Embed Size (px)
Citation preview

Copyright is owned by the Author of the thesis. Permission is given for a copy to be downloaded by an individual for the purpose of research and private study only. The thesis may not be reproduced elsewhere without the permission of the Author.
A STUDY OF CITRIC ACID PRODUCTION BY
SUBMERGED AEROBIC FERMENTATION
USING THE FUNGUS Aspergittus niger
A the s is presented in par t i a l
fulf ilment o f t he re qu ireme n t s f o r the degree
of Doctor of P h ilosophy
in Biotechnology at Mas sey Un iv.ers i t y
MARK WILLIAM DAWSON 1986
Massey University Library. Thesis Copyright Form
Title of thesis:
(1) (a) �u(5M6�Ir�D A$?D4(� '==§BM6VZ?t71Qi\J !..UW& --;ti€ 1=iJA)Cr(}.5
A�f1E1lG-1 LLvl Al ( 6-c� . 1 give permission for my.thesis to be made available to readers in the Massey University Library under conditions determined by the Librarian.
(b) -� wish my thesis to be made available to readers
(2) (a) without my vritten consent -for.:....-._. . months.
1 agree that my thesis, or a copy, may be sent·to another institution under conditions determined by the Librarian.
(b) l:do-not'w� my thesis, or a cOPl, to be sent to another institution without my vritten consent� -.---- .' months.
(3) (a)
(b)
I agree that my thesis may be copied for Library use.
I d�no�' ������e�s�i�s�to be copied for Library use tor months. ------
Signed +r��---"'-'....".�-----MARK WILL lAM
Date 02-.'-1/3 )8'G ,
The copyright of this thesis belongs to the author. Readers must sign their name in the space below to show that they recognise this. They are asked to add their permanent address.
NAME AND ADDRESS
MAS:;:"{ lJ�;lVERS'TY J.JG-R/\i�Y
DATE
i
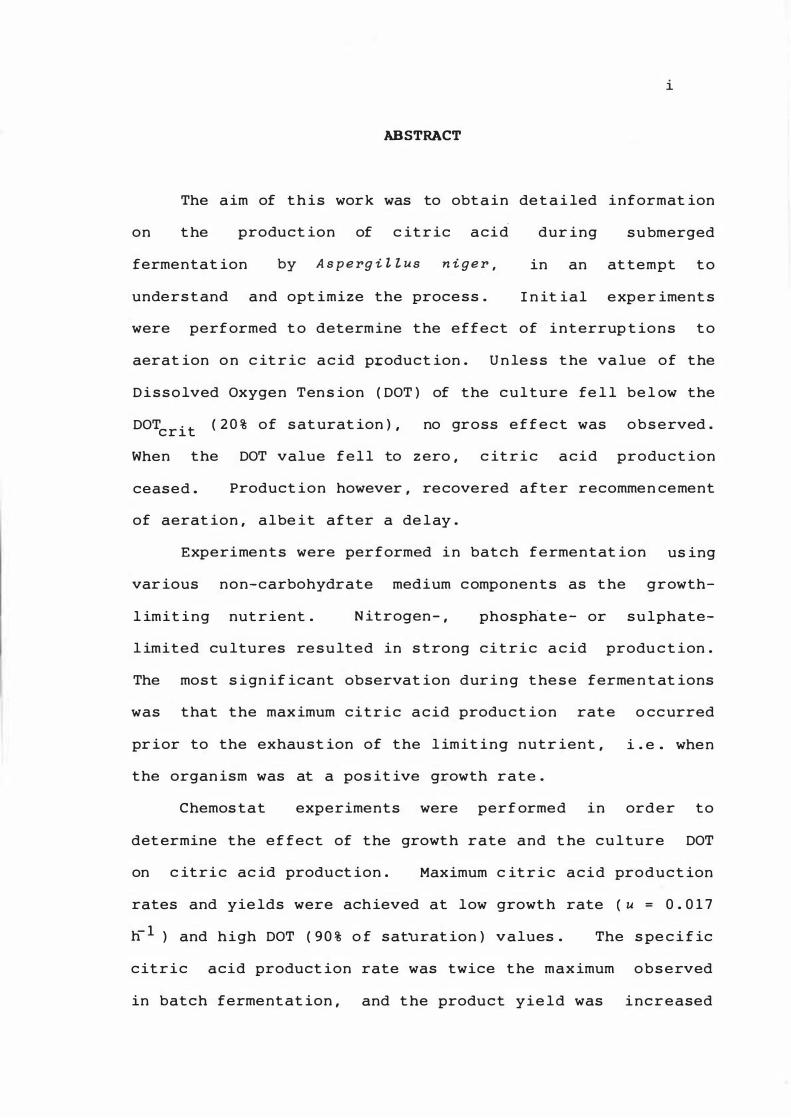
ABSTRACT
The a im of t h is work was to obt a in de t a i led informat ion
on t he product ion of c it r ic acid
fermentat ion by Aspergi�lus niger,
unders t and and opt imize the proce s s .
dur ing s u bmerged
in an at tempt t o
I n it ial exper iment s
were perf ormed t o determ ine the effect of i n t errup t io n s t o
aerat ion o n c it r ic a c id product ion . U n le s s t he va lue of the
D i s s o lved Oxygen Ten s ion ( DOT ) of the c u l t ure fe l l be l ow the
DOTcrit ( 2 0 % of s at urat ion ) , no gross e f f e c t was o b s erved .
When the DOT value f e l l to z ero , c it r i c a c i d produ c t ion
ceased . Product ion however , recovered a f t e r recommen cement
of aerat ion , albe it after a de lay .
Experime n t s were performed i n batc h ferme n t at ion us ing
var ious non-carbohydrate medium c ompone n t s as t he growth-
l imit ing nut r ient . N itrogen - , phospha t e - or s u lphate-
l imited cu ltures re s u lted in s trong c i t r i c a c id produ c t ion .
The mos t s ign if icant observat ion dur i n g t he s e ferme n t at ions
was that the max imum citric a c id produ c t ion rat e o cc urred
pr ior to the exhau s t ion of the l imit ing nutr ient , i . e . when
the organ ism was at a pos it ive growth rate .
Chemos tat experiments were perf ormed in order to
det ermine the e f fect of the growth rate and t he cu l t u r e DOT
on c it r i c ac id product ion . Maximum c it r i c a c i d pro d u c t ion
rates and yie lds were achieved at low growt h rate (u = 0 . 0 1 7
h- 1 ) and high DOT ( 9 0 % o f saturat ion ) values . The s pe c i f ic
c it r i c acid product ion rate was twice t he max imum o b s erved
in batch ferment at ion , and t he product yie ld was i nc r e ased
i i
b y 2 3 % .
The inf ormat ion regar d i n g growt h rate and" DOT ga ined
from the chemostat exper ime n t s was appl ied t o a c o n t inuous
fed-bat c h fermentat ion u s in g n itrogen as t he growt h- l im i t i n g
nutr ient . The overall fermenter product iv i t y at t a in e d was
doub le t hat of t he batch f ermentat ion , result i n g in a
halv ing of t he ferme n t at ion per iod . Thi s is t he f ir s t
reported u s e o f t he c ont inuous fed -batch t e c hn i qu e f or
c it r i c a c id produc t ion .
I n all t hree ferme n t at ion modes ( batch , chemos t at and
fed-batch ) , n itrogen l imi t a t ion was s uper i or t o p h osphate
l imitat ion i n terms of c it r i c ac id product ion r a t e s and
yie lds . A double n it roge n /phosphate l im i t at ion gave r e s u l t s
almos t ident ical t o a n itroge n l imit at ion . The e v i dence
s ugge s t s t hat the n itroge n nutrient exe r t s a f orm of
catabolite repress ion on c it r i c acid accumu l a t ion .
i i i
ACKNOWLEDGEMENTS
The author w is he s t o acknow ledge t he f o l lowing p e op le :
Drs I . S . Maddox , J . D . Brooks and R . C . L awre n c e for
gu idance and s upervis ion . The ir ava i lab i l i t y and
wil l in gnes s to d i s c u s s prob lems when t hey aro s e , was great ly
apprec iated .
Profes s or R . L . Ear le , Head of t he Depar tment of
Biote chnology for h i s encouragement t hrougho u t the pr oje c t .
Mr I . K . Gray and h i s s ta f f of t he New Zeal a n d Da iry
Research I n s t it ute f or trace e lement analys is .
Dr R . D . Reeves of t he Department of C he m istry , Mas sey
Un ivers ity , for s u lphate analys is .
Mr J . Alger and Mr B . Coll ins o f t he Depart me nt of
B i otechnology for t he ir a s s is t ance with the many t e c hn ical
problems wh ich arose with t he equ ipme n t .
Dr I . F . Boag of t he Depar tment of Produ c t ion Te c h n o logy
for his as s is t ance with computer analys i s of d a t a and
deve loping t he program for the construc t i on o f 3 - D re sponse
s urfaces .
Mr M . S tevens , Mr M . Lubbers , Mis s A . Moran a n d Mrs A .
McCutcheon o f the Department of B iote c hno l o gy f o r t he ir
excellent laboratory suppor t .
The New Zealand Dairy Research I n s t i t u t e , P al mers ton
North for f inanc ial support of mys el f and t h is proje c t .

iv
My parents , for t he ir con s t ant s upport and
e ncourageme nt throughout t hi s proj ect .
My wife Deborah , for t yping , proof -read ing and a dv is i n g
on layout of the t hes is , and for her pat ience , love and
encouragement .
TABLE OF CONTENTS
Abs tract
Acknowledgements
Table of Contents
L is t of F i gure s
L is t of Tab les
Abbreviat ions
CHAPTER 1 I ntroduct ion
CHAPTER 2 Product ion o f c it r i c a c id by fermentat i on
2 . 1
2 . 2
2 . 3
2 . 4
I ntroduct ion
His t ory
C it r ic acid-accumu lat i n g organ isms
I ndus tr ial proce s s e s
2 . 5 Biochemis try o f c i t r ic acid accumu lat ion by A.
niger
2 . 6 Environmental f ac t ors affect ing c it r ic a c id
accumu lat ion
2 . 6 . 1
2 . 6 . 2
2 . 6 . 3
2 . 6 . 4
2 . 6 . 5
Form of growt h
pH
Temperature
Aerat ion
Nutr it ional s tatus of
medium
2 . 6 . 5 . 1
2 . 6 . 5 . 2
2 . 6 . 5 . 3
2 . 6 . 5 . 4
C arbohydrate
N itro �en
P hosphat e
Trace e leme n t s
t he growt h
v
PAGE
i
i i i
v
x i
xvi i
xx
1
3
3
7
8
9
1 2
2 3
2 4
2 6
2 7
2 8
3 0
3 0
3 1
3 2
3 3
2. 6 . 6 Presence
compounds
of me thanol and other
2. 7 Re lat ions hip between growt h rate and c it r i c
2. 8
2. 9
ac id product ion
Cont inuous
c it r ic ac id
c u lture chemo s t at product ion o f
Cont inuous fed-bat c h culture
CHAPTER 3 Mat erials and met hods
3. 1
3. 2
3. 3
3. 4
3. 5
Mate r ials
3. 1 . 1
3. 1. 2
3. 1. 3
3. 1. 4
Microb i o l o g i c a l med i a
Gas es
C hemicals
Organ ism
Med i a steril isat ion
C le an ing of glassware
Analyt ical me thods
3. 4 . 1
3. 4. 2
3. 4. 3
3. 4.4
3. 4. 5
3. 4. 6
3. 4. 7
3. 4.8
pH me as ureme n t
De terminat ion o f myce l i a l dry we i ght
Analys is of s u gars
De terminat ion of c it r ic acid
De terminat ion of t o t a l n itrogen
Determinat ion of inorgan ic phosphate
De terminat ion of s u lphate
Determinat ion of Mg 2 + and trace met a l s
Culture condit ions
3. 5. 1
3. 5. 2
3. 5. 3
Preparat ion of spore suspens ion
Shake -f las k cu lture
Bat ch Fermenter cu lture
v i
PAGE
3 5
3 5
3 7
3 9
4 2
4 2
4 2
4 4
4 4
4 5
4 6
4 6
4 7
4 7
4 7
4 7
4 8
4 9
5 0
5 1
5 1
5 2
5 2
5 2
5 3
3. 6
3. 7
3. 8
3. 9
3. 5. 4
3. 5. 5
3. 5. 6
3. 5. 7
Cont inuous fed-ba t ch fermentat ion
Chemos tat c on t inuous c u l t ure
Ster il izat ion
Prepara t ion of inoculum f or fermenter
exper iment s
v i i PAGE
5 9
5 9
6 7
6 8
3. 5. 8 Samp li n g of ferment ers 6 8
3. 5. 9 Avoidance o f wa l l growt h i n fermenter
cult ure
Preparat ion of s amples f or HPLC analys is
Enzyme assays
3. 7. 1
3. 7. 2
3. 7. 3
3. 7. 4
3. 7. 5
3. 7. 6
3. 7. 7
3. 7. 8
Prepar at ion of ce l l -free extract
Prot e in e s t imat ion
Acon i t a s e ( E . C . 4. 2. 1. 3 )
NAD- l in ked i s o c itrate dehydrogenase
( E . C . 1. 1. 1. 4 1 )
NAD P - l i nked isoc itrate dehydro genase
( E . C . 1. 1. 1. 4 2 )
2 -oxoglutarate dehydrogenase ( E . C .
1. 2. 4. 2 )
pyruvate carboxylase ( E . C . 6.4. 1. 1 )
I s o ci t rate lyase ( E . C . 4. 1. 3. 1 )
C alculat ions
3. 8. 1
3. 8. 2
3. 8. 3
Stat i s t ical analyses
Carbon balance
Gas balance
Dis cuss ion of met hods
3. 9. 1 Organ ism
3. 9. 2 Chemos t at cont inuous cult ure
6 8
6 9
6 9
6 9
7 0
7 1
7 1
7 2
7 2
7 3
7 3
7 4
7 4
7 4
7 5
7 7
7 7
7 7
v i i i
PAGE CHAPTER 4 The ef fect of int errupt ions to t he a ir
s upply dur i n g c it r i c ac id product ion 8 0
8 0
8 1
8 1
4 . 1
4 . 2
4 . 3
4 . 4
I ntroduct ion
Res u lts
4 . 2 . 1
4 . 2 . 2
Shake - f la s k cu lture
Comb inat ion of fermenter and s hake -
4 . 2 . 3
f lask culture
Fermenter culture
Dis cuss ion
Conc lus ions
8 4
8 7
9 2
9 5
CHAPTER 5 The e f fe c t o f d i f ferent nutr ient
5 . 1
5 . 2
l imitat ions on c it r i c acid produ c t ion
in bat c h culture 9 7
I n troduct ion
L im itat ion of trace me t a ls
9 7
9 7
5 . 3 L im i t at ion of nutr ient n i t rogen , p hosphate ,
s u lphate and magne s ium a t low leve l s o f
b iomas s 1 0 1
5 . 3 . 1 T ime cour s e of ferme ntat ions 1 0 1
5 . 3 . 2 Rates of growth , Product f ormat ion and
nutrient upt ake 1 1 0
5 . 3 . 3 Analys i s of s e lected e n z yme s 1 1 3
5 . 3 . 4 Discuss ion 1 2 1
5 . 4 L im i t at ion of nutr ient n i t ro gen , phospha t e and
double n itrogen /phosphate at high leve l s o f
b ioma s s
5 . 4 . 1 T ime course of fermentat ions
1 2 4
1 2 8
5 . 5
5. 4 . 2
5. 4 . 3
Rates o f growt h , product format ion and
nutr ient upt a ke
Discuss ion
Conc lus ions
CHAPTER The product ion of c itric acid
chemost at cont inuous cu lture
I nt roduct ion
6 in
6 . 1
6 . 2
6 . 3
6 . 4
6 . 5
6 . 6
6 . 7
Nitrogen - l imited ferme n t a t ions
Phosphate - l imited ferme n t a t ion
Double n i t rogen/ phosphate - l imited ferment at ion
Ana lys is of selected e n z ymes during nitrogen
l imited fermentat ion
Dis cuss ion
Conclus ions
CHAPTER 7 C it r i c a c id produ c t ion i n c ont inuous fed-
ix
PAGE
1 3 3
1 3 4
1 4 2
1 4 3
1 4 3
1 4 3
1 6 5
1 7 1
1 7 4
1 7 6
1 8 0
bat ch culture 1 8 2
7 . 1
7 . 2
7 . 3
7 . 4
7 . 5
7 . 6
I n troduct ion
N itrogen - l imi ted ferme nt a t ion
Phosphate - l im ited ferme n t a t ion
Double nitrogen /phosphate - l im ited ferme n t a t ion
Dis cuss ion
Con c lus ions
CHAPTER 8 Fina l discuss ion and conclus ions
References
APPENDIX 1 Gas mass balance
APPENDIX 2 Determinat ion of s to ic hiometry
1 8 2
1 8 2
1 8 5
1 8 7
1 9 7
2 0 0
2 0 3
2 0 9
2 3 3
2 3 5
APPENDIX 3 Fu ll regres s ion mode ls for n itrogen-
l imited chemos t at cultures wh ich
exhib ited a s ign i f icant lack of f it
APPENDIX 4 Repr int of pub l i cat ion concern i n g work
des cr ibed in t h i s t he s is
x
PAGE
2 3 5
2 3 9
LIST OF FIGURES
2 . 1 Flow d iagram for s ubme r ged
manufacture
c itric a c id
2 . 2
2 . 3
The tricarbox y l ic ac id c yc le with glyoxyl ic
a c id cyc le and carbohydrate input
Alternat ive pathway for the non-
p ho sphorylat ing reox idat ion of reduced aden ine
nuc leot ides
3 . 1 A s chemat ic diagram of t he fermenter ves se l ,
s howing var ious fac il it ies and probes i n t he
x i
PAGE
1 1
2 1
2 2
ves se l head 5 4
3 . 2 A s c hemat ic diagram of t he batch ferment er and
3 . 3
3 . 4
3 . 5
3 . 6
i t s anc i l lary e quipment
The chemos tat f ermenter he ad
A s chemat ic diagr am of the chemos t at
cont inuous cu lture fermenter and i t s anc i l lary
equ ipment
A s chemat ic diagram o f t he DOT control s ys tem
which used proport ion a l - i n t e gral contro l of
agitat ion speed
A s chemat ic diagram of the chemos t at
cont inuous culture over f low contro l s ys te m
4 . 1 Ef fect of interrupt ions to aerat ion on c it r i c
ac id product ion i n s hake - f lask culture
4 . 2
4 . 3
Effect of interrupt ions to aerat ion on s u gar
ut i l isat ion in s hake - f lask culture
Effect of interrupt ions 't o aerat ion on b ioma s s
product ion in s hake - f l as k culture
5 7
6 0
6 4
6 6
6 6
8 2
8 2
8 3
4 . 4 T ime c ours e prof ile o f t he cont r o l fermenter
c u l ture ( no interrupt ions )
4 . 5 E f f e c t o f interrupt ion s t o aerat ion on c it r ic
a c i d product ion in fermenter c u l t ure
4 . 6 E f f e c t of interrupt ions t o aerat ion on b iomas s
product ion i n fermenter culture
4 . 7 E f f e c t o f interrupt ions t o aerat ion on s u gar
ut i l i s at ion in fermenter cu lture
4 . 8 E f f e c t o f interrupt ions t o aerat ion on t he DOT
o f t he cu lture s in the fermenter
4 . 9 E f f e c t o f interrup t i on t o aerat ion in a 2 . 0
l itre fermenter . Aerat ion was interrupted on
day 8 by replac ing t he a ir s upply w i t h
n it r o gen gas for 1 2 0 min
5 . 1 E f f e c t of me tal ion l imitat ions on b iomas s
product ion i n s hake - f lask culture
5 . 2 E f f e c t of met a l ion l im i t a t ions on c it r i c ac id
product ion in s hake - f lask culture
5 . 3 E f f e c t of met a l ion l imitat ions on sugar
ut i l i s at ion in s hake - f las k culture
5. 4 The t ime cours e of a nitrogen- l im it e d batch
f erme n t at ion
5 . 5 The t ime course o f a pho s phate - l im it e d batch
f erment at ion
5 . 6 The t ime course of a su lphat e - l im it e d batch
fermentat ion
5. 7 The t ime course of a m agnes ium-l im it e d bat c h
f erment at ion
x i i PAGE
8 8
9 0
9 0
9 1
9 1
9 3
9 9
1 0 0
1 0 0
1 0 3
1 0 5
1 0 6
1 0 8
5 . 8 Growt h rate , product f ormat ion rates and
nutrient upt ake r a t e s under n itrogen
lim it a t ion
5 . 9 Growt h r ate , produ c t f ormat ion rates and
nut r ient uptake rates under phosphate
l imit at ion
5 . 10 Growt h rate , produc t f orma t i on rates and
nutrient upt ake r a t e s under s u lphate
l imit at ion
5 . 1 1 Growth rate , product f ormat ion rat e s and
nutrient upt ake rates under magnes ium
l imit at i o n
5 . 1 2 The spe c if ic act ivit ies of s ome e nzymes in a
n itroge n - limited bat ch ferme n t at ion
5 . 1 3 The e f fect on biomas s o f var ious leve ls of
excess nutrient n it rogen i n phosphate - l imited
x i i i PAGE
1 1 5
1 1 6
1 1 7
1 1 8
1 2 0
culture 1 2 6
5 . 1 4 The e f f e c t on c itric ac id produc t ion and yie ld
of var ious leve ls of exce s s nutrient n itrogen
i n phosphate - l imited culture 1 2 6
5 . 1 5 The e f f e c t on sugar ut i l is at ion o f various
leve ls of exce s s nutrient
phosphate - l im it ed culture
n i t rogen in
5 . 1 6 The leve ls of exc e s s nutrient n i trogen i n
phosphate - l imited culture
5 . 1 7 T ime course of a n i troge n - l imited bat ch
fermentat ion with high 'leve ls of b iomass
5 . 1 8 The t ime course of a phosphate - l imi ted bat c h
fermentat ion w i t h high leve l s of b iomass
1 2 7
1 2 7
1 2 9
1 3 0
5. 1 9 The t ime course o f a double nit roge n /
p ho sphate - l imited bat c h ferment at ion wit h hig h
leve ls of b iomas s
5 . 2 0 Growt h rate , p roduct f ormat ion r at e s and
nutr ient uptake rate s dur ing a n itrogen
l im i t e d batch f ermentat ion at high b iomas s
leve l
5 . 2 1 r a t e s and Growt h
nutr ient
l im i t e d
leve l
rat e , product format ion
uptake rates dur ing
bat ch ferme n t at ion at
a phosphate
h i g h b iomass
5 . 2 2 Growt h rate , product f ormat ion
nutr ient uptake rates dur ing
rates and
a double
nitroge n / p hosphate - l im ited bat c h f e rment at ion
x iv
PAGE
1 3 1
1 3 6
1 3 7
at hig h b iomas s leve l 1 3 8
6 . 1 Predicted volume t r ic c it r i c acid p r o qu c t ion at
s t e ady s t ates dur ing n it r o ge n -l im ited
c hemos t at cont inuous cu lture
6 . 2 Pre d i c t e d spec i f i c c it r ic ac id produc t ion rate
at s t e ady s t at e s dur i n g n i t r o gen - l imited
c hemos t a t cont inuous culture
6. 3 Predicted spe c i f ic c i t r i c a c id prod u c t ion rate
calculated us ing myce l ia l n it rogen c on t ent at
s te ady s t ates dur ing n itro gen - lim i t e d
chemos tat cont inuous cu lture
1 5 5
1 5 5
1 5 6
6. 4 Predicted spe c i f ic c it r i c a c id product ion r ate
calcu lated us i n g myce l i a l p hospha t e conte n t at
s teady s tate dur ing n it r oge n - l im i t e d c hemos t a t
cont inuous cult ure
6. 5 Predi c t e d c i t r ic ac id yield bas e d on s u gar
u t i l i s e d at s t eady s t at e s dur i n g n i t rogen-
l im ited c hemos tat cont i nuous culture
6. 6 Ext rapolated spec i f ic c it r i c acid product ion
rate at s teady s t ates dur ing n it r o gen- l im i t e d
xv
PAGE
1 5 6
1 5 7
chemos t at cont inuous c u l t ure 1 5 7
6. 7 Extrapola ted spec if ic c it r i c ac id product ion
rate c a lculated us i n g myce l i a l n it ro ge n
con t e nt a t s teady s tates dur i n g n itroge n -
l imited chemos t at cont inuous culture
6. 8 Extr apolated c itric ac id yie ld bas es on s u gar
ut i l i s e d dur ing n itrogen - l imited chemo s t at
cont inuous culture
6. 9 S tora ge carbon yie ld based on s u gar ut i l i s e d
at s teady s tates dur i n g n it r o gen - l im it e d
chemo s t at cont inous cu lture
6. 1 0 Carbon d iox ide yield bas ed on s u ga r u t i l i s e d
at s te ady s t at e s duri n g n itrogen - l im i t e d
chemo s t a t cont inuous culture
6. 1 1 Predic ted spec i f i c c it r i c acid produc t ion r a t e
at s t e ady states dur ing phospha te - l im i t e d
chemo s t at cont inuous culture .
1 5 8
1 5 8
1 6 3
1 6 3
1 6 9
6. 1 2 Predicted c i t r ic ac i d y ie ld base d on sugar
u t i l is e d at s teady s t a t e s dur ing p hosphat e
l imited chemos t at cont inuous culture
7. 1 T ime c ours e of a n i t r o ge n - l imited fed-bat ch
ferme n t at ion
7. 2 Growth rate , produ c t f ormat ion r a t e s and
nutrient uptake rate s dur ing a n it rogen
l imited fed-bat ch ferment a t ion
7. 3 T ime course of a phosphate - l im i t e d f ed-bat c h
fermentat ion
7. 4 Growt h rate , produ c t f ormat ion r a t e s and
nutr ient uptake rat e s dur ing a p hosphat e
l imited fed -bat c h fermentat ion
7. 5 T ime c ourse of a dou b le n itrogen / phosphate
l im ited fed-ba t c h fermentat i on
7 . 6 Growt h rate , produ c t f ormat ion r a t e s and
nutr ient upt ake rates dur ing a dou b l e n it rogen
xvi
PAGE
1 6 9
1 8 9
1 9 1
1 9 2
1 9 3
1 9 4
phosphate - l imited fed -bat ch ferment a t ion 1 9 5
LIST OF TABLES
2 . 1 E st imated product ion o f c it r i c acid by var iou s
countr ie s
2 . 2 C it r i c ac id import s in New Zea land from 1 9 7 6
t o 1 9 8 4
3 . 1
3 . 2
3 . 3
Sucro se -beef extract med ium
Med ium f or bat ch ferment at ion
Feed med ium for c hemo stat fermentat ion
3 . 4 Var iat ion of pre ssure and t emperature
corre c t ion indice s with f low rate i n var iab l e
area f lowmeter s
4 . 1 The e f fect of int errupt ion t o aerat ion o n
c it r i c acid product ion i n samp le s withdrawn
from a fermenter
5 . 1
5 . 2
L imit i n g nutr ient c oncentrat ion t o obt a in 1 5
g / l b i omass
Summary of d i f ferent nut r ie n t - l im i t e d
ferme n t a t ion s at low b ioma ss leve l s
5 . 3 The r a t io o f c i t r i c acid produced t o oxygen
u sed a s calculated from t he r e sp e c t ive
spe c i f i c rate s
5 . 4
5 . 5
6 . 1
Summary o f dif ferent nutr ient - l i mite d
ferment at ions a t h igh bioma ss leve l s
The rat io of c i t r ic ac id produced t o oxygen
consumed at h i gh biomass leve l s , c a l c u l a t e d
u si n g t he respec t ive sp �c if ic rat e s
Allocat ion of c oded var iable s t o spe c i f i c
growth rate (u) and DOT
xvi i
PAGE
4
6
4 2
4 3
4 3
7 6
8 5
1 0 2
1 0 9
1 1 9
1 3 2
1 3 9
1 4 5
6 . 2 Steady s t ate conce ntrat ions dur i n g n itroge n -
limited chemo s t at expe r ime n t s
6 . 3 Volume t r ic a n d s pe c i f i c r a t e s of nutr ient
upt ake and produc t f ormat ion at s t e ady s t at e s
in n itroge n - l imited chemos t at e x pe r iments
6 . 4 Ful l regre s s ion mode l s f or n it rogen - l imit ed.
chemos tat cu ltures
6 . 5 Corre lat ion coe f f i c ients of data from
n itroge n - l imited c hemost at cultures
6 . 6 Concentrat ions , and volume t r i c and s pec if ic
rates of product f ormat ion and n u t r ie n t upt ake
- 1 at t he s teady s t ate u= 0 . 0 1 7 h ; DOT = 9 0 % of
s aturat ion in n itrogen - l imited c u l t ure
6 . 7 Concentrat ions , and volume t r i c and s pe c i f ic
product f ormat ion and nutrient uptake rates ,
with increas ed b i omas s leve l , a t t he s t e ady
- 1 s tate u = 0 . 0 1 7 h ; DOT = 6 0 % o f s at urat ion
in n itroge n - l imited cu lture
6 . 8 C arbon balances a s % carbon u s e d in n itroge n -
l imited chemo s t at cultures
6 . 9 S te ady s tate concent rat ions dur i n g phosphat e -
l imited chemos tat experimen t s
6 . 10 Volume t r ic a n d spe c i f ic product f orma t ion and
nutr ient upt ake rat es at s t eady s t at e s dur i n g
phos phat e - l imited chemostat exper ime n t s
6 . 1 1 Corre lat ion coe f f ic ien t s of d a t a f r om
phos phate - l imited chemos t at cultures
6 . 1 2 Carbon balances as % carbon used i n phos pha t e -
l imited chemos t at cultures
xvi i i
PAGE
1 4 7
1 4 8
1 5 1
1 5 2
1 5 9
1 6 1
1 6 4
1 6 6
1 6 7
1 7 0
1 7 2
6 . 1 3 C oncentrat ions ,
product format ion
the s te ady s t a t e
saturat ion in
l imited c u l t ure
and
and
u =
volume t r i c and
nutr ient uptake
0 . 0 1 7 - 1 h . , DOT
s peci f ic
rates at
= 9 0 % o f
double n itrogen /pho s phate -
6 . 1 4 The s te ady s t at e act iv it ies of s e le c t e d
x ix
PAGE
1 7 3
e n z ymes i n n itroge n - l imited chemos t at cu lture 1 7 5
6 . 1 5 Molar rat io of c i t r ic ac id produced : oxygen
used b y n it ro ge n - and phosphate - l im i t e d
chemos tat cultures
7 . 1 Summary of fed-batch ferme nt at ion res u l t s a t
day 7
7 . 2 C ompar i s on of s pec i f ic growt h rates c a l c u lat e d
from incre ase i n myce l ia l dry we ight and feed -
medium f l ow rate
7 . 3 Overall fermenter produ c t ivit ies f or c it r i c
acid in batch ,
ferment at ions
chemos t at and f e d -bat c h
8 . 1 Summary o f compar ison o f bat ch , cont inuous
fed-batch and chemos tat fermentat ions
1 7 8
1 9 6
1 9 8
2 0 1
2 0 8
ABBREVIATIONS
ABBREVIATIONS OF UNITS
°c degrees C e l c ius
d day
g gram
h hour
1 l it re
m meter
mg m i l l igram
min minute
ml m i l l il it re
mm m i l l imeter
mM m i l l imole
nm nanome ter
rpm revolut ions per minute
u l m icro lit re
vvm volume per volume per minute
OTHER ABBREVIATIONS
AMP
ATP
D
DOT
DW
EDTA
HPLC
I D
N
NAD
Adenos ine monophos phate
Adenos ine tr iphosphate
D i lut ion rate
D i s s olved Oxygen Tens ion
Dry We ight
Et hylened iaminetetraace t ic acid
H igh Perf ormance L iquid Chroma t o graphy
I nternal Diame ter
N itrogen
N icot inamide Adenine Dinuc leot ide
xx
NADH
NADP
NADPH
P03 -4
TeA
u
xx i
Reduced N icot inamide Aden ine D inucleot ide
Nicot inamide Aden ine Dinuc leot i de Phosphate
Reduced N icot inam ide Aden ine D i nucleot ide P h o s phat e
Pho s phate
Tr icarboxyl ic Ac id
Spe c i f ic Growth Rate
CHAPTER 1
I NTRODUCTION
1
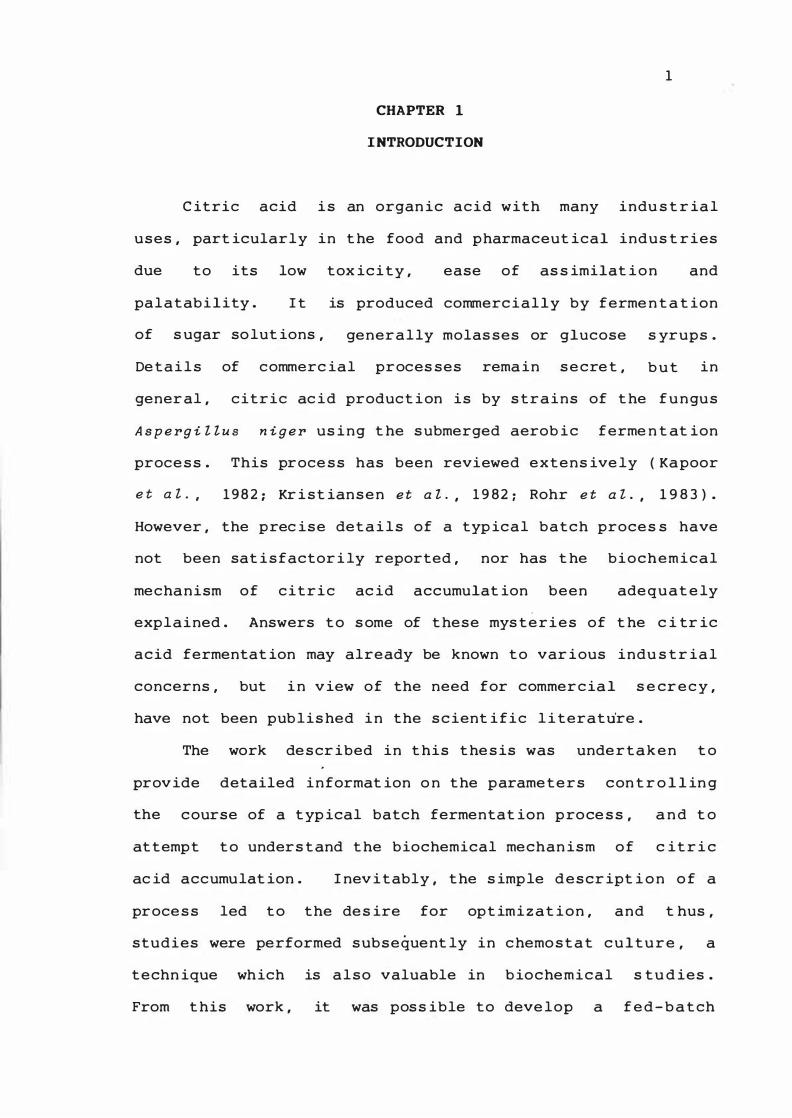
C itric acid i s an organ ic acid with many indu s t r ia l
uses , part icularly in t he food and pharmaceut ical indus t r ies
due to its low tox ic i t y , ease of as s imilat i o n and
palatab i l ity . I t is produced commerc ially by ferme n t a t ion
of s ugar so lut ions , gener a l ly molas ses or glucose s yrups .
De t a i l s of commerc ial proces ses rema in s e cre t , b u t in
gener al , citric ac id product ion is by s tr a i n s of t he f u n gu s
A s p e rg i l l us n i g e r us i n g t he s ubmerged aerob i c ferme n t at ion
proce s s . This proce s s has been reviewed e x t e n s ive ly ( Ka poor
e t a l . , 1 9 8 2 ; Kr i s t ian s e n e t at., 1 9 82; Rohr e t at. , 1 9 8 3 ) .
However , the prec i s e det a i l s of a typical b a t c h proce s s have
not been sat i s factor i ly reported , nor has t he b i o c h e m ical
mechanism of c i t r i c ac id accumulat ion been ade q u at e ly
explained . Answers t o s ome of t hese mys t e r i e s of t he c i tr ic
acid fermentat ion may already be known t o var ious indu s t r ia l
concerns , but i n v iew of the need for commer c ia l s e cr e c y ,
have not been pub lis hed i n the s c ient i f i c l i terature .
The work de s cr ibed in t his t he s is was unde r t a k e n t o
provide detailed informat ion o n t he parame t e r s con t r o l l in g
the course of a t ypical batch fermentat ion proce s s , a n d t o
at tempt t o unders t and t he biochemical mechan ism o f c it r i c
ac id accumulat ion . I nev i t ably , t he s imple d e s cr ipt i o n o f a
proce s s led t o the de s ire for opt imi z at ion , and t hus ,
studies were performed s ub s equent ly in c hemo s t a t c u l t u r e , a
t echn ique which is a l s o valuable in b iochemical s t u d ies .
From t his work , it was pos s ible to deve lop a f e d - b a t ch

2
culture t ec hn ique for c it r i c ac id product ion .
3
CHAPTER 2
PRODUCTION OF C ITRIC AC ID BY FERMENTATION
2 . 1 INTRODUCTION
C it r i c acid i s a t r icarboxy l ic a c i d , which was f ir s t
i s o l ated from lemon j u ice and crys ta l l i z e d as a s o l id by
S chee le in 1 7 84 . I t i s a nat ural cons t i t uent o f c i t r us
f ru i t s , other fru i t s such as pineapples , pears and f i g s and
animal t is s ues . Unt i l t he ear ly part of this c e n t ur y ,
commercial c itric ac id product ion was from lemon j ui c e . At
pres e n t , mos t of the c it r i c acid used in indus t r y i s
produced
mo las ses
by fungal ferme n t at ions ,
as the carbohydrate
us i n g s u gar cane or b e e t
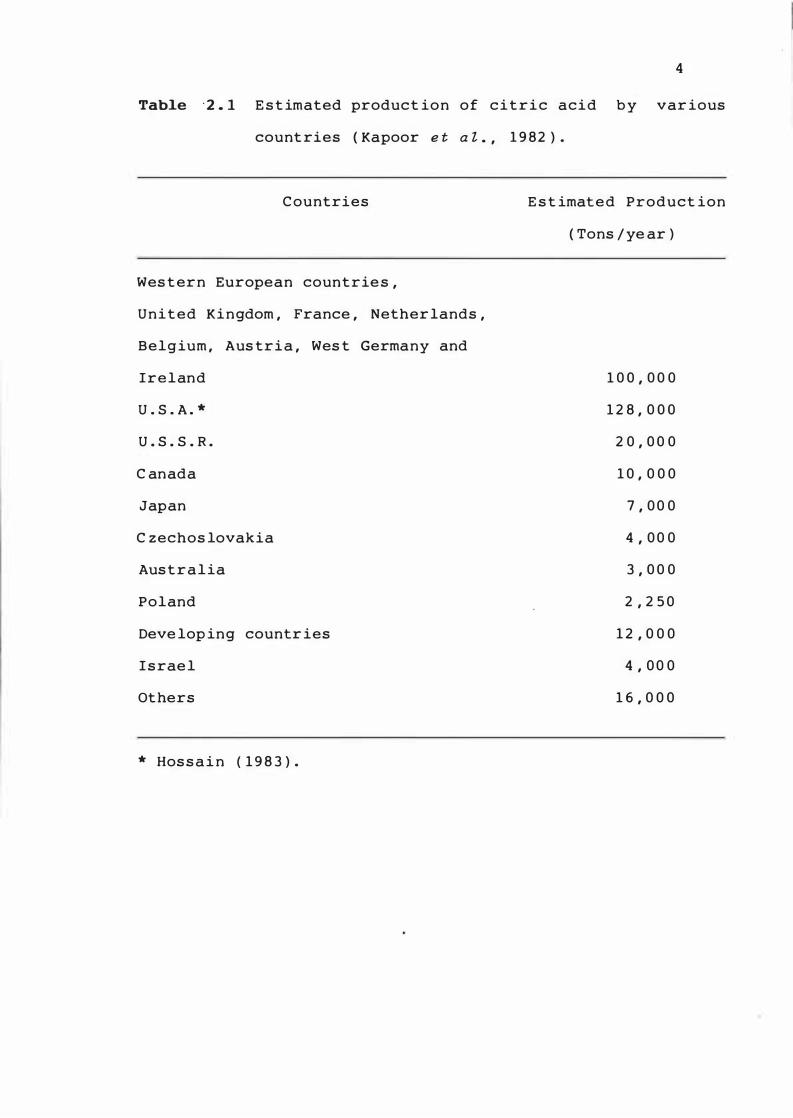
source . The e s t i m a te d
production i n the maj or c it r i c acid-producing n a t i o n s i s
s hown i n Tab le 2 . 1 ( Kapoor e t a l . , 1 9 82 · ) . .
The United S t ates i s the large s t producer o f c i t r i c
acid , with two maj or c ompanies i nvo lve d : - M i le s
L aboratories I nc . , ( E lkhart , I nd iana ) and Pf izer I n c . ( Ne w
York , New York ) . Other import ant producers inc lude :
- England : John and E . S t urge , Ltd , B irmingham .
- Wes t Germany : Joh . A . Benckshi ser , Gmbt t ,
Ludwigshafe n / Rhe in .
- Bel gium : C it r i que BeIge , Tienen .
- France : Rhone - Poulenc S . A . , Par is .
- Repub l ic of C hina : S an Fu C hemical C ompa n y , L t d ,
Taipe i .
C it r i c acid i s used for a var iety o f purpos e s . The
4
Tab1e '2 . 1 E s t imated product ion of c i t r i c acid b y var ious
count ries ( Kapoor et a l. , 1 9 82 ) .
C ountries
Wes t er n European countrie s ,
U n i t ed Kingdom , France , Nether lands ,
Belg ium , Aus tr i a , Wes t Germany and
I r e l and
U . S . A . *
U . S . S . R .
C anada
Japan
C zechos lovakia
Aus t r a l ia
Poland
Deve loping countr ies
I s rae l
Others
* Hos s a i n ( 1 9 8 3 ) .
E s t imate d Product ion
( Tons / ye ar )
1 0 0 , 0 0 0
1 2 8 , 0 0 0
2 0 , 0 0 0
1 0 , 0 0 0
7 , 0 0 0
4 , 0 0 0
3 , 0 0 0
2 , 2 5 0
1 2 , 0 0 0
4 , 0 0 0
1 6 , 0 0 0
5
food and beverage i ndus tr i e s use about 7 0 % , t he
pharmaceut i c a l industry about 1 2 % and other i n du s t r ie s
about 1 8 % o f t he total produced ( Att icus , 1 9 7 5 ) . I n t he
food indus t r y , c i t r i c acid i s used pr imar i ly a s an
acidulant . It i s als o used as a f lavour e nhanc e r and
pres ervat ive in carbon ated beverages . The pharma c e u t i c a l
indus try us e s c itric acid a s an ac idulant , whi le t he
chemical and cosme t ic indus t r i e s use it for its s eque s te r i n g
and plas t ic i z ing propert ies ( Meyrat h , 1 9 6 7 ) . O t her
indu s t r ial applicat ions
water , met a l plat ing ,
text i les . The mos t
inc lude the treatment o f b o i ler
deterge n t formulat ion ,
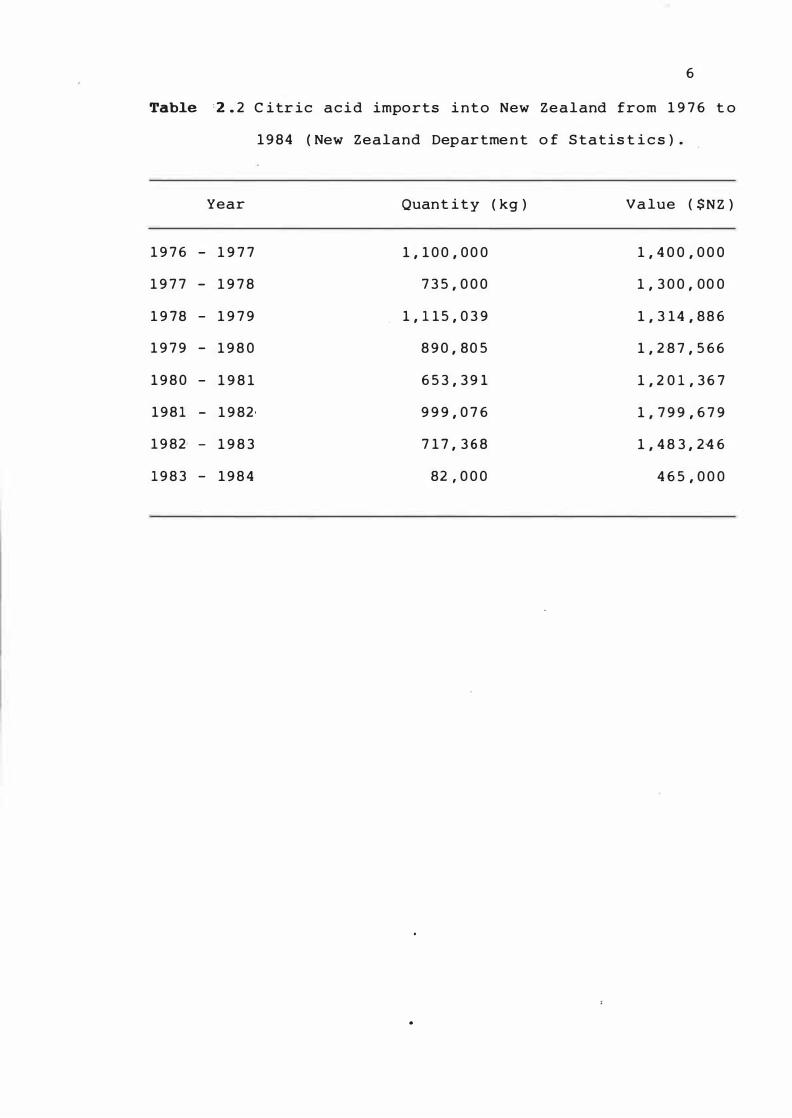
recent ly ava i lable
t an n i ng and
f igur e s f or
importat ion of c itric acid i n t o New Z ealand are s hown i n
Table 2 .'2 , .
There i s an e xtens ive body of literature on c it r i c a c i d
product ion b y fermentat ion , i n cluding more than 4 5 0 r e port s
pub l ished world-w i de in the l a s t 2 0 ye ars . Among s t t he s e
report s are s ome comprehens ive reviews ( e . g . Loe s e c ke , 1 9 4 5 ;
Fos ter , 1 9 4 9 ; Perlman and S ih , 1 9 6 0 ; Lockwood and S chwe i ger ,
1 9 6 7 ; Smith et a t . , 1 9 7 4; Lockwood , 1 9 7 5 ; Berry e t a l . ,
1 9 7 7 ; Miall , 1 9 7 8 ; Kapoor et a t , . 1 9 82, ; Kr i s t ians e n et a l , .
19 82 ' ; Rohr et a l , . 1 9 8 3 ) . The s e aut hors have ade q ua t e l y
covered t he work performed over t he last 5 0 ye ars ,
cons equent ly no at tempt will be made here t o give a d e t a i l e d
review of t he l iterat ure . I n s t ead , t h i s chapte r w i l l
highl ight t hose f actors s hown t o be import an t i n t he
fermentat ion proce s s and which re late to t h i s s t udy .
6
Table ·2 . 2 C itr ic a c i d imports i n t o New Z e a l and from 1 9 76 t o
1 9 8 4 ( New Zealand Departme n t o f S tatis t i c s ) .
Year Quant i t y ( kg ) Va lue ( $N Z )
1 9 76 - 1 9 7 7 1 , 1 0 0 , 0 0 0 1 , 4 0 0 , 0 0 0
1 9 7 7 - 1 9 7 8 7 3 5 , 0 0 0 1 , 3 0 0 , 0 0 0
1 9 7 8 - 1 9 7 9 1 , 1 1 5 , 0 3 9 1 , 3 1 4 , 8 86
1 9 7 9 - 1 9 8 0 8 9 0 , 80 5 1 , 2 '8 7 , 566
1 9 8 0 - 1 9 8 1 65 3 , 3 9 1 1 , 2 0 1 , 36 7
1 9 8 1 - 1 9 82 · 9 9 9 , 0 7 6 1 , 7 9 9 , 67 9
1 9 82 · - 1 9 8 3 7 1 7 , 3 6 8 1 , 4 8 3 , 2 46
1 9 8 3 - 1 9 8 4 82 , 0 0 0 4 6 5 , 0 0 0
7
. 2 ' . 2 HISTORY
The h i s t ory of c i t r i c acid product ion by f ungi h a s be e n
extens ive l y reviewed b y Fos ter ( 1 9 4 9 ) a n d Mial l ( 1 9 75 ) . The
deve lopmen t of a ferme n t at ion proces s f or the produc t io n o f
c itric acid can be conve n ie n t ly d ivided into t hree phas e s
( Per lman and Sih , 1 9 6 0 ) . Wehmer ( 1 8 9 3 ) be gan t h e f ir s t
phas e , when he reported the use o f Pen i o i t t i um t a o teum and
Mu oo� p i r i fo rm i s f or t he product ion of c it r i c ac id , which
occurred when the organ isms were grown on t he s ur f a c e of
media cont ain ing carbohydrate and i norgan ic s a l t s . An
a t t empt was made to use t his proce s s for t he commerc i a l
product ion of c itric acid i n a f actory in Thann , Alsa c e , i n
1 8 9 3 . I t was abandoned in 1 9 0 3 because o f man y
d i f f icult ies , among t hem degenerat ion of t he o rg a n is m ,
cont aminat ion , long ferme n t at ion t imes and high cos t s . The
groundwork , from which a l l microbial c i t r i c acid pro duct i on
proces s e s later deve loped , is attr ibute d t o W e hmer .
The s econd phase , t he result of C urrie's r e s e ar c h ,
reported in 1 9 1 7 ( Per lman and S ih , 1 9 6 0 ) , was s ur f ace
fermentat ion us ing A s p e rg i t t u s n i g e � . C urrie was t he f ir s t
t o report t he importance o f t he use o f pure reage n t s i n t he
fermentat ion medium to obtain increased y ie lds . He j o in e d
C has . Pf i z er and C o . Inc . , Brooklyn , New York , a n d w i t h t h i s
company was part ly respons ible for t he deve lopmen t o f a
c itric ac id proce s s , which was f ir s t operated o n a
commerc i a l s cale in 1 9 2·3 .
The third phase , which is con t i nuing now , i s t he
s ubmerged fermentat ion proce s s . This began in 1 9 3 8 w ith t he
pub licat ion of Perqu in's the s i s ( Per lman and S ih , 1 9 6 0 ) , and
8
res ulted in a s h i ft in emphas i s from s urface c u lt u r e t o
large - s cale s ubmerged fermentat ion . S ur f ace cultur e me t hods
cont inued in use for s ome year s , but have now large l y been
replaced by the more e f f ic ient s ubmerged cult ure me t hods .
Det ails of t he s urface cult ure met hod can be f o u n d i n
Pres cot t and Dunn ' s ( 1 9 5 9 ) review , whi le t he review b y Smith
et a Z . ( 19 7 4 ) covers t he s ubmerged c u l t ure me thods .
'2 . 3 C ITRIC N:: I D-N::C UMULATING ORGANI SMS
Many dif ferent groups of fungi have been f o u n d t o
accumulate c it r ic acid , par t icular l y t he genera A s p e r g i Z Z u s
and Pen i c i Z Z i um . Many s trains of t he s e two genera have been
used by invest igat ors s t udying c it r i c acid product io n . They
have been reviewed by Loesecke ( 1 9 4 5 ) , Foster ( 1 9 4 9 ) and
Perlman and S ih ( 1 9 60 ) . However , i t i s obvious f r om t he
literat ure that o n ly s e lected s trains of A s p e rg i Z Z u s n i g e r ,
mainly mut ants , are u s ed in the commercia l produ c t i o n o f
c itric acid .
Var ious yeas t s , par t icularly of t he genera Ca n d i da and
Sacc ha romy cops i s , have been shown to a c c umulate c i t r i c a c id .
Kapoor e t a Z .
of this s ubj ect ,
the fact that
( 1 982 - ) have publ is hed a c omprehens ive rev iew
and in the s ame review , men t ion is made o f
bacter ia s uch a s B a c i Z Z u s Z i c h e n i f o rm i s ,
Ba c i Z Z u s s u b t i Z i s and B r e vi b a c t e r i um f Z a vu m have b e e n s hown
to accumulate c itric ac id .
9
2.4 INDUSTRIAL PROCESSES
There are t hree bas i c proces s e s used for c ommerc i a l
product ion of c it r i c a c i d ( Lockwood , 1 9 7 5; Rohr et a Z . ,
1 9 8 3 ) : -
1 . The Ko j i ferme n t at ion proc e s s
'2 . The l i quid cult ure s hallow p a n pro c e s s
3 . The s ubmerged ferme n t at ion proce s s
The pre c ise te chn ical de t a i ls o f t he s e proce s s e s remain
s ecret , but examinat ion of t he re levant patents i s s ued to
t he companies concerned has g iven s ome i n format i o n a s t o t he
proces s e s used ( Lockwood , 19 7 5 ) .
The Koj i Fermentat ion Pr oces s
This i s a s imple ferme n t at ion proces s , deve l oped i n
Japan . C oo ked , s o l id vege table res idues , u s u a l l y s weet
potato or wheat bran , are spread in t rays and i n o cu lated
with a s e le c t ed s t rain of A . n i g e r . Dur i n g incubat i o n , t he
amylase produced b y A . n i g e r s ac char i f i e s t he s t a r c h and
much of t he hydrolysed s ugar is t he n converted t o c it r i c
acid . The temperature of t he s o l id mas s i s ma i n t a i ned at
2 8 0 C and t he pH drops to 1 . 8 to ·2 . 0 as c i t r i c
accumulates . The mas s is extracted with wat er
acid
in
percolators after 5 to 8 days incubat ion and t he c i t r i c acid
is pur if ied . The e s t imated annual product ion by t h i s met hod
is only 2 5 0 0 tons ( L ockwood , 1 9 7 5 ; Rohr e t a Z . , 1 9 8 3 ) .
The L iqu id C ulture Shal low Pan Proc e s s --.----
More commonly re ferred to as t he s ur f a c e c u lt ure
method , this is the o lde s t met hod in use in t he U . S . A . and
10
Europe . I t it e s t imated t hat in a l ar ge c it r i c a c i d
produc t i o n p lant , approx imat e ly 3 0 acres o f s ha l l ow p a ns are
requ ired . To prevent met a l ion cont am i nat ion o f t he
s ub s t ra t e , t he pans are manufactured f rom h i gh -pur i t y
s t a inle s s s teel or a lumi n i um . The mos t c ommon s ubs t r at e i s
beet mo l a s ses , but raw s ugar o r gluc o s e s yrups c a n a ls o be
us ed . T r a ces of iron are removed by treat ing t he m o l as s es
with f e r r o cyan ide and f i lter ing o f f the r e s u l t i ng
pre c ip i t a t e . The med ium is then adj us ted t o pH 2 . 5 t o 4 . 0
u s i n g s u lphur ic ac i d . I nocu lat ion i s w i t h spores of A .
niger b lown over t he s t er i l e s o lut ion i n t he pans . The
s pores rap idly germinate and cover t he s o lu t ion w i t h a t h in
white pe l l i c le of myce l i um . The temperat ure i s mai n t a in e d
a t 3 0°C and s teri le humid i f ied a ir is b l own s lowly over t he
s ur face o f the solut ion for about 5 to 6 days . Af t e r 8 t o
1 0 days o f incubat ion , the s ugar con t e n t has b e e n reduced
from 2 0 0 g / l to 10 g / l and the maximum c it r i c a c i d
concentrat ion i s achieved . The yie ld o f c it r i c a c i d from
this proce s s is approx imate ly 8 5 % on t he bas i s o f s ugar
used .
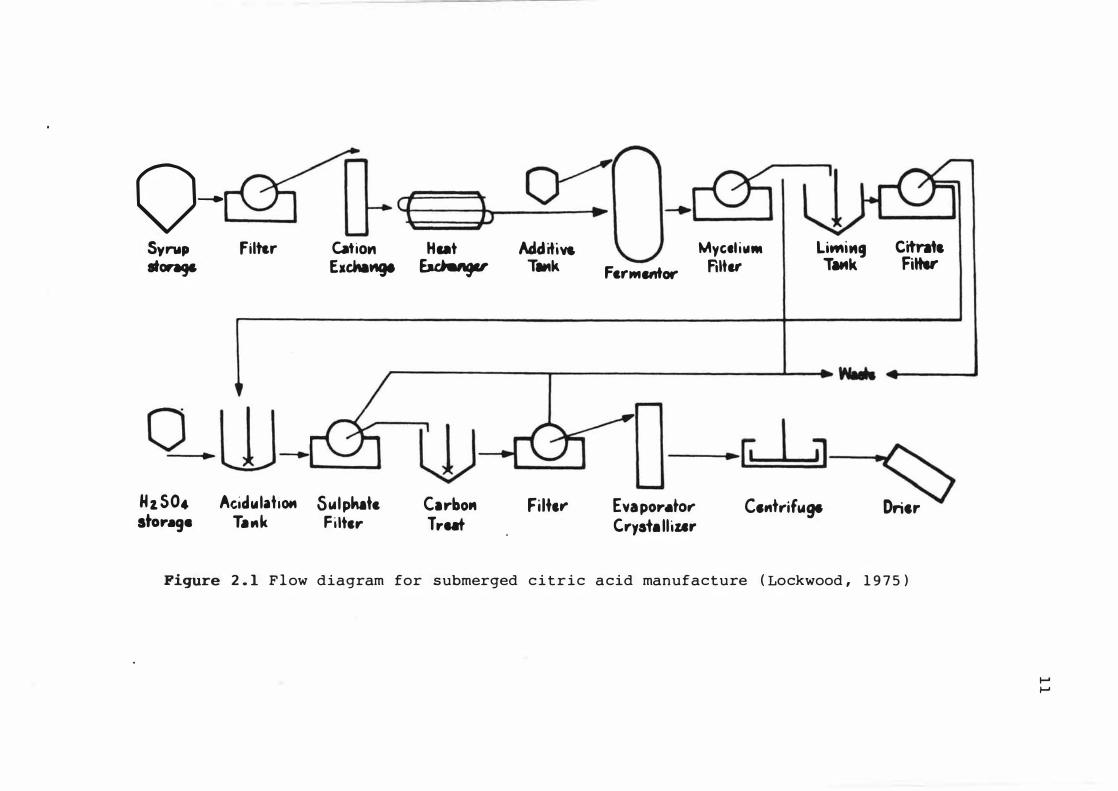
The Submerged Ferment at ion Proces s
A s chema t i c diagr am of this proc e s s is shown i n F i gure
2 . 1 ( Lockwood , 1 9 7 5 ) . The raw mater i a l s used are gener a l l y
beet mo las s es , glucos e s yrups and h i gh - t e s t cane s yr up . A
pe l letal form of a se lected s train o f A . niger i s u s ed t o
inoculate t he fermenter . The culture i s a g i t at e d and
aerated throughout the ent ire fermen t at i o n . The durat i o n o f
the fermentat ion depends o n the init ial s ugar c o n c e n tr a t i o n ,
Q- 0-« ]) -cQ]
Synt, Filter Catio� Hut Additiv. My'lli .. ", Li ... i"CJ Citrat, Itong& Exchawtp ExchIrIgu TIMk Fer ........ Filtu TaMk Fitter
o�w
- Lj)
�[i I il fflS0, AcidwlatlOM Swlphate C.,.bo" Filter' Evapo,..tot" C,,,t,.ifwg. Dn,r sto"·9- r."k Filte,. Tr .... C,.yatalliur
Figure 2 . 1 F l ow diagram for submerged c i t r i c a cid manufacture ( Lockwood , 1 9 7 5 )
I-' I-'
12
s ubsequent s u gar addit ions and t he amount o f growt h . I t
usually ranges from 6 t o 14 days , but for a given s e t o f
cond i tions , i t is a con s t ant period . T he c i t r i c ac i d y ield
from t his process is about 95% on t he basis of s ugar
ut i l i sat ion ( Lockwood and Bat t i , 1965 ) . The s ubmerged
fermentat ion proces s , be cause of t he f o l lowing advant ages:
- higher y ield of c it r ic a c id based on s ugar u s e d
- improved proces s control
- reduced ferme n t at ion per iod
- reduced requireme nt for f loor space
- reduced manual handl ing
- lower i nves tment cos t
is t he preferred proce s s f or curre nt commercial c it r i c ac id
product ion ( Sodeck e t a l . , 1982 ) .
I n s ummary , approx imat e l y 80% o f t he c i t r ic a c i d
requ ired in t he wes tern wor ld i s produced b y t he s ubmerged
fermentat ion proces s , us ing mo las s e s as t he s ub s t rate
( Sodeck et a l . , 1982, ) .
2 . 5 B IOCHEMISTRY OF C ITRIC JlCID JlCC UMULATION BY A. NICER
Many theories have been put f orward t o e xp la i n t he
accumulat ion of c i t r ic acid by A . niger ( e . g . Per lman and
S ih , 1960; Meyrath , 1967; Kubi ce k et a l . , 1980; Hos s a i n et
a l . , 1984 ) . The s it uat ion , however , is s t i l l t hat n o s in g le
hypot hes is fully explains t he opt imum phys i o l o g ical
condit ions required to obtain h i gh yie lds . I t i s ge n e r a l l y
accepted t hat t he final s tep i n t he s yn t hes is of c it r i c ac id
is t he condens at ion of ace t yl C oA and oxaloacet a t e ( F i gure
2:2- ) , and t hat this condens at i o n is t he ma j or r o u t e o f
13
c itric acid s yn t he s i s ( Kapoor e t a l . , 1 9 82 ) . Two p r o b lems ,
t hen , need t o be addre s s ed . F irs t , t he reason why c it r i c
a c i d is accumulated r a t her t han met abol i sed . S e c o nd , t he
s ource o f oxaloace t ic ac id , s in ce accumu lat ion o f c i t r i c
a c i d impl ies some dis t urban ce i n t he normal operat i o n o f t he
TeA- cyc le , which cons eque n t ly prevents t he produ c t i o n o f
oxaloacet i c a c i d b y t h i s ro ute .
The mec han ism o f c i t r i c ac id product ion by A . n i g e r was
s t udied by Shu e t a l .
glucose - 1 -C 1 4 as t he
( 1 9 5 4 ) , us ing a med i um c o n t a i n in g
s o le carbon s ource . F o l lowing
mathema t i cal analys i s of t he ir dat a , they conc luded t ha t 3 7
t o 4 0 % of t he t o t a l c it r ic a c i d was formed f r o m C4 -
d i c arboxyl i c acid , w h i c h had b e e n produced v i a t h e TCA
cyc l e . I n contras t , Boms te in and Johnson ( 1 9 5 2 ) a n d C le land
and Johnson ( 1 9 5 4 ) demo n s trated t hat ver y l i t t l e C4
d i c arboxylic acid was produced via t he TeA cycle whe n t he
fermentat ion condit ions were s uc h t o give 5 0 t o 7 0 % y i e lds
of c itr ic acid . U s ing t he radio labe l le d g luc o s e a s
s ubstrate , C le land and John s on ( 1 9 5 4 ) conc luded t ha t g luco s e
was f irst sp l it i n t o two C3 - f ragments ( pyruv i c a c i d )
f o llowed by the format ion o f a C2 -fragme n t ( acetyl C o A ) by
decarboxylat i on and a C4 - fragment ( oxaloacet i c a c i d ) b y
c arboxylat ion .
c itric acid .
The s e two fragme n t s the n conde n s e d t o form
S ince t hen , t he enzymes phosphoe n o lpyruvat e
c arboxykinase and pyruvate c arboxylase have been
demons trated to be act ive pur ing c i tr i c ac i d p r o du c t i o n
( Woron ick and Johns on , 1 9 6 0 ; Bloom and Johns on , 1 962 - ) . I t
has also been reported that pyruvate c arboxylas e , i s o c i tr a t e
14
lyas e and oxaloacetate hydro lase are act ive in A . n i g e r
dur ing oxalic acid and c i t r i c a c i d product ion ( Ve r ho f f and
Sprad l i n , 1 9 7 6 ) . Hence, t here i s ev i dence t ha t a maj or
s ource of oxaloacet ic acid dur ing c it r i c acid a c c umu l a t i on
i s v i a carboxylat ion of a C3 - f ragme n t .
There a number of repor t s in t he l iterature c on c er n i ng
t he invo lvement of s ome TeA-c ycle e n z ymes in c it r i c a c i d
accumulat ion . Three key e n z yme s t hat have been e x am i n e d are
aconitase and both NAD - l inked and NAD P - l inked i s o c i t r a t e
dehydrogenases . Ramkr ishnan et a t . ( 1 9 5 5 ) rep o r t e d t hat
c it r i c a c id accumu lated due to the d i s appe arance of
aco n i t ase and i s o c itrate dehydrogenase at the end of t he
i n i t ial growt h phase . I t was not s t at e d , however , whi ch
i s o c itrate dehydrogenase was examine d . They f ur t her
demons trated that dur ing c it r i c a c id accumula t i o n , t he
act iv i t y o f the condens ing e n z yme i n cre ased t e n f o l d a n d t hat
the accumulated c it r ic acid inhibited t he a ct iv i t y of
i s oc i trate dehydro genas e . However , t he p r e s e n c e of
a conitase and both NAD - l i n ked and NAD P- li n ke d i s o c i t rate
dehydrogenases dur ing c i t r i c acid accumu l at ion was
demon s trated by La Nau z e ( 1 9 6 6 ) , a l t hough i n lower a c t i v it y
dur ing the citric ac id product ion phase t han d ur in g t he
i n i t ial growt h phas e of t he fungus . There is a maj or d e f e c t
in the report o f Ramkr ishnan e t a t . ( 1 9 5 5 ) , i n t hat t h e y
f a i led t o give det a ils of the me t hod us e d for t he
preparat ion of the c e l l-free extract , and more impor t a n t ly ,
f a i led t o give de t a i l s of the prec aut ionary meas ures t aken
t o avo id enzyme inact ivat ion dur ing t h i s prepara t i o n
1 5
procedure . Thus , the obs erved dis appearance o f t he s e
e n z ymes may have been t he res u lt o f inact ivat ion d ur i n g t he
preparat i o n procedure , par t i cu l arly s i nce many s ub s e que n t
inve s t igat ors have demons trated t he s e e n z yme s t o be a c t ive
dur i n g c it r ic ac id a ccumulat ion . Abmed e t a Z . ( 1 9 7 2' ) re
e xamined t he role of t he TeA-c yc le . dur ing c i t r i c ac i d
accumu lat ion , in part icular s t udyi n g m i t o chondr i a l f u n c t i o n ,
TeA-cyc le e n z ymes and interme d i a t e s of t he TeA-cyc le . They
demons trated t hat certain TC A- cyc le e n z yme act ivi t ie s , e . g .
t he c it r i c ac i d conde n s i n g e n z yme , acon i t a s e and bot h NAD
l i n ked and NADP- l in ked isoc i trate dehyd rogenas es , w e r e a s
h i g h dur i n g t he product ion phas e a s dur ing t he i n it i a l
growth phas e . The pres ence o f TC A- c yc le intermed i a t e s , a s
demons trated b y Ahmed ( 1 9 7 0 ) , gives n o s uppor t t o t he
concept o f a complete blockage of t he TeA- c yc le dur i n g
c it r i c ac id accumulat ion .
S z c z odrak ( 1 9 8 1 ) s tudied t he act ivities o f a c o n i t as e ,
both NAD - l inked and NAD P - l inked i s o c it r at e dehydr o g e n as e s
and c itrate s ynthase ( condens i n g enz yme ) i n ce l l - f r e e
extracts of A . n i g e r dur i n g c it r ic ac i d product io n . He
reported t hat during the product ion phas e , t he act iv i t i e s o f
aco n i t as e and bot h NAD - l inked and NAD P - l inked i s o c i t ra t e
dehydrogenases de creased s ign i f icant ly c ompare d w i t h t he ir
act iv i t i e s dur ing t he growt h phas e ( but d i d not d i s appe ar
complete l y ) and t hat c itrate s ynt hase act iv i t y was
maintained at a cons tant leve l t hr ou ghout t he e n t ir e
ferment at i on . Hos s a i n e t a Z � ( 1 9 8 4 ) c a l c u l a t e d t he s pe c i f i c
product ion rate of c itric ac id over t he e n t ire f e r me n t at io n
per iod and s howed a relat ionship between t h i s a n d t he
1 6
act ivit ies of aco n i t as e and both NAD - l inked and NAD P - l i nked
is oc itrate dehydrogenases . The maximum s pec i f ic c it r i c a c id
product ion rate c o i n c i ded with t he max imum o b s erved
a ct ivit ies of t he s e t hr e e e n z ymes . Thus , alt houg h t he
pat t ern of enzyme act iv i t y s hown by Hos s a in e t a l. ( 19 8 4 )
a greed with that o f S z c z odrak ( 1 9 8 1 ) , t he lat t e r a u t hor
f a iled t o report c i t r i c acid product ion r a t e s , and d i d not
provide suff icient dat a for s uch c a l culat ions . H e n ce ,
whereas S z czodrak ( 19 B1 ) pos t u lated t ha t c i t r i c a c i d
accumulat ion fol lowed a decrea s e in act ivity of t he s e
e n z ymes , Hos s a in e t a l . ( 19 B4 ) pos t ulated t hat t he e n z yme
act ivit ies were high in response to large los ses of c i t r i c
a c id from t he ce l l a t a t ime whe n t he organ ism was s t i l l
growing and needed t o " s c aven ge " t h i s i n t erme d i ar y
metabolite . Then , a s the s pe c i f i c growt h rate dec r e a s e d , s o
did the leve l of e n z yme act ivity . C on s e quent ly , i t was
pos tulated that t he s e enz yme act ivit ie s are inf lue n c e d b y
t he c itrate concentrat ion , r at her than t he c i t ra t e
concentrat ion be i n g inf luenced by t he e n z yme a c t iv i t ie s .
Unfortunately , Ho s s ain e t a l. ( 19 B4 ) d id n o t provide any
data regarding growt h rate .
There are some report s in the l iterature whi c h i n d i ca t e
a b lockage o f the TeA- cyc le at t he s t ep of 2 ·-oxog l u t a r a t e
dehydrogenas e . Kub i cek a n d Rohr ( 19 7 7 , 19 7 8 ) were una b l e t o
detect t his enzyme in ce l l - free extract s of A . n i g e r d ur i n g
c itric ac id product ion in a s ucros e -bas e d s yn t he t i c med ium .
Hos s ain e t a l. ( 1 9 8 4 ) were also unable t o de t e c t t hi s e n z yme
when us ing a syn t he t i c medium with s ucrose , g l u c os e o r
1 7
fruc t ose as t he s ole carbon s ourc e . I t was , howeve r ,
detected when e i ther lactose or galactose was t he s o le
carbon s ource , both of whi c h are poor s ubs trates f o r c i t r ic
ac id produc t ion . Bot h groups pos t u l ated a block age i n t he
�A- cycle at t he s tep of 2 -oxog lut arate dehydro ge n a s e a s
be ing respons ible , a t l e a s t in part , f o r c i t r i c a c id
accumulat ion . Ho s s ain et aZ. ( 1 9 8 4 ) f ur t her pos t u l a t e d t hat
t he blockage was caused by t he a c t ion of glucos e and
fructose in repres s in g this e n z yme , but t hat galac t o s e and
lact ose did not cause s uch repre s s ion . I n c o n t r as t ,
Me ixner-Monor i e t a Z . ( 1 9 8 5 ) were ab le t o det e c t and me a s ure
'2� oxoglut arate dehydrogenas e act iv i ty , when , dur i n g t he
e n z yme as s ay , t he react ion was i n i t iated by t he add i t i o n o f
coenz yme - A rather t han by addit ion o f 2 - oxoglut arate . Thus ,
t he act ivity of 2 -oxoglut arate dehydro genase was me a s urable
at all s amp l in g t imes dur i n g c i t r i c a c id acc umulat i o n . They
s uggested t hat t he inabil ity o f o t her wo� kers t o de t e c t t he
a c t ivity of t h i s enzyme was t he res u lt o f attemp t i n g t o
init iate t he react ion b y the add i t ion o f s ubs tr at e , as
opposed to addit ion of coe n z yme - A . The former me t ho d wi l l
s how act ivity only i f t he e n z yme i s act ive a t n ormal
bios ynthe t i c leve ls , and wi l l s how an apparent c o mp le t e
inhib it ion o f act ivity where t he e n z yme may b e pre s e n t a s a
p art ially inact ivated enzyme complex . Thus , very low l eve l s
of e n z yme act ivit y , rather than no act iv it y , would p r o b a b l y
have been observed by Kub i cek a n d Rohr ( 1 9 7 7 , 1 9 7 8 ) a n d
Hos s ain et a Z . ( 1 9 8 4 ) us i? g t he lat ter met hod . On t h i s
bas is , t he hypo t he s i s o f Hossain et aZ. ( 1 9 8 4 ) o f c om p l e t e
blockage of t he �A- cycle a t t he s tep o f '2� oxog l ut arate
1 8
dehydrogenas e , i f mod i f ied t o read " s i gn i f icant i n h i b i t i o n
of" rema ins valid and n o lon ger con trad i c t s t he r e s u l t s o f
Ahmed ( 1 9 7 0 ) .
Af ter an extens ive s t udy o f the phys i o logical a s pe c t s
o f t he c i t r i c acid ferment at ion , Kub icek and Rohr ( 1 9 8 1 )
s ugges ted t hat t he fol lowin g met abo l ic eve n t s are
respons i b le f o r c it r i c acid a c c umu lat ion by A . n ig e r :
( a ) e x ce s s ive c a t abo l is m of g luco s e v i a t he hex os e
monophospha t e pathway due t o poor re gulat ion a t t he
phosphofruct okinase and phosphoeno lpyruvat e carbox yki n a s e
s t ep s
( b ) un i n f luenced r a t e o f c i t r i c a c i d forma t i o n b y
poor ly regulated c itrate s yn t hase
( c ) incompl e t e operat ion o f t he �A- cyc le d u e t o
inhibit ion of '2 -oxoglut arate dehydrogena s e by g l uc o s e a n d
NH + ions , and inhib i t ion of i s o c i trate dehydro ge n a s e a n d 4
s ucc inic dehydrogenase by s everal met abo l i t e s
( d ) anaplero t ic forma t ion of oxa loace t a t e b y
con s t itut ive , weakly-re gulated pyruvate c arboxylase .
S ince t hen , reports from t he s ame laborat ory have a t t empt e d
t o explain s ome o f t he s e met abol ic eve n ts . Hab i s o n e t a Z .
( 1 9 8 3 ) examined t he role of phosphofruc t ok inase , p yruva t e
carboxylas e and c itrate s yn t has e . They c o n cluded t ha t t he
key regulat ory e n z yme was phosphofruct ok inase , i n t ha t
feedback inhibit ion o f t h i s e n z yme b y c i t r a t e was i mp a i re d .
They reported
intrace llular NH+ 4
t hat t his s i t uat ion
level was increased .
arose whe n t he
Kub icek e t a t .
( 1 9 7 9 ) and Ma e t a t . ( 1 9 8 5 ) reported t ha t i n cre a s e d p ro t e in
1 9
degradat ion and c onsequent increase in intrace l l u l a r
levels , occurred dur ing Mn 2 + de f i c ient condit i o n s dur i n g
the product ion phas e . Rohr e t a l . ( 1 9 8 3 ) s howed
phosphofruc t ok inase a c t ivity t o be i n s ens it ive t o c i trate
repres s ion in the pres ence of phys iological concen t r a t ions
of NH +
in v i t l' 0 •
4 They pos tulated that an e xplan a t i o n for
c it r i c acid accumu lat ion was reduced feedback i n h i b i t ion of
+ phosphofruc t ok inase due to t he release o f NH 4 ions r e s u l t i n g
from prote i n t urnover .
Rohr e t a l . ( 1 9 8 3 ) s ugge s t ed a me chan ism f or c it r ic
acid accumul a t ion in which t he 'K: A- cycle , due to t he ..
impaired act ivity of ' 2�oxoglutarat e dehydrogenas e , oper a t e s
a me chan ism resembl ing the " hors e s hoe - cycle " whic h i s k nown
to operate in facultat ive anaerob i c b a c t e r i a , and i n whi c h
the other d i c arboxylic ac ids are f orme d by t he reduct ion of
oxa loacet ate . Thus , pyruvate c arboxylase i s f ormed by t he
fun gus to ens ure a s u f f ic ient s upply o f oxaloace t at e .
By t he meas urement of k ey e n z yme s , Kubicek a n d Rohr
( 1 9 7 7 ) , s howed t he rat io of glyco lyt i c t o pentos e p h o s phate
pathway met abo lism of glucose t o be ' 2 : 1 u nder u n l im it e d
growt h condit ions . However , dur i n g c it r i c a c id a c c um ulat ion
t he invo lvement of glycolys is increas e s t o a rat i o of 4 : 1 .
C onsequen t ly , reox idat ion of glyco lyt i c NADH , p roduced
during ATP format ion , is neces s ar y f or c i t r i c a c i d
accumulat ion . Kub icek e t a l . ( 1 9 8 0 ) s ug ge s t e d t ha t A . n ig e 1'
contains a s t andard resp iratory chain s en s i t ive t o a n t imyc in
and az ide , and an alternatjve branch s e ns i t ive to s a l ic y l -
hydroxamic acid ( SHAM ) ( F igure 2 . 3 ) . They s howed that
c itric acid accumu lat ion was s trong l y i n hi b i t e d by S H AM , but
20
growt h was insens it ive , and t hat bot h growt h and c it r i c a c id
accumulat ion were s ens i t ive t o ant imyc in and az ide . They
a l s o s ugge s t ed t hat a h i gh c u l t ure D i s s olved Oxygen T e n s ion
( DOT) is nece s s ar y t o main t a in t he act ivity of t his
a lt ernat ive branch , hence t he reason f o r t he requ ireme n t f or
a high cult ure DOT f or s ign i f i cant c i t r ic a c id acc um u l a t ion
to occur . I n o t her microorgan isms , t hi s branc h o f t he
pathway has been reported t o fac i l i t a t e t he reox i d a t i o n o f
cytoplasmic NADH in t he absence of ox idat ive phosphory l a t ion
s o t hat glyco lyt ic ATP format ion can proceed . Thus , t he
increas ed respiratory act ivit y ( which in part is n o t c oupled
to ATP s ynthe s is ) , and t he dere gulat i o n o f
p hosphofruct okinase from c itrate i n h i b i t ion by i n creas ed +
intrace llular NH4 levels , s t imulate a met abolic f lu x t hr o u gh
g lycolys is without s i gn i f icant met abo l ic contro l . This
s ituat ion , given t he anap lerot ic n a t ure o f t he p yr uvate
c arboxylase enzyme and t he unusual operat ion o f t he TC A-
cycle ( in t hat oxoaloacetate is me t ab o l is ed t o b o t h mal i c
acid and c i tric ac id due to t he low leve l o f act iv i t y o f 2 -
oxoglut arate dehydrogenase) , res ul t s i n a r i s e i n t he
c itrate concentrat ion .
There are l i t t le data pub l i s he d on t he r o l e o f
isoc itrate lyase in citric acid product ion . Two groups
inve s t igated isocitrate lyase act iv i t y dur i n g c i t r i c a c i d
product ion b y dif ferent s trains of A . n ig e r ( Ahmed e t a l . ,
1 9 72 ; Ng e t a Z . , 1 9 7 3 ) . Both repor t e d t ha t t he e n z yme was
act ive t hroughout t he fermentat ion . From mas s bal a n c e work ,
Verhoff and Sprad l i n ( 1 9 7 6 ) pos tu late d a s c heme o f c it r i c
2 1
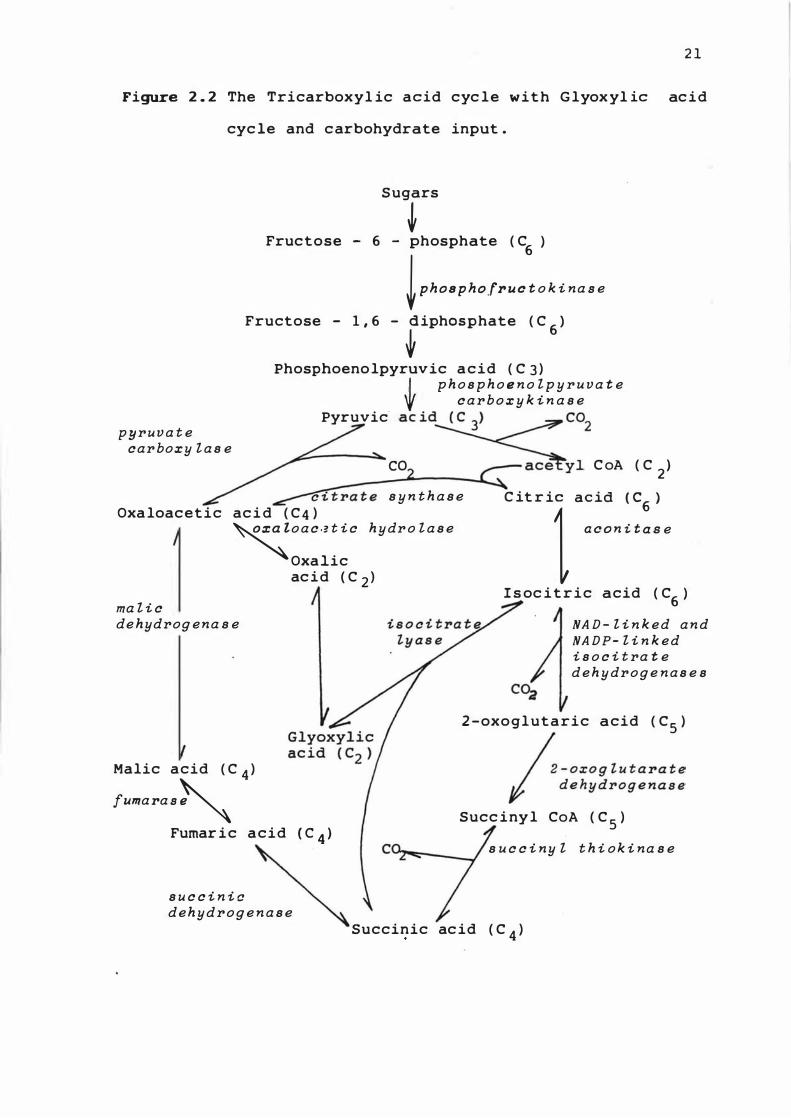
Figure 2 . 2 The Tricarboxyl ic acid cyc le w i t h G lyox yl ic ac i d
cyc le and c arbohydrate input .
pyruva t e car boxy l a s e
Sugars
� Fructose - 6 - phosphate ( C
6)
� Ph08PhOf • . . t o k i na . e
Fructose - 1 . 6 - ;iPhOSPhate ( C6
J
Phosphoeno lpyruvic a c i d ( C 3 ) L p h o s p h o e n o l p y r u va t e
'f c a r b o x y k i n a s e Pyruvic· aC id� co
2
CO _�Y l C oA ( C 2 ) c i t ra t e s y n t h a s e
Oxa loacetic ac i d ( C 4 ) c it r il a:::
n
::: �e �o a c .? t i c hydr o l a s e
Oxalic
ma l i c de hydrog ena s e
Malic acid ( C 4 )
f.",a .a .�
ac i d ( C 2 )
Fumar i c acid ( C 4 )
s u c c i n i c dehydrog e n a s e
I s oc i t r ic acid ( C6 )
NA D - l i n k ed a n d NA DP- l i n k ed i s o c i t ra t e d e h y drog e n a s e s
2 -oxoglutaric acid ( CS )
� - Oxog t . t a .a t e I "d e hy drog e n a s e
Succ iny l CoA ( C S )
s u c c i ny l t h i o k i na s e
Succinic ac id ( C 4 )
2 2
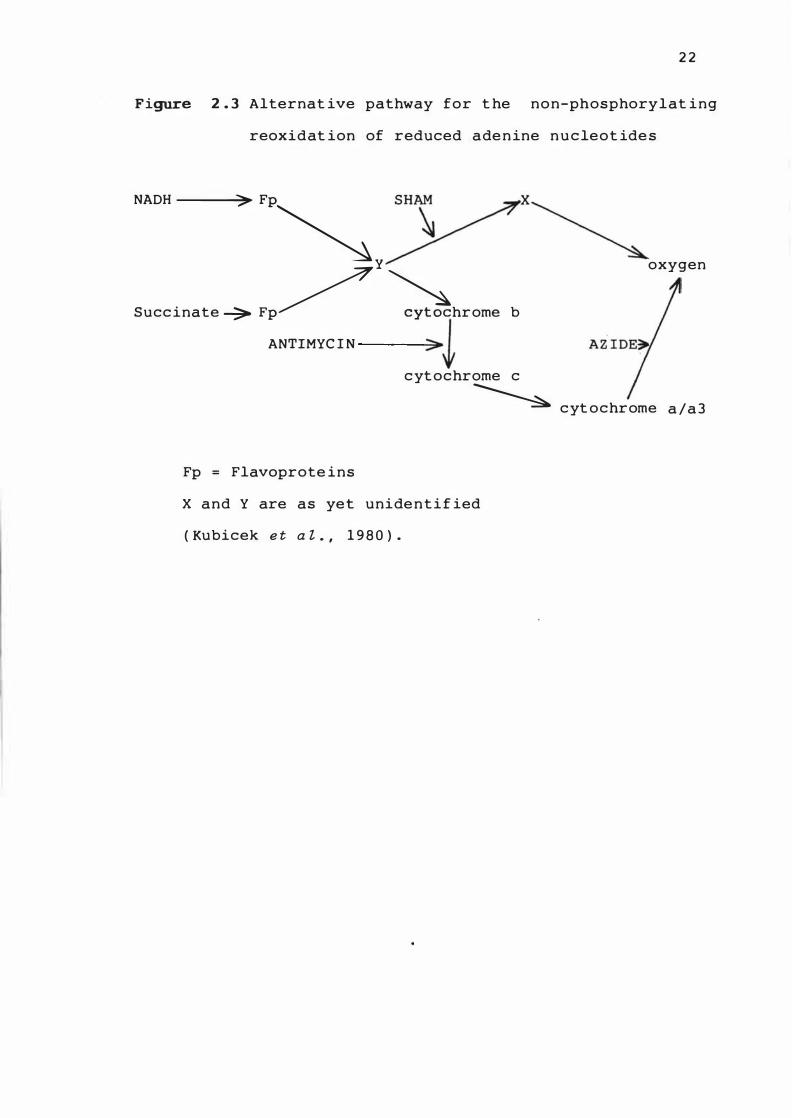
Figure 2 . 3 Alternat ive pathway for t he non-phosphorylat ing
reoxidat ion of reduced ade n ine n u c leot ide s
NADH ---.;;::>� FP�
y
Succ inate --:;;. FP/ �hrome b
ANTIMYC I N 30J
x
oxygen
c yt ochrome c
� c yt ochrome a /a 3
Fp = Flavoprote ins
X and Y are as yet unide n t i f ied
( Kubicek e t a l . , 1 98 0 ) .
2 3
acid acc umulat ion i nvo lvin g is o c itrate lyas e . I t i nvolved
the a ccumulat ion of lip ids b y the organ i sm , whi ch c a u s e d t he
glyoxyla t e cyc le t o opera t e in an at tempt t o convert t he
lip ids back t o s u gars . Because an exc e s s o f s u gar i s s t i l l
pres ent , oxa l i c ac i d accumu lates . W i t h t he c onve r s i o n of
oxa l i c acid to glyoxylate ( F i gure 2 . 2· ) , the s ub s equent
react ion g lyoxylate to i s o c i t rate ( t he e n z yme i s o ci t r a t e
lyase ) i s the reverse o f t ha t norma l l y operat i n g w h e n t he
g lyoxylat e cycle i s in operat ion , s o i s o c i t rate i s f orme d .
However , this hypot hes is was bas e d on mas s b a lance e quat ions
der ived from data obt ained from bat ch ferment at i o n s , in
which t hey s t art e d from a premise tha t c itr i c a c id
product ion occurred only after act ive grow t h had c e as e d .
However , Ho s s ain e t a l . ( 19 8 4 ) have s hown t hi s not t o be t he
case . Therefore , while this hypothe s i s cannot be d is mi s s e d ,
i t mus t be treated with s ome caut ion .
I n s ummary , a great deal of informat ion w i t h r e gard t o
the operat ion of the 1C A- c ycle , and more recen t l y s ome w i t h
regard t o the g lyoxylate cycle dur i n g c it r i c a c id
accumulat ion has been pub l is hed . However , much o f i t is
con f l ict i n g , and t he s i t uat ion , alt hough s l i ght l y c le ar er
than in 1 9 80 , remains uncert a i n .
2 . 6 ENVIRONMENTAL FAC TORS AFFEC TING C ITR IC AC I D ACC UMULATION
Much contrad ict ion e x i s t s i n the l iteratur e r e gard i n g
the e f f e c t s o f d i f ferent environment a l f a c t or s on c it r ic
acid product ion .
dif ferent work ers
Poss ibly , this can be exp l a ined b e c au s e
have used ( 1 ) d i f ferent s tr a i n s o f
2 4
organ ism , ( 2 ) dif ferent media and ( 3 ) d i f f erent s ou r ces o f
nutr ient chemica ls , pos s ibly contaminated wit h d i f ferent
leve ls of trace e leme n t s . Als o , it mus t be borne i n mind
t hat the various environme n t a l factors can inter a c t with
each other . Hence , t he f o l lowing sect i o n s s ummar i s e t hose
factors which are k nown to be import ant .
2 . 6 . 1 Form of Growth
When f i l amen t ous fungi are grown in s ubmerged c u lt ure
the t ype of growt h var ies from t he " pe l let " form , c on s is t in g
o f a compact dis crete spherical mas s o f hyphae , t o t he
" f i lamentous " form in which the hyphae f orm a homogenous
s uspens ion dispersed t hroughout t he medium . The pe l l e t mode
of growth is gener a l l y be l ieved to be des irab le i n the
citric ac id fermentat ion and i t s format ion depends u p o n t he
fungal species , t he s iz e of t he inocu lum , t he growt h medium
and t he phys ical environment within t he c u l t ure ves s e l e . g .
pH , aerat ion and agitat ion ( Whitak er and L o n g , 1 973 ) .
Schwe iger and S n e l l ( 1 9 49 ) deve loped a medium i n which
A . n iger grew in t he form of sma l l pe lle t s , averag i n g 0 . 1 mm
diameter , which were composed of s hort s t ubby , f ork ed ,
bu lbous myce l ia . They report ed t hat t he s l ime - f ormin g
t e ndencies of the fungus were e l iminated a n d aera t i o n was
more eas ily achieved . C ar i l l i e t a Z . ( 1 96 1 ) obse r v e d t hat
t he f ilamentous form of A . n i ger reduced t he oxygen l e v e l i n
the medium to zero a f t e r 15 hours o f ferme n t at i on . W h e n the
fungus was induced t o form pellets , t he v i s cos i t y o f t he .
s uspens ion was cons iderably lower and t he d i s s o lved oxygen
leve l cons iderably h igher . They conc luded t ha t t he pe l le t
2 5
form o f growth was e s s e n t i a l t o ma intain an exce s s o f oxygen
in t he c u l t ure med ium and hence achieve hi gher y i e lds o f
c i t r i c a c i d . C lar k e t a l . ( 1 9 6 6 ) repor t e d t hat f i l ament o u s
growth of A . n ig e r has l i t t J.e capac i t y t o produc e c it r ic
a c id and i t s occurrence has a lways res u l t ed i n poor y ie ld s .
They further demons trated t ha t Mn 2 + ions induced f i lame n t o u s
rat her t han pel 1e t a l growt h dur ing s ubmer ged f erme n t a t ion .
Heinrich and Rehm ( 1 9 82 · ) s t udied c i t r i c a c id produc t i on
from A . n i g e r in bot h s hake - f las k cult ure and i n a s t irred
fermenter . They obtained h igher c it r i c ac id yie l d s i n t he
s hake -f lask t han in t he s t irred ferme n t er c u l t ure . T he
reas on g iven for t he d i f f erence was t he d i f feren t modes o f
growt h , i . e . pe llets in s hake -f lask and f il amen t s i n t he
s t irred fermenter . They concluded t h a t t he f i l ament o us
growt h in t he fermenter was due to Mn2 + i on c o n t am i n a t ion o f
t he medium from impur i t ie s in the s t ainl e s s s tee l p ar t s .
Whit aker and Long ( 1 9 7 3 ) pub l is he d a review i n whi c h
t he import ance of t he p e l let a l f or m o f growt h was
extens ive ly discus s ed . However , t he y d i d n o t p re s e nt
evidence t o demons t rate c learly whet her i t i s t he p e l le t a l
form or t he ferme n t at ion condit ions ( wh ic h c o i n c i de n t a l ly
en courage pellet format ion ) which is i mpor t ant i n c i t r i c
acid product ion . The e f f i c iency o f aer a t i o n o f t he
fermentat ion l iquor is much greater i n a p e l le t a l c u l t ur e
t han i n a f ilament ous culture . However , t here i s a t pre s e n t.
no exper imental dat a pub l i s hed regard i n g t he aerat i o n
e f f i c iency w i t h i n pe l let s . Als o , s uch f a c t or s a s Mn 2 + i o n s ,
t he pres e n ce of which is known to be de t r ime n t a l t o c i t r i c
acid product ion , were pos tulated t o act t hr o u gh t he ir e f fe c t
2 6
o n f ungal morphology , i n wh ich t he f i l amen t ous f orm of
growth is encouraged . The work of Hab i s on e t a Z . ( 19 8 3 )
( Sect ion 2 . 5 ) indicates t hat the Mn 2 + ion e f f e c t i s
b iochemical , and related t o t he intracell u l ar NH +
ion 4 concentrat ion .
2 . 6 . 2 pH
The maintenance of proper acidity of t he f e rme n t at i o n
medium i s import ant f o r s uc ce s s ful product ion o f c it r i c
acid . A low pH f avours c i t r i c acid a ccumulat i o n ( and
c o i n c ident aly minim i z e s t he danger o f m i cr o b i a l
c o n t aminat io n ) , wh ile a high p H favours t he produ c t i o n of
oxalic ac id ( Pres cott and Dunn , 19 59 ) . I n genera l , t he be s t
c it r i c acid-producing s trains p o s s e s s the greate s t t o lerance
o f acidic condit i ons , but t he mos t f avourable p H w i l l depend
l arge ly on t he fungal s train u s e d ( Loesecke , 1 9 4 5 ) . Berry
e t a l . ( 1 9 7 7 ) have s ugge s ted t hat t he mos t favoura b le pH
value is between 2 ' . 0 and 3 . 0 . A higher pH i s f avoured
dur ing the init ial s t ages of t he fermentat ion s in c e t h i s
f a c i l it ates mycel ial growt h ; t hereaf t er t he p H i s p e rm it t e d
t o drop dur ing the ferme n t a t ion as t he c i t r i c a c i d
accumulates in the medium .
Shu and Johns on ( 19 4 8b) demons trated t hat t he i n i t ia l
pH value o f a sucrose -based s yn t he t i c med i um i n f l u e n c e d t he
rate of c it r i c acid product ion i n s ubmerged cult ur e . They
observed that at i n it ial pH 1 . 7 both growth and c it r i c a c i d
product ion were great ly reta�ded . They obt a ined t he h i ghe s t
yield at i n i t ial pH 3 . 7 t o 4 . 2 . Banik ( 1 9 7 5 ) adj u s t e d t he
pH of a s ucrose-based s yn t he t i c medi um t o 2 . 0 , 2 . 5 , 3 . 5 ,
2 7
4 . 0 , 4 . 5 and 5 . 0 and found t hat the opt imum i n i t i a l p H f or
t he product ion of citric ac id was 3 . 5 . However , i t h a s been
s ugge s ted t hat the opt imum i n i t ial pH var i e s depe n d i n g on
the nature of t he s ub s t rate ; a pH value of 2 . 5 t o 4 . 0 i s
opt imum f o r def ined media while an init ial p H of 6 . 0 t o 7 . 5
is required in molasses medium ( Berry e t a Z. , 1 9 7 7 ) .
Hos s a in e t a Z . ( 1 9 8 3 ) obs erved t hat an i n i t i a l pH o f 4 . 5 was
opt imal for c i t r i c a c id product ion from whey perme at e .
Kri s t iansen and C harley ( 1 9 8 1 ) conducted exper im e n t s i n
- 1 a con t inuous cult ure chemos t at a t a growth rate o f 0 . 0 7 5 h
and pH values ran ging from 1 . 5 t o 3 . 5 . They c a l c u l a t e d t he
s p e c i f i c c i t r ic acid product ion rates and conc lude d t hat t he
opt imum pH value for citric a c i d produ c t ion was p H 1 . 7 5 .
They als o demons trated that at a growt h rat e o f 0 . 0 7 5 - 1
h ,
t he overall c it r i c acid product ivity and t he b i omas s
concentrat ion were independen t o f the p H within t he r an ge
1 . 6 t o 3 . 9 .
'2 , . 6 . 3 Temperature
The importance of incubat ion tempera t ure in d e t e r m i n i n g
t he yie ld of c i t ric a c i d has been e mphas i s e d b y many
inves t igators ( e . g . Kitos et a Z . , 1 9 5 3 ; Mart i n , 1 9 5 7 ;
K r i s t iansen and C harley , 1 9 8 1 ) . The t e mperat ure u s e d w i l l
depend i n part o n t he organ ism and t he f e rme n t a t ion
condit ions . The opt imum temperature r a n ge o f ' 2·8 t o 3 0 °c
for A . n i g e r has been propos ed for high y i e l d s a n d r ap i d
rates of accumu lat ion ( Pres cpt t and Dunn , 1 9 5 9 ) . D o e l ger
and Pres cott ( 1 9 3 4 ) found that increas i n g t he t empe r at ure
above 30 °c decreased the c it r ic acid yie ld and i nc r e a s e d
2 8
oxa l i c a c i d accumulat ion .
'2 '. 6 . 4 Aerat ion
C itr ic ac i d is an ox idat ion product of a hexose s u gar ,
and therefore , dur ing i t s product ion under s ubmerged c u l t ure
cond i t ions , i t is n e ce s s ary t o ens ure a s upp ly o f oxyge n
exceeding t hat required for growth a l one .
Karow and Waksman ( 1 9 4 7 ) obt a i ned max imum y i e l d s of
c it r ic acid when pure oxyge n i n s tead o f a ir was sup p l ie d to
t he cultures . They conc luded t hat oxygen is a l im i t in g
factor i n t he product ion of c it r i c ac id i n s ubme r ged
ferment at ion . They did not howeve r , report t he oxyge n
upt ake rates .
Us ing a s yn t het i c s ucro s e -based medium i n 5 0 - ga l lon
t an ks , Bue low and Johnson ( 1 9 5 2 ) found t hat by i n c r e as ing
t he airf low rat e from 0 . 9 to 3 . 5 mmo l oxyge n / l . m i n and
in creas ing the agitat ion s peed , t he fermentat ion t ime was
decreased by approx imately 4 0 hours , and t he yield i nc r e as e d
from 5 5 to 8 0 % ( based on s ugar ut il is ed) . No c u l t u r e DOT
values , oxygen uptake or carbon diox i de product i o n r a t e s
were reported and s o n o compar is ons of t he s e r a t e s w i t h
t hose o f other workers is pos s ib le .
Kovat s and Gackows ka ( 1 9 7 6 ) r eported t ha t an
int errupt ion to aerat ion dur ing the f e rme n t at ion a d ve r s e l y a c.uJ
af fected c i t r i cAproduc t ion . Kub icek e t a l . ( 1 9 8 0 ) r e po r t e d
t hat a s hort interrup t ion t o aerat ion r 2� minut e s } r e s u lt e d
in a complet e and irrevers i.b le l o s s o f a b i l i t y t o p r o duce
c it r i c acid , but had no e f f e c t on t he viab i l it y o f t he
organ ism . The indus tr ial import ance o f t his f in d i n g , i s
2 9
t hat i f a mechan ical bre akdown occurs and las ts lon ge r t ha n
2 0 m inutes , t he ferme n t at io n will have t o be abandoned .
Fundamentally, it indica t e s t hat the c it r i c acid p r o duc i n g
c apab i l i t y o f the organ i s m i s fragile , in t hat it w i l l not
s urvive adverse condi t ions f or more t han a few m in u t e s ,
whereas the viabi l i t y o f t he organism is unaff e c t ed . The
authors did not at t empt t o exp lain this e f fect . H oweve r , i t
is un likely that i t i s a gene t i c e f f ec t , s uch a s p lasmid
c ur i n g , due t o t he r ap id i t y of t he loss of the p r opert y
( Scot t , pers . comm . , 1 9 8 6 ) . A p o s s ibility i s t ha t ,
i nduct ion of a biochemical pathway , n o t normally o p e r a t i n g
under condit ions s uit a b le f or c it r i c ac id ac c umu l a t i o n ,
occurs . Once induced , t h i s pathway c o n t inues ope r a t i o n even
after recommencement o f aerat ion , w i t h c itric a c i d as a
s ubs t r at e . However , i t mus t be emphas i s e d t hat t h i s i s
speculat ion . Kub icek e t a Z . ( 1 9 8 0 ) reported c r i t i c a l DOT
values for A . n i g e r of 18 to ' 2 1 mbar ( 1 0 to 1 2 % o f a ir
s at urat ion ) during the growth phase , and 2 3 t o 2 6 mbar ( 12
t o 1 5 % of air s at urat ion ) dur i n g the product ion phas e . T he
min imum DOT value for c i t r i c ac id produc t ion was 2 5 mbar
( 1 5 % of air s aturat ion ) and product ion increas e d s t e ad i l y
between 4 0 and 1 5 0 mbar ( 2 5 and 7 5 % o f a ir s at ur a t ion ) .
They reported spe c i f i c oxygen upt ake rates o f 0 . 1 2
mmo l / gDW . h and specif i c carbon dioxide produc t i o n r at e s o f
0 . 0 6 mmo l / gDW . h . These f i gures are s i gn i f i cant ly lower t ha n
thos e reported b y S iebert and Schulz ( 1 9 7 9 ) whi c h w e r e i n
t he order of 1 to 10 mmo l / gDW . h f or the spec i f i c oxygen
upt ake rate , and 0 . 1 t o 2 . 0 mmo l / gDW . h f or t he s pe c i f i c

c arbon diox i de product ion rat e . Meas ureme n t s
s pe c i f ic oxygen upt ak e r a t e of f u n g i i n o t he r
3 0
o f t he
aerobic
ferment at ions , s uch as p e n ic i l l in product ion ( Varder and
L i lly , 19 8 2 ) , are of t he s ame order as t hose repo r t ed by
S ie bert and S chulz ( l 9 7 9 ) , so t he dat a of Kub i c e k e t a Z .
( l 9 8 0 ) mus t be treated w i t h s ome caut ion . Over a l l , f ew dat a
are ava ilab le on t he oxygen uptak e and carbon d i ox ide
product ion rates dur ing t he c itric ac id f erment at i o n .
' 2' . 6 . 5 Nutrit ional Status of the Growth Medium
It i s generally accepted t hat in batch f er m en t a t ion
microogan i s ms wi l l grow at t heir max imum spe c i f i c growt h
rate , u n t i l at leas t one nutrient in t he local e n v i ronme n t
becomes growt h- l im i t ing . U n l e s s t he growt h - l im i t ing
nut r ient is reple n i s hed , i t wi l l eve n t ua l ly be e x hausted
from t he local environme n t and this i s t ermed " n u t r ient
exhaus t ion " . This phenome non is u s e d in f e rm e n t at ion
proces s e s t o allow t he organ ism t o mu lt i p l y t o an opt imum
b iomas s concentrat ion by t he use of a non - c ar b o hydrate
growth-l im i t ing s ubs trate s uch as n i t rogen . O n c e t he
growth- l imit ing nut r ient i s exhausted from t he med i um , t he
organ ism converts t he rema i n i n g c arbohydrate t o t he des ired
product rather than t o b iomass .
2 . 6 . 5 . 1 C arbohydrate
Pure s ugars s uch as glucose or s ucrose were u s e d a s t he
carbon s ource in much of t he early work on c it r i c ac id
product ion , but in present commercial prac t ice t he raw
mater ial is generally cane or bee t mo las s es . Ear l y work ers
e s t ab l i s hed that a relat ive ly high s ugar concent r a t i o n of

3 1
1 0 0 t o 2 0 0 g / l was requ ired t o g ive h i gh yie lds o f c i t r ic
acid ( based on sugar ut i l is e d ) and t hat in weak e r s ugar
s o lu t ions , a large proport ion of t he s ugar was r e qu ired as
an e nergy s ource for gr owt h ; c on s e quent ly les s ac i d could be
produced ( C urrie , 1 9 1 7 ; Por ge s , 1 9 3 2, ; Doelger and P r e s co t t ,
1 9 3 4 ) . I n curren t commerc i a l pract ice , u s i n g s ubmerged
fermentat ion , the concentrat ion of s u gar i n the med i um i s
adj us ted t o 1 6 0 g / l ( Berry e t a Z . , 1 9 7 7 ) .
Var ious sugars have been inve s t i gated a s carbohydrate
sour ces for c itr i c a c i d produc t ion , inc luding g luco s e ,
s ucrose , arab inose , fructose , lactose , gala c t o s e and
mannose . Very l it t le c i t r i c a c i d was obt ained from g a l ac t o s e
in compar i s on wit h other sugars
1 9 62 ) . Ho s s a in et a t . ( 1 9 8 4 )
( Ame l un g , 1 9 2 7 ; N o gu c h i ,
inve s t i gat ed c i t r ic a c id
product ion from dif ferent s ugars i n c luding s ucros e , g lucos e ,
fructose , lactose and galact o s e . They s howed t ha t t he
maximum rate of c i t r ic ac id product ion us i n g sucr o s e was at
least ' 2 . 5 t imes higher than t hat obta ined using a n y o f t he
other s ugars . No c it r ic ac id was produced when g a l a c t o s e
was the s ugar s ource and whe n a mix ture of g l u c o s e a n d
galactose was use d as the s ugar s ource , Hos s a i n e t a Z .
( 19 8 5 ) s howed galactose t o have an inhib i t ory e f fe c t o n
c it r i c a c i d product ion from glucos e .
2 . 6 . 5 .. 2 Nit rogen
Nitrogen is
nutr ient dur ing
generally
c i t r i c .
u s e d
acid
as the growt h- l im i t i n g
product ion i n b a t c h
fermentat ion , s o that the f ermentat ion oper a t e s under
phase . However , n i troge n exhaus tion dur i n g t he product ion
32
there are no pub l i s hed dat a s howi n g t he exact re l a t i o n s h ip
between exhaus t ion of nutr ie n t n itro gen and t he i n i t i a t i o n
of c i t r i c acid product ion . L oes e cke ( 1 9 4 5 ) report e d t hat a
low n itrogen con cen trat ion f avours c it r i c ac id product ion ,
whi le a h i gh nitrogen concentrat ion favour s abun d a n t growt h
of myce l ium , wit h low c i t r i c a c i d produc t ion . T h i s e f fe c t
o f t he high concentrat ion probab ly occurs f o r two r e as on s ;
f irs t ly , by the t ime t he n itrogen is exhaus ted f r om t he
medium les s s ugar rema ins f or c onver s i on t o c i t r i c ac i d
s ince it has already bee n converted to b ioma s s a n d c arbon
diox ide ; and secondly , t he higher t he biomass con c e n t r a t io n ,
the more d i f f icult it is t o mai n t a in a s u f f ic ien t l y h ig h D OT
for c it r i c acid product io n t o occur . Thus , t he n e e d t o
limit b i omas s is emphas ized .
The n itrogen source i s usually ammon ium s ulphat e ,
ammon ium n itrate , s odium n itrate , potass i um n i t r at e or
ammon ia . No s ingle s ource is s uperior to any others and t he
advantages occas ionally obs erved are a measure of t he p ur i t y
o f t he compound used ( Per lman and S ih , 1 9 6 0 ) .
2' . 6 . 5 . 3 Phosphate
General ly , pot a s s ium dihydrogen orthopho s p hat e i s us e d
when phos phate needs to be added t o commerc i a l f e r me n t at ion
s ubs trates . It is also t he s o urce in mos t s yn t he t i c medi a .
A patent by Szucs in 1 9 4 4 ( Shu and J ohns on , 1 9 4 8 a ) c laimed
t hat pho sphate l imitat ion was required f o r c i t r i c ac i d
product ion i n s ubmerged . cult ure , but i t w a s later
estab li s hed by the latter aut hors t hat t h i s work h a d been
performed us ing an ins uf f i c ient ly pur if ied phospha t e s ource ,
3 3
which s t il l contained s ome trace met a l ions , and t ha t while
t he phosphate conce ntrat ion s hould be low , . it need n o t be
l im it in g to al low citric a c i d accumu lat ion . Except f or t he
more recent work by Kr i s t iansen e t a t . ( 1 9 82') in c o n t i nuous
c u l t ure c hemostat operate d with a phosphate - l imi t e d feed
med i um , very lit t le informat ion e x i s t s on t he e f f e c t of
phosphate l imitat ion on citric a c i d produc t ion . Kr i s t i a n s e n
e t a t . ( 1 9 82') s howed that le s s c i t r i c acid was p r o duced
duri n g phosphate - l imited s teady s t ates t han duri n g t hos e of
n it rogen l imitat ion . However , t hey conc luded t hat t he
amount of exces s n i trogen in t he med i um was the impor t an t
f ac t or rat her than t he lack of phosphat e , in t hat t he h i gher
t he exce s s of nitrogen , the les s c i t r ic a c id was produced .
2 . 6 . 5 . 4 Trace Elements
Many variat ions have been reported in t he requ i r e me n t s
f or s ome e s s ential trace e lemen t s , s uc h a s Fe 2 +, C u 2 + ,
and Mn 2 +, in t he c i t r ic a c i d f erment at ion , ref l ec t i n g t he
d i f ferent s t rains of A . n i g e r used , as we l l as t he d i f f e r e n t
s ources o f nutrient chemicals . I t is we l l e s t ab l i s hed t hat
the trace me tal requ irements mus t be inve s t igated whenever a
new s t r a i n or substrate is used ( Berry e t a t . , 1 9 7 7 ) .
C lark e t a t . ( 1 9 6 6 ) s t udied t he e f fe c t o f var i ous t r a c e
metals on c itric acid product ion a n d conc luded t hat v e r y l ow
2 + 2 + 2 + 2 + leve ls of Fe , C u and Z n , and t he t ot al abs e n c e o f Mn
were requ ired for high yie lds of citric a c id .
No data are ava ilab le on trace met al upt a k e r a t e s
dur i n g the c itric acid ferment at ion . The o n l y t r a c e me t a l
t o have been s t udied in any de t a i l i s Mn2 +. Kub i c e k a n d
3 4
Rohr ( 1 9 7 7 ) demons trated t hat Mn2 + in t he f e r me n t a t ion
med ium de creased t he specific a c t iv i t y of c itrate s yn t has e ,
while i ncreas i n g t he speci f i c act ivit ie s o f acon i t a s e and
both NAD- l i n ked and NAD P - l in ked i s o c i t rate dehydr o ge n a s es .
Hab i s on e t a Z . ( 1 9 8 3 ) reporte d increased i ntrace l lu lar NH: leve ls when
2 + M n was absent from t he fermentat i o n med ium ,
pos s ib l y due t o increased pro t e i n
+ leve l of NH4 deregulates t he
degradat ion . T he
c itrate inhib i t ion
high
of
phosphofructokinas e , t hus fac i l i t a t i n g t he a ccumu l at i o n o f
c i t r i c ac id . However , in Mn 2 +
- s uf f i c ient med i a , t he
+ intrace l lular NH 4 leve ls were lower , as was the c i t r i c a c i d
yie ld ( Habison e t a Z . , 1 9 8 3 ) .
The pres ence of 2 +
Mn has a l s o been r e p o r t e d t o
encoura ge f i lamen t ous as oppos e d t o p e l le t a l morphol o gy
( Ki ss e r e t a Z . , 1 9 8 0 ; Heinrich and Rehm , 1 9 8 2 ) .
2 + 2 + 2 + The trace me tals F e , e u and Z n have bee n reported
to have a cr i t i cal i n f luence on c i t r i c acid p ro d u c t ion .
Several reports indicate t hat s ome or a l l o f t he s e met a ls
s hould be abs ent from t he med i um or pre s e n t i n v e r y l ow
concentrat ion . Shu and Johns on ( 1 9 4 7 , 1 9 4 8b ) , f o r e x amp le ,
2 + reported that Fe mus t b e pre s e n t i n low con c e n t r a t i o n s ,
ye t L a Nauze ( 1 9 6 6 ) imp l ies t hat it s hould be a bs en t f or
high yields of citric acid . 2 +
e u has be en report e d t o be an
antogq� i s t t o Fe2 +
( Schwe iger , 1 9 6 1 ) , which , if t h is i s t he
case , s ugge s t s t hat a lower concentrat i o n of 2 +
F e wil l
2 + negat e t he requirement for e u . I t has been s t a t e d t hat
2+ ons e t of Zn de f i c iency dur i n g growth of t he fungus s i gn a l s
t he tran s it ion from the growt h phase t o t he produ ct io n p ha s e
3 5
( Kapoor e t a Z . , 19 82 ) . However , it i s general ly a c c e p t e d
t hat t hi s t rans i t ion occurs at t he point o f n i t r ogen
exhaus t ion .
2 . 6 . 6 Presence of Methanol and Other C ompounds
A maj or advance in the t echnology of t he c it r i c a c id
f erme n t at ion was t he obs ervat ion by Moyer ( 1 9 5 3a , b , 19 5 4 )
t hat t he addit ion of a lcohols or e s t ers t o t he f erme n t at ion
medium res ulted in increased c it r ic a c id produc t i o n . He
demonstrated that t he add i t ion of methano l ( f in a l
concentrat ion ' 2 t o 4 % ( v /v ) ) at i noculat ion great ly e n hanced
c i t r i c ac id product ion by A . n i g e r f rom crude c ar b ohydra t e
s ources s uch as ge lat in ised corn s t arch , black s t r ap m o l as s es
and beet mo las se s . Hos s ain e t a Z . ( 1 9 84 ) repo r t e d t ha t no
citric acid was produced when galact o s e was the s ub s t r a t e .
However , the add i t ion of 3 % ( v/v ) met hano l on day 3 o f t he
fermentat ion caused c i t r i c acid to be produc e d f r om
galactose . The exact role of met hanol was not s t at ed b y
e it her author , b u t it was not as s imi lated dur i n g t he
fermentat ion . Several other work er s have report e d t hat
other compounds are also bene f i c i a l in increas i n g t he c it r ic
acid yie ld , for example glycero l ( Leopo1d , 1 9 7 1) a n d f at t y
acids ( Mi 11is e t a Z . , 1 9 6 3 ) .
' 2 . 7 RELATIONSHIP BETWEEN GROWTH RATE AND C ITRIC )C ID
PRODOC TION
Gaden ( 1 9 5 5 ) proposed a c las s i f i c a t ion s che me o f .
ferment at ions in which t here were t hree t ype s . Type I
ferme n t at ions convert the energy s ource d i re c t l y t o p r o d u c t
3 6
a s a res u lt o f me tabol ism , and as s uch are growt h -
as s oc iated . For Type 1 1 fermentat i ons , the produc t
format ion exhibits s ome relat ions hip wi t h growth r at e , but
it is n o t direct ly growth -a s s o c i ated . I n Type I I I
fermentat i o n s , growt h-as sociated me t ab o l is m of t he energy
s ource has pas sed its maximum and has a lmos t cea s ed bef or e
the per i od of max imum product f ormat i o n . The c la s s i c a l
examp les o f the three types are e t hanol , c i t r i c a c i d a n d
pen i c i l l in f or Type I , Type 1 1 and Type I l l , respe c t ive ly .
Many reports have been publ i s hed on the s ubme r g e d bat c h
fermentat i o n of c i t r ic acid but f ew dat a are pre s e n t ed o n
growt h rates , a s opposed t o mycel ial dry we i ght s . I t i s
pos s ible t o calculate approx imate spe c i f ic growt h r a t e s at
par t i cular t imes dur ing the f erme n t a t i o n from t he d a t a of
some aut hors ( e . g . S iebert and S chulz , 1 9 7 9 ; Hos s a in e t a Z . ,
1 9 8 3 , 1 9 8 4 ) due t o the ir frequency of s amp li n g . However ,
mos t aut hors have not s ampled frequent ly · enough . H o s s a in e t
a Z . ( 1 9 8 4 ) demons trated t hat t he max imum s p e c i f i c r a t e o f
citric ac id product ion occurred pr ior t o t h e exhau s t ion from
the medium of nutr ient n itroge n , t he growt h - l im i t i n g
subs trat e , and not later i n t he fermen t at ion , a s h a s b e e n
generally a ccepted in the l it erature . T h i s imp l i e s t hat t he
maximum product ion occurs at a pos i t ive growt h rate .
Because o f the wel l -e s t ab l i s hed var lat i o n o f t he s p e c i f i c
growth rate during a bat ch fermentat ion , t he c u l t ure w i l l be
at the opt imum growt h rate for c it r i c a c i d product io n f or
only a s hort period of t ime . This was reco gn is e d by
Kri s t ian s e n and S inclair ( 1 9 7 9 ) , and Kr i s t i a n s e n and C har l e y
( 1 9 8 1 ) , both o f whom used chemo s t at c o n t i nuous c u l t ure t o
3 7
inves t igat e , amongst o t her par ameters , t he e f fect o f growt h
rate on c i t r ic ac id produc t ion . The former aut h o r s u s ed
A s p e rg i l l u s fo e t i du s , wh ils t t he lat t e r used A . n i g e r . B o t h
aut hors report ed an opt imum spe c i f i c growt h r a t e o f
approx ima t e ly 0 . 0 75 h- l for c it r i c acid p r o d u c t ion .
However , n e i t her group re corded t he DOT of t he c u l t ure at
s te ady s t at e , nor did t he y a t t empt t o contro l i t . H e n c e ,
although t hey mai n t ained aerat ion and a g i t at ion c o n d i t ions
cons t an t for all s t eady s t at e s , i t i s c le ar t hat d i f fe r e n t
DOT values mus t have exis t ed s ince t he oxygen upt ak e rat e
would have varied with t he growth rate . The repo r t e d opt imum
growt h rates mus t therefore be c a l le d i n t o doubt , as at
leas t two parame t ers ( DOT and growth rat e ) c hanged f or e a c h
s t e ady s t ate , when i t was as s umed t ha t only t he growt h rate
changed . Only t he v a l u e of t he opt imum growt h r a t e i s
que s t ioned , however , not i t s ex i s t ance .
' 2, . 8 C ONTI NUOUS C ULTURE C HEMOSTAT PRODOC TION OF C ITRIC AC ID
Mos t pub lished work on c it r ic acid product i o n u s i n g t he
s ubmerged ferment at ion proces s has been from labora t or y or
p i lo t s ca le bat ch ferme n t a t ion . This may con t r i but e t o t he
var ied obs ervat ions and consequent lack of a s in g l e
unanimous ly s upported hypot he s is for t he me chan i s m o f c i t r ic
acid accumulat ion by A . n i g e r .
Les n iak and S t awi ck i ( 1 9 7 9 ) used a " s emi - c on t i n uous"
sys t em o f removal of a given vo lume of ferme n t a t i o n brot h , .
con t aining a repres e n t a t ive amount o f b i om as s and
rep laceme n t with fresh medium at daily intervals . T h i s was
3 8
i n e f fe c t a repeated fed-bat c h cult ure . They d i d n o t
a t t empt a chemos t at s t udy , c i t ing t e chn i c a l prob lems w i t h
main t a in i n g a cons t ant vo l ume . This problem has a l s o b e e n
e xper ienced b y o t her workers att empt i n g chemos tat s t ud i e s
w i t h f i lame nt ous organ isms ( Kr i s t ians e n a n d C harle y , 19 8 1 ;
C lark , 19 82 ; C lar k et a l . , 19 8 3 ) . The main problem involv e s
r apid b lockage o f t he overf low port i f a s t a ndard we ir t ube
i s employed . However , met hods have been dev ised t o c ontro l
t he out let flow , usually involv i n g app l icat ion of a vacuum
on an e lectr ically controlled t ime s i gn a l ( C lark e t a l . ,
19 8 3 ) .
A maj or use of the cont inuous c u l t ure c hemos t at i s as a
research tool . Thus , s teady s t ate condit ions may be
achieved , in contras t to t he trans ient cond i t i o n s in
t rad it ional bat ch fermentat ion . I n t ur n , t h i s a l lows
contro l , and hen ce inves t igat ion , of v ar ious environme n t a l
f actors . However , it mus t be emphas i s e d t hat t o i n t erpre t
corre c t ly dat a from a chemostat , o n l y t he one p arame t er
under inve s t igat ion can be permit t e d t o change , un l e s s , i n a
des i gned experimen t prov i s ion i s made f or t he s t udy o f two
or more parameters . I n this s it u a t ion , a f ac t or i a l
exper imental des i gn mus t be used .
The commercial advant age of us i n g a c o n t inuous c u l t ur e
chemos tat is greater product iv i t y t han f r om a batc h proces s ,
s ince the condit ions required for t he maximum product iv i t y
c an b e maintained for lon g per iods . I n c o n t r as t , dur i n g a
batch proces s t he s e condit ions may o c c ur o n ly f o r a very
s hort per iod of t ime . Kri s t ian s e n and C har l e y ( 19 8 1 )
reported a 3 -fold increas e in produc t iv i t y over p ub l i s he d
3 9
l it erat ure values for bat c h s t irred t anks and s emi
cont inuous t ower proces s e s . They s t at e d , however , t ha t t hey
used a s ucro s e -based s yn t he t i c medium , and compar i s o n was
w i t h values reported for bot h s ynthe t i c med i a and mo l a s ses .
S tudies on c i t r i c acid product ion i n c hemo s t a t c u l t ure
have been des cribed by Kris t iansen and S in c lair ( 1 9 7 9 ) and
Kr i s t ianse n and C har ley ( 1 9 8 1 ) , us ing b o t h n i t r o ge n - and
phosphate - limited condi t ion s . The ir s t udies p e r t ained
mai n ly to t he e f f e c t s of grow t h rate ( see Sect ion ' 2 . 7 ) and
pH value ( s ee Sect ion 2 . 6 . 2 ) on c it r ic a c id product i o n .
2 . 9 C ONTI NUOUS FED-BATC H C ULTURE
The t erm fed -bat ch c u l t ure was de f ined by Y o s hida e t
a L . ( 1 9 7 3 ) as a bat ch culture cont i n uous ly f e d w i t h a
growth- limit ing s ubs trate . There is no c o n t inuous r emova l
of cu lture s o t here is a c ons t a n t l y increas i n g v o l ume .
Thus , it is dis t in guishe d from t he cons t an t volume
cont inuous culture chemos t at .
P irt ( 1 9 7 4 ) deve loped mat hemat ical expre s s io n s f or t he
cont inous fed-batch s ys t em , whi le Dunn and Mor ( 1 9 7 5 )
deve loped P irt ' s work furthe r . Bot h o f t hese a u t h o r s us ed
Monod ' s equat ion as the bas is of t he ir t heoret ic a l s t ud ies .
A comprehens ive review of fed -batch t echn iques has r e cent ly
been pub l i s hed ( Yamane and Shimi z u , 1 9 8 4 ) , but no men t ion is
made of t he ir app l icat ion to c it r i c ac i d product i o n .
C ont inuous fed - ba t ch sys t ems are u s e d indus t r i a l ly for
pen i c i l l in product ion and was te treatme n t ( P irt , 1 9 7 4 ) ,
bakers ye as t product ion ( Woehrer and Roehr , 1 9 8 1 ) a n d t he
4 0
produc t i o n of s ome amino acids and extracellu lar e n z ymes
( Y amane and S himi z u , 1 9 8 4 ) . K r i s t i a n s e n and C har l e y ( 1 9 8 1 )
s t ated that c i t r i c ac id was produced c omme r c i a l ly u s i n g f e d
batc h ferme n t at ion . However , t hey gave n o det a i l s o f t he
proce s s and failed to provide any pat e n t or l i t erat ure
reference .
I n t he con t inuous fed-bat c h ferme n t at ion , a qua s i
s t e ady s t ate is obt ained when t he growth- limit i n g s ubs trate
is exhausted from t he bat c h fermentat ion broth and growt h
l imit in g -amounts are t hen added cont i n uous ly . The f e d - ba t ch
quas i -s t e ady s t ate and chemo s t a t s t e ady s t a t e are
comparab le , in that in both cas e s t he growt h rate e quals t he
dilut ion rate . However , the d i f f e re n ce i s t hat in t he
chemos t a t , d i lut ion rate ( an d hen ce , growt h r a t e ) is
cons t ant as a cons equence of t he con s t an t volume , where as
with t he fed - bat ch s ys t em , the di lut i o n r a t e decre a s e s w i t h
t ime d u e to t he increase i n volume . The d i l ut ion r at e i n
fed - bat c h fermentation can be main t a i ned c o n s t ant f or s ome
t ime by increas ing t he f low rate i n proport ion t o t he
increase in volume ( P irt , 1 9 7 4 ; Dunn and Mor , 1 9 7 5 ) . Thus ,
the growt h rate can be con t r o l led in f ed -b a t ch
ferment at ions .
I ndus t r ially , the use of t he f e d - b a t c h ferme n t at i o n
al lows t he appl icat ion of data accumu l a t e d from c hemo s t at
s tudies , and reduces the " down t ime " o f expens ive
equipment when compared with the bat c h proces s .
bat c h s ys tem is techni cal ly eas ier t o operate
cap i t al
The f e d
t han t he
chemostat , because there i s no requireme n t f or exa c t vo lume
control and there fore there are no ove r f low port b lo c k a ge

4 1
prob lems , which i s part i cularly important when us i n g
f i lamentous fungi .
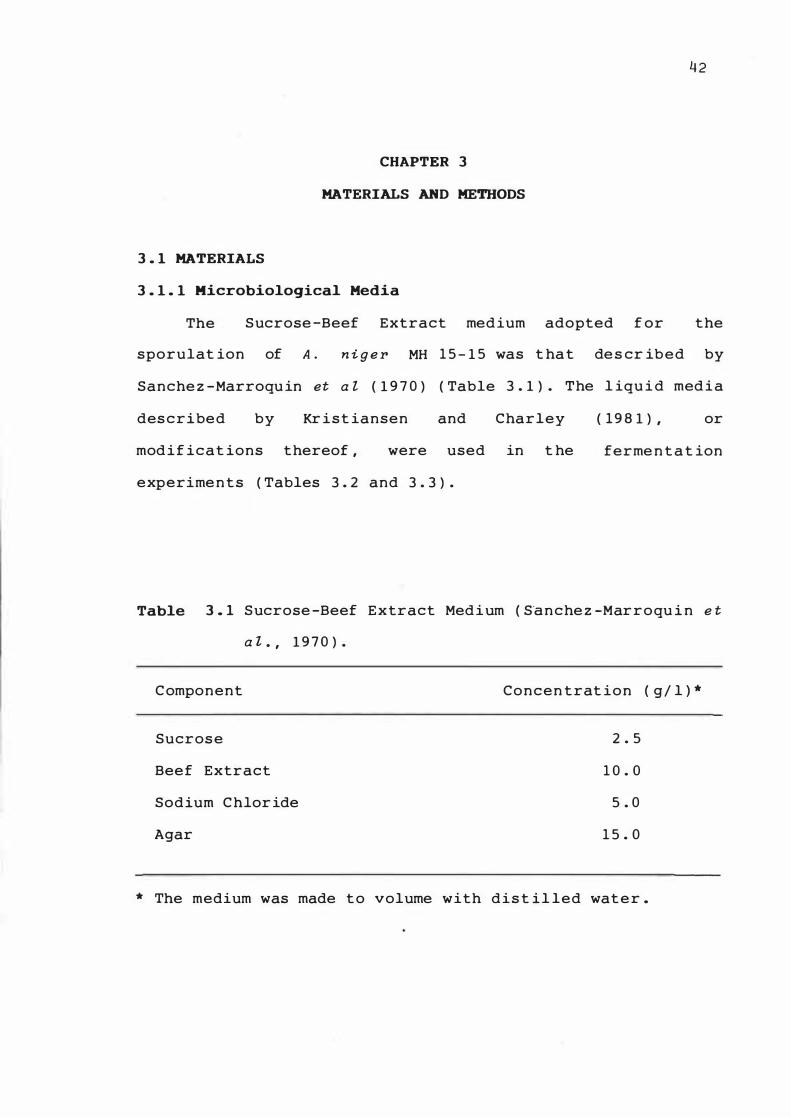
3 . 1 MATERIALS
CHAPTER 3
MATERIALS AND METHODS
3 . 1 . 1 Microbiological Media
4 2
The Sucrose -Beef Extract med ium adopted f or the
sporulat ion of A . n i g e r MH 1 5 - 1 5 was t ha t de s cr ib e d by
Sanche z -Marroqu in et a Z ( 1 9 7 0 ) ( Table 3 . 1 ) . The l iqu i d med i a
des c r i bed by Kr i s t iansen and Charley ( 1 9 8 1 ) , or
mod i f i c a t ions thereof , were used in t he
experime n t s ( Tables 3 . 2 and 3 . 3 ) .
ferme n t a t ion
Table 3 . 1 Sucrose -Beef E x tract Med i um ( S� n c he z -Mar r o qu i n e t
a L , 1 9 7 0 ) .
C omponent
Sucros e
Beef Extract
Sodium C hlor ide
Agar
Concen t rat ion ( g / l ) *
2 . 5
1 0 . 0
5 . 0
1 5 . 0
* The medium was made t o volume with d i s t i l led wat e r .
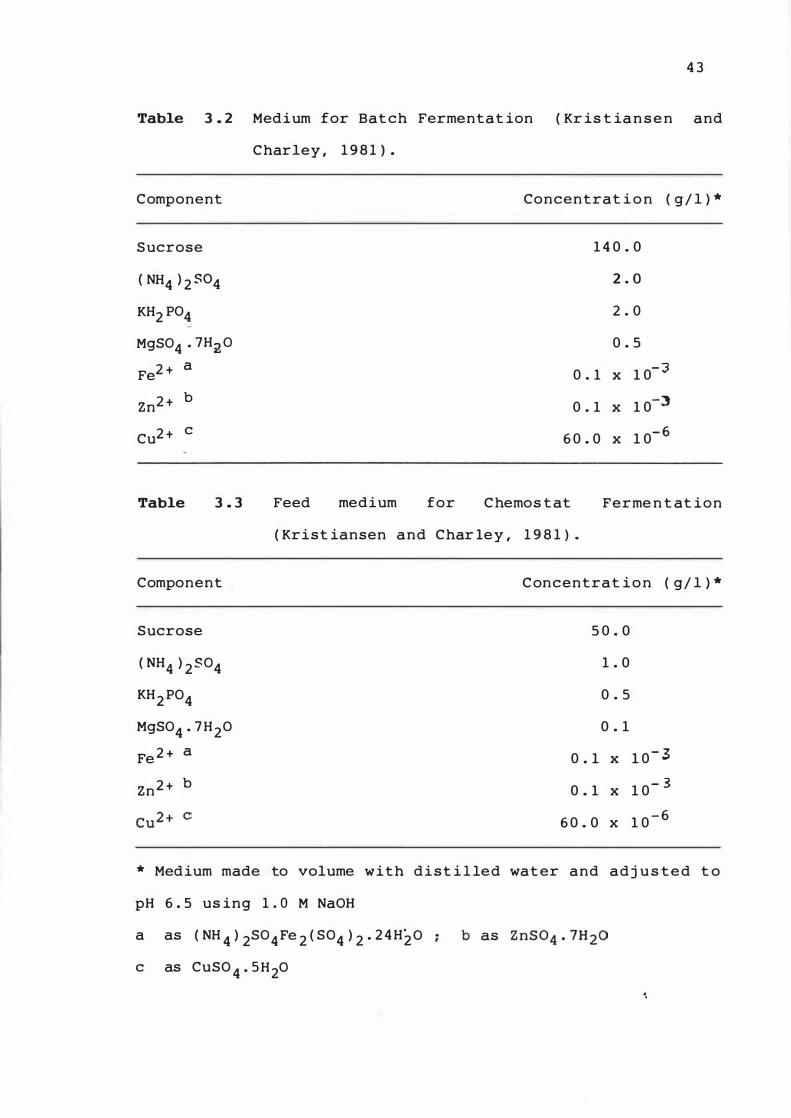
4 3
Table 3 . 2 Medium for Batch Fermentat ion ( Kr is t ia n s e n and
Component
Sucrose
( NH4 ) 2 5°4
KH2 P04
MgS04 · 7H20
Fe2 + a
Zn2 + b
Cu2 + c
Table 3 . 3
Charley , 1 9 8 1 ) .
Feed medium for
Concentrat i o n ( g/ l ) *
1 4 0 . 0
2 . 0
2 . 0
0 . 5
0 . 1 x 1 0- J
0 . 1 x 1 0-�
6 0 . 0 x 1 0- 6
Chemos tat Ferme n t at ion
( Krist iansen and Char 1ey , 1 9 8 1 ) .
Component
Sucrose
( NH4 ) 2 S04
KH2 P04
MgS04 · 7H20
Fe 2 + a
Zn2 + b
Concentrat i o n ( g/ l ) *
5 0 . 0
1 . 0
0 . 5
0 . 1
0 . 1 x 1 0- 3
0 . 1 x 1 0- 3
6 0 . 0 x 1 0 - 6
* Medium made to volume with dist i l led water and adj u s ted t o
pH 6 . 5 us ing 1 . 0 M NaOH
a as ( NH 4 ) 2S04Fe 2 ( S04 ) 2 . 24H20
c as CuS0 4 . SH20
'.
4 4
3 . 1 . 2 Gases
The following gases were suppl ied by New Zea land
I ndus t r ia l Gases L imited , Palmerston North , New Zealand :
oxygen- free nitrogen ; dry air ; carbon d i ox ide ; 4 % carbon
d iox ide in oxygen-free nitrogen ; 1 6 % oxygen in oxygen- free
n itrogen .
. 3 . 1 . � Chemicals
Chemicals used for fermentat ion and analyt i c a l wor k
were all o f analyt ical grade . The ir s ources were :
-BDH Chemicals Ltd ( Palmers t on North , New Zealand ) .
ammonium ferrous sulphate ; ammonium sulphate ; buffer
tablets , pH 4 . 0 and 7 . 0 ; c it r ic ac id ; coomass ie b r i l l iant
b lue G2 5 0 ; copper sulphate ; ethylene diaminetetracet ic ac i d ;
fructose ; hydraz ine s u lphate ; hydrochloric a c id ; magne s ium
chlor ide ; magnes ium sulphate ; orthophosphoric ac id ; d i
potass ium hydrogen phosphate ; potas s ium d ihydrogen
phosphate ; potass ium cyan ide ; s odium molybdate ; s u lphur ic
acid ; tris ( hydroxymethyl ) methylamine .
-Aj ax Chemicals ( Sydney , Australia ) .
acetonitr ile ( HPLC grade ) , methanol ( HPLC grade ) .
- S i grna Chemical Co . , ( S t Louis , Missour i , U . S . A . ) .
adenos ine 5-monophosphoric acid ( AMP , mus cle adenyl i c
ac id ) ; adenos ine 5 -triphosphoric acid ( AT P , s od ium salt ) ;
bee f extract ; bovine serum album in ; B-n icot inamide aden ine
dinucleot ide ( NAD ) ; B - n icot inamide ade n i ne dinuc leot ide ,
reduced form ( NADH , disodium salt ) ;
dinucleot ide phosphate ( NADP ,
B-n icot inam ide ade nine
monosodium s a l t ) ; B -
4 5
nicot inamide adenine d inucleot ide phosphat e , reduc e d form
( NADPH , t e trasodium salt ) ; c is -acon it ic acid ; c o- carboxylase
( aneurine pyrophosphate : thiamine pyrophos phate c h l or ide ) ;
co-enzyme A ( sodium s alt ) ; DL- isocitric ac id ( t r is odium
salt ) ; L-cysteine hydrochloride ; g lucos e ; mal ic
dehydrogenase ; pyruvic acid ( s odium salt ) ; s ucrose .
-Swift Consol idated ( NZ ) Ltd , ( We l l ingt on , New Z e a l a nd ) .
Dow-Corn ing ant ifoam A . F . emuls ion ( Food Grade ) .
3 . 1 . 4 organi sm
The organism used was A s p e rg i l l u s n i g e r MH 1 5 - 1 5 ,
isolated by Hossain e t a l . " ( 1 9 8 3 ) as a mut ant s t r a i n of A .
n i g e r IMI 4 1 8 74 . Cultures of A . n i g e r MH 1 5 - 1 5 were grown on
s lopes o f Sucrose -Beef Extract Agar ( Table 3 . 1 ) , where they
sporulated profus e ly .
Spores of A . n i g er MH 1 5 - 1 5 were pre s e rved u s ing t he
techn ique described by Hossain ( 1 9 8 3 ) and Hos s a i n e t a l .
( 1 98 3 ) , which was as follows :
a ) The organism was grown on s lopes o f Sucrose -Beef
Extract Agar for 8 - 9 days .
b ) The spores were harvested in s terile d i s t i l le d water
and the spore suspens ion was shaken f or one hour to
break the spore cha ins and clumps . The s u s pens i on
was then f iltered through sterile glas s wool to
remove any remaining clumps , and t he conce n t rat ion
was adjusted to 1 - 2 x 1 08 spores /ml us i n g d is t illed
water .
c ) The spore suspens ion ( 2 ml ) was d is pensed
4 6
asept ically into 3 ml o f nutrient broth , containing
30% ( v/v ) glycerol , contained in a 10 m l c apac ity
s crew cap bot t le ( 1 5 such bott les
from a s ingle s lope culture ) .
were prepared
The inoculated
bot t les were then stored at - 2 0oC . When s p ores were
requ ired f or subcultur ing , a loopful from a t hawed
bot t le was trans ferred to a s lope of Sucrose-Beef
Ext ract Agar , and incubated at 3 0 � for 6 - 8 days . A
further subculture from this init ial s lope , onto a
fresh agar s lope , was carried out to obt a i n improved
sporulat ion . This second s lope was used f or up to 3
months as the stock s lope culture f or inoculum
preparat ion .
3 . 2 MEDIA STERILISATION
All microbiological media were ster i l ised by
autoclav ing at 12 1 0C for 15 minutes . All fermentat ion med ia
were s ter i l ised at 1 2 1 0C for 2 0 minutes .
3 . 3 CLEANING OF GLASSWARE
All g las sware was washed in hot Pyroneg ( R ) s olut ion ,
rinsed in tap water , then in dist i lled water , and hot a ir
dried . Glassware used in enzyme as s ays , trace met a l a s s ays ,
and storage of HPLC solvents was treated with chromic ac id
after the detergent wash , then r insed thoroughly with
de ionised water . It was then treated with 2 . 0 M NaOH
solut ion , and again thoroughly rinsed with de ion ised wate r .
Finally , it was treated with a 5 0 % ( v/v ) s o lut ion o f
hydrochlor ic acid in de ionised water , and thoroughly r insed
in Milli-Q de ionised water .
3 . 4 ANALYTICAL METHODS
3 . 4 . 1 pH Measurement
4 7
p H measurements were performed rout inely us i n g a
Metrohrn p H meter E S 2 0 ( Metrohm A . G . , Heri s au , Swit zer l and ) .
3 . 4 . 2 De terminat ion of Myce1 ia1 Dry We ight
A spe c i f ic volume of fermenter cult ure ( about 2 5 ml ) or
the ent ire contents of a shake - f lask culture ( about 1 0 0 ml )
were f i ltered through a Buchner funne l , us ing a pre -we ighed
Whatman No . 5 4 filter paper which had been dr ied at 1 0 S ct +
2 � and s t ored in a des iccat or . The fungal mas s was was hed
three t imes with de ion ised water ( about 4 0 0 ml ) and dried
to cons t ant we ight at 1 0 So C + 2 0C .
3 . 4 . 3 Ana1ys is of Sugars
Sugar analys is was carried out by H igh Perfo rmance
L iquid C hromatography ( HPLC ) , us ing a Waters As s oc iates
Mode l ALC /GPC 244 l iquid chromatograph with a Mode l 6 0 0 0 A
solven t de l ivery system and a U 6 K septumle s s i n j ec t or
( Waters As soc iates , I nc . , Milford , Mas sachusetts , U . S . A . ) .
A u - Bondapak family Carbohydrate Analys is Col umn ( 3 . 9
mm I D x 3 0 0 mm , part number 84 3 0 8 , Waters As sociat e s ) was
used for the analys is .
The detector was a Model 4 0 1 Different ial Refract ometer
( Waters As soc iates ) . The response was recorded on a CR600
twin-pen , f lat -bed chart recorder ( J . J . L loyd I n s tr uments
Ltd , Southhampton , England ) . ,
The analyses were conducted at ambient temperat ure . The
solvent system was a mixture of aceton itr i le and water
( rat io 8 0 : 2 0 ) ( Hossain e t a Z . ,
4 8
1 9 84 ) . The s o lven t f low rate
was 1 . 5 t o 2 . 0 ml /min , depending on the resolut ion required .
Between 2 5 and 100 ul of sample was inj ected i n t o t he
chromatograph , the exact amount depending on t he s ugar
concentrat ion in the sample .
The quant i t at ion of sugars was performed by mea s uring
t he peak he ight of t he sugar in t he samp le , and comparing
this with a standard curve of peak he ight . Standard curves
were l inear up to 2 0 g/l concentrat ion in a 5 0 u l i n j ected
sample .
3 . 4 . 4 Determinat ion of C itric Ac id
C it r i c acid was determined by an HPLC met ho d . The
equipment used was as described in Sect ion 3 . 4 . 3 . , w i t h t he
except ion of the column . For this analys is , a u -Bondap ak C 18
reverse -phase column ( 4 . 0 mm ID x 2 5 0 mm , B io-s i l ODS - 1 0 ,
B io-Rad Laboratories , R ichmond , Californ i a , U . S . A . ) was
used . The solvent system was 2 % ( w/v ) pot ass ium d i hydrogen
orthophosphate prepared us ing Mil l i-Q de ion ised wate r and
adj us ted to pH 2 . 4 5 with ort hophosphor ic acid ( Coppo l a e t
a Z . , 1 9 7 8 ) . The solvent f low rate was 1 . 5 m l /m i n . S amples
of between 25 and 1 0 0 ul were i n j ected i n t o t he
chromat ograph . The amount of c itric acid in t he s amp l e s was
calculated by measuring the peak he i ght of ac i d w i t h
reference to peak he ight o f the standard curve . The s t andard
curve was l inear up to 3 0 g / l concentrat ion for a 5 0 u l
inj ected s amp le .
Thorough cleaning of this column was nec e s s ary
following the use of the phosphate -based solven t . !h i s was
4 9
achieved us ing freshly degas sed Mil l i-Q de ion ised wat e r at a
flow rate of 1 . 5 ml /min for 1 hour . The f low rate was then
reduced to 0 . 1 ml /min overn ight . This was the n fol l owed with
a methanol /water mixture ( rat io 5 0 : 5 0 ) and pure met han o l
at flow rates o f 0 . 5 ml /min for 3 0 minutes and 1 . 0 ml /m i n
for 20 minutes , respective ly .
3 . 4 . 5 De terminat ion of Total Nitrogen
This was perf ormed us ing the micro- k j e ldahl
( N . Z . S . 2 2 4 6 , 1 9 6 9 ) .
met hod
A known volume of the fermentat ion l i quor , or a known
we ight of oven-dr ied myce l ia ( 2 0 to 4 0 mg N ) was
transferred t o a Kj e ldahl digest ion f las k . S odium s ulpha t e
( 2 . 0 g ) , mercuric sulphate solut ion ( 5 ml ; o f 1 5 0 g red
mercur ic ox ide dissolved in a s o lut ion of 1 8 0 ml
concentrated sulphur ic acid plus 1 3 2 0 ml wat e r ) and
concentrated sulphur ic acid ( 2 0 ml ) were added to t he
Kj e ldahl f lasks . The contents of the f lasks were brought t o
the boi l and heated unt il the solut ion was clear . Heat i n g
was con t i nued for a further 1 hour . The cooled con t e n t s were
trans ferred quant itat ive ly to a 1 0 0 ml vol umetric f las k .
Al iquots ( 1 0 ml ) of the digested s amp le s were u s e d t o
determine t he ammon i a concentrat ion i n the s ampl es . This
was done by steam d istillat ion in a Markham s t i l l apparatus
following the add it ion of aqueous sod ium hypophos p h i t e ( 5
ml ; 1 5 % ( w/v ) ) and aqueous sodium hydroxide ( 1 5 m l ; 6 0 %
( w/v ) ) . The dis t i l late con�aining ammon ia was c o l le cted i n
aqueous bor ic acid solut ion ( 10 ml ; 2 % ( w/v ) ) conta i n in g 2
drops of screened methyl red indicator ( 2 g met hy l red and
5 0
1 g methylene blue dissolved in 1 0 0 0 ml 9 6 % ( v /v ) e t hanol ) ,
and t it rated with 0 . 0 0 2 M Hel t o grey- green end point . A t
this concentrat ion , 1 m l ac id = 0 . 0 2 8 g n itroge n . A l l
determinat ions were carried out in dup licate .
3 . 4 . 6 Determinat ion of Inorgan ic Phosphate
Thi s was performed by measuring the blue c olour
intens ity formed by the reduct ion of molybdophosphori c ac id
to molybdenum b lue , of uncertain compos i t ion , in t he
presence of hydraz ine sulphate ( Voge l ,
of the blue co lour is proport ional
1 9 6 1 ) . The i nt e n s i t y
t o the p hosphate
concentrat ion in the s ample . S ample and s t andard s o lut ions
containing up to 0 . 1 mg of phosphorous as the ortho��.Qte. in
25 ml , were mixed with molybdate s olut ion ( 5 ml ; 1 2 . 5 g
sodium molybdate in 5 . 0 M sulphur ic acid , and d i lu t e d t o
500 ml with 5 . 0 M sulphur ic ac id ) , and hydraz ine s ulphate ( 2
ml ; 1 . 5 g hydraz ine sulphate in 1 . 0 l itre M i l l i-Q de ion i s ed
water ) , diluted to the mark with de ion ised water in a 5 0 m l
volumetr ic f lask , and we ll mixed . The f lasks were t hen
immersed in a bo il ing water bath for 10 m inutes .
removed and cooled rapidly in iced water . When
The y were
c o o l , t he
contents were aga in mixed , and the volume readj us t e d t o 5 0
ml with Milli-Q de ionised water . The abs orbance o f t he
samples was measured at 8 3 0 nm against de ion ised wate r . T he
standard curve was linear in the range 0 t o 4 . 0 mg/ l
phosphorous .
5 1
3 . 4 . 7 Determination of Sulphate
This was performed by the Chemistry Department , Mas sey
Un ivers ity , Palmers ton North , New Zealand , us ing the met hod
of Michalk and Manz ( 1 9 80 ) . The met hod is based on the
precipitat ion of su lphate by the addit ion of barium c h l or ide
in exces s , and determinat ion of unconsumed barium i on s in
s olut ion by atomic absorpt ion spectrophotome t ry .
An . .Q m o u n t of 0 . 5 to 1 ml of s ample or s ta ndard
solut ion was mixed with uranyl ace t at e s olut ion ( 2ml ; 8 g
uranyl acetate i n 1 . 0 l itre o f Mill i-Q de ion ised wat er ) t o
remove prote in and phosphate . The mixture was cent r i fuged at
5 , 0 0 0 x g for 2 0 m inutes . A 1 ml o mou� t of s upernatant
l iquid was then mixed with barium chlor ide s olut ion ( 1 ml ;
1 2 0 mg in 1 . 0 l itres of Milli-Q de ion ised water ) . After 1 6
t o 2 4 hours , the mixture was cent r ifuge d , and 1 ml of
s upernat ant l iquid was mixed with cae s ium c hloride s o lut ion
( 9 ml ; 2 0 0 mg in 1 . 0 l itres Mil l i-Q de ion i s ed wat e r ) . The
barium ion concentration was t hen determined by at omic
abs orpt ion spectrophotometry at 5 5 3 . 4 nm us ing a n it rous
ox ide -acetylene f lame .
3 . 4 . 8 Determinat ion of Mg 2 + and Trace Metals
Determinat ions of Cu 2 +, Fe 2 +, Zn 2 +, Mn 2 + and Mg 2 + were
performed by the New Zealand Dairy Research I n s t itute
( Palmerston North , New Zealand ) . 2 + For C u , 2 + 2 + Fe , Z n and
M 2 + n , no pretreatment of samples was neces s ary . For Mg 2 +,
0 . 0 5 g of l iquid sample was we ighed i n t o a 1 0 0 ml vol umetric
f lask , to which 4 0 ml of Mil l i-Q de ionised water was added .
To this was added 2 ml of a 5% Sr 2 + ( w/v ) s o lut ion , and t he
5 2
sample was diluted t o the mark us ing Milli-Q de ion i s e d water
and we l l mixed . All f ive met a l ions were measured u s ing a
GBC 9 0 3 Atomic Absorpt ion Spectrophotometer ( GBC , Dandenong ,
V ictoria , Aus tra l ia ) . The following wavelengths wer e used :
2 + C u at 3 2 4 . 8 nm i 2 + 2 + 2 + Fe at 24 8 . 3 nm i Z n a t 2 1 3 . 9 nm ; Mn
at 2 79 . 5 nm i Ml·+ at 2 8 5 . 2 nm .
3 . 5 CULTURE CONDI TIONS
3 . 5 . 1 Preparat ion of Spore Suspens ion
A spore s uspension was prepared in s teri le d i s t i l led
water from the spores scraped from 1 0 -day old culture grown
on s lopes of Sucrose -Beef Extract Agar as des cr ibed in
Sect ion 3 . 1 . 4 .
3 . 5 . 2 Shake- Flask Culture
Experiments were conducted in 2 5 0 ml . Erlenmeyer f lasks
containing 1 0 0 ml of medium . The f lasks were tre a t e d with
S igmacote ( S igma Chemical Co . , St . Louis , M i s s o ur i ,
U . S . A . ) which coated the inner surface of t he f lasks w i t h a
microscop ically t hin f i lm of s i l icone , thus prevent i n g wal l
growth of myce lium . After coat ing , the f l as ks were dr ied i n
hot a ir and then was hed i n Mil l i-Q . de ionised water a n d hot -
air dried bef ore use .
Spores ( approx imately 1 x 10⁸ ) from a s t andard spore
suspens ion ( Section 3 . 1 . 4 ) were used t o inoculate 1 0 0 ml of
fermentat ion medium which w�s then incubated at 3 00 C on an
Environ-Shaker Mode l 3 5 9 7 at an operat ing speed of 1 8 0 rpm .
For sampl ing , the ent ire contents of a f lask were t ak e n .
5 3
3 . 5 . 3 Batch Fermenter Culture
The fermentat ion apparatus used was cons tructe d in the
B iotechnology Department , Massey Un ivers ity . F i g ure 3 . 1
shows a schemat ic d iagram of the fermenter ves s e l , while
Figure 3 . 2 shows a schemat ic diagram o f t he ferment e r unit
and its anci llary equipment . The fermenter ves s e l used was
a seven l itre capacity glas s j ar ( New Brunswick S c i en t i f ic
Co . , New Brunswick , New Jersey , U . S . A . ) , with a working
volume of f ive l itres , and was provided with a s t ainless
steel head containing ports for the insert ion of probes and
the other facilit ies required . The d imen s ions of the
fermenter vessel and impe l lers are s hown i n Figure 3 . 1 . The
fermenter vessel was provided with f our baf f le s each of 2 cm
width , which extended from the head t o within 5 cm o f the
ves s e l base .
Agitat ion was provided by an assembl y of t hree , 4 -
bladed impe l lers mounted vert ically at i ntervals o f 7 , 1 8
and 2 8 c m above the bas e of the ves s e l on the central
impe l ler s ha ft . This was driven by a D . C . 1 / 4 H . P . var iable
speed motor from the t op of the fermenter ves s e l . Vari ab le
speed was obtained us ing an e lectron ic controller . Impe l ler
speeds from 0 to 1 0 0 0 rpm were attainable .
The fermenter temperature was maint a ined at 3 0 + 0 . 2 °c
by means of hot or cold water flowing through hol low baf f les
and was controlled by an electronic t he rmos t at . The
temperature was cont inuous �y recorded u s ing a Honeywe l l
Varsaprint Multipoint chart recorder ( Amiens , France ) .
Air was suppl ied t o the fermenter ves s e l f rom t he
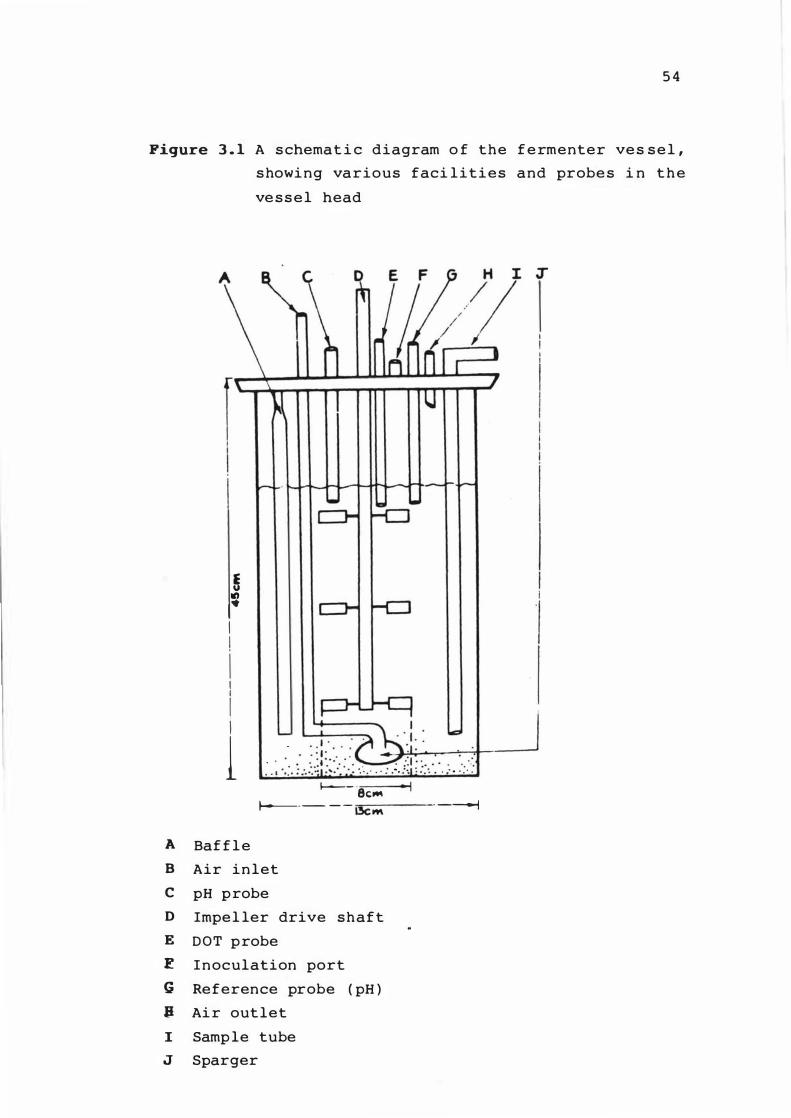
5 4
Figure 3 . 1 A s chemat i c diagram o f the f e rmenter ve s s e l ,
s howing various faci l i t i es and probe s i n t h e
ve s s e l head
! Itt I· I I I I I
I i
1
A Baf f l e
.. . . , .::. :':))��:':':.:; .: . . . . 7. . ..J .• .'..:.L{I.;..�: .... ::..,....:--. .. -' .. ':-:.: . ....., .. ::�� 1---- 'Sc", • I
1---. - - - i3C", . _--j
B Air in let
C pH probe
D Impe l ler drive shaft
E DOT probe
� I n oculation port
G Reference probe ( pH )
11 Ai r out let
I Sample tube
J Sparger
5 5
Univers ity compressed air l ine , through a c leaner /manos tat
as sembly ( Manost at SPNZ 1 0 2MOA , Mac Ewans Machinery Ltd ,
Palmers t on North , New Zealand ) to a f lows tat ( type MN , B . R .
Hamersham Ltd , Lower Hutt , New Zealand ) t o regulate t he f low
t o the rotameters . The rotameter ( Ser ies 1 1 0 0 , t ube H-G-
3 0 0 , Fisher Cont rols Ltd , Croyden , England ) control led the
airflow to the fermenter over the r ange 0 . 6 t o 5 . 0
l itre /min . The measured air was pas sed t hrough a s t e r i le
glass wool -packed f i lter , then a ster i l e m i l l ipore f i lter
( 0 . 2 2 urn, Mill ipore Corporat ion , Bedford , Mas s a c husetts ,
U . S . A . ) before entering the culture ves s e l through a 4 cm
s tainless s teel s intered met al plate .
Exhaust air was vented through a water cooled c ondenser
t o prevent the 105 5 of fermentat ion l iquid by evaporat ion .
The condenser was connected to a water t rap , to ret ain any
small amounts of water vapour carried past the c ondenser .
From the water trap , the gas pas sed through a second s t er i le
mill ipore f i lter . The f i lter was connec ted to a d i s t i l le d
water lute , caus ing a back-pressure of 6 0 cm water
( equivalent to 53 mm Hg ) on the fermenter ves sel . T he water
lute was connected to a second water cooled c ondenser ,
t hrough which water from a resevoir he ld at 1 . 0 + 0 . 20 C was
pumped , which was in turn connected to a sec ond water trap .
From this second water trap , the exhau s t a ir e n t e red t he
carbon dioxide gas analyzer ( Type 2 H / 3 4
analyzer , Analyt ical Deve lopment Company ,
thence to an oxygen analyze'r ( Servomex ( R )
5 4 0 A , Sybron Taylor , Taylor I nstrument
Infra- Red gas
H ert s , Eng land ) ,
Oxygen Analyzer
Ltd , S ussex ,
England ) , 5 0 that the carbon dioxide product ion and t he
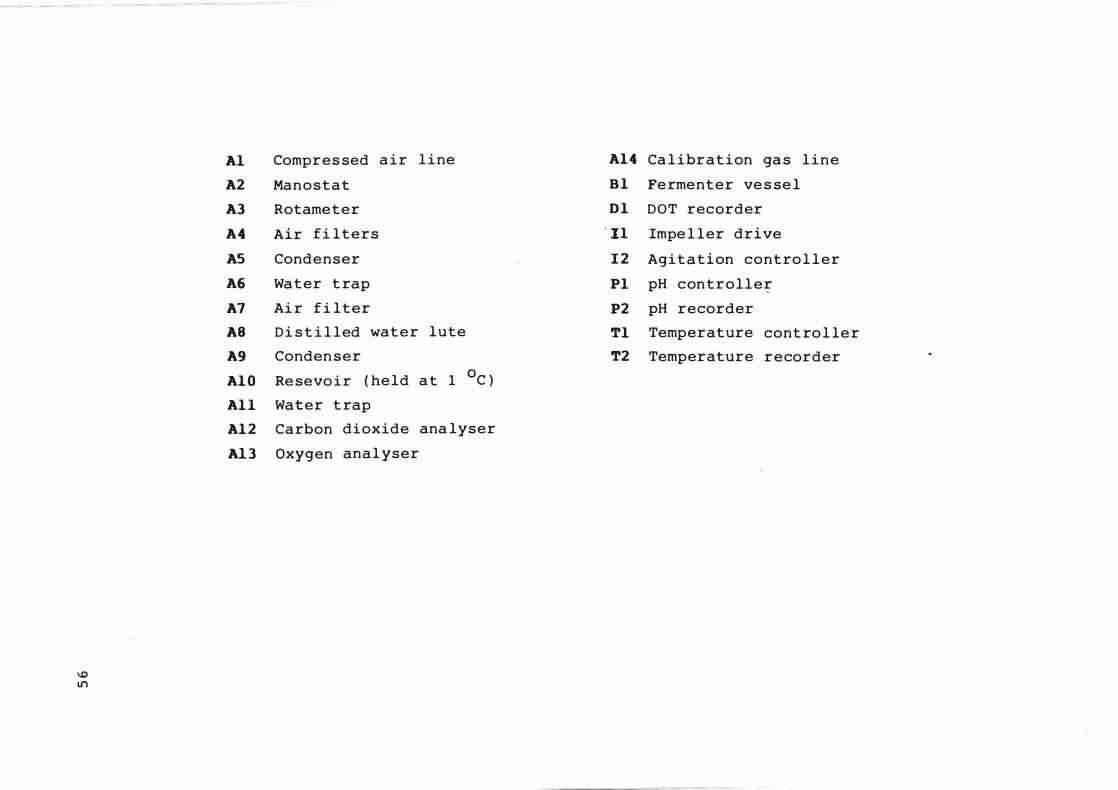
Al Compres sed a i r line Al 4 Ca l i bration ga s line
A2 Manostat B l Fe rmenter ve s se l
A3 Rotameter D l DOT recorder
A4 Air fi lters ° 11 Impe l ler drive
AS Condenser 1 2 Agit a t i on contro l ler
A6 Water t rap PI pH controller
A7 Ai r f i lter P2 pH recorder
A8 Di s t i l led wat e r lute Tl Temperature cont ro l le r
A9 Conden ser T2 Temperature recorder
Al O Re sevo i r ( he ld a t 1 °C )
Al l Water t rap
Al 2 Carbon dioxide ana lyser
A1 3 Oxygen anal yser
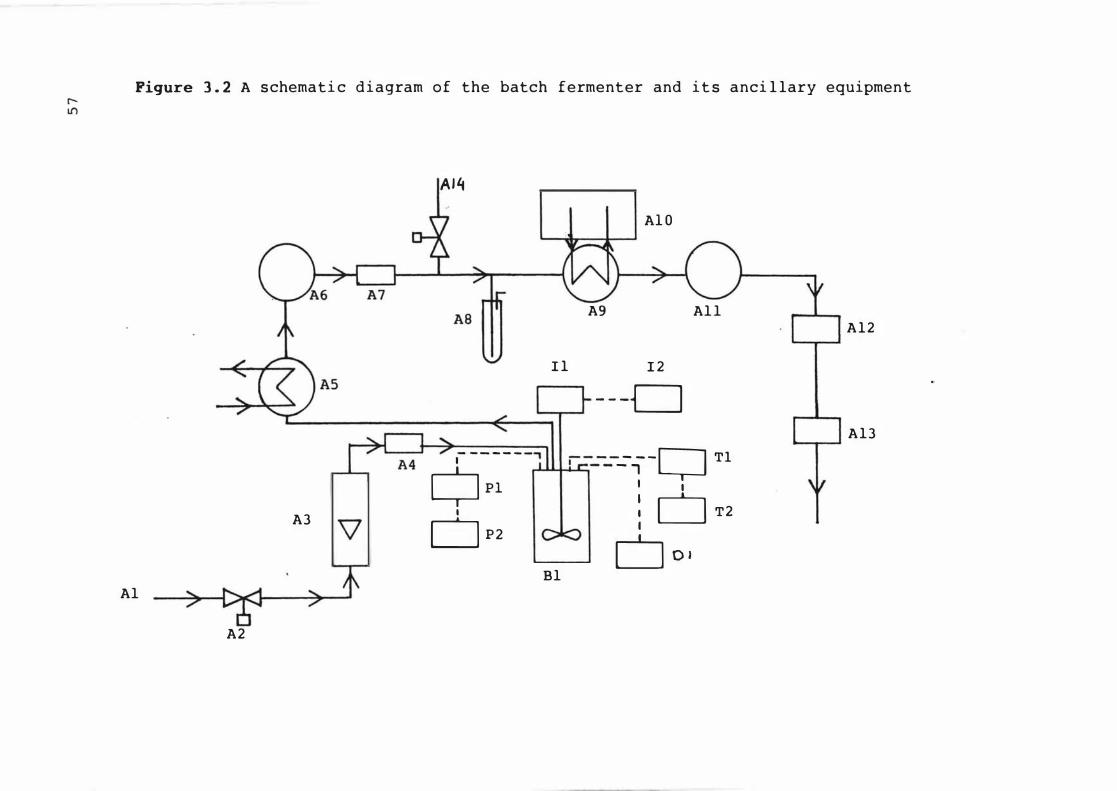
Figure 3 . 2 A s chemati c d i agram o f the batch fermenter and i t s anci l lary equipment
A3
Al
A2
Al 4
AI D
A9 All
11 1 2
- - -CJ
.- - - - - - -r-"u..a.. ...... II--I--,-----_-,- -Q T 1
QPl
: O T2
O P2
6 0 1 Bl
A12
A13
5 8
oxygen uptake rates o f the fermentat ion cou ld be m o n it ored .
Both gas analysers were connected to a twin pen f lat bed
recorder ( J . J . Lloyd Instruments Ltd , Southampt on , E ngland )
and cont inuous ly monit ored ( Figure 3 . 2 ) ( Brooks
1 9 82 ) .
e t a Z . ,
The culture pH was measured us ing an E . I . L 3 3 1 0 7 0 0 3 0
toughened glass e lectrode and an E . I . L 3 3 1 3 2 0 2 1 0
laboratory sealed reference electrode ( E le ctronic
Instrument s Ltd , Richmond , Surrey , England ) connec t e d t o a
Horizon pH Controller Mode l 5 9 9 7 - 20 ( Ecology Co . , Oak Park
Avenue , Chicago , I ll inois , U . S . A . ) . The p H contr o l ler was
connected to the Honeywe l l Varsapr int mu lt ipo i n t chart
recorder .
recorded ,
The culture pH was cont i nuous ly
but not controlled . The pH value o f . each
fermentat ion s ample was measured independent ly to c h e c k t he
accuracy of the fermenter pH meas urement , a n d any
discrepanc ies were corrected .
Dis solved oxygen tens ion was measured us ing a ser ies
900 galvan ic dissolved oxygen probe ( Type M 1 0 1 6 - 5 0 0 2 , New
Brunswick Sc ient ific Co . , I nc . , New Jersey , U . S . A . ) , and
cont inous ly recorded us ing the mul t ipoint chart r e c order .
The probe was cal ibrated i n s i t u , pr ior to the i n o c ulat ion
of the fermenter , by sparging the contents of t he f ermenter
wit h oxygen- free nitrogen gas through t he a ir s uppl y sys t em
to obt ain z ero saturat ion condit ions . The cont e nt s of t he
fermenter vessel were then ,aerated vigorous ly t o g iv e
o f saturat ion . The saturat ion condit ion was he l d f or
1 0 0 %
1 2
hours t o ensure stable dissolved oxyge n probe opera t i on and
t he chart recorder was set at 9 5 % ful l s cale .
5 9
Af t e r t he
complet ion of the fermentat ion , the probe cal ibrat ion was
checked to ensure that no s igni f icant deter iorat ion of t he
probe had occurred dur ing the fermentat ion .
3 . 5 . 4 Cont inuous Fed-Batch Fermentat ion
The e quipment described in Sect ion 3 . 5 . 3 , was used f or
fed-batch fermentat ion , with the s ame anc illary e qu ipment
except t hat pH was not continuous ly monitored . T he feed
med ium was added through port C ( Figure 3 . 1 ) , de l ivered by a
peristalt ic pump ( Mode l 1 6 1 2 , Instrumentat ion S p e c i a l t ies ,
L incoln , Nebras ka , U . S . A . ) . Port G ( Figure 3 . 1 ) was
s toppered in this series of experiments . It was cons idered
that the frequency of s ampl ing , and t he independent measure
of pH was sufficient to monitor adequately the pH of t he
fermentat ion .
3 . 5 . 5 Chemostat Cont inuous Culture
The fermenter used was a Mul t i gen F2 0 0 0 Benc ht op
culture apparatus ( New Brunswick Scient i f ic Co . I nc . , New
Brunswick , New Jersey , U . S . A . ) . Figure 3 . 3 s hows a d i a gr am
of the fermenter head , and Figure 3 . 4 s hows a s c hemat i c
diagram of the fermenter plus i t s anc i llary equipment .
The fermenter ves sel was a 2 l it re capac i t y glass j ar
of working volume 1 . 6 litre , with a p ol ye t hylene
polypropylene head containing holes for t he insert ion o f
probes and other sensors . The vesse l was unba f f led , t he
var ious probes and tubes prov iding suf f ic ient baf f l ing .
Agitat ion was provided by an impe l ler a s s embly of
three , 6 -bladed disc-turbine impellers mounted a t equal ly
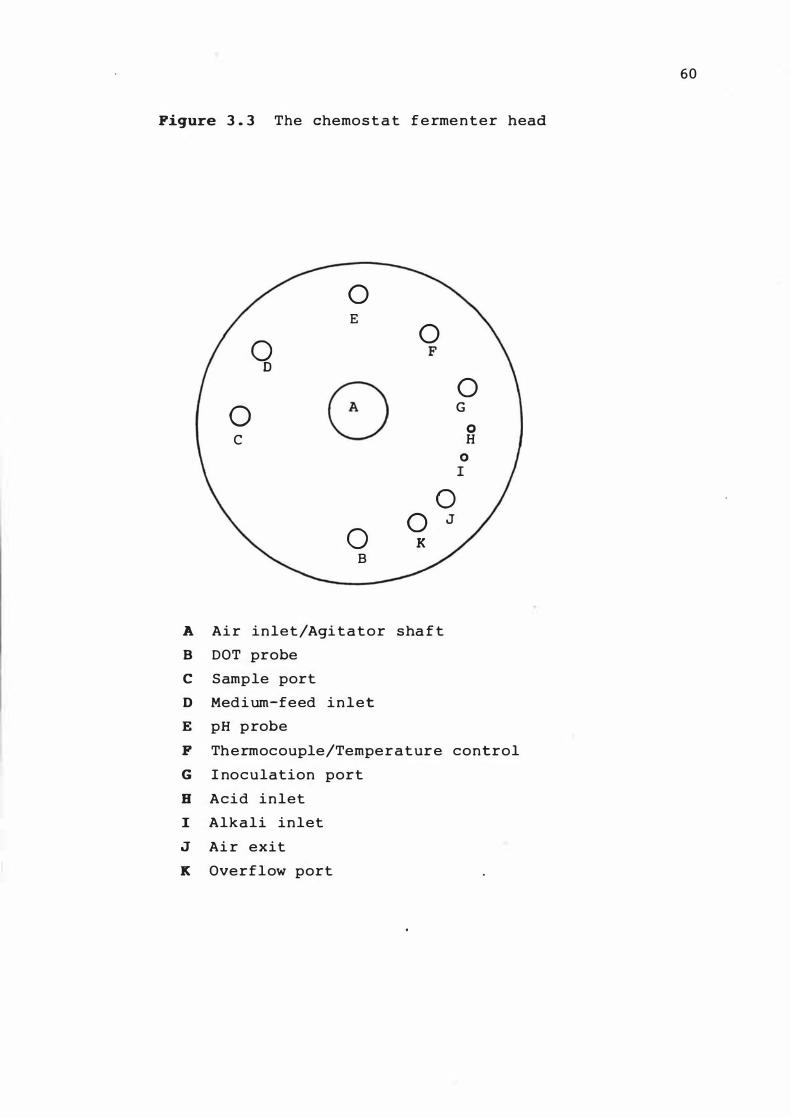
Figure 3 . 3 The chemos t a t f e rme n t e r head
0 E
0 0 F
0
8 0 C
0 0 0 K
B
A Ai r inlet/Agi t a t o r sha f t
B DOT probe
C Sample port
D Medi um-feed inlet
E pH p robe
J
0 G
0 H
0 I
F Thermocouple/Temperature control
G I noculation port
B Acid inlet
I Alkali inlet
J Ai r exit
K Overflow port
60
6 1
spaced intervals from 5 cm above t he vess e l base t o 5 cm
be low t he culture surface . This was dr iven by i n d i rect
magnet ic coupl ing t hrough the base of t he vessel . Agitat ion
speeds from 0 to 1 0 0 0 rpm were attainable .
Temperature control was by means of a heat ing
wrapped around the out s ide o f the fermenter ves se l .
t ape
With
t he thermocouple wire inserted int o a glass tube of water ,
inserted in the fermenter head , the temperat ure o f the
ves se l contents was maint ained at 3 0 + 0 . 5 OC . Tempera t ure
was cont inuous ly monitored and recorded us ing a Honeywe l l
Varsaprint Mult ipoint chart recorder ( Amiens , France ) .
Air supply and exhaus t a ir measurements were performed
as des cr ibed in Sect ion 3 . 5 . 3 , except that the rotamet e r was
a Fisher Contro ls Model E - 3 0 0 , with an operat ing range of
1 0 0 t o 1 2 0 0 ml /min .
Culture pH was mon it ored dur ing t he batch phas e , and
control led , if necess ary , during t he cont inuous c u l t ure
phase us ing a Horiz on pH Control ler Model 5 9 9 7 - 2 0 ( Ec ol ogy
Co . , North Oak Park Avenue , Chicago , I l linois , U . S . A . ) . The
pH probe used was a comb inat ion Or ion Mode l 9 0 - 14 ( Or ion
Research , Cambr idge , Massachusetts , U . S . A . ) . In a l l
exper iments it was des ired t o maint ain the culture at p H 2 . 0
+ 0 . 1 during the cont inuous phase . I n some exper iments t his
value was attained and he ld without any control . However ,
prov i s i on was made for automat ic cont rol v i a add it ion o f 0 . 1
M HC I or 0 . 1 M NaOH by Masterf lex per i s t a l t i c pumps ( C o le
Palmer I nstrument Co . , C hicago , I l l inois , U . S . A . ) . The
culture pH was cont inuous ly recorded us ing t he mul t ipo int
6 2
chart recorder . I ndependent p H meas ureme n t s o f s amp l e s were
carr ied out as des cr ibed i n S e c t ion 3 . 5 . 3 .
A glas s galvan i c d i s s o lved oxygen probe , t yp e M I 0 1 6 -
0 7 7 0 ( New Brunswick Sc ient i f i c Co . I nc . , New Brun s w i c k , New
Jersey , U . S . A . ) was used to meas ure the culture d i s s o lved
oxygen tens ion . The probe was connected t o a mode l DO- 4 0
D i s s o lved Oxygen Analys er ( New Brunswick S c ien t i f ic Co .
I nc . ) which used a 1 0 mv output f or chart r ec order
operat ion . The probe was c a l ibrated i n s i t u , p r ior t o
inocu lat ion o f the fermenter , by t he me thod des c r i bed i n
Sect ion 3 . 5 . 3 . Cult ure DOT was cont inuous l y recorded us i n g
t he mult ipo int chart recorder . The culture D O T was
aut oma t i ca l ly controlled us i n g an e le c t ronic a n a logue
c ircuit , de s igned in s uch a way as to increase ( if b e low t he
DOT s e t -p o int ) or decrease ( i f above t he DOT s e t -p o i nt ) the
agitat ion speed . When at the set -poi nt t he agitat i o n s peed
would rema in cons tant . The sys tem , a modif icat i o n o f t ha t
reported by C lark e t a t . ( 1 9 8 5 ) , allowed c o ntro l o f t he DOT
to + 2 % of s aturat ion and rap idly returned the DOT t o t he
set -p o int fol lowing d i s t urbances ( Figure 3 . 5 ) .
The overf low met hod used was t hat de s c r ibed b y C lark
( 1 9 8 2 ) .
myce l ial
part i a l ly
mixture
occurred .
A weir t ube was found to be u n s at is f a c t o r y f o r
organ isms , because the t ube r ap id l y bec ame
blocked and t he overf low was not a hom o geneous
of fermenter content s . Thus b iomas s b u i ld - up
The sys tem used ( Figure 3 . 6 ) was p e r i od i c a l
evacuat ion ef the overf low resevo ir , t hus w i t hdraw i n g c u l t ure
throu gh a vert ically pos it ioned overf low t ub e . T he vac u um
was app l ied for 1 5 s e c onds every 1 5 minutes . C u l t ure
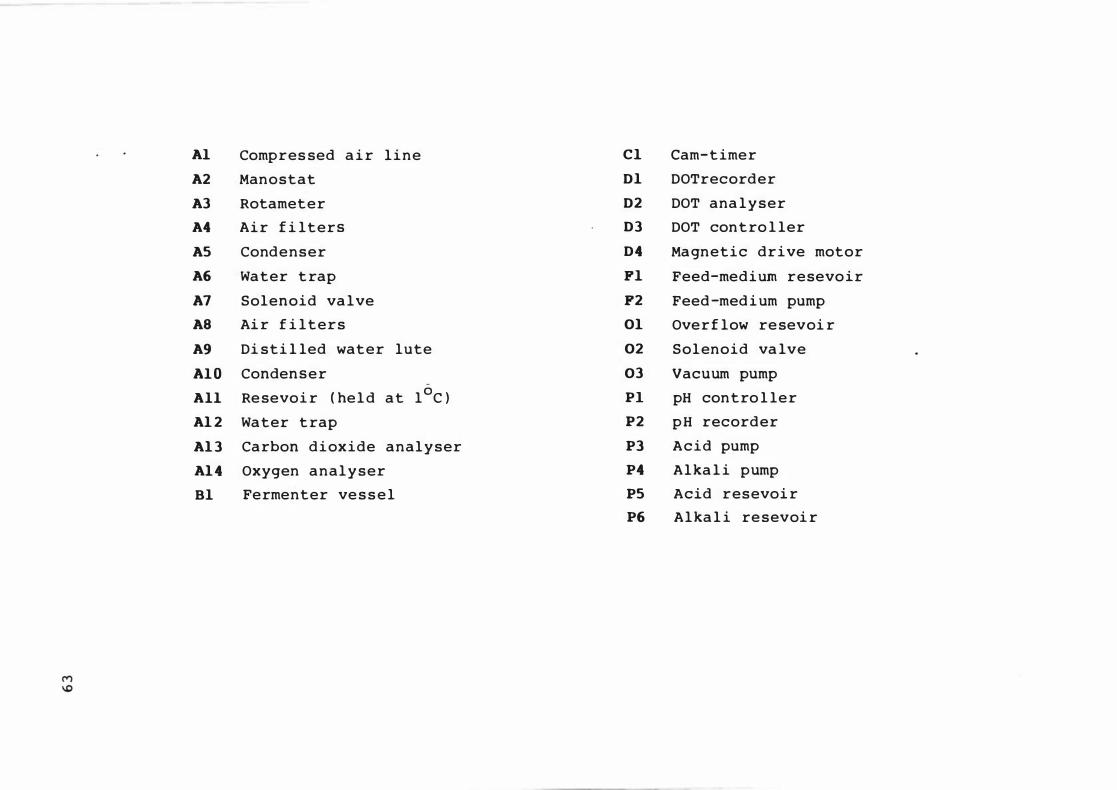
Al
A2
A3
A4
AS
A6
A7
A8
A9
Al O
All
A1 2
A1 3
A1 4
Bl
Compres sed a i r line
Manostat
Rotameter
Ai r f i lters
Condenser
Water t rap
Solenoid va lve
Ai r f i l t e r s
Di sti l led water lute
Condenser
Re sevoi r ( he l d a t lOC )
Water t rap
Carbon d i oxide analyser
Oxygen analyser
Fermenter ve s s e l
Cl
Dl
D2
D3
D4
Fl
F2
01
02
03
PI
P2
P3
P4
PS
P6
Cam-t imer
DOTrecorder
DOT ana lyser
DOT con t ro l ler
Magnetic drive motor
Feed-medium resevo i r
Feed -med i um pump
Ove r f low re sevoi r
Solenoid va lve
Vacuum pump
pH con t ro l le r
p H recorder
Acid pump
Alka l i pump
Acid resevoi r
Alka l i re sevoi r
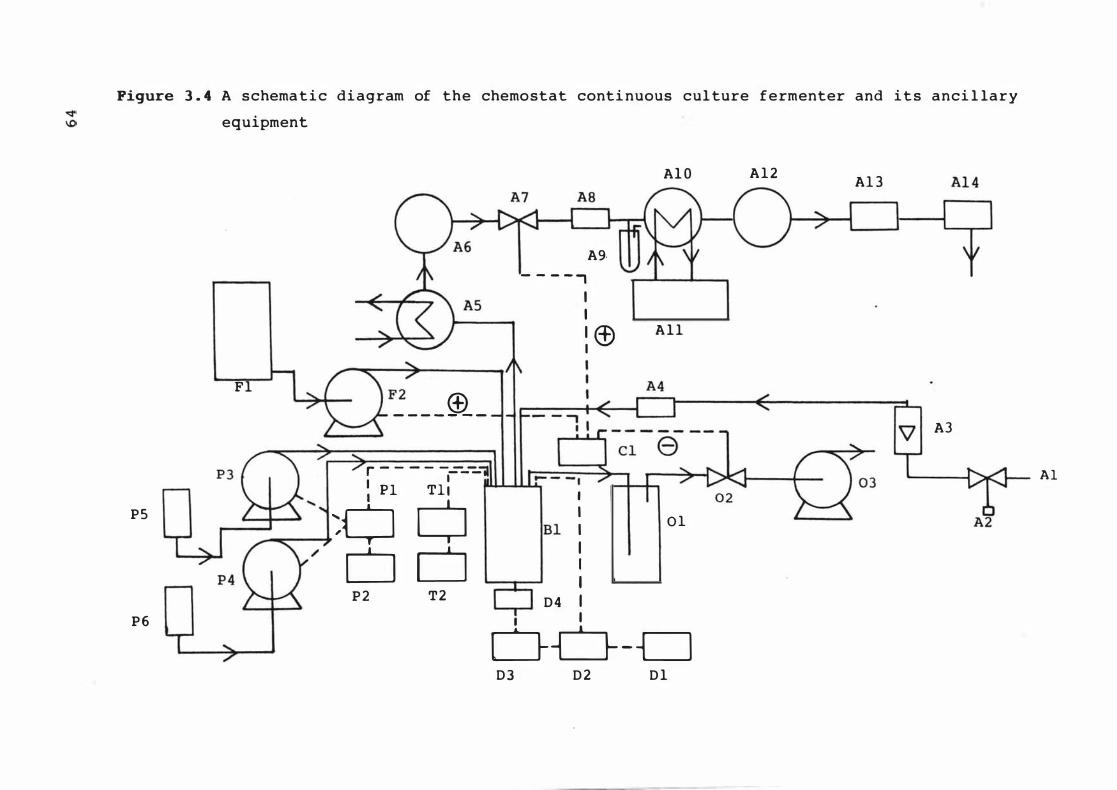
Figure 3 . 4 A schema t i c di agram of the chemostat conti nuous cul ture f e rmenter and i t s anci l lary
equipment
P S
P 6
A9· - - - - ,
Fl
- - - - � -
r - - - - - - -=1 ,- - -
£---+-� ' :0 6
,...... .......... �
Bl :
D D ! P 2 T2 D4 I
I I I (±) I
AI O
A l l
0 1
I I
OD--D D 3 D 2 D l
A 1 2 AI )
A3
A l
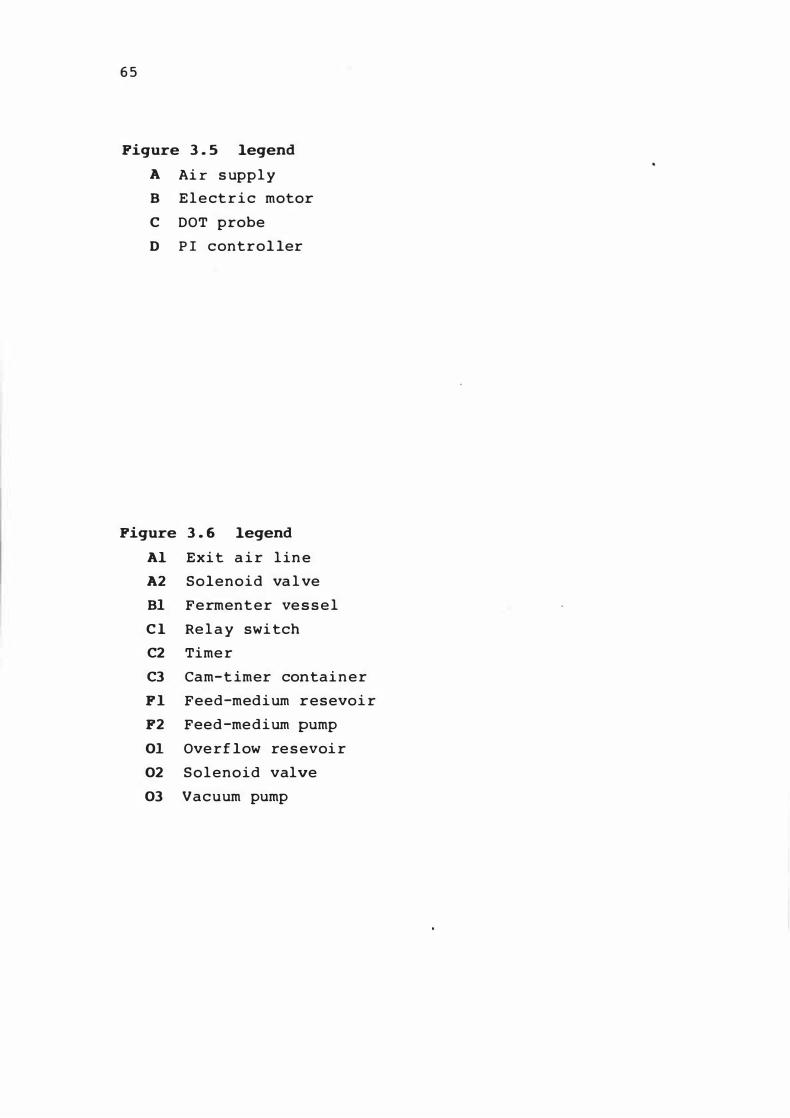
6 5
Figure 3 . 5 legend
A Ai r s uppl y
B E l e ct r i c motor
C DOT probe
D P I control ler
Figure 3 . 6 legend
Al Exi t a i r l in e
A2 Solenoid va l ve
BI Fermenter ve s s e l
C l Re l a y swi tch
C2 Time r
C3 Cam-t imer contai n e r
F I Feed-medium resevoi r
F2 Feed -medium pump
01 Ove rf low re s evoi r
02 Solenoid valve
03 Vacuum pump
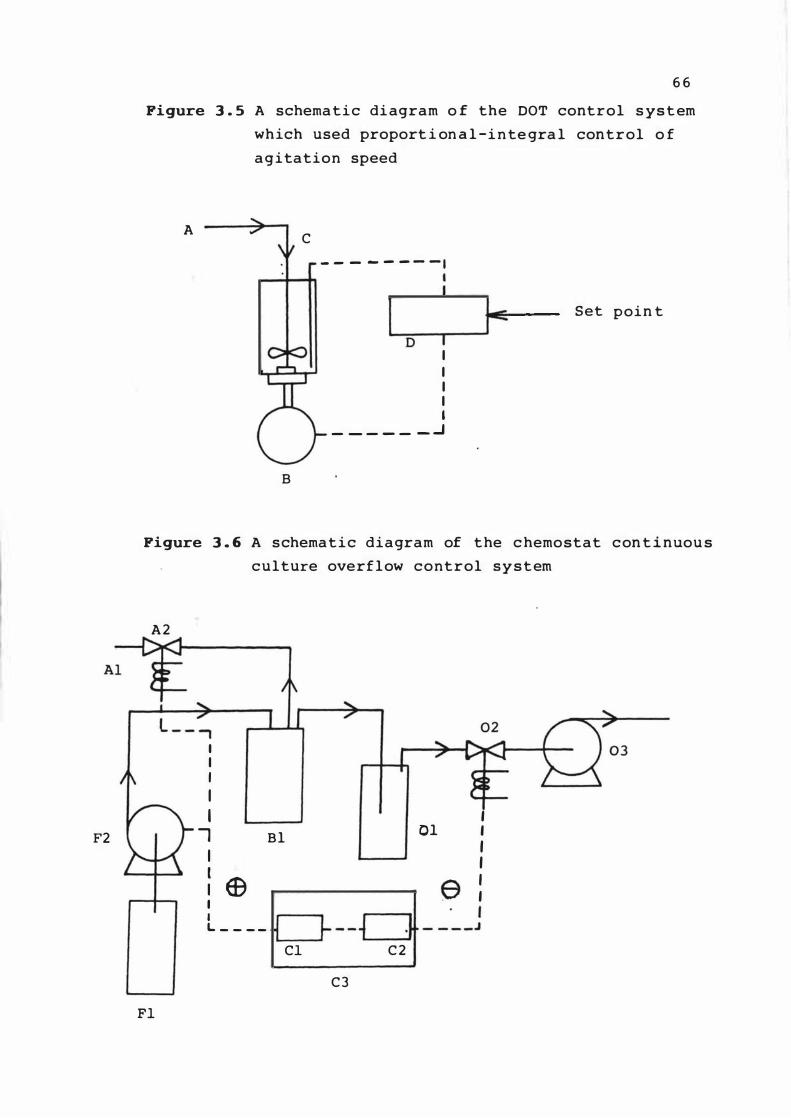
F2
6 6
Figure 3 . 5 A schema t i c di agram o f the DOT contr o l s ys t em
which used proport i on a l -i n te gra l control o f
agitation speed
A C
B
- - - - - -- - ,
L-�--r_--�r= Set poin t
D I I I I I
_ _ _ _ _ _ ..J
Figure 3 . 6 A schemat i c diagram of the c hemostat con t i nuou s
culture overf low control s y s t em
A 2
Fl
I I I I I
-, Bl I
: Ee I I L _ _ _ _
01
Cl C 2
C3
e
, , , , I , I
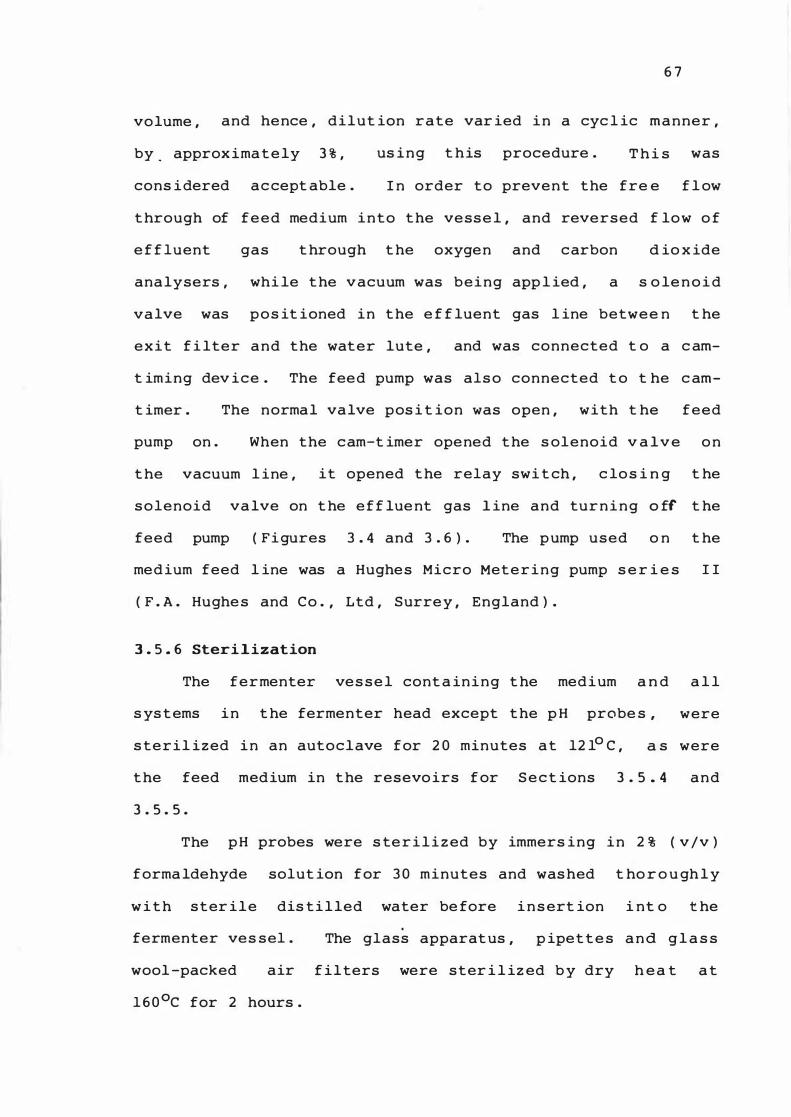
6 7
volume , and hence , dilut ion rate var ied i n a cyc l ic manner ,
by . approx ima t e ly 3 % ,
cons i dered ac cept able .
us i n g t his procedure . T h i s was
I n order to prevent the fre e f l ow
t hrough of f e e d medium i n t o t he vesse l , and reversed f lo w o f
e f f luent gas t hrough t he oxygen and carbon d io x ide
analysers , whi le t he vacuum was being app l ied , a s o le n o i d
valve was p o s it ioned in t he e f f luent gas l ine betwee n t he
exit f i lter a n d the water lute , and was connected t o a c am
t iming dev ice . The feed pump was als o connected t o t he c am
t imer . The normal valve pos i t ion was open , with t he feed
pump on . When the cam-t imer opened t he s olenoid v a l v e o n
t he vacuum l ine , it opened t he relay swi t ch , c lo s i n g t he
s o lenoid va lve on t he e f f lue nt gas l ine and tur n i n g o ff t he
feed pump ( Fi gures 3 . 4 and 3 . 6 ) . The p ump used o n t he
med ium feed l ine was a Hughes Micro Met e r i n g pump s e r i e s 1 1
( F . A . Hughe s and Co . , Ltd , Surre y , England ) .
3 . 5 . 6 Steri 1 ization
The fermenter ves se l cont a in i n g t he medium a n d a l l
s ys t ems i n t he fermenter head except t he p H probe s , were
s teril ized i n an autoclave for 2 0 minutes a t l2 lo C , a s were
t he feed medium in t he resevo irs f or S e c t ions 3 . 5 . 4 a n d
3 . 5 . 5 .
The p H probes were s te r i l i z ed by immers ing i n 2 % ( v /v )
forma ldehyde solut ion for 3 0 minutes and was hed t ho r o u gh l y
w i t h ster i l e dis t i l led water be fore i n s ert ion i nt o t he
fermenter ves sel .
wool -packed air
l 6 0 0C for 2 hours .
The glass apparat us , p ipet t e s a n d g l a s s
f il ters were ster i l iz ed b y dry h e a t a t
3 . 5 . 7 Preparat ion of Inoculum for Fermenter Experiments
Spore s ( approx imat ely 1 x 1 0 8) ( Se c t ion 3 . 1 .4 )
6 8
were
used to i nocu late 1 0 0 ml o f med ium in a 2 5 0 ml E r l e nmeyer
f lask . The i noculated med ium was t he n i ncubated at 3 0 � in
s hake -cult ure f or 36 to 4 0 hours for the bat ch and f e d -batch
experime n t s , and 24 hours for t he chemos t at exp e r imen t s .
The conte n t s o f the f lask ( cont a i n i n g sma ll p e l le t s o f about
0 . 2 t o 0 . 3 mm d iameter ) were used f or t he inoculat i o n o f the
fermenters ( 1 0 % ( v /v ) inoculum ) .
3 . 5 . 8 Samp ling of Fermenters
The r out ine withdrawal of s amples ( about 3 0 m l v o l ume )
f or analys i s was performed t hrough the s amp le w i t hdrawal
s ystem o f t he ves s e l s . Pr ior t o s ampl i n g , t he w i t hdrawa l
s ys t em was f lushed with 1 0 to 1 � m l of t he c u lt ure f lu i d t o
remove any " dead " volume . The vol umes o-f f lu s h and s amples
withdrawn from t he fermenter were recorded and t ake n int o
account dur i n g the volumetric ana lys i s o f f ermen t at ion
c omponent s .
3 . 5 . 9 Avoidance of Wall Growth in Ferment er Culture
Myce l ia l growt h around t he v es s e l wal l s was
periodic a l ly dis lodged wit h a t e f lon -c overed bar magnet
i n s ide the fermenter ves s e l which was s e c ured and mov e d w i t h
a horse s hoe magnet from out s ide t he ves s e l .
6 9
3 . 6 PREPARATION OF SAMPLES FOR HPLC ANALYS IS
Myce l i um was removed by f i lt rat ion and the s amp l e s were
cent r if uged at about 2 5 0 0 x 9 us ing a W i f u g C hemico
Cen t r i fuge ( S t ockholm , Sweden ) . The s upernatant l i qu id was
t hen f i lt ered through a membrane ( pore s i ze 0 . 4 5 urn ) u s i n g a
Swinney F i l t er Kit ( Mi l l ip ore C orporat ion , Bed f ord ,
Mas s achuse t t s , U . S . A . ) .
3 . 7 ENZYME ASSAYS
3 . 7 . 1 Preparat ion of Ce ll-Free Extract
Ferme n t at ion samp les ( about 5 0 m l ) or whole s ha ke - f la s k
content s ( about 1 0 0 ml ) were f i ltered t hrough a Buc hner
funne l us i n g Whatman No . 54 f i lt er p aper . The myce l ium was
was hed twice wit h cold M i l l i-Q deion ised water ( ab o u t 4 oc ) ,
fol lowed by washing with s u f f ic ient 0 . 1 M p o t a s s i um
phosphat e buf fer ( pH 7 . 4 ) to bring the p H t o n e ut r a l it y .
The mycel ium was then rewashed with c o ld de i o n i s e d w a t e r .
The was hed mycel ium was sus pended in c o l d 0 . 1 M
pota s s ium p hosphate buf fer , pH 7 . 4 , cont a i n i n g 1 mM E DTA ( 1 0
ml extract ion solut i on l g wet wei ght myce l iu m ) . The
s uspens ion was p laced into a pre - cooled homo ge n i z er
container ( a s t ainless s teel bot t le of 7 5 ml capac i t y ) w h i c h
cont ained the required amoun t of ballo t i n i b e a d s ( ab o u t 5
g i g wet we i ght mycel ium ) of 0 . 5 mm d i ame ter ( Gl a s pe r l e n , Kt .
Nr . 5 4 1 8 0 , B . Braun Me lsungen AG . , Germany ) . The s t a i n le s s
s teel con t a iner was placed ins ide t he ho l d i n g chamb e r o f a
rot ary cell homogenizer ( Ce l l Homoge n i z er MSK , Type 8 5 3 0 3 4 ,
B . Braun Melsungen AG , Germany ) wh ich operat e d a t e it her
2 0 0 0 or 4 0 0 0 rpm . The machine and the mat e r i a l we re c oo le d
7 0
for abou t 1 minute by pass age o f l iquid carbon d iox ide
through t he s ys t em . This coolant f low was c o n t i nued
t hroughout homoge n izat ion . Shaking was cont inued f or 1
minute at 4 0 0 0 rpm at an operat ing t empera ture o f about 3 t o
4 0 ," ... . The homogenate was t he n s epara t e d from t he b a l lot i n i
beads by f i ltering through a glass s in t e r . The f i lt ered
l iquid was t hen cent rifuged at 2 5 0 0 0 x g f or 30 m in u t e s at
o °c us i n g a re frigerated centrifuge ( S orval l Superspeed RC
2 -B Aut omat i c Refr igerate d Cent r if u ge ) . The creamy
s upernat ant l iqu id was ma i n t ained at 3 t o 4 0C and a s s ayed
for e n z yme act ivity as s oon as poss ib le . Where n ec e s s ary ,
the extract was diluted us ing 0 . 1 M p o t a s s ium phosphate
buf fer , p H 7 . 4 .
All as s ays were carried out at r oom t emperat ure ( about
2 3 0C ) us i n g a Shimadzu UV- 1 2 0 - 0 2 s pe c t r op ho t ome t e r ( S h imadz u
Corporat ion , Kyoto , J apan ) . As s ays were c o n du c t e d in
t r ip l icate and the average result was reco r ded .
The spe c if i c act ivity of the e n z ymes was e xpr e s s ed as
umo les of produc t / min /mg of prote in . The amoun t o f p roduct
formed dur ing t he react ion t ime was c al c u lated f rom t he
s t andard curve of that produc t .
3 . 7 . 2 Protein Est imat ion
The pro t e in content of c e l l - free e x t r a c t s was e s t imated
using the met hod of Bradford ( 1 9 7 6 ) .
Di luted cell -free extract ( 0 . 1 ml , c o n t a i n i n g 1 0 t o 1 0 0
u g prote in ) was p ipet ted into a t e s t t u b e . T o t h i s was
added 5 ml of prote in reagent ( C ooma s s ie Br i l l i an t B lue
G2 5 0 , 1 0 0 mg dis s o lved in 5 0 m1 9 5 % e t han o l , t o wh i c h was
7 1
added 1 0 0 m l of 8 5 % ( w/v ) orthophosphor ic a c i d , a n d t he
mixture was d i luted with Milli-Q de ion ised water t o a f inal
volume of 1 . 0 l it res , . and f il t ered be fore u s e ) a n d m ixed
gent ly . The b lue c olour obtained aft er 2 minutes i s s t ab le
f or up t o 1 hour . The absorbance was meas ured at 5 9 5 nm
agains t a r e a gent blank , and c ompared t o a s t andard c urve
c on s t ru c t e d u s ing Bov ine S erum Albumin ( BSA ) . A r e d u c t ion
factor of 2 . 1 equivalent prote in was requ ired , due t o t he
use of BSA a s the s t andard s olut ion , whe n c a l c u l a t i n g t he
abs olute prot e i n concentrat ion in the s amp le ( Chon g ,
C omm , 1 9 8 4 ) .
3 . 7 . 3 Aconit ase ( E . C . 4 . 2 . 1 . 3 )
Pers
The act ivity of t h i s enzyme was de termined by mea s u r i n g
the rate o f appearance of c is -acon i t a t e from i s o c i trate
accord ing t o t he met hod of La N au z e ( 1 9 6 6 ) .
The react ion s y s t em contained : 0 . 1 M DL- i s oc i t r a t e in
0 . 5 M potas s ium phosphate buf fer ( pH 7 . 4 ) , 0 . 4 ml ; d il uted
enzyme extract , 0 . 1 ml ; and 0 . 0 5 M phosphat e buf fe r ( pH
7 . 4 ) , 2 . 5 ml . The b lank conta ined ( in 3 ml ) a l l c omp o n e n t s
except the s ubs trate . The rat e was obt a ined by mon it or i n g
the increas e i n abs orbance a t 2 4 0 nm over a per i o d o f 5
minutes .
3 . 7 . 4 NAD-Linked Isocitrate Dehydrogenase ( E . C . 1 . 1 . 1 . 4 1 )
The act ivity of t his enzyme was determined by m e a s u r i n g
t he rate o f format ion of NADH from NAD accord i n g t o t he
method of La Nauze ( 1 9 6 6 ) .
The react ion s ys tem con t a ined : 0 . 5 M p ot a s s ium
7 2
phosphat e buf fer ( pH 7 . 4 ) , 0 . 2 ml � 0 . 0 0 5 M NAD , 0 . 3 ml �
0 . 0 0 2 5 M AMP , 0 . 3 ml � 0 . 1 M MgC I2 , 0 . 1 ml � 0 . 3 M KCN
( fres hly neutral ized ) , 0 . 1 ml ; 0 . 1 M DL- isoc itra t e , 0 . 1 ml �
d i luted e n z yme extract , 0 . 1 ml ; Mi 1 1 i-Q de ion ised w at e r , 1 . 8
ml . The b lank contained ( in 3 ml ) a l l c omponent s o t he r t han
t he s ubs trate . The rat e was obt a ined by meas u r i n g t he
increase in absorbance at 3 4 0 nm over a p e r iod of 5 m inut e s .
3 . 7 . 5 NADP-L inked Iso�rate Dehydrogenas e ( E . C . 1 . 1 . 1 . 4 2 )
The act ivity of t his enzyme was det e rm ined by mea s ur in g
t he rate of format ion o f NADPH from NADP accord i n g t o t he
met hod o f L a Nauze { 1 9 6 6 } .
The react ion system con t a ined : 0 . 5 M p o t a s s ium
phosphate buf fer { pH 7 . 4 } , 0 . 2 ml ; 0 . 0 0 2 5 M NAD P , 0 . 3 m l ;
0 . 1 M MgC lz , 0 . 1 ml ; 0 . 3 M KCN { fres h l y neutra l i z e d } , 0 . 1
ml ; 0 . 1 M DL- isoc itrate , · O . l ml � di lut e d e n z yme e x t rac t , 0 . 1
ml ; M i l l i-Q de ion ised water , 2 . 1 m l . The blank c on t a ined
{ in 3 ml } a l l t he componen t s ot her t han t he s ubs t r a t e . The
rate was obt a ined by mon itoring t he increa s e in abs orbance
at 3 4 0 nm over a period of 5 minutes .
3 . 7 . 6 2 -0xog1utarate Dehydrogenase ( E . C . 1 . 2 . 4 . 2 )
The ac t ivity of this enzyme was determined by mea s ur in g
t he rate of format ion o f NADH from NAD acc ordin g t o t he
method of Reed and Mukherj ee ( 1 9 6 9 ) .
The react ion system con t a ined : 0 . 5 M p ot as s ium
phosphate buf fer ( pH 8 . 0 ) , 0 . 3 ml ; 1 0 mM MgC IZ ' 0 . 3 ml ; 0 . 0 1
M NAD , 0 . 3 ml ; 3 0 mM cys te ine hydroc h l o r ide ( ne u t r a l iz e d
before use ) , 0 . 3 ml ; 2 0 mM thiamine pyropho sp hate , 0 . 0 3 m l ;
3 mM Coen z yme A ( prepared fres hly be f ore us e ) , 0 . 0 6 m l ; 0 . 1
7 3
M 2 -oxoglutarate , 0 . 0 3 ml ; diluted e n z yme extract , 0 . 1 ml ;
Mi l l i-Q d e i o n ised water , 1 . 5 8 ml . The blank cont a i n e d ( in 3
ml ) a l l c omponent s ot per t han t he sub s t rate . The r a t e was
obt ained by monitoring t he increase in abs orbance a t 3 4 0 nm
over a per iod of 5 minutes .
3 . 7 . 7 Pyruvate Carboxylase ( E . C . 6 . 4 . 1 . 1 ) The act ivity of t his e n z yme was determ ined by me a s ur ing
the rate of ox idat ion of NADH to NAD according to t he me t hod
of Fe ir and Suzuki ( 1 9 6 9 ) .
The react ion s ys t em conta ined : 5 0 mM t r is hydr o ch l o r ide
buf fer ( pH 7 . 9 ) , 1 . 5 ml ; s o l u t ion c o n t a i n in g 5 mM s od ium
pyruva t e ,
and 3 3 mM
5 mM sodium bicarbonate ,
KCl , 1 ml ; 0 . 1 mM
3 mM MgC 1 2 , 1 . 2 mM ATP ,
NADH , 0 . 3 m l ; m a l i c
dehydroge nas e , 1 un it ( 0 . 1 ml ) ; diluted e n z yme ext r ac t , 0 . 1
ml . The blank conta ined ( in 3 ml ) a l l c ompone n t s o t he r t han
the s ub s trate . The rate was obt a ined by mon it o r i n g t he
decrease in absorbance at 3 4 0 nm over a per iod of 5 m in u t es .
3 . 7 . 8 I s ocitrate Lyase ( E . C . 4 . 1 . 3 . 1 ) The act ivity of this enzyme was determined by me a s u r ing
the rate o f format ion of glyoxyl ic ac id p he n y lhydra z one
according to the met hod of Dixon and Kornber g ( 1 9 5 9 ) .
The react ion sys t em cont a ine d : 0 . 5 M p o t as s ium
phosphate buf fer ( pH 6 . 8 5 ) , 0 . 4 ml ; 0 . 1 M DL- i s o c i t r a t e i n
0 . 0 5 M po tas s ium phosphate buffer ( pH 6 . 8 5 ) , 0 . 5 m l ; 0 . 1 M
MgC 1 2 , 0 . 1 ml ; 0 . 1 M phen ylhydraz ine , 0 . 0 2 ml ; d i l u t ed
enzyme extract , 0 . 1 ml ; M i l l i - Q de i o n i s ed wate r , 1 . 78 ml .
The b l ank cont ained ( in 3 m l ) a l l c ompone n t s o t he r t ha n t he
7 4
s ubs t r a t e . The rate was obt a ined by mon i t or ing t he i n cr e a s e
in abs orbance at 3 2 4 n m over a per iod o f 5 minut e s , and
calculated us ing t he molar ext inct ion coef f ic ie n t f or
- 4 glyoxyl i c a c id phenylhydraz o ne of 1 . 7 x 10 .
3 . 8 CALCULATIONS
3 . 8 . 1 S tat ist ical Analyses
From t he data generated dur in g c he mos t at c o n t inuous
culture exper iments at var ious DOT and s p e c i f i c grow t h rate
values , regres s ion equat ions were obt a ined . Lack o f f it
tes t s were performed and e quat ions s howi n g no s i gn i f i cant
lack o f f it were used to predict respo n s e sur f ac e s a s 3 -
dimens ional contour diagrams by mean s o f a program deve l oped
at Mas s ey Un ivers ity for an I BM XT pers o n a l computer ( Boag ,
pers c omm . , 1 9 84 ) . From t hese respons e s urfaces , opt imum
condit ions for c it r i c ac id product ion were pred i c te d , and
where t here was no s ign if icant lack o f f it , t he apparen t
opt imum condit ion was tested exper ime n t a l ly . C orr e lat ion
coe f f i c ients
obt a i ned .
for the ent ire corre l a t ion
3 . 8 . 2 Carbon Balance
mat r i x were
The c arbon balance was calculated to determine t he fate
of t he carbohydrate source carbon . The f o l l ow i n g
as s umpt ions were made : -
a ) Prot e in content of b ioma s s was expre s s ed as a
percentage nitroge n of t he myce l ia l dry we i gh t x
6 . 2 5
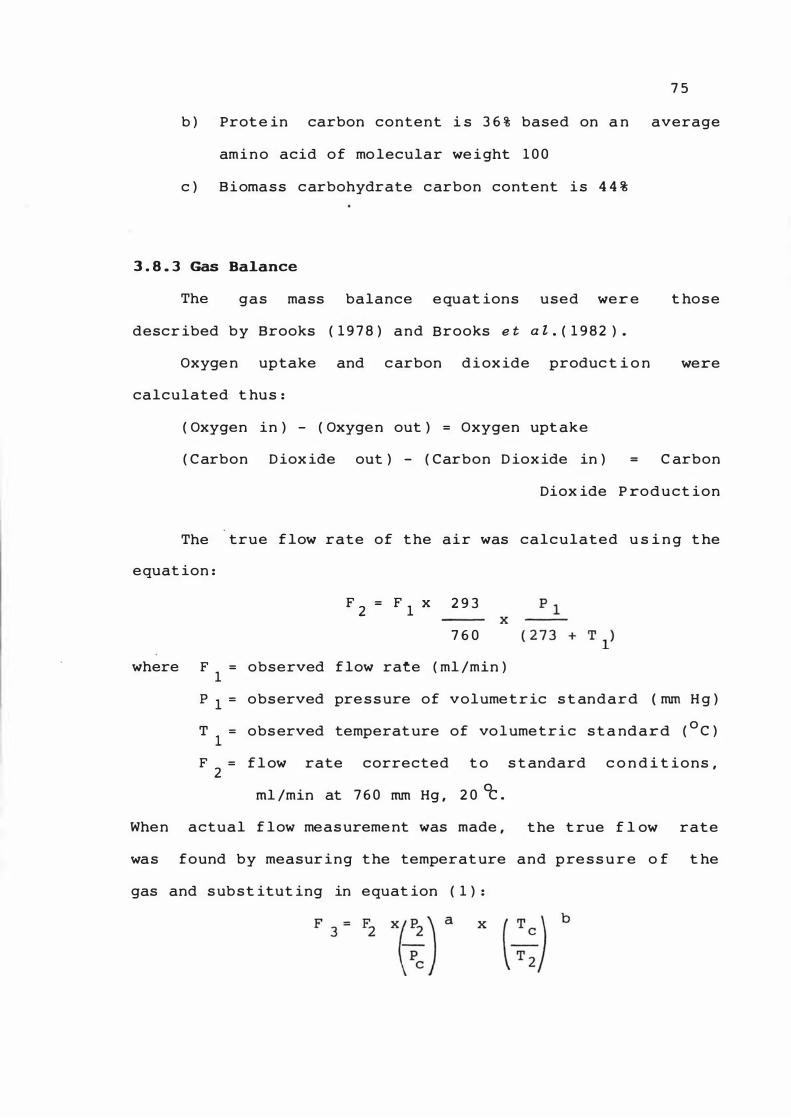
7 5
b ) Prot e in carbon content i s 3 6 % based on a n average
ami n o acid o f mo lecular we i ght 1 0 0
c ) B i oma s s c arbohydrate c arbon content i s 4 4 %
3 . 8 . 3 Gas Ba1ance
The gas mass balance e quat ions used wer e t hose
descr ibed by Brooks ( 1 9 7 8 ) and Brooks e t a t . ( 1 9 8 2 ) .
Oxyge n uptake and c arbon d i ox ide produc t i o n were
calculated t hus :
( Oxygen in ) - ( Oxygen out ) = Oxygen upt ake
( C arbon D iox ide out ) - ( Carbon D iox ide in ) = C arbon
Diox ide P ro d u c t ion
The true f low rate of t he air was calculated u s i n g t he
equat ion :
where
F 2 = F 1
x 2 9 3
7 6 0
F 1
= observed f low rate ( ml /min )
p 1 = observed pre s s ure of volume t r ic s t an d a r d ( mm H g )
T 1 = obs erved temperat ure of vo l ume t r i c s t a nd a r d ( o C )
F 2 = f l ow rate corrected t o s t andard c o n d i t i o n s ,
ml /min at 7 6 0 mm Hg , 2 0 °C .
When actual f low meas ureme nt was made , t he t rue f l ow rate
was found by measur ing t he temperat ure and p re s s u r e o f t he
gas and s ub s t itut ing in equat ion ( 1 ) :
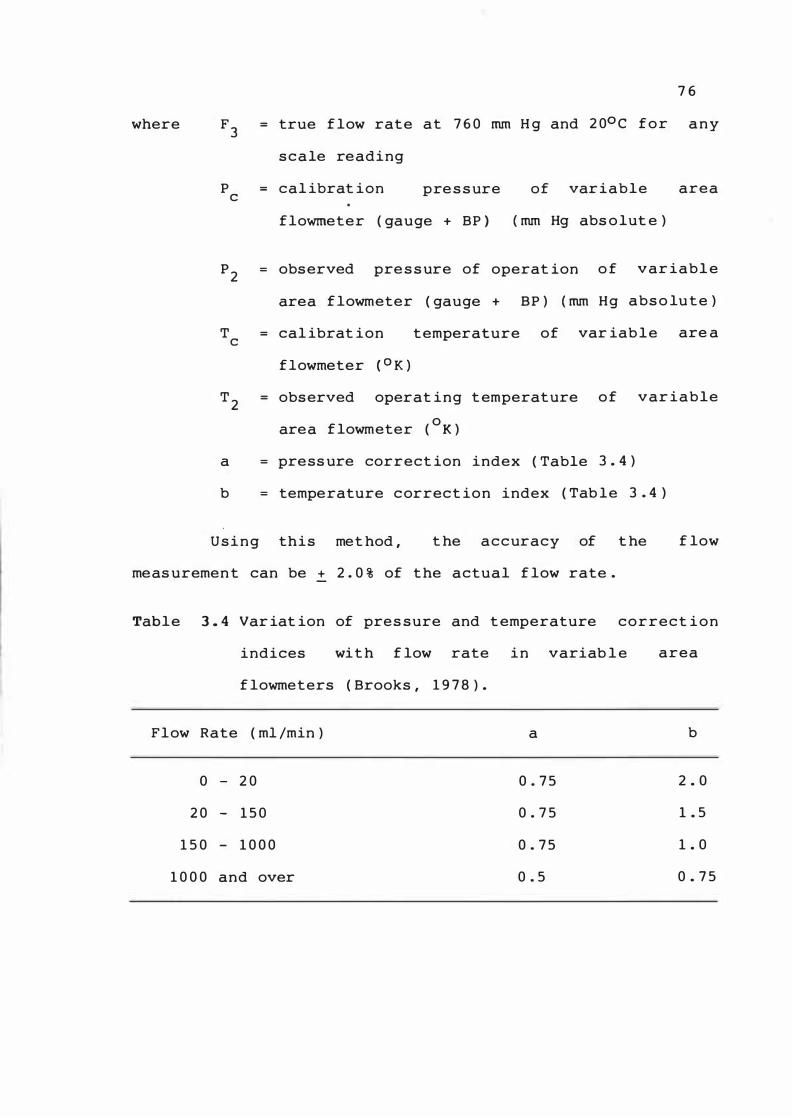
7 6
where F3
= true f low rate at 7 6 0 mm H g and 2 00 C f o r a n y
s c a le reading
P = cal ibrat ion pre s s ure of var iable area c
flowmeter ( gauge + BP ) ( mm Hg abs o lut e )
P 2 = observed pre s s ure of operat ion o f var iabl e
area f lowmeter ( gauge + BP ) ( mm Hg abs o lu t e )
T = cal ibrat ion t emperature of var iab l e are a c
f lowmeter ( O K )
T 2 = observed operat ing t emperature o f var iable
area f lowmeter (o
K )
a = press ure correct ion index ( Table 3 . 4 )
b = temperature c orrect ion index ( Tab le 3 . 4 )
U s i n g this met hod , t he a c c uracy of t he f low
meas uremen t can be + 2 . 0 % of t he actual f low rate .
Table 3 . 4 Var iat ion of pres sure and t emperature corre c t i o n
indices wit h f low rate in variab l e
f lowmeters ( Brooks , 1 9 7 8 ) .
Flow Rate ( ml /min )
o - 2 0
2 0 - 1 5 0
1 5 0 - 1 0 0 0
1 0 0 0 and over
a
0 . 7 5
0 . 7 5
0 . 7 5
0 . 5
area
b
2 . 0
1 . 5
1 . 0
0 . 7 5
7 7
3 . 9 DISCUSSION OF METHODS
3 . 9 . 1 Organism
T he organ ism used in t h is proj ect , A . n i g e r MH 1 5 - 1 5 ,
was a mut ant isolated for i t s ab i l ity t o produce c it r ic ac id
from whey permeate ( Ho s s a in et a L . , 1 9 8 3 ) . T h i s mus t b e
cons idered when compar isons are made between data obt a i ned
in t hi s proj e c t and dat a pub l ished in t he l iterature , wh ich
� genera lly obt a ined from A . n i g e r strains s e le ct ed f or
t he ir ab i l it y to produce c it r ic ac id from t he s ubs t ra t e u s ed
in t he reported work . I n t h is proj e c t , t he s ubs t r a t e used
was s ucrose . This s u gar was used bec aus e it i s a more
favourable s ubstrat e t han lac t o s e for s tron g c it r ic a c i d
produc t ion .
3 . 9 . 2 Chemost at Cont inuous Culture
S ome prob lems were exper ienced wit h t he c hemo s t at
cont inuous culture s ystem . I n a n i n it i a l s e r ie s of
exper iments , it was found t hat s t e ady s t ate condit i o n s were
achieved after 3 res ide nce volumes had pas s e d t hrough t he
fermentat ion ves sel . Previous c u l t ure his t ory had n o e f f e ct
on t he s t e ady st ate , once achieved .
Subs e quent to this s e r ies of experiment s , a per iod of
some 8 mont hs occurred dur i n g which n o st eady s t at e s were
able to be achieved . This was due t o was hout , which
apparent ly commenced after approx imate ly 1 . 7 5 to 2 r e s iden ce
vo lumes had passed t hrough t he ferme n t at ion ve s s e l . This
occurred at all dilut ion rates t e s ted , from 0 . 0 4 5 to 0 . 1 2
4 h • When the cont inuous feed was t urned o f f , and t he
cu lture bat c hed , was hout ceased , a s l ight increase in
7 8
b ioma s s concentrat ion ( meas ured a s myc e l ia l dry we i ght )
occurred and c it r i c a c id product ion c ommence d . Once the
cont inuous f eeding was resumed , was hout again r e s ulted .
Dur ing t h i s period , t he s ame culture o f A . n i g e r MH 1 5 - 1 5
produced c i t r ic a c i d in batch ferment a t ions a t t he s ame
product ion rates as t hose observed prior t o t he o n s e t of
this problem , g iving s imilar f in a l c it r i c ac i d
concentrat ions and y ie lds . I n an a t tempt t o s o lve t he
problem , fresh bat ches of all c hemicals u s ed in t he med i um
were obt a ined , and a l l met al tubes ,
components , except t he agitat or ,
probe s and o t he r met a l
wer e removed f r om t he
fermentat ion ves se l , and rep laced by g l as s . However , no
improvement occurred . Eve ntually , by s ub c u l t ur in g f rom t he
frozen s tocks , a s t ock culture was found t hat d i d n o t was h
out , and gave res u l t s s imi lar t o t hose o b t a ined i n c hemos t at
cont inuous cu lture pr ior to t he ons e t o f t hi s prob lem .
Fur ther frozen s t oc ks of t his culture were made ( Se c t ion
3 . 1 . 4 ) and used for s ubsequent work .
were expe r ienced .
N o f u r t her prob lems
The reas on for t he abnormal behaviour of t he c u l t ure i s
n o t known . However , a poss ible exp lana t i o n was s ug ge s t e d by
Lawrence ( pers . comm . , 1 9 8 5 ) f o l lowing h i s a t tendance at a
s ympos ium in East Germany in 1 9 8 4 w i t h t he t heme of
" Prob lems of Phage in Biotechnology" . S ix o f t he groups t hat
att ended this s ympos ium reported was ho u t in c hemo s t at
cont inuous culture in p ilot p lant o r c ommerc ia l s ca l e
ferment at ions . I n all 6 report s , b a ct e r ia were t he
ferment ing organ isms , and bacter iophage s were f o u n d to be
respons ib le for t he was hout of t he c u l t ure ( Hoppe e t at . ,
7 9
1 9 8 4 ; Kirchube l , 1 9 8 4 ; Kr ivisky , 1 9 84 ; Mac h , 1 9 8 4 ; P r a us e r ,
1 9 8 4 ; Wunsche 1 9 8 4 ) . Lys is occurs dur i n g a c t ive growt h o f an
organ ism . I f t he cu lture is act ive ly growing as in a
c hemos tat , lys is c ou ld occur . I f however , act ive grow t h has
ceased , as occurs in bat ch ferment at ion s ub s e qu e n t t o t he
exhaus t ion of t he growt h - l imit ing nutrient ( n it rogen ) , t he th� "'o�f- , � I I
phage cannot lyse " I as t he cu lture is n o t " growin g " , mere ly
increas ing t he myce l ia l dry we i ght by me ans o f s t orage
carbohydrate produc t ion . There are no report s o f f u n ga l
phage in the literature , though virus - l i ke par t ic l e s have
bee n observed in yeas t s ( Bruenn , 1 9 8 0 ) . C o n s e que n t l y , t he
pos s ibi lity of a phage - l ike con t aminat ion o f t he c u l t ur e in
the pres e nt s t udy , cannot be dis counted .
Another pos s ib i l i t y is t hat due t o t he f a c t t ha t t he
culture was growing cont inuous ly in c hemos t at , a c hem i c a l or
combinat ion of c hemica ls , was produced
condit ions t hat cause d t he c e l l s t o lyse .
under t he s e
N o s e a r c h was
undert aken to det ect and ident ify t his c hemical , i f i n fact
it e x i s t e d .
Wit hout fur t her i nves t igat ion , t he f ormer exp l a na t ion
involving virus /p lasmid con t aminat ion of t he c u l t ure appears
to be t he more l ik e ly of t he two pos s ib i l it i e s .
CHAPTER 4
THE EFFECT OF INTERRUPTIONS TO THE AIR
SUPPLY DURING CITRIC ACID PRODUCTION
4 . 1 INTRODUCTION
80
It is generally accepted t hat aera t ion dur i n g t he
product ion o f c i t r ic ac id by A . n i g e r i n s ubme r ge d bat c h
fermentat ion is c r it ical if high yields a r e t o b e obt a i ne d .
Kovats and Gackows ka ( 1 9 7 6 ) reported t hat a n interrup t ion t o
aerat ion dur i n g bat c h fermentat ion advers e l y affe c t s c it r i c
ac id product ion . Kubicek e t a l . ( 1 9 8 0 ) f ound t hat a 2 0
minute interrupt ion to aerat ion dur i n g i d i ophas e d i d not
reduce t he viab i l ity of t he organ ism , but irreve r s i b l y
des troyed i t s ab i l ity t o produce c it r i c a c i d . Rohr e t a l .
( 1 9 8 3 ) noted tha t t he ab i l ity t o produce c it r ic a c i d was
irrevers ibly ret arded , but not t o t a l ly de s troyed a f t er an
interrupt ion of 20 minutes . The y a l s o reported a s l i ght
s t imulatory e f fect on biomas s product ion .
Kubicek e t a l . ( 1 9 8 0 ) repor ted cr i t i c a l DOT va l u e s o f 9
t o 1 0 % of s aturat ion and 1 2 t o 1 3 % o f s at urat i o n for
trophophase and idiophase , respe c t ive ly . They a l s o s howed
that c it r ic ac id product ion s t eadily incre a s e d betwe e n DOT
values of 2 5 and 7 5 % of saturat ion .
On t he bas is that interrupt ions t o aerat ion are not
uncommon in pract i ce dur ing fermentat ion p r o c e s s e s , i t was
dec ided to re -examine these reports concer n i n g t he e f fe c t
8 1
of interrup t ion of aerat ion on c it r i c a c i d produc t i o n .
4 . 2 RESULTS
The
( Table
med i um used was t hat descr ibed in sec t i o n 3 . 1
3 . 2 ) ,
conce n t r at ion
with t he except ion t hat t he
was reduced t o 1 . 0 g/ l in order to
( NH 4 ) 2S0 4
r e s tr ic t
t he f in a l b iomas s concentrat ion a n d t hereby a l l ow t he
maintenance o f a higher DOT va lue . The experime n t s were
carr ied out in t hree s ituat ion s : e n t ire ly in s h a ke - f la s k
culture ; a c ombinat ion of fermenter a n d s hake -f lask c u lt ure ;
and ent ire ly in fermenter cu lture . I n a l l t hree s it u a t ions ,
interrup t ions to aerat ion were performed b y f lus h i n g t he
cultures wit h oxygen- free n itrogen gas .
4 . 2 . 1 S hake-F1ask Cu1ture
T hree s e t s of cult ures were set up , one as a c o n t ro l ,
one which was f lu s hed with oxygen - free n itrogen gas f or 2 0
minutes o n bot h the f ir s t and third days a f t er ino c u l a t i o n ,
and one which was f lu s he d with oxyge n - free n itrogen g a s f or
1 2 0 minutes on both t he f ir s t and t hird days a f ter
inoculat ion . Dur ing t he f lushing , t he f la s ks were r emoved
from t he s haker and t he n itrogen gas was de l ivered at a f low
rate o f 1 0 0 ml /m in v i a a s t er i le glas s t ube with t he t ip
j ust be low t he surface of t he c ulture . The contro l f la s ks
remained on t he shaker at a l l t imes . C it r i c a c id
concentrat ion in the f lasks was meas ured da i l y a n d t he
resu lts are s hown in Figure 4 . 1 .
part icular ly for 1 2 0 minutes ,
I nterrup t ions t o a e r a t i o n ,
r e t arded c it r i c a c id
product ion , but t his ef fect was not permanen t . By t he f i f t h
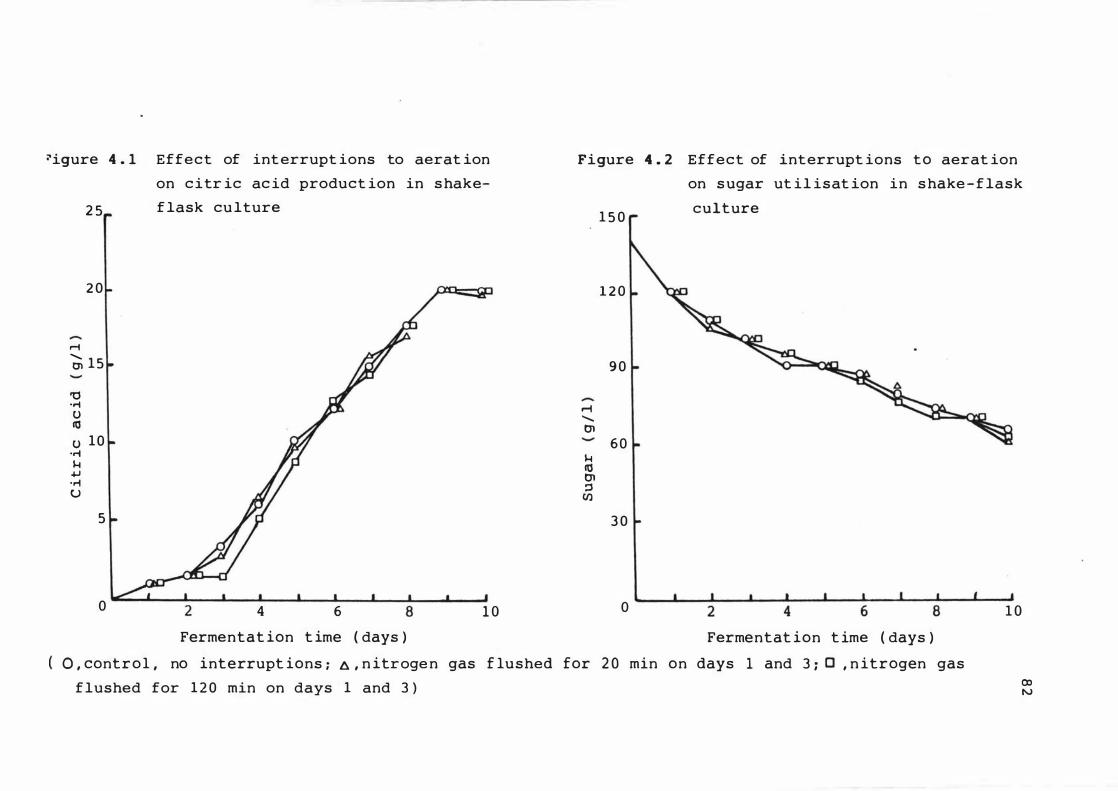
�igure 4 . 1 Effect of int errupt ions to aerat ion
on c itr ic ac id product ion in s hake-
2 5 f lask cu lture
2 0
r-I � 15
'0 .... () co () 10
.... H +J .... u
5
o 4 6 8 1 0 Fermentat ion t ime ( days )
Figure 4 . 2 Effect of interrupt ions t o aerat ion
on s ugar ut il isat ion in s hake - f lask
1 5 0 culture
1 2 0
90
� ........ O'l
60 H CO O'l ='
Ul
3 0
o 1 0 Fermentat ion t ime ( days )
O , contr o l , no interrupt ions : � , n itroge n gas f lushed for 2 0 min on days 1 and 3 ; 0 , n itrogen gas
f lushed for 1 2 0 min on days 1 and 3 ) co IV
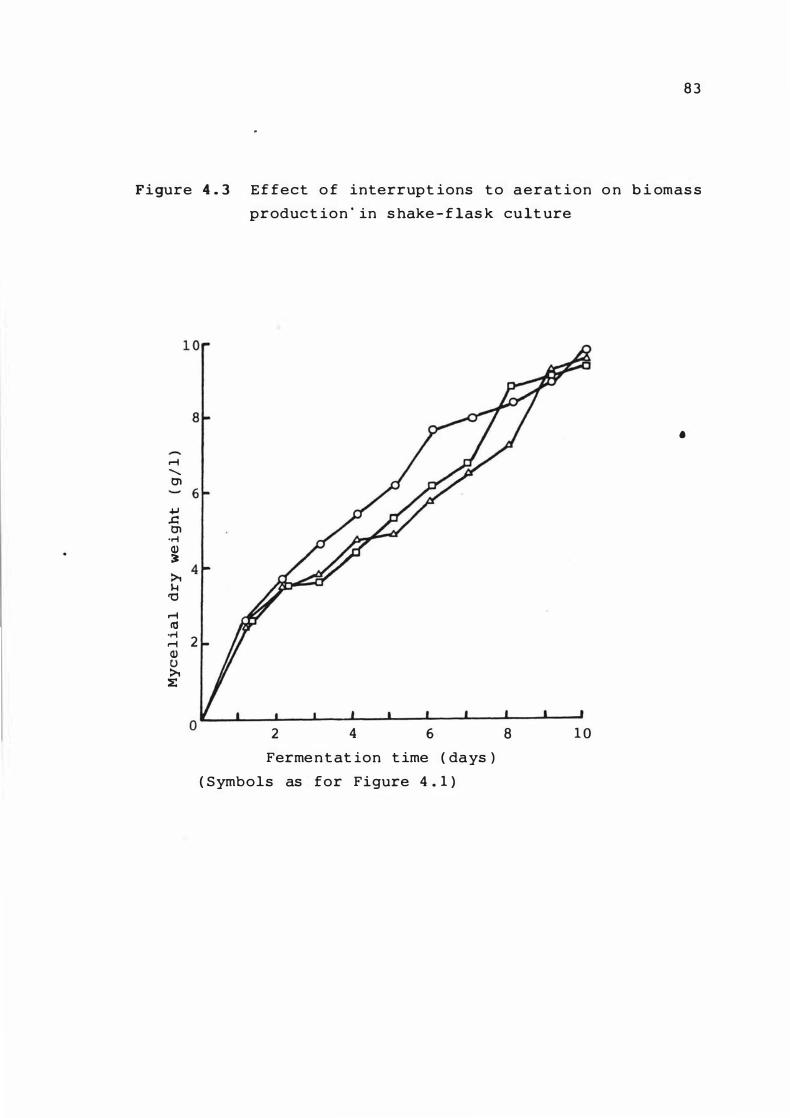
8 3
Figure 4 . 3 E f fect o f interrupt ions t o aerat ion o n b i omas s
produc t ion ' in s hake - f las k cu lt ure
� " �
� � � .� � � � H � � � .� � � u � �
2
0 2 4 6 Ferme n t at ion t ime ( days )
( Symbols as for Figure 4 . 1 )
•
8 1 0
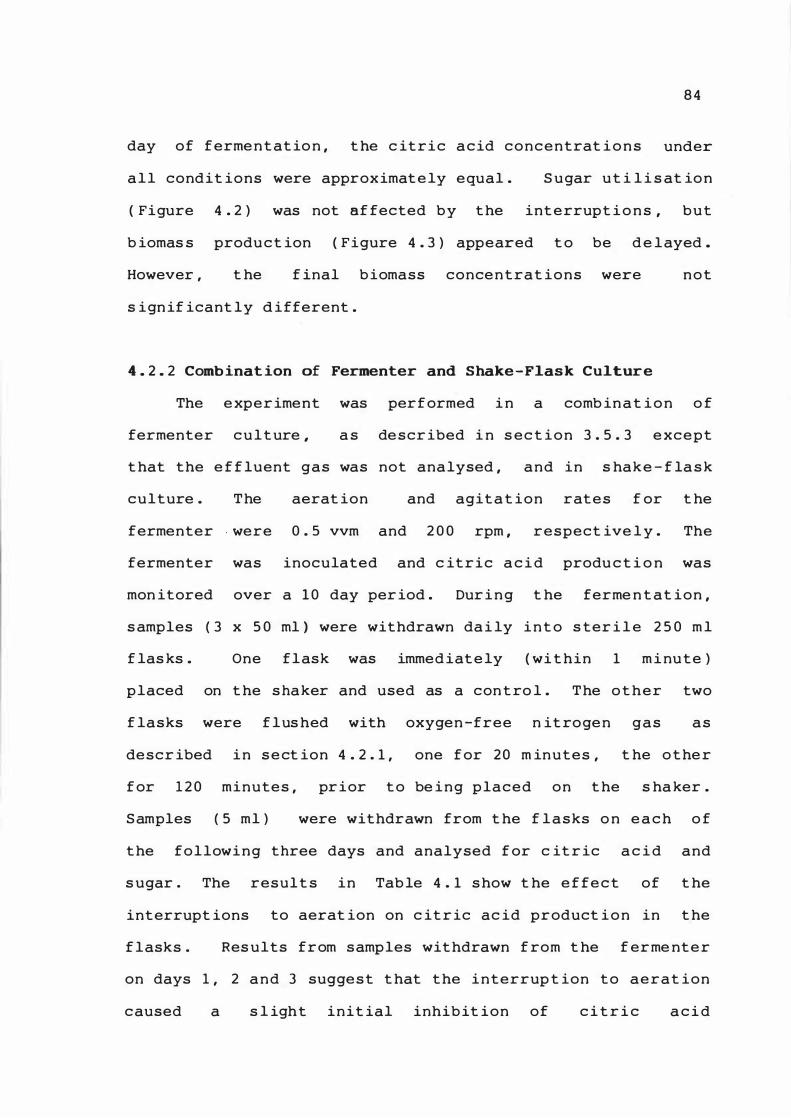
8 4
day of f erme n t at io n , t he c it r i c a c id concentrat i o n s under
a l l condit ions were approximat e ly equal . S ugar u t i l i s at io n
( Figure 4 . 2 ) was not af fected b y t he int errupt i o n s , b u t
b iomas s produ c t ion ( Figure 4 . 3 ) appeared t o be d e l ayed .
However , t he f inal b iomass conce n t rat ions were n o t
s ign if icant ly d ifferent .
4 . 2 . 2 Comb inat ion of Fermenter and Shake - F1as k Cu1ture
The e xper iment was perf ormed i n a comb in a t i o n o f
fermenter c u l t ure , a s de scr ibed i n s ec t i o n 3 . 5 . 3 e xcept
t hat the e f f luent gas was not analysed , and in s hake - f la s k
culture . T he aerat ion and agit a t ion rat e s f or t he
fermenter - were 0 . 5 vvm and 2 0 0 rpm , respect ive l y . The
fermenter was inoculated and c it r i c a c i d produ c t i o n was
mon itored over a 1 0 day per iod . Dur i n g t he ferme n t at ion ,
s amples ( 3 x 5 0 ml ) were withdrawn da i ly i n t o s ter i l e 2 5 0 m l
f las ks . One f l ask was immed iat e ly ( wi t hin 1 m i nu t e )
p laced on t he s ha ker and used as a con t ro l . T he o t her two
f lasks were f lus hed with oxygen -free n it roge n g a s a s
descr ibed i n s e ct ion 4 . 2 . 1 , one f or 2 0 m inutes , t he o t he r
f or 1 2 0 minutes , pr ior t o be i n g p laced on t he s ha ker .
S amples ( 5 ml ) were withdrawn from t he f l a s ks o n e a c h o f
t he followi n g three days and analysed f or c it r ic a c i d and
s ugar . The resul t s in Tab le 4 . 1 s how t he e f fe c t of t he
interrupt ions to aerat ion on c it r ic ac id product i o n in t he
f lasks . Res ults from samples wit hdrawn f rom t he f er me nt e r
on days 1 , 2 a n d 3 sugge s t t hat t he i n terrup t ion t o a e r a t ion
c aused a s l ight init ial inhib it ion of c i t r i c a c i d
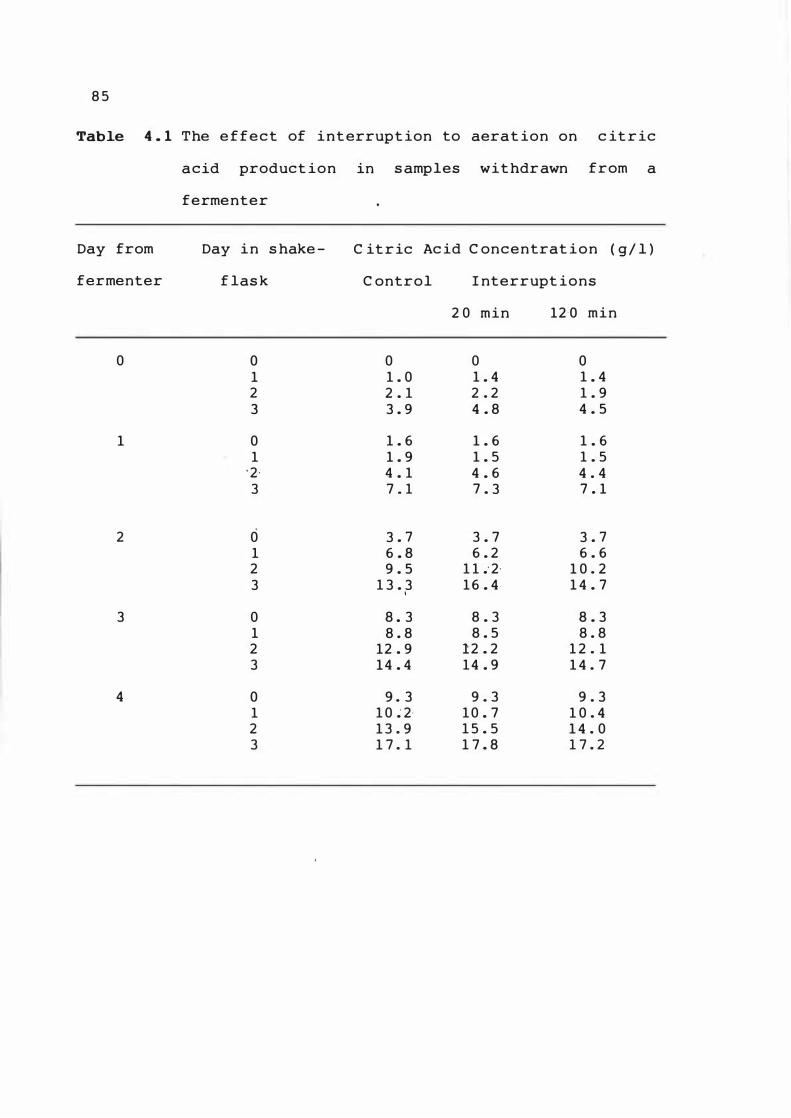
8 5
Table 4 . 1 The e f f e c t of int errupt ion to aerat ion on c it r ic
acid product ion in s amples wit hdr awn from a
fermenter
Day from Day i n s hake - C it r ic Ac id C oncentrat i o n ( g / l )
fermenter f las k C ontrol I nterrupt ions
2 0 min 12 -0 min
0 0 0 0 0 1 1 . 0 1 . 4 1 . 4 2 2 . 1 2 . 2 1 . 9 3 3 . 9 4 . 8 4 . 5
1 0 1 . 6 1 . 6 1 . 6 1 1 . 9 1 . 5 1 . 5
' 2 - 4 . 1 4 . 6 4 . 4 3 7 . 1 7 . 3 7 . 1
2 0 3 . 7 3 . 7 3 . 7 1 6 . 8 6 . 2 6 . 6 2 9 . 5 1 1 .. 2 - 1 0 . 2 3 1 3 . 13 1 6 . 4 1 4 . 7
3 0 8 . 3 8 . 3 8 . 3 1 8 . 8 8 . 5 8 . 8 2 12 . 9 1 2 . 2 1 2 . 1 3 1 4 . 4 1 4 . 9 1 4 . 7
4 0 9 . 3 9 . 3 9 . 3 1 1 0 .- 2- 1 0 . 7 1 0 . 4 2 1 3 . 9 1 5 . 5 1 4 . 0 3 1 7 . 1 1 7 . 8 1 7 . 2
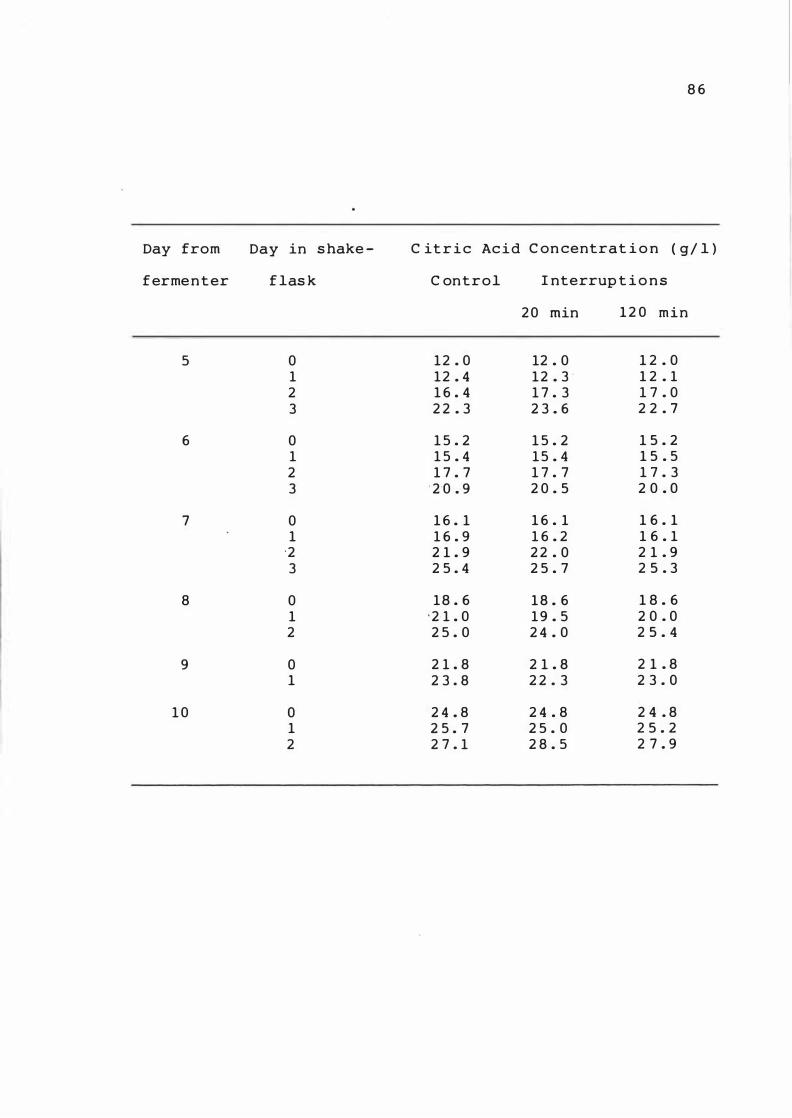
8 6
Day from Day in s hake - C it r i c Ac i d C on centrat i o n ( g / l )
f erme n t er f las k C on t r o l I nterrup t i o n s
2 0 min 1 2 0 m i n
5 0 1 2 . 0 12 . 0 1 2 . 0 1 1 2 . 4 1 2 . 3 ' 1 2 . 1 2 1 6 . 4 1 7 . 3 1 7 . 0 3 2 2 . 3 2 3 . 6 2 2 . 7
6 0 1 5 . 2 1 5 . 2 1 5 . 2 1 1 5 . 4 1 5 . 4 1 5 . 5 2 1 7 . 7 1 7 . 7 1 7 . 3 3 ' 2 '0 . 9 2 0 . 5 2 0 . 0
7 0 1 6 . 1 1 6 . 1 1 6 . 1 1 1 6 . 9 1 6 . 2 1 6 . 1
' 2 2 1 . 9 2 2 . 0 2 1 . 9 3 2 5 . 4 2 5 . 7 2 5 . 3
8 0 1 8 . 6 1 8 . 6 1 8 . 6 1 ' 2 1 . 0 1 9 . 5 2 0 . 0 2 2 5 . 0 2 4 . 0 2 5 . 4
9 0 2 1 . 8 2 1 . 8 2 1 . 8 1 2 3 . 8 2 2 . 3 2 3 . 0
1 0 0 2 4 . 8 2 4 . 8 2 4 . 8 1 2 5 . 7 2 5 . 0 2 5 . 2 2 2 7 . 1 2 8 . 5 2 7 . 9
8 7
product io n , but this was qu ickly overcome . Samples w i t hdrawn
from t he fermenter after day 3 behaved s imi lar ly t o each
other , s howing that the int errupt ions had no las t in g e f fe c t
o n t he c it r ic ac id product ion o f t he cultur e s . The
interrupt ions to aerat ion had l it t le effect o n
ut i l isat i o n ( data n o t shown ) .
s ugar
4 . 2 . 3 Fermenter Culture
T he e xper iments were performed in f ermenter c u l t u r e a s
descr ibed i n sect ion 3 . 5 . 3 , except - t hat n o a n a l y s i s o f
e f f luent gas was performed . Aerat ion and a g i t at i o n r a t e s
were 1 . 0 vvrn and 2 0 0 rpm , respec t ive ly . A c on t ro l
fermentat ion was performed w i t h no interrupt ion t o a er a t i o n
( Figure 4 . 4 ) . Fermentat ions were t hen performed i n wh i c h
oxygen-free nitrogen gas was sparged at a f low r a t e o f 1 . 0
vvrn f or e it her 20 or 1 2 0 minutes on t he f ir s t and t hi r d days
of t he ferment at ion . Agit at ion was cont i nued t hroug ho u t t he
interrupt i o n per iod . A furt her experiment was p e r f ormed
where , i n s tead of replac i n g t he a ir wit h n itrogen g a s , t he
aerat ion and agitat ion were d iscont inued for a 2 0 m i n ut e
per iod on t he f irst and t hird days of t he ferme n t a t i o n . T he
c it r ic ac id product ion under the var i ous c o n d it io n s i s
p lotted i n Figure 4 . 5 , and s hows t hat u n der t he c o n d i t i o n s
o f two 2 0 minute int errupt ions , produ c t ion was s im i l ar t o
that of t he control . However , whe n t he int errup t i o n s wer e
for 1 2 0
retarded ,
was equa l
minutes , c it r ic ac id produ c t ion was
alt hough t he rate of product i o n f in a l l y
to , that o f t he control . After t he
s ev e r e l y
a t t a ine d
f ir s t 1 2 0
minute interrupt ion ( on day I ) myce l ia l growt h was s ev e r e l y
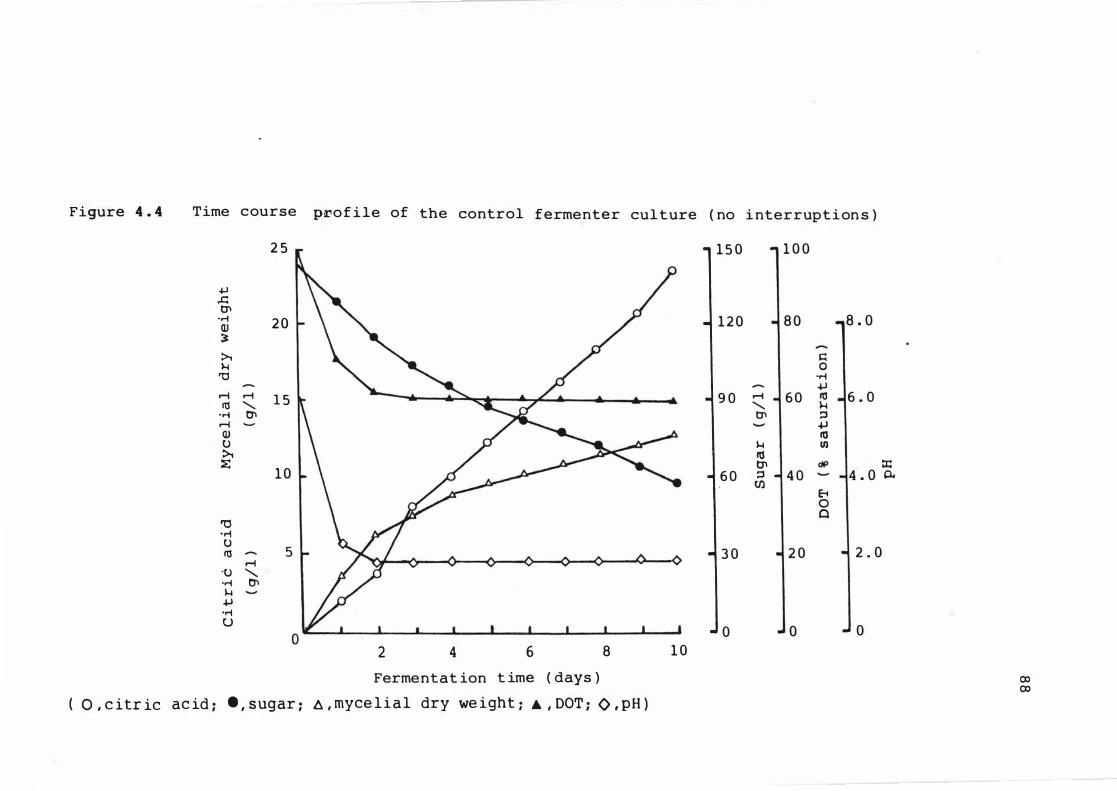
Figure 4 . 4 Time course Pii'o f i le of the control fermenter cul ture ( no i nterrup t i on s )
2 5 1 5 0 1 0 0
+l .c tTI 8 . 0 -..-i 20 120 80 Q)
� :>.. I::; )...j 0
'0 -..-i +l r-i r-i 1 5 9 0 r-i 6 0 ro 6 . 0 ro "'- "'- )...j
-..-i 0'1 tTI ::l r-i +J Q) ro u )...j U) :>.. ru :E: tTI dP :r: 10 6 0 ::l 4 0 4 . 0 0-Ul
E-1 0
"0 0
-r-! U ro 3 0 2 0 2 . 0 r-i -u "'--..-i 0'1 )...j +J -r-! CJ 0 0 0
2 4 6 8 1 0
Fermentat ion t ime ( days ) Cl) ex>
( 0 , c itr ic ac id ; . , s ugar ; e. , myce l i a l dry we ight ; A , DOT ; O , pH )
8 9
ret arded , a n d did not recover unt il the s ix t h d ay o f
fermentat i o n ( F igure 4 . 6 ) . The biomass concent rat i o n a t t he
end of t he ferment at i�n was not t oo d i s s imilar t o t ha t of
t he control . The rate o f s u gar ut i l isat ion ( F igure 4 . 7 ) was
unaf fected by the f ir s t 1 2 0 minute inte rrupt ion , b u t was
retarded after t he s e c on d interrupt ion . Recover y was
observed at t he same t ime as myce l ia l growth recomme n ce d .
The product yie lds ( based on s ugar ut i l i s e d ) a f t e r 1 0
days of f erment at ion were 4 5 % for t he contro l ferme n t a t i o n ,
with s imi lar values obta i n e d f or both o f the ferme nt at ions
with 2 0 m inute int errupt ions . However , t he product y i e l d f o r
t he ferme n t at ion interrup t e d for per iods o f 1 2 0 minut e s , wa s
o n ly 2 1 % .
The DOT prof i les for t he exper imen t s in t he ferme n t e r
are s hown i n F i gure 4 . 8 . When t he a ir s upply was i n t e r r up t e d
f or 1 2 0 m inutes , t he DOT decreased t o z ero over a p er io d o f
3 5 minutes . I n contrast , when the interrupt ions were f or 2 0
minutes , t he DOT did not decrease to zero , the l owes t value
reached be ing 20% of air saturat ion . Dur i n g n i t r o ge n
sparging o f un inoculated growt h medium , t he rec orde d DOT
decreased to z ero wit hin 1 0 minutes . Thi s indicat e s t ha t t he
mycel ia l p e l lets ret ain d i s s o lved oxygen for s ome t ime a f te r
t he interrupt ion to the a ir s upply , re s u l t ing i n a s lowe r
rate of de gas s ing . I n all exper iments , a f ter r e c omme n ce me n t
o f t he a i r supply t he DOT rose t o a leve l higher t ha n t ha t
immediat e l y pr ior to t he interrupt ion and t he n gra d u a l l y
decreas ed , s uggest ing t hat the rate of met abo l i s m i s
t emporar i l y depressed dur ing oxyge n s t arvat ion .
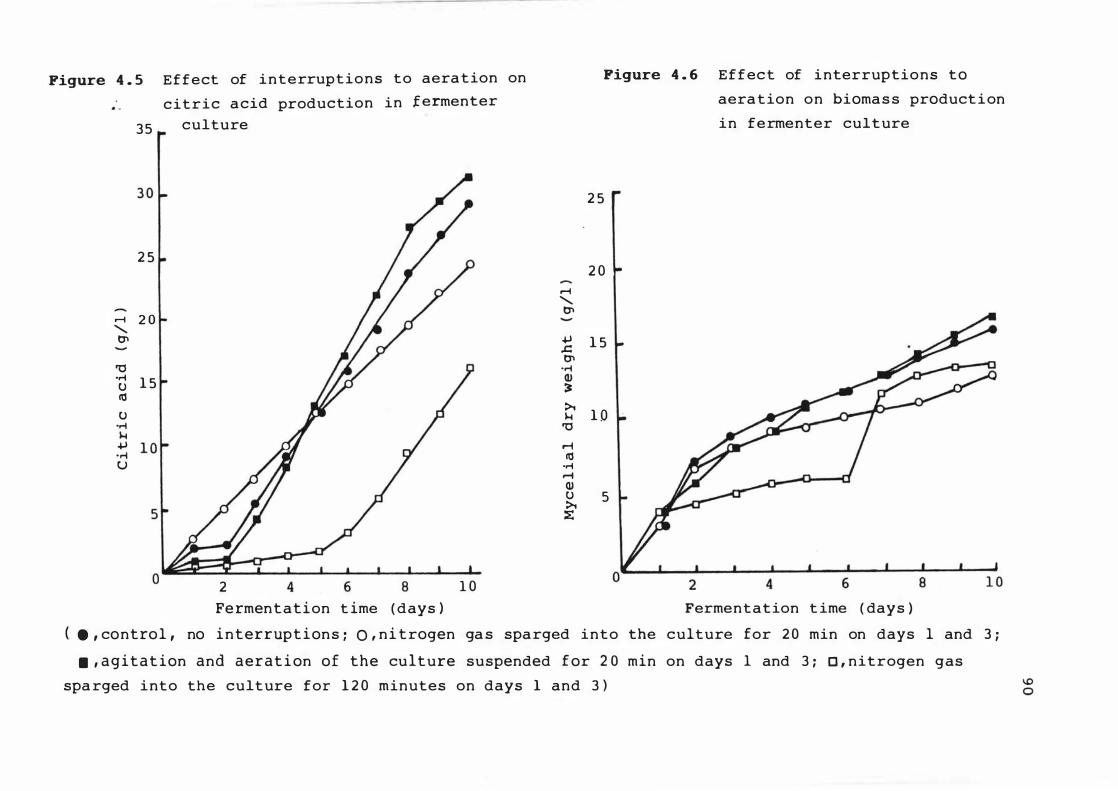
Figure 4 . 5 Effect of interruptions to aera tion on
citric a cid production in termenter
� " � � .� u � u
.� � � .� u
3 5 culture
2 5
2 0
1 5
2 4 6 8
Fe rment a t i on t ime ( days )
1 0
� " � � � � .� ID � � � � rl � .� � ID U � �
Figure 4 . 6 Effec t of interruptions to
aera tion on bioma s s product i on
in fermenter cult ure
2 5
2 0
1 5
1 0
5
Fermentation t ime ( days )
. , contro l , no i n t errup t i ons : Q , n i trogen ga s spa rged into the culture for 2 0 min on days l and 3 ;
. , a g i t a t ion and a e r a t i on of the cu lture suspended f or 2 0 min on days l and 3 ; D , nitrogen gas
spa rged into the culture for 1 2 0 minutes on days 1 and 3 )
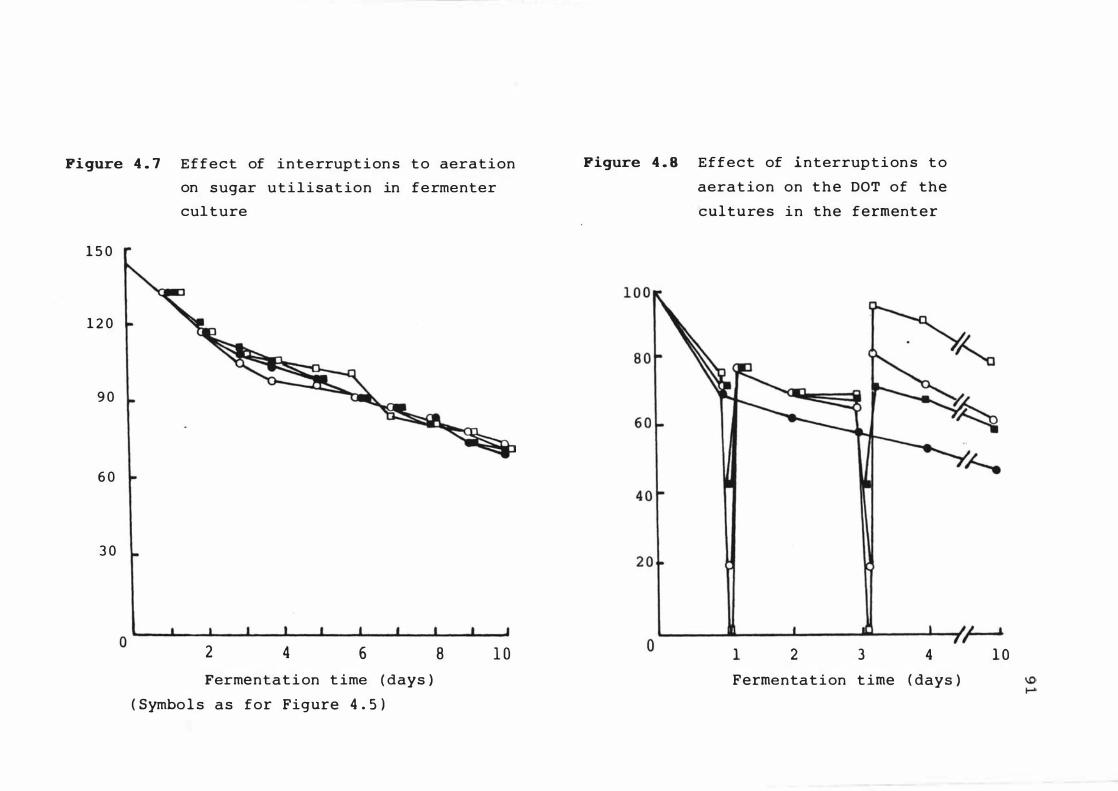
Figure 4 . 7 Effect of inte rrup t i on s t o aeration
on sugar u t i l i sat ion in fermenter
cul ture
1 5 0
1 2 0
9 0
6 0
3 0
o 2 4 6 Fermentat i on t ime ( days )
( Symbo l s a s for Figure 4 . 5 )
8 1 0
Figure 4 . 8 Effect of interrup t i on s t o
aera t ion on t h e DOT of the
cultures in the ferment e r
o �--�----�--------��� 1 2 3 4 1 0 Fermenta t i on t ime ( days )
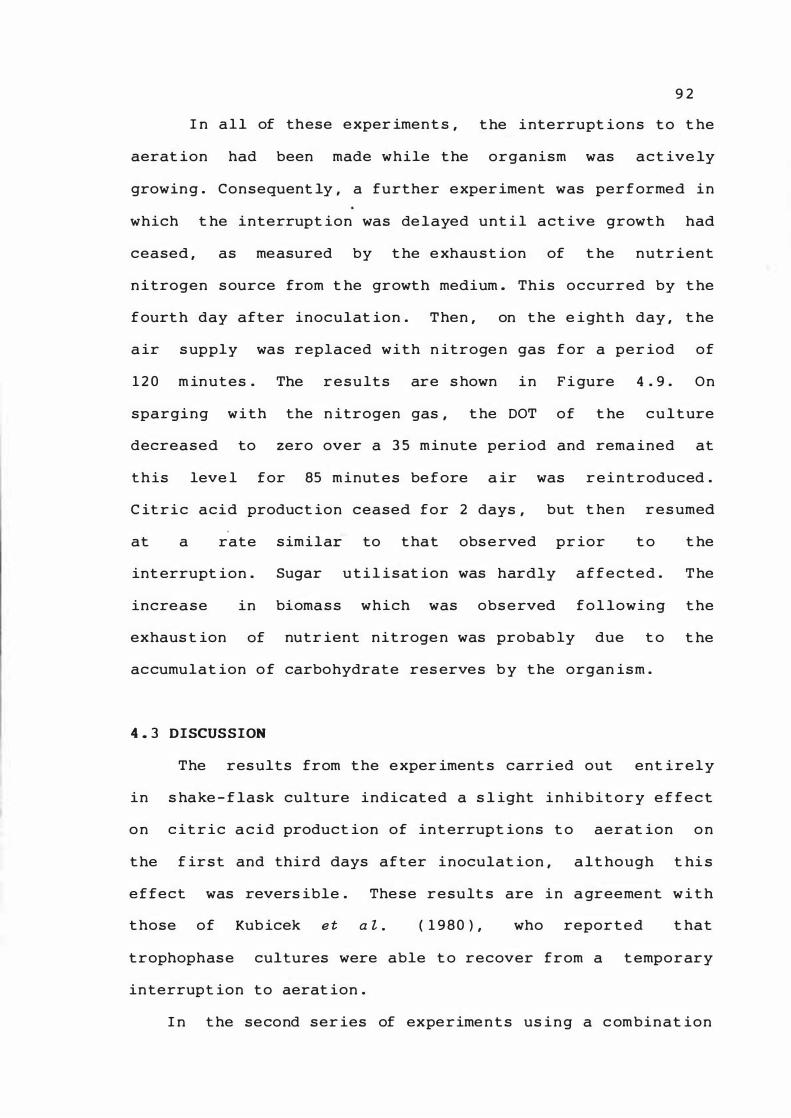
I n all of these e xper iment s ,
aerat ion had been made while t he
9 2
t he interrupt i o n s t o t he
organism was act ive ly
growing . Consequent ly , a further e xper iment was per f ormed in
which t he interrupt ion was de layed unt i l act ive growth had
ceased , as measured by t he e xhau s t ion of t he nutr ient
n itrogen s ource from t he growth medium . This occurred by t he
f ourt h day after inoculat ion . Then , on t he e ight h day , t he
a ir s upply was replaced with n itroge n gas f or a per iod of
1 2 0 m inutes . The r e s u lts are s hown in F i gure 4 . 9 . On
sparging with the n itrogen gas , t he DOT of t he c u l t ure
decreased to zero over a 3 5 minute per iod and rema ined at
t h is leve l for 85 m inut es be f ore a ir was r e i n t roduced .
C it r i c acid product ion ceased for 2 days , but t he n r e s umed
at a rate
int errupt ion .
increase in
exhaus t ion of
simila� to t hat obs e rved pr ior t o
Sugar u t i l i s at ion was hardly a f f e c te d .
bioma s s which was obs erved f o l lowing
nutr ient nitroge n was probab ly due t o
accumulat ion o f carbohydrate res erves b y t he organ ism .
4 . 3 DISCUSSION
t he
T he
t he
t he
The res ults from t he e xper iment s carr ied out ent i r e l y
in s ha ke - f lask culture indicated a s l ight i n h i b i t o r y e f f e c t
o n c it r ic a c i d product ion of int errup t ions t o aer at ion o n
t he f ir s t and third days after inoculat ion , alt hough t hi s
e f fect was revers ible . The s e result s are in a greement w i t h
t hose of Kub icek e t a t . ( 1 9 8 0 ) , who repor t e d t hat
trophophas e cultures were able t o recover from a t emporary
interrupt ion to aerat ion .
I n t he second ser ies of expe r ime n t s us ing a c ombinat ion
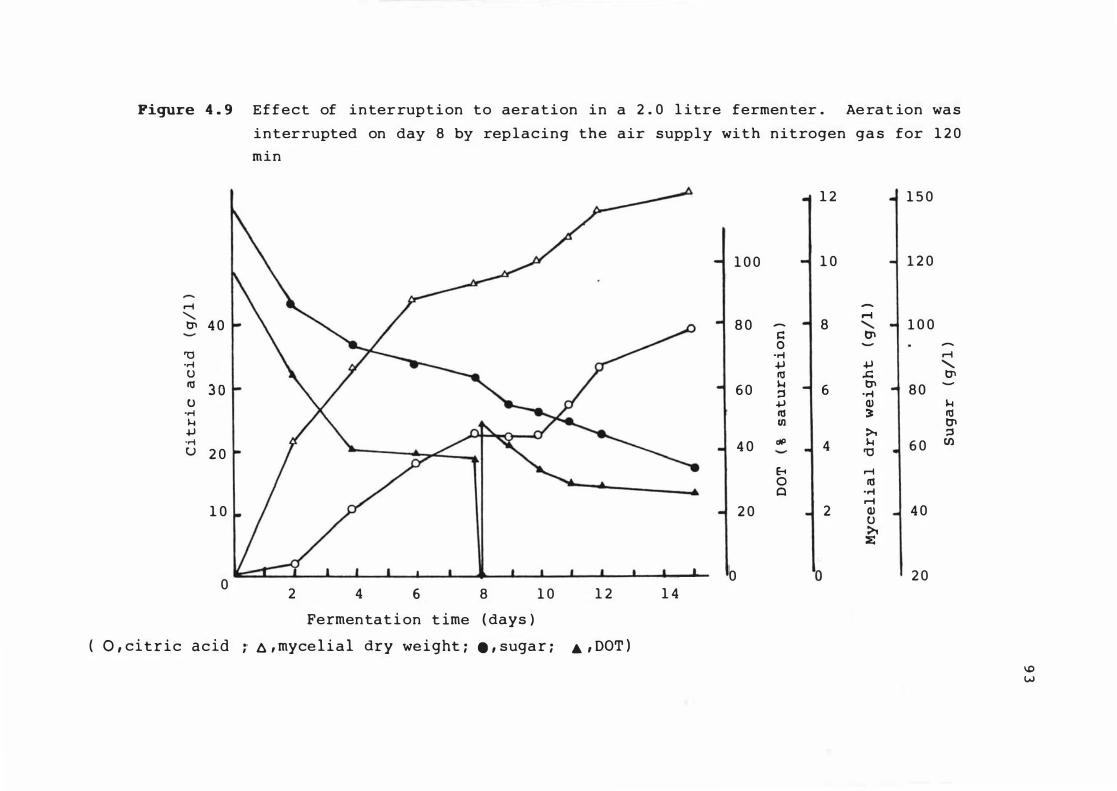
Figure 4 . 9 Effect of i n terrup t i on to aera t i on in a 2 . 0 l itre ferrnenter . Ae ra t ion wa s
i n terrupted on day 8 by rep lacing the air supply wi t h nitrogen ga s for 1 2 0
rnin
1 0 0
r-i .......... '" 4 0 8 0
'0 -r-i U III 3 6 6 0 u
-r-i 1-1 +l -r; u 2 0 4 0
1 0 2 0
0 0
2 4 6 8 1 0 1 2 1 4
Fermentat i on t ime ( days )
( 0 , c i t r i c a c id A , myce l i a l dry we i ght ; . , suga r ; • , DOT )
J::: 0
-r-i +J III 1-1 ::s +J III Ul
rIP
8 0 Cl
0
1 2 1 5 0
1 0 1 2 0
8 ...... .......... 1 0 0 t]\
+J ..c:
6 t]\ 8 0 -r-i Q) �
>t
4 1-1 6 0 '0 r-i III
-r-i ......
2 Q) 4 0 u >t :t:
2 0
...... .......... t]\
1-1 III t]\ ::l Cl)
\0 w
of fermenter and s hake - f las k culture ,
9 4
t he e f fe c t s o f
interrup t ions dur i n g bot h trophophase and idiophas e were
inve s t igated . Sl ight .inhibit ory e f fe c t s on c it r ic a c i d
product ion occurred dur ing trophophase , but were qu i ckly
overcome . However , during id iophas e , no e f fect was obs erved .
T hese res u lts appear to contradict t hose o f Kubicek e t at .
( 1 9 8 0 ) , who repor t e d t hat id iophase cul tures f a i le d t o
recover from temporary interrupt ions t o t he a ir s up p l y .
S ince interrupt ions t o t he a ir supp ly dire c t ly a f fe c t t he
DOT o f t he culture , e xper ime n t s were per formed e n t ir e l y i n
fermenter culture , s o t hat t he DOT could be mon i t ored
cont inuous ly . In t he e xper iments where t he interrupt io n
per iods w.ere o f ' 2'0 minut es durat ion , t he DOT n ever fe l l
be low 2 0 % o f sat urat ion . This i s above t he crit ica l DOT
va lue of 12 to 1 3 % o f s aturat ion report e d by Kub icek e t at .
( 1 9 8 0 ) , s o the lack of any gros s e f fect of t he interrup t ions
on citric acid product ion can be exp lained on t his b a s is .
S imilar resu lts have been report ed for pe n i c i l lin produc t ion
( Varder and L illy , 1 9 82· ) . I n contras t , when t he a ir s upp l y
t o t he fermentation was int errupted f or 12Q minut e s , t he DOT
va lue decreased to z ero and was ma int ained at t hat leve l for
85 minutes . I n t h i s case , myce lial growt h a nd c i t r i c a c i d
product ion , but n o t sugar ut i l isat ion , cease d . This was n o t
a permanent effect a n d b o t h b iomass product io n and c i tr i c
a c i d produc t ion rates eve ntua lly recovered t o equa l t h a t o f
t he control cult ure , a lbeit with a reduced produc t y i e ld .
Thus , bot h trophophas e and idiophas e c u lt ures c a n r e cover
after a period of 85 minutes at a DOT va lue of z e r o
9 5
s at urat ion . For t he exper iment involv i n g a comb i n a t i o n o f
s hake - f las k and fermenter culture , i t mus t be as s umed , t hat
the c r i t ical DOT value was not reached . T h i s was probably a .
re f lect ion of the met hodology used in t hat the d i s s o lved
oxygen was not complete ly removed from the myc e l i a l p e l le t s .
Hence , a temporary i n t errupt ion to the air s upp ly p er s e i s
not a s important a s t he value to which t he DOT d e c r e as es ,
and t he rate of decrease will depend on t he oxyge n demand o f
the culture . Thus , i n t he event of a t emporary i n t er r upt ion
to t he a ir s upply dur ing a f erment ation , a t t en t i o n t o t he
DOT value w i l l indicate whether any inhib i t ory e f f e c t is
l ikely to occur . I f the DOT remains above t he c r i t i ca l
value , no real effect w i l l be apparent . However , be l ow this
value , product ion will be inhibited f or s ome c on s i de rab le
t ime , although s ubsequent re covery can occur . S in c e s ugar
ut i l i s at ion conti nues during the interrup t ion , r educed
product yie lds can be expected . The fate of t he s ugar d ur in g
this t ime is unknown .
4 . 4 C ONC LUS IONS
The ma in conc lus ion that can be drawn f r om t h i s s er ie s
of e xper ime n t s i s that i f the air s upply t o a c i t r i c acid-
produc ing culture is int errupted s o that t he D OT value f a l l s
t o z ero , inhibit ion of citr i c acid produc t i o n w i l l o ccur .
However , both trophophas e and idiophase c u l t ures c a n r e cover
even after a per iod of 8 5 minutes at a DOT value o f z ero .
Nonethe les s , there w i l l be a s i gn i f icant l a g per io d b e twe e n
re connect ion of the a ir supply and the obs e rved re covery .
Furt hermore ,
9 6
product yie lds wil l be depres sed d u e t o
cont i nued s ugar ut i l is at ion dur ing t he interrup t ion .
I n terrupt ions t o aerat ion that do not reduce t h e DOT
va lue to les s t han t he cr it ical DOT va lue ( 1 2 t o 1 3 % o f
saturat ion ) for c i tr ic acid product ion , w i l l have n o gro s s
ef fect o n t he cult ure . Thus , dur ing an e qu ipme nt bre a kdown ,
which i s the cause of mos t int errupt ions to aerat i on i n
pract ice , attent ion t o t he DOT value wi l l indicate w he t he r
any inhibitory e f fect s hould be expe cted .
9 7
CHAPTER 5
THE E FFECT OF DIFFERENT NUTRIENT L IM I TATIONS ON
CITRIC ACI D P�ODUCTION IN BATCH CULTURE
5 . 1 INTRODUCTION
I t is ge nera l l y rec ogn ised that t o a c hieve high c it r ic
ac id produc t ion rat e s and yie lds , a nut r ie n t other t ha n t he
sugar source s hou ld be exhausted from t he med ium a f t e r t he
at t a inme n t of suff ic ient b i omas s , s o t ha t t he rema i n i n g
sugar i s t hen convert ed to c it r ic a c i d . Most l it e r at ure
reports refer to t he nutrient n i t rogen as the l imi t in g
sub s t rate and very few data have been pub l is hed on l im i t i n g
bioma s s growt h with any other nutrients . Repor t s ex i s t us i n g
pho s phate a s the l im it ing nut r ient ( Shu a n d Johns on , 1 9 4 8 ;
Berry e t a l . , 1 9 7 7 ; Krist iansen e t a l , . 1 9 8 2 ; Jerne j c e t
a l , . 1 9 8 2 ) but no reports have been pub l i s hed in whi c h a n y
other nutrient was de l iberat e ly examined a s t he l im i t i n g
fac t or . The purpose of this sect ion w a s t o examine c i t r i c
ac id product ion and as s oc iated parame te r s , under t he
fol lowing nutrient l imitat ions : n i t r o ge n , pho s p hat e ,
s u lphate , magnes ium , iron , copper and z in c .
5 . 2 L IMITATION OF TRACE METALS
These exper ime n t s were performed in s ha ke - f l a s k c u lt ure
us ing the medium of Kr is t iansen and C har l e y ( 1 9 8 1 ) ( Table
3 . 2 ) mod i f ied as fol lows . N it roge n - l im it e d c u l t ures u s i n g
( NH 4 ) 2S0 4 ( 1 . 0 g / l ) a s the ni trogen s ource were emp loyed a s
controls . For the t race me t al l imit a t ions the ( NH 4 '2 so 4
concentrat ion was a l s o 1 . 0 g / l , whi le two concentrat i o n s of
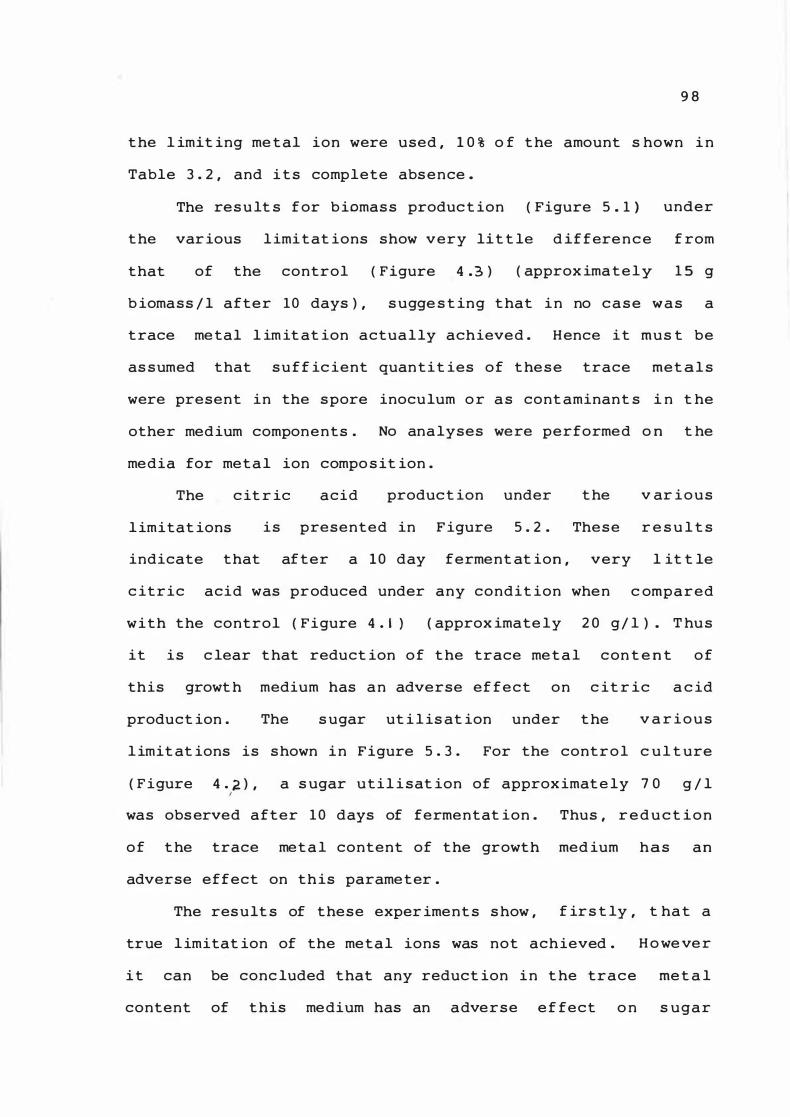
9 8
t he l imit ing me t al ion were used , 1 0 % o f t he amount s hown i n
Table 3 . 2 , and i t s complete abs ence .
The res u lt s f or b iomas s produc t ion ( Figure 5 . 1 ) under
t he var ious l imi t at ions show very lit t le d if fere n c e f rom
that of the control ( Figure 4 . 3 ) ( approx ima t e l y 1 5 g
b iomass / l after 10 days ) , s ugge s t ing t hat i n no c a s e w a s a
t race me tal l im it at ion actually achieved . Hence i t mus t be
as sumed that s u f f ic ient quan t i t ies of t he s e trace met al s
were present in the s pore inoculum o r a s cont aminant s i n t he
other med ium components . No ana lyses were performed o n t he
media for met a l ion compo s it ion .
The c it r ic acid produc t ion under t he v ar i o u s
l imitat ion9 is presented in F igure 5 . 2 . The s e r e s u l t s
indicate that af ter a 1 0 day ferment at ion , very l it t le
c itric acid was produced under any condit ion when c ompared
with the control ( Figure 4 . 1 ) ( approx imate ly 2 0 g / l ) . T hu s
it is c lear t hat reduct ion o f t he trace me t a l c on t e n t o f
this growt h medium has a n adverse ef f e c t on c it r ic a c id
product ion . The s ugar ut i l is at ion under t he v a r i o u s
l imit at ions is s hown i n Figure 5 . 3 . For the contr o l c u l t ure
( F igure 4 . � ) , a s ugar u t i l i sat ion of approx imat e ly 7 0 g / l I
was obs erved after 1 0 days of fermentat ion . Thus , r e d u c t i o n
o f t he trace met a l content of the growth med ium has an
adverse effect on this parame ter .
The res ult s of these exper iment s s how , f ir s t ly , t ha t a
true l imitat ion of the met a l ions was not achieved . H o we ve r
i t can be conc luded that any reduct ion i n t he trace me t a l
content of t his medium has an adverse e f fect o n s ug a r
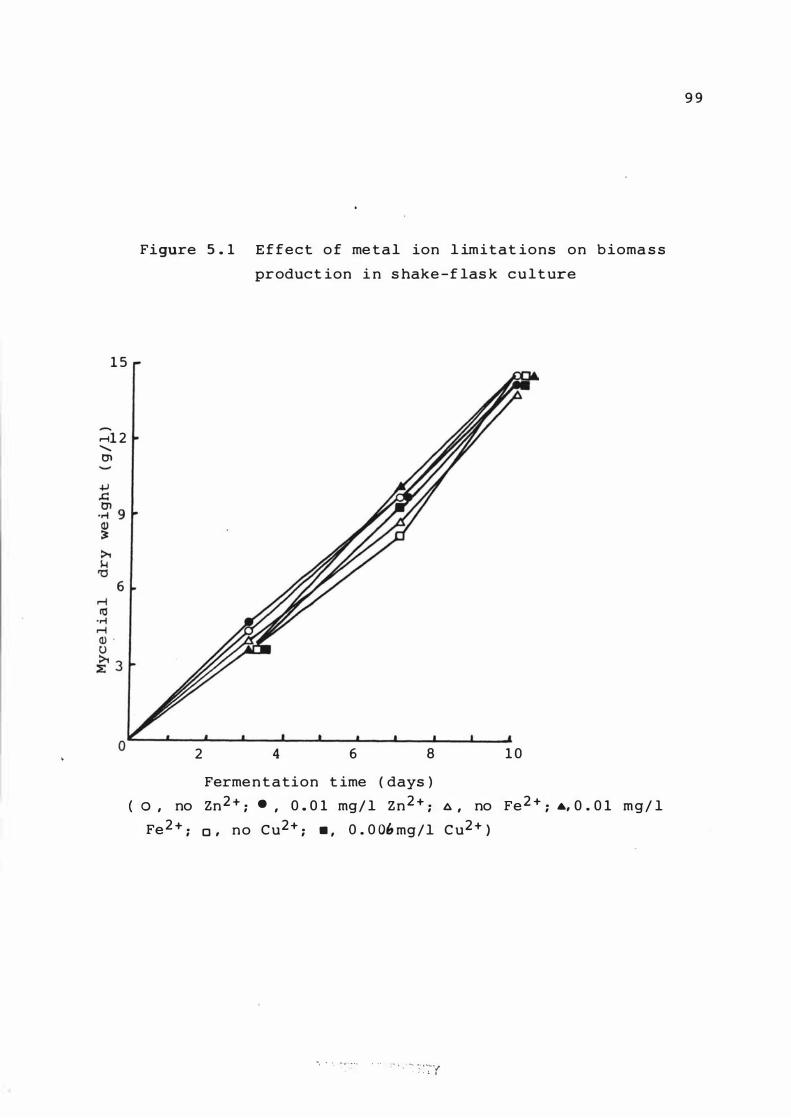
1 5
-..-i1 2 '-0'1
Figure 5 . 1 E f fect o f me t a l ion l imitat ions on b ioma s s
product ion i n s hake -f las k c u l t ure
2 4 6 8 1 0
Ferme n t ation t ime ( days )
0 , no Zn 2 + ; . , 0 . 0 1 mg/ l Zn 2 + ; A , no Fe 2 + ; ., 0 . 0 1 mg / l
Fe 2 + ; 0 , no C u2 + ; . , O . O Oh mg / l C u2 + }
", . " - , ... . .. ; . . : - -' : :'Y
9 9
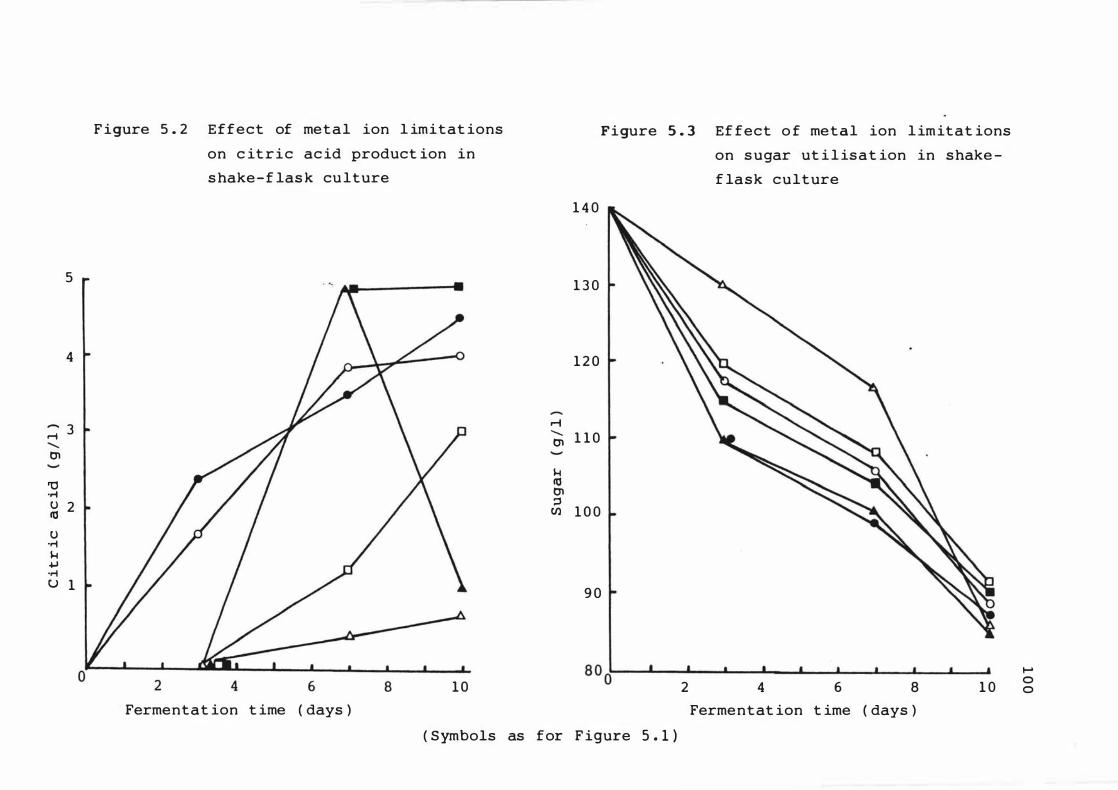
5
4
- 3 r-i ...... Cl
'0 °rl U 2 10 U °rl H +J °rl U 1
F igure 5 . 2 Effect of metal ion l imitat ions
on c it r i c ac id product ion in
s hake - f las k cu lture
1 0
Fermentat ion t ime ( days )
r-I ...... Cl
H 10 Cl ::3
Ul
1 4 0
1 3 0
1 2 0
1 1 0
1 0 0
9 0
Figure 5 . 3 Ef fect o f met.al ion l im itat ions
on s ugar ut i l is a t ion in s hake
f lask culture
8 0 0����--�--�--L-�---L--�--L-� 2 4 6 8 1 0
Fermentat ion t ime ( days )
( Symbols as for F igure 5 . 1 )
I-' o o
1 0 1
ut i l is at ion and c i t r ic acid product ion . O n th is bas is
t here fore , it was n ot cons idered worthwhi le to conduct
further exper iments to achieve true limitat ion .
5 . 3 LIMITATION OF NUTRIENT NITROGEN , PHOSPHATE , SULPHATE AND
MAGNESIUM AT LOW LEVELS OF BIOMASS
The s e experiment s were performed in fermenter cult ure
as de s cr ibed in sect ion 3 . 5 . 3 . The concentrat ion of the
l imiting nutrient was set s o t hat a biomas s concentrat ion of
approx imat ely 1 5 g/ l was achieved in each exper iment ,
a l lowing the maintenance of a high DOT value , while the
agitat ion rate was kept at 2 0 0 rpm to min imise the effect of
s hear forces . The aerat ion rate was s u f f i c ient ly low ( 0 . 5
vvm ) s o as to minim i s e t he error involved in e f f lue nt gas
analyses ( Brooks et a � , . 1 9 8 2 ) . For the var ious l im it a t i ons ,
t he medium des cr ibed in Table 3 . 2 was mod i f ied as shown in
Tab le 5 . 1 . The l imit ing nutr ient c oncent rat ions were
n i trogen ( 0 . 2 1 g I l l , phosphorous ( 0 . 0 7 0 g / l expre s s ed as
phosphate ) , s ulphur ( 0 . 0 7 3 g/ l expressed as s u lphate ) , and
magnes ium ( 0 . 0 0 2 gI l l .
5 . 3 . 1 Time Course of Fermentat ions
F i gure 5 . 4 dep i c t s t he fermentat ion under nit rogen -
l im ited condit ions , and s hows t hat n itrogen was exhaus ted by
day 4 . The phosphate concen trat ion at this t ime was 9 70
mg/ l and no furt her upt ake occurred during t he rema inder of
t he ferment at ion . 2 -
The ver� low concentrat ions of 504 and
Mg 2 + requ ired for t he s e two ions to be growt h l imit ing
nutrients ( see be low ) were s uch that the ir ut i l i s at ion could
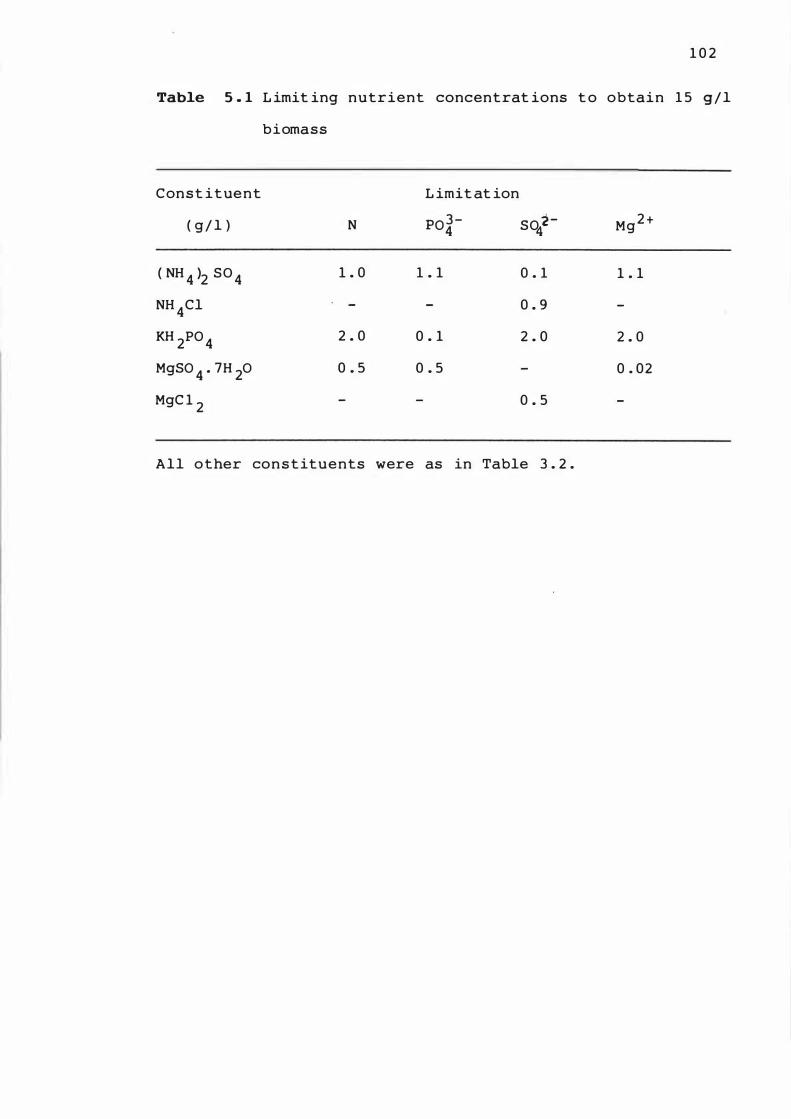
1 0 2
Table 5 . 1 L imit ing nutrient concentrat ions t o obtain 1 5 g / l
biomass
Const ituent L imit at ion
( g / l ) N p0 3 -4 S0 2-
� Mg 2 +
( NH 4 }2 SO 4 1 . 0 1 . 1 0 . 1 1 . 1
NH 4Cl 0 . 9
KH 2P0 4 2 . 0 0 . 1 2 . 0 2 . 0
MgS0 4 • 7H 20 0 . 5 0 . 5 0 . 02
MgC 1 2 0 . 5
All other con s t ituents were as in Table 3 . 2 .
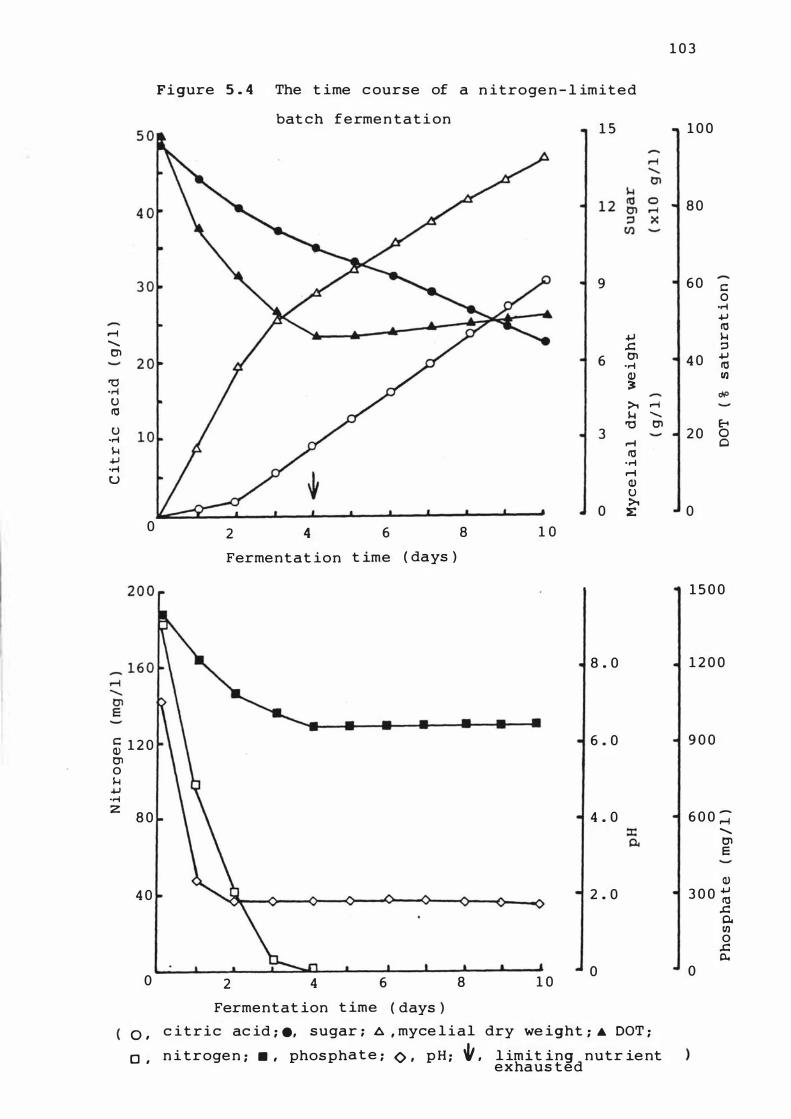
r-i -0'1
'0 .� U 10
U .� 1-1 +J .� U
0
� 1 2 0 tn o 1-1 +J .�
Z 8 0
4 0
o
0 , 0 ,
Figure 5 . 4 The t ime c ourse of a n itroge n - l im i t e d
bat ch f e rme n tat i on 1 5
9
+J .c 6 0'1
.� Cl) �
>. r-1 1-1 -
'0 tn 3
r-1 10
.� r-i Cl) U
0 >.
1: 2 4 6 8 1 0
Fermentat ion t ime ( days )
8 . 0
6 . 0
4 . 0
2 . 0
2 4 6 8 1 0 o
Fermentat ion t ime ( days )
c i t r ic ac id ; ., sugar ; 6 , myce l ial dry we ight ; . DOT ;
n i troge n ; . , phos pha t e ; 0 , p H ; � , l imit ing nutr ie nt exhaus ted
1 0 3
1 0 0
8 0
6 0 c 0
.� +J 10 1-1 ::s
4 0 +J 10 11)
<JP
E-< 2 0 0
Cl
0
1 5 0 0
1 2 0 0
9 0 0
6 0 0 � -tn E
Cl)
3 0 0 +J 10
o
.c 0. 11) o .c 0..
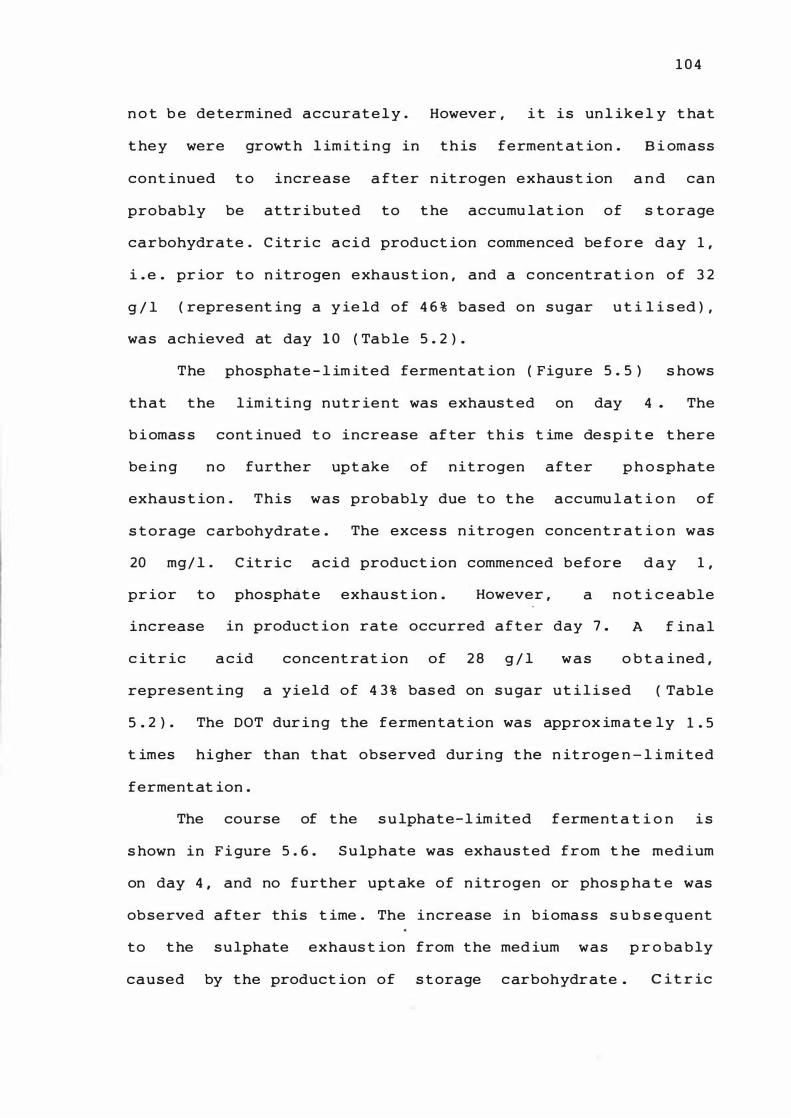
1 0 4
n o t b e de termined accurat e l y . However , i t is un l ik e l y t hat
t he y were growt h l im i t i n g in this ferment at ion . B i omass
cont inued t o increase a fter n it rogen exhaus t ion a n d can
probably be attr ibute d to t he accumu lat ion of s t o rage
carbohydrate . C it r i c a c i d product ion commenced be f o r e d a y 1 ,
i . e . pr ior t o n itrogen exhaus t ion , and a c oncentrat i o n o f 3 2
g / l ( repres ent ing a y ie ld of 4 6 % based on sugar u t i l i s ed ) ,
was achieved at day 1 0 ( Tab le 5 . 2 ) .
The phosphate - l im ited ferment at ion ( Figure 5 . 5 ) s hows
that the limiting nut r ie n t was exhaus t ed on day 4 . The
b i omas s cont inued t o increase af ter t h i s t ime de s p i t e t here
be i n g n o further upt ake of nitrogen after p h o sphate
exhaus t ion . This was probably due t o t he accumu l a t i o n of
s t orage c arbohydrate . The exce s s n i t rogen concent r a t i o n was
20 mg/ l . C it r i c acid product ion commenced before d a y 1 ,
pr ior to phosphat e exhau s t ion . However , a n o t i c e able
increase in product ion rate occurred a f t e r day 7 . A f in a l
c it r ic a c id concent rat ion of 2 8 g / l w a s o b t a ined ,
represent ing a yield of 4 3 % bas ed on s u gar ut i l i s e d ( Table
5 . 2 ) . The DOT dur ing t he fermen tat ion was approx ima t e ly 1 . 5
t imes higher than t hat observed dur ing t he n it roge n - l i m ited
ferment at ion .
The course of t he s u lphate-l im ited f erment a t i o n i s
s hown in F i gure 5 . 6 . S u lphate was exhaus ted from t he medium
on day 4 , and no further upt ake of n itrogen or phos p ha t e was
observed after this t ime . The increase in bioma s s s u b s e quent
to t he s u lphate exhaus t ion from the med ium was p r o ba b ly
caused by the product ion of s t orage c arbohydrate . C i t r ic
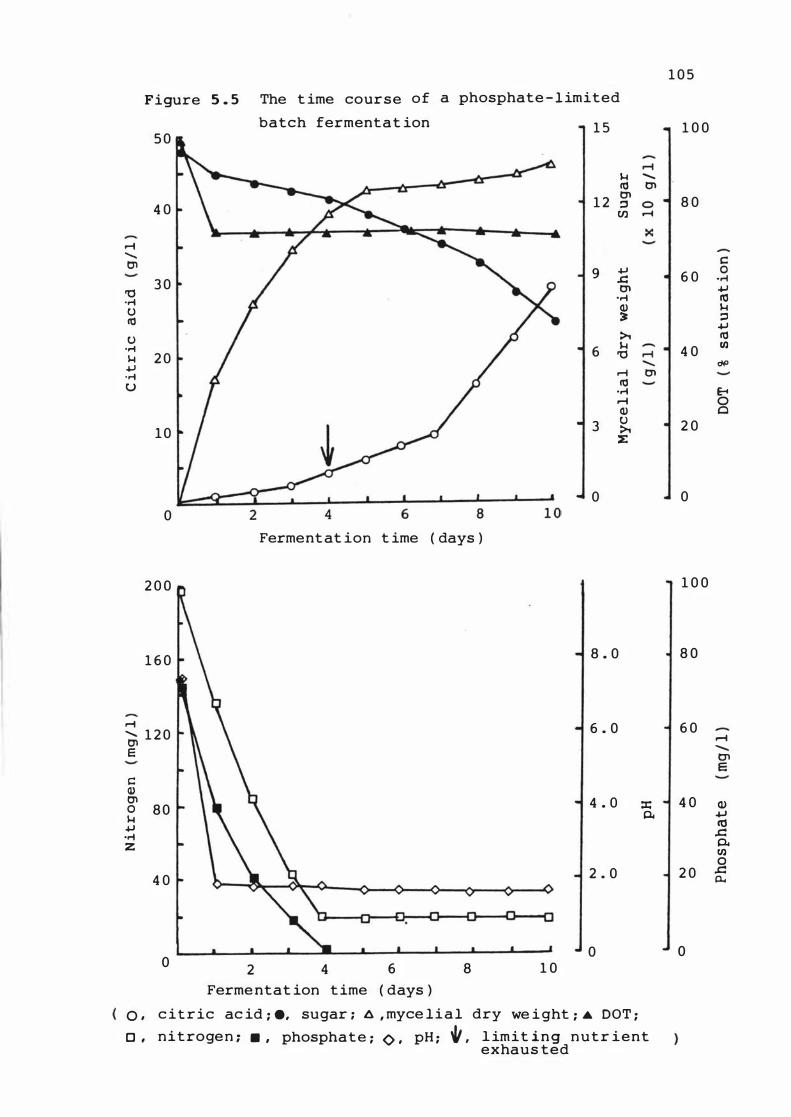
Figure 5 . 5 The t ime course of a phosphate - l imited
batch fermentat ion 1 5 5 0
r-i � ........ Il3 tn
1 2 tn
4 0 :::3 0 CIl r-i
>< ...-t ........ tn
9 +-' 3 0 .a tn '0 .... .... Q) u � Il3
U � .... 6 � � 2 0 '0 r-i ........ +-' ...-t tn .... U Il3 ....
r-i Q)
3 u
1 0 � :E
o o
Fermentat ion t ime ( days )
2 0 0
1 6 0 8 . 0
...-t 6 . 0 ...... 1 2 0 Cl e
c: Q) Cl 4 . 0 :z:: 0 8 0 c. � +-' ....
z
4 0 2 . 0
o o 2 4 6 8 1 0
Ferme ntat ion t ime ( days )
0 , c it r ic ac id ; ., sugar ; A , myce l i a l dry we i ght ; .6- DOT ;
0 , nitrogen ; . , phosphate ; 0 , pH ; � , l imit i n g n u t r ient exhaus ted
1 0 5
1 0 0
8 0
c: 0 6 0 ....
+-' Il3 � :::3 +-' Il3
4 0 U) <JP
Eo! 0 Cl
2 0
o
1 0 0
8 0
6 0 r-i ........ Cl e
4 0 Q) +.I ctJ
.c: 0-en 0
2 0 .c: 0.
o
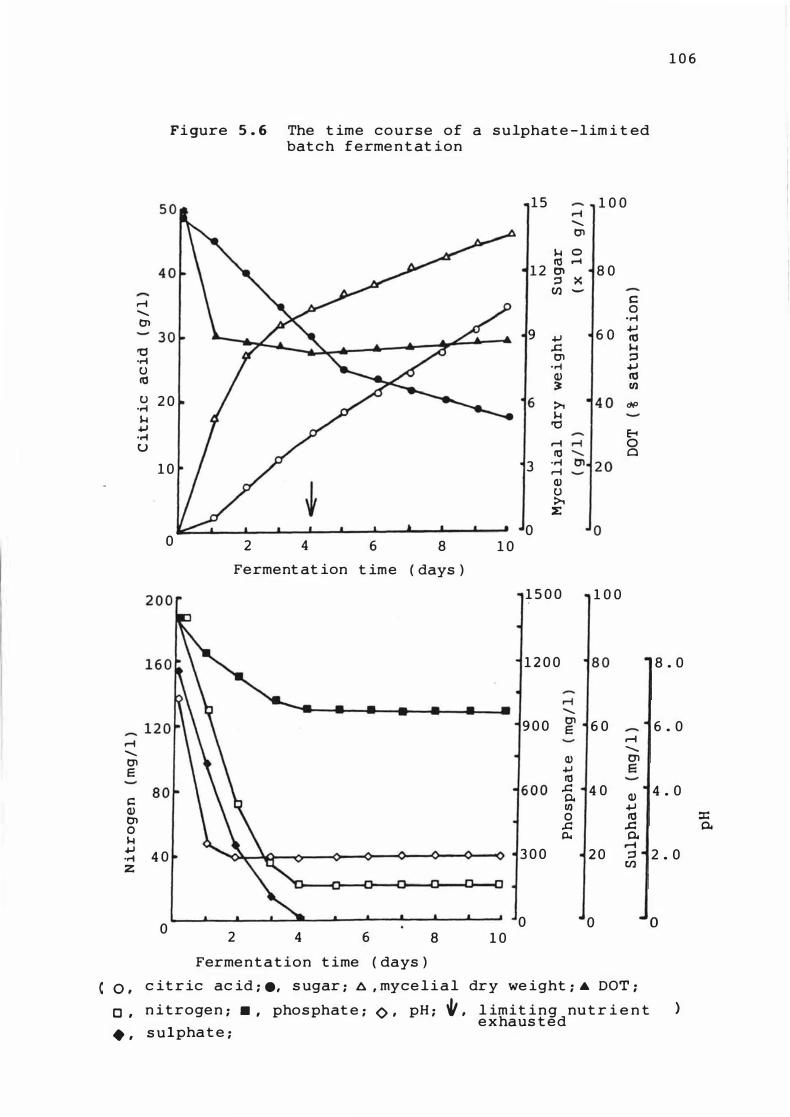
r-I -Cl
'(j .� U "' u
.,-i 14 .....
.,-i U
r-I -Cl E
� Q) Cl 0 14 ..... .,-i
z
o . o . • •
Figure 5 . 6 The t ime course of a s u lphate - l im i t ed batc h f erme n t at ion
1 5 1 0 0 .-i -Cl
14 0
1 2 � .-I 8 0 ::3 X Ul - C
0 .� 9 6 0 .j.J
+J "' -'= � Cl ::3
.,-i .j.J Q) "' � Ul
2 0 ;>, <JP 14
'(j E-4 r-I .-I 0 It3 Cl
1 0 3 .,-i r-I
� Q) u ;>,
:E 0
0 2 4 6 8 1 0
Ferment at ion t ime ( days )
1 5 0 0 1 0 0
1 2 0 0
.-I -9 0 0 Cl 6 0 E -...... -
Q) 0'1 +J E It3
-'= 4 0 Po Q) U) .j.J 0 "'
-'= ;::: p.. � ......
4 0 3 0 0 2 0 ::3 Ul
o o o 2 4 6 8 1 0
Ferme n t a t ion t ime ( days )
1 0 6
8 . 0
6 . 0
4 . 0
2 . 0
o
c it r ic ac id ; ., s ugar ; A , myce l i a l dry we ight ; ... DOT ;
n itroge n ; • • phos phat e ; 0 , pH ; � . l imit i n g nu t r i e n t
1 h e x haus t e d
) s u p a t e ;
:I: �
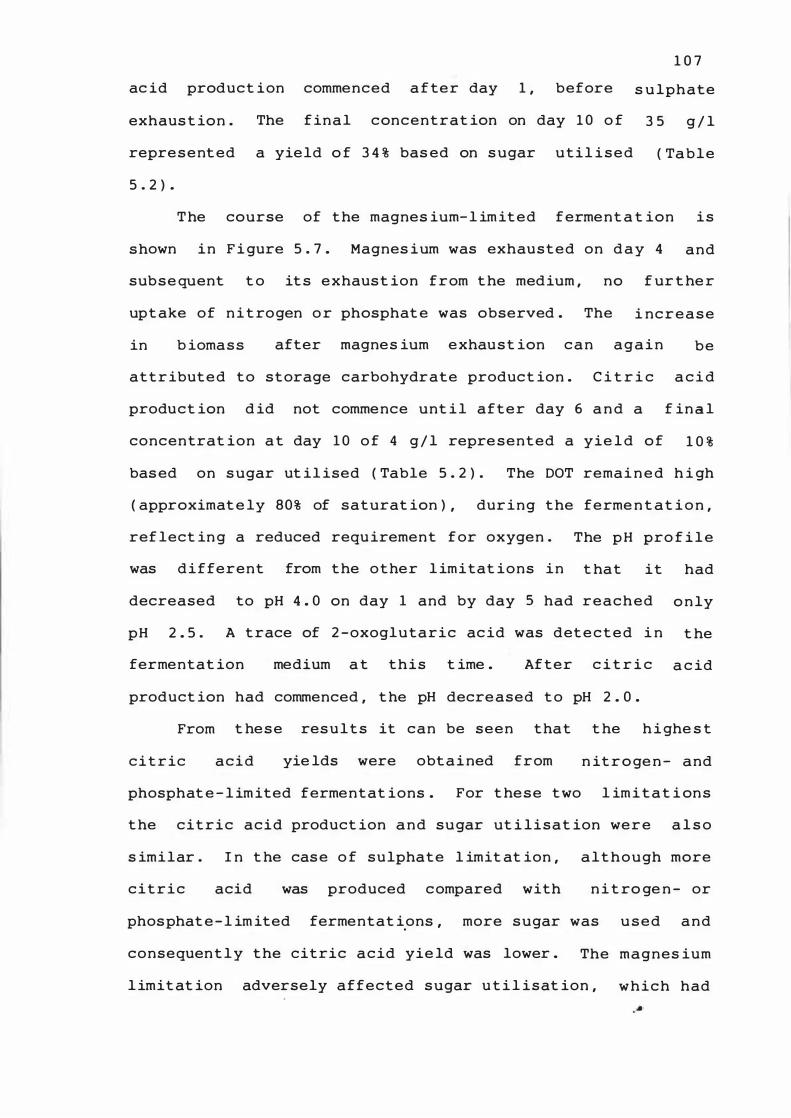
ac id product ion commenced a f ter day 1 , before
exhaus t ion . The f in a l concentrat ion on day 1 0 o f
repre s ent ed a yield o f 3 4 % bas ed on s ugar util i s e d
1 0 7
s u lphate
5 . 2 ) •
3 5 g / l
( Ta b l e
T he course of the magnes ium- l im it e d f erme n t a t ion i s
s hown in F i gure 5 . 7 . Magnes ium was exhausted on d a y 4 and
subse quent t o it s exhaust ion f r om t he medium , no f ur t he r
upt ake of n i t rogen o r phosphat e was observed . The i nc r e a s e
in b ioma s s after magnes ium exhaus t ion c a n a g a i n be
attr ibute d to storage carbohydrate product ion . C i t r i c a c i d
product ion d id not commence unt i l after day 6 a n d a f in a l
concentrat ion a t day 1 0 o f 4 g / l repre sented a yie l d o f 1 0 %
bas ed on s ugar ut il ised ( Table 5 . 2 ) . The DOT remai n e d h i gh
( approximat e ly 80% of saturat ion ) , dur ing the ferme n t at i o n ,
ref lect in g a reduced requ irement f or oxygen .
was d i f ferent from the other l imitat ions in
The p H pro f i l e
t hat it had
decreased to pH 4 . 0 on day 1 and by day $ had reached
pH 2 . 5 . A t race of 2 -oxoglutaric ac id was det e c t e d i n
fermentat ion medium a t this t ime . Af ter c i t r i c
o n ly
t he
a c id
product ion had commenced , t he pH decre ased t o pH 2 . 0 .
From t he s e res u l t s it can be seen that t he h i ghe s t
c i t r ic a c i d yie lds were obt a i ned from n it r o ge n - and
phosphat e - l im ited fermentat ions . For t he s e t wo l im i t a t i on s
t he citric acid product ion a n d sugar ut i l i s a t ion wer e a l s o
s imilar . I n t he cas e o f sulphate l imit at ion , a l t hough more
c i t r i c acid was produced c ompared with n i t ro ge n - or
phosphat e - l im ited fermentat i.ons , more sugar was u s e d a n d
consequen t l y the citric a c id yie ld was lower . The magnes ium
l imit at ion adversely affected sugar u t i l i s at ion , which had
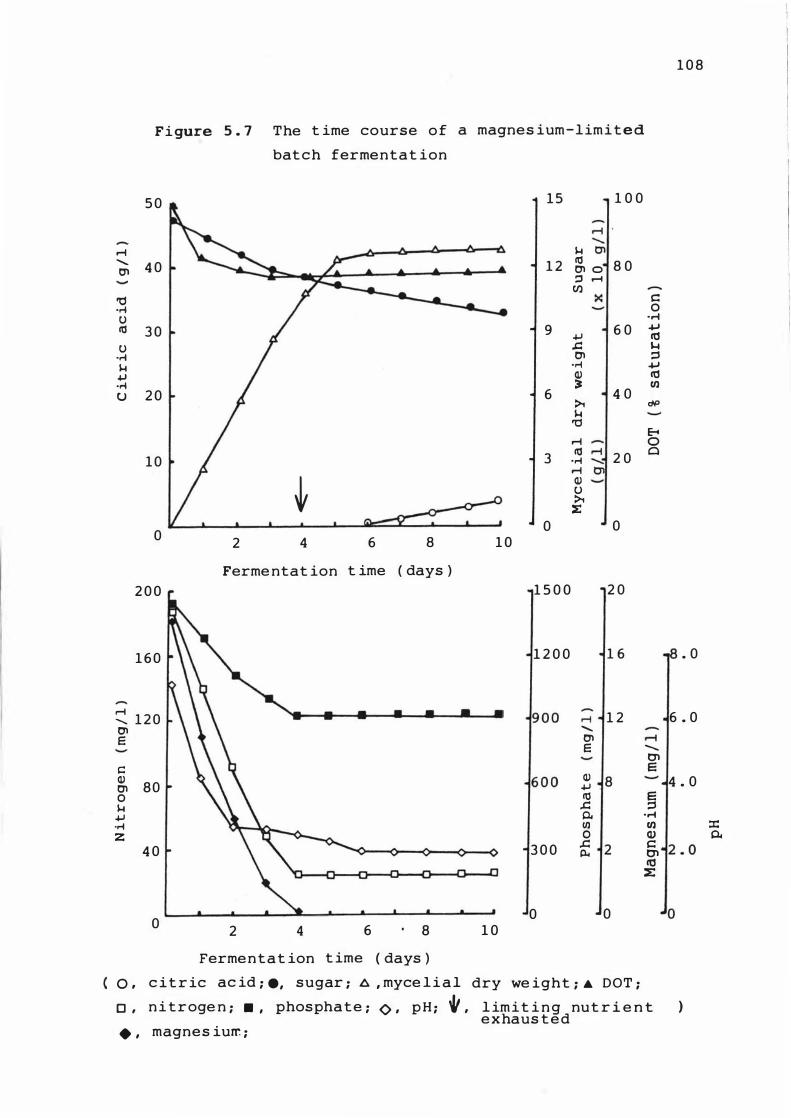
1 0 8
Figur:e 5 . 7 The t ime course o f a magnes ium-lim i t e d
bat c h fermentat ion
5 0 1 5 1 0 0
M � ...... 4 0 1 2 � 8 0 0'1 0'1 0
::J ...... Cl)
x C '1j 0 ·ri ..... U � 3 0 9 6 0 +J
+J 10 .c: � U
·ri 0'1 � ·ri +J � Q) 10 +J
·ri :J Ul
() 2 0 6 4 0 � dP �
'1j E-4
M 0
3 � ...... 2 0 0
1 0 ·ri -......: M 0'1
� Q) u �
::E
0 0 0 2 4 6 8 1 0
Ferme ntat ion t ime ( days )
2 0 0 1 5 0 0 2 0
1 6 0 1 2 0 0 1 6 . 0
� 1 2 0 M 1 2 6 . 0 ...... 0'1
E 0'1 r-i E ........
0'1 e c:
Q) Q) 8 4 . 0 0'1 80 +J 0 � e � .c: � +J 0.. ..... ·ri Ul Ul ::c
0 Q) 0.. z
4 0 3 0 0 .c: 2 c p.. 0'1 10 ::E
0 0 0 2 4 6 8 1 0
Ferme n t a t ion t ime ( days )
0 , c it r ic ac id ; ., sugar ; 6 , myce l i a l dry we ight ; . DOT ;
D , n i t r oge n ; . , phospha t e ; 0 , p H ; " , l im i t i n g nut r i e n t ) e x haus t e d
. , magnes iurr. ;
1 0 9
Table 5 . 2 Summary of d i f feren t nutr ient - l im i t e d
ferment a t i o n s a t low b i omas s leve ls
L imit in g Biomass Sugar used C it r i c Acid C i t r i c Ac i d
nutrient ( g/l ) ( g / l ) ( g / l ) Y ie l d ( % )
N 14 70 3 2 4 6
P0 3 -4 14 6 5 2 8 4 3
SO 2,.-4 14 1 0 6 3 5 3 4
Mg 2 + 14 3 8 4 1 0
Res u l t s are e xpressed after 1 0 days of f erme n t at ion .
There was no res idua l l im i t ing nutr ient rema i n ing i n t he
fermentat ion l i quor after day 4 .
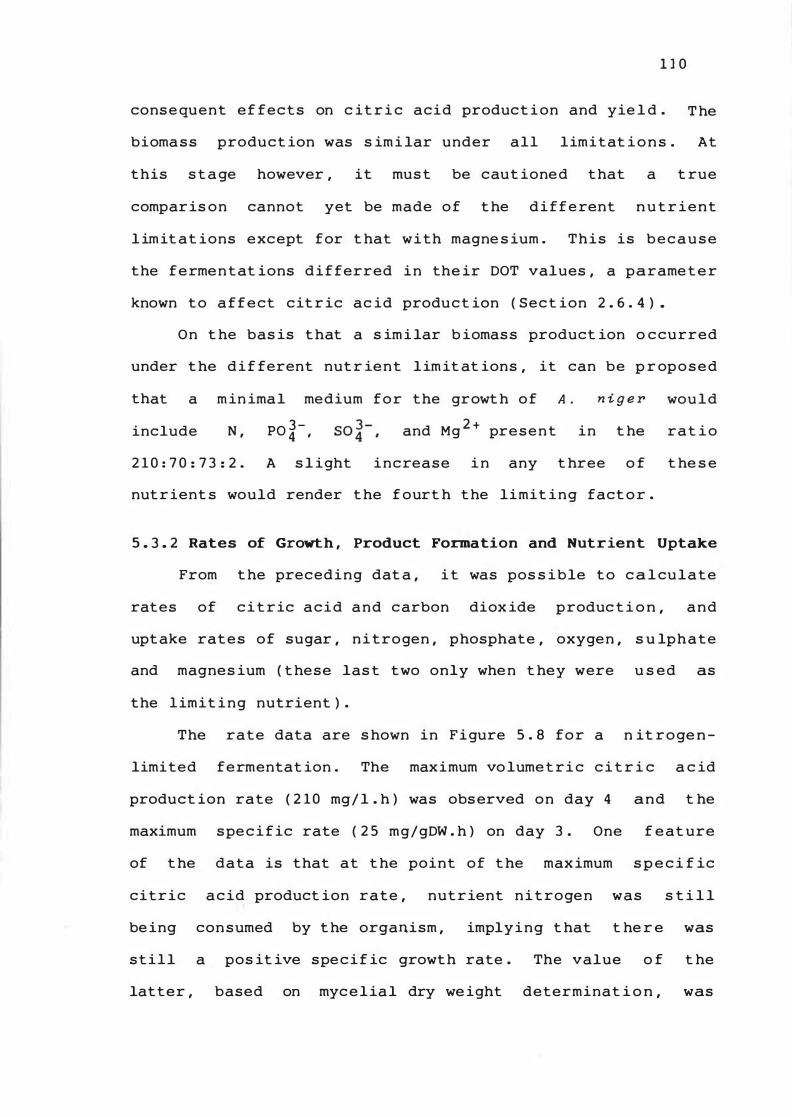
1 1 0
cons e quent e f f e c t s on c it r i c acid product i on and yie l d . T he
bioma s s product ion was s im i lar under all limitat i o n s . At
t his s t a ge however , it mus t be caut ione d t hat a t rue
compar is on cannot yet be made o f t he d i ff e rent n u t r ient
l im it at ions except for t hat with magne s ium . This is b e c a u s e
the f e rme n t at ions d i f ferred in the ir DOT values , a parame t e r
known t o a f f e ct cit r ic ac id produ c t ion ( Se c t ion 2 . 6 . 4 ) .
On t he bas is t hat a s im i lar b iomas s product ion o c curred
under t he d i f ferent nut r ie n t lim it at ions , it can be p r op o s e d
that a m in imal medium for the growt h o f A . n i g e r wou l d
include N , P0 3 -4 ' and Mg 2 + pre s e n t in t he r a t i o
2 1 0 : 7 0 : 7 3 : 2 . A s l ight increase i n any t hree o f t he s e
nut r ient s would render t he f ourt h t he limit i n g fact o r .
5 . 3 . 2 Rates of Growth , Product Formation and Nutrient Uptake
From t he preceding dat a , i t was pos s ible t o c a l cu l a t e
rates of c i t r ic a c i d a n d c arbon diox ide produc t i o n , a n d
upt ake rat e s o f sugar , n i t r o gen , phosphate , oxyge n , s u lp h a t e
and magnes ium ( t hese las t t wo only whe n t hey were u s ed as
the l imit i n g nutrient ) .
The rate data are s hown in F i gure 5 . 8 for a n it r o ge n -
limited fermentat ion . The maximum vo lume t r i c c i t r i c a c id
product ion rate ( 2 1 0 mg/ l . h ) was obs erved on day 4 and t he
maximum s pe c i f ic rate ( 2 5 m g / gDW . h ) on day 3 . One f e at ure
of t he data is that at t he point of t he max imum s p e c i f ic
citric a c id product ion r a t e , nut r ient n i t roge n was s t i l l
be ing con sumed by t he organism , imply i n g t hat t he r e was
s t i l l a pos it ive spe c i f ic growt h rate . The value o f t he
latter , based on myc e l ia l dry we ight determinat i o n , was
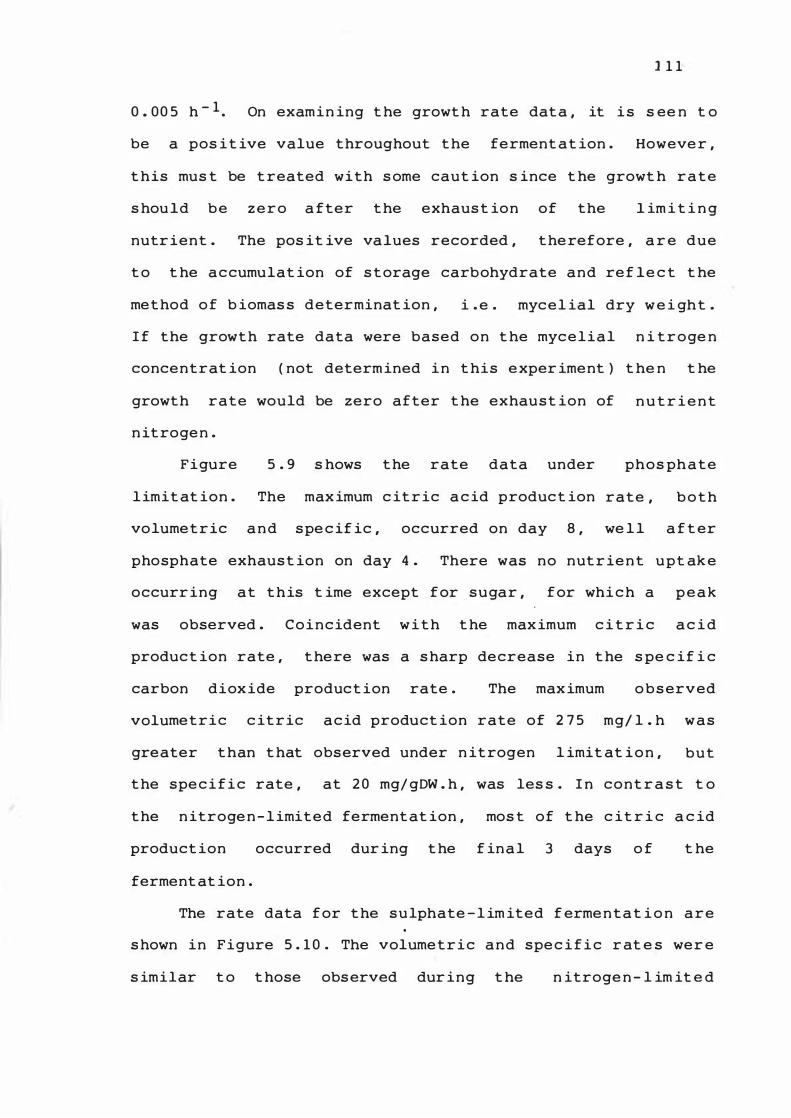
1 1 1
0 . 00 5 h - 1 . On examin ing t he growt h rate dat a , it i s s ee n t o
be a pos i t ive value throughout t he ferment at ion . Howeve r ,
t his mus t be t reated with s ome caut ion s ince t he growt h r a t e
s hou ld b e z e r o a fter t he exhaus t ion of the l im i t i n g
nutr ient . The pos it ive values recorded , t he refore , a r e due
t o t he a c cumulat ion of s t orage carbohydrate and re f le c t t he
met hod o f b iomas s determinat ion , i . e . myc e l ial dry w e i ght .
I f the growt h rate data were based on t he myc e l i a l n i t r o ge n
concentrat ion ( not determ ined i n t his e xper iment ) t he n t he
growth rate would be zero after t he exhaust ion of n u t r i e n t
n it roge n .
Figure 5 . 9 s hows t he rate data under phos ph a t e
l imit at ion . The max imum c it r ic a c id produc t ion rate , b o t h
volume t r ic a n d s pe c if ic , occurred on day 8 , we l l a f t er
phosphate exhaus t ion on day 4 . There was no nut r ie n t u pt ak e
occurr ing at t his t ime except f or sugar , f or whi c h a p e a k
was observed . C o i n c ident w i t h t he max imum c i t r i c a c i d
product ion rate , t here was a s harp decrease in t he s pe c if i c
carbon diox ide product ion rate . The max imum o b s erved
volume t r i c c it r ic a c id product ion rate of 2 7 5 mg/ l . h w a s
greater t han t hat observed under n it rogen l imit at i o n , b u t
t he spe c i f i c rate , at 2 0 mg/ gDW . h , was les s . I n c o n t r a s t t o
t he n itroge n - l imit e d ferment at ion , mos t of t he c it r i c a c id
product ion occurred dur ing t he f in a l 3 days o f t he
ferment at ion .
The rate data f or t he s u lphate - l im ited f erme n t a t i o n a r e
s hown in Figure 5 . 1 0 . The volume t r i c a n d spe c i f i c r at e s wer e
s imilar t o t hose obs erved dur ing t he n itroge n - l im it e d
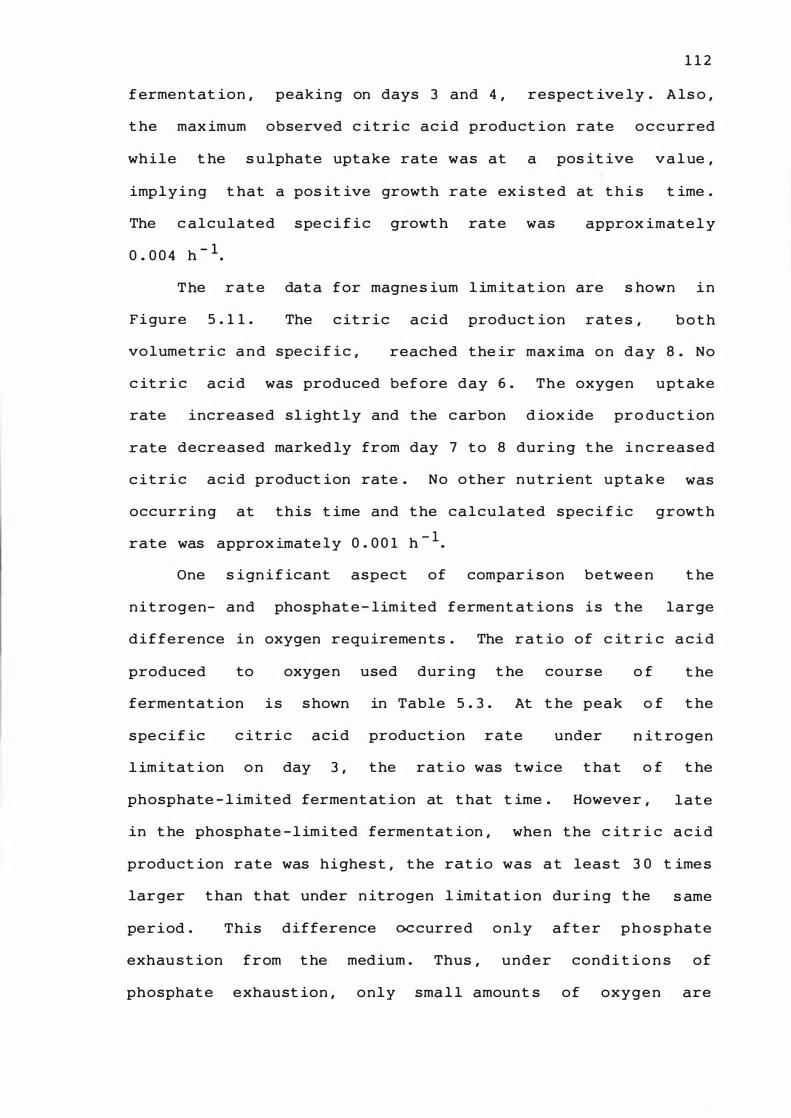
1 1 2
f ermen t at ion , peaking on days 3 and 4 , respect ive ly . A ls o ,
t he max imum observed c it r i c ac i d product ion rate o c c urred
while t he s u lphate uptake rate was at a pos it ive va l ue ,
implying t hat a pos it ive growt h rate ex i s t e d at t h i s t ime .
The c alculated spe c i f ic growt h rat e was
0 . 0 0 4 h - 1.
approx imate l y
T he r a t e dat a for magne s ium l im it at ion are s hown i n
F i gure 5 . 1 1 . The c it r ic acid product ion rat e s , b o t h
volumet r i c a n d spe c i f ic , reached the ir max ima on d a y 8 . No
c it r i c acid was produced bef ore day 6 . The oxygen upt ake
rate increased sl ight ly and t he c arbon d iox ide pro du c t i on
rate decreased marked ly from day 7 to 8 dur i n g t he i n c reased
c it r i c acid product ion rate . No other n u t r ient upt a k e was
occurring at this t ime and t he calculated spec i f ic growt h
. 1 0 . 0 0 1 h - 1 . rate was approx lffiate y
One s ign i f icant aspect of compar i s on betwee n t he
n i t rogen- and phosphat e - limited ferment ations is t he large
dif ference in oxygen requ ireme n t s . The r a t io of c it r i c a c i d
produced to oxygen used dur i n g t he course o f t he
fermentat ion is s hown in Table 5 . 3 . At t he peak o f t he
spe c i f ic c it r i c acid product ion rate under n it ro gen
l imitat i on o n day 3 , the rat i o was twice t ha t o f t he
phosphate - l imited ferment at i on at t hat t ime . However , late
in t he phosphate - l imited fermentat i on , whe n t he c it r i c a c i d
product ion rate was highe s t , t he rat io was a t leas t 3 0 t ime s
larger t han t hat under n itrogen l imit at ion dur i n g t he s ame
period . This difference oc curre d o n l y a f t e r p h o s p hate
exhau s t ion from t he medium . Thus , under condi t i o n s of
phosphat e exhaust ion , only sma l l amount s of oxyge n are
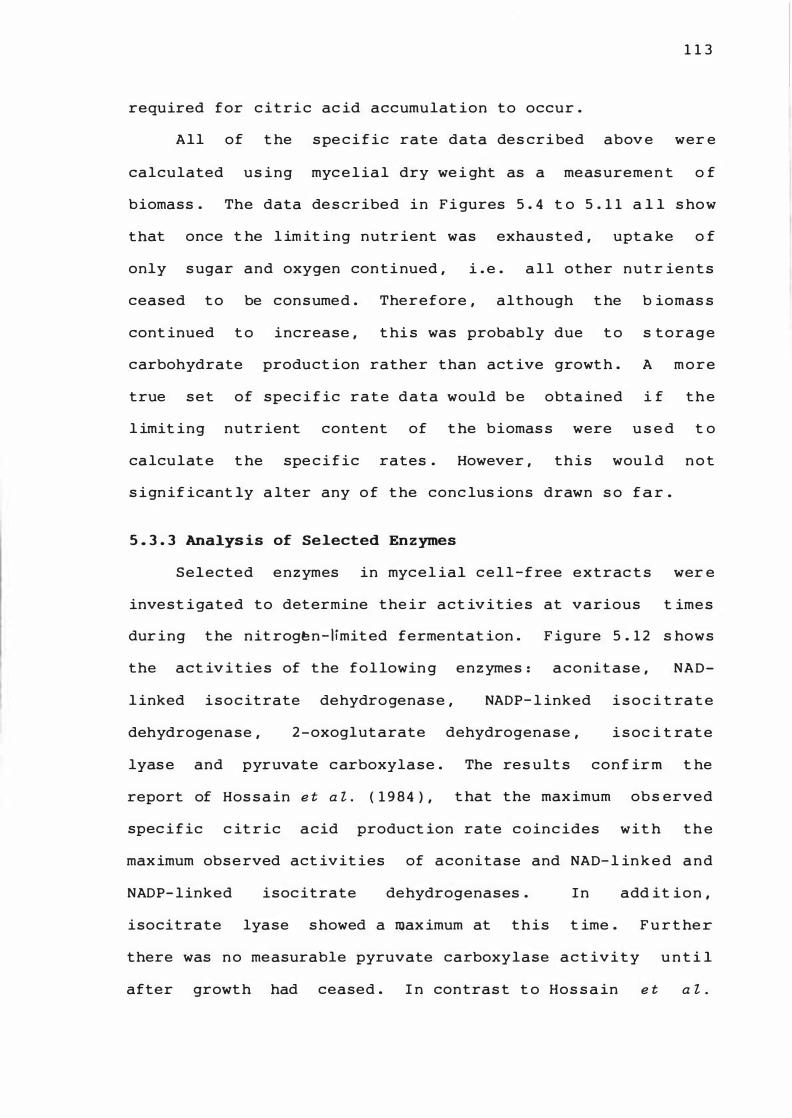
1 1 3
required for c it r i c ac id accumulat ion to occur .
All of t he s pe c i f ic rate data des cribed abov e wer e
calculated us ing myc e l ia l dry we i ght as a meas ureme n t o f
biomass . The data de s cr ibed in F i gures 5 . 4 t o 5 . 1 1 a l l s ho w
that once t he l im it ing nutr ient was exhau s t e d , upt a ke o f
only s ugar and oxygen con t i nued , i . e . a l l other n u t r ie n t s
ceased t o be con s ume d . The r e f ore , although t he b iomas s
cont inued t o increase , t hi s was probably due t o s t or a g e
carbohydrate product ion rathe r than act ive growt h . A m o r e
true s e t of spec i f ic r a t e d a t a would b e obta ined i f t h e
l imit ing n u t r ient content of t he biomas s were u s e d t o
calculat e t he spe c i f ic rates . However , t h i s wou l d n o t
s ign if icant ly a lter any o f t he conc lus ions drawn s o f a r .
5 . 3 . 3 Analys is of Selected Enzymes
Selected enzymes in myc e l ial c e l l - f ree e x t r ac t s wer e
inve s t i gated to determine the ir act iv i t ie s at various t ime s
dur ing t he n it roge n - l imit ed fermentat ion . F igure 5 . 1 2 s hows
the act iv i t ie s of t he f o l lowin g e n z ymes : a c o n i t ase , NAD
l inked i s o c itrate dehydro genas e , NADP- l inked i s o c i t ra t e
dehydrogenase , 2 -oxoglut arate dehydrogenase , i s oc i t rat e
lyas e and pyruvate c arboxylase . The res ult s con f ir m t he
report of Hos s a in e t at. { 1 9 8 4 } , t hat the max imum ob s erved
spec i f ic c it r ic a c id product ion rate c o in c ides w i t h t h e
max imum obs e rved act ivit ies of aconitase and NAD- l in k e d a n d
NADP- l inked isoc itrate dehydrogenases . I n add it i o n ,
isocitrate lyase s howed a max imum at t his t ime . F u r t he r
there was n o measurable pyruvate carboxylase a c t ivi t y u n t i l
after growt h had ceased . I n contras t t o Hos s a in e t at .
1 1 4
For rate dat a s hown i n F i gures 5 . 8 , 5 . 9 , 5 . 10 and 5 . 1 1 ,
t he f o llowing s ymbo ls were u s ed :
o , volume t r i c c i t r ic a c id product ion rate expre s s ed
as mg/ l . h
• , s p e c if ic c itr ic ac id product ion rate expres s ed as
mg/ gDW . h
b , s pe c if ic s ugar upt ake rat e expre s s ed as m g / g DW . h
. , s pe c i f ic n itrogen upt ake rat e e xpres sed a s
m g / g DW . h
o , s pe c i f ic phosphate upt ake rat e e xpr e s s e d a s
mg / g DW . h
� , s pe c i f ic s u lphate uptake rate ( F igure 5 . 10 o n ly )
e xpres s ed as mg/gDW . h
X ' s pe c i f ic ma gnes ium upt ake rat e ( Figure 5 . 1 1 o n l y )
expres s ed as mg/ gDW . h "
. , s pec i f ic oxygen upt ake rate expre s s ed as hi 1l'O/j g DW • h
0 , s p e c i f ic c arbon d iox ide product io n rat e e xpr e s s ed
as WlItIOIj 9 DW • h
. ' s pe c i f ic growth rate expres s ed as h- 1
All axes , un les s o t herwi s e s pec i f ied , repres en t t he
spec if ic product format ion or nutrient upt ak e r a t e s .
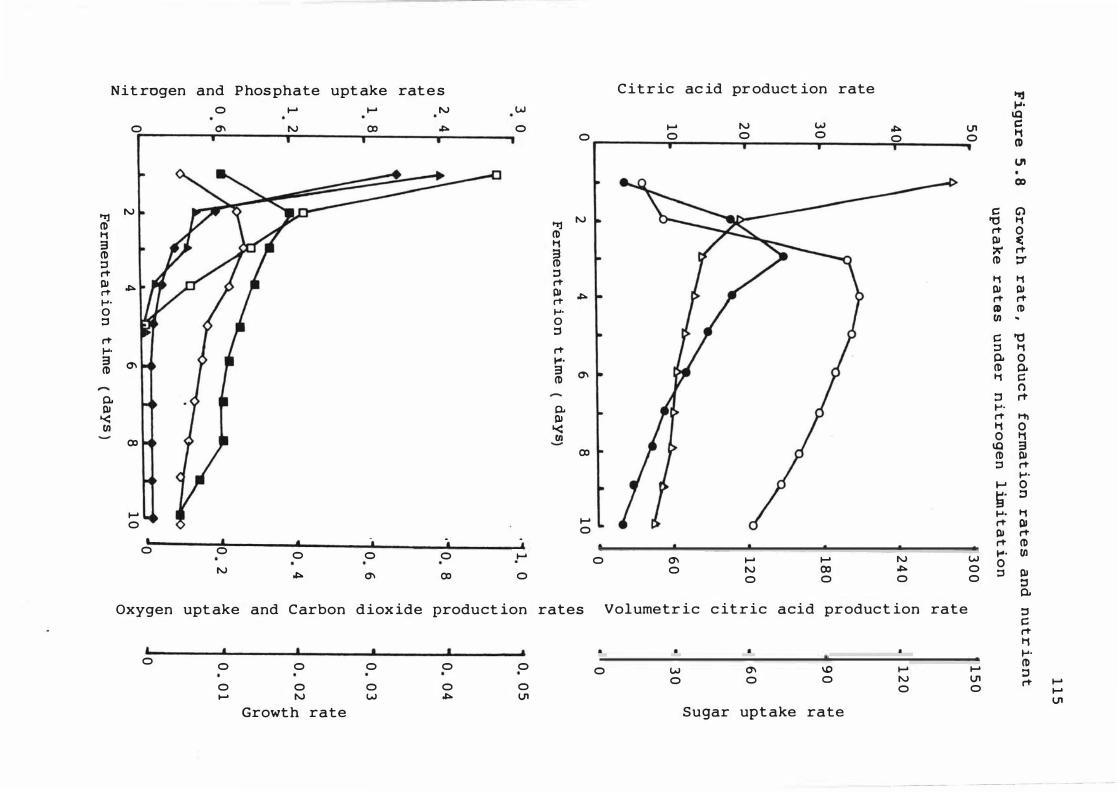
Nit rogen and Phos phate upt ake rat e s o � � N W
o 0'1 N co � 0
"Ij N
(\) 11 3 (\) ::l rt DJ rt ..... o ::l
rt foI· 3 (\)
P. DJ
I.( en
�
0'1
CD
� o
i t
... ______ .&. ______ ...... L....._____ ._ • ... o 0 0 0 0 � N � 0'1 co o
C it r ic ac id pr oduct ion rate
� N W � U1 o 0 0 0 0 0 i
"Ij N
(\) 11
� ::l rt
� � foI· o ::l
rt ..... 3 (\)
P. DJ
I.( en
0'1
co
� o
A • • __________________ ..&a ______ _&. o 0'1
o � N o
� CD o
N � o
w o o
Oxygen upt ake and Carbon d iox ide product ion rates Volumetr ic c it r ic acid product ion rate
• . , t o 0 0 0 0 0
o I-'
o N
Growth rate
o w
o �
o U1
a a • .. ------- -_--'L-______ .A o w
o 0'1 o
\0 o
Sugar upt ake rate
� N o
� U1 o
..., .....
IQ c:: 11 (\)
Ut
CD
c:: G) 'tS 11 rt 0 DJ � � rt (\) ::r
11 11 DJ DJ rt rt CD (\) en ..
C 'tS ::l 11 0. 0 (\) 0. 11 C
Cl ::l rt foI· rt HI 11 0 0 11
IQ 3 (\) DJ ::l rt
foI· ...... 0
�. ::l
foI· 11 rt QI DJ rt rt (\) ..... III 0 ::l DJ
::l P.
::l C rt 11 ..... (\) ::l rt
-----------
� � U1
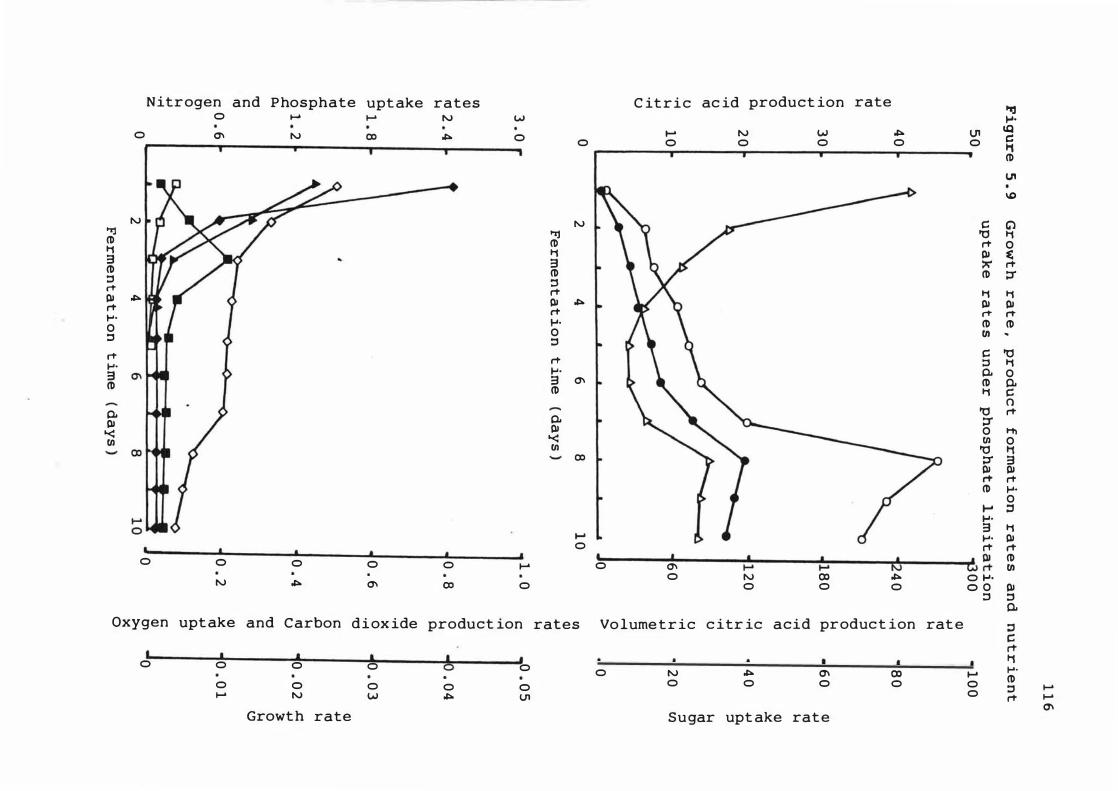
Nitrogen and Phosphate upt ake rates C it r i c ac id product ion rate t'Ij 0 I-' I-' IV W 1-'0 I-' IV W � U1 \Q 0 0\ IV co � 0 c:: 0 0 0 0 0 0
11 CD
UI
ID
IV IV C G"l t1j t1j "0 11 CD CD r1' 0 11 11 QI ( 3 3 � r1' CD CD CD P" ::J ::J eT r1' 11 11 QI � QI � QI QI r1' r1' eT eT 1-'0 1-'0 CD CD 0 0 (/l � ::J ::J C "0 r1' r1' ::J 11 1-'0 1-'0 0- 0 3 :3 0'1 CD 0-CD CD 11 C
0 "0 r1' 0-
QI 0- P" '< QI 0 HI
'< (/l 0 (/l (/l "0 11 co P" 3
QI QI r1' r1' CD 1-'0
0 .... ::J 1-'0 3 11
.... 1-'0 QI • 0 r1' r1' • • • I I I I I i6 6 � CD 0 0 0 0 0 .... 0 0'1 .... I-' (/l 0 IV 0) � 0 1-'0 IV � 0'1 0) 0 0 0 0 0 0 QI
::J ::J 0-
Oxygen upt ake and Carbon d i ox ide product ion rates Vo lume t r ic c itr ic acid product ion rat e ::J c: rt I I I I b • • 11 0 0 0 0 0 I I 1-'0 0 IV � 0\ 0) .... CD 0 0 0 0 0 0 0 0 0 0 ::J I-'
I-' IV W � U1 0 r1' I-' 0\
Growth rate Sugar upt ake rate
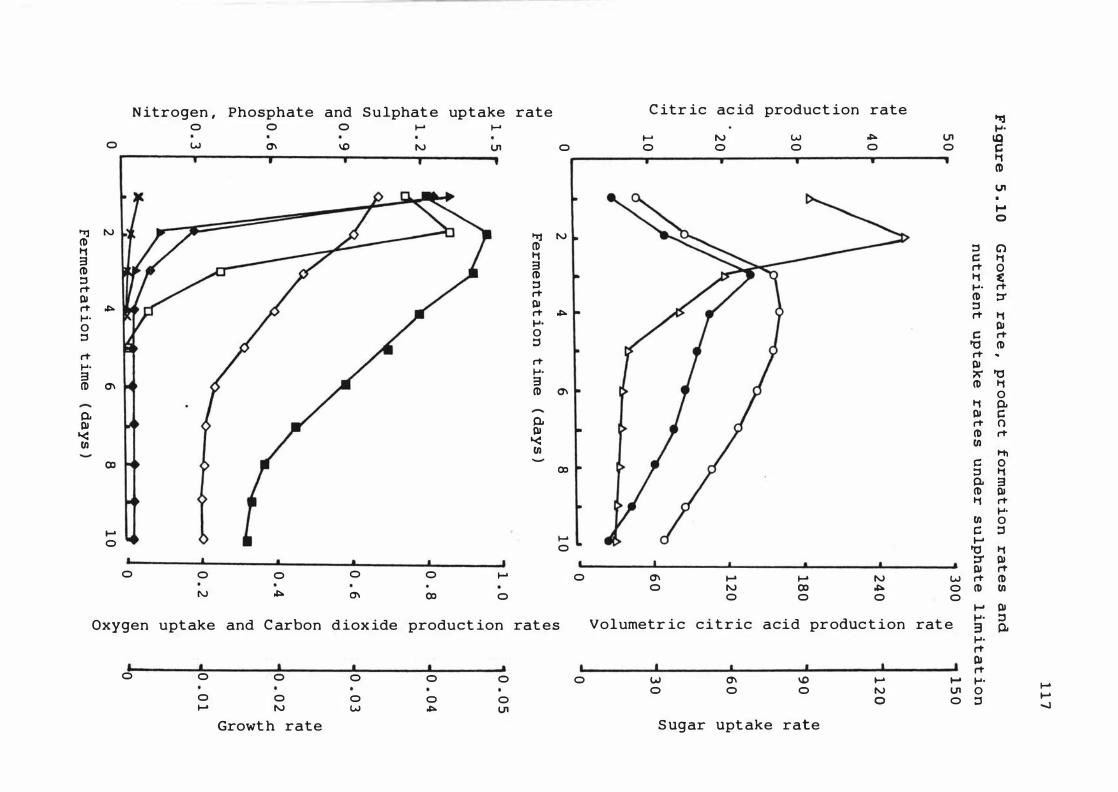
o
"I] IV CD 11 3 CD ::s rT III rT � �. o ::s
rT �. 3 (1) 0\
CL III
'< en
(X)
...... o
N itrogen , Phosphate and Sulphat e uptake rate o 0 0 ...... ......
w 0\ \0 N U1
o 0 0 0 0 ......
IV � 0\ ()) o
o
"I] IV (1) 11 3 CD ::s rT III rT � �. o ::s
rT ..... 3 (1) 0\
0-III
'< en
(X)
...... o
Oxygen uptake and C arbon d iox ide product ion rat es
I ' I • o 0 0 0 0 0
o .....
o N
Growt h rate
o w
o � o U1
o
C itr ic ac id product ion rate
..... o
0\ o
N o
...... IV o
w o
..... ()) o
� o
N � o
U1 o
w o o
Volumetr ic c i t r ic acid produc t ion rat e
o W 0\ \0 ...... ..... o 0 0 N U1
S ugar upt ake rate
o 0
� .....
IQ c: 11 (1)
U'I .... o
::s C) c:: 11 rT 0 11 ( �. rT CD ::t ::s rT 11
III c:: rT
'0 CD rT .. III X' '0 CD 11
o 11 CL III c:: rT 0 CD rT en
HI c:: 0 ::s 11 CL 3 CD III 11 rT
en C ......
�. o :l
'0 11 ::t III III rT rT CD CD en
...... III �. :l 3 Q. ..... rT Cl rT �. o :l
...... ...... �
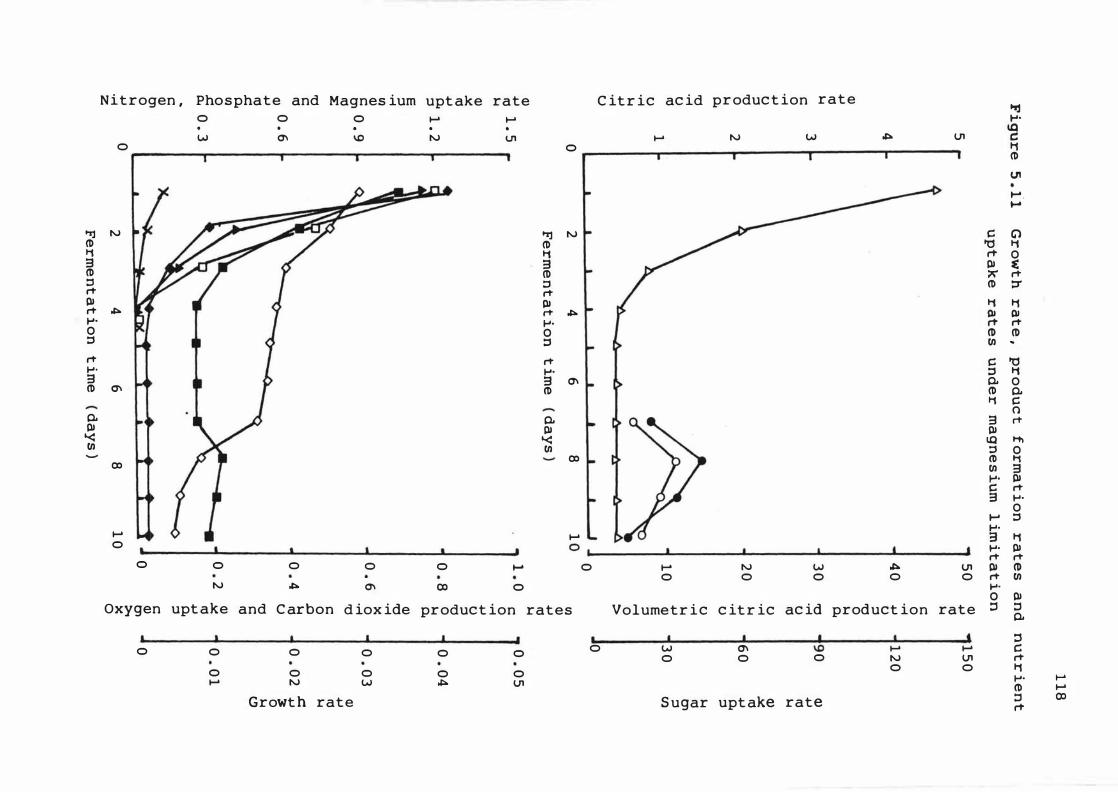
Nitrogen , Phosphate and Magnes ium upt ake rate C it r ic ac id pr oduc t ion rate "Ij 0 0 0 � � ....
tQ w 0\ \0 N VI � N W ,c:. U1 c:
0 0 t1 �
U1 .... .
�
t-rj N t-rj N C G) � � � t1 11 t1 rt 0 9 9 III t: � (l) X' rt ::s ::s (l) ::r rt rt III III t1 t1 rt � rt" � III III .... .... rt rt 0 0 (l) (l) ::s ::s en �
rt rt" C � .... .... ::s t1 9 9 0\ 0- 0 (l) CI'I (l) � 0-
11 C 0
0- 0- 9 rt III III III
'< '< tQ HI en en ::s 0
co (l) 11 co en 9 .... III
C rt :3 ....
0 .... ::s
� � a' t1 0 0 , .... III
rt" rt" 0 0 0 0 0 ..... 0 .... N W ,c:. U1 III (l)
0 0 0 0 0 rt en N ,c:. 0\ co 0 ....
0 III Oxygen upt ake and C arbon d iox ide produc t ion rates Volumetr i c c it r ic ac id product ion rate ::s ::s
0-
.. I I I I I • ::s 0 0 0 0 0 0 0 W 0\ \0 � � c
0 0 0 N U1 rt"
0 0 0 0 0 0 0 t1
� N W ,c:. U1 .... � (l) �
Growt h rate S ugar upt ake rate ::s ex> rt
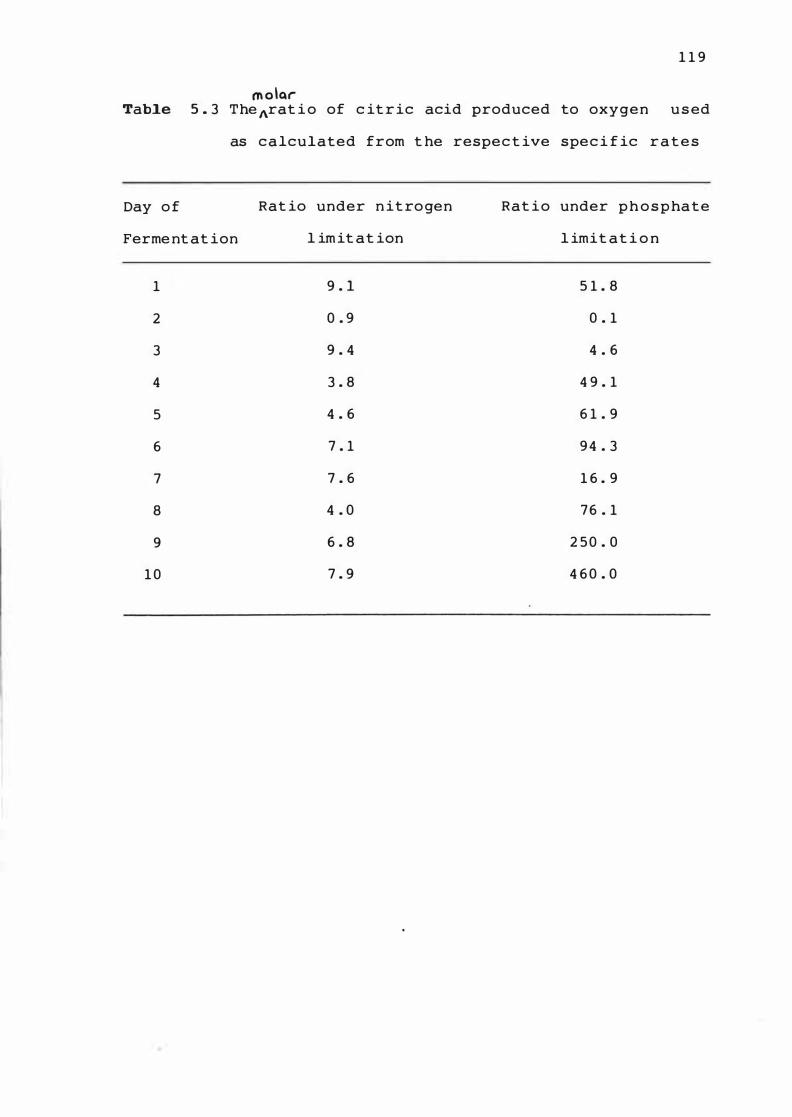
1 1 9
m o la,-Tab1e 5 . 3 The Arat i o of c it r ic acid produced to oxygen u s ed
as c a lculated from t he respec t ive spec i f ic r a t e s
Day o f Rat io under n it ro gen Rat io under p h o s p ha t e
Ferme nt at ion l im it at ion l imit at i o n
1 9 . 1 5 1 . 8
2 0 . 9 0 . 1
3 9 . 4 4 . 6
4 3 . 8 4 9 . 1
5 4 . 6 6 1 . 9
6 7 . 1 9 4 . 3
7 7 . 6 1 6 . 9
8 4 . 0 7 6 . 1
9 6 . 8 2 5 0 . 0
1 0 7 . 9 4 6 0 . 0
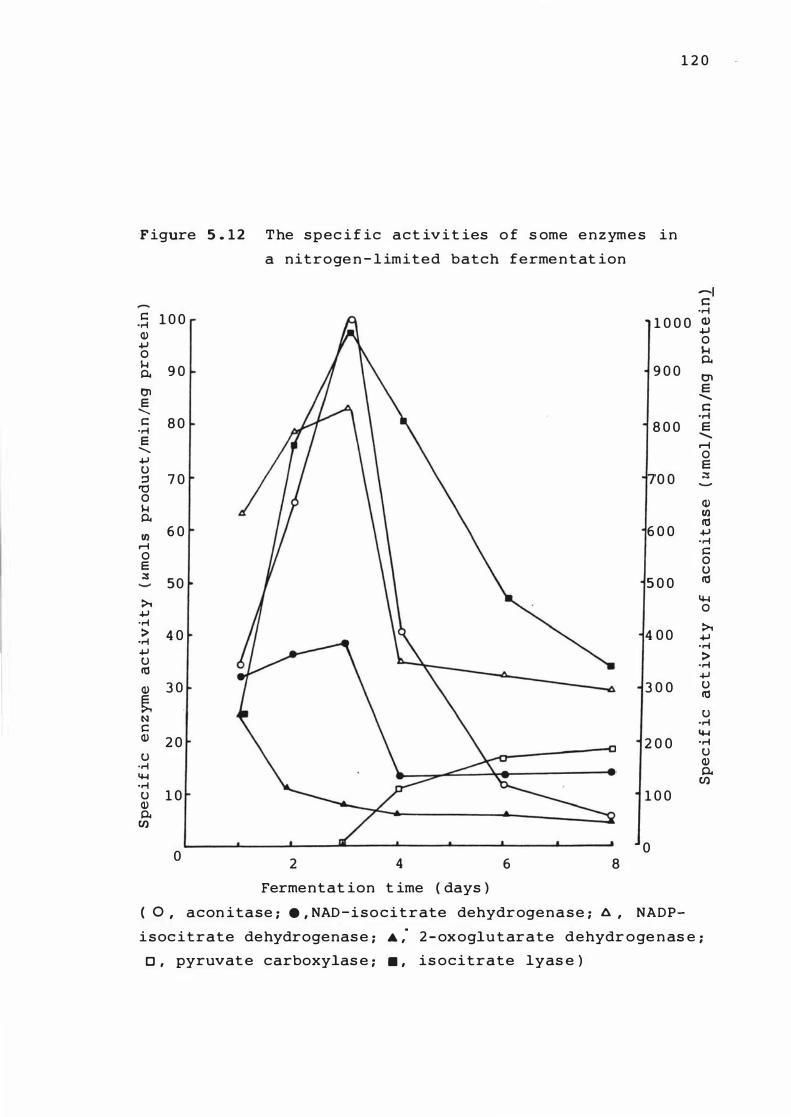
'F igure 5 . 1 2 T he spec i f ic act iv i t ies o f s ome e n z yme s in
a nitroge n - l imited batch ferme n t at ion
I:
1 2 0
-I c:: 0,-l 1 0 0 OM 1 0 0 0 Q)
.j..J Q) +J
0
0 $...l
I-l 9 0 0-
0. 9 0 0 01
O'l E
E '"
......... c:: I: 8 0
OM
OM 8 0 0 E
E '"
......... r-i
+J 0
u E
::3 '0
7 0 0 0 ;:$
0 I-l
Q)
0. (f)
6 0 6 0 0 �
(1) .j..J
r-I OM
0 c::
E 0
;:$ u
5 0 5 0 0 �
>t �
+J 0
OM �
:> 4 0 4 0 0 OM .j..J
+J 0,-l
U :>
� OM .j..J
Q) 3 0 3 0 0 u
� �
N U
I: OM
Q) 2 0 �
2 0 0 OM
U U
OM Q)
� 0-OM
Cl)
U 1 0 1 0 0 Q) 0.
Cl)
o o 2 4 6 8
Ferme n t at ion t ime ( days )
( 0 I acon itase ; . , NAD - i s o c i t rate dehydrogen a s e ; l:l. I NADP
i s oc itrate dehydrogenas e ; A , 2 - ox oglu t arate d ehydr o ge n as e ;
0 , pyruvat e carboxylas e ; . , is ocitrate lyas e )
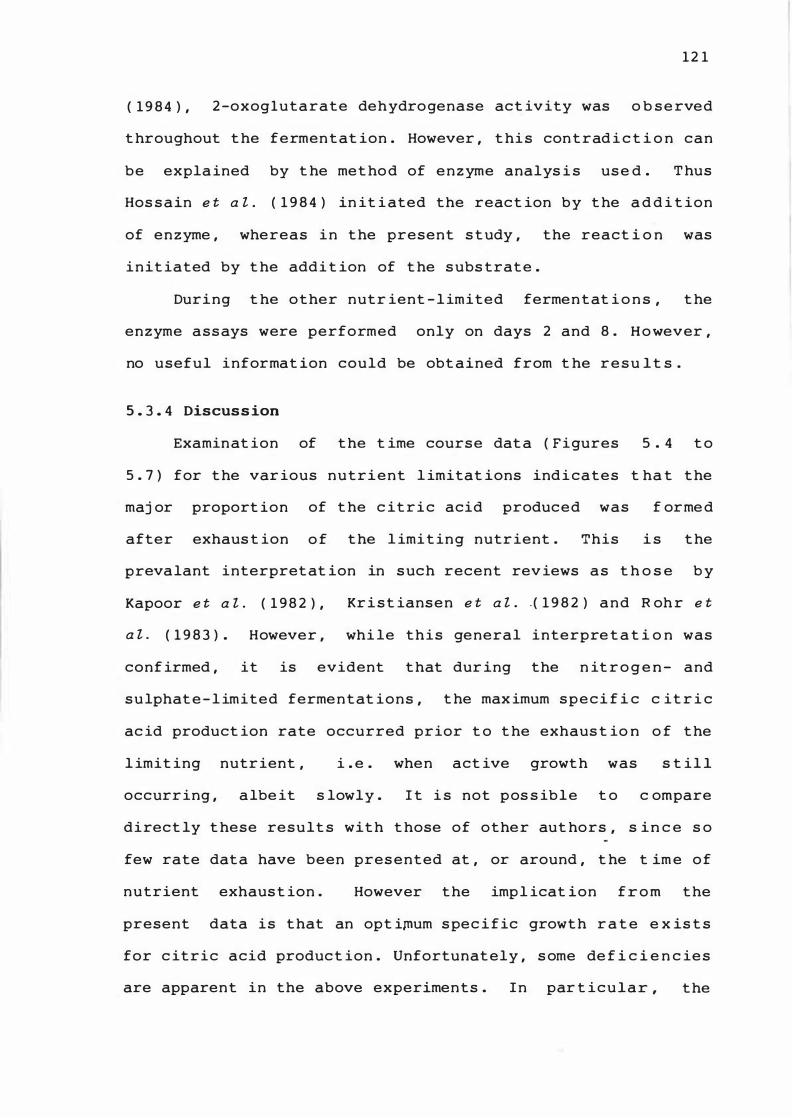
1 2 1
( 1 9 8 4 ) , 2 -oxog1utarate dehydro genase ac� ivity was o b s e rved
t hroughout t he fermen t at ion . However , t hi s con t rad i c t i o n can
be expla ined by t he met ho d of e n z yme analys i s us e d . T hus
Hos s ain e t a l . ( 1 9 8 4 ) in it i ated the reac t ion b y t he a d d i t ion
of enzyme , whereas i n t he present s t udy , the react i o n was
i n it iated by t he addi t ion of t he s ubs trat e .
During t he o t her nutr ient - l imited fermen t at i o n s , t he
enzyme ass ays were performed only on days 2 and 8 . H o wever ,
no useful informat ion could be obt ained from t he r e s u l t s .
5 . 3 . 4 Discus s ion
Examinat ion of t he t ime course dat a ( Figures 5 . 4 t o
5 . 7 ) for t he var ious n u t r i e n t l imitat ions ind i cates t ha t t he
maj or proport ion
after exhaus t ion
of t he c it r i c acid produced was f orme d
o f t he l imi t in g nutr ient . This i s t he
prevalant interpret at ion in s uc h recent rev iews a s t h o s e b y
Kapoor e t a l . ( 1 9 8 2 ) , Kr i s t iansen e t a l . . ( 1 9 8 2 ) a n d R oh r e t
a l . ( 1 9 8 3 ) . However , whi le this general interpre t a t i o n was
conf irmed , it is evident t hat dur ing the n it r o g e n - and
s u lphat e - l imited ferme n t at ions , t he max imum s p e c i f i c c it r i c
ac id product ion rate occurred prior t o t he exhaus t io n o f t he
l imit ing nutr ient , i . e . when act ive growt h was s t il l
occurr ing , a lbe it s lowly . I t i s not p os s ib l e t o c ompare
direct ly t hese result s wit h t hose of othe r aut hors , s in c e s o
few rate dat a have been pres ented at , or around , t he t im e o f
nutrient exhaus t ion . However t he imp l icat ion f r o m t he
present data is t hat an opt i�um s pec i f ic growt h r a t e e x is t s
for c it r i c acid produc t ion . Unfortunat ely , s ome de f i c i e n c ie s
are apparent in the above experimen t s . I n par t i c u l a r , t he
1 2 2
volume t r i c c it r ic a c id produc t ion rat e s were rat her l ow ,
re f le c t i n g t he low leve l of b iomas s . Al s o , t he fermen t at ion
did not proceed to comple t i on . T hus , f ur t her e x p e r ime n t s
were performed i n which hi gher leve l s of b iomas s wer e us e d
( Se c t ion 5 . 4 ) .
I t was cons idered t hat t he magnes ium l imitat ion w a s n o t
wor t h p urs uing fur t her , s in c e i t was not condu c ive t o c i t r i c
ac id produc t ion . I t was a l s o dec ided t ha t becau s e o f t he
s imilarity of resu lts betwee n n itrogen- and s u lp hat e - l im i t e d
f erme ntat ions , the l a t t e r would not be furt her inves t i ga t e d .
This dec i s ion was made on t he bas is t hat the c i t r i c a c id
y i e l d under sulphate l im i t at ion was lower t han t ha t under
n itrogen limitat ion . Als o , b o t h l imitat ions both r e s t r i c t
prote in s yn t hes is and n it rogen conte n t s of bot h b iomas s and
fermen t at ion liquors are markedly eas ier t o mon it or t ha n t he
s ulphate content s . I t is a l s o more l ik e ly t hat i n t he
c ommer c ial s ituat ion , n it rogen would be t he l imi t i n g
n u t r i e n t rat her than su lphat e .
W i t h regard to t he e n z yme analyse s per formed dur i n g t he
nitroge n - l imited fermentat ion t he res u l t s s upport t h e work
of Hos s a i n e t a l . ( 1 9 84 ) , with t he e x ception of t he 2 -
oxoglut arat e dehydrogenase act ivity . Thus the c on c e p t o f
repre s s ion of this e n z yme being respon s i b le , at l e as t i n
p art , for c itric acid acc umulat ion mus t b e mod i f i e d t o
" part ial repress ion " or " part ial inhib it ion " as s ugges te d b y
Meixner -Monori e t a l . ( 1 9 8 5 ) . Hoss ain e t a l . ( 1 9 8 4 ) d i d n o t
analys e i s oc itrate lya s e dur ing t he ir e xp e r ime n t s , b u t dat a
have been reported by Ahmed e t a l . ( 1 9 7 2 ) . T he p r e s e n t
1 2 3
results s how t hat t he e nz yme i s mos t act ive a t t he s ame t ime
as acon itase and the i s o c i t r at e dehydrogenases , and t hu s may
be t he maj or means o f prov i d i n g oxaloacet ate dur i n g r ap id
product ion and los s of c it r ic ac id from t he c e l l . P yr uvate
carboxylase appears t o f u l f i l l t h i s function only a f t e r
act ive myce l ia l growt h has ceased . Overall , t he p r e s en t
results do n o t c ont rad i c t t he view of Hos s a in e t a Z . ( 1 9 8 4 )
that t he observed max imum act ivit ies of acon i t a s e a n d t he
i s oc itrate dehydrogenas e s a t t he t ime of max imum s p e c i f i c
c it r i c acid product ion r a t e are the response o f t he c e l l t o
d im i n i s hed intracellular leve ls o f c i t r i c acid . I ndeed ,
i s oc itrate lyase may be added t o this lis t of e n z ymes .
An intere st ing f eature of t he phosphat e - l im it e d
fermentat ion compared t o t he n itrogen- o r s u lphate - l im i t e d
f ermentat ions is t he lowered oxygen demand o f t he f o rmer
dur ing c it r ic ac id produ c t ion . I f t his e f fe c t c an b e
ver i f ied u nder condi t ions o f higher biomas s ( S ect i o n 5 . 4 ) i t
may have important imp l ic a t ions f or t he power r e qu ir e me n t s
of t he f ermentat ion . T he b iochemical e xplanat ion o f t he
observed result is not c lear , but i t may be c onne c t e d t o t he
alternat ive mechan ism o f the non-p hosphoryla t i n g re
ox idat ion of adenine nuc l e o t ides as sugge s ted by Kub ic e k e t
a Z . ( 1 9 8 0 ) ( Sect ion 2 . 5 ) . Under cond i t ions o f p ho s p ha t e
. d e f i c iency , oxidat ive phosp horylat ion is res t r i c t e d a n d t he
alternat ive mechan ism , whi c h requ ires a high DOT b u t u s e s
substrate - level phosphorylat ion , is used for n u c l e o t ide
reox idat ion . However , t hi s remains specu lat ive .
1 2 4
5 . 4 LIMITATION OF NUTRIENT NITROGEN , PHOSPHATE AND DOUBLE
NITROGEN / PHOSPHATE AT HIGH LEVELS OF BIOHASS
I n t he prev ious s e c t ion , t he e f fects o f v a r i ou s
nut r ient limitat ions on c it r ic a c id produc t i o n were
inve s t i ga t ed . However , t he exper ime n t s were perf orme d at
re lat ive l y low leve ls of b ioma s s wit h the res u l t t ha t t he
volume t r i c c it r ic acid product ion rates were r a t he r l ow a n d
t he ferme n t at ion did not g o t o comp le t ion . The int e n t i o n n ow
was t o repeat t he e xper iment s involv ing n it r o ge n a n d
phosphat e limit at ion , us i n g higher leve ls of b i omas s t o
correct t hese de f f i c iencies .
Kr is t iansen e t a l . ( 1 9 8 2 ) reported t hat in a p ho s p h a t e -
l imited fermentat ion , t he amount of exce s s n it r o ge n i n t he
medium s hould be as low as poss ible , but no d a t a were
provided . To invest igate t his c la im , exper ime n t s were
performed t o determine t he e f f ect on c it r ic acid p r o du c t i o n
of var ious leve ls of exces s n it rogen in a . phosphate - l im i t e d
medium . The fermentat ions were perf ormed i n s hake - f l as k ,
us ing t he medium of Kr i s t iansen and C har ley ( 1 9 8 1 ) ( Ta b l e
3 . 2 ) , modif ied as fol lows : KH 2P0 4 ( 0 . 1 g / l ) w a s u s e d , t o
give a po l- concent rat ion of 0 . 0 7 g / l , while t he n i t r o g e n 0 '3 1 5 9/1
concentrat ions inves t igat e d were 0 . 2 5 g / l , A 0 . 4 2 g/ 1 , 0 . 5 2 5
g l l and 0 . 6 3 g l l obt ained f rom ( NH 4 ) 2S04 conce n t r a t i o n s o f
1 . 2 g l l , 1 . 5 g l l , 2 . 0 g l l , 2 . 5 g l l and 3 . 0 g l l ,
respect ive ly .
The results are s hown in F igures 5 . 1 3 , 5 . 14 a n d 5 . 1 5
for b iomass , citric a c id product ion and yie ld , a n d s ug a r
ut i l isat ion , respect ively . No maj or e f fect on b i omas s
product ion was observed . However , t here was a s i gn i f i c a n t
1 2 5
e f fect o n c it r ic acid product ion and yield , i n t ha t t he
lower t he n it rogen exces s , t he higher t he c it r i c ac id
product ion and yield . For t he t hree lowest leve l s of
n it r o gen excess , t he s ugar ut i l is at ions were s im i lar , but
wit h t he two larges t exce s s n it ro ge n leve l s , marke d l y more
sugar was used and was probably c onverted to carbon d io x ide .
Extrap olat ing from t he data , it appears t hat t he b e s t
s it uat ion , b o t h for improvement of c it r ic acid p r o du c t ion
and on purely econom i c grounds , wou ld be a double
n itroge n / p hosphate l im i t at ion . F i gure 5 . 1 6 s ho w s t he
res idual n itrogen con centrat ions in t he fermentat i o n l iquor .
E xper ime n t s were now perf orme d in fermenter c u l t u r e t o
inve s t i gate c itric ac id product ion under con d i t i o n s of
n it rogen , p hosphat e and double n it ro ge n / p ho s p hate
l im it at ion . The opera t i n g condi t ions were as des cr ib e d i n
Sect ion 3 . 5 . 3 , wit h t he agit at ion a n d aerat ion r a t e s s et a t
2 5 0 rpm a n d 0 . 8 vvm , respect ive ly . T he med i a used wer e bas ed
on t hat of Kris t ians e n and C har ley ( 1 9 8 1 ) ( Tab l e 3 . 2 )
modi f ied as fol lows : for n i trogen l im it a t i o n , no
modif i cat ion ; for phosphate l im i t at ion , KH2 P04 at 0 . 2 g / l ,
giv i n g 1 4 6 mg/ l as PO� - and ( NH 4) 2 S04 at 2 . 2 g / l g i vi n g 4 6 0
mg / l as N t o al low an excess of 1 0 % of t he i n it i a l n i t r o ge n
concentrat ion ; and for t he double n i t roge n / p h o s phate
limi t at ion KH2P04 at 0 . 2 g / l ( 14 6 mg / l as PO� -) and ( NH 4 ) 2 S04
at 2 . 0 g / l ( 4 20 mg / l as N ) were used . A l l ot h e r med ium
con s t i t uents were as i n Table 3 . 2 . The f ermen t a t i on p e r iod
was extended to 14 days t o allow t he proces s t o go t o
comp let ion .
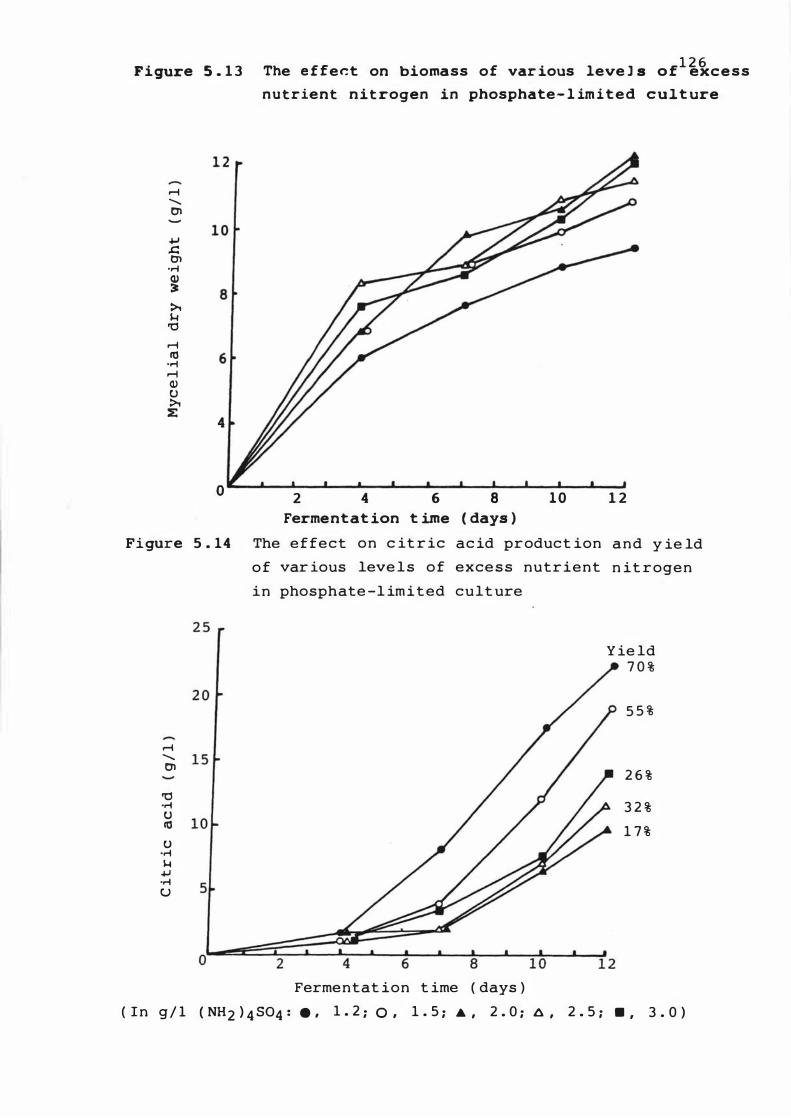
F i gure S . 1 3 The e f fer.t on biomass of var ious leve l s o f1 ��c e s s
n u t r ient n i t rogen in phosphate - l im i t e d c u l t ure
r-I '" 01
� .c: Cl
·rl Q) �
>. $..I ro
r-I ItS
·rl r-I Q) tJ >. :E
4
0 2 4 6 8 1 0 1 2
Fermentat ion t ime ( days )
Fi gure 5 . 14 The e f fect on c it r ic ac id product ion a n d y ie ld
o f var ious leve l s o f exce s s nutr ient n it rogen
in phosphate -l im i t ed cult ure
Y ie ld 7 0 %
5 5 %
r-I '" 01
2 6 %
ro ·rl 3 2 % tJ ItS 1 7 % tJ
·rl $..I +J ·rl ()
o
Fermentat ion t ime ( days )
( I n g / 1 ( NH 2 } 4 S04 : . , 1 . 2 ; 0 , 1 . 5 ; .to , 2 . 0 ; � , 2 . 5 ; . , 3 . 0 )
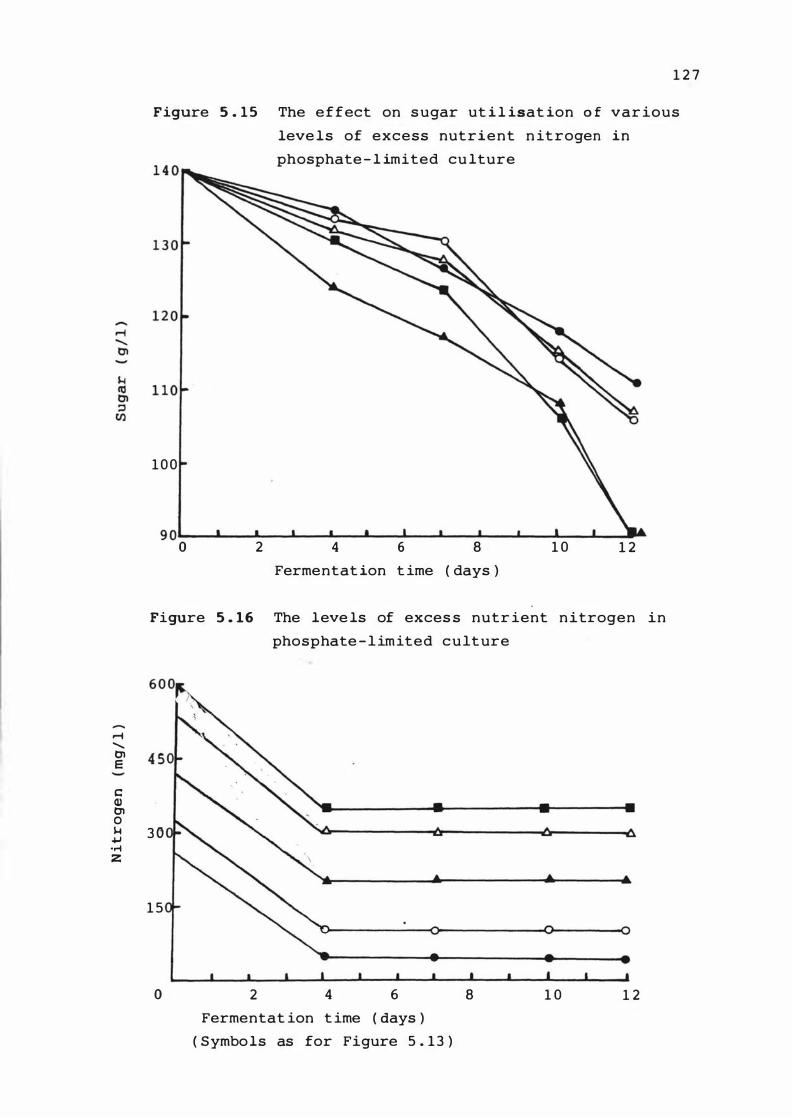
� " � E
c � � 0 �
� .� z
1 2 7
Figure 5 . 1 5 The e f fect on s ugar ut i l isat ion o f var ious
leve ls of excess nutrient n it rogen in
phosphate - l imited cu lture
1 0 0
9 0�--�--�--������--�--�----------�-----o 2 4 6 8 1 0 1 2
Fermentat ion t ime ( days )
Figure 5 . 1 6 The leve ls of exces s nutr ient n itrogen in
phosphate - l imited c u lt ure
3 0
1 5
o 2 4 6
Fermentat ion t ime ( days )
( Symbo ls as for Figure 5 . 1 3 )
8 1 0 1 2
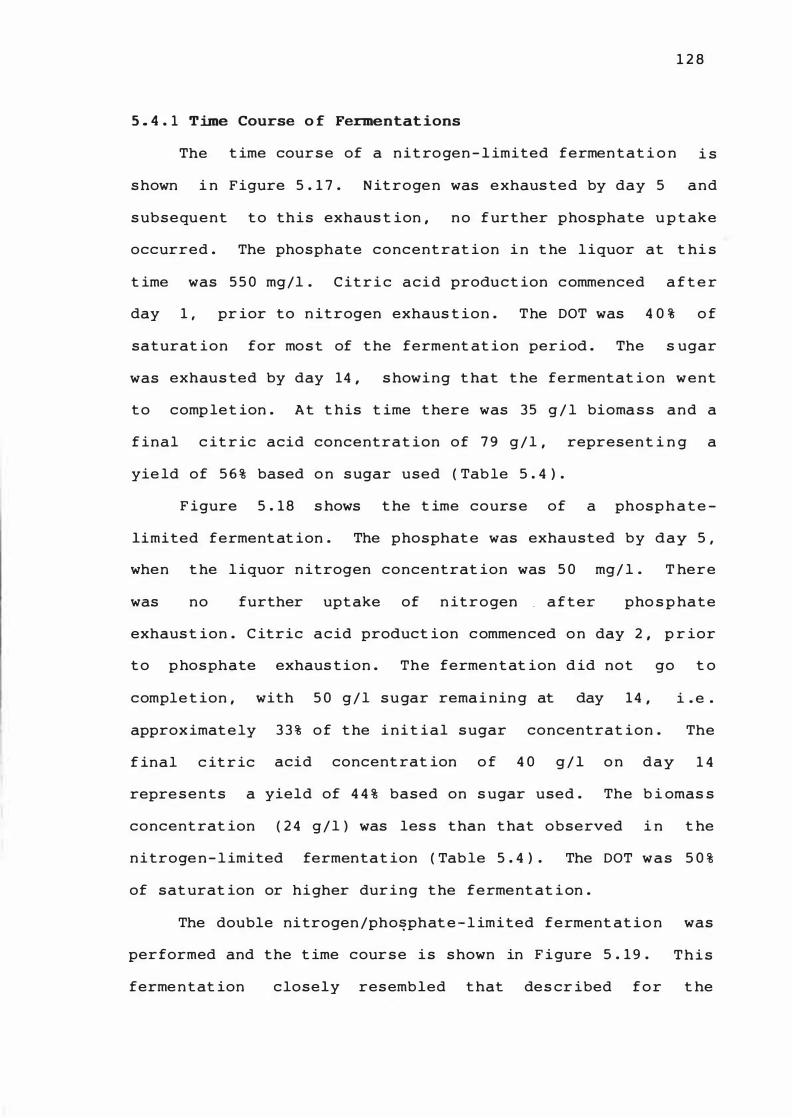
1 2 8
5 . 4 . 1 T�e Course o f Fermentat ions
The t ime cour s e of a n it ro gen - l imited fermen t at i o n i s
s hown i n Figure 5 . 1 7 . N it roge n was exhaus t e d by day 5 and
s ubsequent t o this exhaus t ion , n o f ur t her phosphate u p t ake
occurred . The phosphate concent rat ion i n t he l iquor at t hi s
t ime was 5 5 0 mg/l . C it r i c acid product ion c ommenced a f t e r
day 1 , pr ior to n it rogen exhaus t ion . The DOT was 4 0 % o f
saturat ion for mos t of t he ferment at ion period . The s ugar
was exhaus ted by day 14 , s howing t hat t he ferment at i o n w e n t
t o comp le t ion . A t t his t ime t here was 3 5 g / l bioma s s a n d a
f inal c it r ic acid concentrat ion of 7 9 g / l , represen t i n g a
yie ld of 5 6 % based o n s ugar used ( Tab le 5 . 4 ) .
F igure 5 . 1 8 s hows t he t ime cours e of a phosp h a t e
limited ferment at ion . The phosphat e was exhausted by day 5 ,
when t he l iquor n itrogen concentrat ion was 5 0 mg/ l . T here
was no further upt ake of n it r o gen . a f t er pho s p ha t e
exhaus t ion . C itric a c id product ion c ommen ced o n day 2 , p r ior
t o p hosphate exhaus t ion . The ferme n t at ion d id not go t o
comple t ion ,
approx imat e ly
f inal c it r ic
with 5 0 g / l s u gar rema i n in g at day 1 4 ,
3 3 % o f t he i n i t ial s ugar concentrat ion .
acid concent rat ion o f 4 0 g / l o n d a y
i . e .
The
1 4
repre s e n t s a yield of 4 4 % based on s ugar used . The b i omas s
concent rat ion ( 2 4 g / l ) was les s than t hat observed i n t he
n itroge n - l imited fermentat ion ( Tab le 5 . 4 ) . The DOT w a s 5 0 %
of sat urat ion or higher dur ing t he ferment at i on .
The double nitrogen /pho�phat e - l imited ferment at io n was
performed and the t ime cour s e is s hown in F igure 5 . 1 9 . T h i s
ferme n t at ion closely resembled t hat des cr ibed f o r t he
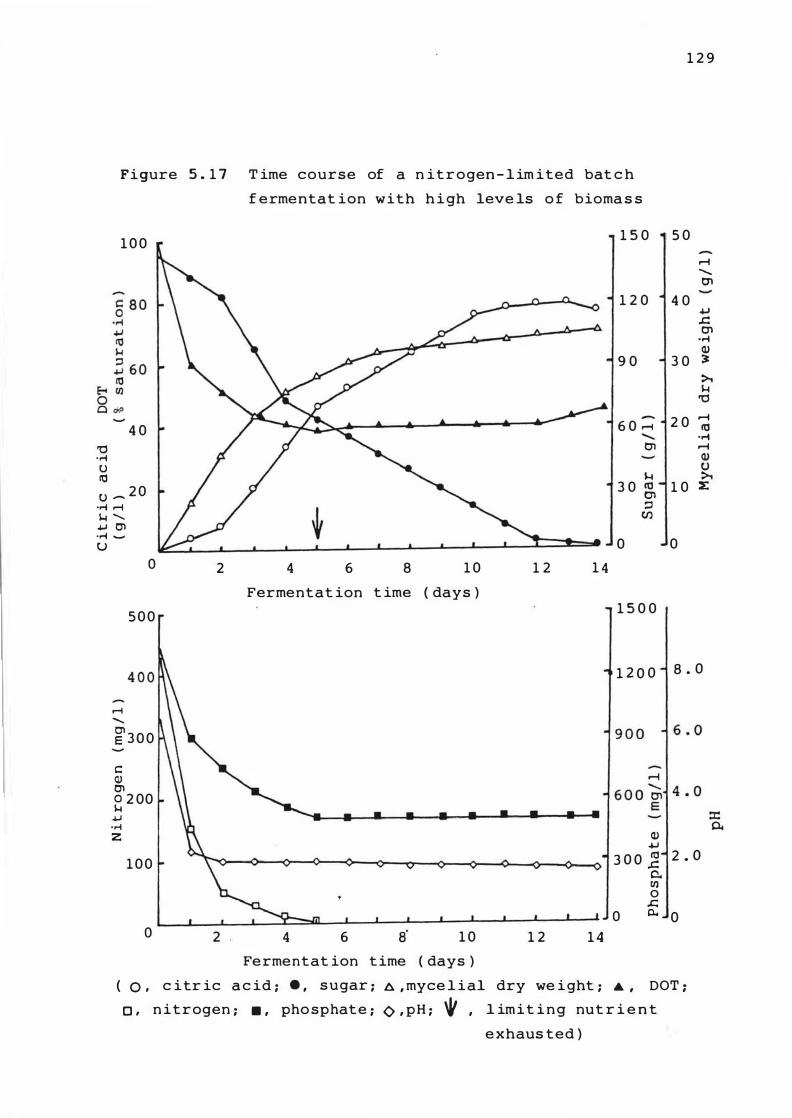
1 2 9
Figure 5 . 1 7
1 0 0
4 0 '0 • .-4 U "' u _ 2 0
• .-4 ,....j I-l '
+.I Cl • .-4 ...... U
o
500
2
T ime course of a n it r ogen - l im ited bat c h
f ermentat ion with h i gh leve ls o f bioma s s
1 5 0
1 2 0
9 0
-6 0 ,..... .........
O'l
I-l 3 0 10
O'l ::J
en
0 4 6 8 1 0 1 2 1 4
Fermentat ion t ime ( days ) 1 5 0 0
5 0 ,..... ......... O'l
4 0 +J ..c: en
-.-4 Cl)
3 0 �
>, I-l
'0
2 0 ,..... "'
• .-4 ,..... Cl) U >,
1 0 �
0
1 2 0 0 8 . 0
.-i ,
� 3 0 0
c:: Cl) Cl 0 2 00 � +.I
• .-4 Z
100
o 2 . 4 6 1 0 1 2 1 4 Fermentat ion t ime ( days )
Cl) +J 3 0 0 � 2 . 0
0.. U) o .c:
o p... 0
( 0 , c itr ic a c id ; . , s ugar ; A , myce l ial dry we i ght ; � , DOT ;
0 , n it rogen ; . , pho sphat e ; O , p H ; � , l im i t i n g nut r i e n t
e xhaus ted )
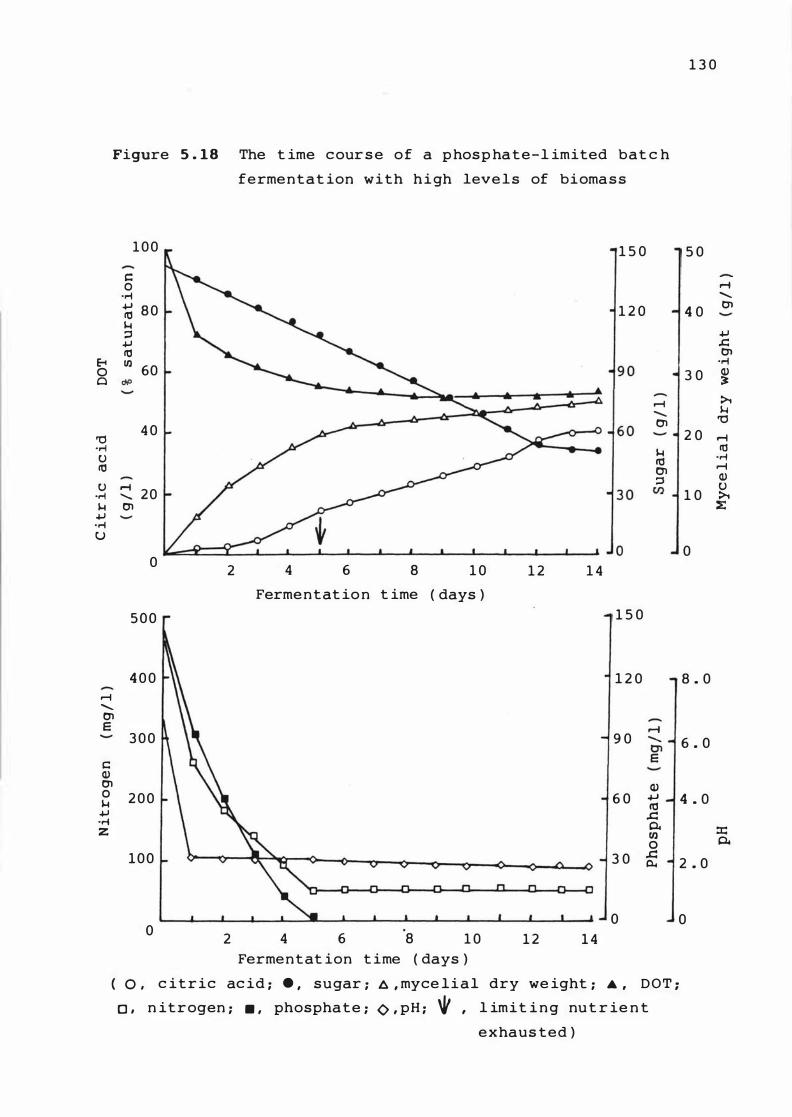
Figure 5 . 1 8 The t ime c our s e of a p hosp ha t e - l imited bat c h
ferme n t a t ion with h i gh leve l s of bioma s s
1 0 0 1 5 0
c: 0
• rot +J 8 0 1 2 0 co 1-1 ==' +J co
8 In 0 60 Cl <JP
...-i "-0'1
'0 4 0
. rot H () 113 co 0'1
==' () � 20 Cl) ·rot 1-1 0'1 +J
• rot U
0 2 4 6 8 1 0 1 2 1 4
Ferme n t at io n t ime ( days )
5 0 0 1 5 0
4 0 0 1 2 0 r-I "-0'1 E ...-i
3 0 0 9 0 "-0'1
c: E
Q) 0'1 Q) 0 2 0 0 6 0 +J 1-1 113 +J .c
·rot 0. z Cl]
0
1 0 0 3 0 .c Il..
1 3 0
5 0
4 0
3 0
2 0
1 0
0
8 . 0
6 . 0
4 . 0
2 . 0
o 0 o
2 4 6 8 1 0 1 2 1 4
Ferme n t at ion t ime ( days )
( 0 , c it r ic ac id ; . , sugar ; l:. , myce l i a l dry we ight ; A , DOT ;
0 , n it rogen ; . , phospha t e ; O , pH ; \f , l imit i n g nu t r ie n t
exhaus ted )
r-f "-Cl
+J .c: Cl
• rot Q) �
� 1-1
'0
r-f co
·rot r-I Q) () �
:E
:c 0.
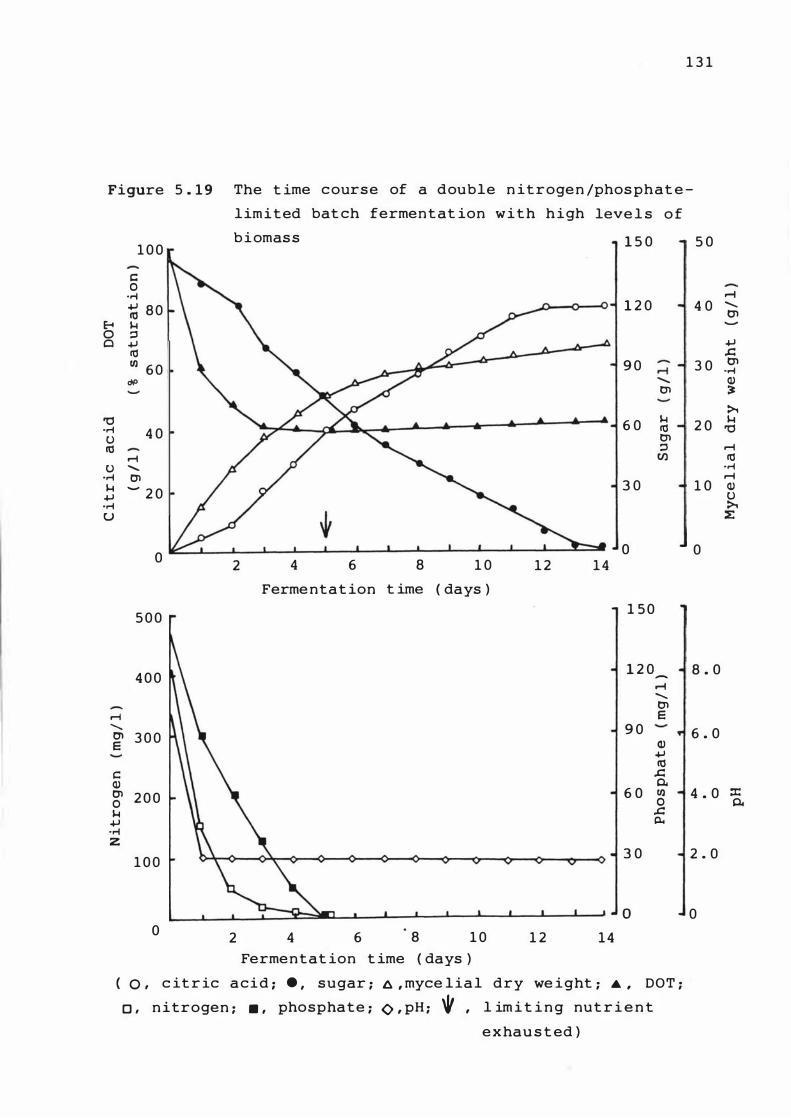
Figure 5 . 1 9
1 0 0
c 0
.,..j
1-1 8 0 It! E-4 1-1 0 ::s Cl 1-1
It!
III 6 0 rH>
'0 .,..j 4 0 U It!
...-l U ........
.,..j 0'1 1-1 - 2 0 1-1
.,..j u
0
5 0 0
4 0 0
...-l ........ 0'1 3 0 0 E
C Q,) 0'1 2 0 0 0 1-1
1-1 .,..j z
1 0 0
o
1 3 1
The t ime c ourse of a double n it roge n /phos phat e -
lim i t ed bat ch ferment at ion w i t h h i gh
b i omas s
2 4 6 8 1 0 1 2
Ferme ntat ion t ime ( days )
2 4 6 8 1 0 1 2
Ferme n t at ion t ime ( days )
leve l s o f
1 4
1 4
1 5 0 5 0
1 2 0 4 0
9 0 ...-l 3 0 '-. t1'I
6 0 1-1 2 0 It! t1'I ::s
Cl)
3 0 1 0
0 0
1 5 0
1 2 0 8 . 0 -..-i '-. t1'I E
9 0 6 . 0 Q,) 1-1 It!
.a 0..
6 0 III 4 . 0 0
.c c..
3 0 2 . 0
o 0
( 0 , c it r ic a c i d ; . , sugar ; t:.. , myce l ia l dry we i ght ; .A . DOT ;
0 , n itrogen ; . , phosphate ; <) , pH ; '¥ , l im i t i n g nut r i e n t
e x hau s t ed )
..-i '-. t1'I
1-1 .a t1'I
.,..j Q,) �
>.. 1-1
'0
..-i It!
.,..j ..-i Q,) U >..
:E
:r: 0..
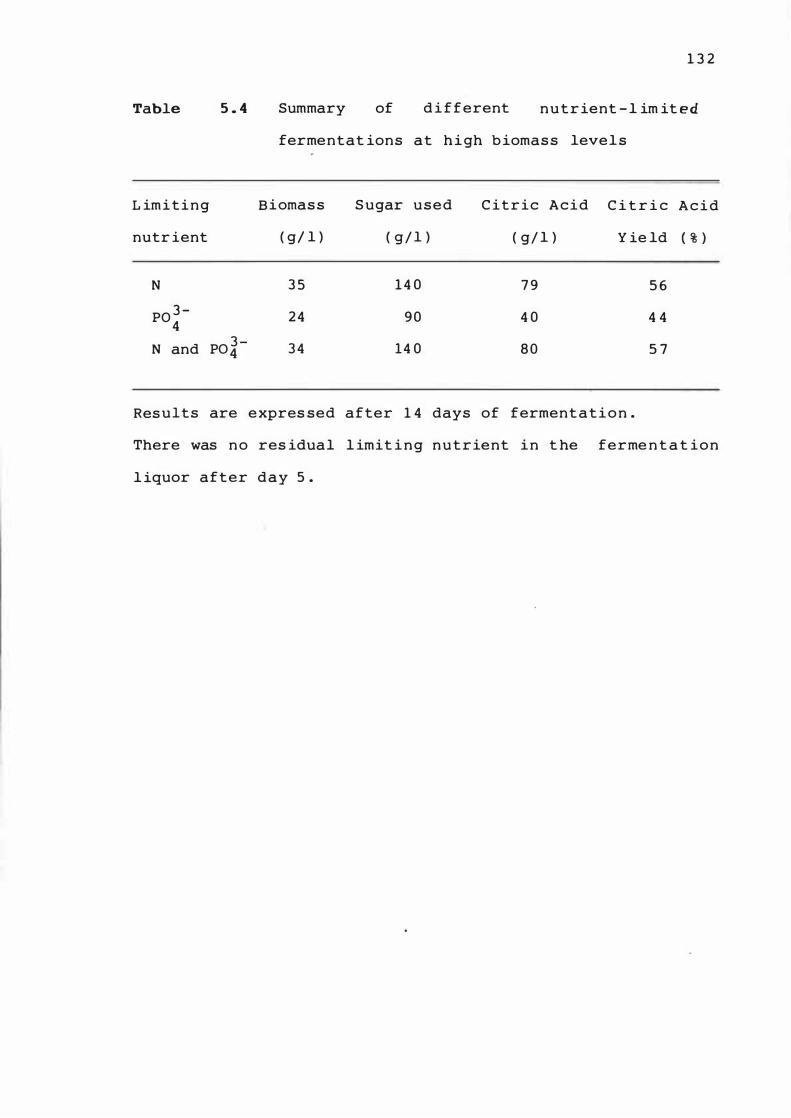
1 3 2
Table 5 . 4 Summary of d i f f erent n u t r ient - l im it ed
fermentat ions at h i gh b iomas s level s
L im i t i n g B i omas s S ugar u s e d C it r i c A c i d C i t r i c A c i d
nutr ient ( g/ l ) ( g / l ) ( g/ l ) Y ie ld ( % )
N 3 5 1 4 0 7 9 5 6
P0 3 -4
2 4 9 0 4 0 4 4
N and PO�- 3 4 14 0 8 0 5 7
Res ults are expres sed after 1 4 days of ferment a t i o n .
There was n o res idual l imit i n g n u t r ient i n t he ferme n t a t i o n
l iquor after d a y 5 .
1 3 3
n itrogen - l im it e d f erme n t a t ion ( F i gure 5 . 1 7 ) , w i t h t he
except ion t hat bot h n itrogen and phospha t e were exhau s t ed b y
day 5 . The f inal c it r i c ac id concent rat ion o f 8 0 g / l ,
represent i n g a yield of 5 7 % based on s ugar used , a n d t he
b iomas s concentrat ion of 3 4 g / l on day 1 4 ( Table 5 . 4 ) were
remarkably s imilar t o t he values for n i tr o gen l imit a t i o n .
From t he s e res ult s , it i s c le ar t hat the n it r o g e n -
l imited fermentat ion was s uper i or t o t he phosphat e - l im i t e d
fermentat ion in t erms o f c it r i c ac id product ion a n d y ie lds .
The doub le n it roge n /phosphate l im i t a t i o n c losely r e s emb l e d
t he n i t roge n - l imited ferment at ion .
The increase in bioma s s observed a fter t he e xhaus t io n
of t he l im i t ing nutr ient s was probably due t o t he produ c t i o n
of s t or age c arbohydrate b y t he organ ism .
5 . 4 . 2 Rates of Growt h , Product Format ion and Nutr ient Uptake
From t he dat a pre s ented in S e c t ion 5 . 4 . 1 , i t i s
pos s ible t o calculate rates o f c i t r i c ac id and c arbon
d ioxide product ion and t he upt ake r a t e s of n i t ro ge n ,
phosphat e , s ugar and oxyge n . F igure 5 . 2 0 s hows the r a t e d a t a
f o r the n itrogen - limited fermen t at ion . The max imum c it r i c
ac id product ion rates , bot h volume t r ic and spec i f ic , wer e
observed o n day 3 , i . e . pr ior to n it ro ge n exhaus t io n o n day
5 , at values of 690 mg/ 1 . h and 35 m g / g DW . h , respect ive ly . As
expected , t he volumetric rat e s were h i gher t ha n t ho s e
observed under condit ions o f low b iomas s leve l s ( F i gure
5 . 4 ) . The max imum spe c if ic �ugar upt ake rate c o i n c i d e d w i t h
t he c i t r i c acid product ion rate max ima . The spec i f i c growt h
rate at t his point was 0 . 0 1 2 h - 1 and t he s pe c if ic n i t ro ge n
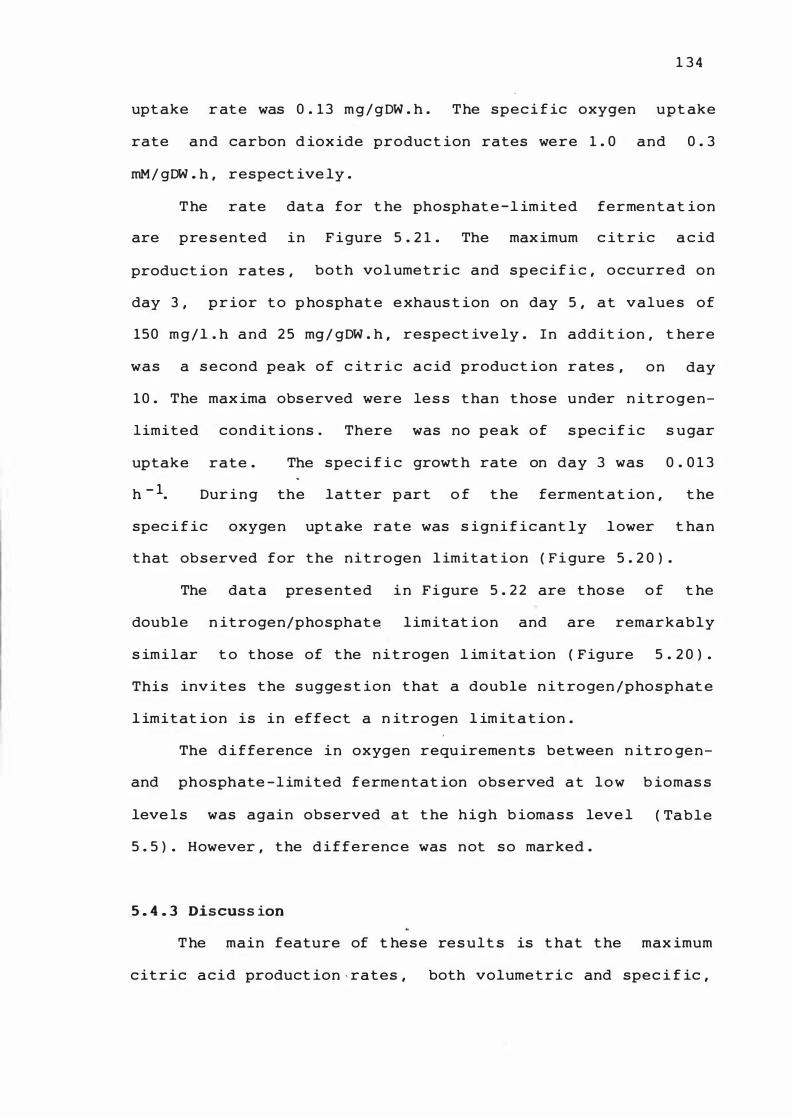
1 3 4
upt ake r ate was 0 . 1 3 m g / g DW . h . The spec i f ic oxygen upt ake
rate and carbon d iox ide product ion rates were 1 . 0 and 0 . 3
mM/ gDW . h , respect ive ly .
T he rate dat a for t he phosphat e -l imited ferme n t a t ion
are pre s ented in F igure 5 . 2 1 . The max imum c it r ic a c id
product i o n rates , both vol umetric and s p e c i f i c , o ccurre d on
day 3 , p r ior t o p hosphat e e xhaus t ion on day 5 , at value s of
150 m g / l . h and 2 5 mg / gDW . h , respect ive ly . In addit ion , t here
was a s econd peak of c it r i c a c id product ion r ates , on day
1 0 . The max ima obs erved were les s t han t hose u nder n it r o g e n
limited condit ions . There was no p e a k o f s pe c i f ic s ugar
uptake rate . The spec i f i c growt h rate on day 3 was 0 . 0 1 3
h - 1. Dur i n g the latter p art o f t he ferment at ion , t he
spec i f ic oxygen upt ake rate was s ign i f icant ly l ower t han
t hat obs erved for the nitrogen l imitat ion ( F i gure 5 . 2 0 ) .
The dat a pres ented i n Figure 5 . 2 2 are t ho s e o f t he
double n itrogen/phosphat � limitat ion and are remarkably
s im i l ar t o those of the n i t rogen l im itat ion ( Figure 5 . 2 0 ) .
This inv ites t he s ugge s t ion t hat a double n it rogen /pho s p h at e
l imitat ion is in effect a n itrogen l im it a t ion .
The d i fference in oxygen requ ireme n t s between n it ro ge n
and phosphate - l imited f erme ntat ion obs erved a t l o w b iomas s
leve l s was again observed at t he high b ioma s s leve l ( Table
5 . 5 ) . However , the d i f ferenc e was not s o marked .
5 . 4 . 3 Discuss ion
T he main feature of t he s e res ult s is t hat t he max imum
c itric acid product ion , rates , both volume t r i c and spec i f ic ,
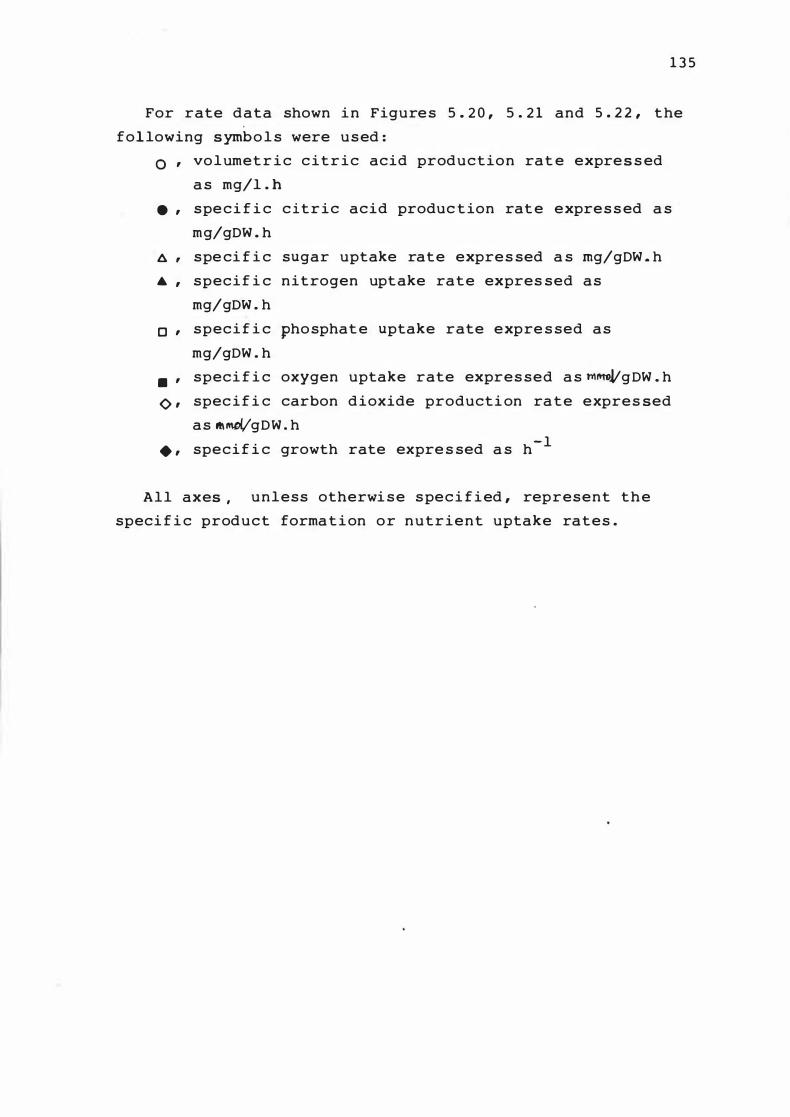
1 3 5
For rate data shown i n Figure s 5 . 2 0 , 5 . 2 1 and 5 . 2 2 , t he
fol lowing symbo l s were u s ed :
o , volumet r i c c i t r i c acid production rat e expre s s ed
a s mg/l . h
. , spe ci f i c c i t r i c acid produc t ion rat e expre s s ed a s
mg/gDW . h
6 , spe ci f i c sugar uptake rat e expre s sed a s rng/gDW . h
. , speci f i c nitrogen upt ake rat e expres sed a s
mg/gDW . h
0 , speci f i c pho sphat e uptake rate expre s sed a s
mg/gDW . h
. ' speci f i c oxygen uptake rate expre s sed a s ��Vg DW . h
0 , spec i f i c carbon d ioxide producti on ra t e expre s sed
a s fbll\Dlj gDW . h
. , speci f i c growth rate expre s sed a s h- l
All axes , unless otherwi s e s pe c i f i ed , represent t h e
speci f i c product forma t i on o r n u t r i e n t uptake rat e s .
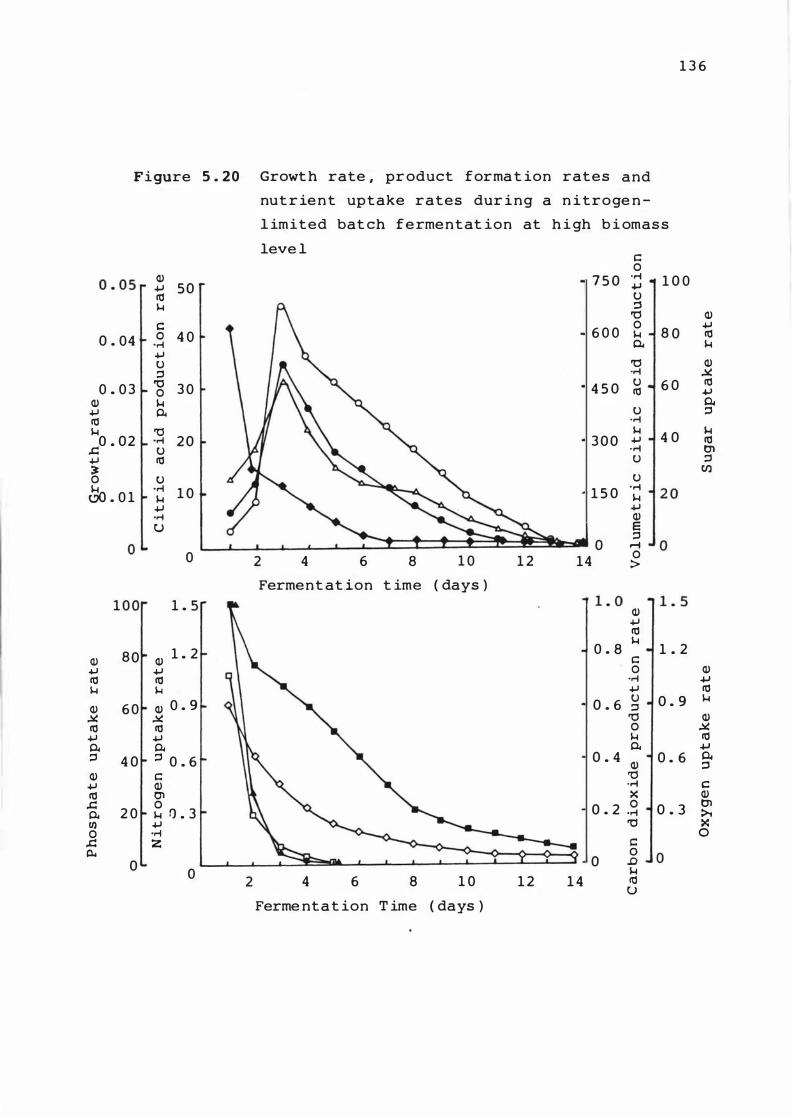
1 3 6
Figure 5 . 2 0 Growt h rate , pr oduct forma t ion rates and
nut r ie n t uptake rates dur i n g a n i troge n -
l imited bat ch f e rme n t at ion at h i gh b i omas s
leve l c:: 0
Q) 7 5 0 :j 1 1 0 0 0 . 05 1'" +J 50 ca U 1-1 ::3
'l::j Q) c:: 6 0 0 0 8 0 +J
0 . 04 t- .� 4 0 1-1 ca 01 1-1
+J U 'l::j Q) ::3 '.-1 �
0 . 03 'l::j 3 0 4 5 0 u 6 0 ca 0 ca .+J
Q) 1-1 01 +J � U ::3 ca • .-1 1-1 'l::j 1-1 4 0 1-1
.co . 02 • .-1 20 300 +J ca U • .-1 tiI
+J ca U ::3 � Cl) 0 u u
& . 0 1 • .-1 1 0 1 5 0 .� 1 2 0 1-1 +J +J '.-1 Q) () E
::3
0 '- 0 � "' 0 0 0 2 4 6 8 1 0 1 2 14 >
Ferment at�on t ime ( days )
100r 1 . 5r � 1 1 . 0 ' 1 . 5 Q) +J ca
80 Q) 1 . 2 0 . 8
1-1 1 . 2 Q) c:: +J +J 0 Q) ca ca • .-1 .+J 1-1 1-1 +J ca
Q) 0 . 9 u 0 . 9 1-1
Q) 60 0 . 6 ::3 � � '0 Q) ca ca 0 � +J +J 1-1 ca � � � .+J ::3 4 0 ::3 0 . 6 0 . 4
Q) 0 . 6 01
::3 Q) c:: 'l::j +J Q) • .-1 c:: ca Cl x Q) .c 0 0 0 . 3 tiI � 2 0 1-1 () . 3 0 . 2 . .-1 � U) +J 'l::j � 0 '.-1 0
.c z c Il. 0 .8 J O 0 0 1-1
2 4 6 8 1 0 1 2 1 4 ca ()
Ferme nt a t ion T ime ( days )
1 3 7
Figure 5 . 2 1 Growth rate , product f ormat ion rate s and n u t r i e n t
upt ake r a t e s dur ing a phosphat e - l imited b a t ch
f e rme nt at ion at h i gh b i omas s leve l
0 . 0 5
0 . 04
QJ � 0 . 0 3 � J:: +-' :J 0 . 02 o � t!l
0 . 0 1
QJ +-' n:l �
o
QJ 0 • 6 .l( n:l +-' §' 0 . 4 QJ +-' n:l
J:: 0 . 2 0. Cl) o
J:: �
Q) +-' et! 5 � � o � 4 u :l '0 o � 3 0-'0 • .-4 � 2 U
• .-4 � ."!:: 1 u
o
3 . 0
QJ .l( et! +-' OIl . 2 :l � QJ gO . 6 � +-'
'.-4 Z
o
2
2
4 6 8 1 0 1 2 1 4 Ferme n t at ion t ime ( days )
4 6 8 1 0 1 2 1 4 Ferme n t at ion t ime ( days )
QJ +-' n:l �
1 5 0 § 1 0 0 • .-4 +-' U :l
1 2 0 'g 8 0 � 0-
'0 9 0 . .-4 6 0 U et! U
60 .� 4 0 +-' '.-4 U
3 0 u 2 0 • .-4 � +-' QJ
0 3 0 � o :>
3 . 0 1 . 0
QJ +-' 2 . 4 � 0 . 8
Q) +-' et!
1 . 8
1 . 2
O . 6 � QJ
.l( et! +-' 0-o . 4 :l
QJ '0 • .-4
0 . 6 >< o • .-4 '0
� QJ 0'1
O . 2 � x
o
o § 0 .0 � n:l U
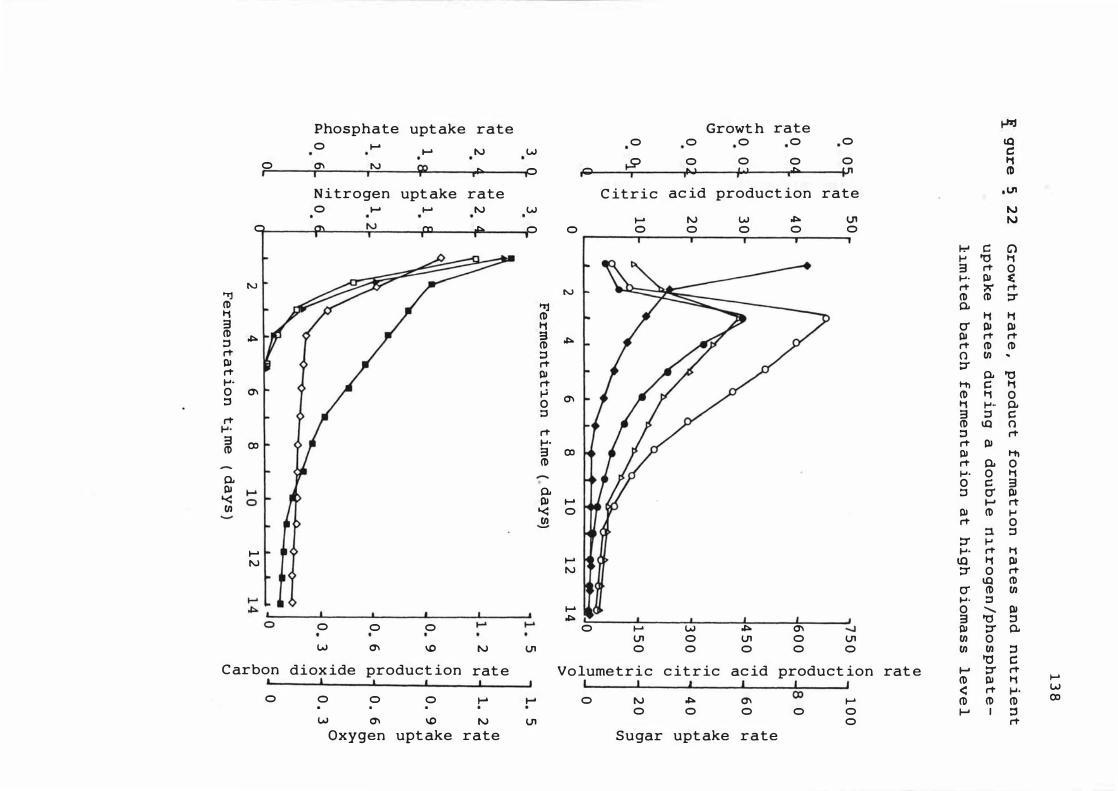
Phosphate upt ake rate Growt h rate � 1-" 0 0 0 0 0 0 IQ ...... ...... IV W c:
0 0\ I'.) 0 0 0 0 0 11 Ifl � 0 0 ...... IV W � Ion ID I I i , i i , i ,
N itrogen upt ake rate C itric ac id product ion rate VI
0 ...... ...... IV W I'.) ...... I'.) w � Ion IV
0 0\ I'.) Cl) � 0 0 0 0 0 0 0 , , , I-' c: C) 1-" '0 11 3 rt 0 .... � � I'.) I'.) rt � rt
'"'l CD CD ::r CD � P. 11 CD 11 11 3 11 er III III CD � 3 � � rt rt ::J CD rt CD CD rt ::J 0 en �
� rt ::r rt � P. '0 .... rt I-tl C 11 0 0\ 1-" 0\ It) 11 0 ::J 0 11 1-" P.
::J 3 ::J C rt It) IQ 0 1-" rt ::J rt 3 Cl) .... rt III It) 3 Cl) � I-tl
It) rt 0- 0 .... 0 11
6 � [
P. 0 C 3 � P. ::l er III '< III ...... I-' rt en '< 0 � It) 1-"
en rt 0 ::l ::l
::r 1-" .... rt 11 � r r? � '*� IQ 11 III ::r 0 rt
IQ CD er It) en .... ::J
� !,c. 0 " III I I I I , 3 '0 ::J
0 0 0 ...... ...... 0 ...... w � 0\ -...J � ::r p. U1 0 U1 0 U1 en 0
w 0\ \0 I'.) U1 0 0 0 0 0 en en ::l "0 c:
C arbon diox ide product ion rat e Volumetric c it r ic ac id product ion rat e I-' ::r rt It) � 11 ......
I I , I I I < rt 1-" w 0 0 0 0 ...... ...... 0 I'.) � 0\ (X) ...... ID It) ID Cl)
0 0 0 0 0 I-' I ::l w 0\ \0 I'.) U1 0 rt
Oxygen upt ake rate Sugar upt ake rate
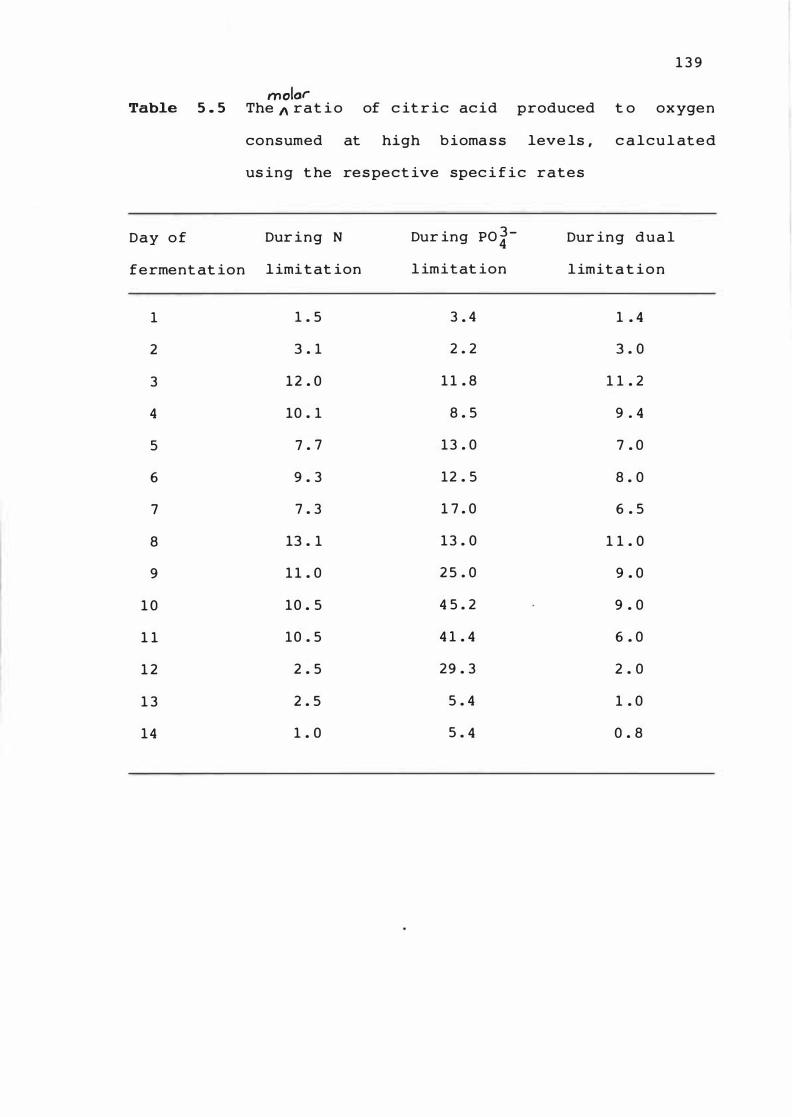
1 3 9
molor Table 5 . 5 The 1\ rat i o of c it r ic ac id produced t o oxygen
consumed at high b ioma s s leve ls , c a lcu l at e d
us ing t he res pect ive spec i f ic rates
Day o f Dur ing N Dur ing P0 3 -4 Dur ing d u a l
ferment at ion l imi t at ion l im i t at ion l imit a t i o n
1 1 . 5 3 . 4 1 . 4
2 3 . 1 2 . 2 3 . 0
3 1 2 . 0 1 1 . 8 1 1 . 2
4 10 . 1 8 . 5 9 . 4
5 7 . 7 1 3 . 0 7 . 0
6 9 . 3 12 . 5 8 . 0
7 7 . 3 1 7 . 0 6 . 5
8 13 . 1 1 3 . 0 1 1 . 0
9 1 1 . 0 2 5 . 0 9 . 0
1 0 1 0 . 5 4 5 . 2 9 . 0
1 1 1 0 . 5 4 1 . 4 6 . 0
1 2 2 . 5 2 9 . 3 2 . 0
1 3 2 . 5 5 . 4 1 . 0
1 4 1 . 0 5 . 4 0 . 8
1 4 0
occurred pr ior t o t he exhaus t ion of t he l im it i n g n u t r ient
f rom the growt h medium , i . e . when the spe c i f ic growt h r a t e
was pos it ive and n o t a f t e r ces s at ion of act ive growt h , a s i s
often s t ated i n the literat ure . This was par t i cularly marked
in the case of the n itroge n - l im it e d ferment at ion .
The spe c if ic growt h r a t e dur ing a bat ch ferment a t i o n i s
generally calculated from t he increase i n b iomas s , u s u a l ly
measured as myce l i a l dry we ight , over a g iven per io d of
t ime . It is a s s umed t hat t he increase in myce l ia l dry we i ght
is due to t he growt h of t he organ ism . However , i f t he
growt h-l im it ing nutr ient i s approaching exhaus t ion , o r has
been exhausted from t he med ium , any increase i n myce l ia l dry
we ight may not be due to a c t ive growth . Fur t her , bec au s e o f
the rap id dec l ine i n growth rat e as t he l im i t i n g n u t r i e n t
approaches exhaus t ion , accurate measurement s o f t he s p e c i f ic
growth rate are not pos s i b le . For t he s e reas ons , i t was
decided that a t horough examinat ion of t he e f f e c t o f
spec i f ic growt h rate o n c it r ic acid product io n was warr an t e d
and t his requ ired a s t udy in chemos tat culture . A c o n t i nuous
culture chemos t at is a u s e ful research tool a s i t a l l ow s a
study of the e f fect of changing one parameter , e . g . g r ow t h
rate , whi le all other parameters are mai n t a ined c o n s t an t .
I f , as seems probable at this s t age , an o p t imum
spe c i f ic growth rat e exis t s f or c itric a c i d p r oduct i o n , t he n
i t s hould be pos s ible t o maintain the max imum c it r i c a c i d
product ion rate for e xt ended t ime per iods dur i n g a
fermentat ion proces s . This Cqn be achieved in b o t h c he rn o s t at
and cont inuous fed-ba t c h culture , as in b o t h t e c h n i qu e s
spec i f ic growt h rates les s than t he max imum c an be
1 4 1
ma int a ined con s t ant .
Wit h re gard t o t he phosphat e - l imited f erme n t at i o n , a t
this s t a ge there appears t o b e l it t le advantage i n l im i t i n g
this nutr ient whe n compared with t he n itrogen - l im it e d
fermentat ion . The d i f ference i n oxygen upt ake observed whe n
t he fermentat ions were performed at low biomas s leve l s was
not s o apparent at t he higher leve ls of b iomas s . F ur t her ,
t he res u l t s s how t hat in a phosphate - l imited f ermen t at i o n
the leve l of exc e s s n itrogen rema i n i n g a f t e r p ho s phat e
exhaus t ion has an effect on c it r ic acid produc t io n and
yie lds . On economic grounds , i t would be preferable to have
no exce s s nutrie n t s present after t he required b iomas s
concentrat ion has been attained . The pre s e n t res u l t s s how
t hat when n itrogen and phosphate are u s e d t oget her a s
l imiting nutr ients , the s ituat ion resemble s n it r o ge n rathe r
t han phosphate l im i t at ion . T o i nves t i gate t he s e d i f fe r e n t
nutrient limit at ions more f u l ly , exper ime n t s i n c h e mo s t at
culture are required .
The reason why exce s s n itrogen i n a phosphate - l im it e d
culture s hould have a detr imen t al e f f ect on c it r i c ac i d
product ion i s not c lear . One pos s ible explanat i o n i s t ha t
t he nutr ient � + 4
ion may exert a form of cat abo l i t e
repres s ion . From F igures 5 . 2 0 , 5 . 2 1 and 5 . 2 2 , i t was
obs erved that the n itrogen upt ake rate at t he t ime o f
max imum c it r ic ac i d product ion rate was approx imate ly 0 . 1
mg /gDW . h . I t has been s ugge s t ed above t hat an o p t imum
spec i f ic growt h rate ex i s t s f or c itric a c i d product i o n . An
opt imum n itrogen upt ake rate may also e x i s t .
1 4 2
5 . 5 C()NCLQSlOHS
The maj or conc lus ion that can be drawn from t h i s s t udy
i n batch fermentat ion' i s t hat c itric ac id product io n can
read i l y occur under condit ions of n it rogen , phosp h a t e or
s u lphate lim i t at ion . Further , the max imum c it r i c a c i d
product ion rate occur s pr ior t o the exhau s t ion o f t he
limit ing nut r ient from t he medium , sugges t ing t ha t a n
opt imum spe c i f ic growt h rate exis t s f or c it r i c a c i d
a ccumulat ion . However , due t o the d i f fult ie s i n mea s ur i n g
growt h rates accurat e l y i n batch ferment at ions , s t ud i e s i n
chemos tat culture are requ ired t o ver i f y t h i s e f fe c t .
1 4 3
CHAPTER 6
THE PRODUCTION OF CITRIC ACI D IN CHEMOSTAT
CONTINUOUS CULTURE
6 . 1 INTRODUCTION
Dur i n g a chemo s t a t f erme n t at ion , t he organ i s m c a n b e
maintained i n a con s t ant met ab o l ic s t ate , t hu s a l l ow i n g
accurate de term inat ion of t he e f f ec t s o f d i f f e r e n t
e nv ironme n t a l var iables . The res u l t s d e s c r i b e d i n t he
previous c hapter indi cated t hat t here may be a n opt imum
s pe c i f ic growth rate f or c it r ic acid produ c t ion . Als o in t he
prev ious c hapter , it was s t at e d that it was d i f f i cu l t t o
compare accurat e l y t he ferment at ions operat e d under
d i f ferent nutrient l im it at ions because o f t he d i f f e re n t DOT
values t hat were ma i n t ained . Thus , i t was dec ided t o per f orm
a s t udy in c hemos tat cult ure t o determine t he e f f e c t s o f two
var iables , s pec i f ic growt h rate and DOT , on c it r ic ac i d
produc t ion , a n d i f pos s ib le determine t he opt imum c o n d i t i o n s
f or t he s e two variab les . The limi t ing n u t r ie n t s u s e d t o
obt ain s te ady states were n it rogen and p h o s p hat e .
Subsequen t ly , a comb ined n itrogen / p hosphat e double
l imitat ion was perf ormed .
6 . 2 NITROGEN-L IMITED FERMENTATIONS
The des ign for t he exper iment was a f a c t o r i a l
experiment us ing three values of the two v ar i able s , s pe c if i c
growt h rate and DOT . The centre point c ho s e n f or t he
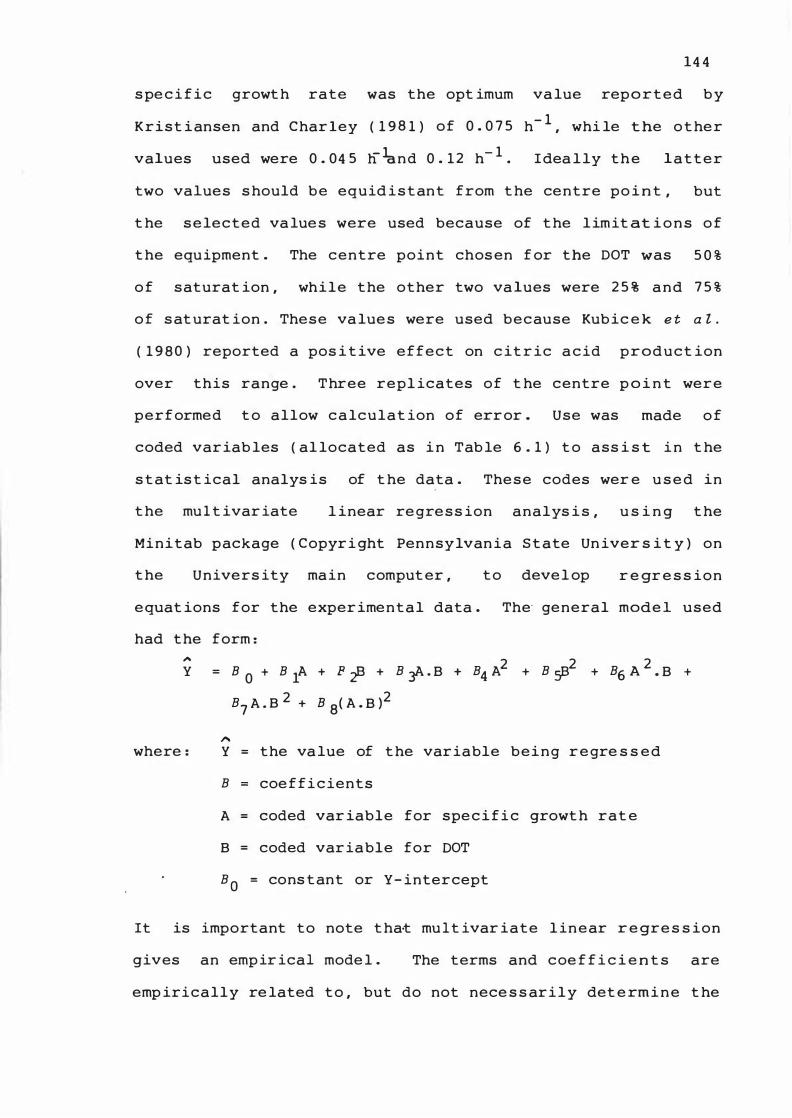
14 4
spe c i f ic growth rate was the opt imum value reported by
Krist iansen and Char 1ey ( 1 9 8 1 ) of 0 . 0 7 5 h- 1 , whi le t he other
values used were 0 . 04 5 n �nd 0 . 1 2 h - 1 . Idea lly the latter
two values s hould be equid istant from the centre po i n t , but
t he selected values were used because of the limit at ions of
the equipment . The centre point chosen f or the DOT was 5 0 %
of saturat ion , while the other two values were 2 5 % and 7 5 %
of saturat ion . These values were used because Kubic e k e t a Z .
( 1 9 80 ) reported a pos i t ive effect on c it r ic acid product ion
over this range . Three repl icates of t he centre p o i n t were
performed t o allow calculat ion of error . Use was made of
coded variab les ( al located as in Tab le 6 . 1 ) t o ass i s t in t he
s tat ist ical analys is of t he data . These codes wer e u s e d in
the mu1 t ivar iate l inear regress ion analys is , u s i n g the
Minitab package ( Copyri ght Pennsylvania S t ate Un iver s i t y ) on
the Univers ity main computer , to devel op r e gr e s s ion
equat ions for the experimental data . The' general mode l used
had the form : ". 2 2 2 Y = B 0 + B lA + P ;!3 + B � • B + B 4 A + B r:J3 + B6 A • B +
where : ,..
B7 A . B 2 + B 8( A . B )2
y = the value of the variable being r e gre s s ed
B coefficients
A = coded var iable for specific growth rat e
B = coded variable for DOT
BO = cons tant or Y- intercept
It is important to note tha·t mu1t ivar iate l inear r e gre s s ion
gives an empir ical mode l . The terms and coe f f i c i e n t s are
emp irically re lated to , but do not nece s s arily det e rmine t he
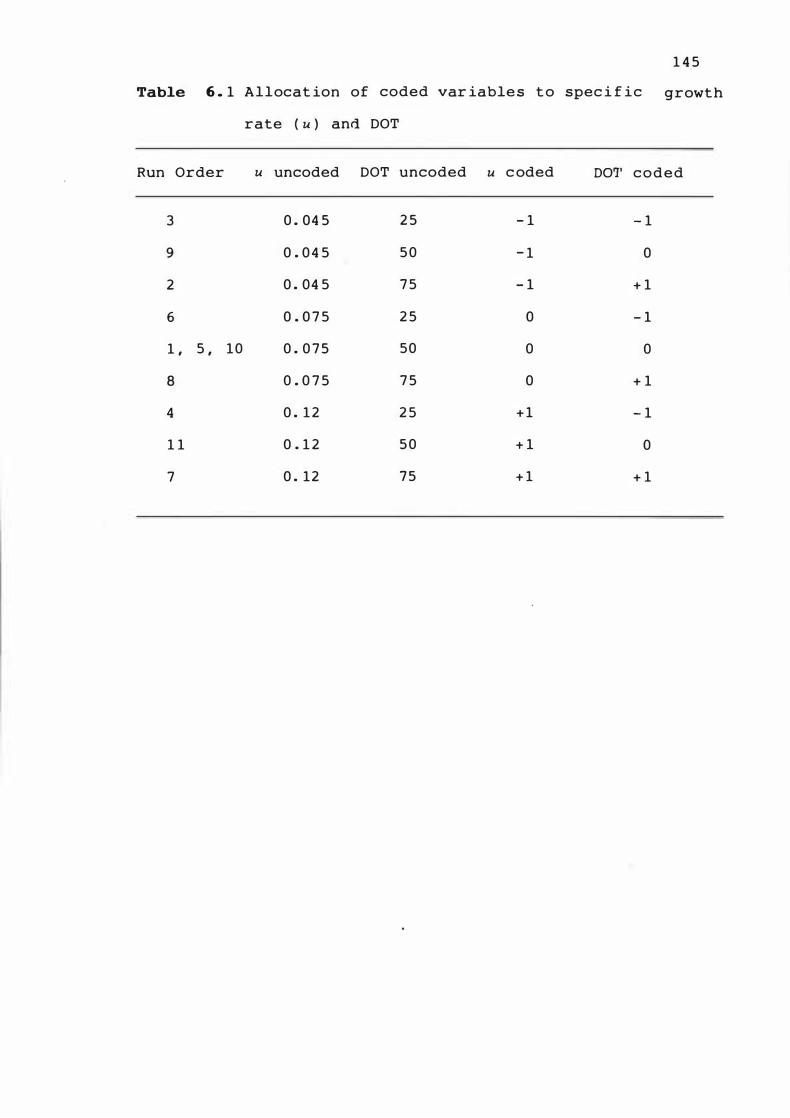
1 4 5
Table 6 . 1 Allocat ion of coded var iable s t o spec i f ic growth
rate ( u ) and DOT
Run Order u uncoded DOT uncoded u c oded 00'1' c o d e d
3 0 . 04 5 2 5 - 1 - 1
9 0 . 0 4 5 5 0 - 1 0
2 0 . 04 5 7 5 - 1 + 1
6 0 . 0 7 5 2 5 0 - 1
1 , 5 , 1 0 0 . 0 7 5 50 0 0
8 0 . 0 7 5 7 5 0 + 1
4 0 . 1 2 2 5 + 1 - 1
1 1 0 . 1 2 5 0 + 1 0
7 0 . 1 2 7 5 + 1 + 1
1 4 6
value of , t he exper ime n t a l var iab les .
For each s teady s t at e inve s t igated , a new c u l t u r e was
e s t ab l i s hed to avo i d any prob lems as s o c iated w i t h s tr a i n
dege nerat ion . The proce s s was operated i n i t ially a s a b a t c h
ferment at ion us ing t he med ium des c r ibed i n Tab l e 3 . 2 ,
adj u s t e d t o pH 6 . 5 . After inocu lat ion w i t h a 2 4 hour- o l d
s hake - f l a s k cult ure ( 1 0 % ( v /v ) inoculum ) ( Sect ion 3 . 5 . 7 ) ,
t he pH was al lowed t o drop naturally t o p H 2 . 3 a t which
t ime t he cont inuous f eed was s tart ed u s ing t he me dium
des c ribed i n Table 3 . 3 , adj usted to pH 4 . 5 . The a e r a t i o n
rate w a s adj us ted t o t he 0 . 5 l /min ( 0 . 3 5 vvm ) mark o n t h e
rot amet e r whi le t he a g i t at ion speed range w a s c on t r o l le d a s
des cr ibed in Sect ion 3 . 5 . 5 t o maintain a c o n s t ant D O T v a lue .
I n mos t cases the pH of the culture rema i n e d natur a l l y a t p H
2 . 0 , but t he automat i c control was ava i l a b le i f r e qu ired .
The cult ure was a s s umed to be i n s t eady s t at e a f t e r t hree
res idence t imes , and t hereafter s ucce s s ive s amp l e s t ak e n at
least half a res idence t ime apart s howed no s ig n i f i c a n t
var iat ion .
The s te ady s t at e concentrat ions r e c orded f o r t he
var ious operat ing cond i t ions are s hown i n Table 6 . 2 a n d t he
calculated rate dat a in Table 6 . 3 . The t heory o f t he
chemos t a t culture pre d i c t s that bioma s s c oncen t r a t i o n i s
dependent o n only t he concentrat ion o f t he growt h - l im it i n g
nutrient , i n this case n itrogen . Howeve r , t he o b s e rved
b iomas s conce ntrat ions , bas ed on myce l ia l dry we i gh t , v a r i e d
cons iderably at d i f ferent s teady s t ates . T h i s w a s a lmos t
cert ainly due to accumu lat ion of s t orage carbohydra t e b y t he
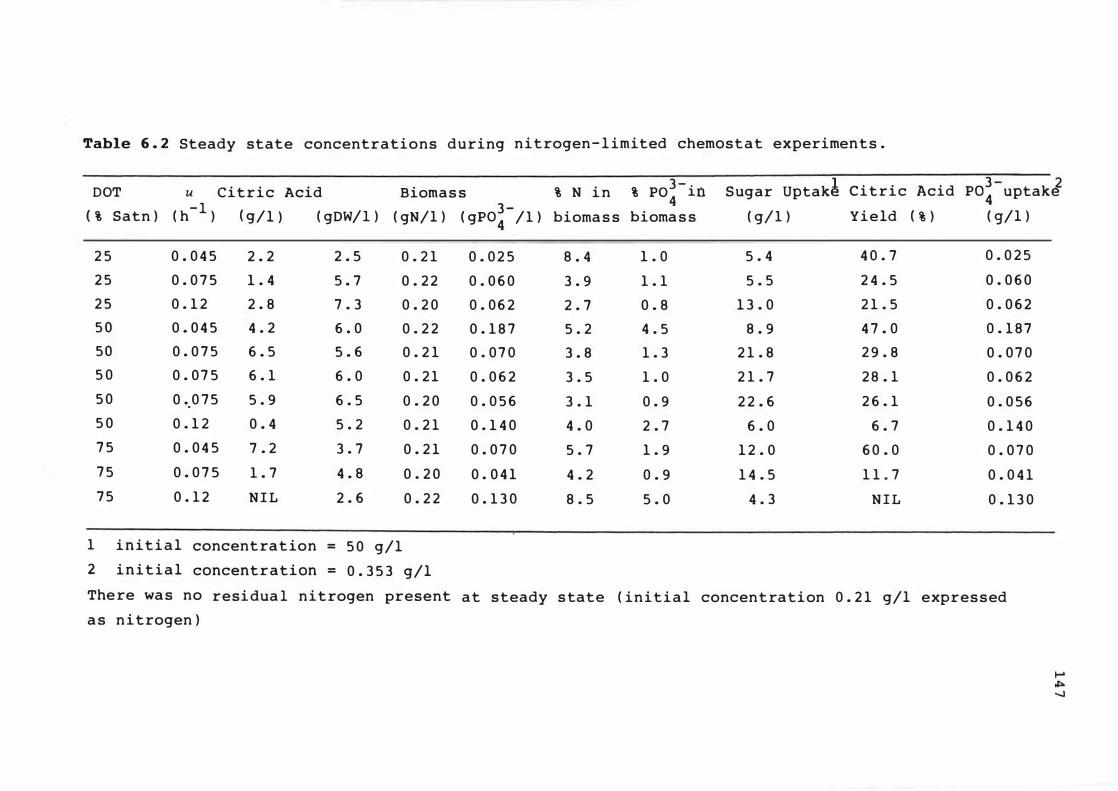
Table 6 . 2 Steady state concentrations during n i t rogen- l imited chemostat experiments .
% PO!- in Sugar Uptak� C i t r i c Acid P03 2 DOT u C i t r i c Acid Biomas s % N i n uptake
( h- l ) 3 - 4 ( % Satn ) ( g/l ) ( gDW/l ) ( gN/l ) ( gPo4 / 1 ) bioma s s bioma s s ( g/ 1 ) Y i e ld ( % ) ( g/l )
2 5 0 . 0 4 5 2 . 2 2 . 5 0 . 2 1 0 . 0 2 5 8 . 4 1 . 0 5 . 4 4 0 . 7 0 . 0 2 5
2 5 0 . 0 7 5 1 . 4 5 . 7 0 . 2 2 0 . 0 6 0 3 . 9 1 . 1 5 . 5 2 4 . 5 0 . 0 6 0
2 5 0 . 1 2 2 . 8 7 . 3 0 . 2 0 0 . 0 6 2 2 . 7 0 . 8 1 3 . 0 2 1 . 5 0 . 0 6 2
5 0 0 . 0 4 5 4 . 2 6 . 0 0 . 2 2 0 . 1 8 7 5 . 2 4 . 5 8 . 9 4 7 . 0 0 . 1 8 7
5 0 0 . 0 7 5 6 . 5 5 . 6 0 . 2 1 0 . 0 7 0 3 . 8 1 . 3 2 1 . 8 2 9 . 8 0 . 0 7 0
5 0 0 . 0 7 5 6 . 1 6 . 0 0 . 2 1 0 . 0 6 2 3 . 5 1 . 0 2 1 . 7 2 8 . 1 0 . 0 6 2
5 0 0 .. 0 7 5 5 . 9 6 . 5 0 . 2 0 0 . 0 5 6 3 . 1 0 . 9 2 2 . 6 2 6 . 1 0 . 0 5 6 5 0 0 . 1 2 0 . 4 5 . 2 0 . 2 1 0 . 1 4 0 4 . 0 2 . 7 6 . 0 6 . 7 0 . 1 4 0 7 5 0 . 0 4 5 7 . 2 3 . 7 0 . 2 1 0 . 0 7 0 5 . 7 1 . 9 1 2 . 0 6 0 . 0 0 . 0 7 0 7 5 0 . 0 7 5 1 . 7 4 . 8 0 . 2 0 0 . 0 4 1 4 . 2 0 . 9 1 4 . 5 1 1 . 7 0 . 0 4 1 7 5 0 . 1 2 N I L 2 . 6 0 . 2 2 0 . 1 3 0 8 . 5 5 . 0 4 . 3 N I L 0 . 1 3 0
1 i n i t i a l concent ra t ion = 5 0 g/l
2 i n i t i a l concentration = 0 . 3 5 3 g/l
The re wa s no resi dua l n i t rogen present a t steady s tate ( in i t i a l concen t ration 0 . 2 1 g/l expres sed
a s n i trogen )
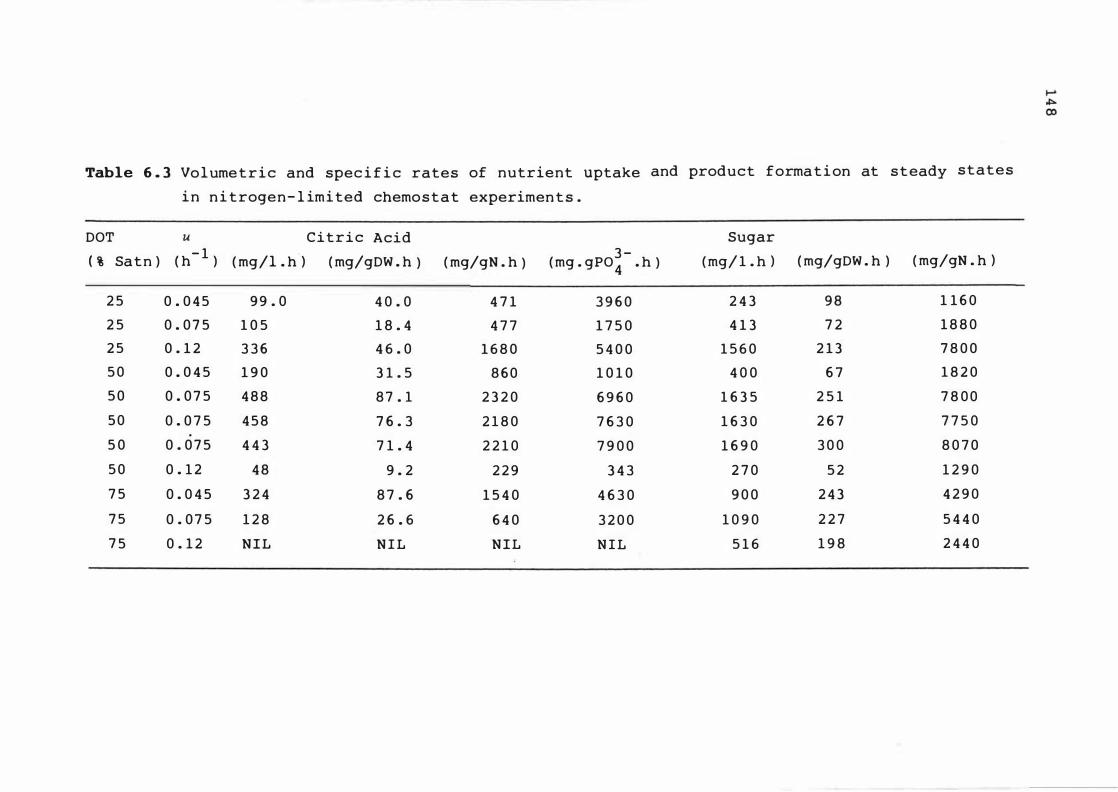
Table 6 . 3 Volume t r i c and spec i f i c rates of nutrient uptake and product forma t i on at s t eady states
i n n i trogen- l imi ted chemos t a t experimen t s .
DOT u Citric Acid Sugar
( % Satn ) ( h- 1 ) ( mg/l . h- ) ( mg/gDW . h ) ( mg/gN . h )
3 -( mg . gPO 4 • h ) ( mg/ 1 . h ) ( mg/gDW . h ) ( mg/gN . h )
2 5 0 . 0 4 5 9 9 . 0 4 0 . 0 4 7 1 3 9 6 0 2 4 3 9 8 1 1 6 0
2 5 0 . 0 7 5 1 0 5 1 8 . 4 4 7 7 1 7 5 0 4 1 3 7 2 1 8 8 0
2 5 0 . 1 2 3 3 6 4 6 . 0 1 6 8 0 5 4 0 0 1 5 6 0 2 1 3 7 8 0 0
5 0 0 . 0 4 5 1 9 0 3 1 . 5 8 6 0 1 0 1 0 4 0 0 6 7 1 8 2 0
5 0 0 . 0 7 5 4 8 8 8 7 . 1 2 3 2 0 6 9 6 0 1 6 3 5 2 5 1 7 8 0 0
5 0 0 . 0 7 5 4 5 8 7 6 . 3 2 1 8 0 7 6 3 0 1 6 3 0 2 6 7 7 7 5 0
5 0 0 . 0 7 5 4 4 3 7 1 . 4 2 2 1 0 7 9 0 0 1 6 9 0 3 0 0 8 0 7 0
5 0 0 . 1 2 4 8 9 . 2 2 2 9 3 4 3 2 7 0 5 2 1 2 9 0
7 5 0 . 0 4 5 3 2 4 8 7 . 6 1 5 4 0 4 6 3 0 9 0 0 2 4 3 4 2 9 0
7 5 0 . 0 7 5 1 2 8 2 6 . 6 6 4 0 3 2 0 0 1 0 9 0 2 2 7 5 4 4 0
7 5 0 . 1 2 N I L N I L N I L N I L 5 1 6 1 9 8 2 4 4 0
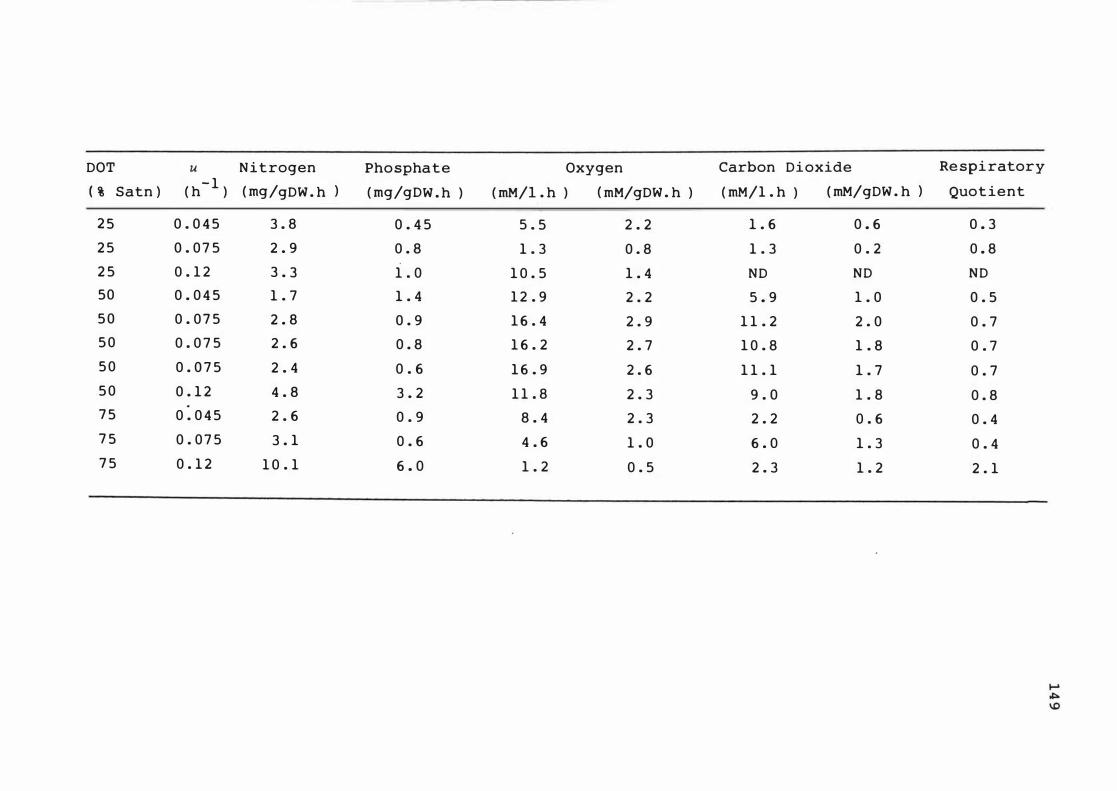
DOT u N i t rogen Phosphate Oxygen Carbon Dioxide Re spi ratory
( % Satn ) ( h- 1 ) ( mg/gDW . h ) ( mg/gDW . h ) ( mM/I . h ) ( mM/gDW . h ) ( mM/1 . h ) ( mM/gDW . h ) Quot ient
2 5 0 . 0 4 5 3 . 8 0 . 4 5 5 . 5 2 . 2 1 . 6 0 . 6 0 . 3
2 5 0 . 0 7 5 2 . 9 0 . 8 1 . 3 0 . 8 1 . 3 0 . 2 0 . 8
2 5 0 . 1 2 3 . 3 1 . 0 1 0 . 5 1 . 4 ND ND ND
50 0 . 0 4 5 1 . 7 1 . 4 1 2 . 9 2 . 2 5 . 9 1 . 0 0 . 5
5 0 0 . 0 7 5 2 . 8 0 . 9 1 6 . 4 2 . 9 1 1 . 2 2 . 0 0 . 7
5 0 0 . 0 7 5 2 . 6 0 . 8 1 6 . 2 2 . 7 1 0 . 8 1 . 8 0 . 7
5 0 0 . 0 7 5 2 . 4 0 . 6 1 6 . 9 2 . 6 1 1 . 1 1 . 7 0 . 7 5 0 0 . 1 2 4 . 8 3 . 2 1 1 . 8 2 . 3 9 . 0 1 . 8 0 . 8 7 5 0 . 0 4 5 2 . 6 0 . 9 8 . 4 2 . 3 2 . 2 0 . 6 0 . 4 7 5 0 . 0 7 5 3 . 1 0 . 6 4 . 6 1 . 0 6 . 0 1 . 3 0 . 4 7 5 0 . 1 2 1 0 . 1 6 . 0 1 . 2 0 . 5 2 . 3 1 . 2 2 . 1
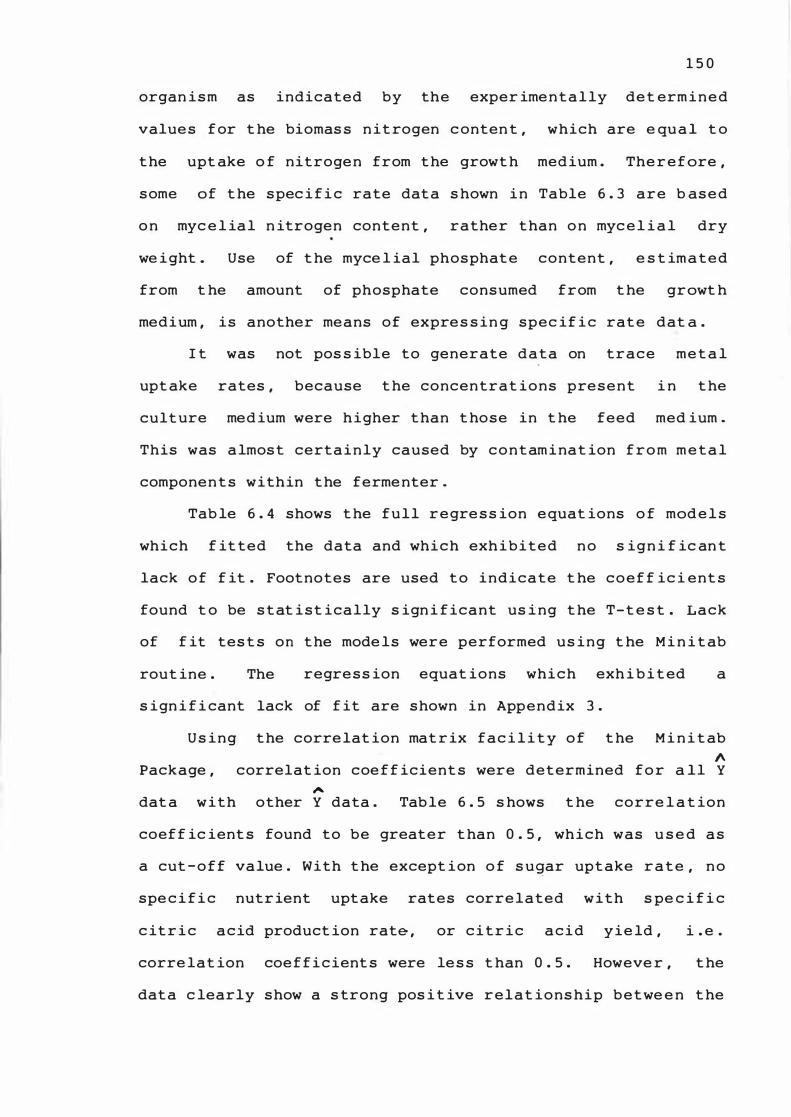
1 5 0
organ i s m as indicated by the exper ime n t a l ly de t erm i n e d
value s f or t he biomas s n it rogen c onten t , which are e qu a l t o
t he upt ake o f nitroge n from t he growt h med ium . The r e f ore ,
s ome of t he s pec i f i c rate dat a s hown i n Table 6 . 3 are b as e d
o n myc e l ia l n itrogen content , rather t han o n myc e l i a l dry
we i ght . Use of t he myce l ial phosphat e content , e s t im a t e d
from t he amount of phosphate consumed from t he growt h
medium , is another means of expre s s in g spec if i c rat e dat a .
I t was not pos s ible to generate d a t a on t r a c e me t a l
upt ake rates , because t he concentrat ions pre s e n t i n t he
cult ure med ium were h igher t han t hose in t he feed med ium .
This was a lmos t certa i n ly caused by c o n t am i nat ion f r o m m e t a l
componen t s within t he ferme nter .
Tab le 6 . 4 shows t he f u l l r e gre s s ion e quat ions o f mod e l s
which f it ted the data and whi c h exh i b i t e d n o s ign i f ic an t
lack o f f it . Footnotes are used t o i n d i c a t e t he c o e f f ic i ent s
found t o be s t at i s t ically s ign i f icant us ing t he T- t e s t . Lack
of f it tes t s on t he mode ls were performed us i n g t he M i n i t ab
rout ine . The regre s s ion equat ions whi c h exh i b i t ed a
s ign i f i cant lack of f it are s hown in Appendix 3 .
U s i n g t he corre lat ion mat r ix f a c i l i t y o f t he M i n i t ab A
Package , correlat ion coe f f icient s were determined f o r a ll Y "
dat a w i t h other Y data . Tab le 6 . 5 s hows t he corre l a t ion
coef f ic ient s found to be greater t han 0 . 5 , which was u s e d a s
a cut - o f f value . With t he except ion o f s u�ar upt ake r a t e , n o
spe c i f i c nutr ient upt ake rates corre lated w i t h s pe c i f i c
c it r i c a c id product ion rate , or c i t r i c a c i d yie ld , i . e .
corre lat ion coe f f i c ient s were le s s t han 0 . 5 . Howeve r , t he
dat a c learly s how a s trong pos i t ive r e l a t ions hip b e t we e n t he
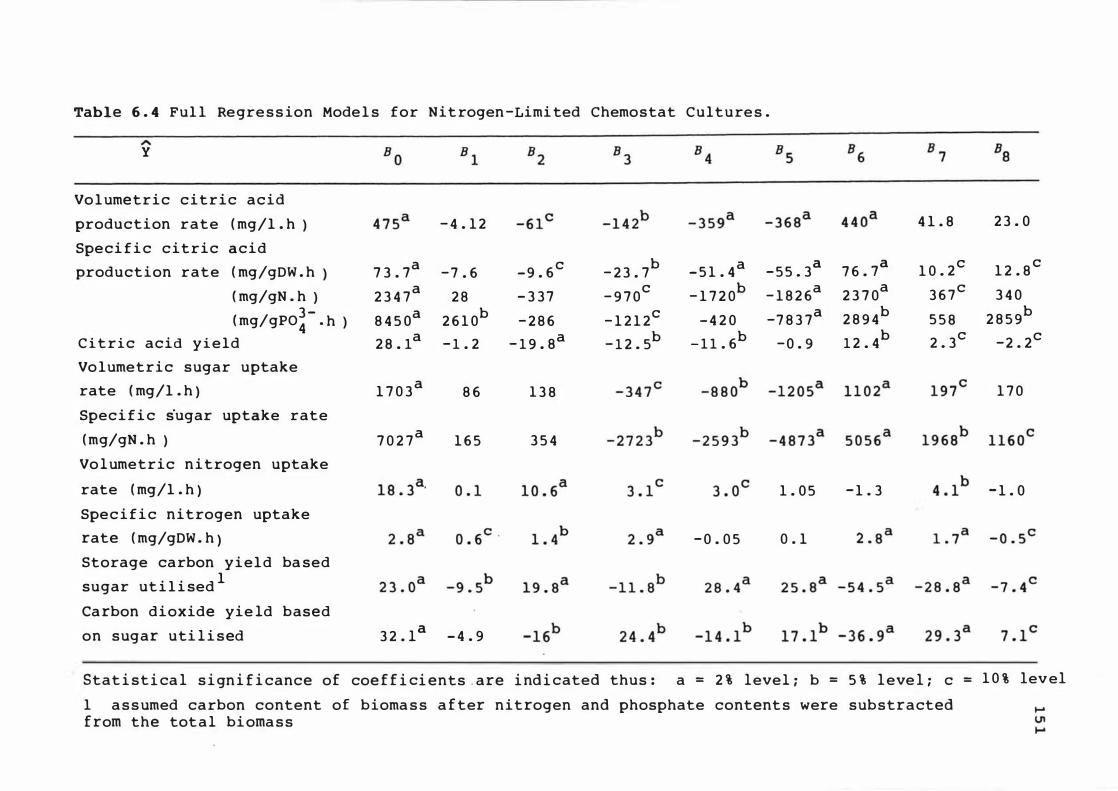
Table 6 . 4 Ful l Regre s s ion Mode l s for Nit rogen -Limi ted Chemostat Culture s .
,.. y
Vo l umetric citric acid
production rate ( mg/l . h )
Speci f i c citric acid
production rate ( mg/gDW . h )
( mg/gN . h ) 3 -( mg/gP04 · h )
C i t ric acid y i e ld
Vo lumetric sugar uptake
rate ( mg/l . h )
Speci f i c sugar uptake rate
( mg/gN . h )
Vo l umetric n i trogen uptake
rate ( mg/1 . h )
Spec i f i c nitrogen uptake
rate ( mg/gDW . h )
Storage carbon yield ba sed
sugar ut i l i sed l
Ca rbon dioxide yie ld based
on sugar uti l i sed
- 4 . 1 2
7 3 . 7a - 7 . 6 - 9 . 6 c
2 3 4 7 a 2 8 - 3 3 7
8 4 5 0a 2 6 1 0b - 2 8 6
2 8 . 1a - 1 . 2 - 1 9 . 8a
1 7 0 3 a 8 6 1 3 8
7 0 2 7 a 1 6 5 3 5 4
3 2 . la - 4 . 9
- 2 3 . 7b - 5 1 . 4 a - 5 5 . 3a
- 9 7 0c - 1 7 2 0b - 1 8 2 6a
- 1 2 1 2c - 4 2 0 -7 8 3 7a
- 1 2 . 5b - 1 1 . 6b - 0 . 9
1 . 0 5
- 0 . 0 5 0 . 1
7 6 . 7a
2 3 7 0a
2 8 9 4b
1 2 . 4b
- 1 . 3
4 1 . 8
1 0 . 2 c
3 6 7 c
5 5 8
2 . 3c
Stat i st i ca l s i gn i f i cance of coe f f i ci ents . are i nd i cated thus : a = 2 % level ; b = 5 % l eve l ; c =
1 a s s umed carbon content of bioma s s a f ter nitrogen and phosphate content s were substracted f rom the tot a l bi oma s s
2 3 . 0
1 2 . 8 c
3 4 0
2 8 5 9b
- 2 . 2c
1 7 0
- 1 . 0
1 0 % level
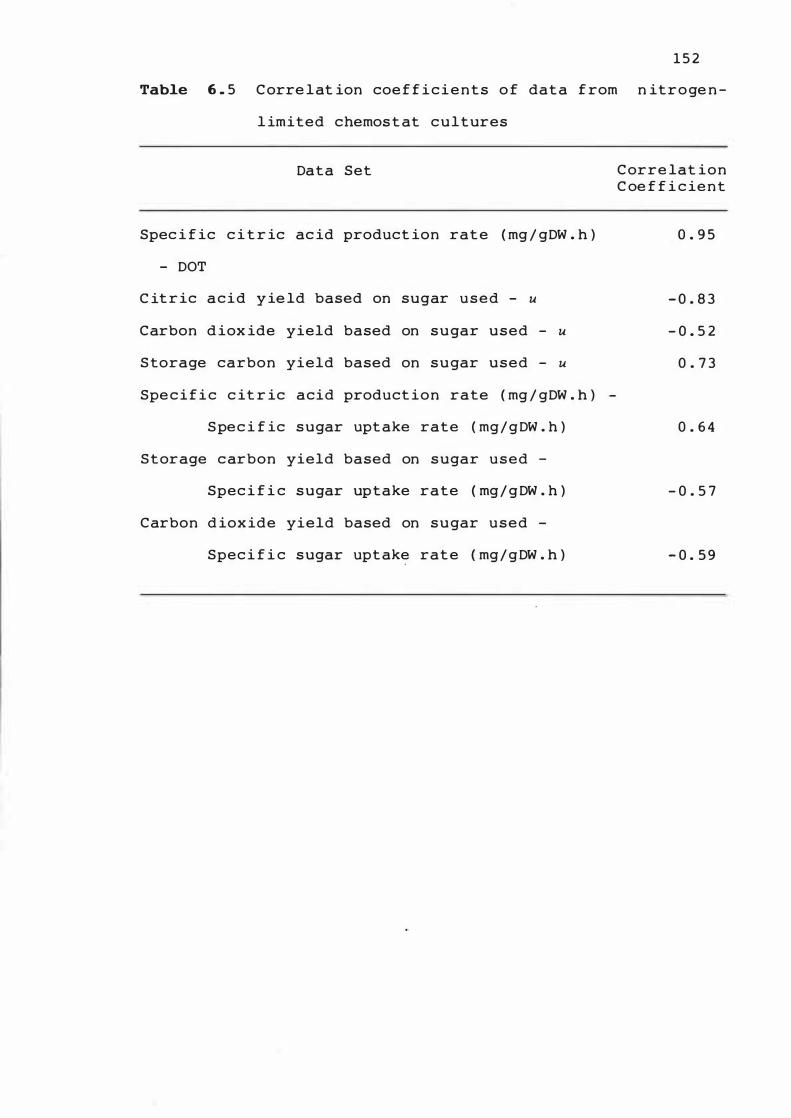
1 5 2
Table 6 . 5 C orre l at ion coe f f i c i e n t s o f dat a f rom n it r o ge n -
l imited chemos t at cultures
Data Set C orre lat i o n C oe f f i c ie n t
Spec i f ic c i t r ic ac id product ion rat e ( mg / gDW . h ) 0 . 9 5
- DOT
C it r ic a c i d y ie ld based on sugar u s e d - u - 0 . 8 3
Carbon d iox ide yield based on sugar used - u - 0 . 5 2
S torage carbon yield based on sugar used - u 0 . 7 3
Spe c i f i c c it r ic acid product ion rate ( mg / gDW . h ) -
S pec i f ic sugar upt ake rate ( mg / g DW . h ) 0 . 6 4
S t orage c arbon yield based on sugar used -
Spec i f i c sugar uptake rate ( mg / g DW . h ) - 0 . 5 7
Carbon d iox ide yield based on sugar used -
Spec i f i c sugar upt ake rat e ( mg / g DW . h ) - 0 . 5 9
1 5 3
spe c i f ic c it r ic acid product ion rate and t he DOT v a l ue o f
the culture . A negat ive c orre lation of s p e c i f ic grow t h r a t e
is observed w i t h t he c i t r ic ac i d y ield and with t he c ar b o n
d iox ide yie ld . However , a pos i t ive corre lat ion i s o b s erved
with the s t orage carbon y ield . I n t he case of t he s pe c i f i c
sugar uptake rate ( which i s dependent upon s pec i f ic grow t h
rate ) , a n e gat ive corre lat ion i s obs erved with bot h s t orage
carbon yie ld and carbon diox i de y i e ld . The s e dat a s ugge s t
t hat t o obtain high c i t r ic ac i d product ion rates and y ie ld s ,
the DOT value of the cult ure s hould be h i gh and t he s pe c if i c
growt h rate low .
I n an at t empt t o det ermine t he opt imum spec i f ic grow t h
rate and DOT values for max imum c it r ic ac id product io n r a te s
and yie lds , t he regre s s ion e quat ions f r om Table 6 . 4 wer e
used t o predict response s ur faces , con s t ructed a s 3 -
d imens ion a l cont our diagr ams us i n g a programmed I BM X T
personal computer ( Boag , pers . comm . 1 9 8 5 ) . F igure 6 . 1 s hows
t he predicted volumetric c it r ic acid product ion r a t e as a n
e longated dome with t he apex a t t he centre point . F i gu r e
6 . 2 , which s hows t he predict ions for t he s pe c i f ic c it r i c
acid product ion rat e based o n t o t a l b i omas s ( myce l i a l d r y
we ight ) , a l s o shows a max imum at t he cen t re
exhibit i n g a r idge from DOT 7 5 % of s aturat ion / u =
po i n t , b u t
0 . 0 4 5 h - 1
t o DOT 2 5 % of saturat ion / u = 0 . 1 2 h - 1. I f , however , t he
spec i f ic c i t r ic acid product ion rate is predicted b as e d o n
myce l ia l n i t rogen or phosphate con t e nt s , a s s hown i n F i gu r e s
6 . 3 and 6 . 4 respect ively , t he overall s hape of t he c o n t o u r
s urface doe s not alter great ly , but t h e max imum p o i n t i s
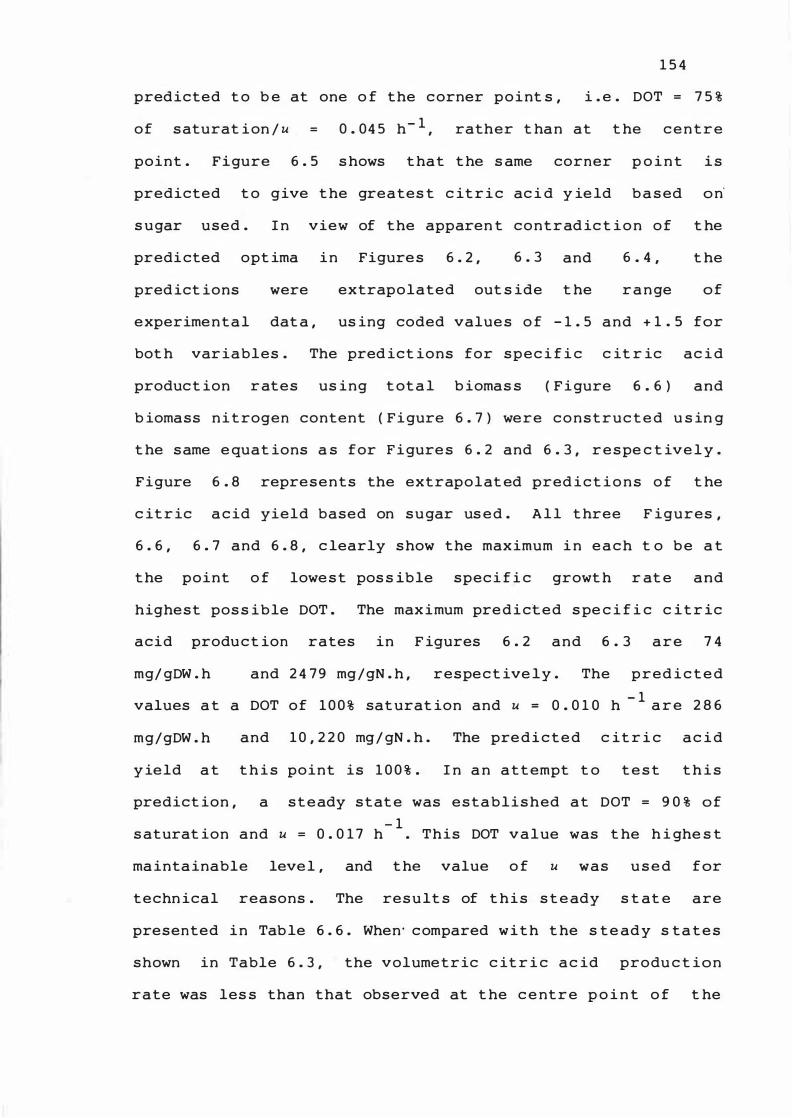
1 5 4
predicted t o b e at one o f the c orner p o i nt s , i . e . DOT = 7 5 %
of s aturat i on / u = 0 . 04 5 h- 1 , rather t han at t he c e n t r e
point . Figure 6 . 5 s hows t hat t he s ame corner p o i n t i s
predicted t o g ive t he greates t c it r i c ac i d y ie ld b a s ed o n
s ugar used . I n view of the apparen t contrad ic t i o n o f t he
predi cted opt ima i n Figure s 6 . 2 , 6 . 3 and
pred ict ions were extrapolated out s ide t he
6 . 4 , t he
r a n ge o f
experime n t a l dat a , us ing coded value s o f - 1 . 5 and + 1 . 5 for
bot h var iables . The pred ict ions for s p e c i f i c c it r ic ac i d
product ion r ates us ing t ot a l b iomas s ( F i gure 6 . 6 ) and
b iomass n i t rogen content ( Fi gure 6 . 7 ) were c o n s t r uc t e d u s in g
t he s ame e quat ions a s for F i gure s 6 . 2 and 6 . 3 , r e s pe c t ive l y .
Figure 6 . 8 repre s e n t s the extrapolat ed pred i c t i o n s o f t he
c it r ic a c id yield based on s u gar us e d . A l l t hree F igures ,
6 . 6 , 6 . 7 and 6 . 8 , c learly s how the maximum i n e a c h t o b e a t
t he point o f lowe s t pos s ible spec i f � c growt h r at e and
highest pos s i b le DOT . The max imum pre d i ct e d s pe c i f i c c it r ic
acid produ c t ion rates in F igures 6 . 2 and 6 . 3 a r e 7 4
mg/ gDW . h and 2 4 7 9 mg / gN . h , respe c t ive ly . The p r e d i c t e d
values a t a DOT of 1 0 0 % sat urat ion and u = 0 . 0 1 0 h - 1 a r e 2 8 6
mg/gDW . h and 1 0 , 2 2 0 mg / gN . h . The pre d i c t e d c it r i c a c i d
y ield a t t h i s point is 1 0 0 % . I n a n a t t empt t o t e s t t h i s
predict ion , a s t e ady s t at e was e s t a b l i s hed at DOT = 9 0 % o f
- 1 s aturat ion and u = 0 . 0 1 7 h . This DOT v a l ue was t he h i ghe s t
ma inta inable leve l , and t he value o f u was u s e d f or
t echn ical reasons . The res u lt s of t hi s s t e ady s t at e are
presented i n Tab le 6 . 6 . When' c ompared w i t h t he s t e ad y s t a t e s
shown in Table 6 . 3 , the volume t r ic c it r i c a c id produ c t ion
rate was les s than that observed at t he c e nt r e p o i n t o f t he
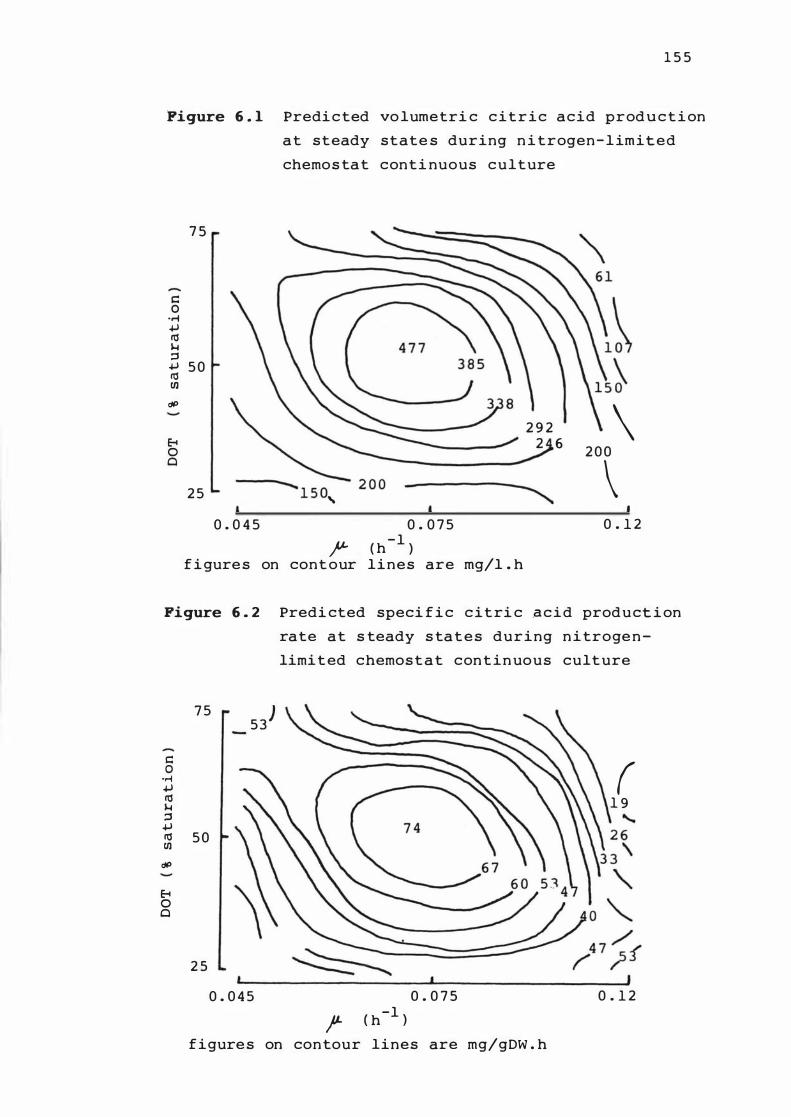
1 5 5
Figure 6 . 1 Predi c ted vo lumetri c c i t r i c acid prod u c t i on
a t s t eady state s during n i trogen- l imited
chemos ta t con t i nuous c u l ture
I::: 0
.,-i � � 1-1 ::l � � III
dP
� 0 0
7 5
5 0
2 5 �
1 5 0 ,
0 . 0 4 5 0 . 0 7 5
f" ( h-l
) f i gure s on cont our l i n e s are mg/l . h
2 9 2 2 6 \
\ 2 0 0
0 . 1 2
Figure 6 . 2 Predi cted speci f i c c i t ri c a c i d prod u ct i on
rate a t s teady s ta t e s during n i troge n
limi t ed chemos t a t con t in uous cult ure
I::: 0 .,-i � � 1-1 ::l � � III
dP
� 0 0
7 5 5 3 )
5 0
2 -5
0 . 0 4 5 0 . 0 7 5
,.. ( h-l )
f i gure s on con tour lines are mg/gDW . h
( 1 9
0 . 1 2
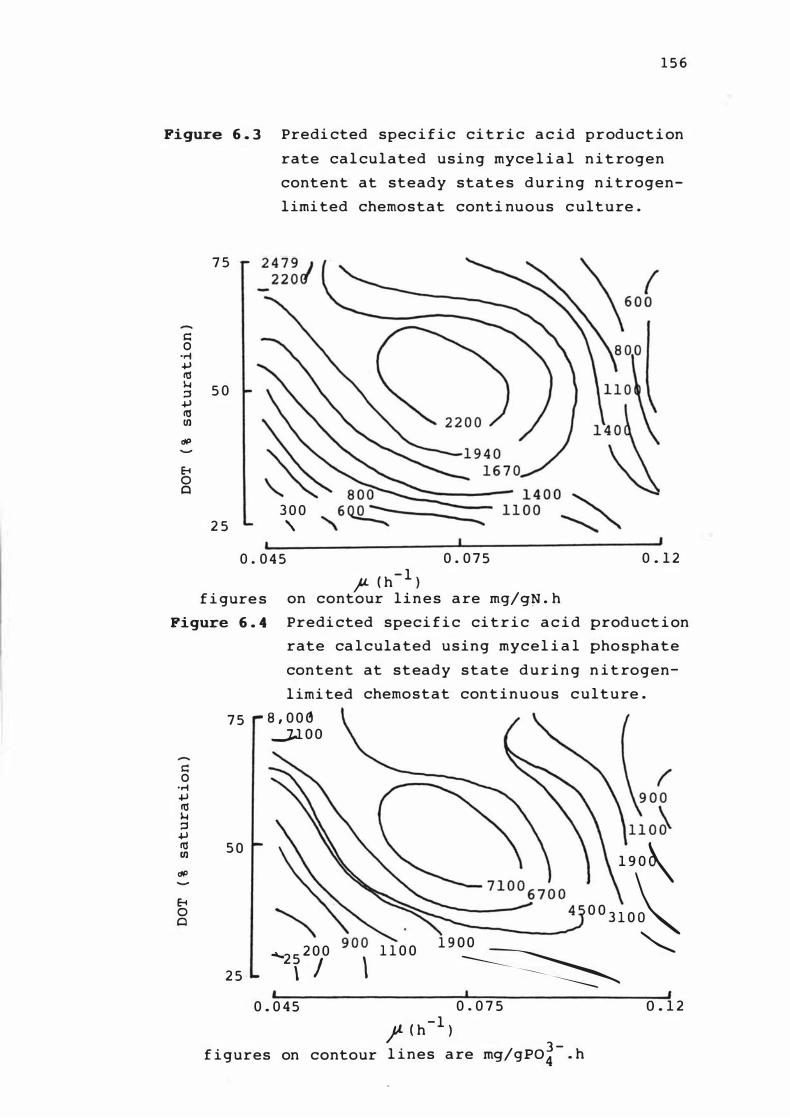
1 5 6
Figure 6 . 3 Predi cted spec i f i c ci t r i c a c i d p r oduct i on
rate ca l cu l ated using myce l i a l n i t rogen
content at steady stat e s d u r i n g n i t rogen
l imi ted cherno s t a t conti nu o u s c u l t u re .
7 5
s:: 0 .... +J tlS 1-1 5 0 ::s +J tlS (J)
(Jp
E-l 0 Cl
2 5
2 4 7 9 J 2 2 0 (1'
3 0 0 ,
I 0 . 0 4 5 0 . 0 7 5 0 . 1 2
,P ( h- l ) f i gure s
Figure 6 . 4
on contour l i n e s a re mg/g� . h
Predi cted speci f i c ci t r i c a c i d product i on
rate ca l cula ted using myce l i a l pho sphate
content at s t eady s t a t e d u r i n g n i t rogen-
l imi ted chernostat con t i n u o u s c u l t u re .
7 5 8 , 0 0 � Jl O O
s:: f 0 .... +J tlS 1-1 ::s +J tlS 5 0
1 9 0' (J) (Jp
E-l 0 0 3 1 0� 0 c
�25 2 0 0 1 1 0 0 1 9 0 0 �
2 5 \ / \ � I I ,
0 . 0 45 0 . 0 7 5 0 . 1 2 jJ- ( h - l )
f i gures on contour l i nes a re mg/gpo� - . h
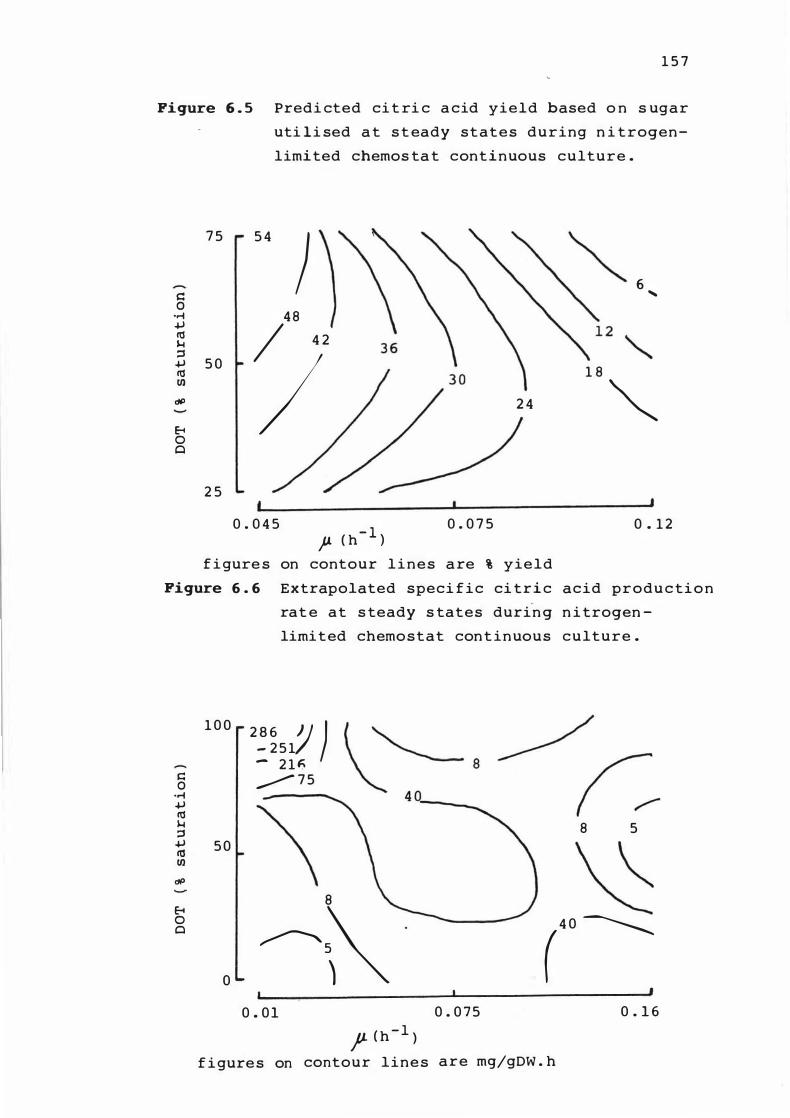
1 5 7
Figure 6 . 5 Predi cted ci t ri c a cid y i e l d based o n s ugar
uti l i sed a t s t eady s t a t e s during n i t rogen
limi ted chemos ta t con t i n uous culture .
7 5 5 4
) s:: 6
... 0 .r-i 48 +J / 4 2 lIS j...j ::s +J 5 0
/
lIS Ul <JP
E-i
1 8 2 4 "'"
0 Cl
2 5
0 . 0 4 5 P C h - I )
0 . 0 7 5 0 . 1 2
f i gure s on contour l i n e s a re % yield
Figure 6 . 6 Extrapolated speci f i c ci tri c acid produ c ti o n
c:: 0 .r-i +J lIS j...j ::s +J lIS Ul <JP
E-i 0 Cl
1 0 0
5 0
0
rat e a t s teady s tates durin g n i trogen
limi t ed chemo s t a t con t in uous culture .
2 8 6 1) )
�:-- 8 �r - 2 5 1 - 2 1 15 � 7 5
\
8 5
~ 8 �� 4 0 �
(
0 . 0 1 0 . 0 7 5 0 . 1 6
P C h - l )
f i gure s on contour l i n e s a r e mg/gDW . h
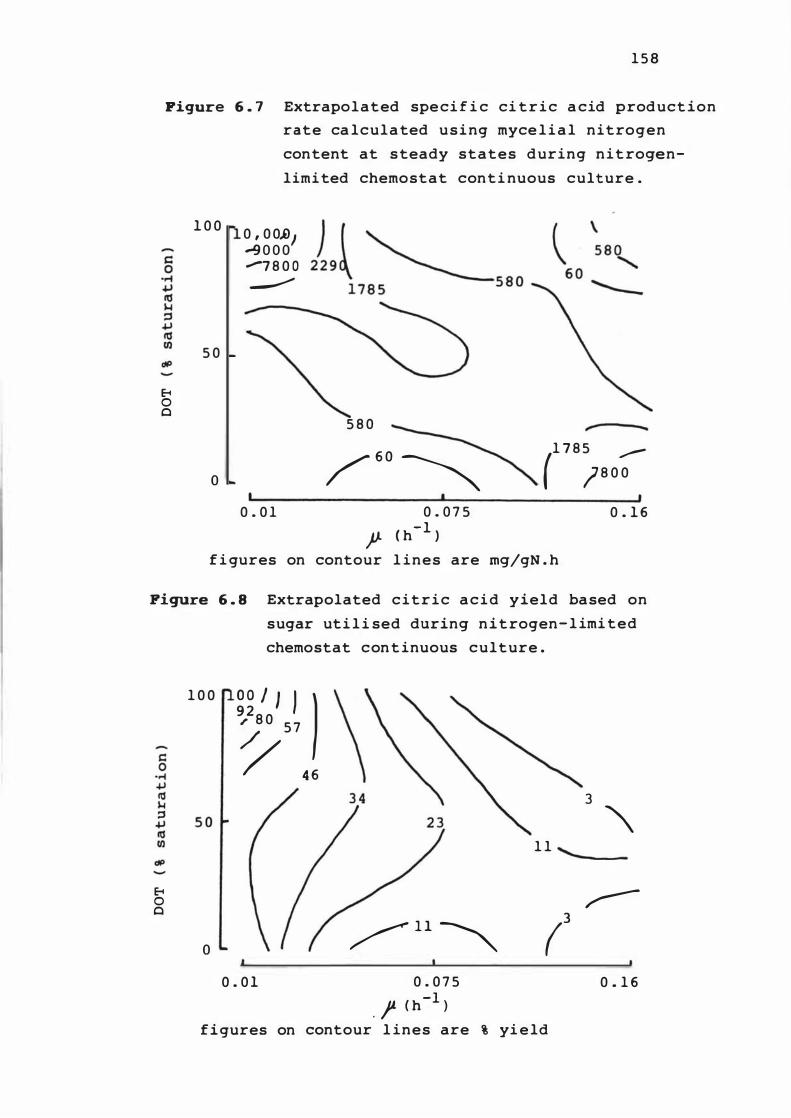
1 58 Pigure 6 . 7 Extrapolated spe ci f i c ci t r i c a cid prod uct ion
rate ca lcula ted u s i ng myce l i a l nitrogen
content at s teady states d uring n i t rogen
limi ted chemostat con t i nuous culture .
1 0 0
5 0
0 , 0 0..0, � O O O --78 0 0 ---'"
8 o Cl
o 0 . 0 1 5 8 0
/ 6 0 � 0 . 07 5
P C h -1 )
-(1 7 8 5 ,,--
1 8 0 0 0 . 1 6
f i gures on contour l ines are mg/gN . h
Pigure 6 . 8 Extrapolated c i t r i c a c i d yield based on
sugar uti l i sed during n i t rogen- l imi t e d
chemostat con t inuous culture .
8 o Cl
1 0 0 �� I I J ) , 8 0 57 '/ 4 6
o 0 . 0 1 / l l �
0 . 0 7 5 . ,P C h-I
)
1 1 ..........
/
f i gures on contour l ines are % yi e ld
3
"
r--
0 . 1 6
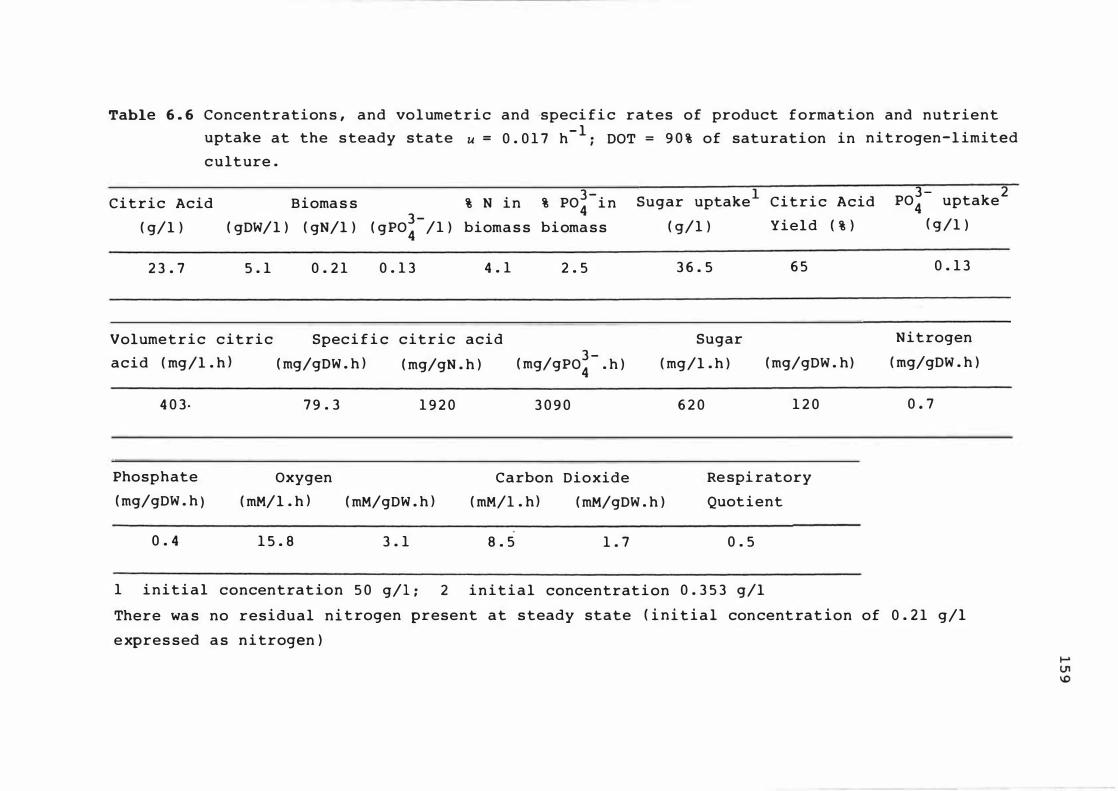
Table 6 . 6 Concentration s , and vol umetric and ·speci f i c rates of product f orma t i on and nutrient
uptake at the s teady state u = 0 . 0 1 7 h- l i DOT = 9 0 % of saturati on in n i t rogen- l imited
cult ure .
Citric Acid Bioma s s % N i n 3 -% P04 i n
( g/l ) 3 -( gDW/l ) ( gN/l ) ( gP04 /1 ) bioma s s bioma s s
2 3 . 7 5 . 1 0 . 2 1 0 . 1 3 4 . 1 2 . 5
Volumet r i c c i t r i c Speci f i c citric acid
acid ( mg/l . h ) ( mg/gDW . h ) ( mg/gN . h )
4 0 3· 7 9 . 3 1 9 2 0
Phosphate Oxygen
3 -( mg/gpo4 . h )
3 0 9 0
Carbon Dioxide
1 Sugar uptake Citric Acid
( g/l )
3 6 . 5
Sugar
( mg/l . h )
6 2 0
Yield ( % )
6 5
( mg/gDW . h)
1 2 0
Re spi ratory
( mg/gDW . h ) ( mM/l . h ) ( mM/gDW . h ) ( mM/I . h ) ( mM/gDW . h ) Quot ient
0 . 4 1 5 . 8 3 . 1 8 . 5 1 . 7 0 . 5
1 i n i t i a l concentrat ion 5 0 g/l : 2 i n i t i a l concentrat i on 0 . 3 5 3 g/l
3 2 P04 uptake
( g/l )
0 . 1 3
N i trogen
( mg/gDW . h )
0 . 7
There wa s no residual n i t rogen present a t s teady state ( i n i t i a l concent rat ion of 0 . 2 1 g/1
e xpres sed a s n i trogen )
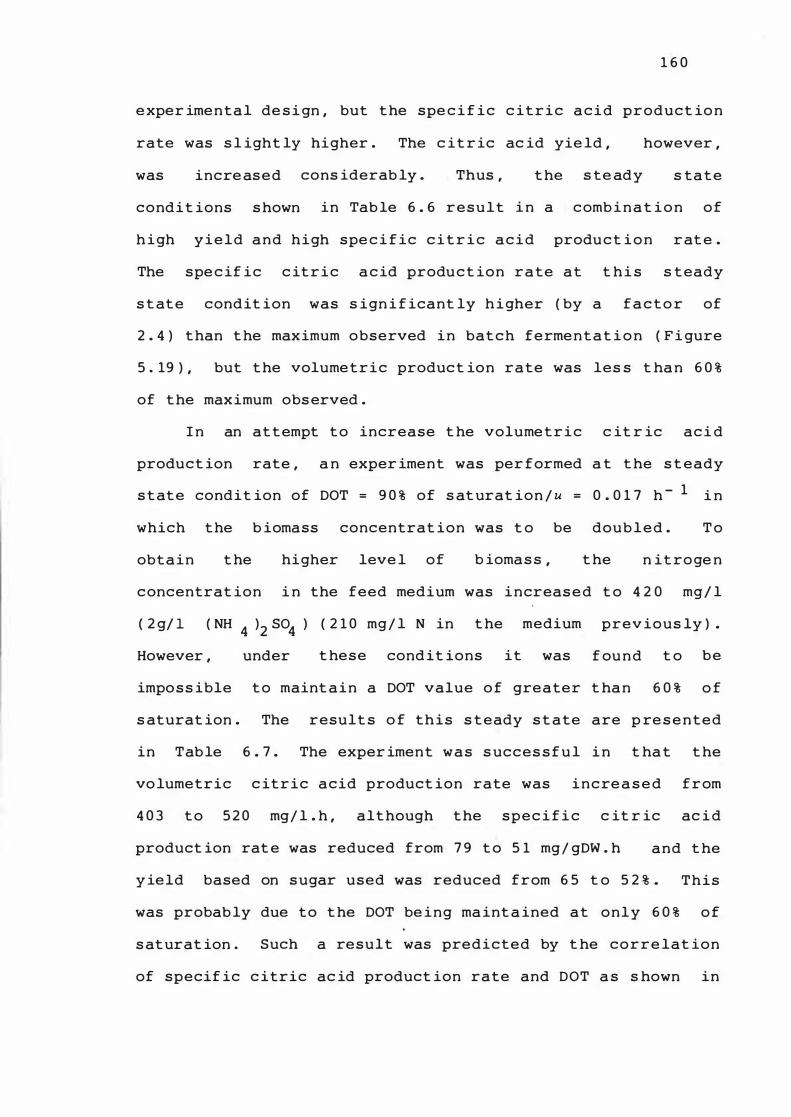
1 6 0
e xper ime n t a l de s i gn , but t he spe c i f i c c it r i c a c i d product io n
rate was s l ight ly higher . The c it r ic ac id yie ld , however ,
was incre as e d
cond i t ions s hown
cons iderab ly . Thus ,
in Tab le 6 . 6 r e s u l t
t he
i n a
s te ady s ta t e
c omb i n a t i o n o f
h i gh y i e l d a n d high spe c i f ic c i t r i c a c i d produ c t i o n r at e .
The spe c if ic c it r i c a c id produ c t ion rate at t hi s s t eady
s t at e condit ion was s ign i f icant ly h i gher ( by a f a c t o r of
2 . 4 ) t han t he maximum observed i n bat c h ferme n t at i o n ( F i gure
5 . 19 ) , but t he volume t r i c product ion rate was les s t ha n 6 0 %
of t he maximum obs erved .
I n an at t empt t o increase t he volume t r i c c it r ic ac i d
product ion rate , a n exper iment was per formed a t t he s t eady
s t at e condit ion of DOT = 9 0 % of s at urat ion / u = 0 . 0 1 7 h - 1 i n
which t he b iomass concentrat ion was t o be doub l e d . T o
obt a i n t he higher leve l of b iomas s , t he n it ro ge n
c oncentrat ion i n the feed medium was i ncreas e d t o 4 2 0 mg / l
( 2 g/ 1 ( NH 4 )2 S04 ) ( 2 1 0 mg / l N in t he
However , under t hese cond it ions
medium
it was
prev ious ly ) .
f ou n d t o be
impo s s ible t o maint a i n a DOT value o f greater t ha n 6 0 % o f
s aturat ion . The result s o f this s t eady s t ate are p re s e n t e d
in Tab le 6 . 7 . The exper iment w a s s ucces s f u l i n t ha t t he
vo lumetric c it r i c acid product ion rate was i n c re a s e d f r om
4 0 3 t o 5 2 0 mg/ l . h , alt hough t he s p e c i f i c c it r ic ac i d
product ion rat e was reduced from 7 9 t o 5 1 mg / gDW . h and t he
y ield based on s ugar used was reduced from 6 5 t o 5 2 % . T h i s
was probab ly due to t he DOT be ing ma int a ined at o n l y 6 0 % o f
s at urat ion . Such a result was predicted by t he c o r r e lat ion
of specif ic c itric ac id product ion rate and DOT a s s hown in
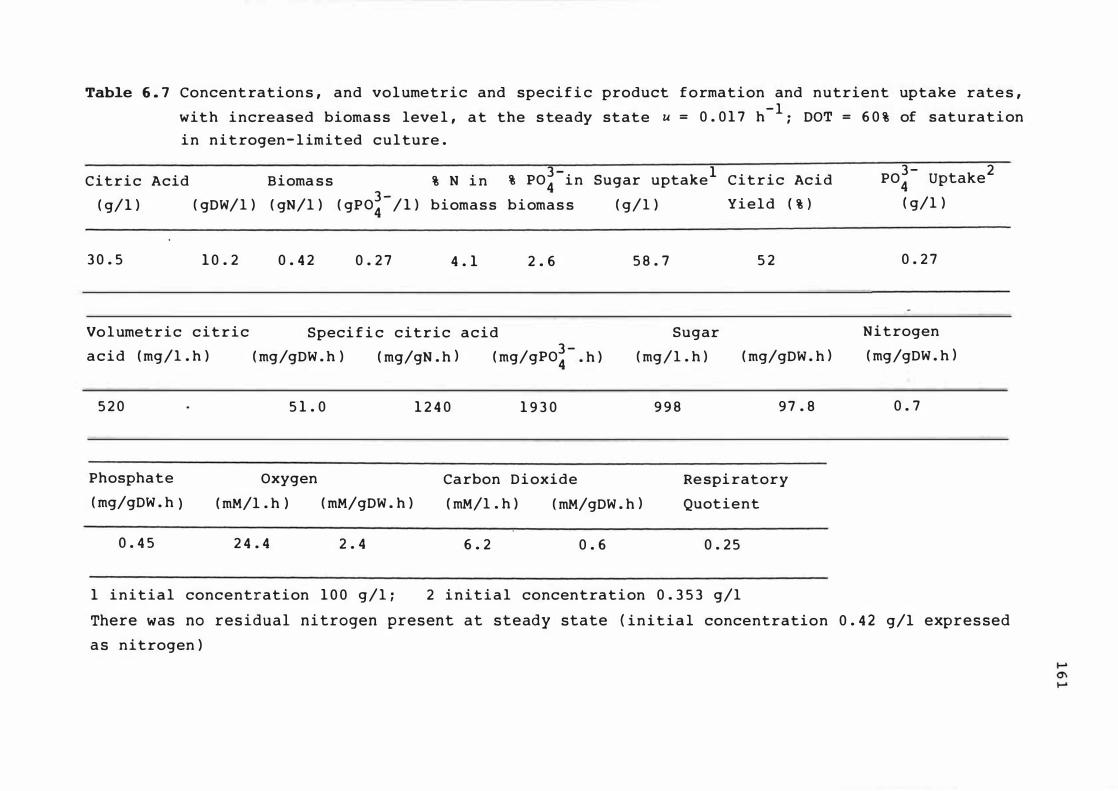
Table 6 . 7 Concent ration s , and vol umetric and speci f i c product f o rmation and nutrient uptake rate s ,
with i ncreased bioma s s leve l , a t the s teady state u = 0 . 0 1 7 h- l ; DOT = 6 0 % of satura t i on
i n n i t rogen- l imited cul ture .
( g/l ) Yield ( % ) ( g/ 1 )
Bioma s s 3 -( gDW/l ) ( gN/l ) ( gPo4 / 1 ) biomas s b i omas s
% N i n 3 - 1 % P04 i n Sugar uptake Citric Acid Citric Acid
3 0 . 5 1 0 . 2 0 . 4 2 0 . 2 7 4 . 1 2 . 6 5 8 . 7 5 2
Vo l umetric c i t r i c
a c i d ( mg/l . h )
Speci f i c citric acid 3 -( mg/gDW . h ) ( mg/gN . h ) ( mg/gpo4 . h )
Sugar
( mg/l . h ) ( mg/gDW . h )
5 2 0
Phosphate
( mg/gDW . h )
0 . 4 5
5 1 . 0
Oxygen
( mM/l . h ) ( mM/gDW . h )
2 4 . 4 2 . 4
1 2 4 0 1 9 3 0
Carbon D i oxide
( mM/l . h ) ( mM/gDW . h )
6 . 2 0 . 6
9 9 8 9 7 . 8
Re spi ratory
Quotient
0 . 2 5
1 i n i t i a l concentration 1 0 0 g/l ; 2 i n i t i a l concentration 0 . 3 5 3 g/l
3 - 2 P04 Uptake
( g/l )
0 . 2 7
N i trogen
( mg/gDW . h )
0 . 7
There was no res idual ni trogen present at steady state ( in i t i a l concentration 0 . 4 2 g/l expres sed
a s nitrogen )
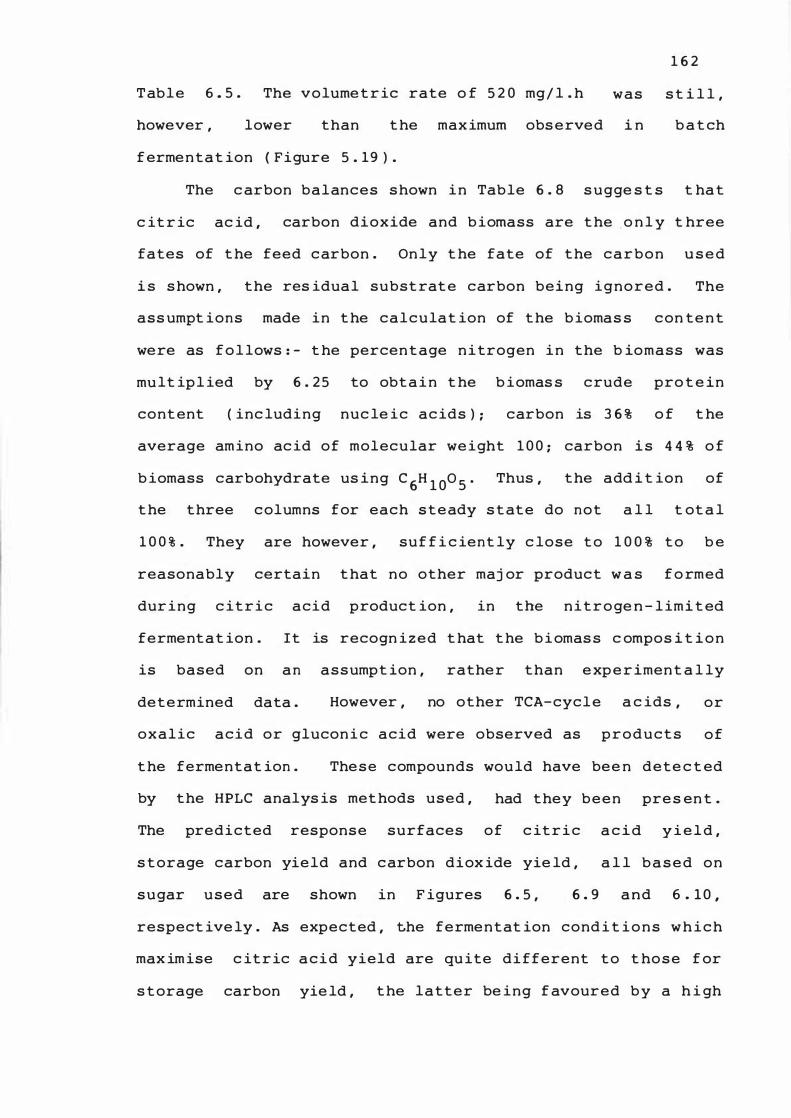
1 6 2
T able 6 . 5 . The volume t r ic rate o f S 2 0 mg/ l . h was s t i l l ,
however , lower than t he max imum obs erved i n b a t ch
f erme n t a t ion ( Figure S . 19 ) .
The c arbon balances s hown i n Table 6 . 8 s ugge s t s t ha t
c it r ic ac id , carbon dioxide and b iomass are t he , o n l y t hree
fates of t he feed c arbon . On ly t he fate of the c a r b o n u s e d
i s s hown , the res idual subst rat e carbon being ignored . The
ass umpt ions made in t he calculat ion of t he b iomas s c on te n t
were as f o l lows : - t he percen t age n i trogen i n the b iomass was
mu lt ip l ied by 6 . 2 S to obt a i n t he b iomas s crude pro t e in
cont ent ( inc luding nuc le ic ac ids ) ; carbon is 3 6 % o f t he
average amino ac id of molecular we ight 1 0 0 ; carbon i s 4 4 % o f
b iomass carbohydrate us ing C 6H 1 00 S • Thus , the add i t ion of
t he three c olumns for each s t e ady s t at e do not a l l t ot a l
1 0 0 % . They are however , suf f i c ient ly c lose t o 1 0 0 % t o b e
reasonably certain t hat no other maj or product w a s f o rmed
dur ing c it r i c acid product ion , in the n i t r o ge n - l imi t ed
ferment a t ion . It is recogn i z e d t hat t he b i omas s c ompos i t i o n
is based on a n assumpt ion , rather than e xp e r imen t a l ly
determined data . However , no other TCA-cycl e a c ids , or
oxalic acid or glucon i c acid were observed as p r o d u c t s o f
t he fermentat ion . The s e compounds wou ld have bee n dete c t ed
by the HPLC analys is met hods used , had they b e e n pre s en t .
The predicted response surfaces of c it r i c
s t orage carbon yie ld and c arbon diox ide yie ld ,
a c i d y i e l d ,
a l l b a s e d on
sugar used are shown in F igures 6 . S , 6 . 9 a n d 6 . 1 0 ,
respect ive ly . As expected , the ferme n t at ion cond i t i o n s w h i c h
max im ise c it r ic a c i d yield are qu ite di fferent t o t ho s e f or
s t orage carbon yie ld , t he latter be ing f avoured b y a h i gh
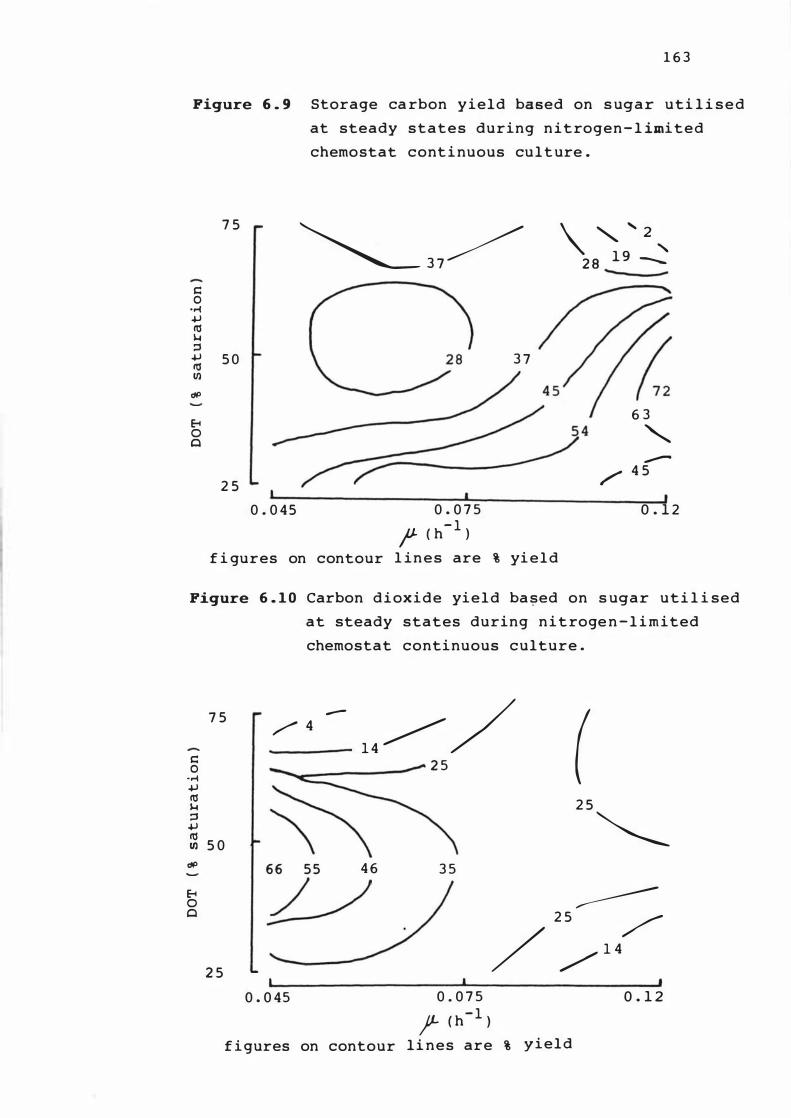
1 6 3
Figure 6 . 9 Storage ca rbon yield based on s ugar uti l i s e d
at steady s t a t e s during n i t rogen - l imi ted
chemostat cont i nuous cul t ure .
7 5
� 3 7� \ ,, ' 2,
2 8 1 9 --- -
c: 0
..... +J I'd 1-1 ::l +J 5 0 3 7 I'd IJ)
tiP
8 6 3
0 " Cl �
/ 4 5 2 5
I I 0 . 0 45 0 . 0 7 5 0 . 1 2
? C h- I
)
f i gures on contour l in e s are % yi e l d
Figure 6 . 1 0 Carbon d i ox i d e yie l d ba sed on s ugar uti l i sed
at steady states during n i t roge n - l i m ited
chemostat continuous culture .
7 5 -
1 4 �/ ( / 4
c: 2 5 0 ..... +J I'd 2 5 1-1
'\
::l � +J I'd 5 0 IJ)
tiP 66 55 4 6 3 5 8 :!-/ ,,-----0 Cl 2 5 /
/ /1 4
2 5 , 0 . 0 45 0 . 0 7 5 0 . 1 2
jl- C h- l )
f i gures on contour l i n e s are % y i e l d
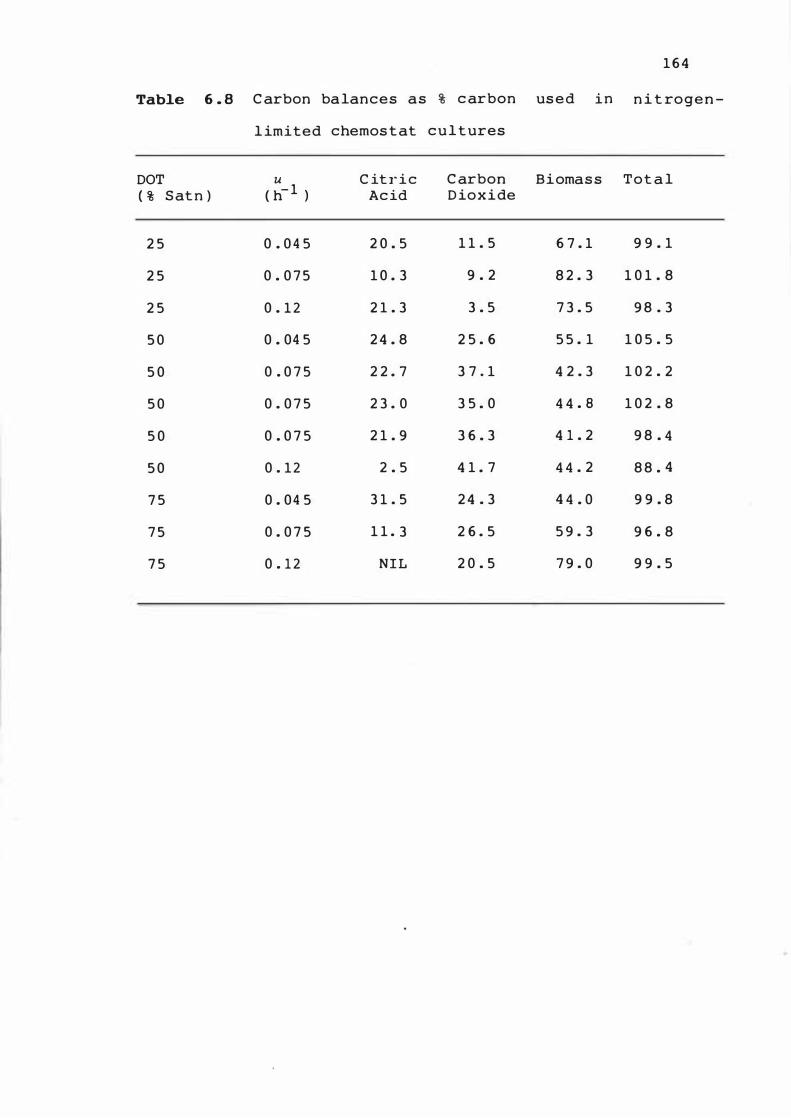
1 6 4
Table 6 . 8 C arbon balances as % c arbon us e d i n n i t rogen -
l imited chemos t at c u l t ures
DOT u C it r i c C arbon Biomas s Tot a l ( % S at n ) ( h- 1 ) Ac id D ioxide
2 5 0 . 0 4 5 2 0 . 5 1 1 . 5 6 7 . 1 9 9 . 1
2 5 0 . 0 7 5 1 0 . 3 9 . 2 8 2 . 3 1 0 1 . 8
2 5 0 . 1 2 2 1 . 3 3 . 5 7 3 . 5 9 8 . 3
5 0 0 . 04 5 2 4 . 8 2 5 . 6 5 5 . 1 1 0 5 . 5
5 0 0 . 0 7 5 2 2 . 7 3 7 . 1 4 2 . 3 1 0 2 . 2
5 0 0 . 0 7 5 2 3 . 0 3 5 . 0 4 4 . 8 1 0 2 . 8
5 0 0 . 0 7 5 2 1 . 9 3 6 . 3 4 1 . 2 9 8 . 4
5 0 0 . 1 2 2 . 5 4 1 . 7 4 4 . 2 8 8 . 4
7 5 0 . 04 5 3 1 . 5 2 4 . 3 4 4 . 0 9 9 . 8
7 5 0 . 0 7 5 1 1 . 3 2 6 . 5 5 9 . 3 9 6 . 8
7 5 0 . 1 2 N I L 2 0 . 5 7 9 . 0 9 9 . 5
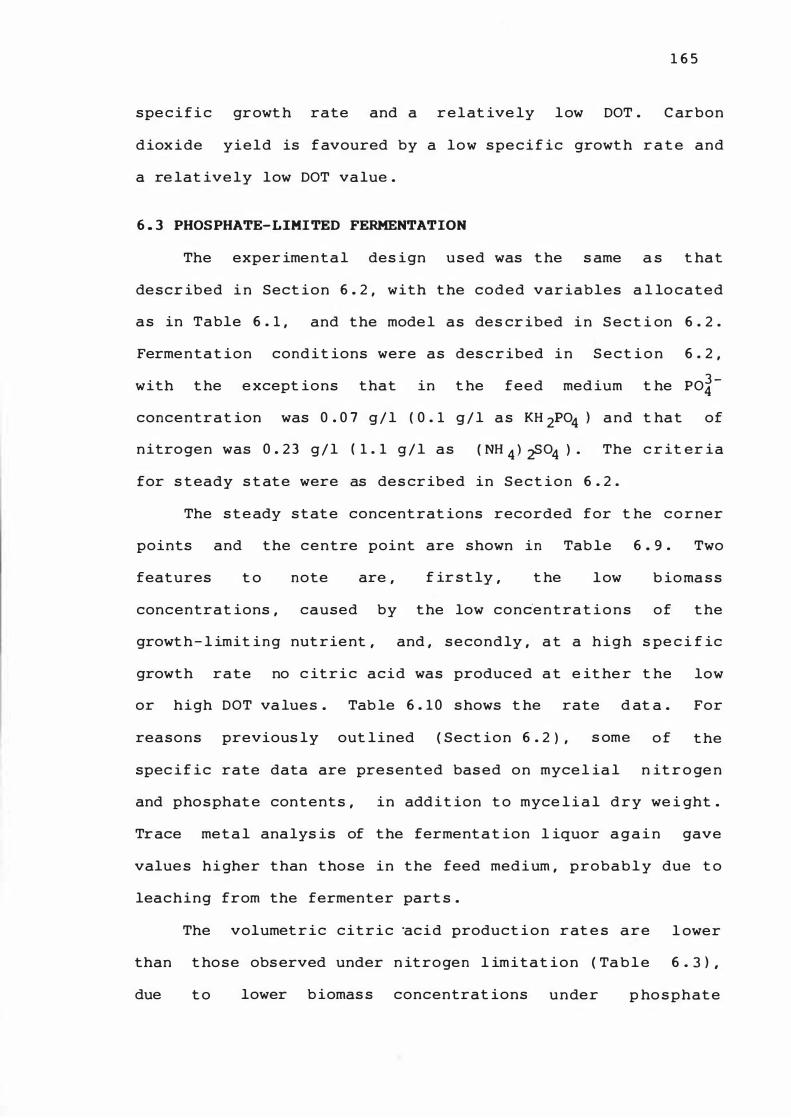
1 6 5
spe c i f i c growt h rate and a r e l at ive ly l ow DOT . C arbon
d iox i de yield is f avoured by a low s pe c i f ic growt h r a t e and
a re lat ive ly low DOT value .
6 . 3 PHOSPHATE-LIMITED FERMENTATION
The exper ime n t a l des ign u s ed was t he s ame a s t hat
descr ibed i n Sect ion 6 . 2 , with t he coded var iables a l lo ca t e d
a s in Table 6 . 1 , and the mode l as des cr ibed i n S e c t i on 6 . 2 .
Ferme n t a t ion cond i t ions were as des c r ibed i n S e c t i o n 6 . 2 ,
with t he e xcept ions that in t he feed med ium t he PO�
concentrat ion was 0 . 0 7 g / l ( 0 . 1 g / l a s KH 2P04 ) and t hat of
n itrogen was 0 . 2 3 g / l ( 1 . 1 g / l as ( NH 4 ) �04 ) ' The c r it er ia
for s t eady s t at e were as des cr ibed in S e c t i o n 6 . 2 .
The s t e ady s t at e concent rat ions recorded for t he c o r ner
points and the centre point are shown in Tab le 6 . 9 . Two
features t o note are , f ir s t ly , t he l ow b io ma s s
concentrat ions , caused by the low conde n t ra t i o n s of t he
growt h- l imit ing nut rie nt , and , s e condly , a t a h i g h s pe c i f ic
growth rate no c it r i c acid was produced a t e it he r t he low
or high DOT va lues . Tab le 6 . 1 0 s hows t he rate d at a . For
reasons previous ly out l ined ( Sect ion 6 . 2 ) , s ome o f t he
spec i f ic rate data are pre s ented bas ed on myce l ia l n it r o ge n
and pho s phat e content s , in add i t ion t o myce l i a l d r y we i ght .
Trace met a l analys is of the ferment a t ion l iquor a g a i n gave
value s hi gher than those in the feed med i um , probab l y due t o
leaching from the fermenter part s .
The volumet r ic c i t r i c 'acid product i o n r at e s are l ower
than t hose obs erved under n it rogen l im i t a t i o n ( Ta b l e 6 . 3 ) ,
due t o lower b iomas s concentrat ions u n der p ho s phat e
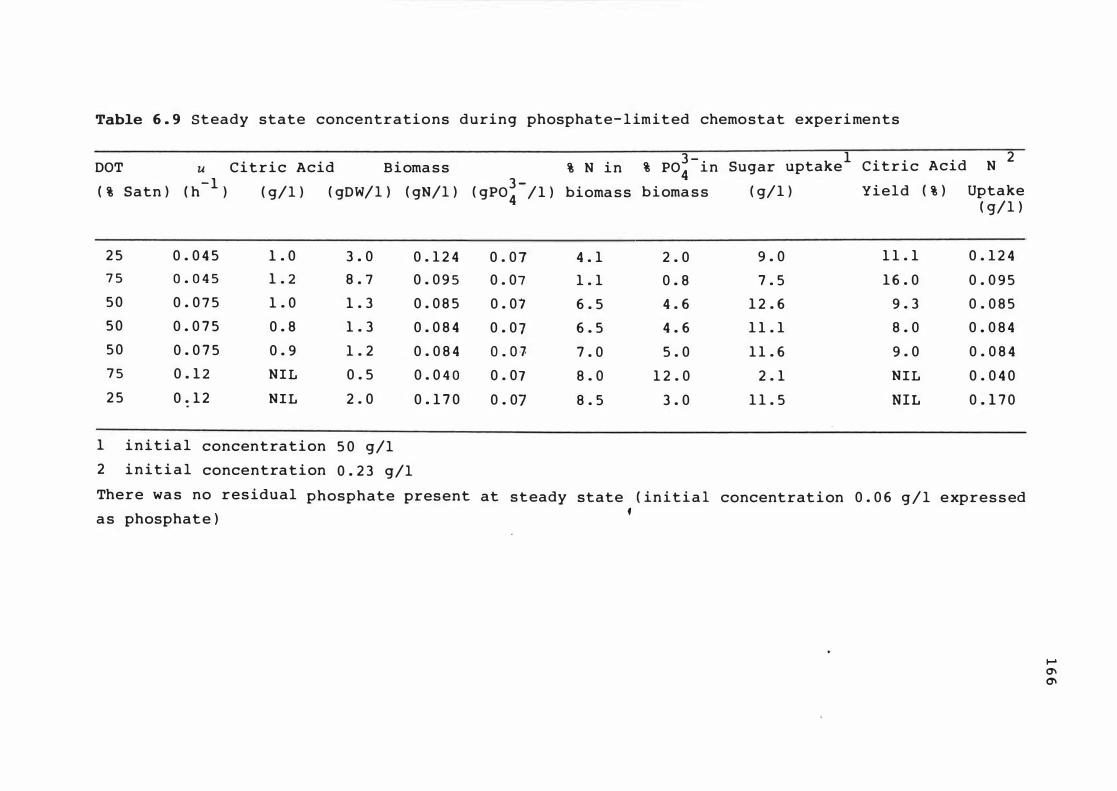
Table 6 . 9 Steady state concentrations during phosphate- l imited chemostat experiments
3 - . 1 Citric Acid N 2 DOT u Citric Acid Bioma s s % N i n % P04 l.n Sugar uptake
( h- 1 ) 3 -( % Satn ) ( g/l ) ( gDW/l ) ( gN/l ) ( gpo4 / 1 ) bioma s s b i oma s s ( g/1 ) Yield ( % ) Uptake
( g/l )
2 5 0 . 0 4 5 1 . 0 3 . 0 0 . 1 2 4 0 . 0 7 4 . 1 2 . 0 9 . 0 1 1 . 1 0 . 1 2 4
7 5 0 . 0 4 5 1 . 2 8 . 7 0 . 0 9 5 0 . 07 1 . 1 0 . 8 7 . 5 1 6 . 0 0 . 0 9 5 5 0 0 . 0 7 5 1 . 0 1 . 3 0 . 0 8 5 0 . 01 6 . 5 4 . 6 1 2 . 6 9 . 3 0 . 0 8 5 5 0 0 . 0 7 5 0 . 8 1 . 3 0 . 0 8 4 0 . 0 7 6 . 5 4 . 6 1 1 . 1 8 . 0 0 . 0 8 4
5 0 0 . 0 7 5 0 . 9 1 . 2 0 . 0 8 4 o . O i7 7 . 0 5 . 0 1 1 . 6 9 . 0 0 . 0 8 4 7 5 0 . 1 2 NIL 0 . 5 0 . 0 4 0 0 . 07 8 . 0 1 2 . 0 2 . 1 NIL 0 . 0 4 0 2 5 0 . 1 2 NIL 2 . 0 0 . 1 7 0 0 . 07 8 . 5 3 . 0 1 1 . 5 N I L 0 . 1 7 0
1 i n i t i a l concentration 5 0 g/l
2 i n i t i a l concentration 0 . 2 3 g/l
There wa s no res idual phosphate present at steady state ( in i t i a l concentrat i on 0 . 0 6 g / l expres s ed a s phosphat e ) f
...... 0'1 0'1
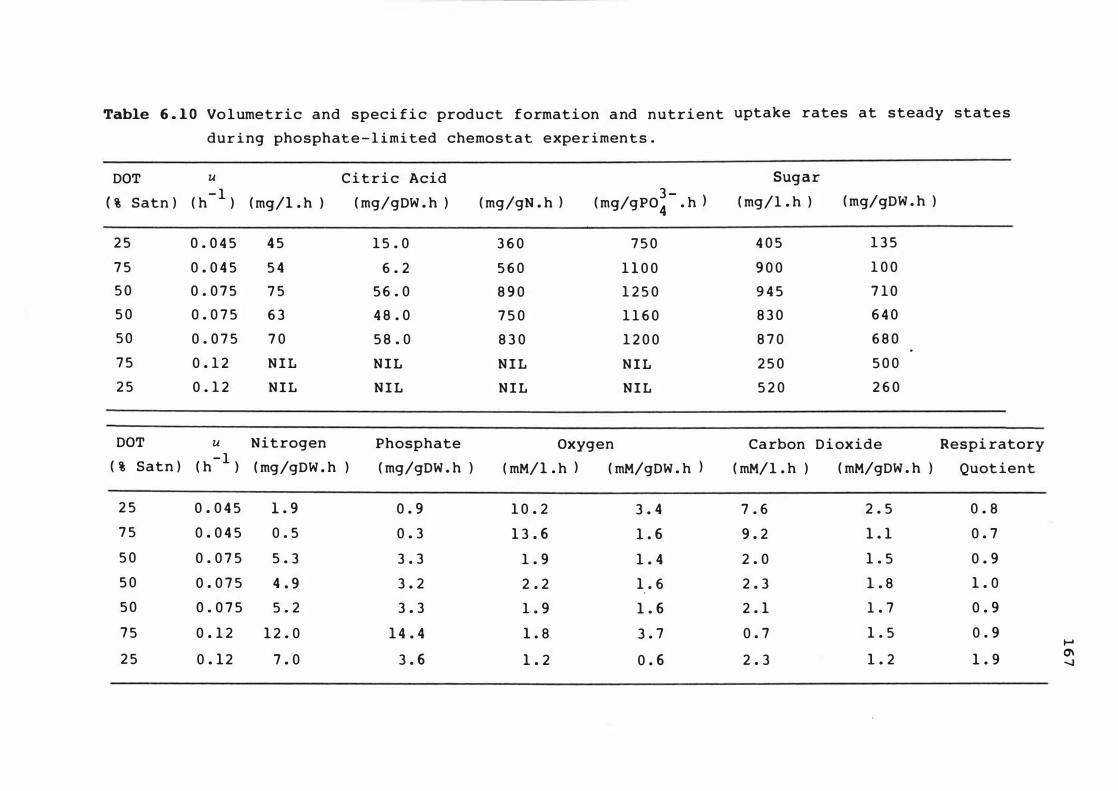
Table 6 . 1 0 Vo l umetric and speci f i c product format i on a nd nutri ent uptake rates at steady state s
dur i ng phosphate - l imi ted chemostat exper imen t s .
DOT u C i t r i c Acid Sugar
( % Satn ) ( h- 1 ) ( mg/1 . h ) ( mg/gDW . h ) ( mg/gN . h ) 3 -( mg/gPO 4 . h ) ( mg/l . h ) ( mg/gDW . h )
2 5 0 . 0 4 5 4 5 1 5 . 0 3 6 0 7 5 0 4 0 5 1 3 5
7 5 0 . 0 4 5 5 4 6 . 2 5 6 0 1 1 0 0 9 0 0 1 0 0
5 0 0 . 0 7 5 7 5 5 6 . 0 8 9 0 1 2 5 0 9 4 5 7 1 0
5 0 0 . 0 7 5 6 3 4 8 . 0 7 5 0 1 1 6 0 8 3 0 6 4 0
5 0 0 . 0 7 5 7 0 5 8 . 0 8 3 0 1 2 0 0 8 7 0 6 8 0
7 5 0 . 1 2 N I L N I L N I L N I L 2 5 0 5 0 0
2 5 0 . 1 2 N I L N I L N I L N I L 5 2 0 2 6 0
DOT u Nitrogen Phosphate Oxygen Carbon D i oxide Respi ratory
( % Satn ) ( h- 1 ) ( mg/gDW . h ) ( mg/gDW . h ) ( mM/1 . h ) ( mM/gDW . h ) ( mM/l . h ) ( mM/gDW . h ) Quot ient
2 5 0 . 0 4 5 1 . 9 0 . 9 1 0 . 2 3 . 4 7 . 6 2 . 5 0 . 8
7 5 0 . 0 4 5 0 . 5 0 . 3 1 3 . 6 1 . 6 9 . 2 1 . 1 0 . 7
5 0 0 . 0 7 5 5 . 3 3 . 3 1 . 9 1 . 4 2 . 0 1 . 5 0 . 9
5 0 0 . 0 7 5 4 . 9 3 . 2 2 . 2 1 . 6 2 . 3 1 . 8 1 . 0
5 0 0 . 0 7 5 5 . 2 3 . 3 1 . 9 1 . 6 2 . 1 1 . 7 0 . 9
7 5 0 . 1 2 1 2 . 0 1 4 . 4 1 . 8 3 . 7 0 . 7 1 . 5 0 . 9 .....
2 5 0 . 1 2 7 . 0 3 . 6 1 . 2 0 . 6 2 . 3 1 . 2 1 . 9 0'\ -..J
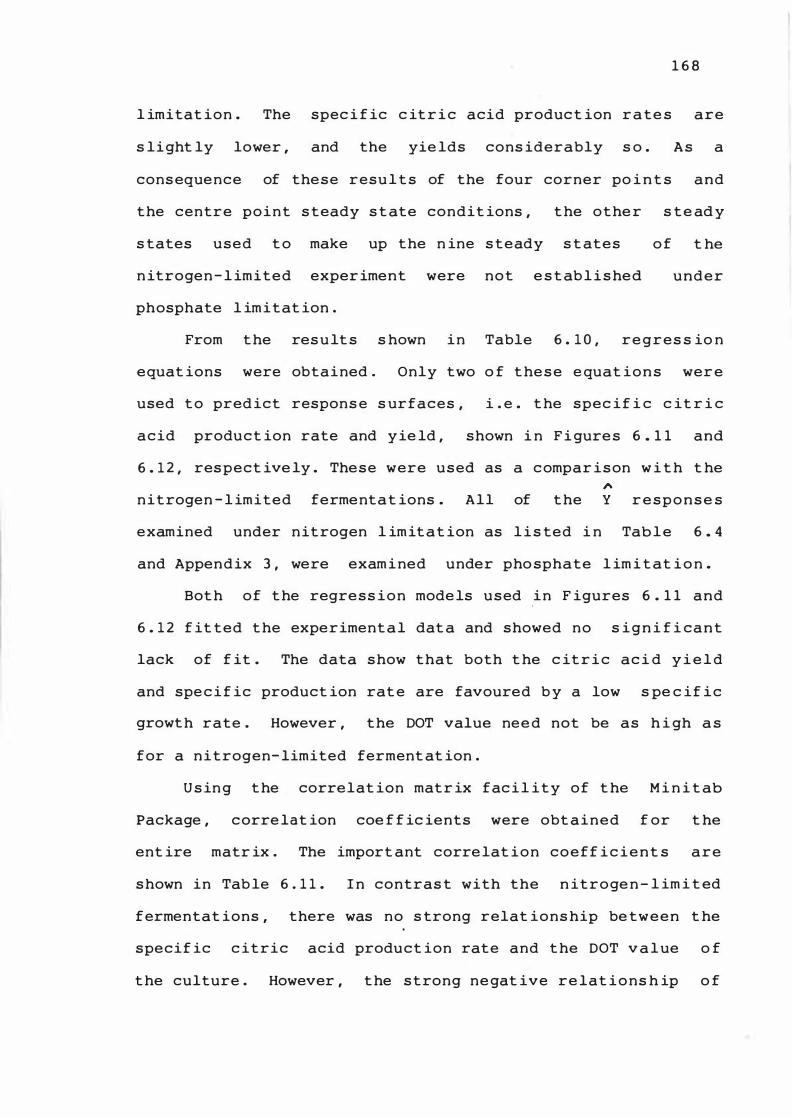
1 6 8
l imitat ion . The spec i f ic c it r i c acid produc t ion r a te s are
s li ght ly lower , and the yie lds cons iderably s o . A s a
cons equence of the s e resu l t s of the four corner po i n t s and
the centre p o i n t s teady s t ate condit ions , t he othe r s t e ad y
s tates used t o make up the n ine s teady s t ates
n itrogen - l imited exper iment were not e s t ab l i s hed
phosphate l im i t at ion .
o f t he
under
From t he res u lt s s hown i n Table 6 . 1 0 , re g r e s s io n
equat ions were obtained . Only two o f t he s e e quat ion s wer e
used t o pred ict respons e s urfaces , i . e . t he spec i f i c c it r i c
acid product ion rate and y ie ld , shown i n F i gure s 6 . 1 1 and
6 . 1 2 , res pect ive ly . The s e were u s ed as a c ompar i s on w i t h t he �
n i t rogen - l imited fermentat ions . All of t he Y r e s p o n s e s
examined under n it rogen l im it at ion as l i s ted i n Tab l e 6 . 4
and Appen d ix 3 , were exam i ned under pho sphate l im i t at i o n .
Bot h of t he regre s s i o n mode ls u s ed i n F igures 6 . 1 1 and
6 . 1 2 f it ted t he experiment a l dat a and showed no s i g n i f i ca n t
lack of f it . The data s how that both t he c it r i c ac i d y i e l d
and spe c i f ic product ion rat e are favoured b y a low s pe c if i c
growt h rate . However , the DOT value nee d not be as h i gh a s
for a n i t rogen- limited ferment at ion .
U s in g t he correlat ion matr ix fac i l i t y of t he M i n i t ab
Package , c orre lat ion coe f f ic ients were obt a i n e d f or t he
ent ire matr ix . The import ant corre lat i o n c o e f f i c i e n t s are
s hown in Tab le 6 . 1 1 . I n contras t with the n it r o ge n - l im i t ed
f ermentat ions , there was no s trong relat ions hip be tween t he
specif ic c it r i c acid product ion rate and t he DOT v a l ue o f
t he culture . However , t he s t rong ne gat ive re lat i o ns h ip o f
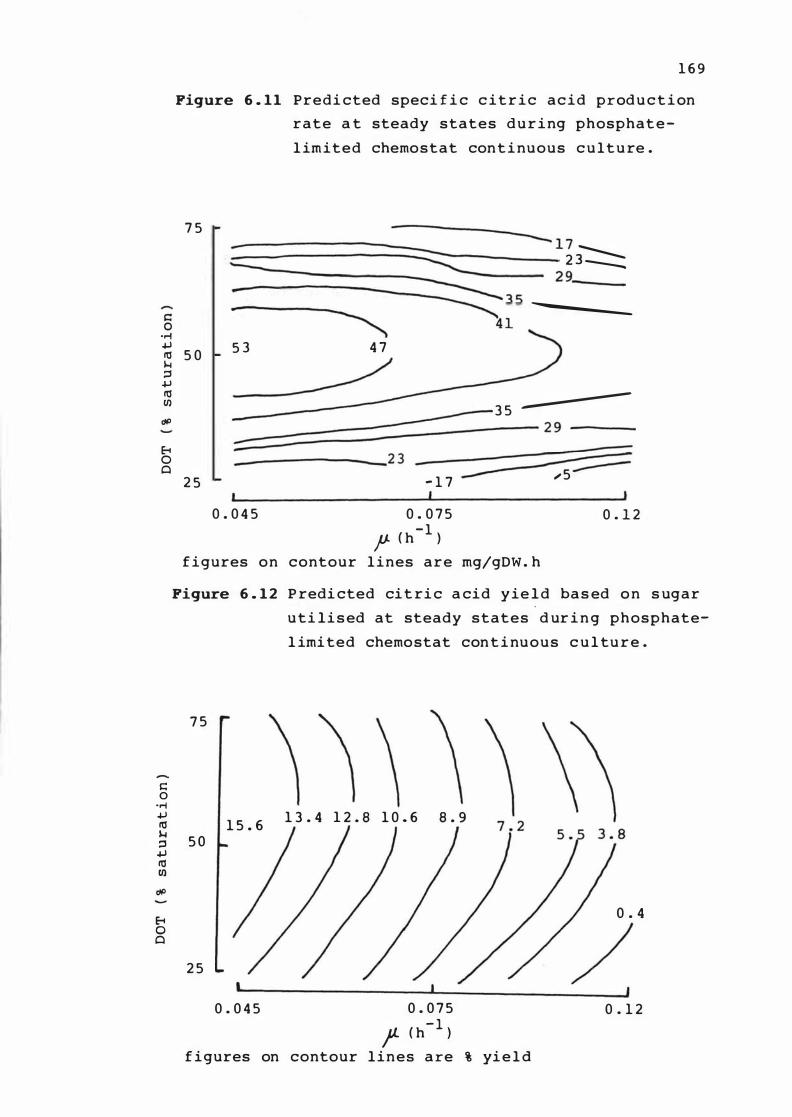
� 0 .,..j +J tU 1-1 ::3 +J tU I/)
<JP
E-t 0 Cl
s:: o .,..j
1 6 9
Figure 6 . 1 1 Predi cted speci f i c c i t r i c acid prod u c t i on
rate a t steady states d u r i ng phosphat e
l imited chemostat con t i nuous c u l t u re .
7 5
5 0
2 5
--- 1 7 = �:?:::::------ 2 3::::::: --�----- 2 9
__ _ :-------------- � 3 5
5 3 � 4 1
4 7
---------
� ----_______ 3 5
��==�=======---------- 2 9 ----
� = __ -----------__ -.._2 3
__ ----� � -- ,, 5
0 . 0 4 5
- 1 7
0 . 0 7 5
P C h - 1 )
0 . 1 2
f igures on contour lines are mg/gDW . h
Figure 6 . 1 2 P redi cted ci t ri c a cid yie l d ba s ed o n s ugar
u ti li s ed at steady states d ur i n g phosphate
l imi ted chemostat con t i nuous c u l tu r e .
7 5
+J 1 3 . 4 1 2 . 8 1 0 . 6 8 . 9 tU 1 5 . 6 � 5 0 +J tU I/)
E-t o Cl
2 5
0 . 0 4 5 0 . 0 7 5
f- C h- I
)
f igures on contour lines a re % yi e l d
0 . 4
/
0 . 1 2
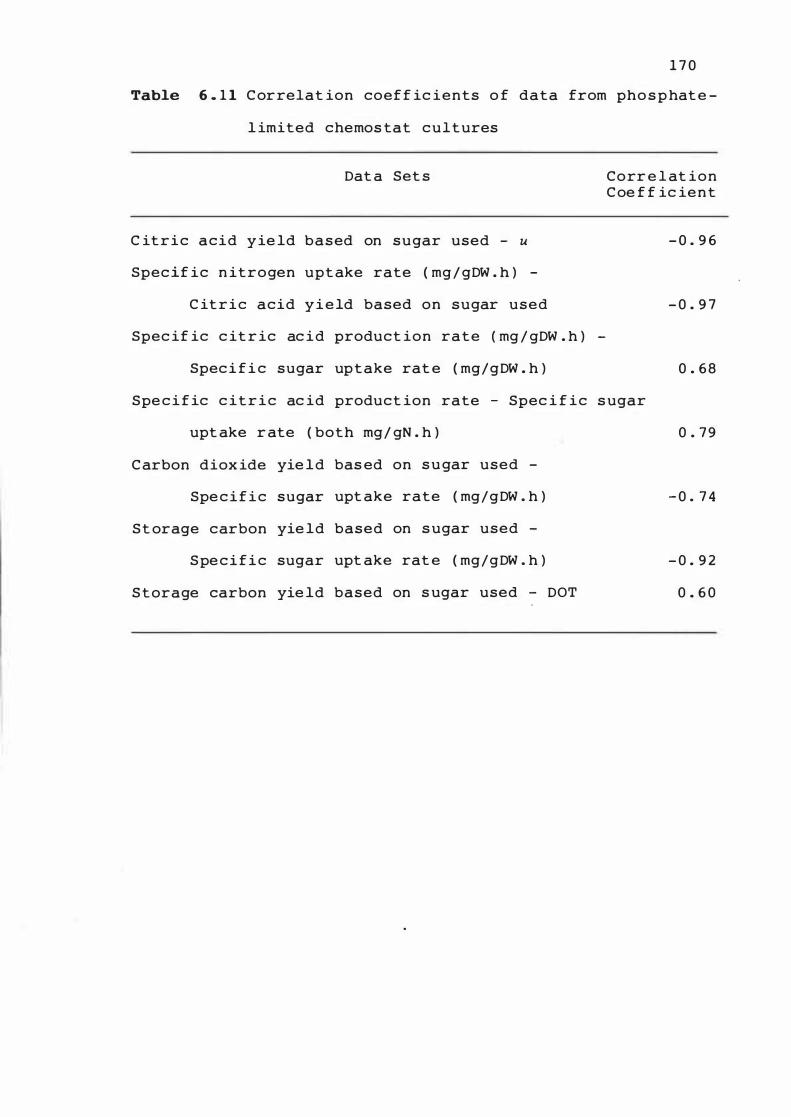
1 7 0
Table 6 . 1 1 C orrelat ion coef f ic ients o f data from pho s p hat e -
l imited chemos tat c u l t ures
Dat a Set s
C it r i c acid y ie ld based on sugar used - u
Spec if ic n itrogen upt ake rate ( mg / gDW . h ) -
C it r i c acid y i e ld based on sugar used
Spec if ic c it r ic ac i d product ion rate ( mg / gDW . h ) -
Spec i f i c sugar upt ake rat e ( mg/gDW . h )
Corr e l at ion C oe f f ic ie n t
- 0 . 9 6
- 0 . 9 7
0 . 6 8
Spe c i f ic c it r i c ac id product ion rate - Spec i f i c s ugar
upt ake r ate ( both mg/ gN . h ) 0 . 7 9
C arbon diox ide yie l d bas ed on s u gar used -
Spe c i f i c sugar upt ake rate ( mg/gDW . h ) - 0 . 7 4
St orage carbon yie ld based on s ugar used -
S pe c i f i c sugar upt ake rat e ( mg / g DW . h ) - 0 . 9 2
S t orage carbon yie ld based on s ugar used - DOT 0 . 6 0
1 7 1
the former with the specific growth rate was observed . As in
the n itrogen - limited fermentat ion
relat ionships were observed between
upt ake rate and both s torage carbon
s t rong n e gat ive
the spec i f i c sugar
and carbon d i oxide
yields , and a pos it ive re lationship wit h t he spec i f i c c it r ic
acid product ion rate . There was also a s trong n e ga t ive
relat ionship between the cit r ic acid y ield and t he s p e c i f ic
nitrogen upt ake rate . I n contrast to the n itrogen - limited
cultures , a high DOT value in phosphate - l im ited c u l t ures
appears to favour the product ion of s t orage c arbon .
The carbon balances for t he phosphate - l imited c u l t ures
are presented in Table 6 . 12 , and were calcu lated us i n g the
ass umpt ions descr ibed in Sect ion 6 . 2 . The s e s uggest t hat no
other maj or products were formed apart from b i omass ,
acid and carbon diox ide .
6 . 4 DOUBLE NITROGEN/ PHOSPHATE-LIMITED FERMENTATION
c itric
Having estab lished DOT and specif ic growth rate values
for max imum citric acid product ion rates and yields under
nitrogen - l imited condit ions , i . e . DOT = 9 0 % of s a t ur at ion
and u = 0 . 0 1 7 h - 1, the same condit ion was used to e xamine
the effect of double nitrogen /phosphate l imitat io n on c it r ic
acid product ion rates . The feed medium was t hat des c r i be d i n
Table 3 . 3 , modif ied to contain 0 . 2 g / l KH Z04 ( 1 4 0 mg / l
expressed as POi- ) . The res ults ( Table 6 . 1 3 ) s howed t hat
ne ither nitrogen nor phosphate were det ected in t he
fermentat ion l iquor at s te ady state . When t hese res u lt s are
compared with those of the n itrogen l imit at ion ( Tabl e 6 . 6 ) ,
it can be seen that the double limitat ion can be regarded as
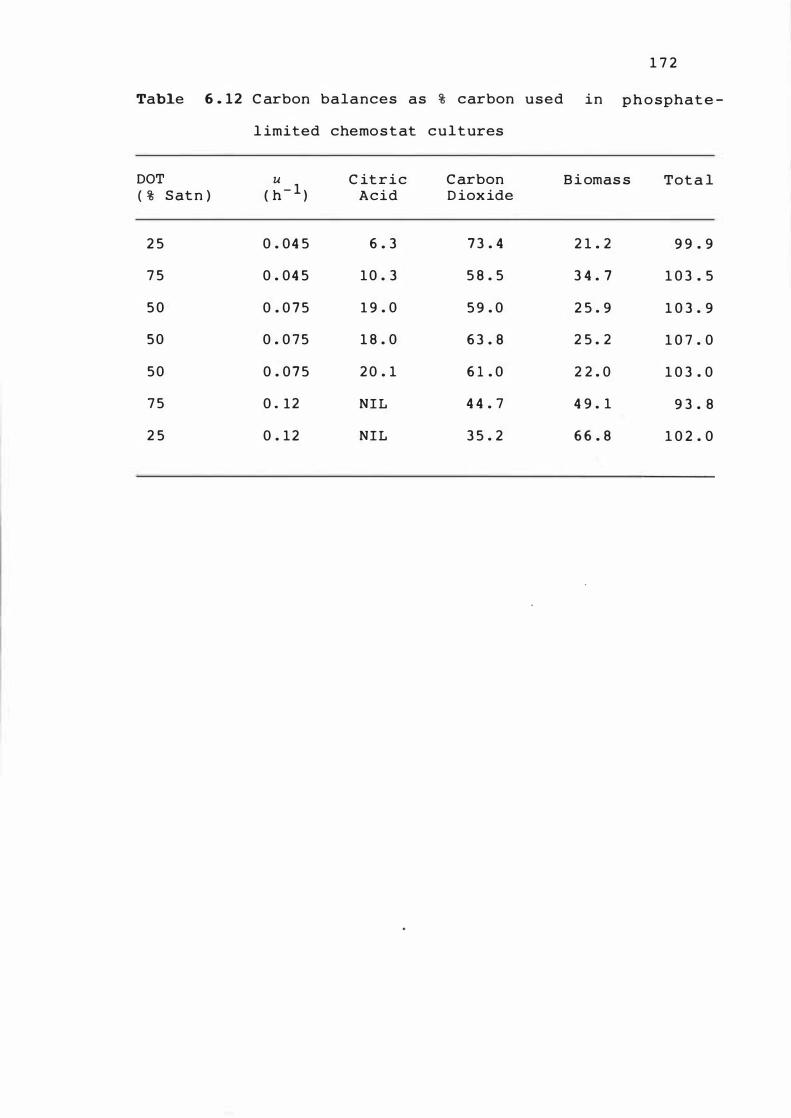
1 7 2
Tab1e 6 . 1 2 C arbon balances as % carbon used in phosphate -
l imited chemostat cultures
DOT u C itric Carbon B i omas s Tota l ( % Satn ) ( h - 1 ) Acid D ioxide
2 5 0 . 04 5 6 . 3 7 3 . 4 2 1 . 2 9 9 . 9
7 5 0 . 04 5 1 0 . 3 5 8 . 5 3 4 . 7 1 0 3 . 5
5 0 0 . 0 7 5 1 9 . 0 5 9 . 0 2 5 . 9 1 0 3 . 9
5 0 0 . 0 7 5 1 8 . 0 6 3 . 8 2 5 . 2 1 0 7 . 0
5 0 0 . 0 7 5 2 0 . 1 6 1 . 0 2 2 . 0 1 0 3 . 0
7 5 0 . 1 2 N I L 4 4 . 7 4 9 . 1 9 3 . 8
2 5 0 . 1 2 N I L 3 5 . 2 6 6 . 8 1 0 2 . 0
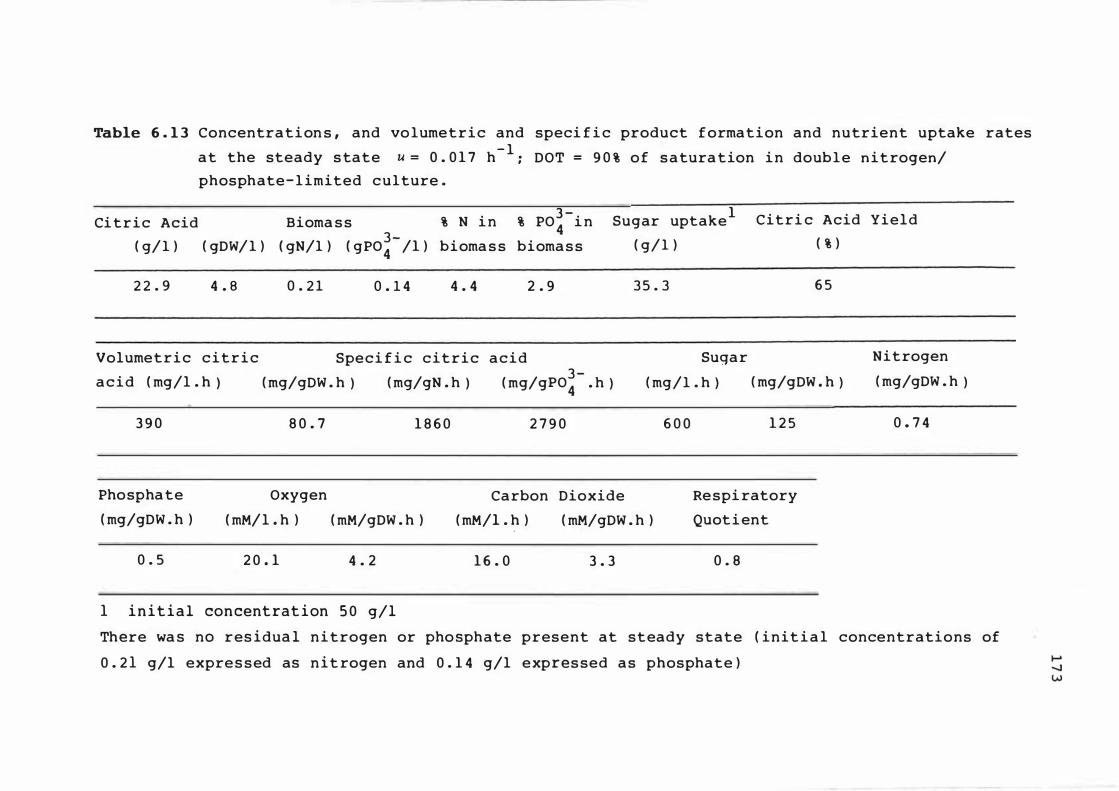
Table 6 . 1 3 Concentra t i on s , and vo lumetric and speci f i c product f ormation and nutrient uptake rates
a t the steady s tate u = 0 . 0 1 7 h- l : DOT = 9 0 % o f s a tura tion i n doub l e n i t rogen/
phosphate- l imited culture .
Ci tric Acid Bioma s s % N i n 3 -% P0 4 i n
( g/ l ) 3 -( gDW/ l ) ( gN/l ) ( gP04 /1 ) bioma s s bioma s s
2 2 . 9 4 . 8
Volumetric c i t r i c
a c i d ( mg/l . h )
3 9 0
0 . 2 1 0 . 1 4 4 . 4 2 . 9
Speci f i c citric acid 3 -( mg/gDW . h ) ( mg/gN . h ) ( mg/gpo4 . h )
8 0 . 7 1 8 6 0 2 7 9 0
1 Sugar uptake
( g/ l )
3 5 . 3
Sugar
( mg/l . h )
6 0 0
Citri c Acid Yield
( % )
6 5
( mg/gDW . h )
1 2 5
Nitrogen
( mg/gDW . h )
0 . 7 4
Phospha te
( mg/gDW . h )
Oxygen
( mM/l . h ) ( mM/gDW . h )
Carbon Dioxide
( mM/I . h ) ( mM/gDW . h )
Re spi ratory
Quot i ent
0 . 5 2 0 . 1 4 . 2 1 6 . 0 3 . 3 0 . 8
1 i n i t i a l concentrat ion 5 0 g/l
There wa s no res idua l n i trogen or pho sphate present at steady state ( init i a l concentrations of
0 . 2 1 g/l expre s sed as n i t rogen and 0 . 1 4 g/l expres sed a s phosphate )
1 7 4
a repeat of the nitrogen l im itat ion , i . e . the dat a o b t a ined
were very s imilar .
6 . 5 ANALYSIS OF SELECTED ENZ YMES DURI NG NI TROGEN-L I MITED
FERMENTATION
The act ivit ies of the enzymes aconi t ase , NAD- l in ke d and
NADP- linked isoc itrate dehydrogenases , 2 -oxoglutarate
dehydrogenase , pyruvate carboxylase , and isocit r a t e l yase
were determined in myce l ial ce ll-free extracts a t each
steady state for the n itrogen- l imited cultures . I n n it r ogen
l imited bat ch fermentat ion , the maximum act iv i t i e s o f
aconit ase , NAD- l inked and NADP-l inked i s o c i trate
dehydrogenases and isocitrate lyase c oinc ided w i t h t he
max imum c it r ic ac id product ion rate . Therefore , an a t t empt
was made to relate the act ivit ies of t hese enzymes t o t he
c itric acid product ion rate in chemostat cultur e . The
results in Table 6 . 1 4 s how that all of these enzym e s were
act ive at all steady states . The enzyme act ivi t i e s and
rat ios of the act ivity of each pair of enzymes were
model led us ing t he mult ivariate l inear regress ion o f t he
mode l descr ibed in Sect ion 6 . 2 . Al l of the r e g r es s ion
e quat ions showed s ignif icant lack of f it and there f o r e c o u l d
n o t be re l iably used in the predict ion of response s ur fa c e s .
C orre lat ion coeff i c ients of the enzyme act ivit ies , a n d t he
rat ios of the enz yme act ivit ies , with a l l o f the nutr ient
and product rate data obta ined under n itrogen l im it at ion
were sought using t he Min itab Package corre lat ion m a tr ix
fac il ity . The correlat ion coe f f icient s were a l l l e s s t han
0 . 3 5 .
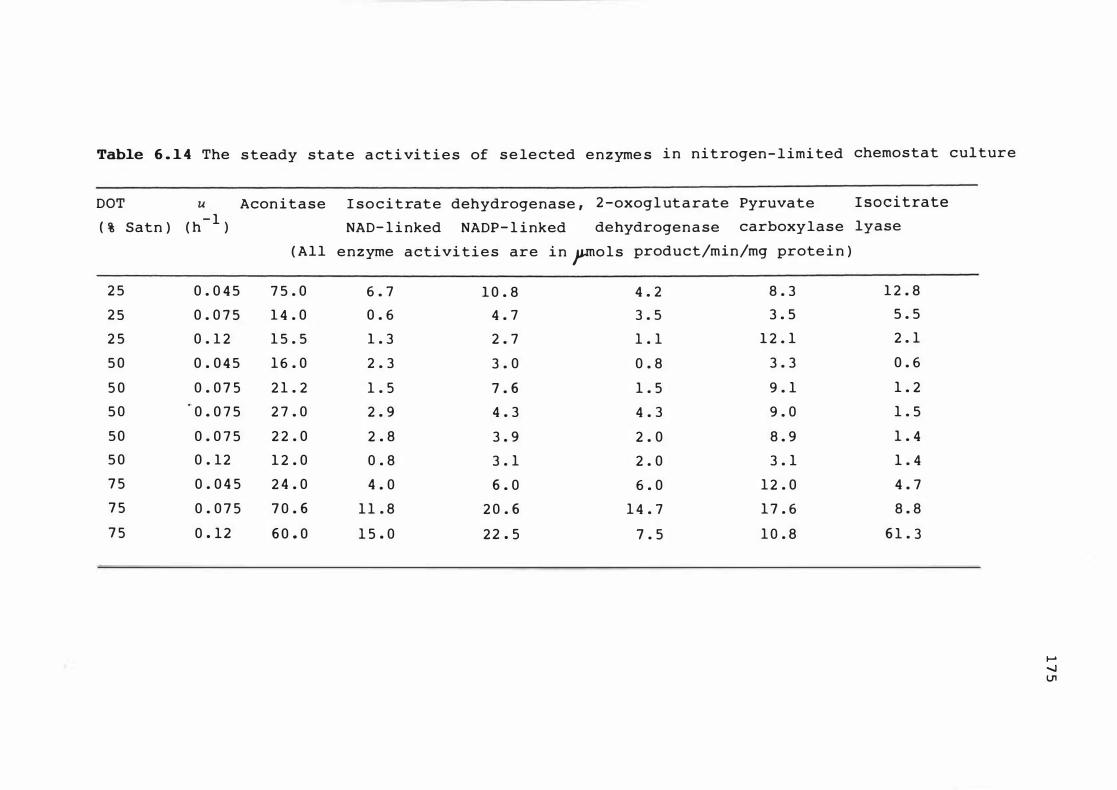
Table 6 . 1 4 The steady state activities of selected enzyme s in nitrogen- limited
DOT u Aconitase I socitrate dehydrogenase , 2 -oxog1 utarate Pyruvate
( % Satn ) ( h- 1 ) NAD- 1 inked NADP- 1 inked dehydrogenase carboxylase
( All enzyme activities are in po1s product/min/mg protein )
2 5 0 . 0 4 5 7 5 . 0 6 . 7 1 0 . 8 4 . 2 8 . 3
2 5 0 . 0 7 5 1 4 . 0 0 . 6 4 . 7 3 . 5 3 . 5
2 5 0 . 1 2 1 5 . 5 1 . 3 2 . 7 1 . 1 1 2 . 1
5 0 0 . 0 4 5 1 6 . 0 2 . 3 3 . 0 0 . 8 3 . 3
5 0 0 . 0 7 5 2 1 . 2 1 . 5 7 . 6 1 . 5 9 . 1
5 0 0 . 0 7 5 2 7 . 0 2 . 9 4 . 3 4 . 3 9 . 0
50 0 . 0 7 5 2 2 . 0 2 . 8 3 . 9 2 . 0 8 . 9
5 0 0 . 12 1 2 . 0 0 . 8 3 . 1 2 . 0 3 . 1
7 5 0 . 0 4 5 2 4 . 0 4 . 0 6 . 0 6 . 0 1 2 . 0 7 5 0 . 0 7 5 7 0 . 6 1 1 . 8 2 0 . 6 1 4 . 7 1 7 . 6
7 5 0 . 12 6 0 . 0 1 5 . 0 2 2 . 5 7 . 5 1 0 . 8
chemostat culture
I socitrate
lyase
1 2 . 8
5 . 5
2 . 1
0 . 6
1 . 2
1 . 5
1 . 4
1 . 4
4 . 7
8 . 8
6 1 . 3
...... -..J (J1
1 7 6
6 . 6 DI SCUSSION
From t he results for the n it rogen -l imited c u l tures , a
steady state for maximum citric acid product i o n was
predicted and experimentally ver if ied to be a t a l ow
spe c i f ic growth rate and a high DOT value ( DOT = 9 0 % o f - 1
saturation and u = 0 . 0 1 7 h ) . However , it mus t be borne i n
mind that DOT values higher than 9 0 % o f s aturat i on , and
specific growth rate values lower than 0 . 0 1 7 h - 1 were not
achieved exper imentally . The volumetric and spec i f i c rates
of citric ac id product ion obtained were s im ilar t o those
observed at a DOT value of 5 0 % o f saturat ion and a s pec i f ic
growth - 1 rate o f 0 . 0 7 5 h . However , the cit r ic ac i d yield
based on sugar used was s igni f ican t ly increased from 2 8 % to
6 5 % . The specific citric ac id product ion rate under thes e
condit ions was 2 . 4 t imes higher than the maximum obs e rved i n
batch fermentat ion , but the volumetric 'product ion r at e was
cons iderably lower , probably because of the lowe r amount o f
biomas s present in the chemostat culture . A n a t te mpt t o
increase the volumetric c itric acid product ion rate i n
chemostat culture b y increas ing the biomas s was s u c c e s s fu l ,
in that an increase from 4 0 3 t o 5 2 0 mg /l . h was observed .
However , t he greater oxygen demand of the increas ed biomas s
resulted in a lower DOT and hence a decreased s pec i f ic
citric acid product ion rate and yield . The v o l umetr ic
product ion rate in cont inuous culture was s t i l l in f e r ior t o
that observed in batch culture o f 6 9 0 mg/ l . h .
Comparing the phosphate-limited and n itroge n - l im i t e d
fermentat ions in chemostat , the n itrogen l im it at i o n was i n
1 7 7
all ways s uper ior . I n the chemostat e xper iments , t he r at io
of c i t r ic acid produced : oxygen used during n itrogen - l imited
and phosphate-limited ferment at ions were s imilar ( Tab le
6 . 1 5 ) . This was not unexpected , as a l t hough the growth
l im it ing nutrient is absent from the culture in c he mos tat ,
it i s cont inually being rep lenished , and a pos it ive nutr ient
upt ake rate is observed , indicat ing t he occurrence of
" ac t ive " metabolic growth , rather than apparent growth from
increased storage carbohydrate product ion . This is in
contras t t o the s ituat ion in batch fermentat ions , where
prior to l im it ing nutr ient exhaus t ion , t he rat io o f c it r ic
ac i d produced : oxygen used dur ing n itrogen - l im i t ed and
phosphat e - l im ited fermentat ions were s im ilar ( Tabl e 5 . 9 ) .
However , subsequent t o t he exhaus t ion of the l imit i n g
nutr ient , the phosphate-l imited ferment at ion exhib ited a
markedly higher rat io ( i . e . a lower oxyg�n requiremen t ) . The
d i fference in the rat io of citric acid produced : oxygen use d
in batch fermentat ions only occurred o n c e act ive growth had
ceased .
Higher volumetric and spe c i f ic c it r ic acid produc t ion
rates and yie lds were obta ined under n itrogen l imi t a t ion at
comparable s teady states . For this reas on , the predicted
opt imum condit ion under phosphate l imitat ion was not
exper imentally verified . It was however , predicted t o be t he
lowes t specif ic growth rate examined , at 0 . 0 4 5 h - l, and at a
DOT value of 50 to 6 0 % of saturat ion .
I t is suggested that the nitrogen nutr ient may be
act ing in the role of cat abo l ite repres s or . This was f ir s t
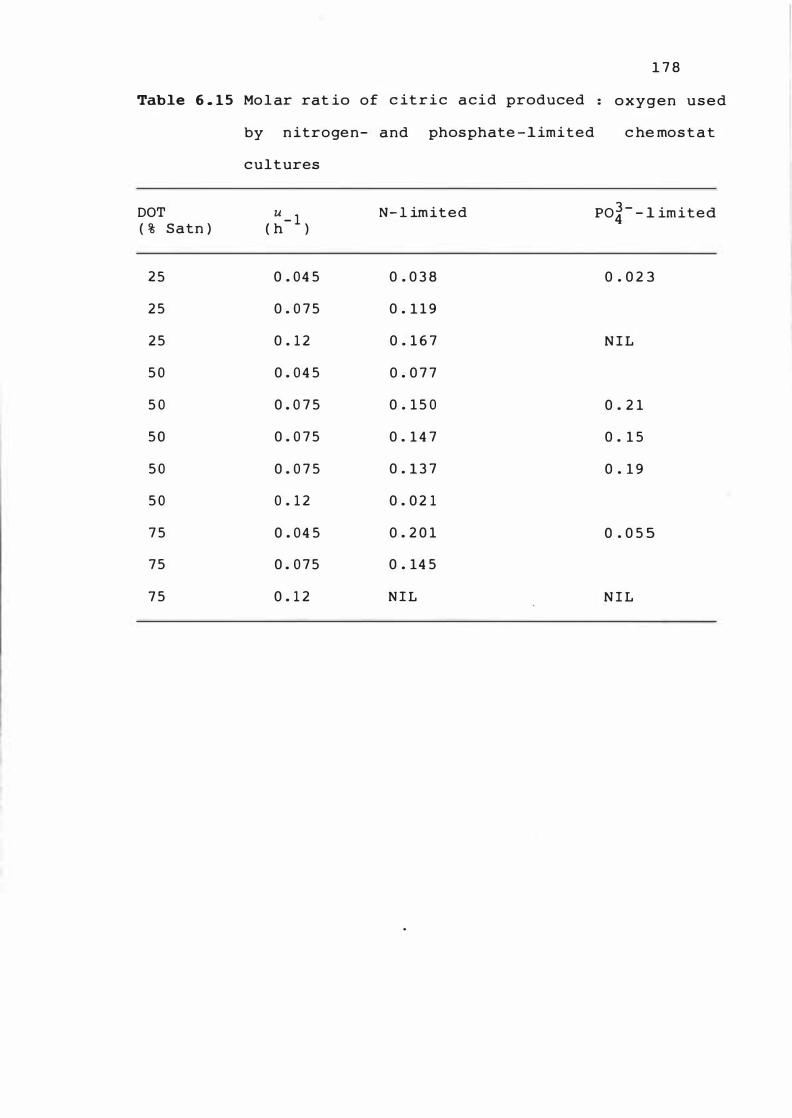
1 7 8
Table 6 . 1 5 Mol ar rat io of c itric acid produced : oxygen used
by n itrogen- and phosphate -limited c he mostat
cultures
DOT u N- 1 imited PO� - - l imited ( % Satn ) ( h - 1
)
2 5 0 . 0 4 5 0 . 0 3 8 0 . 0 2 3
2 5 0 . 0 7 5 0 . 1 1 9
2 5 0 . 1 2 0 . 1 6 7 N I L
5 0 0 . 0 4 5 0 . 0 7 7
5 0 0 . 0 7 5 0 . 1 5 0 0 . 2 1
5 0 0 . 0 7 5 0 . 1 4 7 0 . 1 5
5 0 0 . 0 7 5 0 . 1 3 7 0 . 1 9
5 0 0 . 1 2 0 . 0 2 1
7 5 0 . 0 4 5 0 . 2 0 1 0 . 0 5 5
7 5 0 . 0 7 5 0 . 1 4 5
7 5 0 . 1 2 N I L N I L
1 7 9
sugge sted by Hattori e t a l . ( 1 9 74 ) in regard t o a s im il ar
effect observed in yeast dur ing the product ion o f c it r ic
acid , and supported by Wang e t a l . ( 1 9 7 9 ) in a general
discus s ion on cont inuous culture processes . It i s s upported
in this present study by t he high negat ive corre lat i o n of
the s pecif i c n itrogen uptake rate with the c it r ic a c id yield
under phosphate-limited condit i ons . .
As was observed in batc h fermentat ion , t he double
nitrogen /phosphate limitat ion was virtually a repeat
experiment of a n itrogen - l imited ferment at ion .
Using the results of t he steady s tate perf o rmed t o
ver ify the predicted steady s tate condit ion f or maximum
citric acid
saturat ion / u =
product ion and yield of DOT =
0 . 0 1 7 h - 1 , the s t oichiometry
ferme ntat ion was determined to be :
2 . 09 C l2
H2 2
°] 1 + 1 8 . 5 9 O 2
1 0 . 0 6 CO2
9 0 %
of
of
t he
Det a i l s of the calculat ions are s hown i n Append ix 2 . The
aerat ion and agitat ion requirements of the ferme ntat ion as
wel l as the cool ing load requ ired t o counter the generat e d
heat of oxidat ion can be determined f or s c a le -up to
commercial scale proces s . Therefore the s t o ichiomet r y is
regarded as the bas is for des ign calculat i o n s f or a
commerc ial process .
I nconclus ive results were obt ained from the e n z yme
analyses . The corre lat ion coe f f ic ients were all l e s s t han
0 . 3 5 , and hence the only conclus ion to be drawn f r om t he
results is that all the enzymes are act ive dur i n g c it r ic
acid product ion , but their act ivit ies are n o t dir ec t ly
1 8 0
l inked t o t he rate of citric acid production . Thus , the
result s obta ined , do not c lar ify the s ituat ion any further .
The carbon balances conf irmed that c itric acid , c arbon
diox ide and biomass are the only maj or products o f the
fermentat ion .
High specific c itric acid product ion rates were
obtained during both the
n itrogen / phosphate - l imited
n itroge n - l imited
ferment at ions . The
and double
volumet r i c
rates att a ined however , were lower than the maxima obs e rved
dur ing batch fermentat ion . Although the overal l fermenter
product ivity was higher for the chemostat culture t h a n for
the batch culture ( 4 0 3 mg/ l . h versus 2 7 0 mg/ l . h ) , the
techn ical problems assoc iated with the f ormer techn i que may
prec lude its applicat ion on a commercial scale . Thus , the
logical s tep is to apply the results of the chemo s t a t
culture t o cont inuous fed-batch culture in order t o a c h ieve
and then , most important ly , maintain a high volume t r i c
production rate .
An interesting observat ion was that in the c hemos t at
experiments the form of growth of the organ ism cha n ged f r om
pe llets as were observed throughout the batch fermen t a t io n ,
to discrete pieces of mycelium approximately 1 t o 2 mm in
length , within 1 . 5 res idence times of the commencemen t o f
the cont inuous feed . Thus , the pe l le t a l form o f growth is
not essent ial for citric acid product ion to occur .
6 . 7 CONCLUS IONS
I n chemostat culture under nitrogen- l imited c o nd i t ions ,
high citric ac id product ion rates and yie lds are f avoure d by
1 8 1
operat ing t he ferment at ion at a high DOT value and a low
specif ic growth rate . A specif ic c itric acid product ion rate
of 7 9 mg/ gDW . h was obtained , which is 2 . 4 t imes gre at e r
than the maximum obs erved i n batch fermentat ion u nder
n itrogen- l imited condit ions . N itrogen - l im ited cultures are
superior to phosphate - l imited cultures . A dou b le
n itrogen /phosphat e - l im ited fermentat ion was conf irmed as
being ef fect ive ly a n itrogen l imitat ion .
1 8 2
CHAPTER 7
CITRIC AC I D PRODUCTION IN CONTI NUOUS FED-BATCH CULTURE
7 . 1 I NTRODUCTION
The results obta ined in batch ferment at ion s t ud ies
( Sect ion 5 . 4 ) showed that t he maximum observed cit r i c a c id
product ion rate occurred pr ior to the exhaust ion o f t he
growth-limit ing nutrient , and that s ubsequent t o the
exhaust ion the product ion rate decreased . This impl i e d t hat
there is an opt imum specif ic growth rate f or citr i c a c id
product ion . Studies in chemostat culture ( Sect ion 6 . 2 )
subsequent ly s howed that the maximum product ion r at e s and
yields were obtained at a speci f ic growt h rate of 0 . 0 1 7
h - 1 and a DOT value as high as poss ible .
When operat ing a commercial fermentat ion proces s , it is
des irable to maintain the maximum product ion rate f or as
long a t ime as poss ible in order to max im ise f ermenter
product ivity . This can be achieved in chemostat cul t ure and
can also be achieved in cont inuous fed-batch c u l ture by
control l ing the growt h rate v i a the addit ion of the growth
limit ing nutrient . The purpose of t his s e c t ion was t o apply
the knowledge gained in chemostat culture to cont inuous fed
batch culture .
7 . 2 NI TROGEN-L IMITED FERMENTATION
The obj ect ive of this exper iment was to achi eve and
maintain a high citric acid product ion rate , by main t a in in g
1 8 3
t he specific growth r ate of the organ ism , after i n it ial
biomas s product ion , at a value of 0 . 0 1 7 h- 1 or less . The
extrapolated response s urfaces s hown in the previous s e c t ion
( Figures 6 . 6 , 6 . 7 and 6 . 8 ) indicated that the lower t he
specific growth rate , t he greater t he c it r ic ac id product ion
rates and yie lds that could be obtained . F o l lowing
acquis it ion of a s low feeding pump , spec i f ic growt h rates of
0 . 0 03 h - 1 could eas ily be at tained in fed-batch culture .
The specific growth rate was controlled by cont i nuous
addit ion to the culture of growth-limit ing amounts of t he
nitrogen nutrient . Dur ing cont inuous addit ion of t his
nutrient , however , the volume of t he culture increases
cont inuous ly , resulting in a cont inually decreas ing d i l ut ion
rate and hence , growth rate . S ince equ ipment was not
available to increase the dilut ion rate cont inuous ly , s tep
changes were used . The effect of t his was t hat the d i l u t ion
rate , and hence growth rate , oscil lated .
The ferment at ion was performed as described in s e c t ion
3 . 5 . 4 , us ing the batch fermentat ion medium shown in Table
3 . 2 . The init ial volume of the medium was 4 . 0 litres and
the agitat ion and aerat ion rates were maintained c on s tant
throughout the fermentat ion at 2 5 0 rpm and 3 l /min ,
respect ively . After batching the ferment at ion , the n u t r ient
n itrogen feed was commenced on day 3 at a rate of 10 ml / h of
a ( NH4 ) 2S04 solut ion ( 4 4 0 mg/ l ) , i . e . 0 . 92 mgN /h or , 0 . 2 3
mgN / l . h based on 4 1 medium . This rate was increased t o
0 . 3 5 . 0 . 4 6 and 0 . 6 9 mgN /l . h on days 4 , 5 and 6 ,
respect ive ly . The time course of t he fermentat ion i s s hown
in F igure
prior t o
7 . 1 . The cont inuous feed commenced on
n itrogen exhaust ion , when t he res idual
1 84
day 3 ,
n it ro gen
concentrat ion was 2 0 mg/ l . Phosphate upt ake was observed
due to act ive growth caused by n itrogen replenishmen t of t he
medium . C itric acid product ion commenced after day 2 , and
by day 7 the concentrat ion was 9 1 g / l , repre s e n t i n g a y ie ld
based on sugar used of 6 5 % ( Table 7 . 1 ) . All of t he s u gar
was ut i lised by day 7 , s howing t hat t he ferment at ion had
gone to complet ion in 7 days , compared wit h 1 2 days in batch
fermentat ion ( Figure 5 . 1 7 ) . The DOT value was bet ween 4 0
and 5 0 % of s aturat ion for mos t of the fermentat ion per iod ,
ris ing t o 5 5% on day 7 .
From the t ime course data in Figure 7 . 1 , it was
pos s ible to calculate the product ion rates of c i t r i c ac id
and carbon diox ide , and the uptake rates o f phosphate , s ugar
and oxygen , which are shown in Figure 7 . 2 . N itroge n upt a ke
rates after day 4 were calculated on the bas is o f t he
continuous feed rate , s ince no res idual n itrogen was
detected in t he medium , i . e . feed rate e quals upta ke rate .
The volumetric and spec i f ic citric ac id product i o n rates
fluctuated during t he per iod of cont inuous feeding . I t i s
suggested that this was due to the os c i l lat ions in d ilut ion
rate , and hence growt h rate , as descr ibed above .
Neverthe less , citric acid volumetric product ion r a t e s of
more than 1 . 5 g/l . h were obtained dur ing t his per iod . The
maximum rate observed was 2 . 2 5 g / l . h on day 7 , which
represented a spec i f ic proTIuct ion rate of 8 3 m g / gDW . h .
These f igures compare favourably with max ima observed in
batch fermentat ion of 0 . 69 g / l . h and 3 5 m g / gDW . h ,
1 8 5
respect ively , and t he max ima in chemos tat culture o f 0 . 39
g / l . h and 8 0 . 7 mg/ gDW . h , respect ive ly . Perhaps more
important ly , the high rates were ma int a ined for a l onger
period than in bat ch fermentat ion . The pro f i le f or the
spec i f ic sugar uptake rate corresponded closely wit h t hat o f
the c itric acid product ion rate . The spe c i f ic grow t h rates
at t he t ime of the c itric ac id product ion rate peaks were
- 1 between 0 . 0 0 5 and 0 . 0 1 0 h , based on increases in mycelia l
dry weight , or 0 . 0 0 4 and 0 . 0 0 5 h - 1 bas ed on dilut ion rate
( Table 7 . 2 ) . This dif ference in growth rates is probabl y
due t o storage carbohydrate product ion in the b iomas s . The
spec if ic nitrogen upt ake rates at the c itric acid product ion
peaks were between 0 . 0 2 and 0 . 0 3 mg/ gDW . h , whi l e t he
phosphate upt ake rates were 0 . 0 5 t o 1 . 5 mg/ g DW . h at t hese
t imes . Spec i f ic oxygen uptake and carbon diox ide product ion
rates were approx imately 0 . 5mM / gDW . h and 0 . 4 mM/ gDW . h ,
respect ively . The overall fermenter product ivity was 0 . 5 4
g/l . h based on a 7 -day fermentation . This c ompares
favourably wit h 0 . 2 7 g/l . h obta ined in bat c h ferme n t a t ion ,
based on a 1 2 day fermentat ion t ime .
7 . 3 PHOSPHATE-LIMITED FERMENTATION
In batch fermentat ion and chemost at culture , pho s p hate -
l imited fermentat ions have been shown t o be infer ior t o
nitrogen - limitation with regard t o citric acid product ion
rates and yields . To determine whether the s ame was t rue of
cont inuous fed -bat ch ferment at ion , it was dec ided t o examine
the effect of l imit ing the growth rate by means of
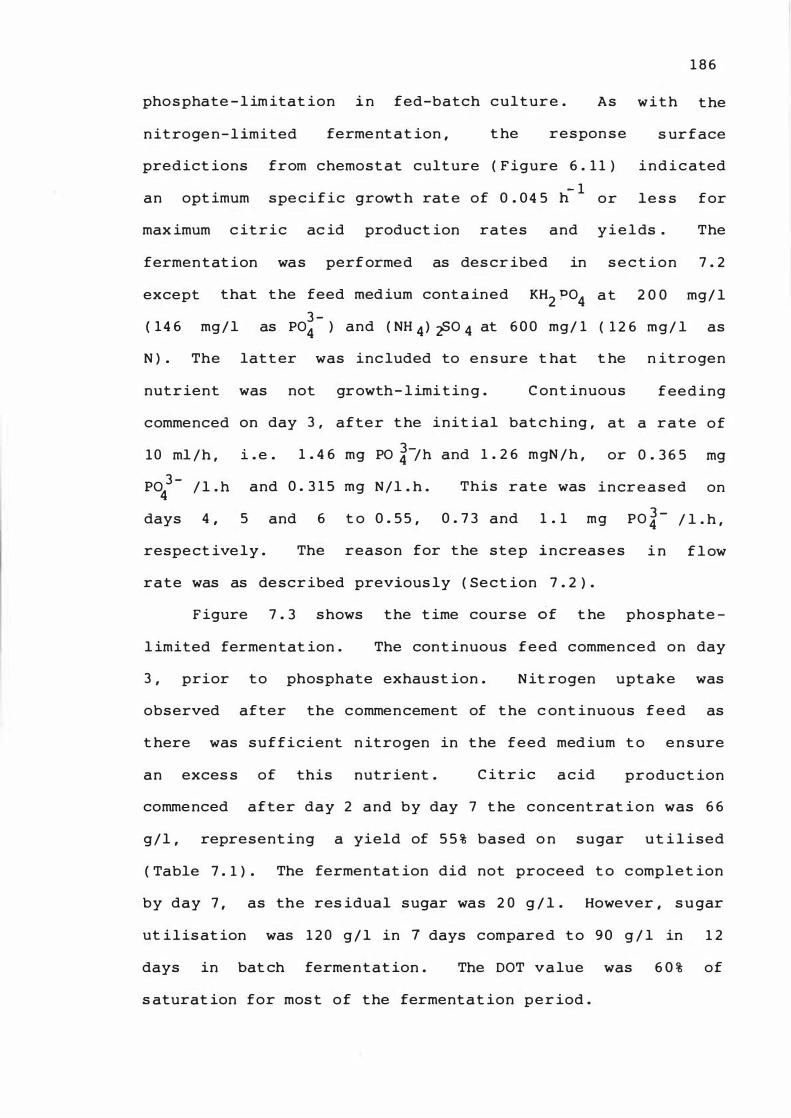
1 8 6
phosphate - l im itat ion i n fed-batch culture . As with the
nitrogen-limited fermentat ion , t he response s urface
predict ions from chemostat culture ( Figure 6 . 1 1 ) indicated
an opt imum specific growth rate of 0 . 04 5 ti 1 or les s for
max imum c itric ac id product ion rates and yields . The
fermentat ion was performed as descr ibed in sect ion 7 . 2
except
( 1 4 6
that the feed medium conta ined KH2 ?04 3 -mg/l as P04 ) and ( NH 4 ) ;f>0 4 at 6 0 0 mg/ 1
at 2 0 0 mg/ l
( 1 2 6 mg/ l as
N ) . The latter was included to ensure t hat t he n itrogen
nutrient was not growth- limiting . C ont inuous feeding
commenced on day 3 , after the init ial batc hing , at a rate of
10 ml /h , i . e . 1 . 4 6 mg PO �-/h and 1 . 2 6 mgN /h , or 0 . 3 6 5 mg
Po 3-4 / l . h and 0 . 3 1 5 mg N/l . h . This rate was increased on
days 4 , 5 and 6 t o 0 . 5 5 , 0 . 7 3 and 1 . 1 mg P0 3 -4 / l . h ,
respect ively . The reason for the step increas es i n f l ow
rate was as described previous ly ( Sect ion 7 . 2 ) .
Figure 7 . 3 shows the t ime course of t he phosphate -
l imited fermentat ion . The cont inuous feed commenced on day
3 , prior to phosphate exhaust ion . N it rogen uptake was
observed after the commencement of the c ont inuous feed as
t here was sufficient n itrogen in the feed medium t o e n s ure
an exces s of this nutrient . C itric acid product ion
commenced after day 2 and by day 7 t he concentrat ion was 6 6
g/l , represent ing a yield of 5 5 % based o n sugar ut i l ised
( Table 7 . 1 ) . The fermentat ion did not proceed t o c omplet ion
by day 7 , as the res idual sugar was 2 0 g / l . However , s u gar
ut ilisat ion was 1 2 0 g / l in 7 days compare d to 90 g / l in 1 2
days in bat ch fermentat ion . The DOT value was 6 0 % of
s aturat ion for most of the fermentat ion per iod .
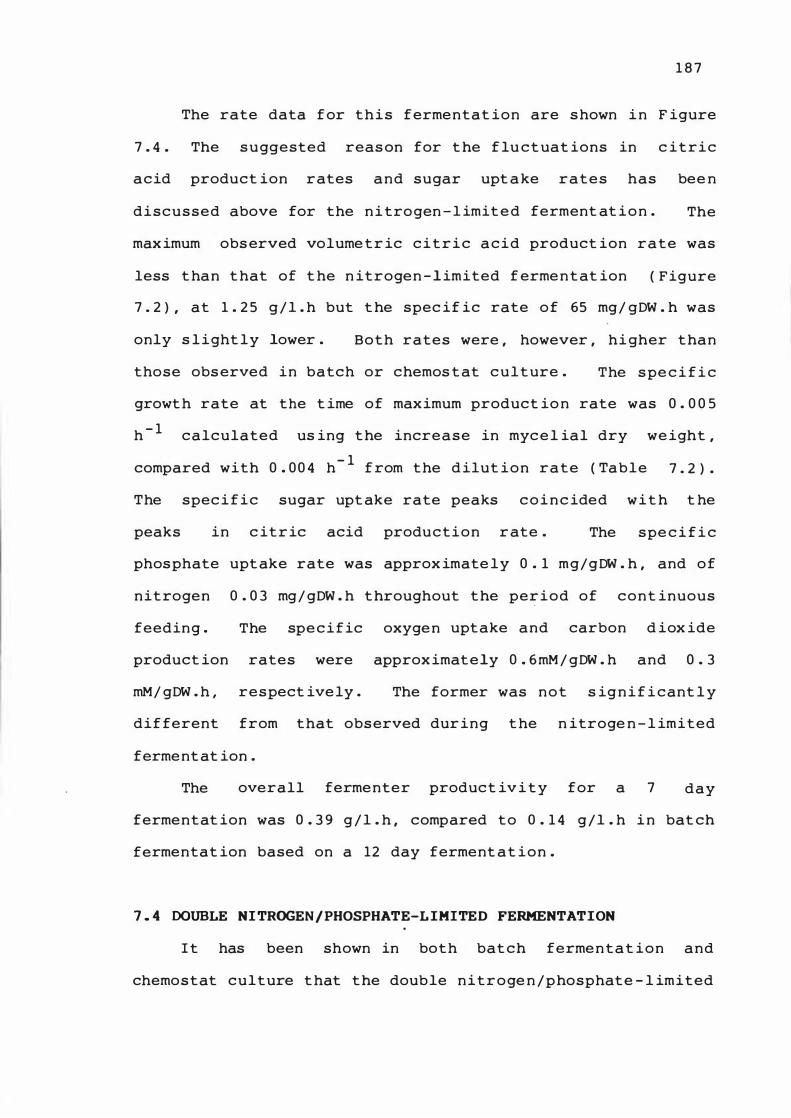
1 8 7
The rate data for this fermentat ion are shown in F igure
7 . 4 . The suggested reason for t he f lu ctuat ions in c itric
acid product ion rates and sugar upt ake rates has bee n
discussed above for the nitrogen -l imited ferment at ion . The
maximum observed volumetr ic citric acid product ion rate was
less than that of t he n itrogen -limited f ermentat ion ( Figure
7 . 2 ) , at 1 . 2 5 g/l . h but t he spec if ic rate of 65 mg/ gDW . h was
only s light ly lower . Both rates were , however , higher than
those observed in batch or chemos tat culture . The spe c i f i c
growth rate at the t ime of maximum product ion rate was 0 . 0 0 5
h - 1 calculated us ing the increase in mycel ial dry weight ,
compared with 0 . 00 4 h- 1 from the dilut ion rate ( Table 7 . 2 ) .
The specific sugar upt ake rate peaks coinc ided wit h t he
peaks in c itric acid production rate . The spe c i f i c
phosphate uptake rate was approx imate ly 0 . 1 mg/gDW . h , and of
nitrogen 0 . 0 3 mg/ gDW . h throughout the period of cont inuous
feeding . The specific oxygen uptake and carbon d iox ide
product ion rates were approximately 0 . 6mM / gDW . h and 0 . 3
mM/ gDW . h , respect ively . The former was not s ignif icant l y
different from that observed during the n itroge n - l imited
fermentat ion .
The overall fermenter product iv i t y for a 7 day
fermentat ion was 0 . 3 9 g / l . h , compared to 0 . 1 4 g/l . h in bat ch
fermentat ion based on a 12 day ferment at ion .
7 . 4 DOUBLE NI TROGEN / PHOSPHATE-L IMITED FERMENTATION
It has been shown in both batch fermentat ion and
chemostat culture that the double nitroge n /phosphate - l imited
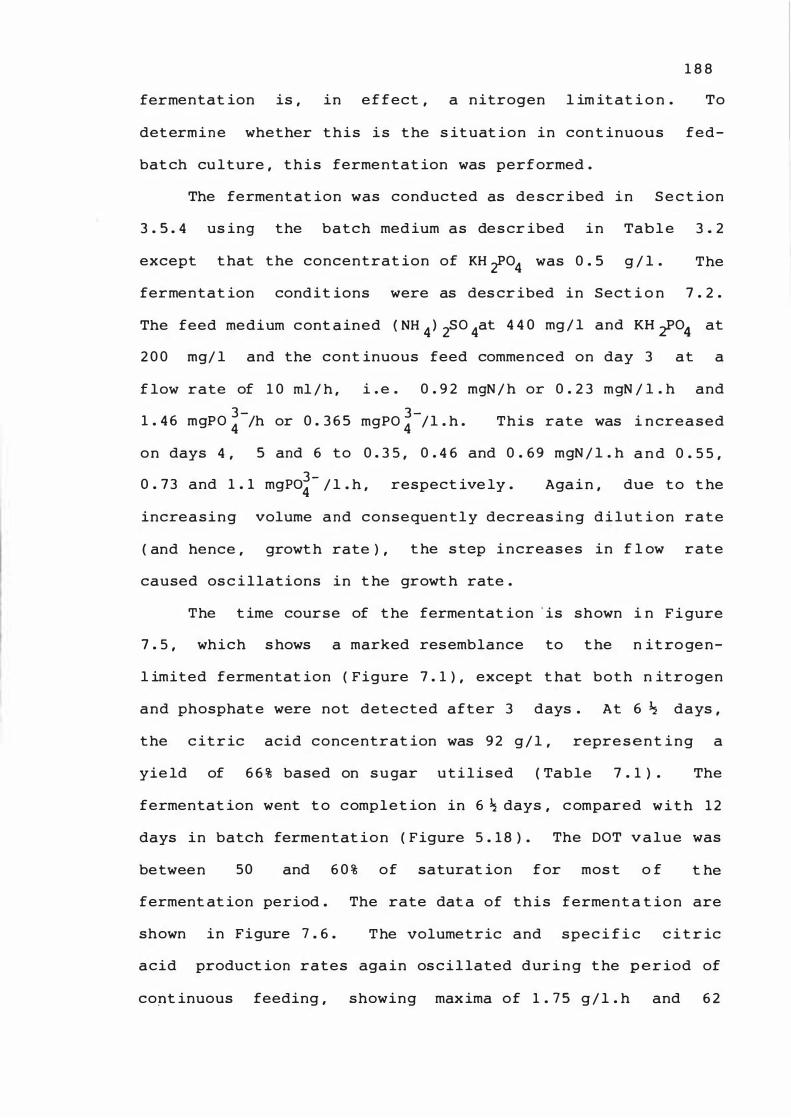
1 8 8
fermentat ion is , in ef fect , a nitrogen l im itat i o n . To
determine whether this is the s ituat ion in con t inuous fed-
batch culture , this fermentat ion was performed .
The fermentat ion was conducted as descr ibed in S e c t ion
3 . 5 . 4 us ing the batch med ium as descr ibed in Tabl e 3 . 2
except that the concentrat ion of KH r04 was 0 . 5 g / l . The
fermentat ion condit ions were as des cr ibed in Sect i o n 7 . 2 .
The feed medium cont ained { NH 4 ) 2S0 4at 4 4 0 mg/ l and KH iPo4 at
2 0 0 mg/ l and the cont inuous feed commenced on day 3 at a
f low rate of 1 0 ml / h ,
3-1 . 4 6 mgP0 4 /h or 0 . 3 6 5
i . e . 0 . 9 2 mgN / h or 0 . 2 3 mgN / l . h and
3-mgP0 4 /l . h . This rate was i ncreased
on days 4 , 5 and 6 to 0 . 3 5 , 0 . 4 6 and 0 . 69 mgN / l . h a n d 0 . 5 5 ,
3-0 . 73 and 1 . 1 mgpo4 / l . h , respect ive ly . Again , due to t he
increasing volume and consequently decreas ing d i lut i on rate
( and hence , growth rate ) , the step increases in f l ow rate
caused osc illations in t he growth rate .
The t ime course of the fermentat ion ' is shown i n F i gure
7 . 5 , which s hows a marked resemblance to the n it ro gen-
l imited fermentat ion ( Figure 7 . 1 ) , except t hat both n itrogen
and phosphate were not detected after 3 days . At 6 � days ,
the c itric acid concentrat ion was 9 2 g / l , represent ing a
yie ld of 6 6 % based on sugar utilised ( Table 7 . 1 ) . The
fermentat ion went t o complet ion in 6 � days , compared with 1 2
days in batch fermentat ion ( Figure 5 . 1 8 ) . The DOT value was
between 50 and 6 0 % of saturat ion for mos t o f t �
ferment at ion period . The rate dat a of this ferment a t ion are
shown in Figure 7 . 6 . The volumetric and spec i f i c c i t r ic
acid product ion rates again oscillated dur i n g the period of
copt inuous feeding , showing maxima of 1 . 7 5 g / l . h and 6 2
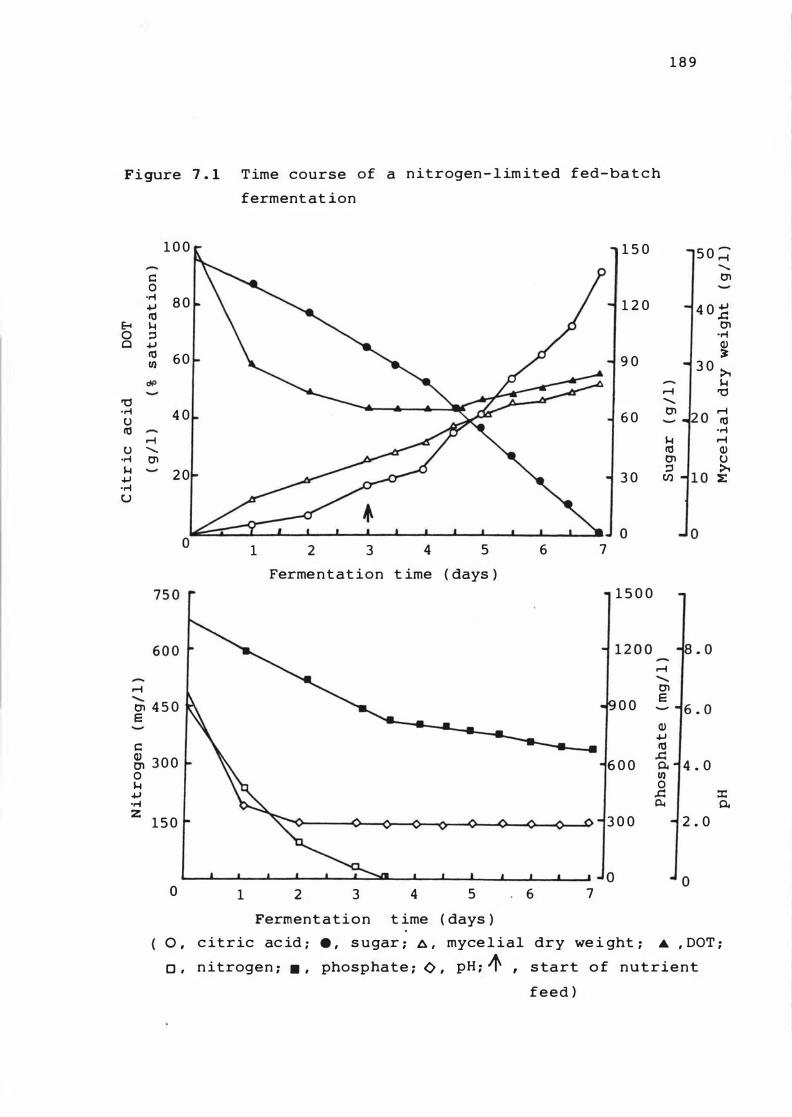
1 8 9
Figure 7 . 1 Time course of a nitrogen- l im ited fed-ba t c h
fermentat ion
1 0 0 1 5 0 5 0 ;.:j' .......
C 0'1 0
.r-! 8 0 +J 1 2 0 4 0 +J rd .c:
e... H 0'1 0 =' 'r-! Cl +J Q)
rd 60 9 0 � Cl) 3 0 �
rH> H r-I '0
'0 ....... 'M 4 0 6 0 0'1 r-i U rd rd 'r-!
r-i H r-i U ....... rd Q) 'M Cl 0'1 U H 20 3 0
=' � +J Cl) � .r-! tJ
o 1 2 3 4 5 6 7
Fermentat ion t ime ( days ) 1 5 0 0
r-I .......
r-i 0'1 ....... 0'1 4 5 0 0 0 E
E Q) +J
C rd
� 3 0 0 ..c: 6 0 0 0. 4 . 0
0 Cl) H 0 +J ..c: :z:: 'r-! D.. 0. z
1 5 0 3 0 0 2 . 0
o 1 2 3 4 5 . 6 7
Fermentation t ime ( days )
0 , c itric ac id ; e , s ugar ; � , myce l ial dry we i ght ; � , DOT ;
0 , n itrogen ; . , phosphate ; () , pH ; if' , s tart o f nutrient
feed )
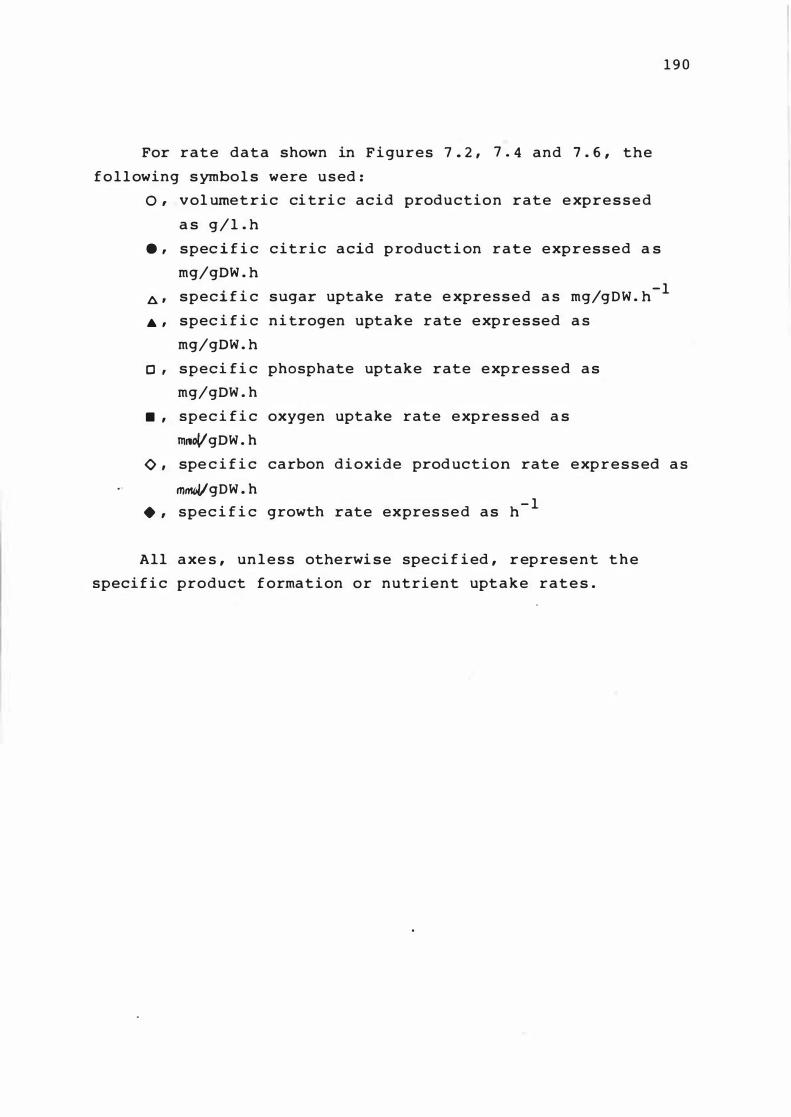
For rate data shown in F i gures 7 . 2 , 7 . 4 and 7 . 6 , the
f o l l owing s ymbol s were u s ed :
0 , vol ume t r i c ci tri c acid production rate e xpre s s e d
a s g / l . h
e , spec i f i c citric a cid p roduct i on r a t e expressed a s
mg/gDW . h
1 9 0
A ,
. ,
speci f i c sugar uptake rate e xpres s e d a s mg/gDW . h- l
spec i f i c n i trogen uptake rate exp r e s sed a s
mg/gDW . h
o ,
. ,
speci f i c phosphate uptake rate exp r e s s e d a s
mg/gDW . h
spec i f i c oxygen uptake rate expres s ed a s
Tl1/1oVgDW . h
0 , spe c i f i c carbon d i oxide prod uction rate exp r e s s ed a s
mnllll/ gDW • h
. , spec i f i c growth rate expres se d a s h- l
All axe s , un l e s s otherwi se speci f i ed , r ep re s ent t h e
speci f i c product f orma t i on or nutrient upt a k e r a t e s .
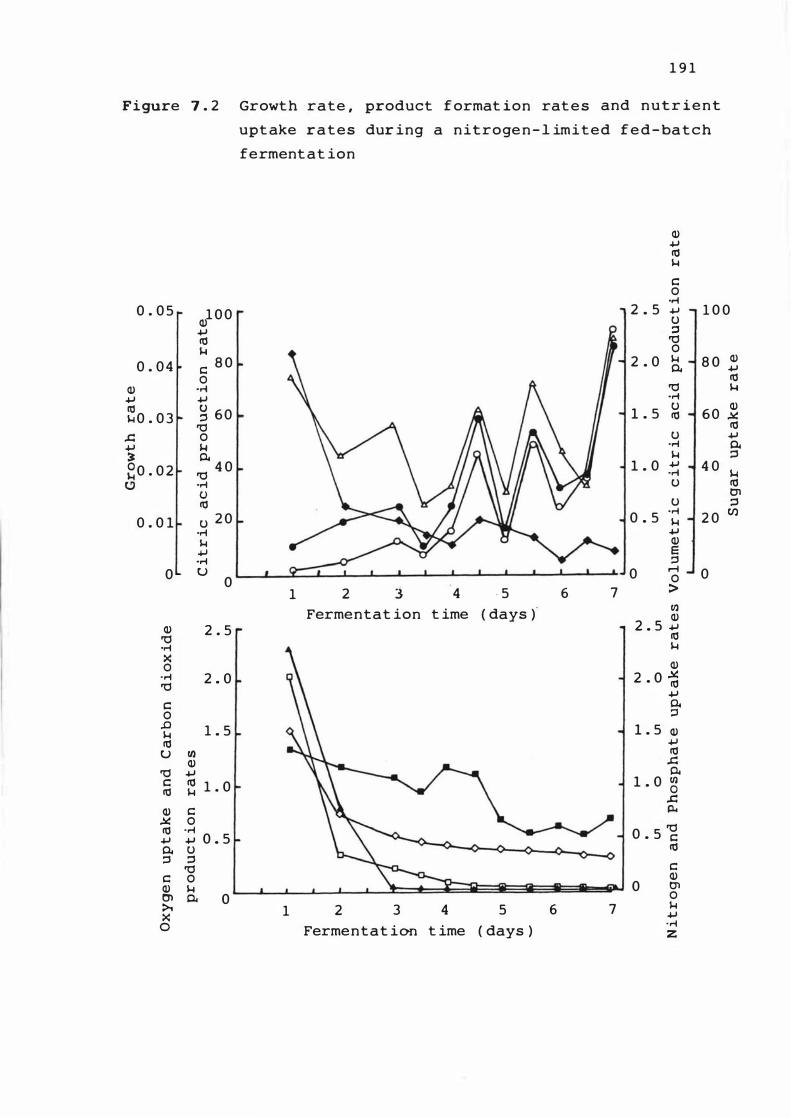
1 9 1
Figure 1 . 2 Growth rate , product format ion rates and nutr ient
uptake rates dur ing a nitrogen- l imited fed-batch
fermentat ion
Q) 4J � 1-1 C 0
.,-i
0 . 0 5 Q)1 0 0 2 . 5 4J 1 0 0
u 4J ::l � '0 1-1 0
0 . 04 c 8 0 2 . 0 1-1 8 0 Q) 0. 4J
0 � Q) .,-i '0 1-1 4J 4J .,-i rtl g 60 1 . 5 u 60 Q) 1-10 . 0 3 � �
'0 � ..c:: 0 u 4J 4J 1-1 .,-i 0. � 0.. 1-1 ::3 80 • 0 2 '0 4 0 1 . 0 4J 4 0 .,-i 1-1 l!> .,-i u �
U 0'1 � u ::3 u 2 0 0 . 5 .,-i 2 0 Cl)
0 . 0 1 1-1 .,-i 4J 1-1 Q) 4J e .,-i ::3
0 U 0 r-I 0 0 0 1 2 3 4 · 5 6 7 :>
Fermentat ion t ime ( days ) m Q)
Q) 2 . 5 2 . 5 4J '0 rtl .,-i 1-1 X Q) 0
.,-i 2 . 0 2 . 0 '@ '0 4J C 0.. 0 ::l
.0 1 . 5 1 . 5 Q) 1-1 � 4J U m �
Q) ..c:: '0 4J 0.. C � 1 . 0 1 . 0 � � 1-1 .c Q) c p..
� 0 '0 � .,-i 4J 4J 0 . 5 0 . 5 c 0. u � ::3 ::3
'0 C C 0 Q) Q) 1-1 0 0"1 0'1 0.. 0 0 >t 1 2 3 4 5 6 7 1-1 X 4J
0 Fermentat ion t ime ( days ) .,-i z
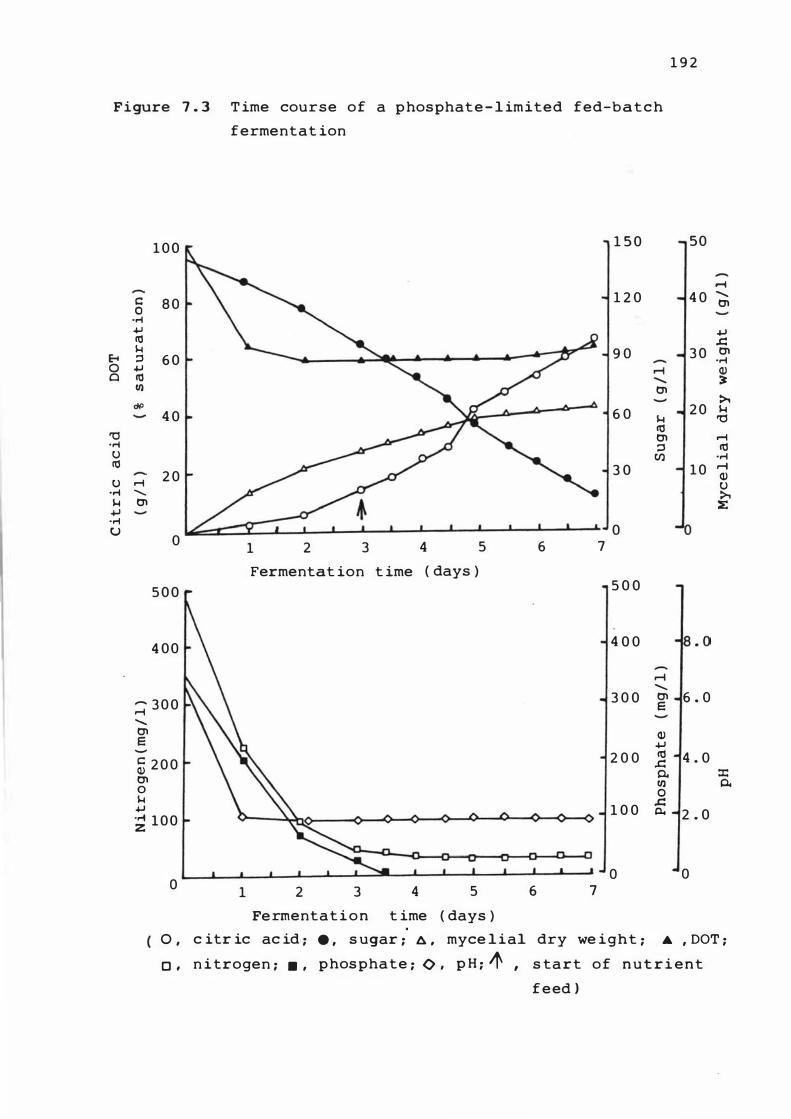
Figure 7 . 3 T ime course of a phosphate - l imited fed-batch
fermentat ion
8 0 Cl
"0 .,..j U re
U .,..j � +J .,..j U
1 0 0
c:: 8 0 0
.,..j +.J IC � ::3 6 0 +.J IC !I)
dP 4 0
r-i 2 0 ......... tn
0
5 0 0
4 00
;::;- 3 0 0 ......... tn E
� 2 0 0 tn o � +.J � 100
o
1 2 3 4 5
Fermentat ion t ime ( days )
1 2 3 4 5
Fermentat i o n t ime ( days )
1 5 0
1 2 0
9 0 ,....j ......... tn
6 0 H re tn ::3
Cl)
3 0
0 6 7
5 0 0
4 0 0
,....j .........
3 0 0 tn E
Q) +J
2 0 0 re .c 0-!I) 0
1 0 0 .c Il.
o 6 7
1 9 2
50
,....j 4 0 .........
tn
+J .c
3 0 tn .,-i Q) �
>. 2 0 H
'0
,....j re
.,-i
10 ,....j Q) u >t
:E
6 . 0
4 . 0 :z:: 0..
2 . 0
o
0 , c itr ic ac id. ; . , s ugar ; 6. , myce lial dry we ight ; . A , DOT ;
0 , n itrogen ; . , phosphate ; <:> , p H ; If'. , s tart of n u t r i ent
feed )
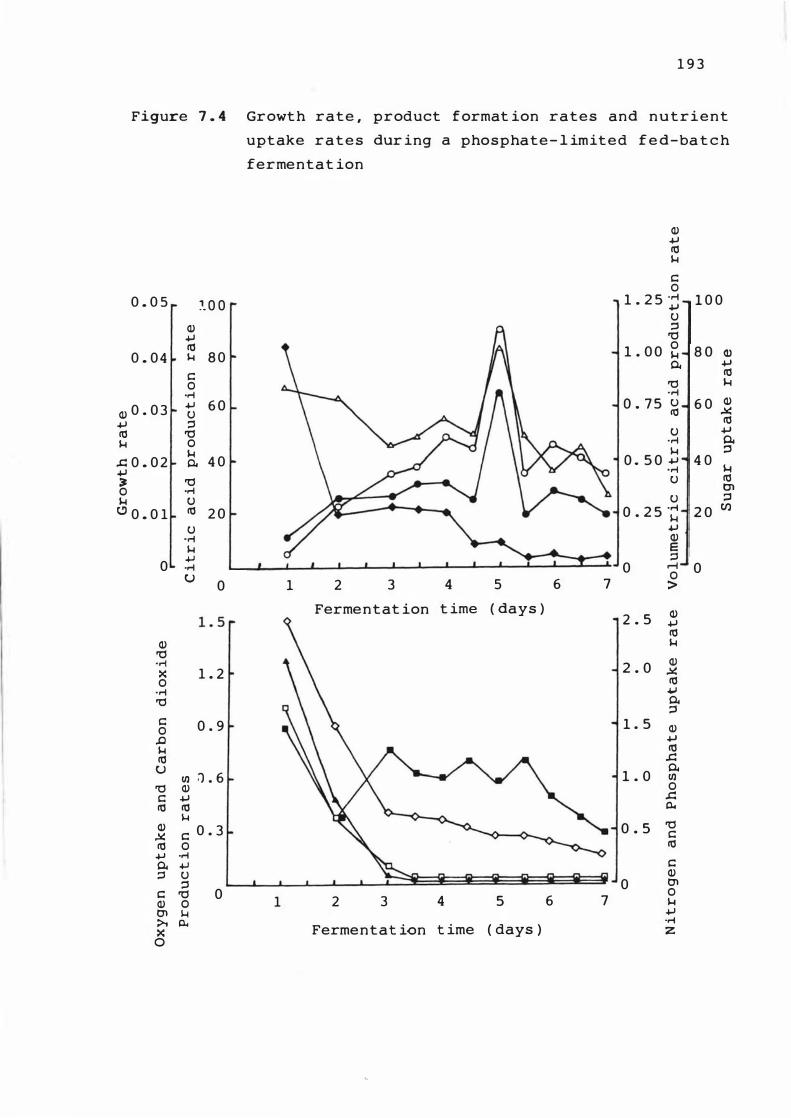
1 9 3
Figure 7 . 4 Growth rate , product format ion rates and nutrient
uptake rates dur ing a phosphate- l imited f e d-ba t c h
fermentat ion
Q) +J en 1-1
� 0
0 . 0 5 �_ O O 1 . 2 5 ;: 1 0 0 C)
Q) ::l +J '0
en 0 8 0 0 . 04 1-1 8 0 1 . 0 0 1-1 Q)
0.. +J
� en
0 '0 1-1
.� .�
Q) 0 . 0 3 .j.J 6 0 O . 7 5 � 6 0 Q)
C) �
+J ::l en
en '0 C) +J
1-1 0 .� 0.
1-1 1-1 ::l
.t:: 0 . 0 2 0.. 4 0 O . 5 0 +J 4 0 .j.J .� 1-1
� '0 C) en
0 .� Cl
1-1 C) C) ::l
t.!) 0 . 0 1 en 2 0 O . 2 5 .� 2 0 Cl)
C) .j.J • .-1 Q) 1-1 E
0 .j.J ::l .� 0 r-i 0 U 0
0 1 2 3 4 5 6 7 >
Fermentat ion t ime ( days ) Q) 2 . 5 .j.J en
Q) 1-1
'0 • .-1 2 . 0 Q) x 1 . 2 ,l(
0 en .� .j.J
'0 0.. ::l
� 0 . 9 1 . 5 0 Q)
.0 +J
1-1 en
en .a
u Ul :) . 6 1 . 0 0. Ul
'0 Q) 0
� .j.J .t::
en en 0.-
1-1 Q)
� 0 . 3 0 . 5 '0
,l( �
en 0 en
.j.J .� 0.. .j.J �
::l C) Q)
::l 0 Cl
� '0 0 1 2 3 4 5 6 7 0
Q) 0 1-1 Cl 1-1 .j.J
� 0.. Fermentat ion t ime ( days ) .�
x z 0
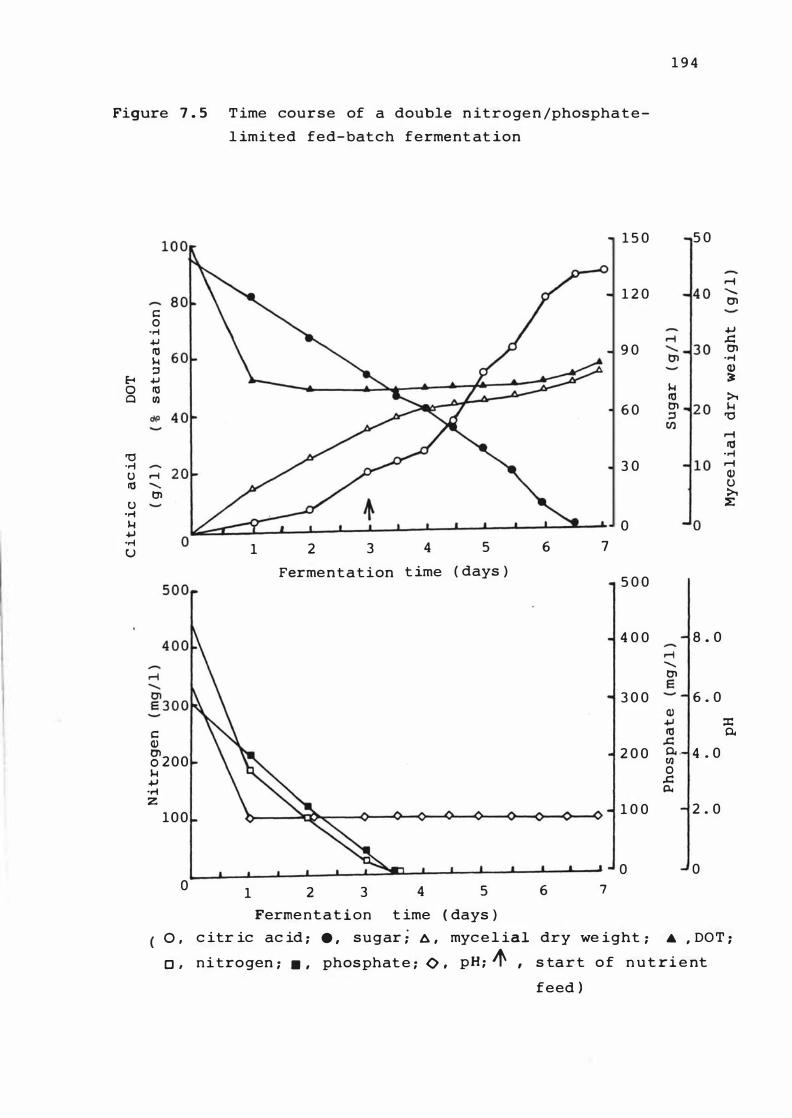
1 9 4
Figure 7 . 5 Time course of a double n itrogen /phosphate
l imited fed-batch ferment at ion
8 0 Cl
'0 ..... U It!
u .,-i 1-1 +J .,-i u
1 5 0 5 0
r-I
1 2 0 , 0'1
c 0
.,-i +.J +J r-i ..c: It! 9 0 , 0'1 1-1 0'1 ..... :s Q.) +J � It! 1-1 Ul It! >.
cH> 6 0 en 1-1
:s '0 Cl)
r-I It!
..... 3 0 r-I
r-i .......
Q.) u
en >. :E
0
1 2 3 4 5 6 7
Fermentation t ime ( days ) 5 0 0
4 0 0 8 . 0 r-i ....... en E
3 0 0 6 . 0 (l) +.J ::x::
C It! 0. (l) ..c:
g200 2 0 0 0. . 4 . 0 Ul 0 1-1
+.J ..... z
..c: Cl.
100 1 0 0 2 . 0
o o o 1 2 3 4 5 6 7
Fermentat ion t ime ( days ) 0 , c itr ic ac id ; . , sugar ; 6 , myc e l ial dry we ight ; & , DO T ;
0 , nitrogen ; . , phosphate ; <:> , pH ; If' , s tart o f n u t ri e nt
feed }
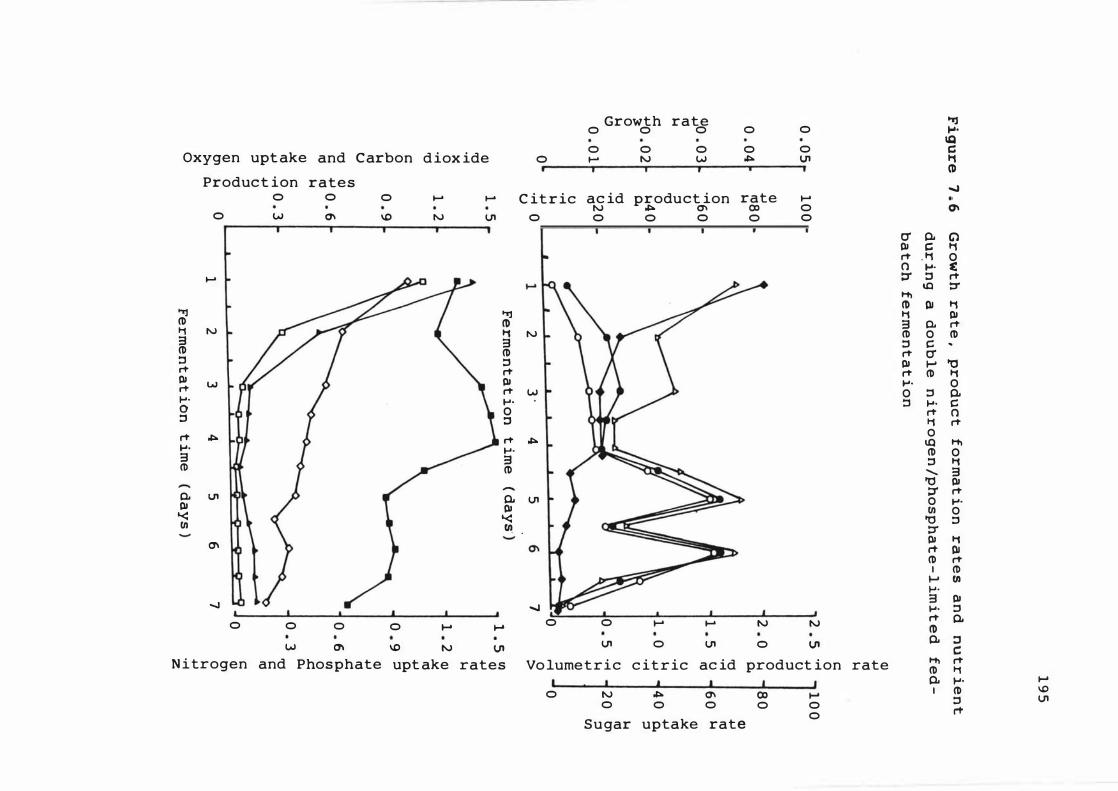
Oxygen uptake and Carbon diox ide
Product ion rates 0 0 0 .- .-
0 W 0'1 \0 N U1
.- .. L\ 1\ . ...
'TI 'TI CD CD t; N t; 3 3 CD CD ::J ::J rt' rt' PI w PI rt' rt' .... .... 0 0 ::J ::J
rt' � rt' .... .... 3 3 CD CD
-0. 0-PI PI '< '<
0 ,
C itric 0
.- kl •
N
w
�
U1
Growth rate o 0 0
0 0 0 .- IV W i i r
0
0 �
ac id product ion N � 0"1
rate CD
0 0 0 0
P .-.
0
0 V1 i
.-0 0
III
: �\ < \ � .
IoU " V .. -.J � -.J , , , , ,
0 0 0 0 ..... ..... 0 0 .- .- IV IV
w 0'1 \0 IV Ut U1 0 U1 0 Ut
N itrogen and Phosphate upt ake rates Volumetric c itric ac id product ion I , I I I
0 IV � 0'1 (Xl .-0 0 0 0 0
Sugar uptake rate 0
0Ij .... IQ c:: 11 CD � (7\
0' 0. G') PI c:: 11 rt' . 11 0 n .... ( ::r ::J rt'
IQ ::r HI CD PI 11 11 PI 3 0. rt' CD 0 CD ::J C �
rt' 0' PI I-' "0 rt' CD t; .... 0 0 ::J 0. ::J .... C
rt' n 11 rt' 0
IQ HI CD 0 ::J t;
"- 3 "0 PI ::r rt' 0 .... III 0
'0 ::J ::r PI t; rt' PI CD rt' I CD I-' III .... 3 PI .... ::J rt' 0. CD 0. ::J
c:: rate HI rt'
CD t; 0. .... .-I CD \0
::J U1 rt'
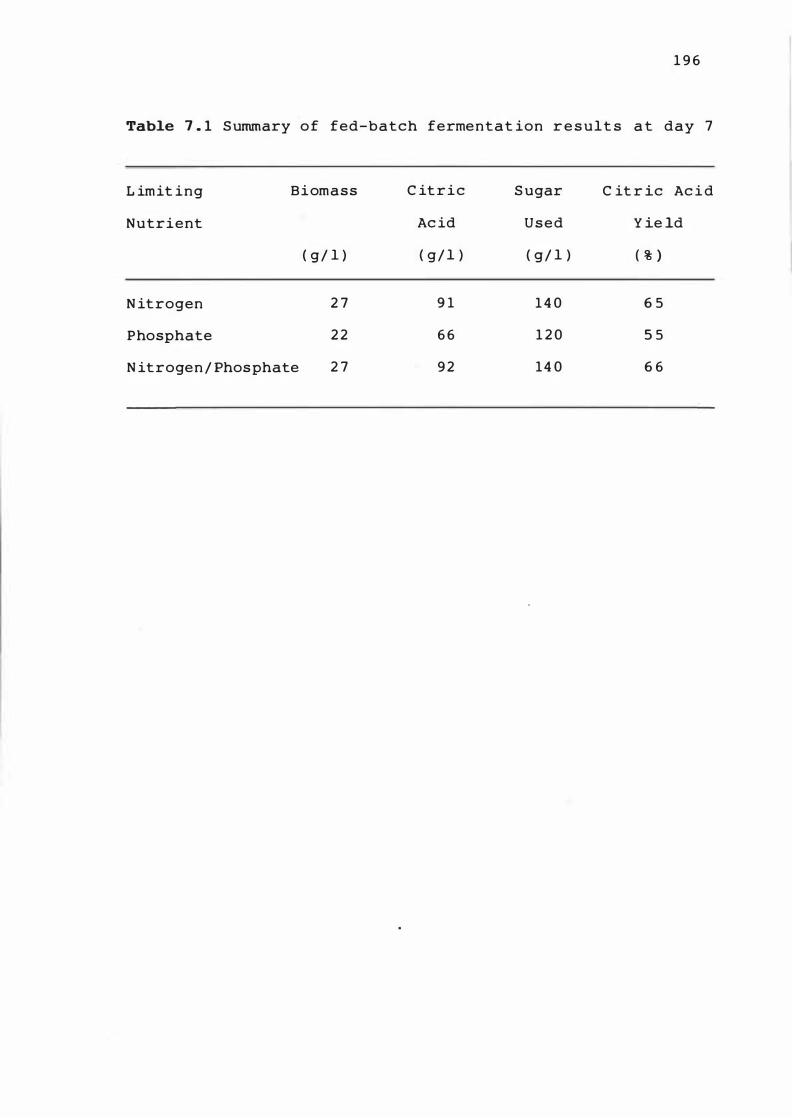
1 9 6
Table 7 . 1 Summary of fed-batch fermentat ion r e sult s a t day 7
L imit ing Biomass C itric Sugar C it r ic Ac i d
Nutrient Ac id Used Y ie ld
( g/ l ) ( g/ l ) ( g/ l ) ( % )
N itrogen 2 7 9 1 14 0 6 5
Phosphate 2 2 6 6 1 2 0 5 5
N itrogen / Phosphate 2 7 9 2 14 0 6 6
1 9 7
mg/ gDW . h , respect ively . Aga in , the spec i f ic sugar uptake
rat e peaks coincided with the c it r ic acid �r oduc t i o n rate
peaks . The spec i f ic growth rate was 0 . 00 1 to 0 . 00 5 h- l
calcu lated o n t he increase in myce l ial dry we i ght , c ompared
to 0 . 0 0 3 to 0 . 00 5 h - l calculated us ing t he dilut ion rate
( Table 7 . 2 ) . The f luctuat ions i n citric a c id product ion
rates and t he sugar uptake can be explained as s ugge s t ed in
Sect ion 7 . 2 . The spec i f ic nitrogen upt ake rate s were
between 0 . 02 and 0 . 0 3 mg/ gDW . h and t he phosphate uptake
rat e s were in the range 0 . 0 5 to 0 . 1 0 mg/ gDW . h . The spec if ic
oxygen uptake and ' carbon d iox ide product i on rates wer e 0 . 9
rnM / gDW . h and 0 . 3 mM/ gDW . h , respect ively .
The overall fermenter product ivity was 0 . 5 9 g/ l . h based
on a 6 day fermentat ion per iod , compared , to 0 . 2 8 g / l . h in
batch ferment at ion based on a 1 2 day ferme nt at ion per io d .
7 . 5 DISCUSSION
The aim of this wor k , which was t o determine t he
feas ibility of citric ac id product ion in fed-batch c u l t ure ,
was achieved . The volumetric and spe c i f ic c it r i c a c id
product ion rates atta ined in fed-batch culture were
s ignif icant ly higher than those in batch fermentat ions , with
consequent reduct ion in fermentat ion t imes . There were ,
however , fluctuat ions in the citric ac i d product ion r a t e s .
This is explained on t he bas is that the d i lu t i on rate , and
hence growt h rate , f luctuated throughout t he peri o d of
cont i nuous feeding . This implies that t here i s a n arrow
range of opt imum growt h rate for max imum c i t r i c a c i d
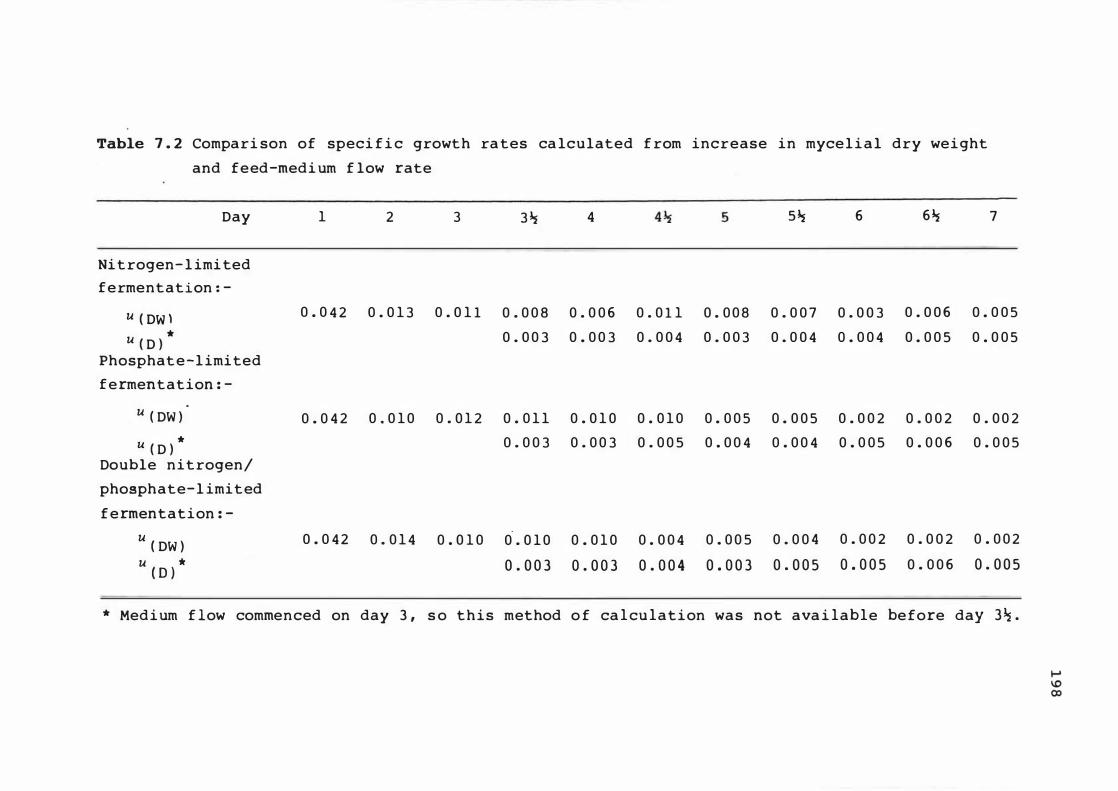
Table 7 . 2 Compari son of speci f i c growth ra tes ca lculated f rom increase in myce l i a l dry wei ght
and feed-medi um f low rate
Day
Ni t rogen- l imi ted
f e rmentation : -
U ( DW ) U ( D )
*
Phosphat e - l imited
f e rmentation : -
U ( DW )
U ( D ) *
Double n i t rogen/
phosphate- l imited
f e rmentation : -
U( DW )
U * ( 0 )
1 2 3 3 � 4 5� 6 6� 7
0 . 0 4 2 0 . 0 1 3 0 . 0 1 1 0 . 0 0 8 0 . 0 0 6 0 . 0 1 1 0 . 0 0 8 0 . 0 0 7 0 . 0 0 3 0 . 0 0 6 0 . 0 0 5
0 . 0 0 3 0 . 0 0 3 0 . 0 0 4 0 . 0 0 3 0 . 0 0 4 0 . 0 0 4 0 . 0 0 5 0 . 0 0 5
0 . 0 4 2 0 . 0 1 0 0 . 0 1 2 0 . 0 1 1 0 . 0 1 0 0 . 0 1 0 0 . 0 0 5 0 . 0 0 5 0 . 0 0 2 0 . 0 0 2 0 . 0 0 2
0 . 0 0 3 0 . 0 0 3 0 . 0 0 5 0 . 0 0 4 0 . 0 0 4 0 . 0 0 5 0 . 0 0 6 0 . 0 0 5
0 . 0 4 2 0 . 0 1 4 0 . 0 1 0 0 . 0 1 0
0 . 0 0 3 0 . 0 1 0
0 . 0 0 3 0 . 0 0 4
0 . 0 0 4 0 . 0 0 5
0 . 0 0 3 0 . 0 0 4
0 . 0 0 5 0 . 0 0 2
0 . 0 0 5 0 . 0 0 2
0 . 0 0 6
0 . 0 0 2
0 . 0 0 5
* Med i um f low commenced on day 3 , s o t h i s method o f ca l cu la t i on was not ava i lable be fore day 3 � .
product ion rate . Nevertheless ,
1 9 9
i t i s c lear from t he data
that high product ion rates can be maintained for e x t ended
t ime periods . Further exper imentat ion us ing equ ipmen t which
would allow maintenance of a constant dilut ion rate s hould
res u l t in improved re sults .
The specif ic cit r ic acid product ion rates att a i n e d were
comparable with those obtained in chemostat culture ( Tables
6 . 1 , 6 . 2 and 6 . 3 ) , and the volumetric rat e s were
s ignif icant ly higher than those obt ained in batch
fermentat ion or chemostat culture . Hence , t he bes t a spects
of both of these techn iques are combined in f e d-batch
culture . The only cost of this techn ique i s a t o t a l of 1 0 %
extra n itrogen nutrient added in the feed med ium . F o r this
cost , the fermentat ion period is nearly halved .
To increase the c itric acid product ion rate and yie ld
further , the DOT value of the culture should be increased ,
as shown in chemostat culture . While this is techn ica l l y
poss ible , economics wil l dec ide whether it is f in an c ia l ly
viable , as s ignif icantly greater power costs , or the u s e of
pure oxygen , wou ld be requ ired .
I nteres tingly , the biomass concentrat i on atta ined in
fed-batch culture was lower than that i n batch
fermentat ions , desp ite there be ing a higher concen t r a t ion of
growth- limit ing nutrient in the former . This was p r obably
due to less storage carbohydrate be ing present in t he
biomass , as predicted from the data in chemostat cul t u re f or
low growth rates .
Another interesting observat ion was that t he p e l l e t a l
form o f growth o f the organ ism disappeared and was r e placed
2 0 0
by discrete myce l ial fragments approx imately 1 t o 2 mm i n
length within 24 hours o f the commencement of cont inuou s
feeding , as was observed in chemostat cont i nuous cu lture
( Sect ion 6 . 6 )
The double nitrogen/phosphate - l im ited fermen t at i o n was
again demons trated to be e f fect ively a n itrogen - l im i t at ion .
The higher citric ac id yield based on sugar used and t he
fact t hat the n itrogen - limited fermentat ion went t o
complet ion , shows the nitrogen l imitat ion t o be sup e r ior t o
the phosphate -limited fermentat ion for c it r ic ac id
product ion . The overall fermenter product ivit ies c learly
show t hat in these experiments the f ed-batch culture was
superior to both batch and chemostat cultures ( Tab le 7 . 3 ) ,
although it must be borne in mind that in chemostat culture ,
growth rates of less than 0 . 0 1 7 h - 1 were not i nves t igated .
If the y were , there is no reason t o be l ieve that s im i lar
produc t iv i t ies to those at t ained in fed-batch cu lture cou ld
not be achieved . The main advantage of fed-batch over
chemostat cu lture is the reduced complex i t y , and t here f ore
cost , f or commercial scale product ion .
7 . 6 CONCLUS IONS
The ma in conc lus ion to be drawn from t hese res u l t s i s
that c it r ic ac id product ion i n cont inuous fed-batch cul t ure
fermentat ion is feas ible . Thus , high citric acid produ ct ion
rates can be achieved and maintained us ing t hi s t echni que ,
result ing in shortened fermentat ion t imes and t hus increased
fermenter product ivit ies . It may be pos s ible t o reduce t he
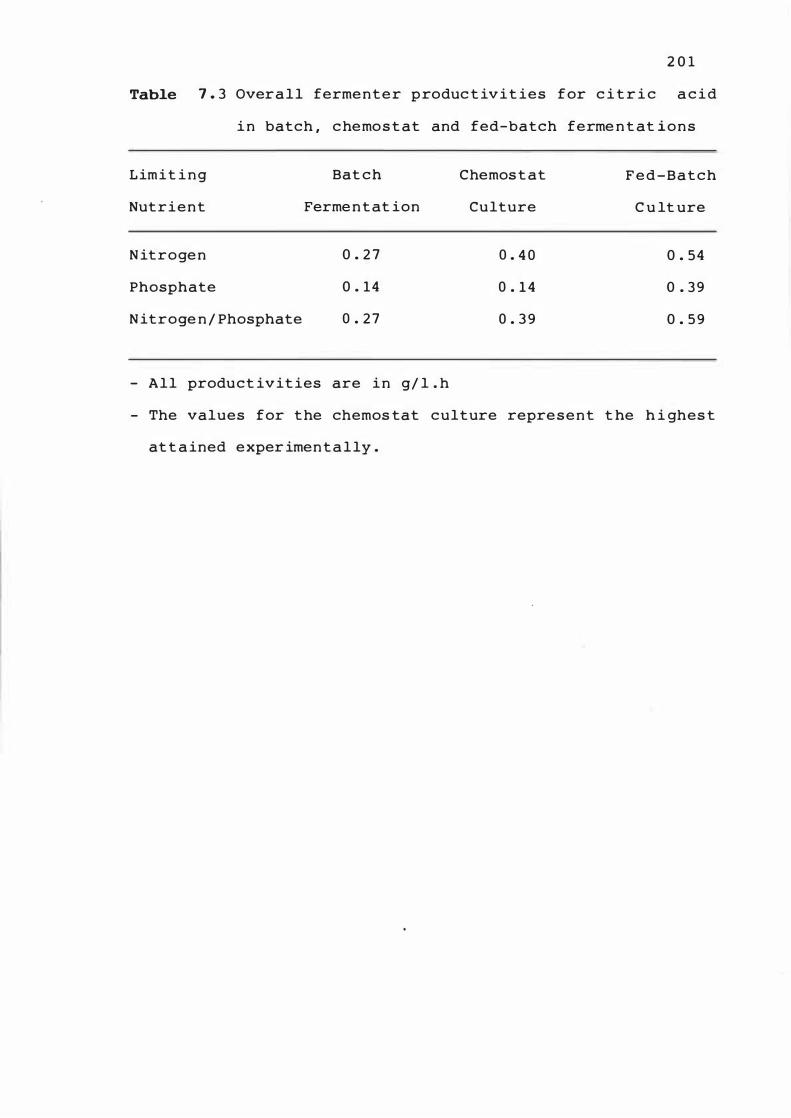
2 0 1
Table 7 . 3 Overall fermenter produc t ivit ies for c i t r i c acid
in batch , chemost at and fed-batch ferme n t at ions
Limit ing Bat ch Chemost at Fed-Batch
Nutrient Fermentat ion Culture C u lt ure
N itrogen 0 . 2 7 0 . 4 0 0 . 54
Phosphate 0 . 14 0 . 14 0 . 39
N itroge n / Phosphate 0 . 27 0 . 39 0 . 59
- All product ivities are in g/ l . h
- The values for the chemos tat culture represent t he h i ghes t
att ained exper imentally .
2 0 2
fermentat ion per iod further by u s i n g a microproces sor
controlled med ium feed pump to increase the f l ow rate
exponent ially , and so maintain t he growth rate con s t ant at
the opt imum for citric ac id product ion . Thus , t he r e are
commercial pos s ib i l it ies f or this fermentat ion t echnology
with regard to c itric acid product ion .
2 0 3
CHAPTER 8
FINAL DISCUSSION AND CONCLUS IONS
The maj or aim of this work was t o seek d e t ai led
informat ion on the course of a typical citric ac id
fermentat ion proces s , with a view to unders tandin g the
process . I n i t ially , exper iments were perf ormed t o
invest igate the ef fect o n the ferme ntat ion of interrup t ions
to aerat ion . Provided that the DOT value of the c u lture
remained above 2 0 % of s aturat ion , no gross e f fe c t was
observed , but when the DOT fe l l to zero , c i t r i c ac id
product ion ceased . This was not unexpected s in ce the
DOTcrit for c itric ac id product ion has bee n reported t o be
2 0 % of saturat ion ( Kubicek e t a l . , 1 9 8 0 ) . However , t he fact
that c itric ac id product ion recovered , even after a p e r iod
of 85 minutes at zero DOT value was surpr is ing , s ince oxygen
starvat ion may have been expected to k i l l the org a n ism .
There are two poss ible explanat ions for this observ a t ion .
The f irst is that the organ ism has s ome facu l t at ive
anaerobic capabil ity . There are no report s i n the
l iterature re garding A . n i g e r fermentat ions under ana erobic
condit ions . However , anaerob ic f i lamentous fungi have been
reported ( Windham and Akin , 1 9 8 4 ) . The second poss i b i l it y
i s that the oxygen s t arvat ion init iated the s poru l a t ion
process o f the organ ism . This process may be reve r s ible
( Baxter , pers . comm . , 1 9 8 6 ) and the de lay observed in t he
recovery of c itric acid produc t ion may have been due t o the
revers al of the biochemical mechan isms of sporu lat i o n and
2 0 4
subsequent recomme ncement o f the biochemical mechan isms
assoc iated with citric acid product ion . However , spores
were not observed in the culture . With this in m in d , and
t he fact t hat sporulation is an aerobic process , t he mos t
l ikely explanation is the f irst , involving anaerobic
metabol ism .
The experiments invest igat ing citr ic ac id product io n in
batch fermentat ion under both n it rogen and phosphate
l imitat ion revealed that the max imum c itric acid produc t ion
rate occurred pr ior t o the exhaus t ion of the l im i t ing
nutrient . This implied that there was an opt imum growth
rate for citric ac id accumulat ion and led to exper iments
being performed in chemostat culture . Dur ing t he s e
experiments , the ef fect of the DOT value o f the culture was
also invest igated . The results showed that t he max imum
product ion rates and yie lds occurred at low growt h rat e s but
high DOT values . It is now pos s ible to s ugge s t an
explanat ion f or these observat ions .
At high growth rates the organ ism wou ld have a high
demand f or energy and biosynthet ic interme diates , in which
case it would be expected that citric acid would be f ur t her
metabolised rather than accumulated . At low growth r ates ,
however , because of the poorly regulated key e n z yme
phosphofructokinase , the f lux of carbon material t hr ough
glycolys is is mainta ined high , but the organ ism has a much
lower demand for energy and biosynthetic int e rmed iates .
Thus citric ac id accumulates . Further , at the low growth
rate the nitrogen ( NH: > uptake rate e as ily sat is f ie s t he
2 0 5
b iosynthet ic demand o f the organism , and the exce s s NH: ion
may contribute to the deregulat ion of phosphofructo k i n ase .
The reason for the requirement of a high DOT v a lue i s
less c le ar , but may be re lated to the operat ion o f the
alternat ive ox idat ion pathway ( SHAM-s ens it ive pathw a y ) a s
suggested b y Kubicek e t a Z . ( 1 9 8 0 ) ( Sect ion 2 . 5 ) . This
pathway a l lows the reox idat ion of glycolyt ic NADH w i t hout
concomitant ATP product ion , and requ ires a high DOT value .
Given that dur ing intens ive c itric acid accumu la t i o n the
energy demand of the organism is low , suf f i c ient ATP i s
formed by subs trate - leve l phosphorylat ion . H owever ,
reox idat ion of NADH is es sent ial for glycolys i s t o be
maintained .
The problem st ill remains regarding the mechan is m o f
c itric ac id accumulat ion . No re lations hips of c it r ic ac id
product ion with any enzyme activit ies were e s t ab l is he d in
chemostat culture , despite relat ionships -be ing obse r v e d f or
phys iological parameters . However , the observat ion t ha t 2 -
oxoglutarate dehydrogenase is act ive dur ing c i t r i c ac id
product ion quest ions the hypothes is of a metabolic b lo c kage
of the TeA-cycle at the point of this e n z yme . No p r o gress
was made in the further clar ificat ion of the s it ua t ion
regarding b iochemical mechan isms of c itr i c
accumulat ion . This wou ld sugges t that c i t r i c
accumulat ion is not totally enzyme control led .
ac id
acid
I t is
poss ible that ce ll membrane permeabi l ity has a r o l e in
c itric acid accumu lat ion , .in con j unct ion with met a b ol ic
contro l .
An interest ing observat ion dur ing the f e rme nter
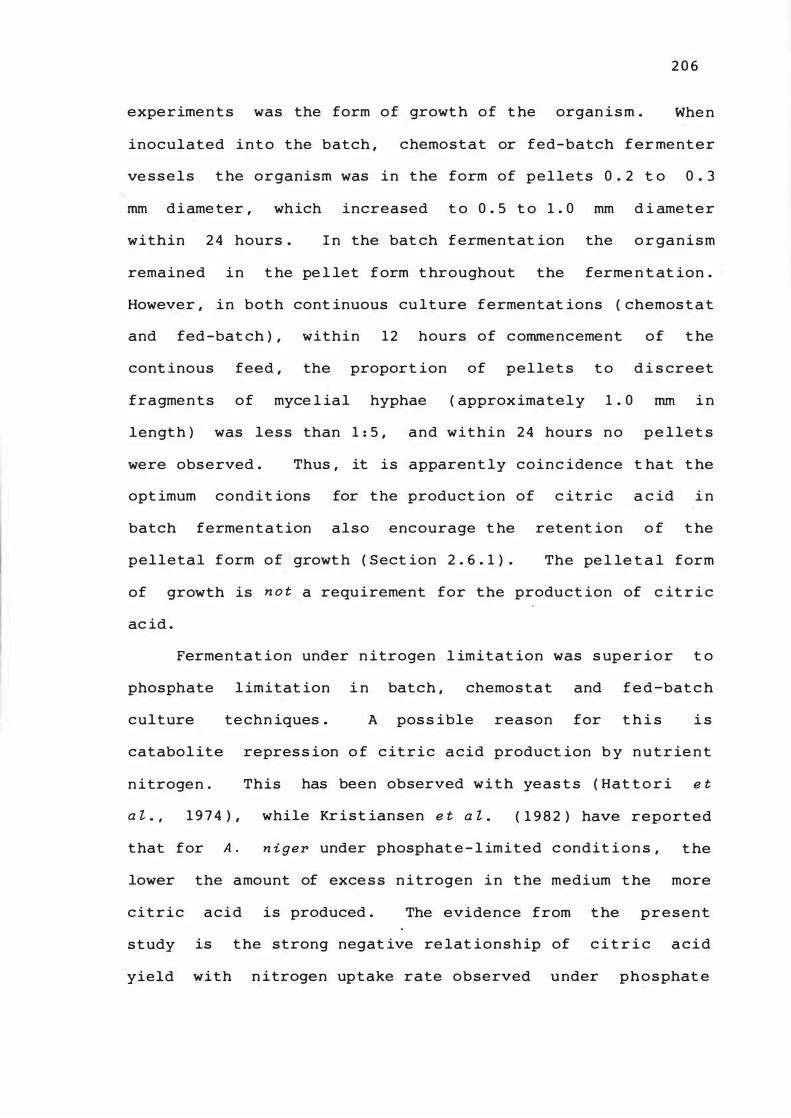
2 0 6
experiments was the form of growth of t he organ ism . When
inoculated into the batch , chemostat or fed-batch fer menter
vessels t he organism was in the form of pellets 0 . 2 t o 0 . 3
mm diameter , which increased t o 0 . 5 t o 1 . 0 mm d i ameter
within 2 4 hours . I n the bat ch fermentat ion the o r ganism
remained in t he pe l let form t hroughout the ferme n t at ion .
However , in both cont inuous cu lture fermentat ions ( chemostat
and fed-bat ch ) , within 12 hours of commencement of t he
cont inous feed , the proport ion of pellets t o d i s creet
fragments of myce l ial hyphae ( approximately 1 . 0 mm i n
length ) was less than 1 : 5 , and within 24 hours no pe llet s
were observed . Thus , it is apparent ly coinc idence t hat t he
opt imum condit ions for the product ion of c itric a c id i n
batch fermentation also encourage t he retent ion o f t he
pelletal form of growth ( Sect ion 2 . 6 . 1 ) . The pel le t a l form
of growth is n o t a requirement for the product ion of c it r i c
ac id .
Fermentat ion under n itrogen l imitat ion was s uper ior t o
phosphate l imitat ion i n batch , chemostat and fed-batc h
culture techn iques . A poss ible reason for t h i s i s
catabol ite repress ion o f c itric acid product ion b y nutrie n t
n itrogen . This has been observed with yeas t s ( Hat t o r i e t
a l . , 1 9 7 4 ) , while Krist iansen e t a l . ( 1 9 8 2 ) have reported
that for A . n i ger under phosphat e - l imited c ondit i o n s , t he
lower the amount of excess n itrogen in the medium t he more
citric acid is produced . The evidence from t he present
study
yield
is the strong negat ive re lat ionship of c i t r i c acid
with n itrogen uptake rate observed under phosphat e
limitat ion , but not
evidence is that a
under n itrogen limitat ion .
combined n itrogen /phosphate
2 0 7
Furthe r
double
l im itat ion behaved as if it were a nitrogen l im itat i o n .
In conc lus ion , maximum c it r ic ac id product io n rate s
occurred at a low but pos i t ive growth rate and a h ig h DOT .
This informat ion , gained from chemostat culture , was applied
to a cont inuous fed-batch system , and fermenter produ c t iv i t y
was doubled compared with a batch fermentat ion ( Ta b l e 8 . 1 ) .
As far as can be determined , this is the f ir s t report ing i n
the scient i f ic literature o f the use of a cont inuous fed
batch fermentat ion sys tem for citric acid product ion .
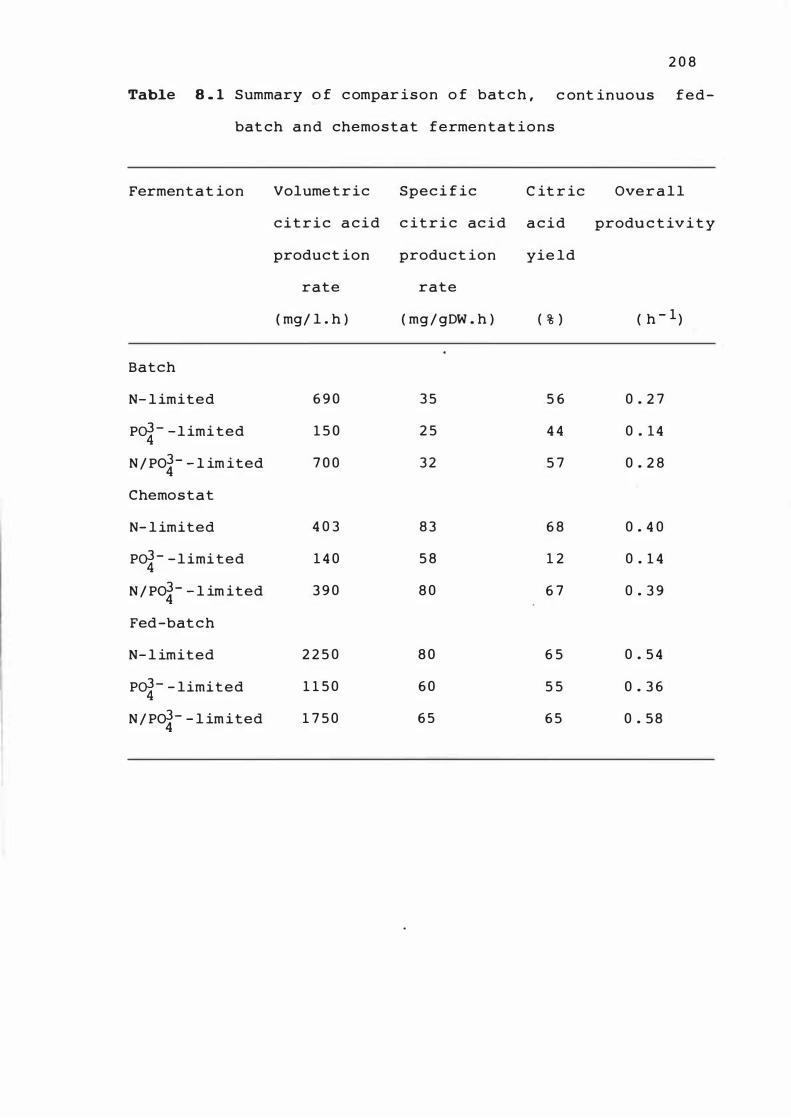
2 0 8
Table 8 . 1 Summary � f compar ison o f batch , c ont inuous fed
batch and chemostat fermentat ions
Fermentat ion Volumetric Speci f ic C it r ic Over a l l
citric acid c itric acid acid produ c t iv i t y
product ion product ion yie ld
rate rate
( mg/ l . h ) ( mg / gDW . h ) ( % ) ( h - 1 )
Batch
N- l imited 6 9 0 3 5 5 6 0 . 2 7
Pq- - l imi ted 1 5 0 2 5 4 4 0 . 14
N / PO�- - l im ited 7 0 0 3 2 5 7 0 . 2 8
Chemostat
N- l imited 4 0 3 8 3 6 8 0 . 4 0
Pq- - l imi ted 1 4 0 5 8 1 2 0 . 1 4
N / PO�- - l im ited 3 9 0 8 0 6 7 0 . 3 9
Fed-batch
N- l imited 2 2 5 0 8 0 6 5 0 . 5 4
Pq- - limited 1 1 5 0 6 0 5 5 0 . 3 6
N / PO�- - l im ited 1 7 5 0 6 5 6 5 0 . 58
2 0 9
REFERENCES
Adiga , P . R . , Sas try , K . S . , Venkatasubramanyam , V . and S arma ,
P . S . ( 1 96 1 ) . I nterre lat ionships in t r a c e - e lement
metabol ism in A s p e rg i l l u s n i g e r . B i o c h em i ca l J o u r n a l ,
8 1 , 5 4 5 - 5 5 0 .
Ahmed , S . A . ( 1 9 7 0 ) . The effect o f different sys tems o f
cu lt ivat ion and of var ious factors on the p r oduct ion of
citric acid and the r o le of mitochondr i a in this
proces s . ph . D Th es i s ,
G l a s g o w , Sco t land .
Un i v e r s i ty o f S t ra t h c l y d e ,
Ahmed , S . A . , Smith , J . E . and Ander s on , J . G . ( 1 9 7 2 ) .
Aiba ,
Mitochondr ial act ivity during c it r ic acid p roduct ion by
A s p e rg i l l us n i g e r . Tra n s a c t i o n s o f t h e B r i t i s h
My co l o g ica l S o c i e ty , 5 9 , 5 1 - 6 1 .
S . and Mat suoka , M . ( 1 9 7 9 ) . Ident i f icat ion of
metaboblic mode l : c itrate production from glucose by
Candida lipo l y t ica .
2 1 , 1 3 7 3 .
B i o t e c h n o l o g y a n d B i o e n g i n e e r i n g ,
Ame lun g , C . H . ( 1 9 2 7 ) . Beitrage zur
Z e i t s c h r if t
s aure b i l dung durch
f u r P h y s i o l o g i s c h e A s p e rg i l l u s n i g e r .
Chem i e , 1 6 6 , 1 6 1 - 2 0 9 .
Asen j o , J . A . and Jew , C . ( 1 9 8 3 ) .
2 1 0
Primary met ab o l ite o r
microbial protein from ce l lu los e : condit ions , kinet i c s ,
and mode l l in g of the s imu ltaneous s acchar i f icat ion and
fermentat ion to citric ac id . I n : A n n a L s o f t h e N e w Y o r k
A ca demy of S c i e n ces , Vo L 4 1 3 , B i o L o g i c a L E n g i n e e r i n g
I l l . K . Ven katosubraman ian , A . Con s t ant inades and W . R .
Vieth ( Editors ) .
Atticus ( 1 9 7 5 ) . C itric acid forges ahead as an indu s t r i a l
chemical . C h e m i ca L A g e o f In d i a , 2 6 , 4 9- 5 4 .
Banik , A . K . ( 1 9 7 5 ) . Fermentat ive product ion of c it r ic a c i d
by A s perg i L L u s n i g e r : s train se lect ion and opt imum
cu ltural condit ions for improved c it r ic a c id
product ion . J o u rn a L of Fo od S c i e n c e a nd Te c h n o Z o gy ,
India , 3 , 1 1 1 - 1 14 .
Baxter , M . ( 1 9 8 6 ) . Pers onal Communicat ion . Departmen t o f
Microbiology and Genet ics , Massey Un ivers i t y ,
Palmerston North , New Zealand .
Bernhauer , K . ( 1 9 2 8 ) . Zum chemismus der
c itronensaurebildung durch p i l z e . 1 . Die s aureb i l du n g
aus verschiedenen kohlen -stof fverbindungen . 1 1 . D ie
c itronensaureb ildung aus gluconsaure .
Z e i t s c hrift , 1 9 7 , 3 0 9 - 34 2 .
B i o c h em i s c h e
Berry , D . R . , C hmie l , A . and Al Oba idi , Z . ( 1 9 7 7 ) .
2 1 1
C it r i c
acid product ion b y A sp e rg i Z Z u s n i g e r . I n : G e n e t i c s a n d
Phy s io Z o g y of A s pe rg i Z Z u s , Edited b y Smith , J . E . and
Pateman , J . A . , p4 0 5-4 2 6 . Academic Press , London , New
York , San Fran c i s co .
Bertrand , D . , and De Wolf , A . ( 1 9 5 9 ) . Premieres reacherches
sur le role de l ' ol igoelement z inc c he z L ' A s p e rg i Z Z u s
n i g e r . B u Z Z e t i n S o c i e t e de C h i m i e B i o Z o g i q u e , 4 1 , 5 4 5 -
5 54 .
Bloom , S . J . and Johnson , M . J . ( 1 9 6 2 ) .
carboxylase of A s perg i Z Z u s n i g e r .
B i o Z o g i ca Z Chemi s t ry , 2 3 7 , 2 7 1 8 - 2 7 2 0 .
The p yruvate
J o u r n a Z o f
Boag , I . ( 1 9 84 ) . Personal commun icat ion . Departmen t o f
Product ion Technology , Mas sey Univers i t y , Palmers ton
North , New Zealand .
Bomstein , R . A . and Johnson , M . J . ( 1 9 5 2 ) . The mechan i sm of
format ion of c itrate and oxalate by A s p e rg i Z Z u s n i g e r .
Jou rna Z of B i o Z o g i ca Z Chem i s t ry , 1 9 8 , 1 4 3 - 1 5 3 .
Bradford , M . M . ( 1 9 7 6 ) .
quant i tat ion of
A rapid and sens it ive met hod f o r the
microgram quant it ies of prote in
u t i l iz ing the principle of prote i n - dye
A n a Zy t i ca Z B i o c h em is t ry , 7 2 , 2 4 8 - 2 54 .
b inding .
Brooks , J . D . ( 1 9 7 8 ) . A study of the s t oichiomet r y and
energet ics of growth of . Ps e udomo n a s AM i in c o n t i nuous
culture . ph . D Th e s i s , Un i v ers i t y of S y dn e y , A u s t ra Z i a .
2 1 2
Brooks , J . D . , Mac lennan , D . G . , Barford , J . P . and Hal l R . J .
( 1 9 8 2 ) . Des ign of laboratory cont inuous - c u l t ure
equ ipment for accurate gaseous met abol ism measureme n t s .
B i o t e a h n o l o gy a n d B i o e ng i n e e r i ng � 2 4 � 8 4 7 - 8 5 6 .
Bruchmann , E . E . ( 1 96 6 ) . Act ion of hydro gen perox idase o n
the accumu lat ion of c itric acid b y A s p e rg i l l u s n i g e r .
Na t u rw i s s e n s c haft e n � 5 3 � 2 2 6- 2 2 7 .
Bruenn , J . A . ( 1 9 8 0 ) . V irus -l ike par t i c les of yeas t . A n n ua l
Rev i ew of Micro b i o l o g y � 3 4 � 4 9 - 6 8 .
Bue low , G . H . and Johnson , M . J . ( 1 9 5 2 ) . Ef fect of aerat ion
on c itric acid product ion in 5 0- gallon t an ks .
Ind u s t r i a l and Eng i n e e r i ng C h e m i s t ry � 4 4 � 2 9 4 5 - 2 9 4 6 .
Car i l l i , A . , Chain , E . B . , Gualandi , G . and Mor i s i , G .
( 1 9 6 1 ) . Aerat ion studies : I l l . Cont inuous measureme n t
of dissolved oxygen dur ing fermentation in large
fermenters . S c i e n t ifi c Rep o r t s o f t h e I s t i t u t o
S u p e r i o r e D i Sa n i t a � Rom e � 1 � 1 7 7 - 1 8 8 .
Chong , R . ( 1 9 84 ) . Pers onal commun icat ion . Departme n t o f
Biotechnology , Mas sey Un ivers ity , Palmers ton North , New
Zealand .
Clark , D . S . and Lentz , C . P . ( 1 9 6 1 ) . Submerged c i t r i c a c i d
fermentat ion o f sugar beet molasses : e f fe c t o f pres s ure
and recirculat ion of oxygen . Cana d i a n J o u r n a l o f
Micro b i o l o gy � 7 � 4 4 7 - 4 5 3 ,.
C lark , D . S . , Ito , K . and Horitsu , H .
2 1 3
( 19 6 6 ) . E f f ec t o f
manganese and other heavy metals on submerge d c it r i c
acid fermentat ion of molas ses . B i o t e c h n o Z o g y a nd
B i o e n g i n e e r i n g , 8 , 4 6 5 - 4 7 1 .
C lark , T . A . ( 1 98 2 ) . The 1 9 -hydroxylat ion of cortexo l on e by
the fungus Pe Z Z i c u ra fi Zam e n t o s a . ph . D Th e s i s , Ma s s ey
U n i v ers i t y , Pa Z m e r s t o n No r t h , N e w Z e a Z a n d .
C lark , T . A . , Maddox , I . S . and Chong , R . ( 1 9 8 3 ) . The e f fe c t
o f glucose on 1 1B - and 1 9 -hydroxylat ion of Re i c h s t e ins
Subs tance S by P e Z Z i c ura fi Zamen t o s a . E u ro p e a n J o u rn a Z
of A pp l i e d Micro b i o l o g y and B i o t e c h n o Z o g y , 1 7 , 2 1 1 - 2 1 5 .
C lark , T . A . , Hesketh , T . and Seddon , T . ( 1 9 8 5 ) . Aut omat i c
control o f dissolved oxygen tens ion v i a f e rmen t e r
agitat ion speed . B i o t e c h n o Z o g y a n d B i o e n g i n e e r i n g , 2 7 ,
1 5 0 7 - 1 5 1 1 .
C le land ,
on
W . W . and Johnson , M . J . ( 1 9 54 ) .
the mechanism of citric acid
Tracer exper imen t
format io n by
A s p e rg i l l u s n i g e r . J o u rn a Z of B i o Z o g i ca l C h em i s t ry ,
2 0 8 , 6 7 9 - 6 8 9 .
C lement , M . T . ( 1 9 5 2 ) . Citric acid ferme n t at ion o f beet
molas ses by A s p e rg i l l u s n i g e r in s ubmerged c u l ture .
Canadian Jo urna Z of Tech n o Zogy , 3 0 , 8 2 - 8 8 .
Coppola , E . D . , Conrad , E . C . and Cotter , R . ( 1 9 7 8 ) . H igh
pressure liquid chromatography determinat ion of maj or
organic acids in cranberry j uice . J o u rn a Z o f t h e
A s s o c i a t i o n o f A n a ly t i ca l Chem i s t s , 6 1 , 1 4 9 0 - 1 4 9 2 .
2 14
Currie , J . N . ( 1 9 1 7 ) . The c itric acid fermentat i on o f
Jo urna l o f B i o l o g i o a l C h e m i s t ry ,
Oas ,
A s p erg i l l u s n i g e r .
3 1 , 1 5 - 3 7 .
A . and Nandi , P . ( 1 9 6 5 ) . Product i o n and
character i z ation of ultravio let induced mutat i o n s i n
A s perg i l l u s n i g e r .
Ins t i t u t e , 2 8 , 8 3 - 9 1 .
Tra n s a o t i o n s of B o s e R e s e a r o h
Oemerec , M . ( 1 94 5 ) . A new mutant of Pen i o i l l i um n o t a t um .
Carne gie I nst itute Washington , Yea r b o o k N o .
1 1 9 .
4 4 , 1 1 7 -
O ivekar , P . V . , Ganapatt i , R . , Chandran , R . R . , Gaind , C . N . ,
Gupta , F . C . and Qaz i , G . N . ( 19 7 1 ) . Submerged c it r i c
acid fermentat ion of sugar cane j u ice . Ind i a n J o u rn a l
of Te o h n o l o g y , 9 , 2 5- 2 6 .
Oixon , G . H . and Kornberg , H . L . ( 1 9 5 9 ) . Ass ay met ho ds for
key enzymes of the glyoxylate cyc le .
J o u rna l , 7 2 , 3 P .
Doe lger , W . P . and Prescott , S . C . ( 1 9 3 4 ) .
T h e B i o o h e m i o a l
C it r i c aci d
fermentat ion . Indus t r i a l a n d En g i n e e r i n g C h e m i s t ry ,
2 6 , 1 14 2 - 1 1 49 .
Dunn , I . J . and Mor , J . R . ( 1 9 7 5 ) . Variab le volume c o n t inuous
culture .
1 8 2 2 .
B i o t e o h n o l ogy a n d B i oeng i n e e r i n g , 1 7 , 1 8 0 5 -
2 1 5
Edwards , D . L . and Unger , B . W . ( 1 9 7 3 ) . Altered mitochondr ial
resp irat ion in a chromosomal mutant of N e u r o s p o r a
aras s a . J o u n a l o f Bac t e r i o l ogy , 1 1 6 , 6 1 0 - 6 1 8 .
Fe ir , H . A . and Suzuki , I . ( 1 9 6 9 ) . pyruvate carboxylase of
A s pe rg i l l u s n i g e r : kinet ic study o f a b iot in- cont a i n in g
carboxylase . Ca n a d i a n J o u rna l o f B i o a h e m i s t r y , 4 7 ,
6 9 7- 7 10 .
Fenc z l , Z . , Uj cova , F . , Machek , F . , Seichert , L . and
Mus i lkova , M. ( 1 9 8 0 ) . Cont inuous cu lt ivat ion of f ungi .
Con t i n u o u s a u l t i v a t i o n of m i a r o o r g a n i s m s ( Proceedings
of the 7th Sympos ium , Prague , 1 0 - 1 4 July 1 9 7 8 ) , 4 4 - 4 9 .
Foster , J . W . ( 1 9 4 9 ) . Citric acid . I n : C h e m i ca l A a t i v i t i e s
of Fung i , p . 3 7 8 - 4 18 . Academic Pres s , I nc . , New Y ork .
Gaden ,
In :
E . L . ( 1 9 5 5 ) .
B i o a hemica l
C lass if icat ion of fermentat ion t ypes .
Eng i n e er i n g F u n d a m e n t a l s , E d i t e d by
Bailey , J . E . and Oll is , D . F . , p . 3 7 1 - 3 7 5 . McGraw-H i l l
Book Co . , New York . 1 9 7 7 .
Gaden , E . L . , Pet s iavas , D . N . and Winoker , J . ( 1 9 5 4 ) .
Microbiological product ion of r ibof lavin and c it r i c
acid from citrus molas ses . J o u r n a l o f A g r i c u l t u r a Z a n d
Fo o d C h em i s t ry , 2 , 6 3 2 - 6 3 8 .
Gardner , J . F . , James , L . V . and Rubbo , S . D . ( 1 9 5 6 ) .
Product ion of c itric acid by mutants of A s p e rg i l l u s
n i g e r . J o u rn a l of G e n e ra l Miaro b i o Z o g y , 1 4 , 2 2 8 - 2 3 7 .
2 1 6
Gerhardt , P . , Dorre 1 , W . W . and Ba1dwin , I . L . ( 1 9 4 6 ) . C it r i c
acid fermentat ion o f beet molasses .
Bac t e r i o t o g y , 5 2 , 5 3 5 - 5 6 4 .
J o u rn a t o f
Han g , Y . D . , Splitts toes ser , D . F . , Woodams , E . E . and S herman ,
R . M . ( 19 7 7 ) . C itric ac id fermentat ion of brewery
waste . J o u rna t of Fo o d Sc i e n c e , 4 2 , 3 8 3- 3 84 .
Han isch , W . H . ,
Opt imizat ion
hydroxylase
Dunhill , P . and L i l ly , M . D . ( 1 9 8 0 ) .
of the product ion of proges terone 1 1 0(,. -
by R h i z o p U ; f n i g r i ca n s . B i o t e c h n o t o g y a n d
B i o e ng i n e e r i ng , 2 2 , 5 5 5 - 5 7 0 .
Hattori , K . , Yokoo , S . and Imada , o . ( 1 9 7 4 ) . The e f f e c t of
ammon ium ions on the rat io of c itric acid to d-
isocitric ac id formed from n -paraf in .
Fermen t a t i o n Tec h n o t o g y , 5 2 , 54 2 - 5 50 .
Jo u rn a t o f
Heinr ich ,
acid
M .
at
and Rehm , H . J . ( 1 9 8 2 ) .
low pH values by
Format ion of g l uc o n ic
free and immob i l i z e d
A s perg i t t u s n i g e r ce lls dur ing citric acid
ferment at ion . European J o u rn a t of A p p t i ed M i c ro b i o t og y
a n d B i o t e c h no t ogy , 1 5 , 8 8 - 9 2 .
Hoppe , K . W . , Bednarska , Z . and Plodz e in , J . T . ( 1 9 8 4 ) . The
prob lems of s treptophage s in fermentat ion proc e s s e s in
Poland . In : A b s t rac t s of L e i p z i g e r B i o t e c h n o Z o g i e
sympo s i um 1 9 8 4 p . 3 7 - 3 8 . 1 0 - 1 4 September 1 9 8 4 , L e i p z i g .
Hos sain , M . ( 1 9 8 3 ) . Submerged c itric ac id fermenta t i o n of
whey permeate by A s p e rg i t t u s n ig e r . ph D Th e s i s , M a s s e y
Un i v ers i t y , Pa tmers t o n N o r t h , N e w Z ea Z a n d .
2 1 7
Hos s ain , M . , Brooks , J . D . and Maddox , I . S . ( 1 9 8 3 ) .
Product ion of c itric acid from whey permeate u s ing
A s p e rg i l l u s n i g e r . N e w Z ea l a n d J o u rna l o f D a i ry
S c i e n c e and Tec h n o l ogy � 1 8 � 1 6 1 - 16 8 .
Hos sain , M . , Brooks , J . D . and Maddox , I . S . ( 1 9 84 ) . The
effect of the sugar source on c itric acid produ c t i o n by
A s p e rg i l l u s n i g e r . App l i ed M i c r o b i o l o g y a nd
B i o t e c h n o l ogy � 1 9 � 3 9 3 - 3 9 7 .
Hos sain , M . , Brooks , J . D . and Maddox , I . S . ( 1 9 8 5 ) .
Galact ose inhibit ion of c itric acid produc t i o n from
glucose by A s p e rg i l l u s n i g e r . A pp l i ed M i cro b i o l o g y a nd
B i o t e c h n o l o gy � 2 2 � 9 8 - 1 0 2 .
I lczuk , z . ( 1 9 68 ) . Genet ics of c itric acid produ c i n g
strains of A s p e rg i l l u s n i g e r . 1 . C it r i c a c id
synthe s is by morphological mutants induced w i t h UV .
Mi cro b i o l og i ca Po l o n i ca � 1 7 � 3 3 1- 3 3 6 .
I lc zuk , z . and Drobowols ka , J . ( 1 9 7 1 ) . The inf lu e n c e of
trace e lements on citric acid product ion by mol a s s e s
mash fermentat ion . Pr e z emy s l F e rm e n t a cyj ny i R o l n y �
1 5 � 1 0 - 1 3 .
Imshenecky , A . A . , Solnceva , L . I . and Euranova , N . F . ( 1 9 6 0 ) .
Experimental variability of A s p e rg i l l u s n ig e r . P a r t 2 .
Format ion of citric acid by mutants of A . n i g e r
produced by UV- irradiat ion .
3 5 7 .
Mi k ro b i o l o g iy a � 2 9 � 3 5 1 -
Jerne j c , K . , C imerman , A . and Perdih , A . ( 1 9 8 2 ) .
2 1 8
C it r i c
acid product ion in chemically .def ined med i a by
A s perg i l l u s n i g er . European J o u rna l of A p p l i ed
Micro b i o l o g y a n d B i o t e c h n o l og y � 1 4 � 2 9 - 3 3 .
Kapoor , K . K . , Chaudhary , K . and Tauro , P . ( 1 9 8 2 ) . C it r ic
acid . In : Prescott and Dunn ' s Ind u s t r i a l M i c ro b i o l o g y �
4 t h Edit ion , p . 70 9 - 74 7 . Edited by Gerald Ree d . AVI
Publ ishing Company I nc . , Wes tport , Connet t icut .
Karow , E . O . and Wakesman , S . A . ( 1 9 4 7 ) . Product ion of c it r ic
acid in submerged culture .
Chem i s try � J 9 � 8 2 1- 8 2 5 .
Indus t r i a l a nd Eng i n e e r i ng
Kirchhube l , W . ( 19 84 ) . Characterisat ion of the p h a ge s o f
group N streptocci in GDR . In : A b s t ra c t s of L e i p z i g e r
B i o t e chno l o g i e s y m p o s i um 1 9 8 4 � p 4 7 .
September , 1 9 8 4 .
Leip l ig 1 0 - 1 4
Kisser , M . , Kub icek , C . P . and Rohr , M . ( 1 9 8 0 ) . I n f lu e n c e of
manganese on morphology and cell wal l compos it i o n o f
A s p e rg i l l u s n i g er during c itric ac i d fermen t a t ion .
A rc h i v e s of Micro b i o l ogy � 1 2 8 � 2 6 - 3 3 .
Kitos , P . A . , Campbe 11 , J . J . R . and Tom1in s o n , N . ( 1 9 5 3 ) .
Inf luence of temperature on the trace e lement
requirements for c itric ac id product ion by A s p e r g i l l u s
n i g e r . App l i ed Mic r o b i o l ogy � 1 � 1 5 6 - 1 5 9 .
2 1 9
Kovats , J . and Gackows ka , L . ( 1 9 7 6 ) . Effect of interrupt ion
in aerat ion of medium in deep citric ac id ferme n t a t ion
in molasses solut ion . Pr e z emy s l F e rm e n t a cyj ny i R o Z ny,
2 0 , 2 2 - 2 5 .
Kres 1 ing , E . K . and Stern , E . A . ( 1 9 3 5 ) . Effect of radium and
u ltraviolet l ight on growth and cit r ic acid f ormat ion
in A s p e rg i l l u s n ig e r cultures . Pro c e e d i ng s of t h e
Ins t i t u t e fo r Sc i e n t ifi c R e s e a r c h i n t h e F o o d I n d u s t ry ,
J , 5 - 2 4 .
Krist iansen , B . and Char ley , R . ( 198 1 ) . Cont inuous proces s
for the product ion of citric aci d .
B i o t e c h n o Z o gy ( Proceedings of S ixth
Fermentat ion Sympos ium ) , 1 , 2 2 1 - 2 2 7 .
A dv a n c e s i n
Inter n a t ional
Kr ist iansen , B . , Char ley , R . C . , Seviour , B . , Harve y , L . ,
Habeeb , S . and Smith , J . E . ( 1 9 8 2 ) . Overproduct i o n of
metabol ites by f i lamentous fungi . I n : O v e rp ro d u c t i o n
of Micro b i a l Pro d u c t s ( FEMS Sympos ium N o . 1 3 ) , p . 1 9 5 -
2 10 . Edited by V . Krumphanz l , B , S ikyta and Z . Vanek .
Academic Press , London .
Krist iansen , B . and S inclair , C . G . ( 1 9 7 8 ) . Produ c t i o n of
c itric acid in batch culture .
B i o e n g i n e e r in g , 2 0 , 1 7 1 1- 1 7 2 2 .
B i o t e c h n o Z o g y a nd
Kr i s t iansen , B . and S incla ir , C . G . ( 1 9 7 9 ) . The product ion
of citric ac id in cont inuous cu lture .
a nd B i o e n g i n e e r i n g , 2 1 , 2 9 7- 3 1 5 .
B i o t e c h n o l og y
2 2 0
Krivisky , A . ( 1 9 8 4 ) . Bacteriophages and p l asmids ,
intrace llular and populat ion interact ions : t he ir
signif icance for biotechnology . I n : A b s t ra c t s o f
L e i p z i g e r B i o t e a h no tog i e s y mpo s i um 1 9 8 4 � p 54 . L e ip z i g ,
10 - 14 September 1 9 84 .
Kubicek , C . P . , Hampe l , w . and Rohr , M . ( 1 9 7 9 ) . Manganese
de f ic iency leads t o elevated amino ac id pools in c it r i c
ac id accumulat ing A s p e rg i t t u s n i g e r . A ra h i v e s o f
Mi cro b i o t o g y � 1 2 J � 73- 79 .
Kubicek , C . P . and Rohr , M . ( 1 9 7 7 ) . I n f luence of manganese
on enzyme synthes is and c itric ac id accumulat i o n in
A s p e rg i t l u s n i g e r . European J o u r n a t of A p p l i ed
Micro b i o t o g y a nd B i o t e c h n o t ogy � 4 � 1 6 7 - 1 7 5 .
Kubicek , C . P . and Rohr , M . ( 1 9 78 ) . The role o f t he
tricarboxyl ic ac id cyc le in c itric acid accumu l at i o n by
A s perg i l t u s n i g e r . European J o u r n a t of A p p l i e d
Micro b i o l o g y a nd B i o t e ah n o t o g y , 5 , 2 6 3 - 2 7 1 .
Kubicek , C . P . and Rohr , M . ( 1 9 8 1 ) . C itr i c a c id
fermentat ion : phys iology of citric a c id ferme n t a t ion .
S o a i e t y fo r G e n e ra t M i a ro b i o togy Q u a r t e r t y , 8 � 2 7 9 - 2 8 1 .
Kubicek , C . P . and Rohr , M . ( 19 8 2 ) .
phys iology and technology of citric
In : Ov e rprod ua t i o n o f miaro b i a l
Nove l t r e n d s i n
a c i d produ c t ion .
p r o du a t s ( FEMS
Sympos ium No . 1 3 ) . p . 2 5 3 - 2 6 2 . Edited by V . Krump h a nz l ,
B . S ikyta and Z . Vanek . Academic Pre s s , Londo n .
2 2 1
Kubicek , C . P . , Zehent gruber , o . and Rohr , M . ( 1 9 7 9 ) . An
indirect me t hod for studying t he f ine control of c it r ic
acid format ion by A s p e rgi l l u s n i g e r .
L e t ters , 1 , 4 7 - 5 1 .
B i o t e c h n o l og y
Kub icek , C . P . , Zehent gruber , 0 . , E l- KaIak , H . and Rohr , M .
( 1 9 8 0 ) . Regu lat ion of c itric acid product i o n by
oxygen : effect of dissolved oxygen tens ion on aden y late
levels and respirat ion in A s p e rg i l l u s n i g e r . E u r o p e a n
J o u rna l of App l i ed Mi c ro b i o l og y a n d B i o t e c hno l o g y , 9 ,
1 0 1 - 1 1 5 .
La Nauze , J . M . ( 1 9 6 6 ) . Acon itase and iso c itrate
dehydrogenase of A s p e rg i l l u s n ig e r in re lat i o n to
c itric acid product ion . J o u r n a l of G en e ra l
Mi cro b i o l o g y , 4 4 , 7 3 - 8 1 .
Larson , G . and En fors , s . o . ( 1 9 8 5 ) . I n f luence o f o xygen
starvat ion on t he resp iratory capac i t y of Pe n i c i Z l i um
c h ry s o g e n um . App l i ed Micro b i o l o g y a n d B i o t e c h n o Z og y ,
2 1 , 2 2 8 - 2 3 3 .
Lawrence , R . ( 1 9 8 4 ) . Pers onal communicat ion . New Z e a land
Dairy Research Inst itute , Palmers ton Nort h .
Leopold , J . ( 19 7 1 ) . Ferment at ion product ion of citr i c a c id .
C z e c h o s l o v a k i a Pa t e n t , 1 4 2 , 3 8 8 .
Les niak , w . and Stawicki , S . ( 1 9 7 9 ) . Semi-c o n t i nuous
fermentat ion of citric acid by submerged ferme n t at ion .
A c t a A l im e n t a r i a Po l o n i ca , 5 , 3 6 5 - 3 7 6 .
Linton ,
2 2 2
J . D . and Musgrave , S . G . ( 1 9 8 3 ) . Product f ormat ion
by a n itrogen limited culture of B e n e c k e a n a t r i e g e n s in
a c hemostat in the presence o f exces s g lucose .
E u r o p e a n J o u rna l of App l i ed M i c ro b i o l o g y a nd
B i o t e c hn o l o g y , 1 8 , 2 4 - 2 8 .
Linton , J . D . ,
k inet ics
gluconate
Aus t in , R . M . and Haugh , D . E . ( 1 9 8 4 ) . The
and phys iology of s t ip it a t i c ac i d and
product ion by carbon s u f f icient cultu r e s o f
Pe n i c i l l i um s t ip i t a t um growing i n cont inuous c u lture .
B i o t e c h n o l ogy a nd B i o e n g i n e e r i n g , 2 6 , 14 5 5 - 1 4 6 4 .
Lockwood , L . B . ( 19 7 5 ) . Organic ac id product ion . I n : Th e
Fi l ima n t o u s F u n g i , Vo l . 1 , p . 14 0- 1 5 7 . Edited b y Smith ,
J . E . and Berry , D . R . Edward Arnold , London .
Lockwood , L . B . and Bat t i , M . A . ( 1 96 5 ) . Biosynthet i c p r o c e s s
for making
3 , 1 8 9 , 52 7 .
citric acid . Un i t ed S t a t e s P a t e n t ,
Lockwood , L . B . and Schwe iger , L . B . ( 1 9 6 7 ) . C it r ic a c i d and
itaconic acid fermentat ions . I n : M i c ro b i a l Te c h n o l o g y ,
p . 1 8 3 - 199 . Edited by PeppIer , H . J . Re inhold Pub l i s h in g
Company , London , New York .
Loescke , H . W . Von ( 1 9 4 5 ) .
mycological citric
A review of informa t i o n on
acid product ion . C h e m i ca l
Eng i n e e r i ng Ne w s , 2 3 , 1 9 5 2 - 1 9 5 9 .
2 2 3
Ma , H . , Kubicek , C . P . and Rohr , M . ( 1 9 8 5 ) . Metabol ic e f fect
of manganese de f ic iency in A s p e rg i � l u s n i g e r : ev i de nce
for increase d prote in degradat ion .
Mi c r o b i o l o g y 3 1 4 1 3 . 2 2 6 - 2 6 8 .
A rch i v e ;; of
Mach , F . ( 1 9 8 4 ) . Bacter iophages of technica l ly imp o r tant
bact er ia . I n : A b s t rac t s of L e i p z i g e r B i o t e c h n o l o g i e
symp o s i um 1 9 8 4 . p . 6 6 . Le ipz i g , 1 0 - 14 September 1 9 8 4 .
Mar t in , S . M . ( 1 9 5 7 ) . C itric ac id product ion by s ubmerged
fermentat ion . Indu s t r i a l a n d Eng i n e e r i n g C h em i s t rY 3
4 9 3 12 3 1- 1 2 3 2 .
Mart in , S . M . and Waters , W . R . ( 1 9 5 2 ) . Product ion o f c it r ic
acid by submerged fermentat ion . Ind u s t r i a l a nd
Eng i n e e r i n g C h em i s t rY 3 4 4 3 2 2 2 9 - 2 2 3 3 .
Mas ior , S . , Surmins ki , J . and Abramik , J . ( 1 9 6 8 ) . C it r ic
ac id from potatoes by fermentat ion . Pre z emy s l
Ferme n t acyj ny i R o l nY 3 1 2 3 3 - 6 .
Me ixner-Monor i , B . , Kub icek , C . P . , Habison , A . , Kub icek-
Pranz , E . M . and Rohr , M . ( 1 9 8 5 ) . Pre s e nc e and
regulat ion of the
mu ltienzyme complex
� -ketoglutarate dehydro ge n ase
in the f ilamen t ous f un gus
A s p e rgi 2 l u s n i g e r . J o u rna l of B a c t e r i o l o g Y 3
2 7 1 .
1 6 1 , 2 6 5 -
Neyrath , J . ( 1 9 6 7 ) . C itric acid product ion . P r o c e s s
B i o c h e m i s t ry 3 2 3 2 5 - 2 7 , & 5 6 .
Mial l , L . M . ( 1 9 78 ) .
2 2 4
Organ ic acids . In : E c o n o m i C '
Mi cro b i o l og y Vo l 2 , p 4 7 - 1 19 . Edited by Rose ,
Academic Press , London , New York , S an Francisc o .
A . H .
Michalk , D . and Manz , F . ( 1 9 8 0 ) . Determ inat ion o f
inorgan ic plasma sulphate by indirect atomic abs o rpt ion
spectrophotometry . C l in i ca C h i m i ca A c t a , 1 0 7 , 4 3 - 4 8 .
Millis , N . F . , Trumpy , B . H . and Palmer , B . M . ( 1 9 6 3 ) . The
e f fect o f lipids on c itric acid product ion b y an
A s p e rgi l l u s n i g e r mutant . Jo u rn a l of
Mi c ro b i o l o gy , 3 0 , 3 6 5 - 3 7 9 .
Mischak , H . , Kubicek , C . P . and Rohr ( 1 9 84 ) .
G e n e r a l
C itrate
inhibit ion of glucose uptake in A s p e r g i l l u s n i g e r .
B i o t e c h n o l o gy L e t t e rs , 7 , 4 2 5 -4 3 0 .
Moyer , A . J . ( 1 9 5 3a ) . Effect of a lcohols on t he myco l o gical
product ion of c itric acid in surface and s ubmerged
cu lture . 1 . Nature of the alcoho l e f f ect .
Micro b i o l o g y , 1 , 1 - 7 .
A pp l i e d
Moyer , A . J . ( 1 9 5 3b ) . Effect of alcoho ls on the myc o l ogical
production of c itric acid in surface and s ubmerged
culture . 1 1 . Fermentat ion of crude carbohydrate .
A pp l i ed Micro b io l o gy , 1 , 8- 1 3 .
Moyer , A . J . ( 1 9 54 ) . Mycological product ion o f o r gan i c
ac ids . U n i ted S t a t e s Pa t e n t , 2 , 6 7 4 , 5 6 1
Muller , H . M . and Frosch , S .
2 2 5
( 1 9 7 5 ) . Oxalate accumu lat ion
from citrate by A sp e rg i l l u s n i g e r .
t he tr icarboxylic acid cycle .
Micro b i o l o g y , 1 0 4 , ·
1 5 9 - 1 6 2 .
1 1 . Involvement o f
A rc h i v e s o f
Ng , A . M . L . , Smith , J . E . and Mc l ntos h , A . F . ( 1 9 7 3 ) . C hanges
in act ivity of tricarboxylic acid cycle and g lyoxylate
cycle enzymes dur ing synchronous deve lopmen t of
A s p e rg i l l u s n i g e r . Tra n s a c t i o n s of t h e B r i t i s h
My c o l o g i c a l So c i e t y , 6 1 , 1 3 - 2 0 .
Noguchi , Y . ( 1 9 6 0 ) . The scaling-up o f c i t r i c ac id
product ion by the fermentat ion of molasses in t he
presence of methanol .
4 9 1 .
H a k k o K o g a k u Z a s s h i ,
Noguchi , Y . ( 1 9 62 ) . Effect o f trace metals o n t he
product ion of c itric acid by A sp e rg i l l u s n i g e r .
Ha k k o Kog a k u Z a s s h i , 4 0 , 1 7 1- 1 7 8 .
Noguchi , Y . and Arao , o . ( 1 9 6 0 ) . Formation of oxa l i c a c id
in the c itric ac id fermentat ion in the met hano l added
molasses medium . Ha k k o KO J a k u Z a s s h i , 3 8 , 4 8 5 - 4 8 8 .
Noguchi , Y . and Sando , Y . ( 1 9 6 0 ) . Effect of met han o l and
ethano l on the product ion of c itric ac id from mola s se s .
Ha k k o KO J a k u Z a s s h i , 3 8 , 5 9 3 - 5 9 6 .
Oht suka , M . , Ohz aki , Y . and Aramiya , H . ( 1 9 7 5 ) . C it r i c
acid b y fermentat ion . Japa n Pa t e n t , 7 , 5 3 0 , 1 5 8 .
2 2 6
Perlman , D . , Kita , D . A . and Peterson , W . H . ( 1 9 4 6 ) .
Product ion of citric ac id from cane molasses . A r c h i v e s
of B i o c h e m i s try � 1 1 � 1 2 3 - 1 3 1 .
,
Per lman , D . and S ih , C . J . ( 1 9 60 ) . Fungal syn t he s is o f
c itric , fumar ic and itacon ic ac ids .
I n d u s t r i a l Micro b i o l o g y � 2 � 1 6 8 - 1 94 .
Pro g r e s s i n
Pirt , S . J . ( 1 9 7 4 ) . The theory o f fed batch culture with
reference to the penic i ll in fermentat ion . J o u rn a l o f
A p p l i ed C h emi s t ry a nd B i o t e c h n o l o g y � 2 4 , 4 1 5-4 2 4 .
Porges , N . ( 1 9 3 2 ) . C it r ic acid product ion by A s p e r g i � l u s
n i g e r . A m e r i c a n J o u r n a l o f Bo t a ny , 1 9 , 5 59 - 5 6 7 .
Prauser , H . ( 1 9 84 ) . Source and hos t ranges of phage s o f
act inomycetes and coryneform bacter ia . I n : A b s t ra c t s
of L e ip z iger B i o t e c h n o l o g i e s y mp o s i um 1 9 8 4 . p 8 2 - 8 3 .
Le ipz i g , 1 0 - 1 4 September 1 9 8 ·1 .
Prescot t , S . C . and Dunn , C . G . ( 1 9 5 9 ) . The c i t r i c ac id
fermentat ion . I n : Ind u s t r i a l M i c ro b i o l o g y , J rd
ed i t i o n � p 5 3 3 - 5 7 7 . McGraw Hill Book Company , I nc . , New
York , Toronto , London .
Ramakr ishnan , C . V . , Steel , R . and Lent z , C . P . ( 1 9 5 5 ) .
Mechan ism of c itric ac id format ion and accumu la t i o n i n
A s p e rg i l l u s n i g e r . A rc h i v e s of B i o c h e m i s t r y a nd
B i o p hy s i c s , 5 5 , 2 7 0 - 2 7 3 .
Reed , L . J . and Mukherj ee ,
dehydrogenase complex
M e t h ods in En z ymo L o g y ,
B . B . ( 1 9 6 9 ) .
2 2 7
A -Ketogl u t ar a t e
from Es c h e r i o h ia o o L i . I n :
Vo L 1 3 , C i t r i o A o i d Cy o L e .
Lowe nste in , J . M . editor . Academic Pre s s , Londo n , New
York .
Rohr , M . and Kub icek , C . P . ( 1 9 8 1 ) . Regulatory aspec t s o f
c itric acid fermentat ion by A s p e rg i L L u s n i g e r .
B i o o h em i s t ry , 1 6 , 3 4 - 3 7 .
Pro o e s s
Rohr , M . , Kubicek , C . P . and Komine k , J . ( 1 9 8 3 ) . C it r i c
a c i d . I n : B i o t e o h n o L og y Vo L 3 , p 4 1 9- 4 54 . Rehm , H . J .
and Reed , G . editors . Ver lag Chemie . We inheim .
Sanche z -Marroquin , A . , Carreno , R . and Ledezena , M . ( 1 9 7 0 ) .
Effect of trace e lements on c itric acid fermentat i o n b y
A s p e r g i L L u s n i ger . A pp L i ed Mioro b i o L o g y , 2 0 , 8 8 8 - 8 9 2 .
Scherbakova , E . Ya . ( 1 9 6 3 ) . UV induced variab i l i t y o f
A s p e rg i L L u s n iger . M i o ro b i o L o g iy a , 3 2 , 4 3 - 4 9 .
Scherbakova , E . Ya . ( 1 9 6 4 ) . Characterist ics of b iochem i c a l ly
act ive A s perg i L L u s n i g e r variant� . produced through UV
irradiat ion . Mi o ro b i o L o g iy a , 3 3 , 4 9 - 5 5 .
Scherbakova , E . Ya . ( 1 9 7 1 ) . A new s train of A s p e rg i L L u s
n i g e r No . 28 8 / 9 for submerged c itric a c i d produc t i o n .
Trudy L e n i ng rad s k o g o N a u o h n o - I s s L e do v a t e L s k o g o
Ins t i t u ta Pis h o h e v o y Promy s h L e n n o s t i , 1 , 1 6 - 2 6 .
Schwe iger , L . B . ( 1 9 6 1 ) . Product ion of c itric a c i d b y
fermentat ion . Uni t e d s ta t e s Pa t e n t , 2 , 9 7 0 , 0 8 4 .
2 2 8
Schwe iger , L . B . and Sne l l , R . L . ( 19 4 9 ) . Ferme n t at ion
process . Un i t ed S ta t e s Pa t e n t � 2 , 4 7 6 , 1 5 9 .
Scott , B . ( 1 9 8 5 ) . Pers onal commun icat ion . Department of
Microbiology and Genet ics , Mas sey Univers ity ,
Palmerston North , New Zealand .
Shu , P . and Johnson , M . J . ( 1 9 4 7 ) . Effect o f t he
composit ion of the sporulat ion med ium on c it r i c ac id
product ion by A s perg i l l u s n i g e r in submerged cu lture .
J o u rna l o f Ba c t e r i o l o gy � 5 4 � 1 6 1- 1 6 7 .
Shu , P . and Johnson , M . J . ( 1 9 4 8 a ) . The interdepende nce of
medium cons t ituents in c itric acid produ c t i o n by
submerged fermentat ion .
5 7 7 - 5 8 5 .
J o u r n a l o f B a c t e r i o l o g y � 5 6 �
Shu , P . and Johns on , M . J . ( 1 9 4 8b ) . C itric acid product ion
by submerged fermentat ion with A s p e rg i l l u s n i g e r .
I n d u s t r i a l and Eng i n e e r i n g C h em i s t ry � 4 0 � 1 2 0 2 - 1 2 0 5 .
Shu , P . , Funk , A . and Ne ish , A . C . ( 1 9 54 ) . Mechan ism of
c itric acid format ion from glucose by A s p e rg i l l u s
n i g e r . Ca n a d i a n Jo urna l of B i o c hem i s t ry a nd
Phy s i o l o g y � J 2 � 6 8 - 8 0 .
S iebert , D . and Schu lz , G . ( 1 9 7 9 ) . C itric acid product ion
by fermentat ion . In t e rna t i o na l M i c ro b i o l o g y a n d F o o d
C o n g r e s s � Paris , 10 October , 1 9 7 9 .
2 2 9
Smith , J . E . , Nowakows ka-Was z c z uk , A . and Anders o n J . G .
( 1 9 74 ) . Organic acid product ion by myce lial fung i . I n :
Ind u s t r i a l A s p e c t s of B i o c h em i s t ry , Vo l 1 , p 2 9 7 - 3 1 7 .
Edited by Spencer , " B . Ams terdam : E ls eve ir .
S ne l l , R . L . and Schwe iger , L . B .
c itric acid by fermentat ion .
2 , 4 9 2 , 6 6 7 .
( 1 9 4 9 ) . Produ c t ion of
U n i t e d S t a t e s Pa t e n t ,
Sodeck , G . , ModI , J . , Kom inek , J . and Salzbrunn , W . ( 1 9 8 2 ) .
Product ion of c itric acid according to the s ubmerged
fermentat ion proces s . Pro c e s s B i o c h em i s t ry , 1 6 3 9 - 1 1 .
S omkut i , G . A . and Benc ive ngo , M . M . ( 1 9 8 1 ) . C it r i c ac id
fermentat ion in whey permeate . Dev e lopme n t s i n
Indus t r i a l Micro b i o l o g y , 2 2 , 5 5 7 - 5 6 3 .
Srivasta , K . S . and Kamal . ( 1 9 7 9 ) . Effect of some chemical
factors on the growth and c itric acid product i o n b y
A s p e rg i l l u s n i g e r . J o u r n a l of t h e Ind i a n B o t a n i ca l
S o c i e t y , 5 8 , 2 0 8 - 2 1 4 .
S tee l , R . , Lentz , C . P . and Mart in S . M . ( 1 9 5 5 ) . S ubmerged
c itric acid fermentat ion of sugar beet mo l a s se s :
I ncrease in scale . Canad i a n J o u rna l o f Mi c ro b i o l o g y , 1 3
2 9 9 -3 1 1 .
S z c z odrak , J . ( 19 8 1 ) . Biosynthes is of c itric a c id i n
relat ion t o the act ivity o f s e lected enzymes o f t he
Krebs cyc le in A s p e rg i l l u s n i g e r myce l ium . E u r o p e a n
J o u rn a l o f App l i ed Micro b i o l ogy a n d B i o t e c h n o l o g y , 1 3 ,
1 0 6 - 1 1 2 .
2 3 0
S zucs , J . ( 1 94 4 ) . Un i t e d S t a t e s Pa t en t � 2 , 3 53 , 7 7 1 .
Toml inson , N . , Campbe l � , J . J . R . and Trus s e l l , P . C . ( 1 9 5 0 ) .
The inf luence of z inc , iron , copper and man ga n e s e on
t he product ion of c itric acid by A s p e rg i l l u s n i g er .
J o u rna l of Bac t e r i o l ogy � 5 9 � 2 1 7 - 22 7 .
Tomlinson , N . , Campbel l , J . J . R . and Trus s e l l , P . C . ( 19 5 1 ) .
The inf luence of z inc , iron , copper and manganese on
t he product ion of citric acid by A s p e rg i l l u s n i g e r . 1 1 .
Evidence for the essent i a l n ature o f copper and
manganese .
Trumpy , B . H .
requirements
Jo urna l of B a c t e r i o l o g y � 6 1 � 1 7 - 2 5 .
and Mil l is , N . F . ( 1 9 6 3 ) . Nut r i t ional
of an A s p e rg i l l u s n ig e r mutant for c it r ic
ac id product ion . Journ a l o f G e n e ra l M i c ro b i o l o g y � J O �
3 8 1 - 3 9 3 .
Vardar , F . and L il ly , M . D . ( 1 9 8 2 ) . Effect of c yc l ing
diss olved oxygen concentrat ions on product format io n in
pen ici l l in fermentat ions . Euro p e a n J o u r n a l o f A pp l i e d
M i c ro b i o l o gy a nd B i o t e c h no l o g y � 1 4 � 2 0 3 - 2 1 1 .
Verhoff , F . H . and Spradlin , J . E . ( 1 9 7 6 ) . Mas s a n d e nergy
balance analys is of met abo l ic pathways appl ie d to
c itric acid product ion by A s p e rg i l l u s n i g e r .
B i o t e c h n o l o gy and B i o e n g i n e e r i ng � 1 8 , 4 2 5 - 4 3 2 .
Vogel , I . A . ( 1 9 6 1 ) . A textbook of quant itat ive inorganic
analys is . p8 10 , 3 rd edit ion . Longman , London .
2 3 1
Wan g , D . I . C . , Cooney , C . L . , Demain , A . L . , Dun h i l 1 , P . ,
Humphrey , A . E . and L il ly , M . D . ( 1 9 7 9 ) . F e rm e n t a t i o n
a n d En z y m e Te c h n o l o gy .
Toron t o .
John Wiley and Sons , N e w York ,
Webs ter I . A . ( 1 9 8 3 ) . The cont i nuous ly fed batch r e ac t o r
for measuring microb i a l growth rates .
a n d B i o e n g ineer i n g , 2 5 , 2 9 8 1 - 2 9 9 0 .
B i o t e c h n o l og y
Wehmer , C . ( 1 89 3 ) . Note sur la ferme n t a t ion c i t r ique .
B u l l e t i n de l a So c i e t e C h im i q u e , 9 , 7 2 8 - 7 3 0 .
Whit aker , A . and Long , P . A . ( 1 9 7 3 ) . Fun g a l pe l le t in g .
Pro c e s s B i o chem i s t ry , 8 , 2 7- 3 1 .
Windham , W . R . and Akin , D . E .
f orage f ibre de greda t ion .
Mi cro b i o l o gy , 4 8 , 4 7 3 - 4 7 6 .
( 19 8 4 ) . Rumen f u n g i a n d
App l i ed a n d En v i r o n m e n t a l
Woehrer , W . and Roehr , M . ( 1 9 8 1 ) . Regu la t ory a s p e c t s o f
bakers yeas t met abo l i sm in aerob ic fed bat c h c u l t u r e s .
B i o t e c h n o l ogy a nd B i o e ng i n e e r i n g , 2 3 , 5 6 7 - 5 8 1 .
Wold , W . S . M . and Suzuk i , I . ( 1 9 7 3 ) . Cyc l ic AMP a n d c i t r ic
a c i d accumu lat ion by A s p e rg i l l u s n i g e r . B i o c h em i c a l
and B i op h y s ica l R e s e a r c h Comm u n ica t i o n s , 5 0 , 2 3 7 - 2 4 1 .
Woronick , C . L . and Johns on , M . J . ( 1 9 6 0 ) . C arbon d io x ide
f ixat ion by ce l l free extracts of A s p e rg i l l u s n i g e r .
J o u r n a l of B i o l o g i ca l C h em i s t ry , 2 3 5 , 9- 1 5 .
Wuns c he , L . ( 1 9 8 4 ) .
b iot echno logy .
Importance of
I n : A b s t ra c t s
B i o t e a h n o l o g i e symp o s i um 1 9 8 4 , p 1 1 0 .
Sept ember , 1 9 8 4 .
2 3 2
bacteriop h a g e s in
of L e £ p z £ g e r
L e ip z i g , 1 0 - 1 4
Yamane , T . , Kishimoto , M . and Yoshida , F . ( 1 9 7 6 ) . Semi-
batch culture of me t hanol - a s s imi lat ing bacter i a w it h an
exponent i a l ly increased met hano l fee d . J o u rn a l of
Ferm e n t a t i o n Techno l o g y , 5 4 , 2 2 9 - 24 0 .
Yamane , T . and Shimizu , S . ( 1 9 8 4 ) . Fed bat c h t e c h n i qu e s i n
m icrob ial proces s e s . I n : Adv a n c e s i n B i o a h em i ca Z
Eng i n e e ri ng/B i o t e ch n o l o g y , Vo Z J O , E d i t e d by Fe i c h t e r ,
A . Springer-Verlag . Ber l i n , He idleberg .
Yoshida , F . , Yamane , T . and Nakamoto , K . ( l 9 7 3 ) . Fe d b a t ch
hydrocarbon fermentat ion with c o l lo ida l emu l s i o n feed .
B i o t e c h n o Z o gy and B i o e n g i n e e r i n g , 1 5 , 2 5 7 - 2 7 0 .
Z a lokar , M . ( 1 9 6 5 ) . Th e F u ng i -A n A dv a n c e d Tr e a t i s e .
C hapter 1 4 , Edited by Ainswor t h , G . C . a n d S u s ema n , A . S .
Academic Pres s , London .
2 3 3
APPENDIX 1
The gas balances were c a lc u lated u s ing the e qu a t i on s i n
S e c t ion 3 . 8 . 3 to cal ibrate t he f low me t ers in t he f ir s t
i n s tance .
C a l ibrat ion
A meas ured 0 . 4 l it re s of water was d i s pe n s e d i n t o a
glas s t ube and t he 0 . 4 1 point marked . Us i n g the e qu a t i o n
=
and subs t itut ing t he act ual atmospher ic pre s s ur e a n d
t emperat ure for P 1
a n d T l
' respe c t ive ly , a n d s t a n d ar d
pre s s ure and temperat ure f o r P2
and T2 , resp ec t ive l y ,
7 6 2 . 2 3 x 0 . 4 = 7 6 0 x V 2
2 9 5 . 7 5 2 9 3 . 1 5
V 2 0 . 3 9 7 6 5 l itres a ir at s t andard t emp e r a t ure
and pres s ure ( which equa t e s t o t he 0 . 4
l i t res of water above ) .
Thus , the f low rate was c a l culated for each s ample b y t im in g
the period required by a s oap bubble t o t r ave l t he m a r k e d
dist ance ( 0 . 4 l itres ) . I t was as s umed t hat oxygen i s 2 0 . 9 5 %
of a ir , and carbon d iox ide is 0 . 0 3 % of a ir in the a e r a t i o n
inf low . The e f f luent a i r was analysed f or o xygen a n d c ar b o n
d iox ide a s des cribed i n S e c t ion 3 . 5 . 3 .
Worked Example
The equat ion used above was again used t o c a l cu l a t e t he
oxygen and carbon diox ide f lowrate in t he in f luent a ir , a n d
the readings from t he g a s analysers u s ed t o c a l c u la t e t he

2 3 4
concent rat ions of t he s e two gase s in t he e f f luent a ir . A
worked example is pre s ented us ing t he s t e ady s t at e DOT = 9 0 %
o f sat urat ion / u = 0 . 0 1 7 h - 1. Eff luent oxyge n w a s 1 9 . 9 % ,
e f f luent carbon d iox ide was 0 . B 7 % , t he a ir t emperat ure was
2 2 . 5 CC and t he atmosp her ic pre s s ure was 7 6 0 . 3 mm H g . The
water lute created a back-pres s ure of 5 3 mm H g o n t he
f ermenter . At t he aerat ion rate of 0 . 5 l /min ( ro t ameter
s e t t ing ) , 2 B . 1 seconds were requ ired f o r t he b u b b le t o
trave l t he d i s tance marked on the 3 9 7 . 6 5 m l gla s s t ube i n
cal ibrat ion .
°2
in =
°2 out
CO2 in =
v 2= 7 6 0 x 2 9 5 . 6 5 x 3 9 7 . 6 5
( 7 6 0 . 3 + 5 3 ) x 2 9 3 . 1 5
= 3 7 5 ml / 2 B . 1 sec
= 3 7 5 x 6 0
2 B . 1
8 0 0 ml /min at STP
0 . 2 9 5 x 8 0 0 = 1 6 7 . 6 ml /min
0 . 1 9 9 x B O O 1 5 9 . 2 ml /min
0 . 0 0 0 3 x 8 0 0 = 0 . 2 4 ml /min
CO2 out = 0 . 00 8 7 x 8 0 0 7 . 0 ml /min
02
in - 02 out - CO2 out + C� in = 0
in this example
1 6 7 . 6 - 1 5 9 . 2 - 7 . 0 + 0 . 24 = 1 . 64
and 1 . 6 4 / 1 6 7 . 6 = 0 . 0 0 9 or 0 . 9 % error .
error of 2 . 0 % or more were dis carded .
S amp l e s w i t h an

2 3 5
APPENDIX 2
The calculat ions f or t he det erminat ion o f t he
s to ichi ometry of t he c it r i c acid ferme n t at ion in t he p re s e n t
s t udy were a s f o l lows :
t he s teady state u s e d was DOT
- 1 = 0 . 0 1 7 h
9 0 % of s at ur a t i o n / u
and i n 1 . 0 l itres o f c u l ture med ium , i n 1 hour
� upt ake was 1 5 . 8 mM = 5 0 5 mg
CO2 product ion was 8 . 5 mM = 3 74 mg ( 2 6 9mg as 0 2 ' 1 0 5
mg as C )
Yie lds based on oxygen used
C it r ic ac id yie ld
4 0 3 ( mg/ l . h ) c i t r i c acid
50 5 ( mg / 1 . h ) ° 2
B iomass yield ( Myce l ial dry we ight )
Product ion rate = 8 5 . 3 mg / l . h
8 5 . 3 ( mg/ l . h ) = 1 6 . 8 %
5 0 5 ( mg / l . h )
Carbon d i ox ide yield
3 7 4 = 7 4 . 1 %
5 0 5
Carbon yie lds
C � c e l l s = 14 . 5 %
C --;;" C02 = 2 1 %
C �c itric ac id = 6 0 %
C unaccounted for = 4 . 5 %
Carbon used = 2 4 8 mg/ l
7 9 . 8 %

From 1 9 0 , obt ain 0 . 79 8 9 c it r i c ac i d
0 . 1 6 8 9 b ioma s s
0 . 74 1 9 CO 2
S o f r om 1 6 9 0 , obt ain 1 2 . 8 9 c it r i c a c id
2 . 7 9 b i omas s
1 1 . 9 9 CO2
From s ucrose
1 9 sucro se � O . 67 9 c it r i c acid
0 . 1 4 9 b i oma s s
0 . 62 9
1 mo le s ucrose ( 3 4 2 g )
CO2
:> 1 2 0 . 6
2 5 . 2
1 1 1 . 6
t here f ore , f or 1 0 0 9 biomas s
9
9
9
c it r ic
b i omas s
CO 2 :
2 3 6
a c id
7 1 4 . 2 9 9 s ucrose + 5 9 5 . 2 3 9 ° � 1 0 0 9 b i omas s + 4 7 8 . 3 8 9
c i t r i c ac id + 4 4 2 . 6 8 C�
div ide by molecular we ight
2 . 0 9 C 1 2H2 20 1 1 + 1 8 . 5 9 0 2 --:::::::>� 1 0 0 9 b iomas s + 2 . 4 9 C6 H 80 7
+ 1 0 . 0 6 CO 2

APPENDIX 3
Full re gres s ion Mode ls for N itrogen -L imited C hemos tat C ultures which exhibited a Sign if icant Lack-of - F it
X y BO B l B2
B3
B4
B 5 B6
B 7 B8
Specific sugar uptake
rate ( mg / gN . h ) 7 0 2 7 1 6 5 3 5 4 - 2 7 2 3 - 2 5 9 3 - 4 8 3 7 5 0 5 6 1 9 6 8 1 1 6 0 3 -( mg / gPO 4 . h ) 3 12 -8 4 2 3 8 1 7 1 3 0 8 - 3 8 5 2 32 4 6 6 - 2 8 0 52 - 2 1 9 3 6 4 7 6 5 ' 2 '0 8 2 0
Specif ic nitrogen uptake
rate 3-( mg / gpo4 . h ) 3 3 6 2 4 1 8 3 1 10 4 5 4 - 2 0 6 - 2 8 4 - 1 6 2 0 7
Volumetr ic oxygen uptake
rate ( mM / l . h ) 1 5 . 8 2 . 8 3 - 0 . 5 5 - 9 . 7 5 - 3 . 4 5 1 . 1 - 1 . 7 5 ' 2, . 6 9 6 . 8 5
Spec i f ic oxygen uptake
rate ( mM / gDW . h ) ' 2' . 1 8 0 . 3 7 0 . 0 5 0 . 3 8 - 0 . 9 8 0 . 0 7 - 0 . 2-4 - 0 . 5 8 0 . 5 5
( mM / gN . h ) 6 4 . 1 1 5 . 6 - 9 . 3 - 5 . 4 - 3 3 - 7 . 6 ...: 2'. 9 ' - 2 . 6 12 . 5 3 -( mM / gP04 . h ) 3 0 5 2 2 4 7 . 7 4 4 . 2 2 1 5 - 2 2 8 - 2 1 1 - 62 . 5 1 9 6
Volumetr ic carbon diox ide
pr oduct ion rate ( mM / l . h ) 1 2 ' . 1 - 1 . 2 1 . 55 5 . 8 - 8 . 3 - 4 . 7 - 3 . 0 3 . 8 2 . 69
Specif ic carbon diox ide
product ion rate ( mM / gDW . h ) 1 . 72 - 0 . 2 0 . 4 0 . 68 - 0 . 9 3 - 0 . 3 2 - 0 . 2 1 0 . 0 5 1 0 . 2 5 1
( mM / gN . h ) 4 8 . 9 - 2 . 9 3 2 3 . 8 2 8 . 6 - 1 5 . 9 - 1 9 1 9 . 5 1 2 . 5 3 -( mM / 9P04 . h ) 2 1 9 1 9 4 1 6 - 64 1 0 9 - 1 7 1 - 4 2 - 1 0 7 8 5
N w ....,J

,.. y BD
B1
B2
Res p iratory quot ient 1 . 0 7 0 . 9 1 0 . 1 5
Volumetr ic phosphate
upt ake rat e ( mg/ l . h ) 4 . 3 3 - 0 . 2 9 4 . 2 5
Spec if ic phosphate
upt ake rate ( mg / gDW . h ) 0 . 6 7 0 . 1 6 5 0 . 9 5
( mg / gN . h ) 1 7 . 6 - 1 . 2 1 2 . 2
B 3 B 4 B5
- 1 . 1 7 0 . 3 7 - 0 . 4 2
1 . 0 8 - 0 . 8 1 8 . 3 2
0 . 4 2 5 - 0 . 0 4 5 1 . 6 9
- 1 1 . 9 - 1 . 5 3 7 . 8
B6 B7
1 . 9 9 - 1 . 2 7
- 6 . 2 2 - 2 . 8 7
- 0 . 5 3 0 . 0 7 5
- 2 1 . 1 - 5 . 2 7
B8
- 0 . 7 3
- 1 . 6
- 0 . 4 1
- 6 . 7 4
rv w ex>