Embed Size (px)
Citation preview
ORIGINAL CONTRIBUTION
A stress-controlled microfluidic shear viscometer basedon smartphone imaging
Deepak E. Solomon1& Amjad Abdel-Raziq1
& Siva A. Vanapalli1
Received: 18 November 2015 /Revised: 26 March 2016 /Accepted: 21 April 2016# Springer-Verlag Berlin Heidelberg 2016
Abstract We report a stress-controlledmicrofluidic shear vis-cometer with flow visualization aided by smartphone technol-ogy. Themethod involves driving the fluid into amicrochannelat constant pressure and using the smartphone camera to trackthe fluid front in a glass capillary attached to themicrochannel.We find that videos of interface propagation from thesmartphone are of sufficient resolution that accurate pressuredrop-flow rate relations can be determined to quantify the vis-cosity curves for complex fluids.We demonstrate that this sim-ple ‘iCapillary’ device measures the shear viscosity ofNewtonian and polymeric fluids over a broad range of shearrates (10–10,000 s−1) that is in quantitative agreement with ro-tational rheometry. We further show that the simplicity of theiCapillary device allows for parallel analysis of viscosity ofseveral samples. We performed multiplexed measurements ofconcentration dependence of high shear rate viscosity of glob-ular protein solutions, and the results are in good agreementwithmodels of suspension rheologyaswell asprior experimen-tal data. Our approach is unique, since no on-chip sensing ele-ment is requiredother than thesmartphonecamera.This sensor-less approach offers the potential to create inexpensive and dis-posable devices for point-of-care rheology of complex fluidsand biological samples.
Keywords Microfluidics . Shear viscocity . Flow curve .
Rheometer
Introduction
Shear viscometers are an important tool in characterizing therheological properties of complex fluids for applications suchas food processing (Rao 2007), consumer products(Buchmann 2001), pharmaceuticals (Purwar et al. 1988), inks,(Tabbernor 1988), polymers (Kontopoulou 2011), drillingfluids (Santoyo et al. 2001), lubricants (de Carvalho et al.2010), and clinical diagnostics (Hurth et al. 2011). In manyof these applications, it is desirable to quickly characterize theviscosity of one or more samples at the location where prod-ucts are being made or processed, rather than being analyzedoffsite. Macroscale rheometers although capable ofperforming a broad suite of precise rheological measurementsare not well suited for onsite or point-of-care viscometry ap-plications, because of their bulkiness and need for skilled op-erators. Furthermore, the capability of these devices to per-form high-throughput measurements of multiple formulationsis limited, making them more suitable for research laboratorysettings rather than point-of-care testing. Viscosity measure-ment devices such as Saybolt, capillary tube, and rotationalviscometers are more suited for onsite usage because of theirnon-complicated operation and cost effectiveness. Althoughhandy, these devices have a number of limitations which in-clude (i) the use of large sample volumes, (ii) cumbersomecleaning procedures if multiple sample measurements areneeded, (iii) limited shear rate range, and (iv) the presence ofnon-viscometric flow kinematics (e.g., Saybolt viscometer)making it difficult to interpret viscosity data for complexfluids.
In the last decade, microfluidic shear viscometers(Galambos and Forster 1998; Lee and Tripathi 2005;Srivastava et al. 2005; Guillot et al. 2006; Pipe et al. 2008;Pan and Arratia 2012; Livak-Dahl et al. 2013) have emergedas alternative tools capable of addressing the above limitations
* Siva A. [email protected]
1 Department of Chemical Engineering, Texas Tech University,Lubbock, TX 79409-3121, USA
Rheol ActaDOI 10.1007/s00397-016-0940-9
of conventional viscometers. Microfluidic viscometers devel-oped to date use a variety of driving sources to introduce fluidflow in microchannels. In strain-rate controlled viscometers,constant fluid flow rate is imposed using syringe pumps(Guillot et al. 2006; Pipe et al. 2008; Pan and Arratia 2012;Guillot and Colin 2014; Solomon and Vanapalli 2014), whilein stress-controlled viscometers a constant pressure drop isdelivered using pressure sources (Livak-Dahl et al. 2013;Hudson et al. 2015) or capillary pressure (Srivastava et al.2005; Han et al. 2007). Knowing the relation between pres-sure drop and flow rate, the viscosity of the fluid is deter-mined. In these devices, depending on the driving force, thefluid response is measured using pressure sensors embeddedon the channel surface (Pipe et al. 2008; Pan and Arratia 2012)or image-based detection of fluid interfaces (Lee and Tripathi2005; Solomon and Vanapalli 2014; Guillot et al. 2006) orintegrating a flow rate sensor (Hudson et al. 2015).
Despite severalmicrofluidic shearviscometersbeingreportedin the literature, current devices have some limitations. For ex-ample, in pressure-sensor-based viscometers, the sensing ele-ment is incontactwith fluid flow,and thisdesignmaynotbe idealfor handling biological samples where use-and-throw capabilityisdesiredtoavoidsamplecross-contamination.Likewise, repeat-ed handling of industrial-grade particulate fluids in these devicesmaybecomeproblematic due to adhesionof particles on channeland sensor surfaces, unless rigorous washing protocols are im-plemented. Finally, because pressure-sensor-based viscometersare flow-rate controlled, they do not scale favorably forparallelized analysis of samples.
Severalmicrofluidicviscometersbasedonimaginghavebeendeveloped (Lee and Tripathi 2005; Guillot et al. 2006; Livak-Dahl et al. 2013; Solomon and Vanapalli 2014). These image-based viscometry methods include those that rely on coflowinglaminar streams (Lee and Tripathi 2005; Guillot et al. 2006;Solomon and Vanapalli 2014) or capillary imbibition of a fluidinto a microchannel (Srivastava et al. 2005; Han et al. 2007). Todetermine sample viscosity, with co-flowing laminar streams in-terface width is measured, while interface motion is recordedduring capillary imbibition. In contrast to on-chip sensor-basedapproaches, these devices have the advantage that there is nodetection element present on the chip making the approachnon-contact, however, these methods have some limitations.They require the use of research-grademicroscopes and camerasto reliablydetect the interface location, becauseof themicroscalechannel and interface width dimensions. Moreover, the co-flowing laminar stream approach might be problematic in mea-suring the viscosity of complex fluids that containmutuallymis-ciblecomponentsandhydrodynamic instabilitiesmightprecludeprecise control of the fluid-fluid interface location (Vanapalliet al. 2007; Cartas-Ayala and Karnik 2013; Solomon andVanapalli 2014). Likewise, capillary imbibition viscometers re-quire calibration chambers to determine capillary pressure andare sensitive to wetting defects.
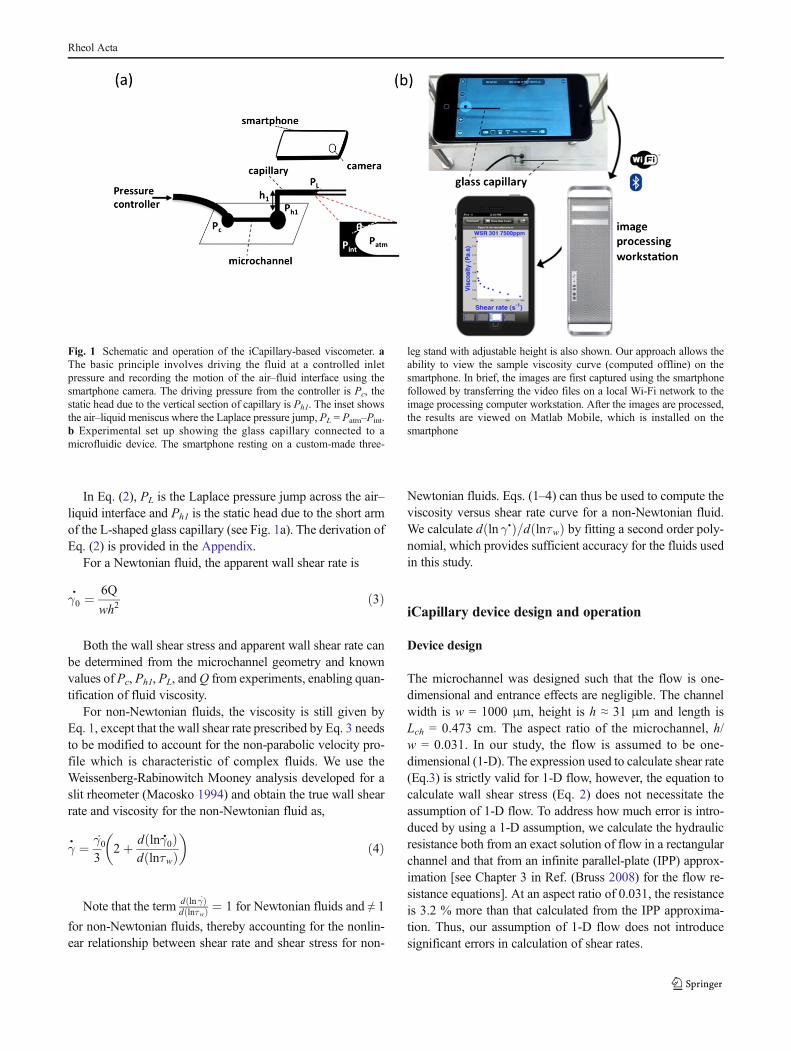
In thiswork,we present amicrofluidic viscometer that is sim-ple and distinct from current image-based viscometers reportedin the literature. It involves a microchannel where flow is drivenusing a constant pressure (or wall shear stress). The flow rate isdeterminedbymonitoring the slug (i.e., air–fluid interface) prop-agation in a millimeter-scale glass capillary connected to themicrochannel (see Fig. 1). Because of the larger diameter glasscapillary, we use the camera on a smartphone to record interfacemotion. We refer to this device as ‘iCapillary’. Currently,smartphones contain cameras that are capable of recording im-ages at 30 frames per second in 1024 pixels of vertical resolution(1024p).Thisvideo-recordingcapabilityprovidessignificantop-portunities for inexpensive visualization of fluid flows inmicrofluidic devices. Exploiting this imaging capability of con-sumer cameras, we show reliable measurement of viscositycurves for Newtonian and polymeric fluids. We also show thatthehigh-shear rateviscosityof severaldifferentconcentrationsofprotein solutions can be measured in parallel that may find po-tential applications in antibody-based therapeutics. Finally, weprovide limits on operability of our iCapillary device.
Basic principle of viscosity measurement
Our method is based on quantifying pressure-drop versus flowrate relation for a given fluid, followed by determination of vis-cosity using the principles of slit-rheometry (Macosko 1994). Aschematic of the device is shown in Fig. 1a. A constant pressure(Pc) is imposed at the inlet of amicrochannel ofwidth (w), height(h), and length (Lch). The volumetric flow rate (Q) of the fluid inthemicrochannel is determined bymeasuring themean velocityof theslug in theattachedglasscapillaryusing the in-built camerain the smartphone. The mean velocity of the slug is then multi-pliedbythecross-sectionalareaof theglasscapillary toobtain thevolumetric flow rate.
We now describe how the viscosity and shear rate forNewtonian and non-Newtonian fluids can be computed fromexperimental data.The foregoing analysis assumes that thedom-inant contribution to flow resistance comes from themicrochannel and thatw>>hmaking the flowone-dimensional.Our devices are designed to ensure these assumptions are satis-fied (see “iCapillary device design and operation” section).
The viscosity for a Newtonian fluid is given by,
μ ¼ τwγ0•
ð1Þ
where τw is the wall shear stress and γ0• is the apparent wall
shear rate. The wall shear stress experienced by themicrochannel in the iCapillary device is given by
τw ¼ Pc−Ph1 þ PLð Þwh2Lch wþ hð Þ ð2Þ
Rheol Acta
In Eq. (2), PL is the Laplace pressure jump across the air–liquid interface and Ph1 is the static head due to the short armof the L-shaped glass capillary (see Fig. 1a). The derivation ofEq. (2) is provided in the Appendix.
For a Newtonian fluid, the apparent wall shear rate is
γ0• ¼ 6Q
wh2ð3Þ
Both the wall shear stress and apparent wall shear rate canbe determined from the microchannel geometry and knownvalues of Pc, Ph1, PL, andQ from experiments, enabling quan-tification of fluid viscosity.
For non-Newtonian fluids, the viscosity is still given byEq. 1, except that the wall shear rate prescribed by Eq. 3 needsto be modified to account for the non-parabolic velocity pro-file which is characteristic of complex fluids. We use theWeissenberg-Rabinowitch Mooney analysis developed for aslit rheometer (Macosko 1994) and obtain the true wall shearrate and viscosity for the non-Newtonian fluid as,
γ• ¼ γ0
:
32þ d lnγ•0ð Þ
d lnτwð Þ� �
ð4Þ
Note that the term d ln γ:ð Þ
d lnτwð Þ ¼ 1 for Newtonian fluids and ≠ 1
for non-Newtonian fluids, thereby accounting for the nonlin-ear relationship between shear rate and shear stress for non-
Newtonian fluids. Eqs. (1–4) can thus be used to compute theviscosity versus shear rate curve for a non-Newtonian fluid.We calculate d ln γ•ð Þ=d lnτwð Þ by fitting a second order poly-nomial, which provides sufficient accuracy for the fluids usedin this study.
iCapillary device design and operation
Device design
The microchannel was designed such that the flow is one-dimensional and entrance effects are negligible. The channelwidth is w = 1000 μm, height is h ≈ 31 μm and length isLch = 0.473 cm. The aspect ratio of the microchannel, h/w = 0.031. In our study, the flow is assumed to be one-dimensional (1-D). The expression used to calculate shear rate(Eq.3) is strictly valid for 1-D flow, however, the equation tocalculate wall shear stress (Eq. 2) does not necessitate theassumption of 1-D flow. To address how much error is intro-duced by using a 1-D assumption, we calculate the hydraulicresistance both from an exact solution of flow in a rectangularchannel and that from an infinite parallel-plate (IPP) approx-imation [see Chapter 3 in Ref. (Bruss 2008) for the flow re-sistance equations]. At an aspect ratio of 0.031, the resistanceis 3.2 % more than that calculated from the IPP approxima-tion. Thus, our assumption of 1-D flow does not introducesignificant errors in calculation of shear rates.
Fig. 1 Schematic and operation of the iCapillary-based viscometer. aThe basic principle involves driving the fluid at a controlled inletpressure and recording the motion of the air–fluid interface using thesmartphone camera. The driving pressure from the controller is Pc, thestatic head due to the vertical section of capillary is Ph1. The inset showsthe air–liquid meniscus where the Laplace pressure jump, PL = Patm–Pint.b Experimental set up showing the glass capillary connected to amicrofluidic device. The smartphone resting on a custom-made three-
leg stand with adjustable height is also shown. Our approach allows theability to view the sample viscosity curve (computed offline) on thesmartphone. In brief, the images are first captured using the smartphonefollowed by transferring the video files on a local Wi-Fi network to theimage processing computer workstation. After the images are processed,the results are viewed on Matlab Mobile, which is installed on thesmartphone
Rheol Acta
The entrance length (Le) for laminar flows with Re < 2000is given by (Pipe et al. 2008),
Le ¼ dh0:6
1þ 0:035Reþ 0:056Re
� �ð5Þ
where Re is the Reynolds number and dh is the hydraulicdiameter of the microchannel. The maximum entrance length(corresponding to the highest shear rates attained in the device∼16,000 s−1) is Le = 0.01Lch, justifying that the flow is fullydeveloped in the microchannel.
The glass capillary was designed such that its flow resis-tance is negligible compared to the microchannel. The boro-silicate glass capillary (BF-200, Sutter Instruments, CA) hasan inner radius, r = 0.76mm and is L-shaped (see Fig. 1a) witha short arm of length h1 ≈ 5 mm and a long arm of length,Lcap = 8 cm. The geometry of the capillary ensures <1 %contribution to the hydrodynamic resistance of themicrochannel. The 5 mm length of the short arm is necessaryfor mechanical stability of the capillary while connecting tothe microchannel. This length of the short arm corresponds toa hydrostatic head of Ph1 ≈ 50 Pa. For majority of the condi-tions used in this study, this static head contributes to <3 % ofthe driving pressure (Pc), nevertheless we accounted for thispressure loss in all of our calculations.
The capillary pressure due to the air–fluid interface wasalso designed to be small compared to the driving pressureby choosing a capillary of sufficiently large diameter. Thecapillary pressure (PL) is given by
PL ¼ 2σcosθr
ð6Þ
where σ is the surface tension between the fluid–air interface,θ is the contact angle between the fluid and the glass capillary(see inset of Fig. 1a). We estimated PL from Eq. (6) usingknown values of surface tension of water–air interface at20 °C (σ = 72.75 mN/m (Vargaftik et al. 1983)) and its contactangle with borosilicate glass (θ = 32°(Finlayson-Pitts et al.2003)). For the glass capillary used in this study,PL ≈ 160 Pa. Note that as the glass is hydrophilic the shapeof the interface is concave as shown in the inset of Fig. 1a,consistent with our observations. For the majority of condi-tions used in this work, capillary pressure contributes to <6 %to the driving pressure (Pc). Interfacially active moleculessuch as surfactants and proteins reduce air–water surface ten-sion; therefore, we expect the contribution of PL to be evenlower in such cases. For simplicity, in all of our analysis, weused an upper bound of PL ≈ 160 Pa. In addition to reducingsurface tension, surfactants and proteins can also form visco-elastic films at interfaces, which may affect our measurementtechnique. We address this potential concern in “Multiplexedviscosity measurements” section.
Device operation
The iCapillary device was tested with Newtonian (water-glyc-erol mixtures), polymeric fluids (polyethylene oxide, WSR-N60K, Dow Chemical Co., Midland, MI), and bovine serumalbumin (BSA, Sigma Aldrich) solutions. Newtonian fluidsand polymeric fluids were prepared as described previously(Solomon and Vanapalli 2014). The bovine serum albumin(BSA) solutions were prepared in 0.01 M phosphate bufferedsaline solution with concentrations varying from 5 to250 mg/ml.
The device consists of a microfluidic channel fabricatedusing the soft lithography technique (Xia and Whitesides1998). To fit the glass capillaries into the outlets of thePDMS microchannel, we punched holes slightly smaller thanthe external diameter of the glass capillary into the outlets ofthe PDMS microchannel. The capillaries were then pushedinto the slightly smaller hole causing the elastic PDMS toexpand and in turn form a leak proof seal. Additionally, wealso ensured that the PDMS device was sufficiently thick (∼3–5 mm) to prevent sagging of the capillaries that might causefluid leakage. The glass capillaries were cleaned with ethanol,sonicated, and dried in an oven to ensure that dirt was not afactor in our experiments.
To generate viscosity curves different driving pressureswere applied using an automated pressure controller(MCFS-flex, Fluigent, France). The reported accuracy of thepressure controllers is <1% of the full scale. The motion of thefluidic slug was captured using a smartphone (iPod, AppleInc., Cupertino, CA). To manipulate the frame rate and formatfor video capturing, we used a third party application(ProCAM, iTunes Store). The movies were recorded in mp4file format at 15 frames per second. The calibration of theimages was performed using a ruler, which yielded a pixelresolution of 100 μm/pixel. The images captured using thesmartphone were transferred to an image processing worksta-tion using a local Wi-Fi network. The transferred video fileswere then analyzed on the workstation using Matlab(Mathworks, Boston, MA). Typical size of the video filesrecorded range from 8 to 100 MB with data transfer rates of1–2 Mbps. After the images are processed, the results areviewed on Matlab Mobile (which is installed on the iPod).
The image analysis was conducted on the image processingworkstation using mostly Matlab (Mathworks, Boston, MA)(in limited cases Image J was also used). In instances wherethe fluidic slug moves <50 pixels (e.g., high fluid viscosity orlow driving pressure), an automated algorithm was used todetect the location of the fluidic slug in the capillary. Asshown in Fig. 2, the image is first cropped to have only thecapillary in the field of view, a threshold is applied on theimages, followed by edge detect to find the contours of thefluidic slug. Finally, a Hough transform is applied to the edgesof the slug to determine the length of the fluidic slug. The error
Rheol Acta
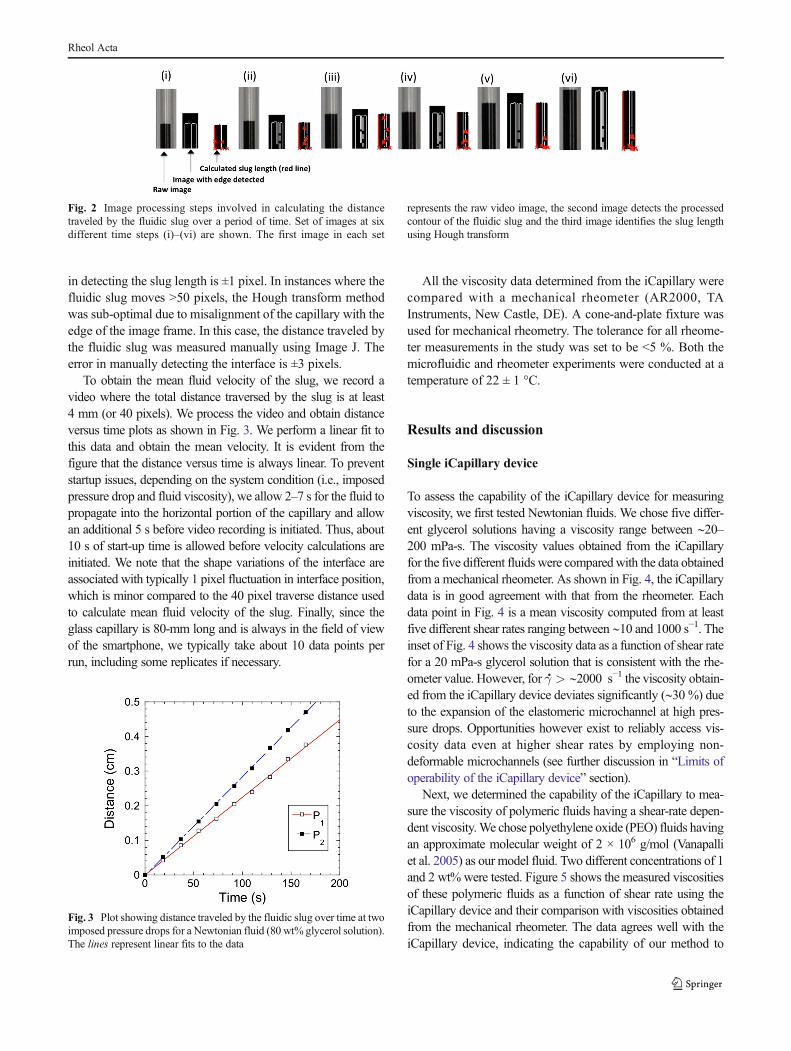
in detecting the slug length is ±1 pixel. In instances where thefluidic slug moves >50 pixels, the Hough transform methodwas sub-optimal due to misalignment of the capillary with theedge of the image frame. In this case, the distance traveled bythe fluidic slug was measured manually using Image J. Theerror in manually detecting the interface is ±3 pixels.
To obtain the mean fluid velocity of the slug, we record avideo where the total distance traversed by the slug is at least4 mm (or 40 pixels). We process the video and obtain distanceversus time plots as shown in Fig. 3. We perform a linear fit tothis data and obtain the mean velocity. It is evident from thefigure that the distance versus time is always linear. To preventstartup issues, depending on the system condition (i.e., imposedpressure drop and fluid viscosity), we allow 2–7 s for the fluid topropagate into the horizontal portion of the capillary and allowan additional 5 s before video recording is initiated. Thus, about10 s of start-up time is allowed before velocity calculations areinitiated. We note that the shape variations of the interface areassociated with typically 1 pixel fluctuation in interface position,which is minor compared to the 40 pixel traverse distance usedto calculate mean fluid velocity of the slug. Finally, since theglass capillary is 80-mm long and is always in the field of viewof the smartphone, we typically take about 10 data points perrun, including some replicates if necessary.
All the viscosity data determined from the iCapillary werecompared with a mechanical rheometer (AR2000, TAInstruments, New Castle, DE). A cone-and-plate fixture wasused for mechanical rheometry. The tolerance for all rheome-ter measurements in the study was set to be <5 %. Both themicrofluidic and rheometer experiments were conducted at atemperature of 22 ± 1 °C.
Results and discussion
Single iCapillary device
To assess the capability of the iCapillary device for measuringviscosity, we first tested Newtonian fluids. We chose five differ-ent glycerol solutions having a viscosity range between ∼20–200 mPa-s. The viscosity values obtained from the iCapillaryfor the five different fluids were comparedwith the data obtainedfrom a mechanical rheometer. As shown in Fig. 4, the iCapillarydata is in good agreement with that from the rheometer. Eachdata point in Fig. 4 is a mean viscosity computed from at leastfive different shear rates ranging between ∼10 and 1000 s−1. Theinset of Fig. 4 shows the viscosity data as a function of shear ratefor a 20 mPa-s glycerol solution that is consistent with the rhe-ometer value. However, for γ• > ∼2000 s−1 the viscosity obtain-ed from the iCapillary device deviates significantly (∼30 %) dueto the expansion of the elastomeric microchannel at high pres-sure drops. Opportunities however exist to reliably access vis-cosity data even at higher shear rates by employing non-deformable microchannels (see further discussion in “Limits ofoperability of the iCapillary device” section).
Next, we determined the capability of the iCapillary to mea-sure the viscosity of polymeric fluids having a shear-rate depen-dent viscosity.We chose polyethylene oxide (PEO) fluids havingan approximate molecular weight of 2 × 10⁶ g/mol (Vanapalliet al. 2005) as our model fluid. Two different concentrations of 1and 2 wt% were tested. Figure 5 shows the measured viscositiesof these polymeric fluids as a function of shear rate using theiCapillary device and their comparison with viscosities obtainedfrom the mechanical rheometer. The data agrees well with theiCapillary device, indicating the capability of our method to
Fig. 2 Image processing steps involved in calculating the distancetraveled by the fluidic slug over a period of time. Set of images at sixdifferent time steps (i)–(vi) are shown. The first image in each set
represents the raw video image, the second image detects the processedcontour of the fluidic slug and the third image identifies the slug lengthusing Hough transform
Fig. 3 Plot showing distance traveled by the fluidic slug over time at twoimposed pressure drops for a Newtonian fluid (80 wt% glycerol solution).The lines represent linear fits to the data
Rheol Acta
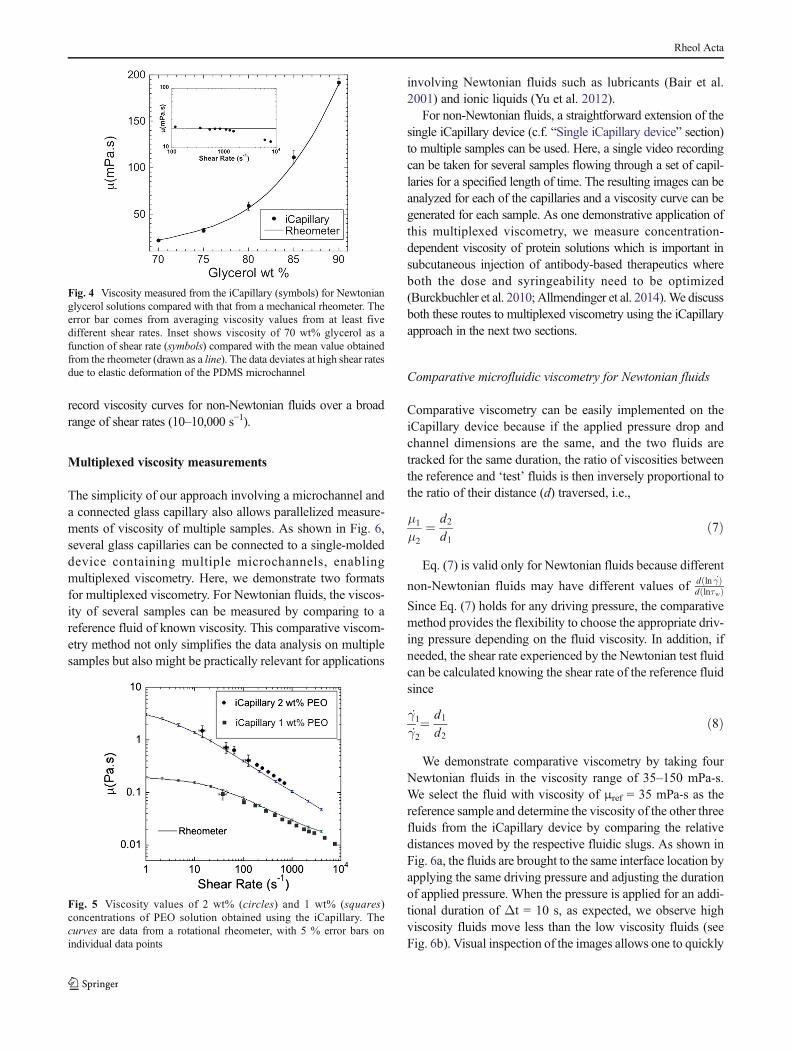
record viscosity curves for non-Newtonian fluids over a broadrange of shear rates (10–10,000 s−1).
Multiplexed viscosity measurements
The simplicity of our approach involving a microchannel anda connected glass capillary also allows parallelized measure-ments of viscosity of multiple samples. As shown in Fig. 6,several glass capillaries can be connected to a single-moldeddevice containing multiple microchannels, enablingmultiplexed viscometry. Here, we demonstrate two formatsfor multiplexed viscometry. For Newtonian fluids, the viscos-ity of several samples can be measured by comparing to areference fluid of known viscosity. This comparative viscom-etry method not only simplifies the data analysis on multiplesamples but also might be practically relevant for applications
involving Newtonian fluids such as lubricants (Bair et al.2001) and ionic liquids (Yu et al. 2012).
For non-Newtonian fluids, a straightforward extension of thesingle iCapillary device (c.f. “Single iCapillary device” section)to multiple samples can be used. Here, a single video recordingcan be taken for several samples flowing through a set of capil-laries for a specified length of time. The resulting images can beanalyzed for each of the capillaries and a viscosity curve can begenerated for each sample. As one demonstrative application ofthis multiplexed viscometry, we measure concentration-dependent viscosity of protein solutions which is important insubcutaneous injection of antibody-based therapeutics whereboth the dose and syringeability need to be optimized(Burckbuchler et al. 2010; Allmendinger et al. 2014).We discussboth these routes to multiplexed viscometry using the iCapillaryapproach in the next two sections.
Comparative microfluidic viscometry for Newtonian fluids
Comparative viscometry can be easily implemented on theiCapillary device because if the applied pressure drop andchannel dimensions are the same, and the two fluids aretracked for the same duration, the ratio of viscosities betweenthe reference and ‘test’ fluids is then inversely proportional tothe ratio of their distance (d) traversed, i.e.,
μ1
μ2¼ d2
d1ð7Þ
Eq. (7) is valid only for Newtonian fluids because different
non-Newtonian fluids may have different values of d ln γ:ð Þ
d lnτwð ÞSince Eq. (7) holds for any driving pressure, the comparativemethod provides the flexibility to choose the appropriate driv-ing pressure depending on the fluid viscosity. In addition, ifneeded, the shear rate experienced by the Newtonian test fluidcan be calculated knowing the shear rate of the reference fluidsince
γ1:
γ2: ¼ d1
d2ð8Þ
We demonstrate comparative viscometry by taking fourNewtonian fluids in the viscosity range of 35–150 mPa-s.We select the fluid with viscosity of μref = 35 mPa-s as thereference sample and determine the viscosity of the other threefluids from the iCapillary device by comparing the relativedistances moved by the respective fluidic slugs. As shown inFig. 6a, the fluids are brought to the same interface location byapplying the same driving pressure and adjusting the durationof applied pressure. When the pressure is applied for an addi-tional duration of Δt = 10 s, as expected, we observe highviscosity fluids move less than the low viscosity fluids (seeFig. 6b). Visual inspection of the images allows one to quickly
Fig. 4 Viscosity measured from the iCapillary (symbols) for Newtonianglycerol solutions compared with that from a mechanical rheometer. Theerror bar comes from averaging viscosity values from at least fivedifferent shear rates. Inset shows viscosity of 70 wt% glycerol as afunction of shear rate (symbols) compared with the mean value obtainedfrom the rheometer (drawn as a line). The data deviates at high shear ratesdue to elastic deformation of the PDMS microchannel
Fig. 5 Viscosity values of 2 wt% (circles) and 1 wt% (squares)concentrations of PEO solution obtained using the iCapillary. Thecurves are data from a rotational rheometer, with 5 % error bars onindividual data points
Rheol Acta
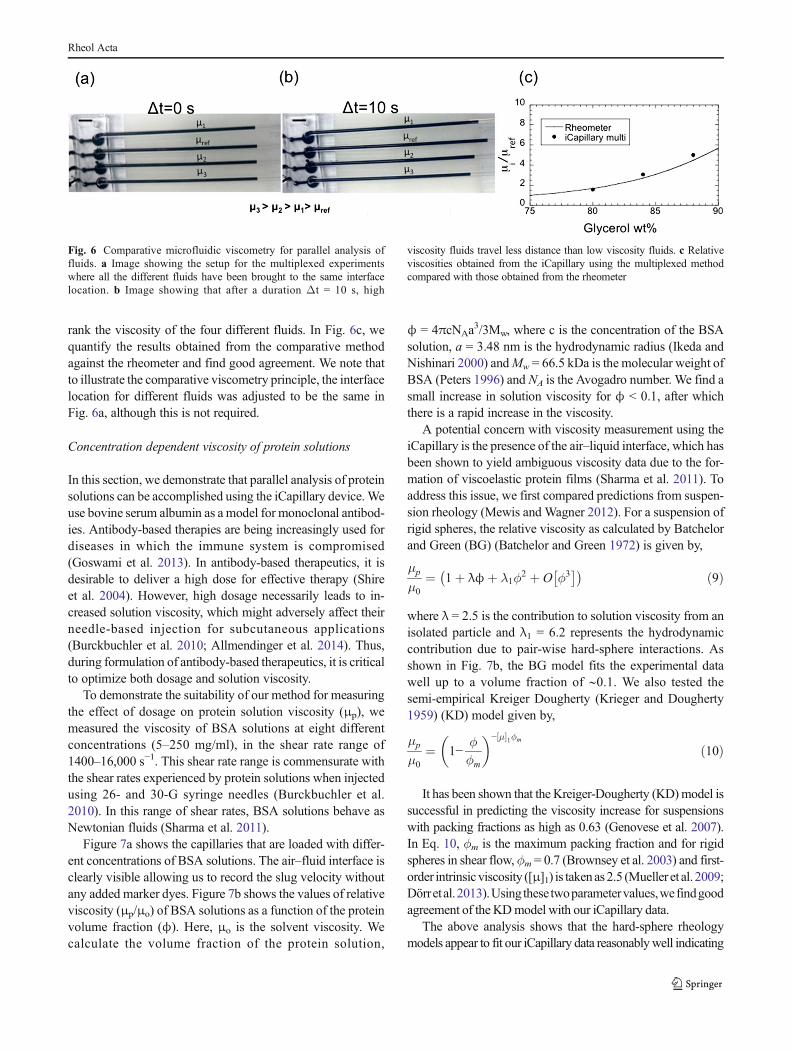
rank the viscosity of the four different fluids. In Fig. 6c, wequantify the results obtained from the comparative methodagainst the rheometer and find good agreement. We note thatto illustrate the comparative viscometry principle, the interfacelocation for different fluids was adjusted to be the same inFig. 6a, although this is not required.
Concentration dependent viscosity of protein solutions
In this section, we demonstrate that parallel analysis of proteinsolutions can be accomplished using the iCapillary device. Weuse bovine serum albumin as a model for monoclonal antibod-ies. Antibody-based therapies are being increasingly used fordiseases in which the immune system is compromised(Goswami et al. 2013). In antibody-based therapeutics, it isdesirable to deliver a high dose for effective therapy (Shireet al. 2004). However, high dosage necessarily leads to in-creased solution viscosity, which might adversely affect theirneedle-based injection for subcutaneous applications(Burckbuchler et al. 2010; Allmendinger et al. 2014). Thus,during formulation of antibody-based therapeutics, it is criticalto optimize both dosage and solution viscosity.
To demonstrate the suitability of our method for measuringthe effect of dosage on protein solution viscosity (μp), wemeasured the viscosity of BSA solutions at eight differentconcentrations (5–250 mg/ml), in the shear rate range of1400–16,000 s−1. This shear rate range is commensurate withthe shear rates experienced by protein solutions when injectedusing 26- and 30-G syringe needles (Burckbuchler et al.2010). In this range of shear rates, BSA solutions behave asNewtonian fluids (Sharma et al. 2011).
Figure 7a shows the capillaries that are loaded with differ-ent concentrations of BSA solutions. The air–fluid interface isclearly visible allowing us to record the slug velocity withoutany added marker dyes. Figure 7b shows the values of relativeviscosity (μp/μo) of BSA solutions as a function of the proteinvolume fraction (ϕ). Here, μo is the solvent viscosity. Wecalculate the volume fraction of the protein solution,
ϕ = 4πcNAa3/3Mw, where c is the concentration of the BSA
solution, a = 3.48 nm is the hydrodynamic radius (Ikeda andNishinari 2000) andMw = 66.5 kDa is the molecular weight ofBSA (Peters 1996) and NA is the Avogadro number. We find asmall increase in solution viscosity for ϕ < 0.1, after whichthere is a rapid increase in the viscosity.
A potential concern with viscosity measurement using theiCapillary is the presence of the air–liquid interface, which hasbeen shown to yield ambiguous viscosity data due to the for-mation of viscoelastic protein films (Sharma et al. 2011). Toaddress this issue, we first compared predictions from suspen-sion rheology (Mewis and Wagner 2012). For a suspension ofrigid spheres, the relative viscosity as calculated by Batchelorand Green (BG) (Batchelor and Green 1972) is given by,
μp
μ0¼ 1þ λϕþ λ1ϕ
2 þ O ϕ3� �� � ð9Þ
where λ = 2.5 is the contribution to solution viscosity from anisolated particle and λ1 = 6.2 represents the hydrodynamiccontribution due to pair-wise hard-sphere interactions. Asshown in Fig. 7b, the BG model fits the experimental datawell up to a volume fraction of ∼0.1. We also tested thesemi-empirical Kreiger Dougherty (Krieger and Dougherty1959) (KD) model given by,
μp
μ0¼ 1−
ϕϕm
� �− μ½ �1ϕm
ð10Þ
It has been shown that the Kreiger-Dougherty (KD)model issuccessful in predicting the viscosity increase for suspensionswith packing fractions as high as 0.63 (Genovese et al. 2007).In Eq. 10, ϕm is the maximum packing fraction and for rigidspheres in shear flow, ϕm = 0.7 (Brownsey et al. 2003) and first-order intrinsicviscosity ([μ]1) is takenas2.5 (Mueller et al. 2009;Dörretal.2013).Usingthese twoparametervalues,wefindgoodagreement of the KDmodel with our iCapillary data.
The above analysis shows that the hard-sphere rheologymodels appear to fit our iCapillary data reasonablywell indicating
Fig. 6 Comparative microfluidic viscometry for parallel analysis offluids. a Image showing the setup for the multiplexed experimentswhere all the different fluids have been brought to the same interfacelocation. b Image showing that after a duration Δt = 10 s, high
viscosity fluids travel less distance than low viscosity fluids. c Relativeviscosities obtained from the iCapillary using the multiplexed methodcompared with those obtained from the rheometer
Rheol Acta
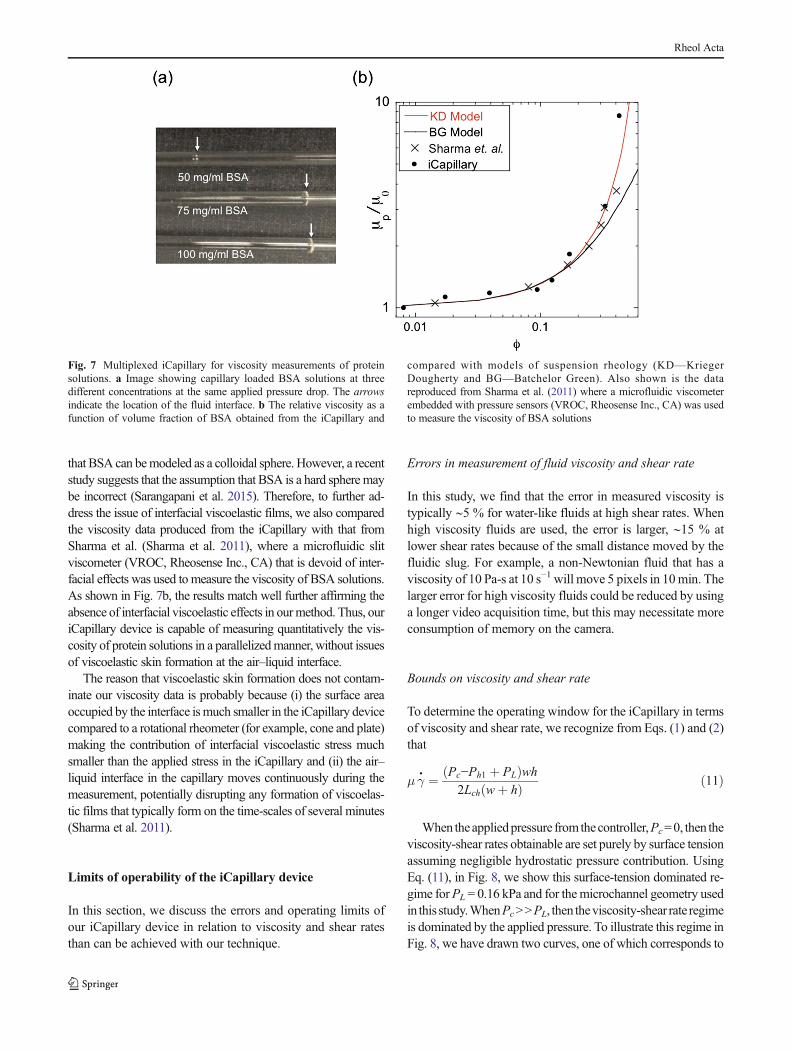
that BSA can bemodeled as a colloidal sphere. However, a recentstudy suggests that the assumption that BSA is a hard spheremaybe incorrect (Sarangapani et al. 2015). Therefore, to further ad-dress the issue of interfacial viscoelastic films, we also comparedthe viscosity data produced from the iCapillary with that fromSharma et al. (Sharma et al. 2011), where a microfluidic slitviscometer (VROC, Rheosense Inc., CA) that is devoid of inter-facial effects was used to measure the viscosity of BSA solutions.As shown in Fig. 7b, the results match well further affirming theabsence of interfacial viscoelastic effects in ourmethod. Thus, ouriCapillary device is capable of measuring quantitatively the vis-cosity of protein solutions in a parallelizedmanner, without issuesof viscoelastic skin formation at the air–liquid interface.
The reason that viscoelastic skin formation does not contam-inate our viscosity data is probably because (i) the surface areaoccupied by the interface ismuch smaller in the iCapillary devicecompared to a rotational rheometer (for example, cone and plate)making the contribution of interfacial viscoelastic stress muchsmaller than the applied stress in the iCapillary and (ii) the air–liquid interface in the capillary moves continuously during themeasurement, potentially disrupting any formation of viscoelas-tic films that typically form on the time-scales of several minutes(Sharma et al. 2011).
Limits of operability of the iCapillary device
In this section, we discuss the errors and operating limits ofour iCapillary device in relation to viscosity and shear ratesthan can be achieved with our technique.
Errors in measurement of fluid viscosity and shear rate
In this study, we find that the error in measured viscosity istypically ∼5 % for water-like fluids at high shear rates. Whenhigh viscosity fluids are used, the error is larger, ∼15 % atlower shear rates because of the small distance moved by thefluidic slug. For example, a non-Newtonian fluid that has aviscosity of 10 Pa-s at 10 s−1 will move 5 pixels in 10min. Thelarger error for high viscosity fluids could be reduced by usinga longer video acquisition time, but this may necessitate moreconsumption of memory on the camera.
Bounds on viscosity and shear rate
To determine the operating window for the iCapillary in termsof viscosity and shear rate, we recognize from Eqs. (1) and (2)that
μ γ• ¼ Pc−Ph1 þ PLð Þwh
2Lch wþ hð Þ ð11Þ
When theappliedpressure fromthecontroller,Pc=0, then theviscosity-shear rates obtainable are set purely by surface tensionassuming negligible hydrostatic pressure contribution. UsingEq. (11), in Fig. 8, we show this surface-tension dominated re-gime forPL = 0.16 kPa and for themicrochannel geometry usedin this study.WhenPc>>PL, then theviscosity-shear rate regimeis dominated by the applied pressure. To illustrate this regime inFig. 8, we have drawn two curves, one of which corresponds to
Fig. 7 Multiplexed iCapillary for viscosity measurements of proteinsolutions. a Image showing capillary loaded BSA solutions at threedifferent concentrations at the same applied pressure drop. The arrowsindicate the location of the fluid interface. b The relative viscosity as afunction of volume fraction of BSA obtained from the iCapillary and
compared with models of suspension rheology (KD—KriegerDougherty and BG—Batchelor Green). Also shown is the datareproduced from Sharma et al. (2011) where a microfluidic viscometerembedded with pressure sensors (VROC, Rheosense Inc., CA) was usedto measure the viscosity of BSA solutions
Rheol Acta
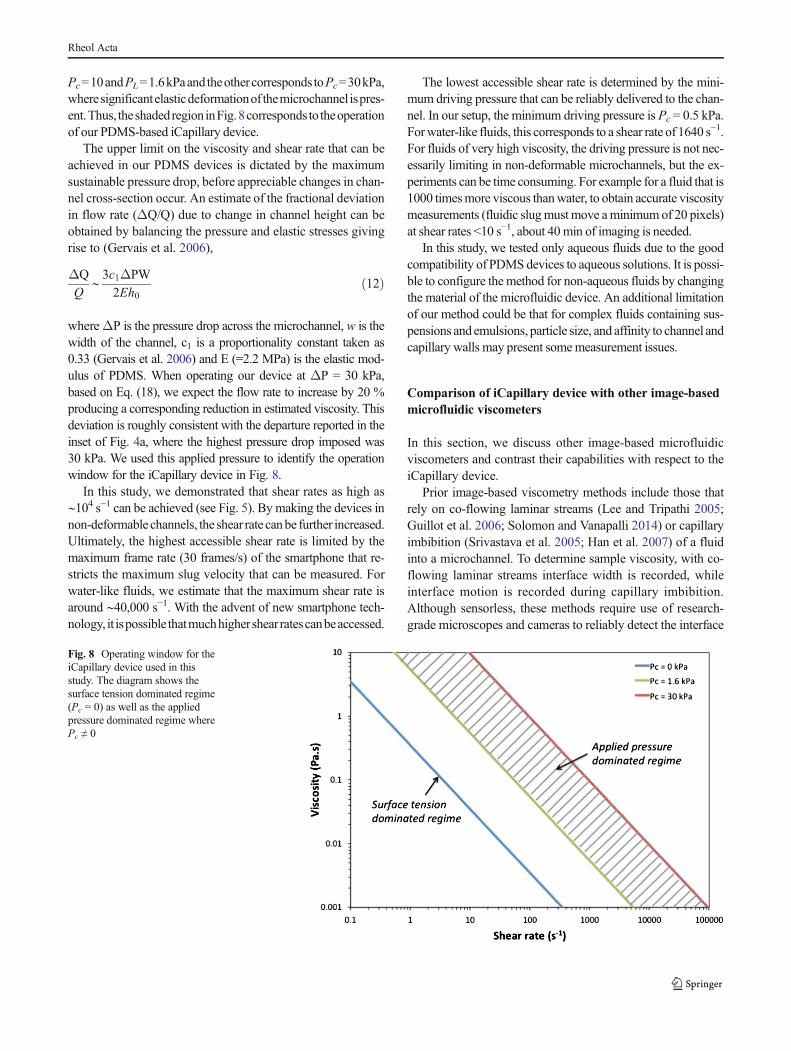
Pc=10andPL=1.6kPaandtheothercorresponds toPc=30kPa,wheresignificantelasticdeformationof themicrochannel ispres-ent.Thus, theshadedregioninFig.8corresponds to theoperationof our PDMS-based iCapillary device.
The upper limit on the viscosity and shear rate that can beachieved in our PDMS devices is dictated by the maximumsustainable pressure drop, before appreciable changes in chan-nel cross-section occur. An estimate of the fractional deviationin flow rate (ΔQ/Q) due to change in channel height can beobtained by balancing the pressure and elastic stresses givingrise to (Gervais et al. 2006),
ΔQ
Q∼3c1ΔPW
2Eh0ð12Þ
whereΔP is the pressure drop across the microchannel, w is thewidth of the channel, c1 is a proportionality constant taken as0.33 (Gervais et al. 2006) and E (=2.2 MPa) is the elastic mod-ulus of PDMS. When operating our device at ΔP = 30 kPa,based on Eq. (18), we expect the flow rate to increase by 20 %producing a corresponding reduction in estimated viscosity. Thisdeviation is roughly consistent with the departure reported in theinset of Fig. 4a, where the highest pressure drop imposed was30 kPa. We used this applied pressure to identify the operationwindow for the iCapillary device in Fig. 8.
In this study, we demonstrated that shear rates as high as∼104 s−1 can be achieved (see Fig. 5). By making the devices innon-deformable channels, the shear rate canbe further increased.Ultimately, the highest accessible shear rate is limited by themaximum frame rate (30 frames/s) of the smartphone that re-stricts the maximum slug velocity that can be measured. Forwater-like fluids, we estimate that the maximum shear rate isaround ∼40,000 s−1. With the advent of new smartphone tech-nology, it ispossible thatmuchhighershear ratescanbeaccessed.
The lowest accessible shear rate is determined by the mini-mum driving pressure that can be reliably delivered to the chan-nel. In our setup, the minimum driving pressure is Pc = 0.5 kPa.Forwater-like fluids, this corresponds to a shear rate of 1640 s−1.For fluids of very high viscosity, the driving pressure is not nec-essarily limiting in non-deformable microchannels, but the ex-periments can be time consuming. For example for a fluid that is1000 timesmore viscous thanwater, to obtain accurate viscositymeasurements (fluidic slugmust move aminimumof 20 pixels)at shear rates <10 s−1, about 40min of imaging is needed.
In this study, we tested only aqueous fluids due to the goodcompatibility of PDMSdevices to aqueous solutions. It is possi-ble to configure the method for non-aqueous fluids by changingthe material of the microfluidic device. An additional limitationof our method could be that for complex fluids containing sus-pensions andemulsions, particle size, and affinity to channel andcapillary walls may present somemeasurement issues.
Comparison of iCapillary device with other image-basedmicrofluidic viscometers
In this section, we discuss other image-based microfluidicviscometers and contrast their capabilities with respect to theiCapillary device.
Prior image-based viscometry methods include those thatrely on co-flowing laminar streams (Lee and Tripathi 2005;Guillot et al. 2006; Solomon and Vanapalli 2014) or capillaryimbibition (Srivastava et al. 2005; Han et al. 2007) of a fluidinto a microchannel. To determine sample viscosity, with co-flowing laminar streams interface width is recorded, whileinterface motion is recorded during capillary imbibition.Although sensorless, these methods require use of research-grade microscopes and cameras to reliably detect the interface
Fig. 8 Operating window for theiCapillary device used in thisstudy. The diagram shows thesurface tension dominated regime(Pc = 0) as well as the appliedpressure dominated regime wherePc ≠ 0
Rheol Acta
location, because of the microscale channel and interfacewidth dimensions, making them more suitable for laboratoryenvironments. Moreover, the co-flowing laminar stream ap-proach might be problematic in measuring the viscosity ofcomplex fluids that contain mutually miscible componentsand hydrodynamic instabilities might preclude precise controlof the fluid–fluid interface location (Vanapalli et al. 2007;Cartas-Ayala and Karnik 2013; Solomon and Vanapalli 2014).
Due to the interface motion in a conduit, our approach resem-bles microfluidic capillary viscometers (μCVs) (Srivastava et al.2005; Han et al. 2007) where capillary pressure is used to drivefluid flow rather than applied pressure. Both the μCVs and theiCapillary device allow use-and-throw capability, with theμCVsneeding much smaller fluid sample volume (typically 1–10 μl).Nevertheless, the iCapillary device has a number of distinct fea-tures that offer significant benefits. (i) InμCVs, the pressure dropis generated by the capillary pressure and therefore needs to beestimated through a calibration chamber (Srivastava et al. 2005).In our device, pressure drop is known and can be varied over abroad range. (ii) The maximum pressure drop in a μCV is deter-mined by the wettability characteristics and geometry of themicrochannel making the technique best suited for low-viscosity fluids and low shear rates (10–1000 s−1). In theiCapillary device, the pressure drop is tunable allowing charac-terization of both high and low viscosity fluids over a muchbroader range of shear rates (10–10,000 s−1).
Conclusions
In this work, we show a smartphone-based microfluidic vis-cometer, which is capable of quantifying the viscosity curvesfor both Newtonian and non-Newtonian fluids. To collect vis-cosity data over a shear rate range of ∼10–10,000 s−1 currentlyrequires about 1 mL of sample, 20 min of experimentationtime and another 40 min of off-line data analysis. Thisthroughput is comparable to conventional rheometers.
However, unlike conventional rheometers, which serially pro-cess samples, we demonstrate that the iCapillary device canprocess samples in parallel. In this case, the iCapillary device islikely to outperform the rheometer since all the samples can bedelivered using a single pressure source, and because severalcapillaries are captured on an image, only a single video file needto be processed for quantifying viscosity of multiple samples.
The number of samples that can be tested simultaneously isonly be limited by the field of view of the camera in the smartphone. For the smartphone used in this study, we estimate that itcan simultaneously image ∼30 capillaries. Thus, our simple meth-od has the potential to determine viscosity curves for a large num-ber of samples in parallel, profoundly saving time and manpower.
The basic platform demonstrated here could be further im-proved. Specific ‘apps’ can be designed that will allow imageand data analysis on the smartphone itself, rather than transferring
files to be analyzed offline. Both the microchannel and glasscapillary can be fabricated as a single unit using technologies suchas 3D printing. With these additional improvements, our devicecan find significant potential for onsite shear viscometry as wellas in applications that desire disposable devices.
Finally, in this work, we used a straight microchannel andfocused on shear viscometry. However, our approach can beexpanded to other microfluidic geometries including a hyper-bolic contraction for measurement of apparent extensionalviscosity of complex fluids (Galindo-Rosales et al. 2013).
Acknowledgments We thank William S. Wang and BiddutBhattacharjee for useful discussions and Prof. Rajesh Khare for accessto the rheometer. We acknowledge the donors of the American ChemicalSociety–Petroleum Research Fund (Grant No. 50521-DNI9) for partialsupport of this work.
Compliance with ethical standards
Conflict of interest This technology has been licensed to NeofluidicsLLC. Deepak Solomon is an equity holder and employee of NeofluidicsLLC. Deepak Solomon and Siva Vanapalli qualify to receive royaltydistributions from patents assigned to Texas Tech University and licensedfor commercial development to Neofluidics LLC.
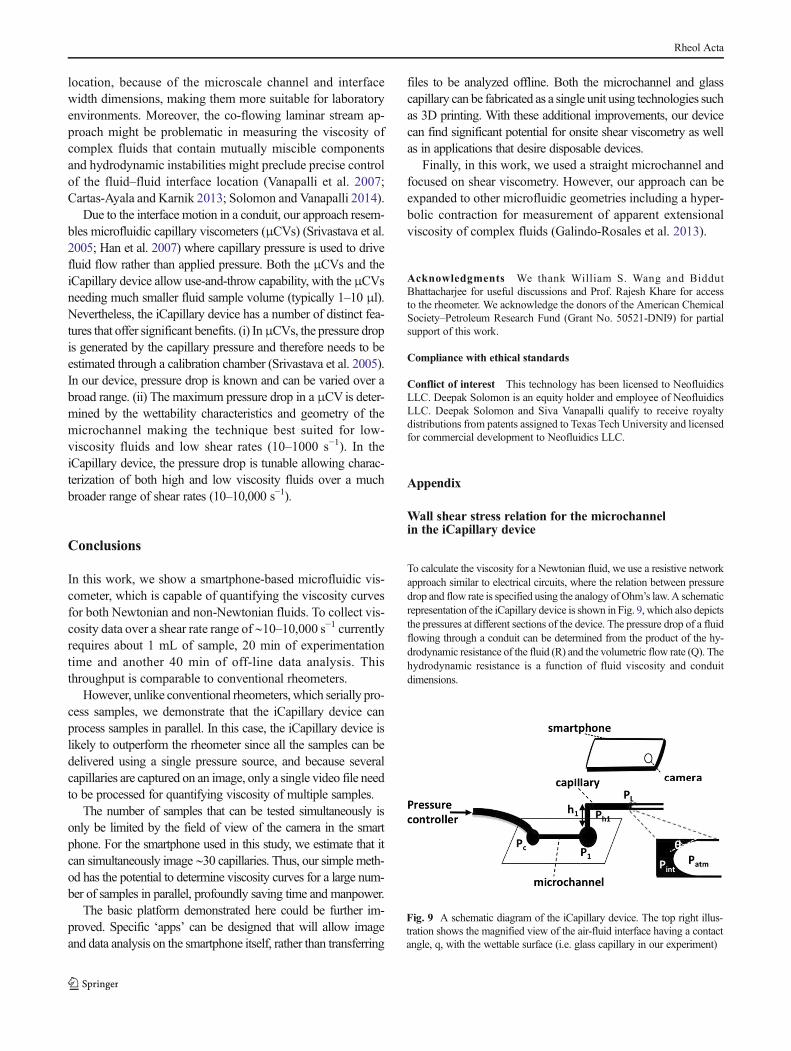
To calculate the viscosity for a Newtonian fluid, we use a resistive networkapproach similar to electrical circuits, where the relation between pressuredrop and flow rate is specified using the analogy ofOhm’s law.A schematicrepresentation of the iCapillary device is shown in Fig. 9, which also depictsthe pressures at different sections of the device. The pressure drop of a fluidflowing through a conduit can be determined from the product of the hy-drodynamic resistance of the fluid (R) and the volumetric flow rate (Q). Thehydrodynamic resistance is a function of fluid viscosity and conduitdimensions.
Fig. 9 A schematic diagram of the iCapillary device. The top right illus-tration shows the magnified view of the air-fluid interface having a contactangle, q, with the wettable surface (i.e. glass capillary in our experiment)
Appendix
Wall shear stress relation for the microchannelin the iCapillary device
Rheol Acta
For the microchannel, the pressure drop and flow rate relation is givenby
Pc–P1 ¼ QRc ð1Þwhere Pc, P1 and Rc are the inlet pressure, outlet pressure and hydrau-
lic resistance of the microchannel respectively.Likewise for the glass capillary, the pressure drop and flow rate rela-
tion is given by
P1–Pint ¼ Ph1 þ QRg ð2Þwhere Pint, Ph1 and Rg are the internal pressure, hydrostatic head and
the hydraulic resistance of the glass capillary respectively.Finally, the Laplace pressure jump (PL) across the air-water interface
is given by
Patm–Pint ¼ PL ð3Þwhere Patm is the atmospheric pressure, taken as zero.From Eqs. (1) – (3), we get
Pc þ PL−Ph1 ¼ Q Rg þ Rc
� � ð4ÞSince Rg < < Rc, we obtain the pressure drop across the microchannel
(ΔP) as
ΔP ¼ QRc ¼ Pc þ PL−Ph1 ð5ÞTaking a control volume inside the microchannel and balancing the
forces due to pressure and wall shear stress gives
τw 2Lch wþ hð Þ½ � ¼ ΔP whð Þ ð6ÞIn Eq. (6), Lch, w and h are the length, width and height of the
microchannel respectively. Using Eq. (5) in Eq. (6), we thus obtain thewall shear stress experienced by themicrochannel in the iCapillary deviceas
τw ¼ Pc−Ph1 þ PLð Þwh2Lch wþ hð Þ ð7Þ
References
Allmendinger A, Fischer S, Huwyler B, Mahler HC, Schwarb E, ZarragaIE, Mueller R (2014) Rheological characterization and injectionforces of concentrated protein formulations: an alternative predictivemodel for non-Newtonian solutions. Eur J Pharm Biopharm 87(2):318–328
Bair S, Jarzynski J,WinerWO (2001) The temperature, pressure and timedependence of lubricant viscosity. Tribol Int 34(7):461–468
Batchelor GK, Green JT (1972) The hydrodynamic interaction of twosmall freely-moving spheres in a linear flow field. J Fluid Mech56(2):375–400
Brownsey GJ, Noel TR, Parker R, Ring SG (2003) The glass transitionbehavior of the globular protein bovine serum albumin. Biophys J85(6):3943–3950
Bruss H (2008) Theoretical microfluidics. Oxford University Press,Oxford
Buchmann, S. (2001). Main cosmetic vehicles. Handbook of CosmeticScience and Technology. A. O. Barel, M. Paye and H. I. Maibach.New York, Marcel Dekker, Inc.: 145–171.
Burckbuchler V,Mekhloufi G, Giteau AP, Grossiord JL, Huille S, AgnelyF (2010) Rheological and syringeability properties of highly con-centrated human polyclonal immunoglobulin solutions. Eur J PharmBiopharm 76(3):351–356
Cartas-Ayala M, Karnik R (2013) Time limitations and geometrical pa-rameters in the design of microfluidic comparators. MicrofluidNanofluid 17(2):359–373
de Carvalho MJS, Seidl PR, Belchior CRP, Sodre JR (2010) Lubricantviscosity and viscosity improver additive effects on diesel fuel econ-omy. Tribol Int 43(12):2298–2302
Dörr A, Sadiki A, Mehdizadeh A (2013) A discrete model for the appar-ent viscosity of polydisperse suspensions including maximum pack-ing fraction. Journal of Rheology (1978-present) 57(3):743–765
Finlayson-Pitts BJ, Wingen LM, Sumner AL, Syomin D, Ramazan KA(2003) The heterogeneous hydrolysis of NO2 in laboratory systemsand in outdoor and indoor atmospheres: an integrated mechanism.Phys Chem Chem Phys 5(2):223–242
Galambos P, Forster F (1998) An Optical Microfluidic Viscosmeter.ASME Int. Mech.Eng.Cong.&Exp 66:187–191
Galindo-Rosales FJ, Alves MA, Oliveira MSN (2013) Microdevices forextensional rheometry of low viscosity elastic liquids: a review.Microfluid Nanofluid 14:1–19
Genovese DB, Lozano JE, RaoMA (2007) The rheology of colloidal andNoncolloidal food dispersions. J Food Sci 72(2):R11–R20
Gervais T, El-Ali J, Gunther A, Jensen KF (2006) Flow-induced defor-mation of shallow microfluidic channels. Lab Chip 6(4):500–507
Goswami S, Wang W, Arakawa T, Ohtake S (2013) Developments andchallenges for mAb-based therapeutics. Antibodies 2:452–500
Guillot P, Colin A (2014) Determination of the flow curve of complexfluids using the Rabinowitsch- Mooney equation in sensorlessmicrorheometer. Microfluid. Nanofluid. 17:605–611
Guillot P, Pascal P, Salmo JB,Mathieu B, Colin A (2006) Viscosimeter ona microfluidic chip. Langmuir 22:6438–6445
Han Z, Tang X, Zheng B (2007) A PDMS viscometer for microliterNewtonian fluid. J Micromech Microeng 17(9):1828–1834
Hudson SD, Sarangapani P, Pathak JA, Migler KB (2015) A microlitercapillary rheometer for characterization of protein solutions. JPharm Sci 104(2):678–685
Hurth C, Klein K, van Nimwegen L, Korn R, Vijayaraghavan K,Zenhausern F (2011) Clinical diagnostic of pleural effusions usinga high-speed viscosity measurement method. J Appl Phys 110(3)
Ikeda S, Nishinari K (2000) Intermolecular forces in bovine serum albu-min solutions exhibiting solid-like mechanical behaviors.Biomacromolecules 1(4):757–763
Kontopoulou M (2011) Applied polymer rheology:polymeric fluids withindustrial applications. Wiley, New York
Krieger IM, Dougherty TJ (1959) A mechanism for non-Newtonian flowin suspensions of rigid spheres. Transactions of The Society ofRheology (1957–1977) 3(1):137–152
Lee J, Tripathi A (2005) Intrinsic viscosity of polymers and biopolymersmeasured by microchip. Anal Chem 77(22):7137–7147
Livak-Dahl E, Lee J, BurnsMA (2013) Nanoliter droplet viscometer withadditive free operation. Lab Chip 13(2):297–301
Macosko CW (1994) Rheology: principles, measurements and applica-tions. Wiley-VCH, New York
Mewis J, Wagner NJ (2012) Colloidal suspension rheology. CambridgeUniversity Press, Cambridge
Mueller S, Llewellin E, Mader H (2009) The rheology of suspensions ofsolid particles. Proceedings of the Royal Society of. London A,Mathematical, Physical and Engineering Sciences, The RoyalSociety
Pan, L. and P. E. Arratia (2012). A high-shear, low Reynolds numbermicrofluidic rheometer. Microfluidics and Nanofluidics(1613–4982).
Peters T (1996) All about albumin: biochemistry, genetics, and medicalapplications. Academic Press, San Diego
Rheol Acta
Pipe CJ,Majmudar TS,McKinley GH (2008) High shear rate viscometry.Rheol Acta 47:621–642
Purwar S, Lim JK, Mauger JW, Howard SA (1988) Measuring viscosityof pharmaceutical and cosmetic semisolids using normal stress. JSoc Cosmet Chem 39(4):241–258
Rao MA (2007) Rheology of fluid and semisolid foods: principles andapplications. Springer, New York
Santoyo E, Santoyo-Gutierrez S, Garcia A, Espinosa G, Moya SL (2001)Rheological propertymeasurement of drilling fluids used in geother-mal wells. Appl Therm Eng 21:283–302
Sarangapani PS, Hudson SD, Jones RL, Douglas JF, Pathak JA (2015)Critical examination of the colloidal particle model of globular pro-teins. Biophys J 108(3):724–737
Sharma V, Jaishankar A, Wang YC, McKinley GH (2011) Rheology ofglobular proteins: apparent yield stress, high shear rate viscosity andinterfacial viscoelasticity of bovine serum albumin solutions. SoftMatter 7(11):5150–5160
Shire SJ, Shahrokh Z, Liu J (2004) Challenges in the development of highprotein concentration formulations. J Pharm Sci 93(6):1390–1402
Solomon D, Vanapalli S (2014) Multiplexed microfluidic viscometer forhigh-throughput complex fluid rheology. Microfluid Nanofluid16(4):677–690
Srivastava N, Davenport RD, Burns MA (2005) Nanoliter viscometer foranalyzing blood plasma and other liquid samples. Anal Chem 77:383–392
Tabbernor, A. (1988). Rheology of printing inks. The Printing InkManual. R. H. Leach, C. Armstrong, J. F. Brown et al. US,Springer: 666–698.
Vanapalli SA, Islam MT, Solomon MJ (2005) Scission-induced boundson maximum polymer drag reduction in turbulent flow. Physics ofFluids, 17(9):095108
Vanapalli SA, van den Ende D, Duits MHG, Mugele F (2007) Scaling ofinterface displacement in a microfluidic comparator. Appl Phys Lett90:114109
Vargaftik NB, Volkov BN, Voljak LD (1983) International tables of thesurface-tension of water. J Phys Chem Ref Data 12(3):817–820
Xia YN, Whitesides GM (1998) Soft lithography. Angewandte Chemie-International Edition 37(5):551–575
Yu GR, Zhao DC, Wen L, Yang SD, Chen XC (2012) Viscosity of ionicliquids: database, observation, and quantitative structure-propertyrelationship analysis. AICHE J 58(9):2885–2899
Rheol Acta