Embed Size (px)
Citation preview
UNIVERSIDAD CARLOS III DE MADRID
DEPARTAMENTO DE INGENIERÍA TELEMÁTICA
TESIS DOCTORAL
A STRESS-AWARENESS APPROACH TO SAFER DECISION MAKING IN THE TRADING PROCESS
INTEGRATING BIOMETRIC SENSOR TECHNOLOGY
Autor: Javier Martínez Fernández Ingeniero de Informática
Directores: Natividad Martínez Madrid
Doctora Ingeniera de Telecomunicación Ralf Seepold Doctor en Ingeniería Informática Tutor estancia: Juan Carlos Augusto
Doctor en Ciencias de la Computación
Leganés, Madrid, Septiembre de 2011

II

III
Tribunal nombrado por el Mgfco. y Excmo. Sr. Rector de la Universidad Carlos III de Madrid, el día __ de ______________de _____.
Presidente
Vocal
Vocal
Vocal
Secretario Realizado el acto de defensa y lectura de la Tesis el día de ___ de ___________
de _____en __________________. Calificación:
EL PRESIDENTE EL SECRETARIO LOS VOCALES

IV

V
A mis padres.

VI

VII
El tiempo es el mejor maestro…lo malo es que
mata a todos sus alumnos.
Anónimo.

VIII

IX
Agradecimientos
Siempre he pensado que con el grado de motivación necesario, y poniendo pasión y dedicación en aquello que emprendes, consigues llegar a buen puerto. Estaba equivocado. Se necesita un ingrediente más: Algo de suerte.
Y en la suerte entrarían grandes y pequeños detalles, pero yo desde luego quiero destacar uno por encima de todos. Que en tu vida se crucen personas que te ayuden en tu camino.
Yo soy un tipo con mucha suerte…y prueba de ello, son estas personas:
Nati y Ralf: Admiro vuestra valía profesional y vuestra dedicación. Pero si algo realmente me sobrepasa es la talla humana de la que disponéis. Desde el día que entré a trabajar con vosotros no habéis dejado de apostar por mí, en todos los sentidos. Hoy en día, si cabe habéis doblado o triplicado la apuesta. Realmente no se cuantas horas habéis pasado guiándome, haciéndome comentarios, corrigiendo y supervisando no se cuantas versiones de esta tesis. La finalización de esta etapa y este libro como máximo exponente espero que al menos compense un poco todo el esfuerzo y tiempo que a día de hoy seguís poniendo. Obst!, se me olvidaba lo más sencillo: Vielen Dank!
Juan Carlos: Me ofreciste la oportunidad de ir a Belfast sin apenas conocerme y una vez allí, encauzaste mi trabajo en determinados puntos donde yo me dispersaba. Impresionado me dejó la paciencia infinita que tuviste con mi inglés. Nunca dejaste de orientarme, siempre con objetividad. Sin tu soporte no imagino como hubiera hecho gran parte de esta tesis. Puedes contar con mi ayuda cuando lo necesites, y aun así, siempre estaré en deuda contigo.
Mis padres: Hay muchos tipos de educación, entiendo que en cada familia hay una distinta. Ahora con 35 años y algo de experiencia en el bolsillo, sigo pensando que de alguna forma los 3 somos indivisibles. El equilibrio ético que construisteis en mi me ayuda a superar cualquier circunstancia en mi vida, y esta tesis no ha sido una excepción. Esté donde esté, no hay día que no estéis. Os quiero.
“M ”….no empiezo porque no acabaría. Has estado, estás y estarás. Es un pacto sin firmar.
Mi abuela Elisa: Gracias por no haberme matado de pequeño cuando me lo merecía. Que estés orgullosa de mi, me da muchas más fuerzas que a ti la garrota. Según escribo estoy pensando en….¿Me podrías hacer un flan?...
Cari: Siempre has mantenido tu palabra, da igual en que aspecto, siempre lo has hecho. Pensaste que este libro llegaría, y seguramente cuando lo leas, porque sé que lo vas a leer, me preguntaras algo con unas ganas de conocimiento tremendas. Siempre aprendo algo de nuestras conversaciones, y lo que aprendo de ti….queda.

X
Fionnuala: Probably, I am going to make some kind of mistake writing this text in English, and for sure, you going to tell me: “Javier, it is fine, your English is good” and then, I am going to tell you: “Fine or bad, the improvement of my English is because of you”. Are you familiar with this dialogue? Thank you very much for your help. Between your book and my PhD no much time was left for other things…so now that they are finished…fancy a chat without focusing on the “PhD” theme?
Giuseppe: Un día fui a imprimir y tú me ayudaste, y entonces al día siguiente me ayudaste con algo que no sabía si era correcto en inglés. Al día siguiente me ayudaste a buscar unos libros técnicos y dijiste…vente y comemos…y entonces me seguiste ayudando…y…ah! sí, te acabo de escribir un mail pidiéndote un favorcillo. Desde luego, con amigos como yo… ¿para qué quieres enemigos? Te debo tantas, que más vale que empieces ya a cobrártelas, aunque claro…eso no lo haría Superman.
Blanca: Un minuto a veces puede ser suficiente para cambiar todo un día. Yo lo llamo minuto de oro. Tú me das muchos. Si en algo eres más terca que yo, es en hacerme creer en las cosas de las que soy capaz cuando realmente no veo el fin, y todo eso…en un minuto. Aunque claro…mejor que no tengas un martillo a mano.
Alfonso: Todo aquello que me enseñaste, todo, lo he tenido que poner en práctica y he pensado…vaya…mi jefe tenía razón. Siempre me has animado a seguir adelante y tu confianza en mi ha sido inquebrantable. Eso da mucha fuerza. Y cada vez que hablamos me siento un poquito más fuerte…aunque siga bebiendo zumitos.
A todas las personas que me han ayudado y animado directa o indirectamente de una manera desinteresada a realizar esta tesis.
Y a todos aquellos que hoy no están aquí, pero están allí, quizás dándome más fuerza de la que yo mismo soy consciente.
Muchas gracias a todos. Lo hemos conseguido.
Javi
XI
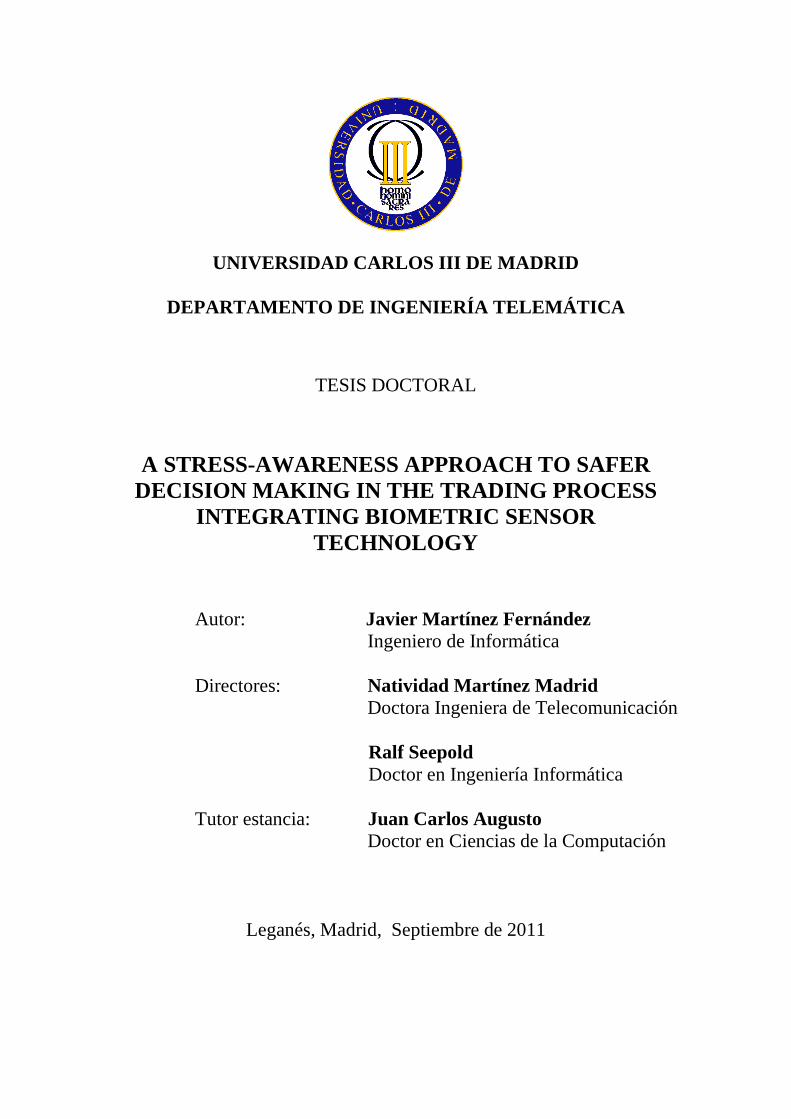
Resumen
La economía mundial ha llegado a tener una importancia fundamental y un claro impacto en nuestro día a día. Los traders, trabajadores de los mercados financieros, trabajan bajo estadísticas, análisis de compañías, noticias y muchos otros factores que influyen en la economía global en tiempo real. Además de tomar continuamente decisiones de riesgo, los traders también son influidos por sus propias emociones, llegando a atravesar momentos realmente estresantes. El trading es una de las profesiones más estresantes reconocidas mundialmente. Esta tesis aúna conocimientos sobre los efectos del estrés y sobre sensores como componente tecnológico, revisando, comparando y resaltando estudios relevantes y productos disponibles en el ámbito comercial. Este trabajo es utilizado para desarrollar un sistema que, usando la tecnología de sensores biométricos, puede ayudar a los traders a evitar que la toma de decisiones sea condicionada por el estrés durante el proceso de trading. Múltiples disciplinas, desde programas basados en inteligencia artificial hasta complejas funciones matemáticas, son usadas para ayudar a los traders en su esfuerzo por maximizar los beneficios. El problema es que hay un componente esencial que aún no es considerado como es la peligrosa influencia del estrés en la toma de decisiones de los traders, en este rápido entorno evolutivo que es el mercado financiero. Esta tesis toma en consideración la negativa influencia del estrés sobre los individuos y propone un sistema diseñado bajo una nueva arquitectura (Self-Aware Architecture) con base en la definición de unos principios biométricos para trading, proveyendo a los traders de la información necesaria para que sean conscientes en tiempo real de sus propios niveles de estrés, evitando de esta manera una toma de decisiones arriesgada por el propio estado del trader. El sistema ha sido diseñado considerando aspectos tecnológicos y psicológicos para mostrar esta información de la manera adecuada. Sensores biométricos son usados para reunir los datos necesarios para mostrar la información al trader. El sistema resultante es capaz de funcionar en traders individuales y en equipos de traders, ofreciendo en este último caso el nivel predominante de estrés colectivo. El sistema ha sido probado dentro de un entorno real y los resultados obtenidos son mostrados en esta tesis mostrando la evidencia de que un trader consciente de sus propios niveles de estrés puede mejorar su promedio de beneficios reduciendo el riesgo en su continua toma de decisiones.

XII
XIII
Abstract
The role of the global economy is fundamentally important to our daily lives. The stock markets reflect the state of the economy on a daily basis. Traders are the workers within the stock markets who deal with numbers, statistics, company analysis, news and many other factors that influence the economy in real time. However, whilst making significant decisions within their workplace, traders must also deal with their own emotions. In fact, traders have one of the most stressful professional occupations. This work studies the current knowledge about stress effects and sensor technology by reviewing, comparing, and highlighting relevant existing research and commercial products that are available on the market. This study is made in order to design a system using sensor technology that supports traders to avoid the poor decision making during the trading process. Multiple disciplines, from programs with artificial intelligence to complex mathematical functions, are used to help traders in their effort to maximize profits. However, an essential problem yet not considered in this rapidly evolving environment is that traders are not supported to adequately manage how stress influences their decisions. This work takes into consideration the negative influences of stress on individuals and proposes a system designed to support traders by providing them with information that can reduce the likelihood of poor decision making. Traders are not aware of how their stress levels jeopardize safe decision making. This work, taking into consideration the known influences of stress on biometric changes, proposes a system, based in biometric principles for trading context, designed to cover this information gap and minimize the likelihood of poor decision making. The system has been designed bearing in mind both technical and physiological aspects to show the information in a suitable way. Biometric sensors are used to collect data associated with stress and a software platform based on a new architecture (Self-Aware architecture) has been developed to collect, analyse and display this information. This architecture is derived from a general model where the trading context will be a specific context fitting in the more general model to take advantage of the architecture in other stressful areas. The resulting system is capable of efficiently providing self-aware information for individual traders and self-aware collective information for teams of traders in trading companies. The system is tested in a real environment and the results provide evidence that self-aware traders could positively improve their daily final balance and diminish risky decision making.

XIV
XV
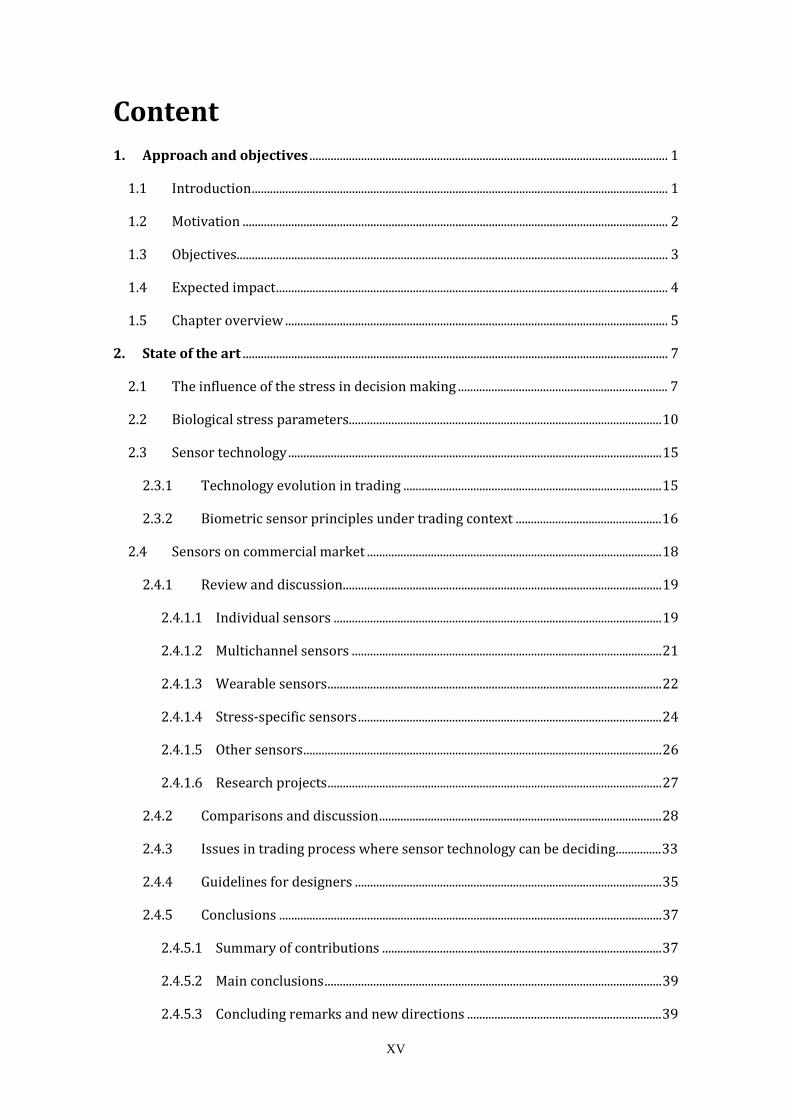
Content
1. Approach and objectives ...................................................................................................................... 1
1.1 Introduction ......................................................................................................................................... 1
1.2 Motivation ............................................................................................................................................ 2
1.3 Objectives.............................................................................................................................................. 3
1.4 Expected impact ................................................................................................................................. 4
1.5 Chapter overview .............................................................................................................................. 5
2. State of the art ............................................................................................................................................ 7
2.1 The influence of the stress in decision making ..................................................................... 7
2.2 Biological stress parameters....................................................................................................... 10
2.3 Sensor technology ........................................................................................................................... 15
2.3.1 Technology evolution in trading ..................................................................................... 15
2.3.2 Biometric sensor principles under trading context ................................................ 16
2.4 Sensors on commercial market ................................................................................................. 18
2.4.1 Review and discussion ......................................................................................................... 19
2.4.1.1 Individual sensors ............................................................................................................ 19
2.4.1.2 Multichannel sensors ...................................................................................................... 21
2.4.1.3 Wearable sensors .............................................................................................................. 22
2.4.1.4 Stress-specific sensors .................................................................................................... 24
2.4.1.5 Other sensors ...................................................................................................................... 26
2.4.1.6 Research projects .............................................................................................................. 27
2.4.2 Comparisons and discussion ............................................................................................. 28
2.4.3 Issues in trading process where sensor technology can be deciding ............... 33
2.4.4 Guidelines for designers ..................................................................................................... 35
2.4.5 Conclusions .............................................................................................................................. 37
2.4.5.1 Summary of contributions ............................................................................................ 37
2.4.5.2 Main conclusions ............................................................................................................... 39
2.4.5.3 Concluding remarks and new directions ................................................................ 39
XVI
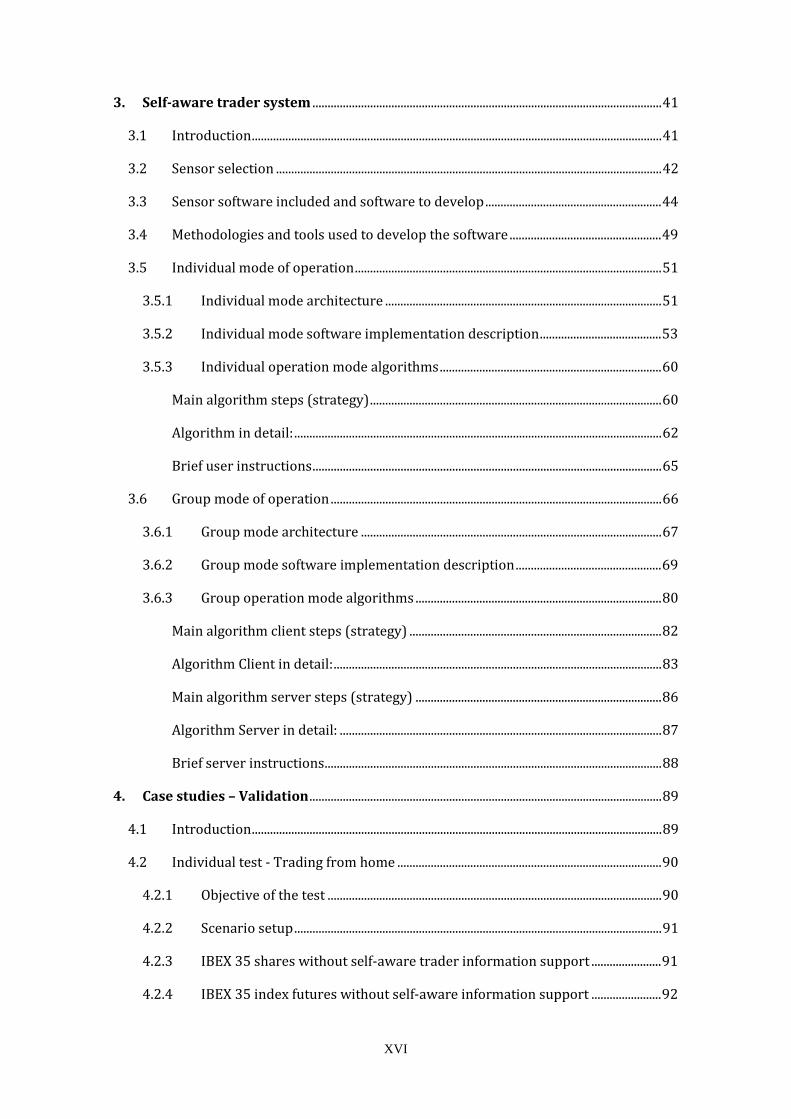
3. Self-aware trader system ................................................................................................................... 41
3.1 Introduction ....................................................................................................................................... 41
3.2 Sensor selection ............................................................................................................................... 42
3.3 Sensor software included and software to develop .......................................................... 44
3.4 Methodologies and tools used to develop the software .................................................. 49
3.5 Individual mode of operation ..................................................................................................... 51
3.5.1 Individual mode architecture ........................................................................................... 51
3.5.2 Individual mode software implementation description ........................................ 53
3.5.3 Individual operation mode algorithms ......................................................................... 60
Main algorithm steps (strategy) ................................................................................................ 60
Algorithm in detail: ......................................................................................................................... 62
Brief user instructions ................................................................................................................... 65
3.6 Group mode of operation ............................................................................................................. 66
3.6.1 Group mode architecture ................................................................................................... 67
3.6.2 Group mode software implementation description ................................................ 69
3.6.3 Group operation mode algorithms ................................................................................. 80
Main algorithm client steps (strategy) ................................................................................... 82
Algorithm Client in detail: ............................................................................................................ 83
Main algorithm server steps (strategy) ................................................................................. 86
Algorithm Server in detail: .......................................................................................................... 87
Brief server instructions ............................................................................................................... 88
4. Case studies – Validation .................................................................................................................... 89
4.1 Introduction ....................................................................................................................................... 89
4.2 Individual test - Trading from home ....................................................................................... 90
4.2.1 Objective of the test .............................................................................................................. 90
4.2.2 Scenario setup ......................................................................................................................... 91
4.2.3 IBEX 35 shares without self-aware trader information support ....................... 91
4.2.4 IBEX 35 index futures without self-aware information support ....................... 92
XVII
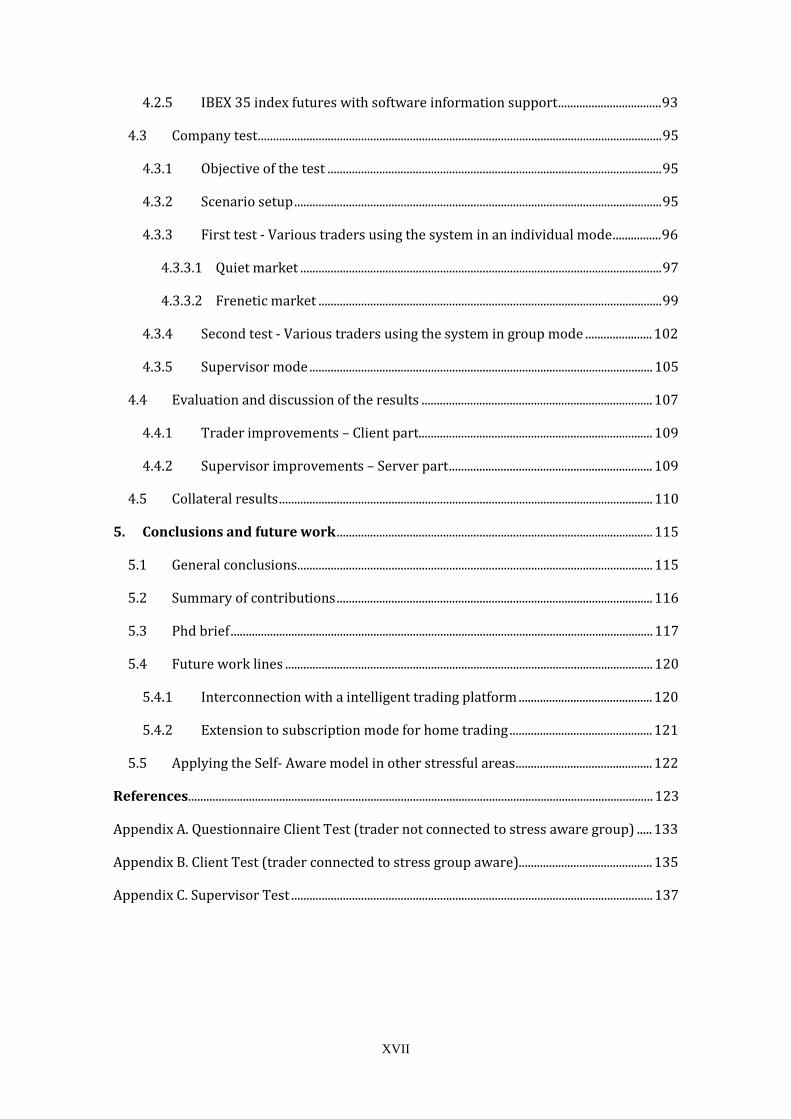
4.2.5 IBEX 35 index futures with software information support .................................. 93
4.3 Company test ..................................................................................................................................... 95
4.3.1 Objective of the test .............................................................................................................. 95
4.3.2 Scenario setup ......................................................................................................................... 95
4.3.3 First test - Various traders using the system in an individual mode ................ 96
4.3.3.1 Quiet market ....................................................................................................................... 97
4.3.3.2 Frenetic market ................................................................................................................. 99
4.3.4 Second test - Various traders using the system in group mode ...................... 102
4.3.5 Supervisor mode ................................................................................................................. 105
4.4 Evaluation and discussion of the results ............................................................................ 107
4.4.1 Trader improvements – Client part............................................................................. 109
4.4.2 Supervisor improvements – Server part ................................................................... 109
4.5 Collateral results ........................................................................................................................... 110
5. Conclusions and future work ........................................................................................................ 115
5.1 General conclusions ..................................................................................................................... 115
5.2 Summary of contributions ........................................................................................................ 116
5.3 Phd brief ........................................................................................................................................... 117
5.4 Future work lines ......................................................................................................................... 120
5.4.1 Interconnection with a intelligent trading platform ............................................ 120
5.4.2 Extension to subscription mode for home trading ............................................... 121
5.5 Applying the Self- Aware model in other stressful areas ............................................. 122
References ......................................................................................................................................................... 123
Appendix A. Questionnaire Client Test (trader not connected to stress aware group) ..... 133
Appendix B. Client Test (trader connected to stress group aware)............................................ 135
Appendix C. Supervisor Test ....................................................................................................................... 137
XVIII
Index of figures
Figure 2.1. Neuro-physiological elements involved in the human response to stress [53] . 10
Figure 2.2. Different heart rhythms (coherence and chaos) ............................................................. 13
Figure 2.3. Reuters 3000 Xtra trader information ................................................................................ 34
Figure 2.4. CMS Forex account information ............................................................................................. 34
Figure 3.1. Emwave Pc sensor and software (displaying heart rate and pulse wave) ........... 44
Figure 3.2. Emwave Data logging options ................................................................................................ 46
Figure 3.3. Flow of data between Emwave and Self Aware Trader System ............................... 47
Figure 3.4. Self-Aware Trader improvement to traditional trading decision making ........... 49
Figure 3.5. Mapping of Self-Aware individual architecture into trading context ..................... 52
Figure 3.6. Use case diagram for individual mode of operation ...................................................... 54
Figure 3.7. Sequence diagram for individual mode of operation .................................................... 59
Figure 3.8. Software Architecture diagram for individual mode .................................................... 60
Figure 3.9. Self-Aware trader algorithm running in a 5 seconds stress time window ........... 64
Figure 3.10. Flowchart for individual mode of operation .................................................................. 65
Figure 3.11. Mapping of Self-Aware group architecture into trading context. Client side ... 68
Figure 3.12. Mapping of Self-Aware group architecture into trading context. Server side . 69
Figure 3.13. Self-Aware Trader software individual and group mode. Client framework ... 70
Figure 3.14. Use case diagram for group mode of operation ............................................................ 72
Figure 3.15. Sequence diagram for group mode of operation. Client side .................................. 73
Figure 3.16. Sequence diagram for synchronization ........................................................................... 75
Figure 3.17. Sequence diagram for server processes .......................................................................... 76
Figure 3.18. Software Architecture Group mode ................................................................................... 77
Figure 3.19. Self-Aware Trader software. Server framework .......................................................... 80
Figure 4.1. Coherence score in session 1 .................................................................................................. 92
Figure 4.2. Coherence score in session 2 (a) and chart of IBEX-35 in session 2 (b) ............... 93
Figure 4.3. Coherence score in session 3 (a) chart of IBEX-35 in session 3 (b) ........................ 94
Figure 4.4. System test setup with Self-Aware Trader information system ............................... 96
XIX
Figure 4.5. Traders in quiet market ............................................................................................................ 97
Figure 4.6. Traders 1, 2 and 3 coherence graphics. Quiet market .................................................. 98
Figure 4.7. Traders 1, 2 and 3 coherence graphics. Frenetic market ......................................... 100
Figure 4.8. Traders in frenetic market .................................................................................................... 101
Figure 4.9. Traders in working in group mode .................................................................................... 103
Figure 4.10. Traders 1, 2 and 3 coherence graphics. Group mode. ............................................. 104
Figure 4.11. Data saved by server in dataBase .................................................................................... 105
Figure 4.12. Interface supervisor mode ................................................................................................. 106
Figure 4.13. Query last 5 minutes ............................................................................................................. 106
Figure 4.14. Coherence chart quiet market without technical analysis applied ................... 112
Figure 4.15.Coherence chart quiet market with technical analysis applied ........................... 112
Figure 4.16. Coherence chart frenetic market without technical analysis applied .............. 113
Figure 4.17. Coherence chart frenetic market with technical analysis applied ..................... 113
XX
Index of tables
Table 2.1. Biometric sensor principles to detect stress in trading context................................. 17
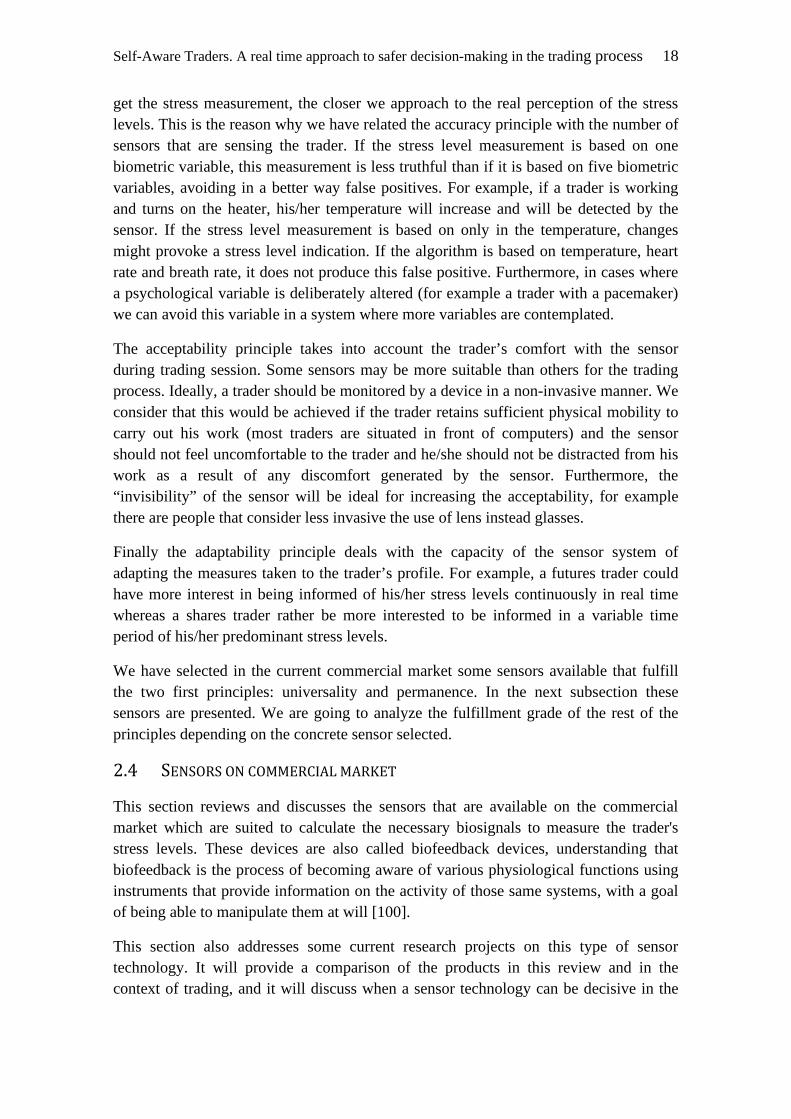
Table 2.2. Individual sensors ......................................................................................................................... 20
Table 2.3. Multichannel sensors for gathering data ............................................................................. 22
Table 2.4. Wearable sensors ........................................................................................................................... 23
Table 2.5. Stress-specific sensors ................................................................................................................. 25
Table 2.6. Other sensors ................................................................................................................................... 26
Table 2.7. Comparison of sensors ................................................................................................................ 32
Table 2.8. Recommended guidelines .......................................................................................................... 37
Table 4.1. Share trading. .................................................................................................................................. 91
Table 4.2. Future trading without support ............................................................................................... 93
Table 4.3. Future trading with support ..................................................................................................... 94
Table 4.4. Information example group test. Similitude and differences ...................................... 99
Table 4.5. Safer and riskier decision making periods ....................................................................... 101
Table 4.6. Information example group test. Period time ................................................................. 103


Chapter 1
1. APPROACH AND OBJECTIVES
En este capítulo se describe de forma general el contexto de la presente tesis doctoral. En primer lugar, se plantean las motivaciones que han dado lugar a la elaboración de la tesis, presentándose de forma concisa los objetivos de la misma. Posteriormente, se describen las principales contribuciones. Finalmente, se presenta la organización del resto de capítulos de este documento.
In this chapter, the context of this work is described in a general way. Firstly the motivations and the objectives to achieve are presented. After that the main contributions are explained and finally how the book is organized is shown.
1.1 INTRODUCTION
During the 1930's, Hans Sely, a medical student at the University of Prague, noted that a group of persons who suffered from different types of illnesses showed the following common symptoms: tiredness, loss of appetite, weight decrease and fatigue, amongst others. Mr Sely was the first to refer to the term “stress” in a biological context [1] including inappropriate physiological response to any kind of demand [2]. In his terminology, “stress refers to a condition and stressor to the stimulus causing it”. Currently, there are many definitions of stress. For McGrath [3] stress is the interaction between three elements: perceived demand, perceived ability to cope with the demand and the perception of the importance of being able to cope with the demand. According to Tepas and Price [4], stress is related to: adaptation, anxiety, arousal, burnout, coping, exertion, exhaustion, exposure, fatigue, hardiness, mental load, repetitiveness, strain, stressors, and tension. It is well known that stress is studied in many research fields such as psychology, computer vision, physiology, behavioural science, ergonomics and human factor engineering.
In the present days of widespread global financial crisis, stock market traders have a particularly stressful profession. This makes the decision making process in the stock market increasingly difficult. Stability within the stock markets is largely an illusion and stress is a common denominator amongst traders. Decision making is somehow safe as long as the environmental conditions do not affect the trader. Pharmaceutical drugs such as Bitalin, Adderall, Vicodin and Oxycontin are currently widely used by traders in Wall Street to avoid panic moments by controlling the emotions of traders [5]. Decision making in the trading process (transactions with shares and bonuses made by traders in financial markets) is a good example of an activity where risk management in real time is important. Besides, this activity increases stress levels. Stress has a significant impact in decision making because it can undermine our capability to make safe decisions.
Self-Aware Traders. A real time approach to safer decision-making in the trading process 2
Research on the influence of stress on decision making is not new. Kowalski et al [6] suggest that knowing decision making process under stress situations would help to understand how people decide in critical moments. Adya et al [7] demonstrate through some experiments that decision support systems can moderate psychological experiences in stressful situations.
There are several available tools to assist traders in their daily work: real time chart tools, analysis of the companies by economic experts and real time news. Furthermore, research has been carried out on the work of traders to assist them on a daily basis. Brown et al [8] propose an expert system for the trading process in commodities futures. Wolberg [9] uses kernel regression for modelling financial markets. Keng and Quek [10] use a neuro-fuzzy model and Zhang et al [11] test trading strategies for trading agents in artificial financial markets. Although all of this external information and indeed this research are positive and useful, nonetheless, trading inherently depends on good judgment exercised during real time decision making in the financial market. Crucially, no information is available to the trader about a major risk source in the decision making process: his/her own state-of-mind. The reader will see in this work that a trader who is aware of his/her own stress levels can make more effective and coherent decisions. Bad decision making by a trader under highly stressful situations can bring about catastrophic consequences, not only on his/her finances or for the company that he/she works for, but also on the psychological health of the trader [12]. Hence, it is in the trader’s interest to know if he/she is under stress, such that poor decisions may be avoided.
1.2 MOTIVATION
Increasing profit in the financial markets is one of the most researched and studied subjects [13]. The focus of most of these studies has been on creating systems to try to predict the movements of the financial markets and take advantage of those movements. However, the financial markets change on a daily basis and consequently, the systems that work today may not be effective in the future.
The latest systems that are being used in the market are the high-frequency trading systems. These systems are based on programs running on high-speed computers that analyze market data, using algorithms to take advantage of trading opportunities that may open up for only a fraction of a second to several hours. These previous attempts of widespread involvement of technology replacing humans have caused negative consequences. For example, The United States stock market crashed on May 6, 2010 (called flash crash [14]). On that day, the Dow Jones Industrial index had its largest intraday point loss and this was attributed to the use of high-frequency trading systems.
In this work we have developed a system (Self-Aware Trader) under the principle that the trader is the main actor in the role of the trading process and all systems are there to support the trader. As it has been previously found, the illusion of control prevents the trader from realizing that he/she is entering a phase of unsafe decision making.
3 Chapter 1.Introduction
It is currently possible to use the sensor technology available on the commercial market to measure the trader’s stress level in real time and this information can be fed back to him/her.
This work merges knowledge on stress effects and sensor technology by reviewing, comparing, and highlighting existing research and commercial products to establish how sensor technology can support traders providing information about their stress level and avoid bad decisions.
The Self-Aware Trader software blends technology and psychology to feed back to the trader this important information. Thanks to the system, the trader is supported in real time in order to allow a safer decision making.
Furthermore, the system has been extended into supporting a group of traders and it has been validated in an investment company environment. We consider that the perfect balance between a technological offer to help traders and an improved human decision making must help avoiding significant losses due to risky decisions. The completion of the test in a real environment, and the positive feedback obtained, supports this hypothesis.
1.3 OBJECTIVES
This work will present the Self-Aware Trader system with the main objective of supporting a safer trading process, encouraging less risky behavior that can potentially lead to bad decision making. This main objective is expanded in the following detailed objectives:
• State of the art study and related work: A necessary study of the areas where this work is related to will give us the necessary knowledge to execute the work for the Self-Aware Trader system.
• Identifying basic biometric principles in trading context: It is necessary to define basic biometric principles in order to get a successful integration of the necessary technology to assist traders in their daily work.
• Identifying issues in the trading process where sensor technology can be decisive: It is necessary that the system developed will be applicable to the trading context.
• Indentifying recommended guidelines for sensor designers: It is necessary to study the sensors commercial market and see how the available sensors fit in the trading context. After the study, it is necessary to introduce recommended guidelines to improve and allow a perfect integration of these devices in the trading process.
• Self-Aware system model deployment: Decision making under stress is a huge problem in many areas, not only trading. The objective is to try to build a
Self-Aware Traders. A real time approach to safer decision-making in the trading process 4
general model where the trading context will be a specific context fitting in this general model. This work would be useful to the other areas where stress in decision making is critical.
• Specific context trading architecture deployment: Once the general model is designed, we have to translate the specifications of the trading context to a suited architecture, always following the basic rules of the general model.
• To increase traders’ awareness of their own stress levels reducing the illusion of control. To achieve this objective two points are crucial:
1. To measure biometric data from a trader in real time through sensors to detect when good decision making may turn into risky decision making
2. To alert the trader in a way that it can increase effectiveness
• To extend the trader’s awareness concept to a group mode and use this information as a measure of the predominant state of the market in real time (advisor’s sentiment or market feeling).
• To get feedback about the system from traders in a real environment: It would be ideal to get the traders’ impressions on the system design. This allows an evaluation on the usefulness and impact of the system in their daily work.
1.4 EXPECTED IMPACT
The development of our proposed system will bring the following scientific/technological benefits:
• The development of a universal architecture that aims at improving decision making under stressful situations.
• The creation of the necessary services to facilitate the evaluation of risk during decision making under stressful situations in individual and collective modes.
• The creation of a solution that fosters good decision making by traders, reducing risk situations with benefits to the health and finances of the own trader/company.
• The monitoring of the vital signs of the trader with sensors to determine a shifting pattern where stress starts to have a considerable adverse effect in traders’ decision making
• The creation of a solution to evaluate the trader’s experiences linked to the risk of the trading process for each trader.
• To facilitate the management tasks of a traders’ team supervisor.
This work will also produce interesting outcomes in the form of knowledge transfer:
5 Chapter 1.Introduction
• Increasing awareness on the interaction between stress and risks in trading.
• A tool that traders can use to decrease bad decision making, which as a result will have a positive impact in the market.
These benefits will be checked through the results obtained in the experiments. These experiments were made in a real environment with real traders. In this way, we can not only get the feedback on this work, but we can also capture important comments for future work.
1.5 CHAPTER OVERVIEW
The content of this book is organized in chapters as follows:
Chapter 2: The state of the art is presented in this chapter. The stress influence in the decision making and the alterations suffered in the human body are described. Some basic biometric principles are defined for the trading context. Sensors capable of measuring these alterations available in the commercial market and its relationship to this work are shown. A comparison and a discussion of these sensors close the chapter.
Chapter 3: The system developed and implemented in this work is presented. All the models and architectures used are explained starting with the sensor selection. In the same way, the modes of operation of the system (individual and group) are shown and a description about the software implementation is given.
Chapter 4: The tests performed during this work and the results extracted are presented in detail: Trading from a home office (individual mode) and in a company (group mode).
Chapter 5: The conclusions obtained during the work are presented. Some possible future work lines and improvements to the current model are commented.
References: All the citations in this book can be found in this section.
Appendix: This section adds some extra documentation to this book, in concrete three questionnaires filled in by the traders in the company are included. The information contained in this section is organized as follows:
• Appendix A: Questionnaire Client Test (trader not connected to stress aware group).
• Appendix B: Client Test (trader connected to stress group aware).
• Appendix C: Supervisor Test.

Self-Aware Traders. A real time approach to safer decision-making in the trading process 6
Chapter 2
2. STATE OF THE ART
En este capítulo se realiza un estudio sobre las tecnologías más importantes relacionadas con las contribuciones propuestas en esta tesis doctoral. En primer lugar, se presentan los conceptos más importantes relacionados con la influencia del stress en la toma de decisiones (apartado 2.1), así como su repercusión biométrica en el cuerpo humano (apartado 2.2), haciendo especial énfasis en aquellos aspectos medibles con sensores, siendo estos necesarios durante la realización de la presente tesis doctoral. Seguidamente, en el apartado 2.3, se proponen unos principios biométricos para ser contemplados en el contexto de trading a la hora de elegir sensores. Además se presenta el estado del arte de aquellos sensores disponibles en el mercado. Finalmente, en el último apartado se realiza un análisis de los sensores expuestos relacionados íntimamente con el ámbito de la presente tesis. In this chapter, a study over the most important technologies related with this work is presented. Firstly the main concepts about stress in decision making (subsection 2.1) and its biometric impact (subsection 2.2) are described. The biometric variables that are possible to measure with sensor support are highlighted. After that, in subsection 2.3 some fundamental biometric principles are proposed for a better selection of sensors in the trading context. Moreover, the sensors related to this work available in the commercial market are shown. Finally, a detailed analysis and comparison of the described sensors is presented.
2.1 THE INFLUENCE OF THE STRESS IN DECISION MAKING
Traders continuously require good judgment in order to make good decisions in real time. In fact, judgment and decision making are the principal skills of traders. However, judgment and decision making are different processes, have different outcomes, and investigators differ in the characterization of these two concepts. It can be argued that decision making is the result of judgment, in other words, an action-based response.
Connelly et al. provide models of decision making [15] whilst others research have characterized its role in information processing ([16], [17]) and as part of the larger cognitive architecture ([18], [19]). Regardless of how these two elements are ultimately defined, they are considered by most to be related and interconnected. It is clear that judgment and decision making are altered under stress conditions. The question as to precisely which elements are degraded and in what ways is less clear and is a much more complex issue. It has already been argued that stress can lead to hyper vigilance, a state of disorganized and somewhat haphazard intentional processing. Janis and Mann [20] were the first researchers to formalize these observations under their decision-conflict theory. According to this theory, hyper vigilance results in a frantic search, rapid attention shifting, and a reduction in the number and quality of alternative options
Self-Aware Traders. A real time approach to safer decision-making in the trading process 8
considered. Ultimately, this state leads to degraded judgment and decision making. Several investigations have lent support to this theory. Janis, Defares, and Grossman [21] found this to be true for some decision making tasks made under the stress of perceived threat. Keinan [22] also reported similar findings. Cognitive resource theory (Vecchio, [23]) confirms that stress can negatively impact on intelligence and decision quality.
The wider theory is that when a person is under stress, he/she takes into consideration fewer alternatives when searching for a solution to a problem [24]. Selten et al. [25] explain that when we have to make decisions, we use a toolbox of strategies and we apply the strategy with the most adaptive heuristic available. Adaptive heuristics [26] are simple behavioral rules that are directed towards payoff improvement but may be less than fully rational. One of the best-known heuristic is “Take the Best” (TTB). In TTB, the person chooses between two alternatives, and predicts which of the two will have the higher value with regard to some currently relevant criterion. To do this, alternatives are compared with regard to their values on cues, or attributes that they both share. The most valid cue is the first to be attended to “Validity” denotes the “de facto” correlation of a cue with the criterion of interest as G. Gigerenzer et al. reported [27]. If that cue discriminates between the two, the alternative it favors is chosen and no further information is needed. If it doesn’t, the second-most valid cue is used, etc. As a consequence, TTB bases its final decision only on the most valid cue that is the first to discriminate between the alternatives: “Take the Best (cue) and ignore the rest” according to G. Gigerenzcer et al. Broder ([28], [29]) confirms how TTB strategy works with traders in an artificial stock market where subjects tended to expand their strategy when the cost of gathering the additional information was perceived as low; however, in situations where the cost is high, they tended towards the TTB strategy.
Stressed decision makers usually demonstrate impaired performance [30] and generate fewer alternatives in the decision process because these alternatives appear less attractive under conditions of stress [31]. Furthermore, decision making for traders is in real time and the time impact factor is also crucial in stress levels because the search for alternatives is truncated by the time limitation ([32], [33]). In this regard, Baradell and Klein [34] reported that stress is perceived as time pressure and lowers self-esteem. Furthermore, the subject is more likely to consider that if he/she makes the wrong decisions, this will be perceived by others as poor performance and will lead to negative consequences. In particular, it can lead to the subject making more errors in cognitive tasks, using stereotypes when making judgments, and a having a greater tendency to ignore situational norms when reaching decisions.
Research on group settings shows how the quality of group decisions declines under stressful conditions due to time pressure [35].
The decision making of traders not only suffers from the negative influence of the time limitation. The decisions are in cascade and there is evidence that individuals tend to rely on previous responses regardless of previous response success [36]. It is for this
9 Chapter 2. State of the Art
reason that when a trader loses in one decision, this can negatively affect the next decision. Fatigue is another stress-related factor [37] to be taken into account. Soetens, Hueting, and Wauters found that fatigue degraded the decision making process [38].
We cannot forget that traders, like any other persons, are affected by their own life and emotions. According to Lazarus [39] where there is stress, there are also emotions. He considers that the separation of these fields is an absurdity given their strong interdependence. There is no known research prior to the 1990s on the nexus between emotions and decision making. In 1998 Ledoux [40] considered the influence of emotions in decision making. Further research ([41], [42]) show that affective states are an important neurological regulator of the relationships between humans and their environment and that normal behaviour is greatly disturbed in the absence of such regulators. Individuals with impaired emotional processing show an inability to observe socials conventions, a tendency to take actions adverse to their own well-being that lead to financial or interpersonal losses, and repeated engagement in disadvantageous actions showing disregard to previous mistakes. Pixley argues that the intrinsic uncertainty associated with financial markets makes emotions such as confidence and trust an unavoidable element in corporative decision making [43]. Similarly, Mercer [44] provides examples of how emotions might be useful in formulating better explanations of rationality in the context of allegiance formation, justice, and strategic choice. He states that cognition, in addition to emotions, can lead to errors of judgment. Dreisbach et al [45] conclude that positive emotions increase flexibility in decision making, create a shift in heuristic use, and enhance the activation of remote associations from memory. However, negative emotions have negative influence [46] on the decision making process.
One factor common to all stressful situations and in particular to traders, is the relationship between stress and the professional experience. Studies ([47], [48]) show how stress tends to have a more negative impact on less-experienced professionals. Professionals with more experience can multi-task more effectively than those with less experience. Therefore, the quality of decision making depends on the experience level of the subject [49]. This is easily understandable with the Klein experiment where he observed the decision making process of fire ground commanders. He determined that people with experience follow systematic and sequential strategies recognizing patterns while people without experience need to process additional new information [50].
As a summary from the different relevant literature sources reviewed, the reader will note that decision making has frequently been studied under simulation or laboratory environments. It is likely that the complexity of judgment and decision making forces this type of approach. But more restrictive approaches in real-world-like environments are highly desirable, in order to augment the study of decision making under naturalistic settings.
It can be deduced from the research referred to above that decision making is degraded under stressful conditions. It is highly important to detect the moment in which the
Self-Aware Traders. A real time approach to safer decision-making in the trading process 10
trader becomes stressed to avoid possible errors during the decision making process. The problem is that, when the trader is under stress, he/she may neither be aware of being under stress nor of all of the effects of stress on the decision making process. Stress levels can be deduced not only from the environment but also from biometric data taken from the trader. Section 2.2 will first study how physiological parameters reflect stress and subsection 2.3 will show how sensors can measure these parameters.
2.2 BIOLOGICAL STRESS PARAMETERS
There are many studies about the biological effects of stress. Some biological signals are easier to measure than others, therefore our objective is to find representative signals that are easy to measure with sensors which are available on the market. Nevertheless, we present several relevant variables that are essentially related with stress levels, even though currently there are no suitable non-invasive sensors to measure in real time some of these variables.
The stress and cognitive processing literature include: neuro-anatomical structures, subcortical and cortical functions, biochemical influences, and pharmacological effects on cognitive performance whilst under stress. The most commonly examined systems are those considered being neuro-endocrine-based and they include the pituitary-adrenocortical, adrenomedullary, and the sympathoneural systems. The relevant studies are commented in the following:
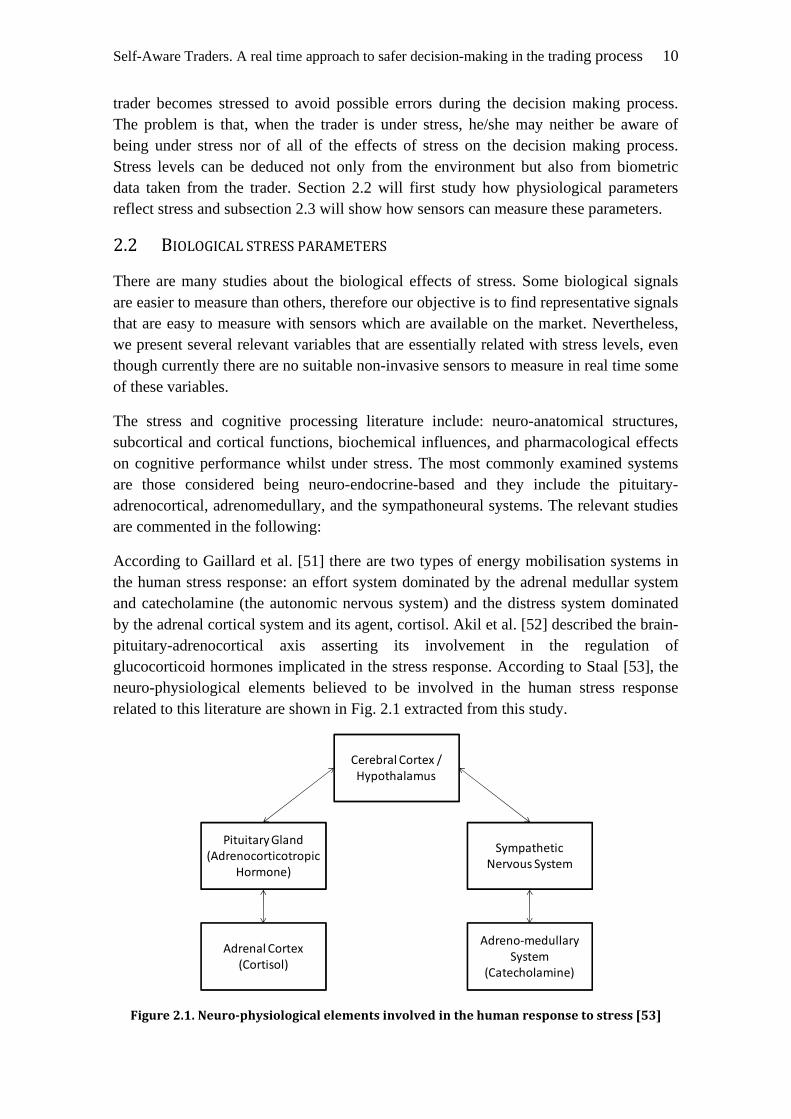
According to Gaillard et al. [51] there are two types of energy mobilisation systems in the human stress response: an effort system dominated by the adrenal medullar system and catecholamine (the autonomic nervous system) and the distress system dominated by the adrenal cortical system and its agent, cortisol. Akil et al. [52] described the brain-pituitary-adrenocortical axis asserting its involvement in the regulation of glucocorticoid hormones implicated in the stress response. According to Staal [53], the neuro-physiological elements believed to be involved in the human stress response related to this literature are shown in Fig. 2.1 extracted from this study.
Cerebral Cortex /
Hypothalamus
Sympathetic
Nervous System
Pituitary Gland
(Adrenocorticotropic
Hormone)
Adreno-medullary
System
(Catecholamine)
Adrenal Cortex
(Cortisol)
Figure 2.1. Neuro-physiological elements involved in the human response to stress [53]
11 Chapter 2. State of the Art
Cannon most likely identified the first human response to stress [54]. He established the relationship between the adrenaline level rise in stressful situations and the drop in adrenaline in a controlled situation. Many studies indicate that the endocrine system changes are high in relation to the stress level [55]. This theory has been substantiated by Coates and Herbert et al. [56] showing in one experiment that cortisol level changed for London traders during risky market operations.
The purpose of that article was to clarify the role of the endocrine system changes when risks are taken in the financial market. The study focuses on a group of male traders in the City of London and steroid hormones. Testosterone and UFC (urine free cortisol), known catalysts for cognitive responses and behavioural changes, were the subject of measurement and study. It was intended to measure changes in the levels of both steroids, the influence on them of the events that traders face up in their daily working life and the effect caused on the norms of behaviour and on the decision making process. However, by focusing on testosterone, this article is not entirely satisfactory. Testosterone is a predominantly male hormone (also produced by women although at lower levels) but cortisol levels do not differ according to the sex of the subject. Cortisol is produced by the adrenal glands and plays a central role in the behavioural and physiological response to physical or psychological stress. When a stressful situation arises, hormone levels increase and they return to normal after the actual emergency. The problem emerges when stress is prolonged (for example, a persistent fall in the stock market). In this case, cortisol levels in the blood are fired up, altering the performance and cognitive interpretation, amongst other physiological disorders that result in a distortion of sensory perception. The experiment took place over around eight days and was conducted on the work premises of a broker. The levels of these hormones were measured whilst operators performed their daily work. They found that the daily testosterone levels were significantly higher than the daily average of the previous month on days when the trader made profits. In the case of cortisol, there was no relationship between the loss and increased levels of this steroid. The researchers considered if there was any correlation between their levels and the risk and it was found that the higher volatility (standard deviation of change in the value of a financial instrument with a specific time horizon) of the daily trader’s profits and losses, the highest daily levels of cortisol and the standard deviation of those levels. This suggests that the individual levels of cortisol are not related to the rate of economic return, such as testosterone, but are related to the variable nature of the returns. If testosterone is responsible for competitive fighting, it peaks after adolescence and the levels of testosterone remain stable for 15 or 20 years thereafter, thus, the explosive combination of youth and capital management must be taken into account. Cortisol is a good stress indicator, and it has been tested in other contexts (air traffic controllers [57], flights pilots [58] and in other studies [59]). However, usually cortisol is not measured in real time and it is usually measured by obtaining samples of saliva from the subject. Consequently, this parameter is not suitable for measuring the stress levels of traders in real time.
Self-Aware Traders. A real time approach to safer decision-making in the trading process 12
Victor Johnston [60], following a different hormonal study, claims that the hands are testimony of the hormonal flow in the foetal stage and that this can be calculated through the measurement of the index and ring fingers; it is possible to have an indicator of exposure to foetal testosterone. Increased exposure is reflected if the ring finger is longer than the index finger. The conclusion that he attempts to provide, without experimental support, is to exclude advisors with a ring finger longer than index finger (because of its negative implications on controlling panic or euphoria) and to rely more on the minor asymmetry finger present, especially if their financial intermediary is continually abusing of the intuition.
With all these related studies about hormones, our behaviour can vary depending on certain hormonal levels, but in relation to hormonal changes, the current technologies do not offer the support necessary to measure them in real time, and in the case of the trader, real time information is crucial.
Given the strong interdependence between stress and emotions, one would expect that hormones would also have an important role in the emotions. Research indicates that this is indeed the case [61]. In this regard, there are several approaches on the detection of emotions. Emotion analysis could be used to monitor the emotional state of a subject, taking actions based on the type of individual feeling being experienced. This branch of affective computing traditionally relies on the detection of emotional states by means of four approaches: facial ([62], [63]), speech ([64], [65], [66]), physiological features ([67], [68], [69], [70]); or a combination of those ([71], [72]). All these studies collect affective information and identify emotional states, making use of indirect measures which can be roughly classified in analytic, subjective, performance, and physiological measures [73], according to Shina [74] there is a cardiovascular differentiation of emotions. Appling the emotional computing used in these studies to traders, the facial and speech recognition approaches first and the second approach are not suitable because, for example, it is not possible for a trader to stare at a fixed point without moving (invalidating the facial recognition). Furthermore, it is not possible for a trader to speak on a continual basis (invalidating speech recognition). However, with the physiological measures (skin temperature, heart rate, etc...) Repin and Steenbarger [75] “find that subjects whose emotional reaction to monetary gains and losses was more intense on both the positive and negative side exhibited significantly worse trading performance.” These results provide valuable information to the traders, but they do not provide indications of the trader’s stress levels in real time. The researchers conclude that there is an emotion with a discrete value (sadness, happiness, fear, euphoria, etc...) and this would be a starting point to translate the emotion into a stress level measurement. However, in doing so, the measurement would be obtained with delay and traders need their stress level information in real time to avoid a risky decision making.
Focusing on the neurophysiological stress response of the autonomic nervous system, Cacioppo [76] found that some physiologic variables change with stress (heart rate, blood pressure, respiratory rate, perspiration, inhibition of digestive system and sexual
13 Chapter 2. State of the Art
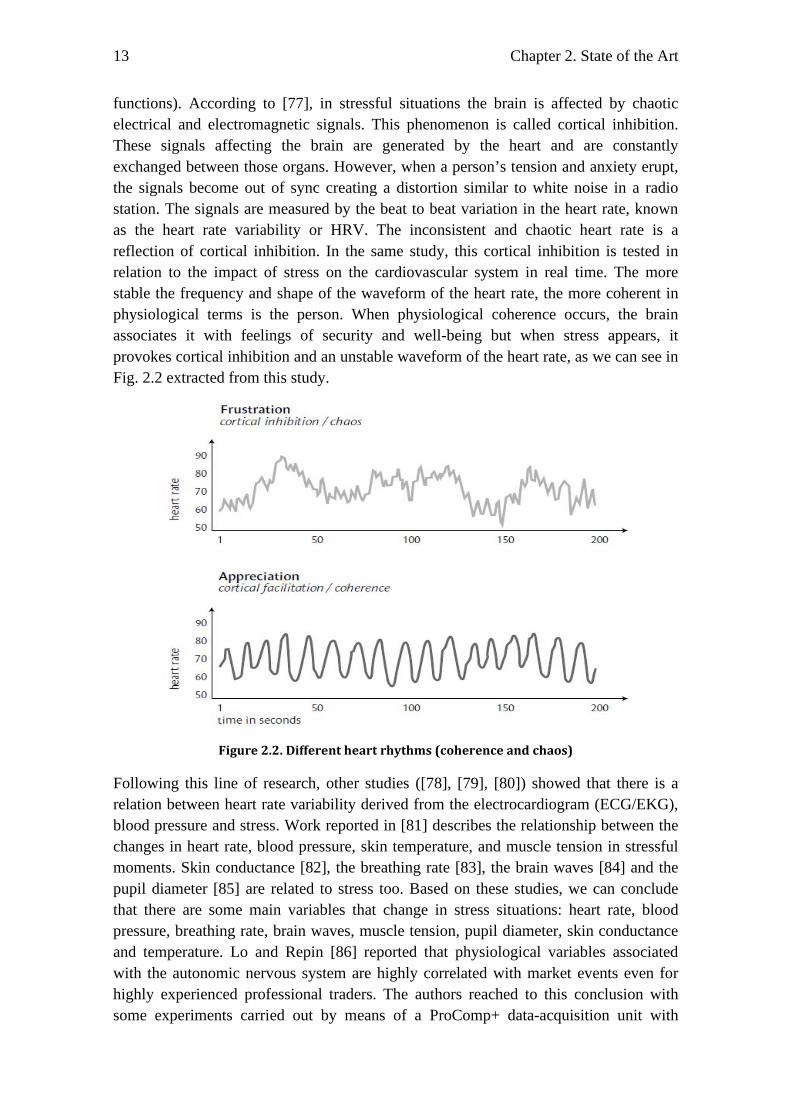
functions). According to [77], in stressful situations the brain is affected by chaotic electrical and electromagnetic signals. This phenomenon is called cortical inhibition. These signals affecting the brain are generated by the heart and are constantly exchanged between those organs. However, when a person’s tension and anxiety erupt, the signals become out of sync creating a distortion similar to white noise in a radio station. The signals are measured by the beat to beat variation in the heart rate, known as the heart rate variability or HRV. The inconsistent and chaotic heart rate is a reflection of cortical inhibition. In the same study, this cortical inhibition is tested in relation to the impact of stress on the cardiovascular system in real time. The more stable the frequency and shape of the waveform of the heart rate, the more coherent in physiological terms is the person. When physiological coherence occurs, the brain associates it with feelings of security and well-being but when stress appears, it provokes cortical inhibition and an unstable waveform of the heart rate, as we can see in Fig. 2.2 extracted from this study.
Figure 2.2. Different heart rhythms (coherence and chaos)
Following this line of research, other studies ([78], [79], [80]) showed that there is a relation between heart rate variability derived from the electrocardiogram (ECG/EKG), blood pressure and stress. Work reported in [81] describes the relationship between the changes in heart rate, blood pressure, skin temperature, and muscle tension in stressful moments. Skin conductance [82], the breathing rate [83], the brain waves [84] and the pupil diameter [85] are related to stress too. Based on these studies, we can conclude that there are some main variables that change in stress situations: heart rate, blood pressure, breathing rate, brain waves, muscle tension, pupil diameter, skin conductance and temperature. Lo and Repin [86] reported that physiological variables associated with the autonomic nervous system are highly correlated with market events even for highly experienced professional traders. The authors reached to this conclusion with some experiments carried out by means of a ProComp+ data-acquisition unit with
Self-Aware Traders. A real time approach to safer decision-making in the trading process 14
Biograph (Version 1.2) biofeedback software from Thought Technologies, Ltd and six sensors (skin conductance response, blood volume pulse, body temperature, respiration, and two electromyographic sensors, facial and forearm).
These physiological variables are also referred to in some studies as biometric variables or biosignals. For example, Kobayash et al [87] attempt to detect stress by using biosignals (finger plentysmogram and respiration) under visual search tasks (tasks that typically involve an active scan of the visual environment for a particular object). Sul et al [88] evaluate stress reactivity and recovery with biosignals and fuzzy theory. The method of stress measurement through biosignals has indeed been applied to some aspects in natural situations such as for quantifying driver stress (see Healy et al [89]).
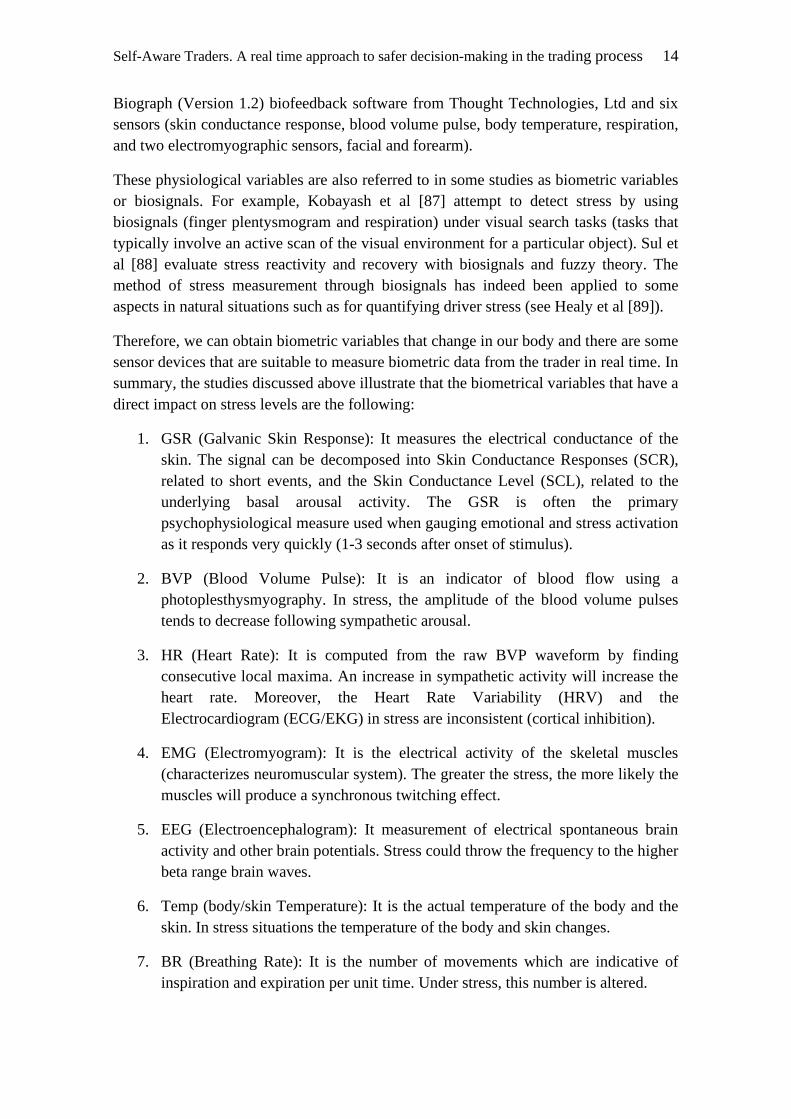
Therefore, we can obtain biometric variables that change in our body and there are some sensor devices that are suitable to measure biometric data from the trader in real time. In summary, the studies discussed above illustrate that the biometrical variables that have a direct impact on stress levels are the following:
1. GSR (Galvanic Skin Response): It measures the electrical conductance of the skin. The signal can be decomposed into Skin Conductance Responses (SCR), related to short events, and the Skin Conductance Level (SCL), related to the underlying basal arousal activity. The GSR is often the primary psychophysiological measure used when gauging emotional and stress activation as it responds very quickly (1-3 seconds after onset of stimulus).
2. BVP (Blood Volume Pulse): It is an indicator of blood flow using a photoplesthysmyography. In stress, the amplitude of the blood volume pulses tends to decrease following sympathetic arousal.
3. HR (Heart Rate): It is computed from the raw BVP waveform by finding consecutive local maxima. An increase in sympathetic activity will increase the heart rate. Moreover, the Heart Rate Variability (HRV) and the Electrocardiogram (ECG/EKG) in stress are inconsistent (cortical inhibition).
4. EMG (Electromyogram): It is the electrical activity of the skeletal muscles (characterizes neuromuscular system). The greater the stress, the more likely the muscles will produce a synchronous twitching effect.
5. EEG (Electroencephalogram): It measurement of electrical spontaneous brain activity and other brain potentials. Stress could throw the frequency to the higher beta range brain waves.
6. Temp (body/skin Temperature): It is the actual temperature of the body and the skin. In stress situations the temperature of the body and skin changes.
7. BR (Breathing Rate): It is the number of movements which are indicative of inspiration and expiration per unit time. Under stress, this number is altered.
15 Chapter 2. State of the Art
8. EOG (Electrooculography): It is the measure of retinal function by recording changes in steady, resting electric potentials of the eye. Under stress, important changes in these measurements take place.
In summary, higher stress is detected with lower BVP values, higher BR, EMG, GSR, SCR, HR values and changes in TEMP, EOG, and HRV. If it is possible to measure these variables in real time, it is possible to gain an understanding of the trader’s stress levels that can be fed back to user. In the next section, the sensors available on the market to measure these signals are described.
2.3 SENSOR TECHNOLOGY
This subsection begins with a brief introduction to the technology evolution in trading and shows how sensor support can provide further help in assisting traders in their daily work.
Moreover, some basic biometric principles applied to the sensors (universality, permanence, performance, accuracy, acceptability, adaptability) are defined to be assessed on the trading context. These principles are crucial in order to understand how this work could be used independently of the evolution of the technology bearing in mind that these principles should be fulfilled in trading context.
Furthermore, a discussion on how sensors capable of measuring biosignals could improve the trader’s decision making process is presented. According to the literature and the commercial products available on the market, when looking for suitable sensors for the trading process, some devices can be useful to obtain biometrical measures.
Taking into account that stress has a direct impact on biometric variables (shown in Section 2.2), some sensors currently available in the commercial market have been studied as examples of the available possibilities to gather the needed information and to feed back to the trader his/her stress level. In the same way, some related current research projects using this kind of sensor technology are mentioned.
The sensors will be classified according to some basic biometric sensor principles that under our understanding are crucial in trading context. The complete list of analysed sensors will be presented.
2.3.1 TECHNOLOGY EVOLUTION IN TRADING
The first traders are dated in the 12th century and they managed the debts of agricultural communities [90]. In these times, the transactions of the money were face-to-face. With the arrival of the telegraph, it was possible to disconnect the flow of financial information from the physical transportation of money. According to [91], this financial information was firstly printed on paper and later distributed in electronic form changing the social interaction in financial markets. From a face-to-face market we have currently a 24-hour global market with fluctuating exchange rates and subsequent speculation [92] supported by electronic trading mechanisms ([93], [94]). This trend is

Self-Aware Traders. A real time approach to safer decision-making in the trading process 16
continuing by replacing direct human decision making with computer-based algorithmic [95].
In this entire evolution, the one goal remaining is to increase the profit. It is one of the subjects where more research and studies has been carried out. Most of these studies have focused their effort in creating systems to try to predict the movements of the financial markets and take advantage of that [96]. However, the financial markets are changing every day and in this kind of volatile scenario, systems that are effective today may not be effective tomorrow.
The latest systems that are being used in the market are high-frequency trading systems [97]. These systems are automatic trading systems that running on high-speed computers searching opportunities of trading operations that may open up for only a fraction of a second or for several hours. The more technological advances are applied to trading, the less human decision is required in real time, moving this responsibility to the programmers designing trading algorithms.
The problem is that there are a lot of critical opinions to the use of that kind of systems, arguing that the volatility is growing up favouring the instability of the financial markets and the impossibility for small traders to have a chance in the market. For example, the flash crash on May 6, 2010 was attributed to the use of these systems.
Probably the perfect balance between a technological offer to help traders and improved human decision making allows avoiding great losses due to risky decisions. A growing body of interdisciplinary research foregrounds the activity performed within this work, in particular the constant need for collaboration between social and technical factors at the level of discourse [98]. In the next subsection it is possible to see how the sensors, which are currently offered in the market, could help in doing that.
2.3.2 BIOMETRIC SENSOR PRINCIPLES UNDER TRADING CONTEXT
One of the most extended uses of biometric sensors is the identification of the user for a special purpose (security, health, etc.). There are some basic biometric principles to evaluate whether a particular body (biometric) characteristic is suitable to identify a person, which are known as the seven pillars of biometric wisdom [99]: universality, distinctiveness, permanence, collectability, performance, acceptability and resistance to circumvention. However, in the trading context, we need to change the focus from identification to the characterization of the state of the user and this movement changes slightly the principles. Of course, it is also possible to use biometric sensors for identification purposes with traders (for example to initiate a special financial transaction) but the goal of the sensors that we analyze is to obtain the stress levels of the traders, i.e. we are interested in the characterization of the state of the traders.
We propose to consider the following principles for biometric sensoring in the trading context (Table 2.1).
17 Chapter 2. State of the Art
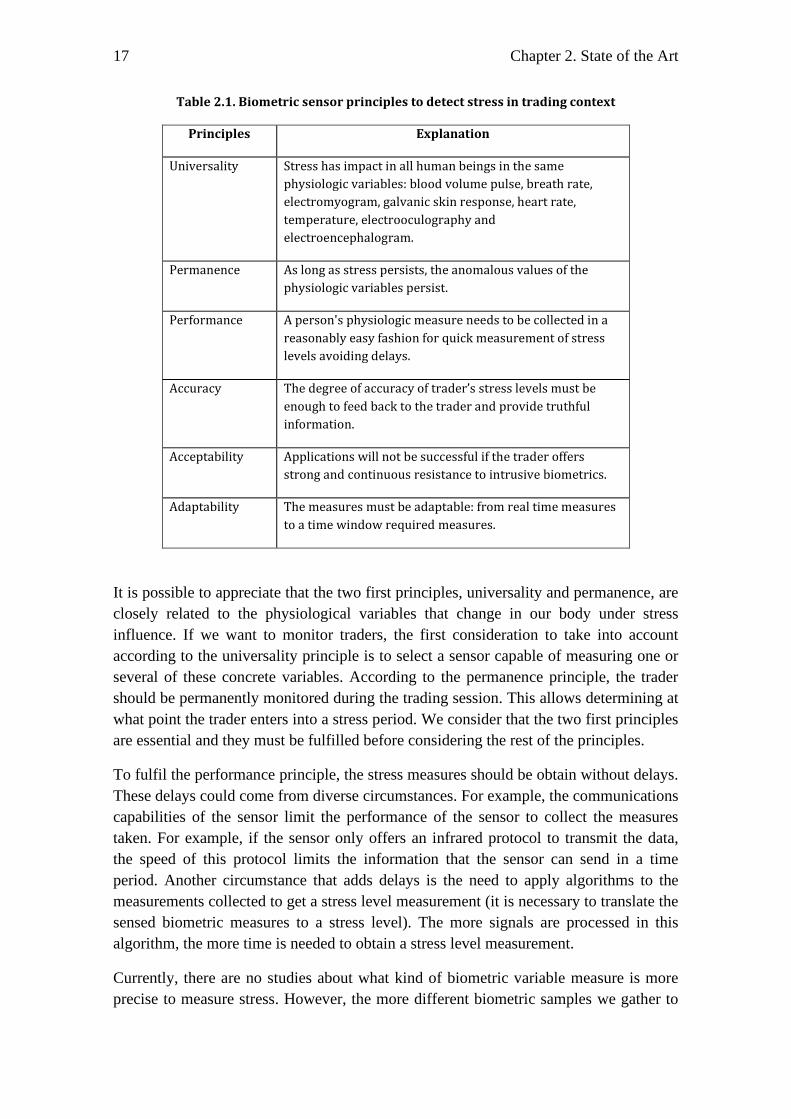
Table 2.1. Biometric sensor principles to detect stress in trading context
Principles Explanation
Universality Stress has impact in all human beings in the same
physiologic variables: blood volume pulse, breath rate,
electromyogram, galvanic skin response, heart rate,
temperature, electrooculography and
electroencephalogram.
Permanence As long as stress persists, the anomalous values of the
physiologic variables persist.
Performance A person's physiologic measure needs to be collected in a
reasonably easy fashion for quick measurement of stress
levels avoiding delays.
Accuracy The degree of accuracy of trader’s stress levels must be
enough to feed back to the trader and provide truthful
information.
Acceptability Applications will not be successful if the trader offers
strong and continuous resistance to intrusive biometrics.
Adaptability The measures must be adaptable: from real time measures
to a time window required measures.
It is possible to appreciate that the two first principles, universality and permanence, are closely related to the physiological variables that change in our body under stress influence. If we want to monitor traders, the first consideration to take into account according to the universality principle is to select a sensor capable of measuring one or several of these concrete variables. According to the permanence principle, the trader should be permanently monitored during the trading session. This allows determining at what point the trader enters into a stress period. We consider that the two first principles are essential and they must be fulfilled before considering the rest of the principles.
To fulfil the performance principle, the stress measures should be obtain without delays. These delays could come from diverse circumstances. For example, the communications capabilities of the sensor limit the performance of the sensor to collect the measures taken. For example, if the sensor only offers an infrared protocol to transmit the data, the speed of this protocol limits the information that the sensor can send in a time period. Another circumstance that adds delays is the need to apply algorithms to the measurements collected to get a stress level measurement (it is necessary to translate the sensed biometric measures to a stress level). The more signals are processed in this algorithm, the more time is needed to obtain a stress level measurement.
Currently, there are no studies about what kind of biometric variable measure is more precise to measure stress. However, the more different biometric samples we gather to
Self-Aware Traders. A real time approach to safer decision-making in the trading process 18
get the stress measurement, the closer we approach to the real perception of the stress levels. This is the reason why we have related the accuracy principle with the number of sensors that are sensing the trader. If the stress level measurement is based on one biometric variable, this measurement is less truthful than if it is based on five biometric variables, avoiding in a better way false positives. For example, if a trader is working and turns on the heater, his/her temperature will increase and will be detected by the sensor. If the stress level measurement is based on only in the temperature, changes might provoke a stress level indication. If the algorithm is based on temperature, heart rate and breath rate, it does not produce this false positive. Furthermore, in cases where a psychological variable is deliberately altered (for example a trader with a pacemaker) we can avoid this variable in a system where more variables are contemplated.
The acceptability principle takes into account the trader’s comfort with the sensor during trading session. Some sensors may be more suitable than others for the trading process. Ideally, a trader should be monitored by a device in a non-invasive manner. We consider that this would be achieved if the trader retains sufficient physical mobility to carry out his work (most traders are situated in front of computers) and the sensor should not feel uncomfortable to the trader and he/she should not be distracted from his work as a result of any discomfort generated by the sensor. Furthermore, the “invisibility” of the sensor will be ideal for increasing the acceptability, for example there are people that consider less invasive the use of lens instead glasses.
Finally the adaptability principle deals with the capacity of the sensor system of adapting the measures taken to the trader’s profile. For example, a futures trader could have more interest in being informed of his/her stress levels continuously in real time whereas a shares trader rather be more interested to be informed in a variable time period of his/her predominant stress levels.
We have selected in the current commercial market some sensors available that fulfill the two first principles: universality and permanence. In the next subsection these sensors are presented. We are going to analyze the fulfillment grade of the rest of the principles depending on the concrete sensor selected.
2.4 SENSORS ON COMMERCIAL MARKET
This section reviews and discusses the sensors that are available on the commercial market which are suited to calculate the necessary biosignals to measure the trader's stress levels. These devices are also called biofeedback devices, understanding that biofeedback is the process of becoming aware of various physiological functions using instruments that provide information on the activity of those same systems, with a goal of being able to manipulate them at will [100].
This section also addresses some current research projects on this type of sensor technology. It will provide a comparison of the products in this review and in the context of trading, and it will discuss when a sensor technology can be decisive in the

19 Chapter 2. State of the Art
trading process. Finally, this section provides guideline considerations for developers of sensors for the trading market.
2.4.1 REVIEW AND DISCUSSION
The relevance of stress in the market is becoming increasingly significant, particularly during times of economic crisis when workers are under more pressure. According to literature and the commercial products available on the market, if we are looking for suitable sensors for the trading process, we propose to divide the products for measuring stress into five categories:
1. Individual sensors to obtain individual biological parameters where we show individual sensors to obtain individual biosignals related to stress.
2. Generic sensors for gathering the data where specific devices are shown which are capable of obtaining and processing as many biosignals as necessary.
3. Wearable sensors, intelligent clothing with some examples of the application of this sensor technology in clothes.
4. Stress-specific sensors which provide a direct stress measure.
5. Other types of sensors including some interesting systems that could not be directly related to one of the previous categories. Furthermore we discuss some current research projects on this kind of sensor technology.
Different tables are presented in the review to illustrate the sensors (one per category). The tables contain the following columns: sensor: name of the sensor; figure: a small illustration of the sensor; developer/reference: manufacturer of the sensor and a reference for further information; measured signals: the stress-related signal or signals that can be measured by the device will be indicated (it should be noted that some sensors can measure other biosignals which are not related to stress measurements and these kinds of signals are not included in the tables); communication capabilities: the way in which the device transmits the data; and specifications: some technical specifications and some details are shown according to the product.
The acronym “N.A.” is used to indicate that the information is not available for a particular product. In addition, each category has been added some particular information common to the category sensors referred into the specific table. This specific information will be explained in each category. For ease of reference, in the comparison which follows in subsection B, a lower case letter is added before the name of the sensor to reference it in the comparison table.
2.4.1.1 Individual sensors
The first category consists of individual sensors to obtain individual biological parameters to gather the biometric data necessary related to stress: heart rate, blood pressure, breathing rate, brain waves, muscle tension, skin resistance, temperature and
Self-Aware Traders. A real time approach to safer decision-making in the trading process 20
retina changes. Nowadays, it is possible to purchase several devices to measure each biosignal, and Table 2.2 selects one representative example for each device that is available on the market. Depending on the trader’s preferences, some sensors may be more suitable than others for the trading process. Ideally, the trader should be monitored by the device in a non-invasive manner. We consider that this would be achieved if the following conditions were met:
1. The trader retains sufficient physical mobility to carry out his work (most traders are situated in front of computers);
2. The sensor should not feel uncomfortable to the trader and he/she should not be distracted from his work as a result of any discomfort generated by the sensor.
Table 2.2. Individual sensors
Sensor Figure Developer/ Reference
Communications Capabilities
Measured Signals
Specifications
a) Polar
RS800
Polar /[101] Polar IrDA USB HR, HRV Soft textile chest transmitter 2.4 GHz
included
b) GSR 2
Thought
Technology /
[102]
N.A GSR Skin resistance range 1,000 ohms -
3,000,000 ohms .Variable frequency
range 0 to 40,000 Hz
c) HEM
790IT
Omron / [103] Omron USB
cable
BP, HR
2 User - 200 Total Memory with Date
and Time Stamp
d) PS2133
Pasco/ [104] PASPORT™ USB
interface
BR Range: 0 to 10 kPa. Accuracy: ± 0.5 kPa.
Maximum Sample Rate: 20 samples per
second
e) SC911
Bio-Medical
Instruments /
[105]
N.A TEMP Reads in increments of 1/10 of a
degree F. Range: 58 to 158 degrees F.
Accuracy: =/- 1.8 degrees F
f) Neurobics
A3
Neurobics /
[106]
Wireless EEG Software and PC wireless receiver
included. Sampling rate: 122
samples/sec. Processor: 10 bit
g) Clinical
EMG
Metron / [107] N.A EMG 35 Segment LED Bar graphs and four
LED numeric Displays. Frequency
Range: 10 Hz +/- 3 Hz @ 80 dB/Dec
(Butterworth) to 450 Hz +/- 40 Hz @
40 dB/Dec (Butterworth)
h) S225
Qubit Systemsb
/ [108]
USB EOG 3 electrode cables, a set of 100
disposable electrodes, and a laboratory
manual are included.
It is possible to find biosignals that can be non-invasively monitored with existing technology in real time. However, the following problems arise with these options:
1. It is necessary to translate the sensed biometric measures to a stress level in real time.
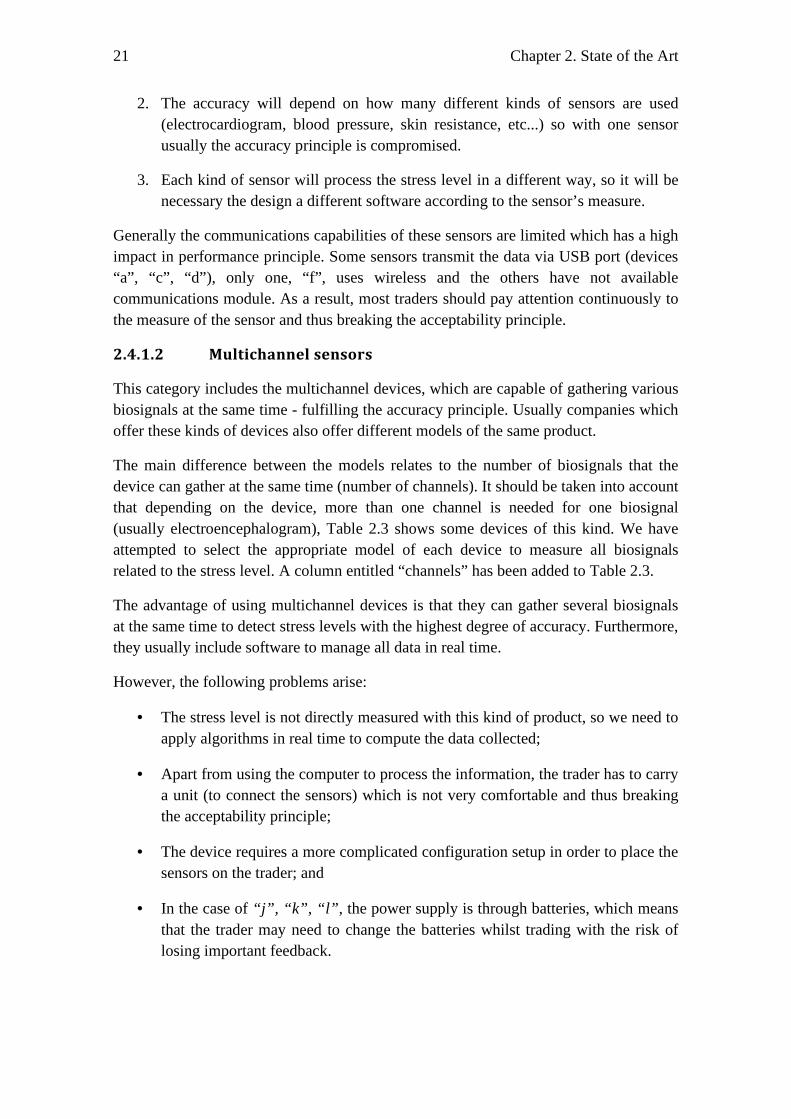
21 Chapter 2. State of the Art
2. The accuracy will depend on how many different kinds of sensors are used (electrocardiogram, blood pressure, skin resistance, etc...) so with one sensor usually the accuracy principle is compromised.
3. Each kind of sensor will process the stress level in a different way, so it will be necessary the design a different software according to the sensor’s measure.
Generally the communications capabilities of these sensors are limited which has a high impact in performance principle. Some sensors transmit the data via USB port (devices “a”, “c”, “d”), only one, “f”, uses wireless and the others have not available communications module. As a result, most traders should pay attention continuously to the measure of the sensor and thus breaking the acceptability principle.
2.4.1.2 Multichannel sensors
This category includes the multichannel devices, which are capable of gathering various biosignals at the same time - fulfilling the accuracy principle. Usually companies which offer these kinds of devices also offer different models of the same product.
The main difference between the models relates to the number of biosignals that the device can gather at the same time (number of channels). It should be taken into account that depending on the device, more than one channel is needed for one biosignal (usually electroencephalogram), Table 2.3 shows some devices of this kind. We have attempted to select the appropriate model of each device to measure all biosignals related to the stress level. A column entitled “channels” has been added to Table 2.3.
The advantage of using multichannel devices is that they can gather several biosignals at the same time to detect stress levels with the highest degree of accuracy. Furthermore, they usually include software to manage all data in real time.
However, the following problems arise:
• The stress level is not directly measured with this kind of product, so we need to apply algorithms in real time to compute the data collected;
• Apart from using the computer to process the information, the trader has to carry a unit (to connect the sensors) which is not very comfortable and thus breaking the acceptability principle;
• The device requires a more complicated configuration setup in order to place the sensors on the trader; and
• In the case of “j”, “k”, “l” , the power supply is through batteries, which means that the trader may need to change the batteries whilst trading with the risk of losing important feedback.
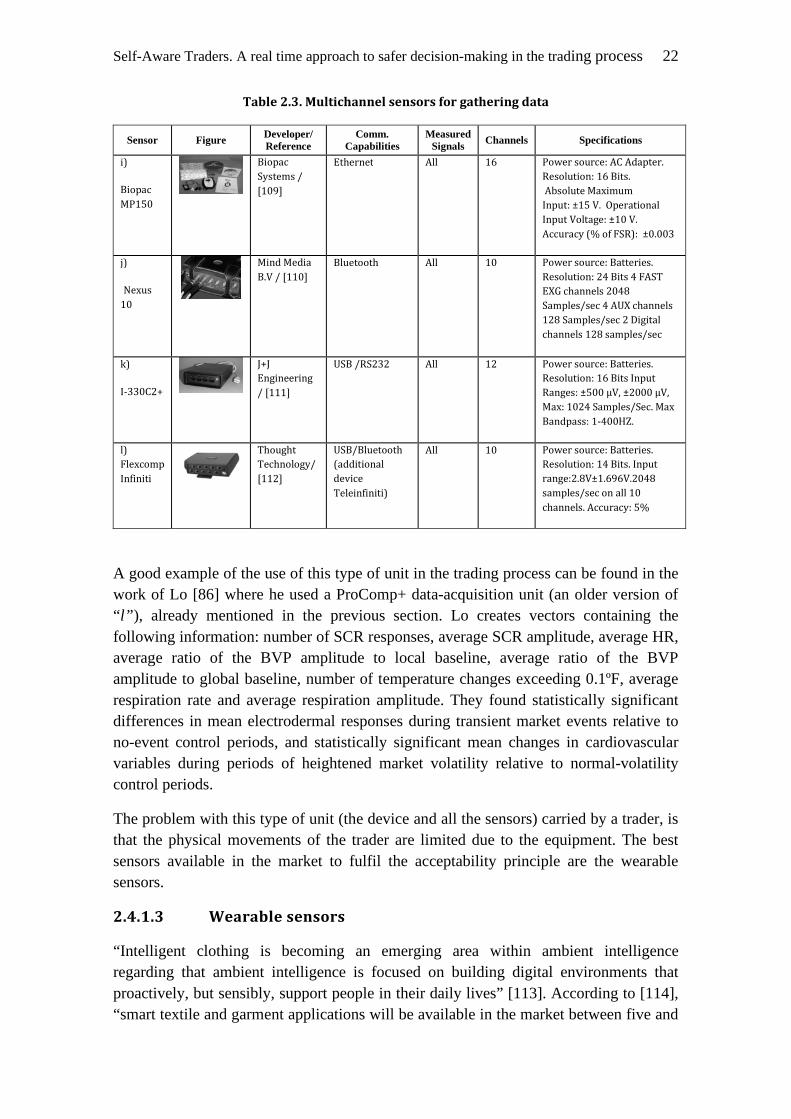
Self-Aware Traders. A real time approach to safer decision-making in the trading process 22
Table 2.3. Multichannel sensors for gathering data
Sensor Figure Developer/ Reference
Comm. Capabilities
Measured Signals Channels Specifications
i)
Biopac
MP150
Biopac
Systems /
[109]
Ethernet All 16 Power source: AC Adapter.
Resolution: 16 Bits.
Absolute Maximum
Input: ±15 V. Operational
Input Voltage: ±10 V.
Accuracy (% of FSR): ±0.003
j)
Nexus
10
Mind Media
B.V / [110]
Bluetooth All 10 Power source: Batteries.
Resolution: 24 Bits 4 FAST
EXG channels 2048
Samples/sec 4 AUX channels
128 Samples/sec 2 Digital
channels 128 samples/sec
k)
I-330C2+
J+J
Engineering
/ [111]
USB /RS232 All 12 Power source: Batteries.
Resolution: 16 Bits Input
Ranges: ±500 µV, ±2000 µV,
Max: 1024 Samples/Sec. Max
Bandpass: 1-400HZ.
l)
Flexcomp
Infiniti
Thought
Technology/
[112]
USB/Bluetooth
(additional
device
Teleinfiniti)
All 10 Power source: Batteries.
Resolution: 14 Bits. Input
range:2.8V±1.696V.2048
samples/sec on all 10
channels. Accuracy: 5%
A good example of the use of this type of unit in the trading process can be found in the work of Lo [86] where he used a ProComp+ data-acquisition unit (an older version of “ l” ), already mentioned in the previous section. Lo creates vectors containing the following information: number of SCR responses, average SCR amplitude, average HR, average ratio of the BVP amplitude to local baseline, average ratio of the BVP amplitude to global baseline, number of temperature changes exceeding 0.1ºF, average respiration rate and average respiration amplitude. They found statistically significant differences in mean electrodermal responses during transient market events relative to no-event control periods, and statistically significant mean changes in cardiovascular variables during periods of heightened market volatility relative to normal-volatility control periods.
The problem with this type of unit (the device and all the sensors) carried by a trader, is that the physical movements of the trader are limited due to the equipment. The best sensors available in the market to fulfil the acceptability principle are the wearable sensors.
2.4.1.3 Wearable sensors
“Intelligent clothing is becoming an emerging area within ambient intelligence regarding that ambient intelligence is focused on building digital environments that proactively, but sensibly, support people in their daily lives” [113]. According to [114], “smart textile and garment applications will be available in the market between five and
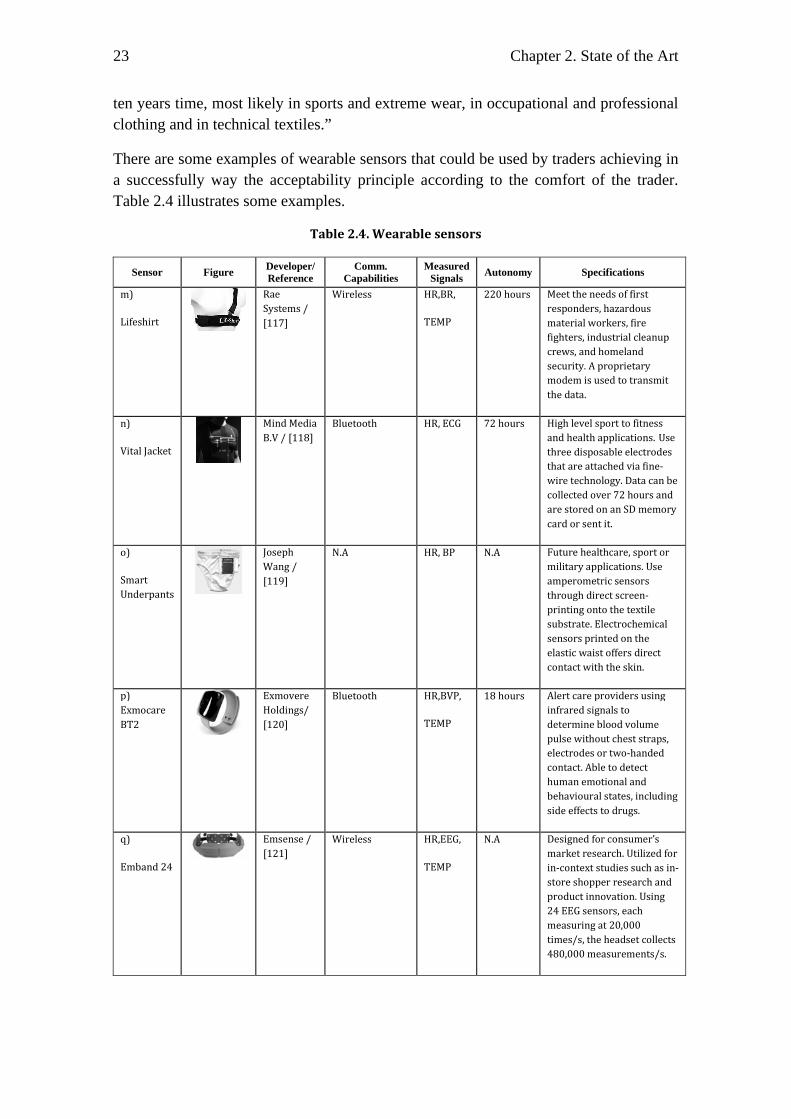
23 Chapter 2. State of the Art
ten years time, most likely in sports and extreme wear, in occupational and professional clothing and in technical textiles.”
There are some examples of wearable sensors that could be used by traders achieving in a successfully way the acceptability principle according to the comfort of the trader. Table 2.4 illustrates some examples.
Table 2.4. Wearable sensors
Sensor Figure Developer/ Reference
Comm. Capabilities
Measured Signals Autonomy Specifications
m)
Lifeshirt
Rae
Systems /
[117]
Wireless HR,BR,
TEMP
220 hours Meet the needs of first
responders, hazardous
material workers, fire
fighters, industrial cleanup
crews, and homeland
security. A proprietary
modem is used to transmit
the data.
n)
Vital Jacket
Mind Media
B.V / [118]
Bluetooth HR, ECG 72 hours High level sport to fitness
and health applications. Use
three disposable electrodes
that are attached via fine-
wire technology. Data can be
collected over 72 hours and
are stored on an SD memory
card or sent it.
o)
Smart
Underpants
Joseph
Wang /
[119]
N.A HR, BP N.A Future healthcare, sport or
military applications. Use
amperometric sensors
through direct screen-
printing onto the textile
substrate. Electrochemical
sensors printed on the
elastic waist offers direct
contact with the skin.
p)
Exmocare
BT2
Exmovere
Holdings/
[120]
Bluetooth HR,BVP,
TEMP
18 hours Alert care providers using
infrared signals to
determine blood volume
pulse without chest straps,
electrodes or two-handed
contact. Able to detect
human emotional and
behavioural states, including
side effects to drugs.
q)
Emband 24
Emsense /
[121]
Wireless HR,EEG,
TEMP
N.A Designed for consumer’s
market research. Utilized for
in-context studies such as in-
store shopper research and
product innovation. Using
24 EEG sensors, each
measuring at 20,000
times/s, the headset collects
480,000 measurements/s.
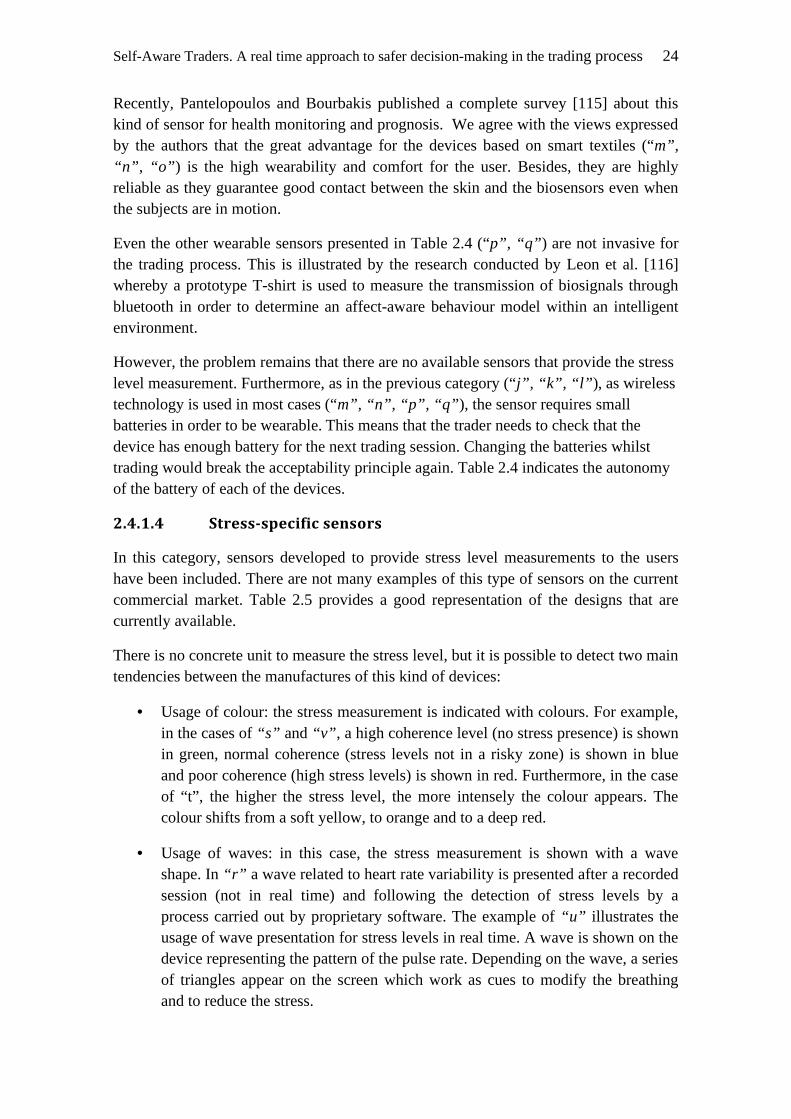
Self-Aware Traders. A real time approach to safer decision-making in the trading process 24
Recently, Pantelopoulos and Bourbakis published a complete survey [115] about this kind of sensor for health monitoring and prognosis. We agree with the views expressed by the authors that the great advantage for the devices based on smart textiles (“m”, “n”, “o” ) is the high wearability and comfort for the user. Besides, they are highly reliable as they guarantee good contact between the skin and the biosensors even when the subjects are in motion.
Even the other wearable sensors presented in Table 2.4 (“p”, “q” ) are not invasive for the trading process. This is illustrated by the research conducted by Leon et al. [116] whereby a prototype T-shirt is used to measure the transmission of biosignals through bluetooth in order to determine an affect-aware behaviour model within an intelligent environment.
However, the problem remains that there are no available sensors that provide the stress level measurement. Furthermore, as in the previous category (“j”, “k”, “l” ), as wireless technology is used in most cases (“m”, “n”, “p”, “q” ), the sensor requires small batteries in order to be wearable. This means that the trader needs to check that the device has enough battery for the next trading session. Changing the batteries whilst trading would break the acceptability principle again. Table 2.4 indicates the autonomy of the battery of each of the devices.
2.4.1.4 Stress-specific sensors
In this category, sensors developed to provide stress level measurements to the users have been included. There are not many examples of this type of sensors on the current commercial market. Table 2.5 provides a good representation of the designs that are currently available.
There is no concrete unit to measure the stress level, but it is possible to detect two main tendencies between the manufactures of this kind of devices:
• Usage of colour: the stress measurement is indicated with colours. For example, in the cases of “s” and “v” , a high coherence level (no stress presence) is shown in green, normal coherence (stress levels not in a risky zone) is shown in blue and poor coherence (high stress levels) is shown in red. Furthermore, in the case of “t”, the higher the stress level, the more intensely the colour appears. The colour shifts from a soft yellow, to orange and to a deep red.
• Usage of waves: in this case, the stress measurement is shown with a wave shape. In “r” a wave related to heart rate variability is presented after a recorded session (not in real time) and following the detection of stress levels by a process carried out by proprietary software. The example of “u” illustrates the usage of wave presentation for stress levels in real time. A wave is shown on the device representing the pattern of the pulse rate. Depending on the wave, a series of triangles appear on the screen which work as cues to modify the breathing and to reduce the stress.
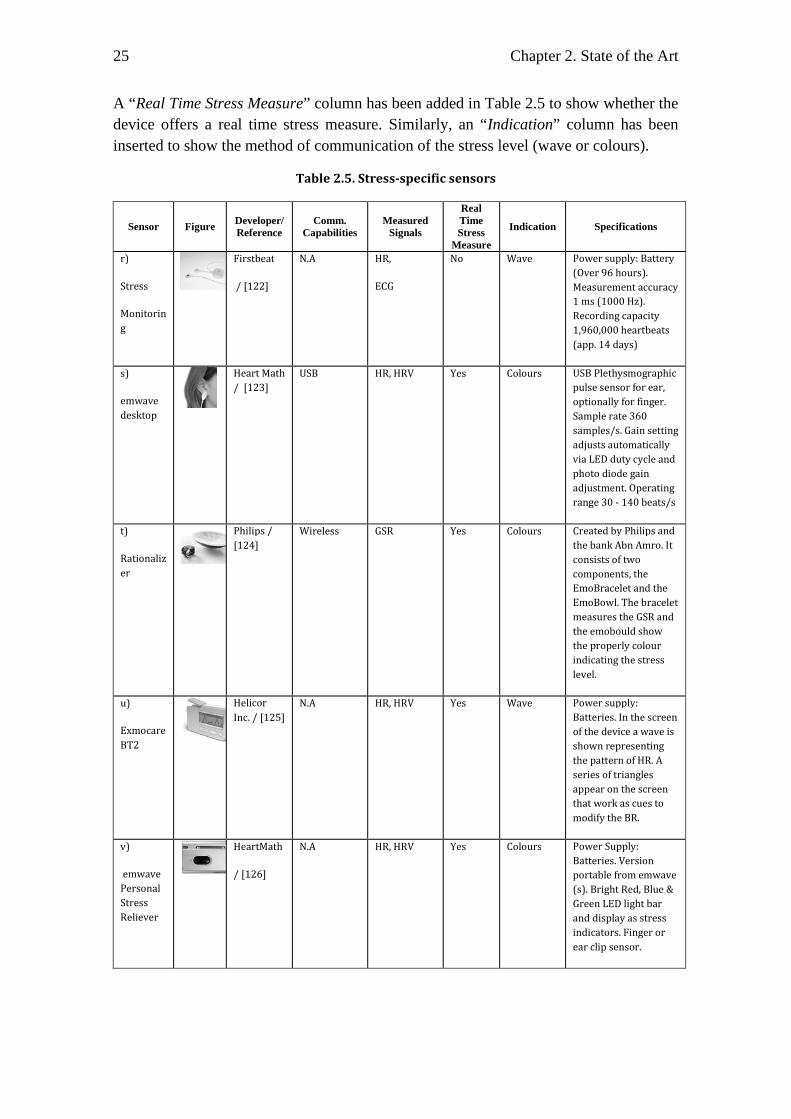
25 Chapter 2. State of the Art
A “Real Time Stress Measure” column has been added in Table 2.5 to show whether the device offers a real time stress measure. Similarly, an “Indication” column has been inserted to show the method of communication of the stress level (wave or colours).
Table 2.5. Stress-specific sensors
Sensor Figure Developer/ Reference
Comm. Capabilities
Measured Signals
Real Time Stress
Measure
Indication Specifications
r)
Stress
Monitorin
g
Firstbeat
/ [122]
N.A HR,
ECG
No Wave Power supply: Battery
(Over 96 hours).
Measurement accuracy
1 ms (1000 Hz).
Recording capacity
1,960,000 heartbeats
(app. 14 days)
s)
emwave
desktop
Heart Math
/ [123]
USB HR, HRV Yes Colours USB Plethysmographic
pulse sensor for ear,
optionally for finger.
Sample rate 360
samples/s. Gain setting
adjusts automatically
via LED duty cycle and
photo diode gain
adjustment. Operating
range 30 - 140 beats/s
t)
Rationaliz
er
Philips /
[124]
Wireless GSR Yes Colours Created by Philips and
the bank Abn Amro. It
consists of two
components, the
EmoBracelet and the
EmoBowl. The bracelet
measures the GSR and
the emobould show
the properly colour
indicating the stress
level.
u)
Exmocare
BT2
Helicor
Inc. / [125]
N.A HR, HRV Yes Wave Power supply:
Batteries. In the screen
of the device a wave is
shown representing
the pattern of HR. A
series of triangles
appear on the screen
that work as cues to
modify the BR.
v)
emwave
Personal
Stress
Reliever
HeartMath
/ [126]
N.A HR, HRV Yes Colours Power Supply:
Batteries. Version
portable from emwave
(s). Bright Red, Blue &
Green LED light bar
and display as stress
indicators. Finger or
ear clip sensor.
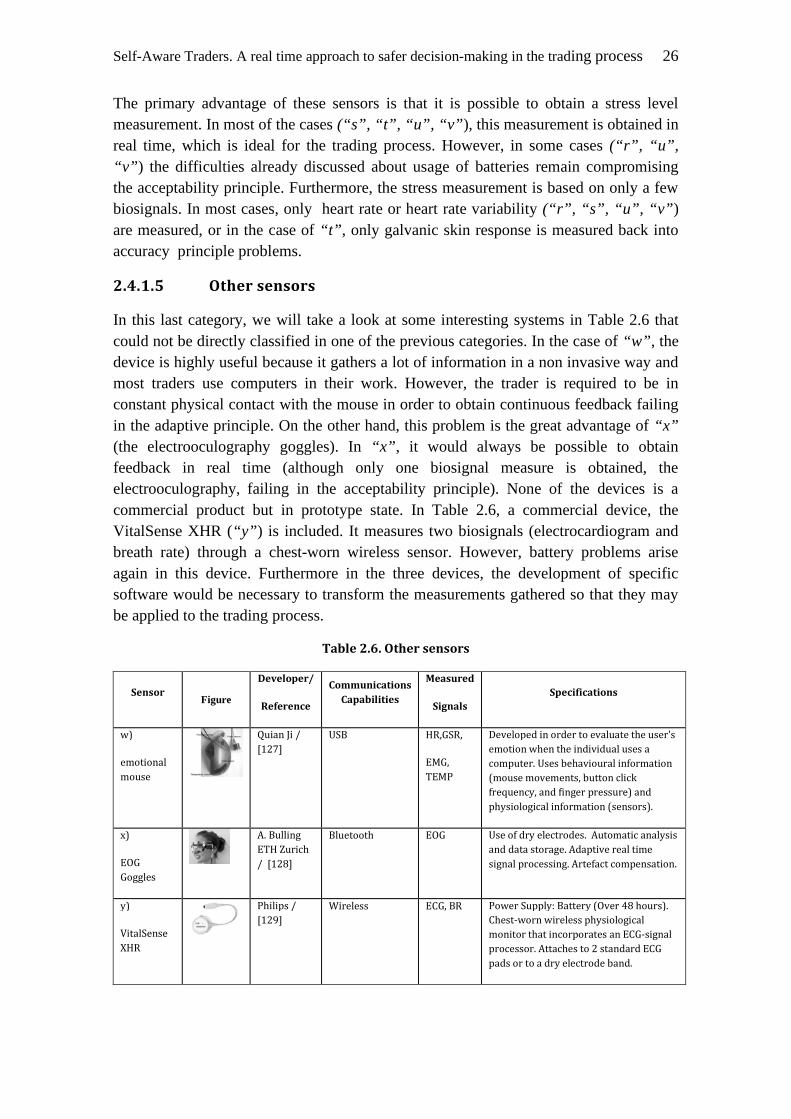
Self-Aware Traders. A real time approach to safer decision-making in the trading process 26
The primary advantage of these sensors is that it is possible to obtain a stress level measurement. In most of the cases (“s”, “t”, “u”, “v” ), this measurement is obtained in real time, which is ideal for the trading process. However, in some cases (“r”, “u”, “v” ) the difficulties already discussed about usage of batteries remain compromising the acceptability principle. Furthermore, the stress measurement is based on only a few biosignals. In most cases, only heart rate or heart rate variability (“r”, “s”, “u”, “v” ) are measured, or in the case of “t” , only galvanic skin response is measured back into accuracy principle problems.
2.4.1.5 Other sensors
In this last category, we will take a look at some interesting systems in Table 2.6 that could not be directly classified in one of the previous categories. In the case of “w” , the device is highly useful because it gathers a lot of information in a non invasive way and most traders use computers in their work. However, the trader is required to be in constant physical contact with the mouse in order to obtain continuous feedback failing in the adaptive principle. On the other hand, this problem is the great advantage of “x” (the electrooculography goggles). In “x” , it would always be possible to obtain feedback in real time (although only one biosignal measure is obtained, the electrooculography, failing in the acceptability principle). None of the devices is a commercial product but in prototype state. In Table 2.6, a commercial device, the VitalSense XHR (“y” ) is included. It measures two biosignals (electrocardiogram and breath rate) through a chest-worn wireless sensor. However, battery problems arise again in this device. Furthermore in the three devices, the development of specific software would be necessary to transform the measurements gathered so that they may be applied to the trading process.
Table 2.6. Other sensors
Sensor Figure
Developer/
Reference
Communications
Capabilities
Measured
Signals
Specifications
w)
emotional
mouse
Quian Ji /
[127]
USB HR,GSR,
EMG,
TEMP
Developed in order to evaluate the user's
emotion when the individual uses a
computer. Uses behavioural information
(mouse movements, button click
frequency, and finger pressure) and
physiological information (sensors).
x)
EOG
Goggles
A. Bulling
ETH Zurich
/ [128]
Bluetooth EOG Use of dry electrodes. Automatic analysis
and data storage. Adaptive real time
signal processing. Artefact compensation.
y)
VitalSense
XHR
Philips /
[129]
Wireless ECG, BR Power Supply: Battery (Over 48 hours).
Chest-worn wireless physiological
monitor that incorporates an ECG-signal
processor. Attaches to 2 standard ECG
pads or to a dry electrode band.
27 Chapter 2. State of the Art
2.4.1.6 Research projects
In this section, some projects are selected where the sensor biofeedback field plays an important role. Although the target of these projects is not related directly to the stress measurements, they provide an idea of the focus in current research with regard to biofeedback measurements.
The following projects illustrate what we can expect from the results with respect to stress measurement.
The DARPA-ASSIST (Advanced Soldier Sensor Information System and Technology) program [130] enhances battlefield awareness via exploitation of soldier-collected information through a light-weight, wearable multi-sensor collection device. It is possible to find some study related to this project [131] with a wearable sensor system. The system consists of a multi-sensor board with a 3-axis accelerometer, microphones for recording speech and ambient sound, photo-transistors for measuring light conditions and temperature and barometric pressure sensors. Another system related with this project (Vanderbilt University’s System [132]) is developing a shooter localization technology with ten acoustic sensors that detects gunfire, determines bullet trajectory, localizes the shooter, etc.
The SESAME [133] consortium is a multidisciplinary group that investigates the use of wireless sensor-based systems with offline and real time processing and feedback in enhancing the performance of elite athletes and young athletes who have been identified as having world class potential. The current work in progress includes pressure sensors in shoes (1000 samples/sec) to analyse foot contact intervals from shoe pressure and inertial sensors on limbs to measure the speed of motion from inertial and foot contact.
The Healthcare@Home project [134] aims to integrate invasive and non-invasive patient monitoring systems with analysis of this information via grid infrastructure. The infrastructure promotes continuous and discontinuous (push/pull) monitoring of patients at home, employing a new class of dedicated home healthcare server relaying data from and to prototype Bluetooth sensor/comms devices. The project uses diabetes as the exemplar disease context and glucose monitoring sensors to provide real time continuous measurements [135].
The WearIT@work Project ([136], [137]) aims to empower the mobile worker by wearable computing intelligent clothing. The project maintains that wearable technology can change the organization’s way of working in three ways: improving worker productivity and flexibility; increasing the number of tasks performed simultaneously and reducing the length of time for the performance of each task. Various low-embeddable physiological sensor modules, for measuring ECG (electrocardiogram), SpO2 (pulse oximeter), HR (heart rate), aortic pressure wave, and breath-to-breath CO2 / O2 concentrations, are used in the project scenarios. These sensors, for example, are particularly relevant to the BSPP (Brigade des Sapeurs

Self-Aware Traders. A real time approach to safer decision-making in the trading process 28
Pompiers Paris) / Rescue scenario where physiological monitoring of firemen is required.
HeartCycle project [138] works to improve the quality of life for coronary heart disease and heart failure patients by monitoring their condition and involving them in the daily management of their disease. Monitoring each patient’s condition is achieved by using a combination of unobtrusive bio-sensors that are built into the patient’s clothing or bed sheets and home appliances. Some sensors used are cuff-less blood pressure, wearable SpO2 (pulse oximeter), inductive impedance, electronic acupuncture system and new sensor development like contact-less ECG, arrays of electrets foils, motion-compensation in ECG, cardiac performance monitor (bio-imped.). The consortium also develops mechanisms to automatically report relevant monitoring data back to clinicians so that they can prescribe personalized therapies and lifestyle recommendations.
In these research projects we can see the application of the sensors in different disciplines (military, sports, healthcare and rescue scenarios). The sensor measurements are focused in the outside environment or in the human being tuned to a project objective. However, from this diversity we draw a conclusion related to this work. In the projects where it is needed to get physiological measures in real time, heart rate and ECG measurement are used (The WearIT@work Project, HeartCycle project). Besides, in all projects, a post analysis of this information allows to draw conclusions to help to improve diverse characteristics.
In order to support traders, it seems to be coherent that one of the biometric measurements chosen to feedback his/her owns state in real time is the heart rate and the ECG. Furthermore, we have to save the information to allow the traders a post analysis of the data to improve his/her trading process. So, we will bear in mind these considerations when selecting the sensor (Heart rate and ECG measurements available) and developing of the software (also saving data).
This review illustrates the sensor technology that is currently available on the commercial market (categories 1, 2, 3, 4 and 5) and where current research projects are focussing on.
2.4.2 COMPARISONS AND DISCUSSION
In this section, a comparison table is provided (see Table 2.7) with reference to all sensors described above. It is possible to find comparisons about some sensors described in this section based on their technical specifications as for example in [139]. In this case, the comparison described in Table 2.7 is based on relevant and important criteria for the trading process. It is important to point out that the purpose of this comparison is not to criticise the sensors. The main objective is to have a global idea of what kind of sensors we can find in the market and what factors we should bear in mind to apply these sensors to the trading process. This table illustrates how every sensor fits to every criterion in the following way: very good relation: “++”; good relation: “+”;
29 Chapter 2. State of the Art
low relation: “-” ; very low relation: “- -”; not applicable relation: if the criterion is not applicable to the sensor, “N.A” is inserted; and if no information is available for an applicable criterion, a “?” is inserted.
The criteria used in Table 2.7 is based on the basic principles mentioned in Table 2.1 for trading, applied to sensors shown in tables 2.2 - 2.6. In order to provide a more exhaustive comparison, we associate these principles to nine technical criteria referred to as technological characteristics important for trading process. This association allows us to show the impact of the current characteristics of the available technology in the basic principles. This gives us an indication which areas need improvement. Bearing in mind that the universality and permanence principles are considered to be achieved by all the sensors, we use these principles to select the examples illustrated previously. The eleven criteria are described below, relating them with the basic principles in format “Criteria. Principle: Description”. Only two criteria are not related to the basic principles, price and available sellers. However, we have decided to include them to show also the complete commercial market information. The criteria used in Table 2.7 are enumerated below:
C1: Data shown in real time. Adaptability principle: This indicates whether the sensor is able to send gathered data from the human body in real time. It is important to traders in order to display all information in real time and thus supporting decisions based on all updated information. For this criterion in the table, “++” is inserted when the sensor has real time support and “--” if it does not.
C2: Stress measurement. Performance principle: It is important to know if a specific stress parameter is supplied as otherwise it will be necessary to transform the data gathered into a suitable stress parameter providing valid information for the trading process. For this criterion, “++” is inserted when the sensor provides stress measurement and “--” if it does not.
C3: Inclusion of software. Performance principle: Depending on the sensor, it may be sometimes necessary to develop own software to access to the measurements (assuming that there is an open interface). For this criterion, “++” is inserted when the software is included and “--” if it is not.
C4: Data logging. Performance principle: This is a significant parameter if the trader needs to review the data and save his/her sessions to study or improve decisions in the future. For this criterion, “++” is inserted when the sensor has data logging and “--” if it does not.
C5: Wearability (visibility) . Acceptability principle: In some cases this parameter could be crucial depending on the scenario for the trading process (home/ investment company/ Wall Street). In this case, “++” is inserted when the sensor is not visible, “+” when it is not visible but it is still wearable, “-” when it is not wearable but the sensor could be carried, “--” is inserted when the sensor should be fixed and it is impossible to carry.
Self-Aware Traders. A real time approach to safer decision-making in the trading process 30
C6: Intrusive/non intrusive (comfortable). Acceptability principle: Depending on the trading scenario, it may not be necessary to have a wearable sensor; however in most cases a non invasive sensor is necessary so that the trader is not disturbed during his work. The symbol “++” is assigned when trader movements and comfort are not compromised, “+” is assigned when the trader can move freely but comfort is compromised. The symbol “-” is used when the sensor is linked with cables or comfort and movements are compromised and “--” is marked when the sensor is connected to cables and comfort or movements are compromised.
C7: Accuracy. Accuracy principle: The more biosignals are measured by the sensor, the greater the accuracy in calculating the trader's stress level measurement. In this case, the symbol “++” is used when the device gathers all of the biosignals measurements, “+” is inserted if it gathers more than two biosignals, “-” when it measures two biosignals and “--” when only it measures only one biosignal.
C8: Autonomy. Acceptability principle: For traders, the need to be aware of the battery life of the sensors is not a good point because they should not be distracted from the trading process. In this case, the symbol “++” is inserted to show that the device can be plugged into the power supply as well as having batteries. The symbol “+” is inserted when it only can be plugged into the power supply or the power supply source is through a USB port. The symbol “-” is inserted when the sensor only has batteries (we consider that changing the batteries whilst trading is worse than an USB connection) and we put “--” when it only as batteries and the battery life is lower than 24 hours.
C9: Communication capacities. Performance principle: The more communication capacities the sensor has, the more possibilities are available to the trader to adapt the sensor within the trading process. In this case, the symbol “++” is inserted when the device has wired and wireless capabilities. The symbol “+” is inserted to indicate when the sensor only has wireless capabilities. The symbol “-” is inserted when the sensor only works with wired communication and “--” shows that the device has no communication capabilities.
C10: Available sellers. Some sensors shown in the previous tables are prototypes and it is not possible to buy them. This criterion is referred to so that it can be seen if it is possible to purchase the device. The symbol “++” is inserted when the software is available on the market and “--” is inserted if it is not available.
C11: Price. In this case, the price category has been defined in the following way: “++” for under 500€, “+” for between 500 and 1000€, “-” for between 1000 and 2000€ and “--” for above 2000€ and Na is used when the device is not a commercial product.
In the following, we can see Table 2.7 with all the sensors (in the first column from “a” to “y” keeping the same name that was used in the previous tables) and all criteria described above (From C1 to C11). For every sensor, eleven criteria have been applied, so the table can be read in two ways: Per sensor (per row) or per criterion (per column).
31 Chapter 2. State of the Art
To maximize the usefulness of Table 2.7 and in order to select the most suitable sensor for the trading process, it is necessary to bear in mind that depending on the trader’s profile (if he/she works for him/herself or for a company, if he/she is trading in shares, futures, commodities, risk profile, etc.) and his/her environment (the place where the trading process is carried out), some sensors may be more appropriate than others. Criterion C1 (Data shown in real time) is always important for traders. However, the relevance and importance of the rest of the criteria will be different in each case. Some examples of different environments and profiles are as follows:
1. Trading with shares from home: in this case, the trader works for him/herself and the environment is the home office. This type of trader usually trades with a computer in a seated position. In this scenario, the acceptability principle (C5, C6 and C8) would not be of crucial importance. Furthermore, in this particular case, the frequency of decision making is usually moderate and therefore it is easier to identify critical times so the accuracy principle (C7) would be of less importance. On the other hand, the performance principle (C2, C3, C4 and C9) would be crucial for the user and sensors such as “s” could be appropriate.
2. Trading in an investment company: in this case, the trader is an investment company employee. Also the trading process is done with computers while sitting so the acceptability principle (C5, C6 and C8) still keeps a secondary role. However, in this case probably the company has a computing department, so it is possible that they can develop suitable software according to the traders’ needs that for example can transform biosignals measures into stress measurement so the performance principle (C2, C3, C4 and C9) could be achieved with technical support. Besides, in these companies the traders usually have a high-frequency number of operations and works with many investment products at the same time, so the accuracy principle (C7) could have a crucial role. In this case, sensor like “i”, “j”, “k” or “l” could be a good option.
3. Live trading (e.g. Wall Street): it is possible to see on television, for example, how frenetic trading can become in live environments such as Wall Street. Obviously in this case, the traders are employees for investment companies and in contrast with the previous scenarios, acceptability principle (C5, C6 and C8) are the most important and sensors such as “n” or “p” could be preferable for this category; assuming that these companies can develop the necessary software.
There are many combinations for potential options and Table 2.7 attempts to assist traders according to his/her requirements. In doing so, it is possible also to help traders where only one criterion could be determinant. For example, in the case of C11, sensors such as “a” , “e” , “u” or “v” could be interesting options. Furthermore, Table 2.7 also shows specific sensor designs for investment companies such as “t” where even criterion C10 is not relevant.
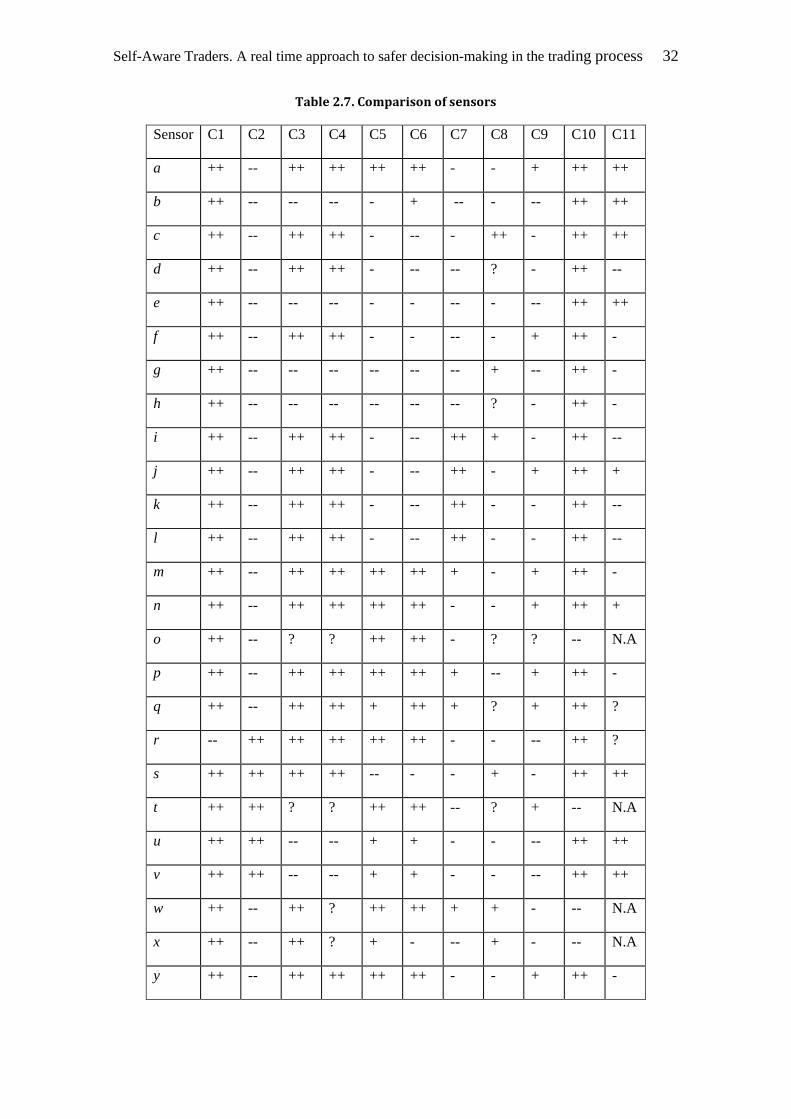
Self-Aware Traders. A real time approach to safer decision-making in the trading process 32
Table 2.7. Comparison of sensors
Sensor C1 C2 C3 C4 C5 C6 C7 C8 C9 C10 C11
a ++ -- ++ ++ ++ ++ - - + ++ ++
b ++ -- -- -- - + -- - -- ++ ++
c ++ -- ++ ++ - -- - ++ - ++ ++
d ++ -- ++ ++ - -- -- ? - ++ --
e ++ -- -- -- - - -- - -- ++ ++
f ++ -- ++ ++ - - -- - + ++ -
g ++ -- -- -- -- -- -- + -- ++ -
h ++ -- -- -- -- -- -- ? - ++ -
i ++ -- ++ ++ - -- ++ + - ++ --
j ++ -- ++ ++ - -- ++ - + ++ +
k ++ -- ++ ++ - -- ++ - - ++ --
l ++ -- ++ ++ - -- ++ - - ++ --
m ++ -- ++ ++ ++ ++ + - + ++ -
n ++ -- ++ ++ ++ ++ - - + ++ +
o ++ -- ? ? ++ ++ - ? ? -- N.A
p ++ -- ++ ++ ++ ++ + -- + ++ -
q ++ -- ++ ++ + ++ + ? + ++ ?
r -- ++ ++ ++ ++ ++ - - -- ++ ?
s ++ ++ ++ ++ -- - - + - ++ ++
t ++ ++ ? ? ++ ++ -- ? + -- N.A
u ++ ++ -- -- + + - - -- ++ ++
v ++ ++ -- -- + + - - -- ++ ++
w ++ -- ++ ? ++ ++ + + - -- N.A
x ++ -- ++ ? + - -- + - -- N.A
y ++ -- ++ ++ ++ ++ - - + ++ -
33 Chapter 2. State of the Art
The table provides information about different sensors that may be applied to the relevant principles. In all cases, and aside from the criteria, it is possible to identify where improvements could be made in sensors, particularly from the point of view of the technology.
We consider that improvements could be made in the following areas helping to fulfil successfully the basic principles:
1) Performance: a standardization process is required for interoperability between various types of sensors. This is raised because the software is proprietary and even the communication in some cases is not foloowing a standard (“a”, “c”, “d”, “m”, “q” ). For example, if a trader gets some category 1 sensors and later wants to take advantage, using them in category 2 devices, this is not possible.
2) Accuracy / acceptability: security in wireless transmissions must be improved in the cases where the biosignals are communicated by the wireless method. The Bluetooth protocol is commonly used but it has some security problems ([140], [141]). It would be desirable therefore to ensure that this data is reliable (accuracy) and protected (acceptability) to avoid security risks. Besides that, if a trader uses stress measurement within a decision making process and somebody can capture and change this parameter, the trading process could be manipulated.
3) Acceptability: the battery life of the sensor in scenarios like a trader is in live trading (Wall Street) is very crucial. It is possible to identify an important area for improvement in all the sensors using batteries. The batteries are possibly too big to wear in many cases. This problem is accentuated in the case of wearable sensors. Longer duration of the batteries and batteries of smaller size would be desirable.
Having considered this comparison, it is possible to identify how sensor technology can assist traders to be aware of their stress. Furthermore, we have suggested some points on how the technology can be improved to fulfill the basic principles of the biometric sensors in trading context. However, in order to ensure the successful integration of the sensor technology in the trading process, it is necessary to establish how to adapt the information on stress levels to the trading process; otherwise the technological support of integration capabilities is lacking [142]. Some aspects to be considered are explained in the next subsection.
2.4.3 Issues in trading process where sensor technology can be deciding
Our approach aims at providing assistance during the trading process by providing psychological data with the technological support offered by new sensors. For this approach, we need to know, firstly, the information that is used in the trading process, how it is possible to complement this information, when it is a suitable time to present to the trader information on her/his stress levels and finally how and what need to be measured to reach an integrated trading process using the new data. In the following, two concepts are presented:
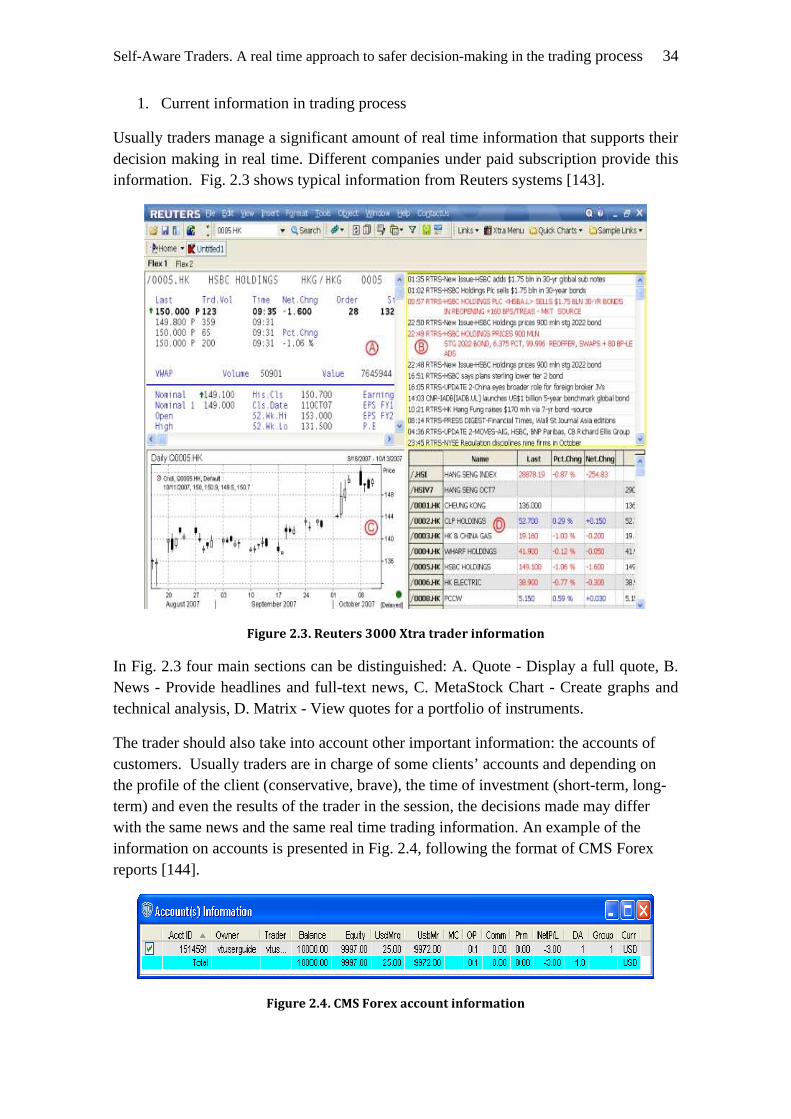
Self-Aware Traders. A real time approach to safer decision-making in the trading process 34
1. Current information in trading process
Usually traders manage a significant amount of real time information that supports their decision making in real time. Different companies under paid subscription provide this information. Fig. 2.3 shows typical information from Reuters systems [143].
Figure 2.3. Reuters 3000 Xtra trader information
In Fig. 2.3 four main sections can be distinguished: A. Quote - Display a full quote, B. News - Provide headlines and full-text news, C. MetaStock Chart - Create graphs and technical analysis, D. Matrix - View quotes for a portfolio of instruments.
The trader should also take into account other important information: the accounts of customers. Usually traders are in charge of some clients’ accounts and depending on the profile of the client (conservative, brave), the time of investment (short-term, long-term) and even the results of the trader in the session, the decisions made may differ with the same news and the same real time trading information. An example of the information on accounts is presented in Fig. 2.4, following the format of CMS Forex reports [144].
Figure 2.4. CMS Forex account information
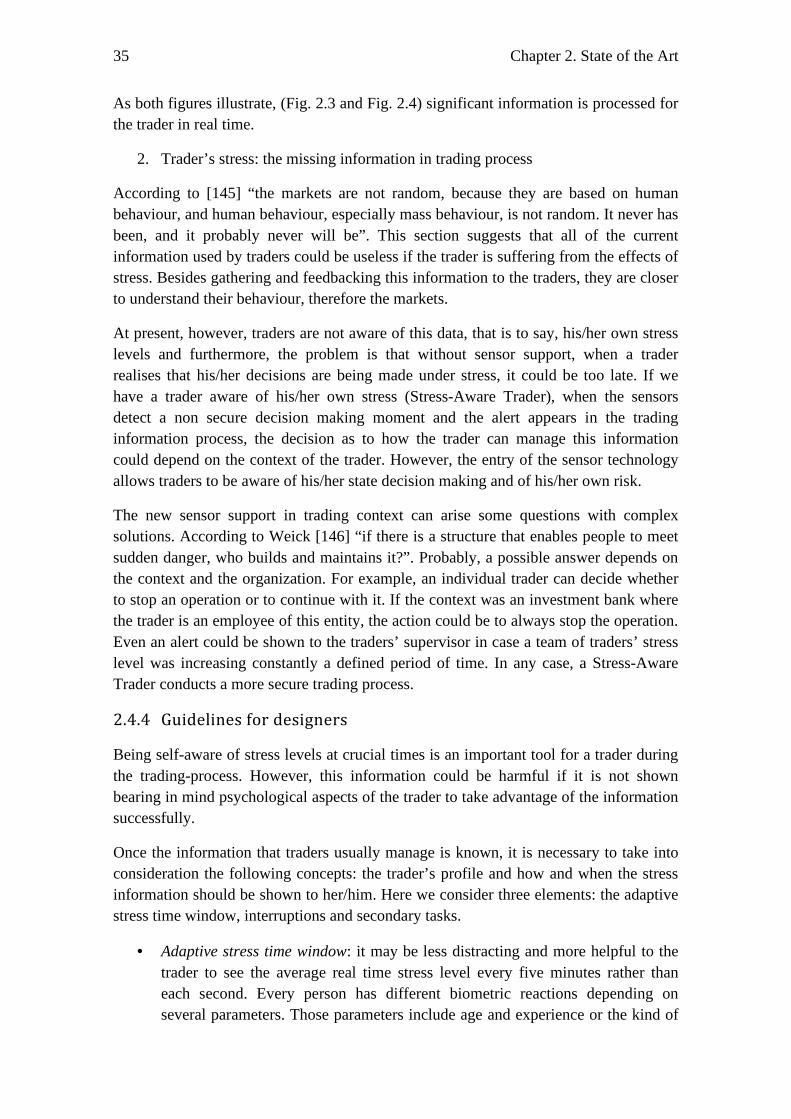
35 Chapter 2. State of the Art
As both figures illustrate, (Fig. 2.3 and Fig. 2.4) significant information is processed for the trader in real time.
2. Trader’s stress: the missing information in trading process
According to [145] “the markets are not random, because they are based on human behaviour, and human behaviour, especially mass behaviour, is not random. It never has been, and it probably never will be”. This section suggests that all of the current information used by traders could be useless if the trader is suffering from the effects of stress. Besides gathering and feedbacking this information to the traders, they are closer to understand their behaviour, therefore the markets.
At present, however, traders are not aware of this data, that is to say, his/her own stress levels and furthermore, the problem is that without sensor support, when a trader realises that his/her decisions are being made under stress, it could be too late. If we have a trader aware of his/her own stress (Stress-Aware Trader), when the sensors detect a non secure decision making moment and the alert appears in the trading information process, the decision as to how the trader can manage this information could depend on the context of the trader. However, the entry of the sensor technology allows traders to be aware of his/her state decision making and of his/her own risk.
The new sensor support in trading context can arise some questions with complex solutions. According to Weick [146] “if there is a structure that enables people to meet sudden danger, who builds and maintains it?”. Probably, a possible answer depends on the context and the organization. For example, an individual trader can decide whether to stop an operation or to continue with it. If the context was an investment bank where the trader is an employee of this entity, the action could be to always stop the operation. Even an alert could be shown to the traders’ supervisor in case a team of traders’ stress level was increasing constantly a defined period of time. In any case, a Stress-Aware Trader conducts a more secure trading process.
2.4.4 Guidelines for designers
Being self-aware of stress levels at crucial times is an important tool for a trader during the trading-process. However, this information could be harmful if it is not shown bearing in mind psychological aspects of the trader to take advantage of the information successfully.
Once the information that traders usually manage is known, it is necessary to take into consideration the following concepts: the trader’s profile and how and when the stress information should be shown to her/him. Here we consider three elements: the adaptive stress time window, interruptions and secondary tasks.
• Adaptive stress time window: it may be less distracting and more helpful to the trader to see the average real time stress level every five minutes rather than each second. Every person has different biometric reactions depending on several parameters. Those parameters include age and experience or the kind of
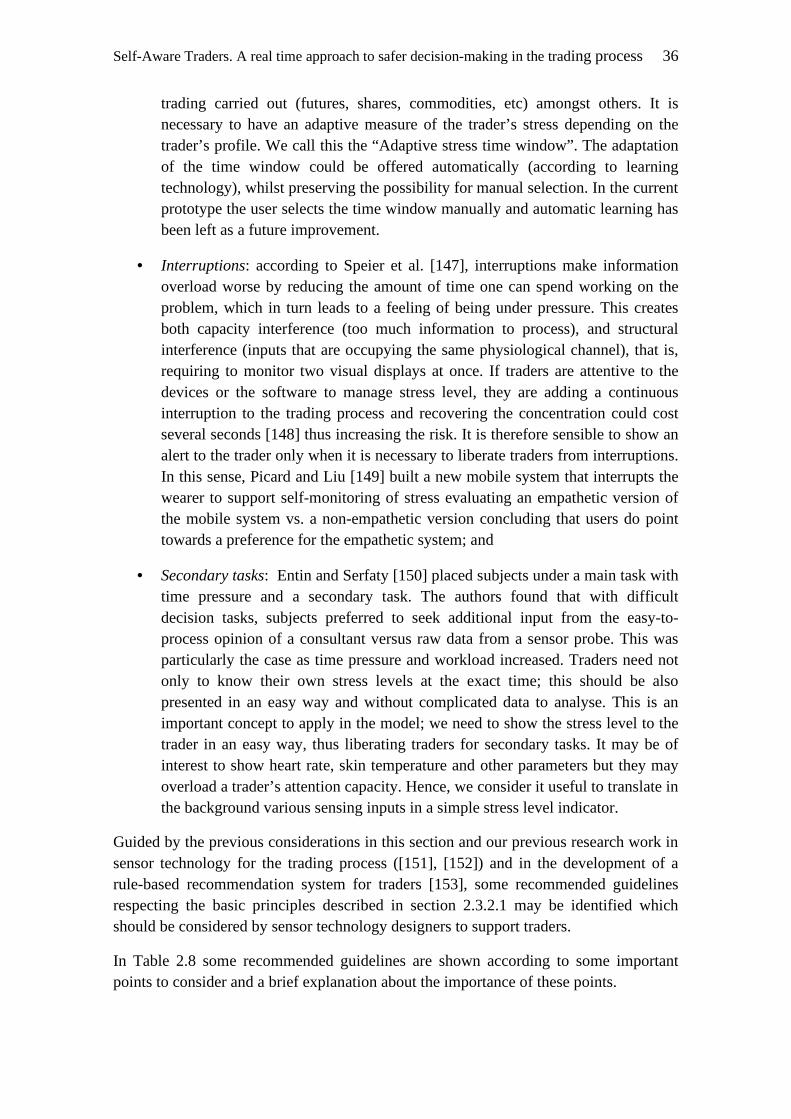
Self-Aware Traders. A real time approach to safer decision-making in the trading process 36
trading carried out (futures, shares, commodities, etc) amongst others. It is necessary to have an adaptive measure of the trader’s stress depending on the trader’s profile. We call this the “Adaptive stress time window”. The adaptation of the time window could be offered automatically (according to learning technology), whilst preserving the possibility for manual selection. In the current prototype the user selects the time window manually and automatic learning has been left as a future improvement.
• Interruptions: according to Speier et al. [147], interruptions make information overload worse by reducing the amount of time one can spend working on the problem, which in turn leads to a feeling of being under pressure. This creates both capacity interference (too much information to process), and structural interference (inputs that are occupying the same physiological channel), that is, requiring to monitor two visual displays at once. If traders are attentive to the devices or the software to manage stress level, they are adding a continuous interruption to the trading process and recovering the concentration could cost several seconds [148] thus increasing the risk. It is therefore sensible to show an alert to the trader only when it is necessary to liberate traders from interruptions. In this sense, Picard and Liu [149] built a new mobile system that interrupts the wearer to support self-monitoring of stress evaluating an empathetic version of the mobile system vs. a non-empathetic version concluding that users do point towards a preference for the empathetic system; and
• Secondary tasks: Entin and Serfaty [150] placed subjects under a main task with time pressure and a secondary task. The authors found that with difficult decision tasks, subjects preferred to seek additional input from the easy-to-process opinion of a consultant versus raw data from a sensor probe. This was particularly the case as time pressure and workload increased. Traders need not only to know their own stress levels at the exact time; this should be also presented in an easy way and without complicated data to analyse. This is an important concept to apply in the model; we need to show the stress level to the trader in an easy way, thus liberating traders for secondary tasks. It may be of interest to show heart rate, skin temperature and other parameters but they may overload a trader’s attention capacity. Hence, we consider it useful to translate in the background various sensing inputs in a simple stress level indicator.
Guided by the previous considerations in this section and our previous research work in sensor technology for the trading process ([151], [152]) and in the development of a rule-based recommendation system for traders [153], some recommended guidelines respecting the basic principles described in section 2.3.2.1 may be identified which should be considered by sensor technology designers to support traders.
In Table 2.8 some recommended guidelines are shown according to some important points to consider and a brief explanation about the importance of these points.
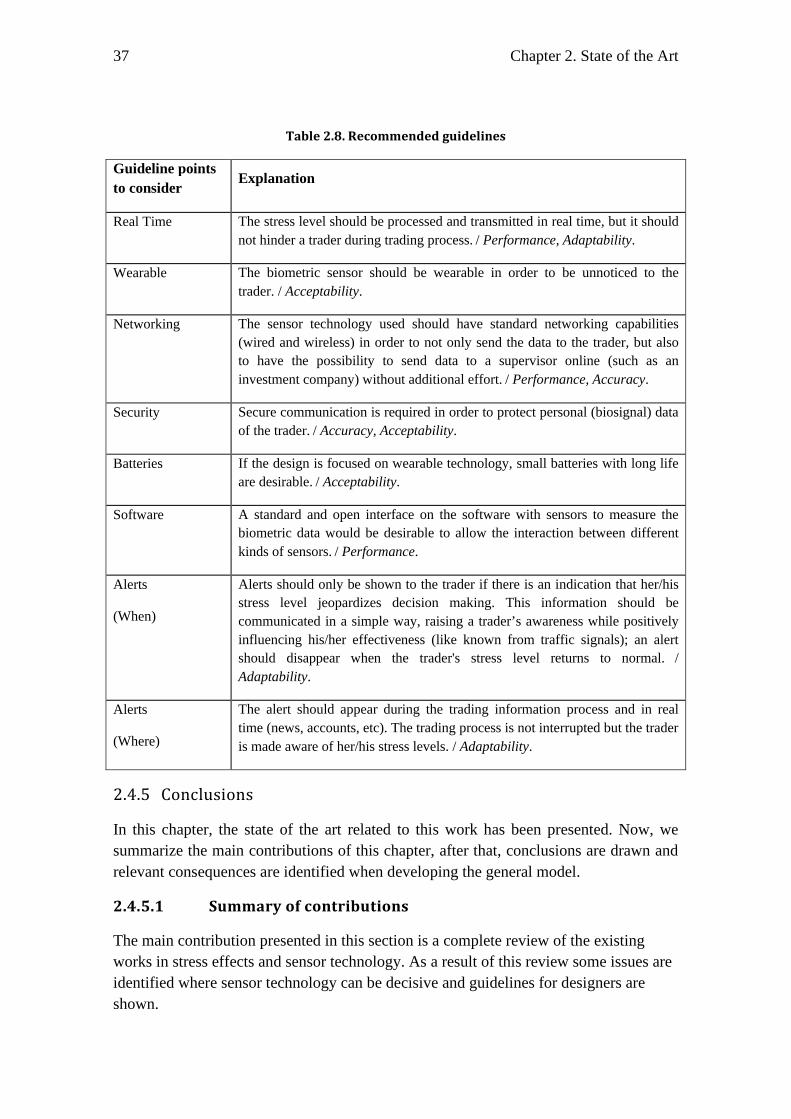
37 Chapter 2. State of the Art
Table 2.8. Recommended guidelines
Guideline points to consider
Explanation
Real Time The stress level should be processed and transmitted in real time, but it should not hinder a trader during trading process. / Performance, Adaptability.
Wearable The biometric sensor should be wearable in order to be unnoticed to the trader. / Acceptability.
Networking The sensor technology used should have standard networking capabilities (wired and wireless) in order to not only send the data to the trader, but also to have the possibility to send data to a supervisor online (such as an investment company) without additional effort. / Performance, Accuracy.
Security Secure communication is required in order to protect personal (biosignal) data of the trader. / Accuracy, Acceptability.
Batteries If the design is focused on wearable technology, small batteries with long life are desirable. / Acceptability.
Software A standard and open interface on the software with sensors to measure the biometric data would be desirable to allow the interaction between different kinds of sensors. / Performance.
Alerts
(When)
Alerts should only be shown to the trader if there is an indication that her/his stress level jeopardizes decision making. This information should be communicated in a simple way, raising a trader’s awareness while positively influencing his/her effectiveness (like known from traffic signals); an alert should disappear when the trader's stress level returns to normal. / Adaptability.
Alerts
(Where)
The alert should appear during the trading information process and in real time (news, accounts, etc). The trading process is not interrupted but the trader is made aware of her/his stress levels. / Adaptability.
2.4.5 Conclusions
In this chapter, the state of the art related to this work has been presented. Now, we summarize the main contributions of this chapter, after that, conclusions are drawn and relevant consequences are identified when developing the general model.
2.4.5.1 Summary of contributions
The main contribution presented in this section is a complete review of the existing works in stress effects and sensor technology. As a result of this review some issues are identified where sensor technology can be decisive and guidelines for designers are shown.
Self-Aware Traders. A real time approach to safer decision-making in the trading process 38
1. Complementing and supplementing existing works in stress effects and sensor technology: The existing studies about stress and sensor technology are focused in their specific disciplines. This chapter applies these studies to the trading process since decision making is the main tool used by traders and provides a detailed review of these fields in the context of trading. Additionally, a detailed discussion is provided about the design of the sensors currently available in the commercial market (Table 2.2-2-6). This discussion is based on proposed basic biometric principles in the trading process (Table 2.1). As a result of a comparison (Table 2.7) between the products some weak points have been detected and several recommendations have been stated (Table 2.8).
Some important current research projects have been presented, these projects are dedicated to sport, health care and work but the trading process is not an exception.
Furthermore, this survey significantly complements and expands our previous work in this area ([151], [152], [153]). Even if we want to help traders with one automatic trading process ([8], [9], [10], [153]), we need to understand not only the technology but also the psychological approach to understand how we can design the system in a right way.
2. Identifying basic biometric principles in sensor technology applicable to a trading process: Usually biometric sensor principles [99] are focused on identification purposes. In this work, we change slightly the focus and we propose basic principles focused on the state of the trader. These principles are used to compare the existing available sensors in the market and give us the clue of what we need to assess to a successful integration of sensor support in a trading process.
3. Identifying issues in the trading process where sensor technology can be decisive: Whereas [75] and [86] show the connection between emotions of traders and the movement of the financial market with sensor technology, the work presented in this section identifies the potentially crucial role of sensor technology in the trading process. Sensor technology could be used to enable traders to become aware of their stress levels when making decisions, thus covering this current information gap. In this way, sensor technology becomes an active element in the trading process.
4. Guidelines for designers: Another contribution of this chapter is the identification of some common needs that are desirable for the successful integration of sensor technology in the trading process. It does so by explicitly highlighting some studies ([147], [148], [149], [150]) about the importance of how sensors should show the relevant data to traders and in this context, the parameters that should be adapted (manually or automatically) to the trader’s profile preference (stress time window). The purpose of the discussion about Table 2.7 in this work is to consider some characteristics to obtain the most
39 Chapter 2. State of the Art
suitable sensing infrastructure for the trading progress giving some recommended guidelines for designers in Table 2.8.
2.4.5.2 Main conclusions
The main conclusions after the study of the state of the art are the following:
• Studies on stress show that this mental state can have a significant impact on our daily life and decision making process. However, there is little done on how to prevent its consequences. Most efforts are focused on managing its consequences.
• Traders have real time information to help them in the decision making process. However, one of the most fundamental pieces of information traders usually do not have is an objective measure of their own mental state and stress level.
• Trading is a clear example where people can benefit enormously by managing the problem before it appears (avoiding bad decision making) instead of trying to manage the consequences (dealing with bankruptcy and ill health).
• Higher stress is detected with lower BVP values, higher BR, EMG, GSR, SCR, HR values and changes in TEMP, EOG, and HRV.
• Sensor technology can measure and detect changes in real time in these biometric variables.
• It is necessary to define biometric sensor principles under trading context in order to allow a complete integration of the sensor technology in the trading process.
• It is possible to select the suitable sensor for the trading process studying the current sensors in the commercial market under these biometric sensor principles.
• Taking advantage of this technology we can design a solution allowing traders to be aware of their own stress level, and improve decision making in the trading process.
• Psychological aspects must be considered along with technical aspects in the design of the system (how show the information, bear in mind the trader’s profile, avoid monitor the trader in an intrusive way, etc...)
2.4.5.3 Concluding remarks and new directions
This chapter merges different disciplines as stress effects in decision making, biological stress parameters or sensor technology. From the study of the art of these disciplines applied in trading context we detected the following main gaps to cover:
Self-Aware Traders. A real time approach to safer decision-making in the trading process 40
• Stress level has a high impact in the trader’s decision making process jeopardizing the trading process. Currently there is no information available to feedback to the traders about their stress level.
• The technological evolution in the trading process has been oriented to maximize the external information (news, charts, automatic trading systems…) to support traders. The main actor in the trading process is the trader and his/her own biometric information is not considered in the decision making process.
• The current biometric sensors available in the commercial market are not designed for trading discipline. The biometric sensor principles focused in trading process would help to integrate this technology in trading process.
To close these gaps we propose the design of the Self-Aware Trader system supporting the trader’s decision making process allowing feedback of his/her own stress levels. This information could be gathered with the sensors available in the market and we can base on some psychological studies to integrate this information within trading information. Besides, extending the Stress-Aware Trader concept to a group of traders, we could create Group-Aware information as being highly valuable information for different uses (supervisors managing an investment company, detecting panic moments in the market, etc).
Thanks to the study of the sensors available in the market we saw in detail what it is possible to get with these kinds of devices. Besides, the current research projects described show the usual measurements in circumstances what we can extrapolate to the trading context (heart rate, ECG). It is possible now to take the following steps of this work, the sensor selection and the construction of a model to allow feedback to the user of his/her own stress levels. These steps will be described in the next chapter.
Furthermore, this state of the art provides the foundation for understanding the important role that sensors have in the trading process and it is hoped that it will inspire other researchers to take up the challenge to investigate some of the issues raised in this chapter as combinations from different disciplines such as trading (economy), stress (medical) and sensors (technological).
Chapter 3
3. SELF-AWARE TRADER SYSTEM
En este capítulo, se introduce el sistema Self-Aware Trader en el que se basará esta tesis y la arquitectura específica aplicada a la misma. En primer lugar, se presenta de forma razonada el sensor escogido para la realización del sistema. A continuación, se describe el modelo utilizado y se presentan tanto la arquitectura global del modelo como la arquitectura específica para el ámbito de esta tesis: el trading. Se presentan los modos de funcionamiento del sistema, individual y grupal, cerrándose el capítulo con los algoritmos seguidos en el desarrollo del software. In this chapter, the Self-Aware Trader system and the specific architecture applied are presented. Firstly the selection of the sensor is discussed. After that, the model is described as well as the general and the specific architectures used on this work. The operational modes of the system: individual and group are shown. Later, a detailed explanation of the algorithms is given and the implementation of the software is presented.
3.1 INTRODUCTION
The previous chapter highlights the importance of traders’ stress due to its impact in their decision making process. This chapter tries to cover the existing gap detected in chapter 2 to feedback the stress level information to the traders, currently missing in the trading process. This chapter explains the development of a concrete model and its implementation to cover this gap and help traders in their daily work.
Firstly we explain the sensor selection to gather the biometric data from the trader. Additionally, we will show how we use the software included in the sensor kit and how we define a stress level indicator taking as input to our system the biometric measures gathered with the sensor.
The main architecture is defined bearing in mind the conclusions extracted from the state of the art, chapter 2, and the objectives defined in chapter 1.
It is possible to see in the state of the art the variety of fields where stress has a high impact on human work. Existing models are focusing on very different areas and none of the documented systems support trading taking into account the stress level of the own trader. It was necessary to design a flexible platform supporting individual and group mode working with real time data acquisition and processing.
We are going to show the general architecture designed and the concrete architecture applied in trading context, taking into account the specific variables of the trading (every context has different specific variables). The use of a general architecture is an
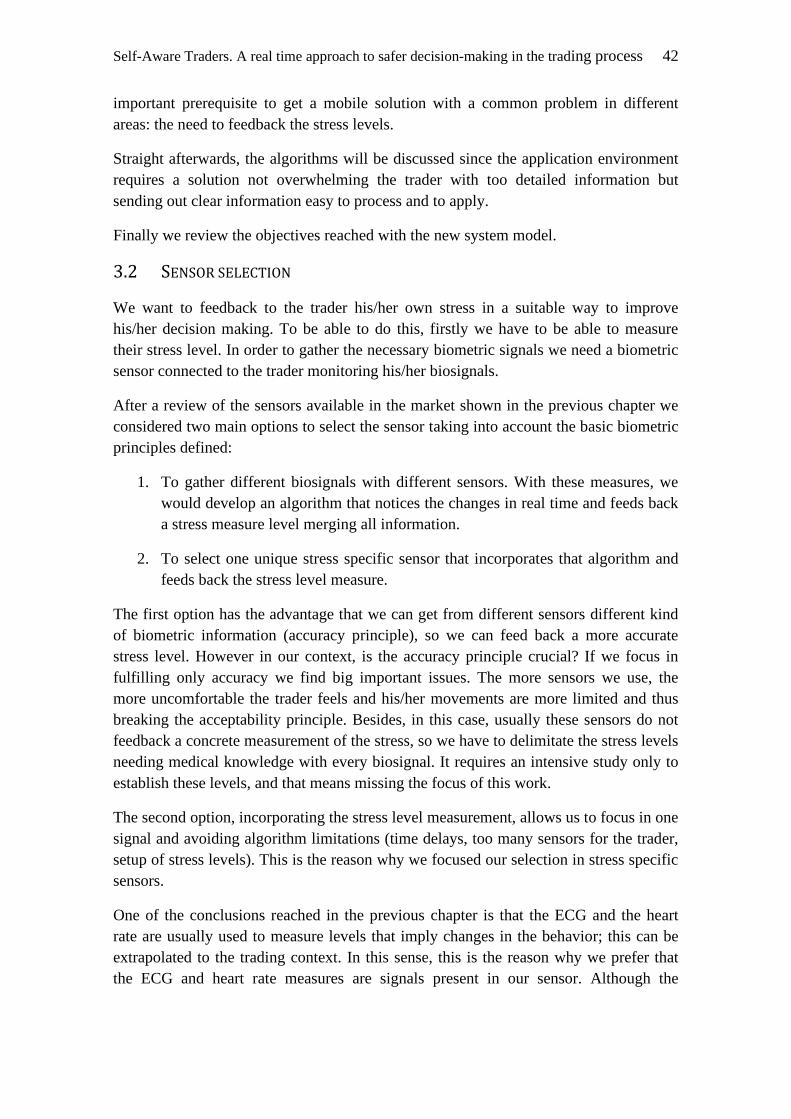
Self-Aware Traders. A real time approach to safer decision-making in the trading process 42
important prerequisite to get a mobile solution with a common problem in different areas: the need to feedback the stress levels.
Straight afterwards, the algorithms will be discussed since the application environment requires a solution not overwhelming the trader with too detailed information but sending out clear information easy to process and to apply.
Finally we review the objectives reached with the new system model.
3.2 SENSOR SELECTION
We want to feedback to the trader his/her own stress in a suitable way to improve his/her decision making. To be able to do this, firstly we have to be able to measure their stress level. In order to gather the necessary biometric signals we need a biometric sensor connected to the trader monitoring his/her biosignals.
After a review of the sensors available in the market shown in the previous chapter we considered two main options to select the sensor taking into account the basic biometric principles defined:
1. To gather different biosignals with different sensors. With these measures, we would develop an algorithm that notices the changes in real time and feeds back a stress measure level merging all information.
2. To select one unique stress specific sensor that incorporates that algorithm and feeds back the stress level measure.
The first option has the advantage that we can get from different sensors different kind of biometric information (accuracy principle), so we can feed back a more accurate stress level. However in our context, is the accuracy principle crucial? If we focus in fulfilling only accuracy we find big important issues. The more sensors we use, the more uncomfortable the trader feels and his/her movements are more limited and thus breaking the acceptability principle. Besides, in this case, usually these sensors do not feedback a concrete measurement of the stress, so we have to delimitate the stress levels needing medical knowledge with every biosignal. It requires an intensive study only to establish these levels, and that means missing the focus of this work.
The second option, incorporating the stress level measurement, allows us to focus in one signal and avoiding algorithm limitations (time delays, too many sensors for the trader, setup of stress levels). This is the reason why we focused our selection in stress specific sensors.
One of the conclusions reached in the previous chapter is that the ECG and the heart rate are usually used to measure levels that imply changes in the behavior; this can be extrapolated to the trading context. In this sense, this is the reason why we prefer that the ECG and heart rate measures are signals present in our sensor. Although the
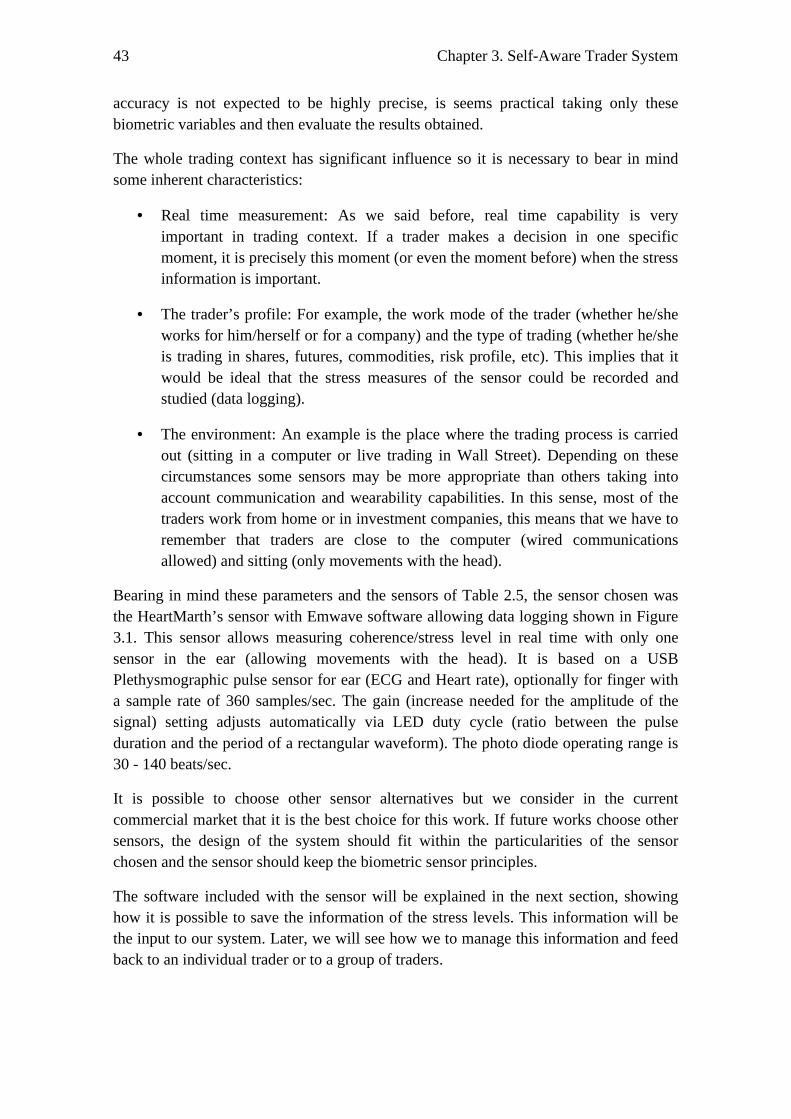
43 Chapter 3. Self-Aware Trader System
accuracy is not expected to be highly precise, is seems practical taking only these biometric variables and then evaluate the results obtained.
The whole trading context has significant influence so it is necessary to bear in mind some inherent characteristics:
• Real time measurement: As we said before, real time capability is very important in trading context. If a trader makes a decision in one specific moment, it is precisely this moment (or even the moment before) when the stress information is important.
• The trader’s profile: For example, the work mode of the trader (whether he/she works for him/herself or for a company) and the type of trading (whether he/she is trading in shares, futures, commodities, risk profile, etc). This implies that it would be ideal that the stress measures of the sensor could be recorded and studied (data logging).
• The environment: An example is the place where the trading process is carried out (sitting in a computer or live trading in Wall Street). Depending on these circumstances some sensors may be more appropriate than others taking into account communication and wearability capabilities. In this sense, most of the traders work from home or in investment companies, this means that we have to remember that traders are close to the computer (wired communications allowed) and sitting (only movements with the head).
Bearing in mind these parameters and the sensors of Table 2.5, the sensor chosen was the HeartMarth’s sensor with Emwave software allowing data logging shown in Figure 3.1. This sensor allows measuring coherence/stress level in real time with only one sensor in the ear (allowing movements with the head). It is based on a USB Plethysmographic pulse sensor for ear (ECG and Heart rate), optionally for finger with a sample rate of 360 samples/sec. The gain (increase needed for the amplitude of the signal) setting adjusts automatically via LED duty cycle (ratio between the pulse duration and the period of a rectangular waveform). The photo diode operating range is 30 - 140 beats/sec.
It is possible to choose other sensor alternatives but we consider in the current commercial market that it is the best choice for this work. If future works choose other sensors, the design of the system should fit within the particularities of the sensor chosen and the sensor should keep the biometric sensor principles.
The software included with the sensor will be explained in the next section, showing how it is possible to save the information of the stress levels. This information will be the input to our system. Later, we will see how we to manage this information and feed back to an individual trader or to a group of traders.
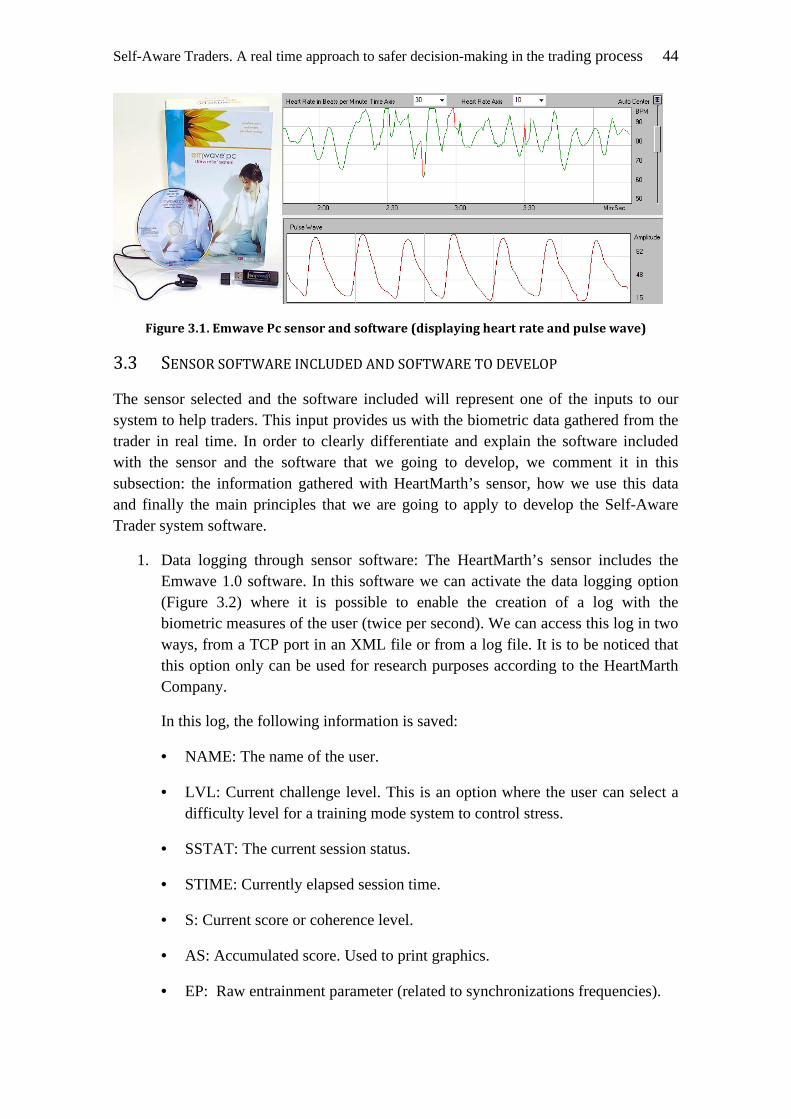
Self-Aware Traders. A real time approach to safer decision-making in the trading process 44
Figure 3.1. Emwave Pc sensor and software (displaying heart rate and pulse wave)
3.3 SENSOR SOFTWARE INCLUDED AND SOFTWARE TO DEVELOP
The sensor selected and the software included will represent one of the inputs to our system to help traders. This input provides us with the biometric data gathered from the trader in real time. In order to clearly differentiate and explain the software included with the sensor and the software that we going to develop, we comment it in this subsection: the information gathered with HeartMarth’s sensor, how we use this data and finally the main principles that we are going to apply to develop the Self-Aware Trader system software.
1. Data logging through sensor software: The HeartMarth’s sensor includes the Emwave 1.0 software. In this software we can activate the data logging option (Figure 3.2) where it is possible to enable the creation of a log with the biometric measures of the user (twice per second). We can access this log in two ways, from a TCP port in an XML file or from a log file. It is to be noticed that this option only can be used for research purposes according to the HeartMarth Company.
In this log, the following information is saved:
• NAME: The name of the user.
• LVL: Current challenge level. This is an option where the user can select a difficulty level for a training mode system to control stress.
• SSTAT: The current session status.
• STIME: Currently elapsed session time.
• S: Current score or coherence level.
• AS: Accumulated score. Used to print graphics.
• EP: Raw entrainment parameter (related to synchronizations frequencies).
45 Chapter 3. Self-Aware Trader System
• IBI: Last interbeat interval.
• ART: Artifact in input detected.
• HR: Current heart rate.
• PPG: Photoplethysmography values.
• FFT: Typical power spectrum set of values. Used to calculate by Emwave the coherence level (S).
It is possible to see these parameters in the next log example (indicated in italics). In this example, it shows the values measured and saved in the second 546000:
546000 NAME: Javier Martínez Fernández
LVL: 1
SSTAT: 2
STIME: 546000
S:0 AS: 12 EP: 10 IBI: 814 ART: FALSE HR: 73
546000 PPG: 76.4160 72.0215 70.8008
546000 IBI: 809
546000 PPG: 57.6172 55.9082 56.1523
546000 PPG: 56.3965 54.9316 50.7813 45.6543
546000 PPG: 42.7246 42.4805 42.9688 42.2363
546000 PPG: 40.2832 36.3770 32.7148
546000 PPG: 30.7617 32.4707 35.1563 36.3770
546000 PPG: 34.1797 29.5410 24.9023
546000 PPG: 24.1699 27.3438 31.9824
546000 FFT: 195.96 146.84 25.30 5.00 30.67 60.09 73.45 29.31 49.06 74.74 9.48 3.12 0.06 23.51 36.85 67.70 28.26 17.31 4.42 0.81 4.37 6.16 4.71 0.36 3.69 2.90 8.89 1.00 6.05 14.27 13.83 2.75 1.62 1.08 2.01 1.25 0.87 4.91 10.92 8.02 0.01 3.04 1.09 1.88 9.14 7.97 3.08 1.09 1.32 5.66 5.42 0.15 1.01 0.43 1.35 2.00 0.90 3.72 5.29 2.41 0.26 1.86 5.77 2.38
In this example the complete log with all the options is shown. We can select the concrete variables that we want to save in the log or send it via TCP to external
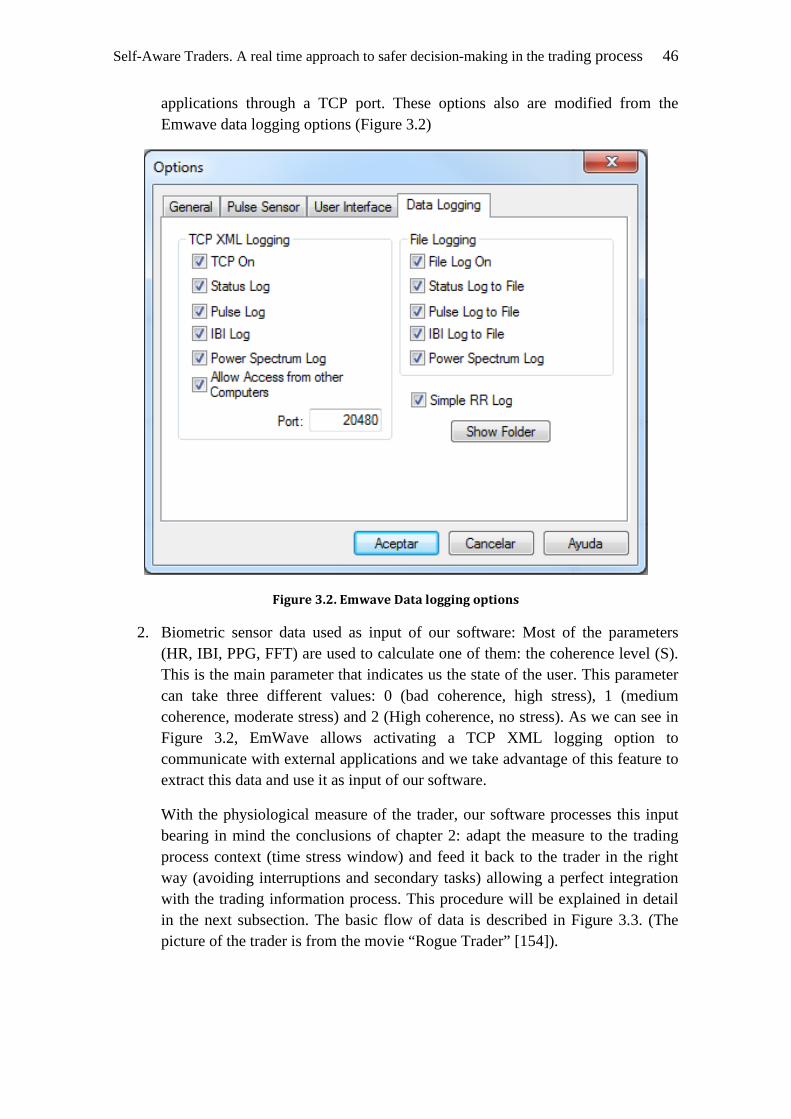
Self-Aware Traders. A real time approach to safer decision-making in the trading process 46
applications through a TCP port. These options also are modified from the Emwave data logging options (Figure 3.2)
Figure 3.2. Emwave Data logging options
2. Biometric sensor data used as input of our software: Most of the parameters (HR, IBI, PPG, FFT) are used to calculate one of them: the coherence level (S). This is the main parameter that indicates us the state of the user. This parameter can take three different values: 0 (bad coherence, high stress), 1 (medium coherence, moderate stress) and 2 (High coherence, no stress). As we can see in Figure 3.2, EmWave allows activating a TCP XML logging option to communicate with external applications and we take advantage of this feature to extract this data and use it as input of our software.
With the physiological measure of the trader, our software processes this input bearing in mind the conclusions of chapter 2: adapt the measure to the trading process context (time stress window) and feed it back to the trader in the right way (avoiding interruptions and secondary tasks) allowing a perfect integration with the trading information process. This procedure will be explained in detail in the next subsection. The basic flow of data is described in Figure 3.3. (The picture of the trader is from the movie “Rogue Trader” [154]).
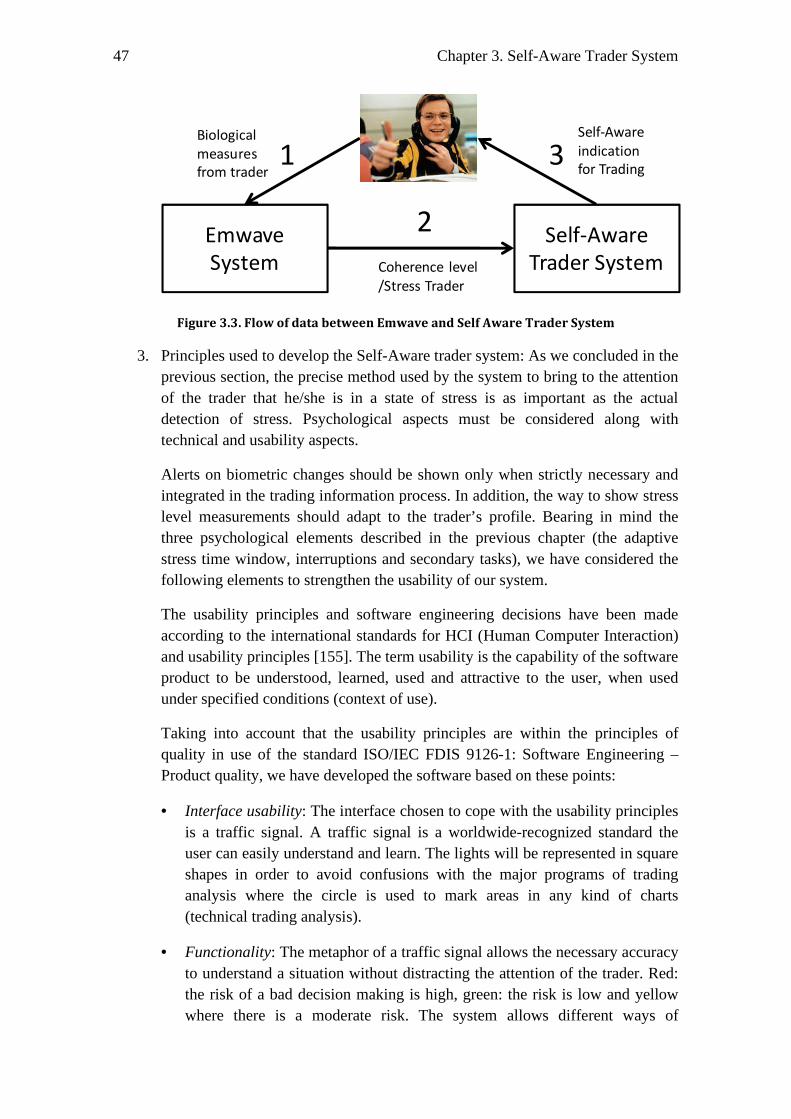
47 Chapter 3. Self-Aware Trader System
Self-Aware
Trader System
Emwave
System
2
Coherence level
/Stress Trader
1Biological
measures
from trader3
Self-Aware
indication
for Trading
Figure 3.3. Flow of data between Emwave and Self Aware Trader System
3. Principles used to develop the Self-Aware trader system: As we concluded in the previous section, the precise method used by the system to bring to the attention of the trader that he/she is in a state of stress is as important as the actual detection of stress. Psychological aspects must be considered along with technical and usability aspects.
Alerts on biometric changes should be shown only when strictly necessary and integrated in the trading information process. In addition, the way to show stress level measurements should adapt to the trader’s profile. Bearing in mind the three psychological elements described in the previous chapter (the adaptive stress time window, interruptions and secondary tasks), we have considered the following elements to strengthen the usability of our system.
The usability principles and software engineering decisions have been made according to the international standards for HCI (Human Computer Interaction) and usability principles [155]. The term usability is the capability of the software product to be understood, learned, used and attractive to the user, when used under specified conditions (context of use).
Taking into account that the usability principles are within the principles of quality in use of the standard ISO/IEC FDIS 9126-1: Software Engineering – Product quality, we have developed the software based on these points:
• Interface usability: The interface chosen to cope with the usability principles is a traffic signal. A traffic signal is a worldwide-recognized standard the user can easily understand and learn. The lights will be represented in square shapes in order to avoid confusions with the major programs of trading analysis where the circle is used to mark areas in any kind of charts (technical trading analysis).
• Functionality: The metaphor of a traffic signal allows the necessary accuracy to understand a situation without distracting the attention of the trader. Red: the risk of a bad decision making is high, green: the risk is low and yellow where there is a moderate risk. The system allows different ways of
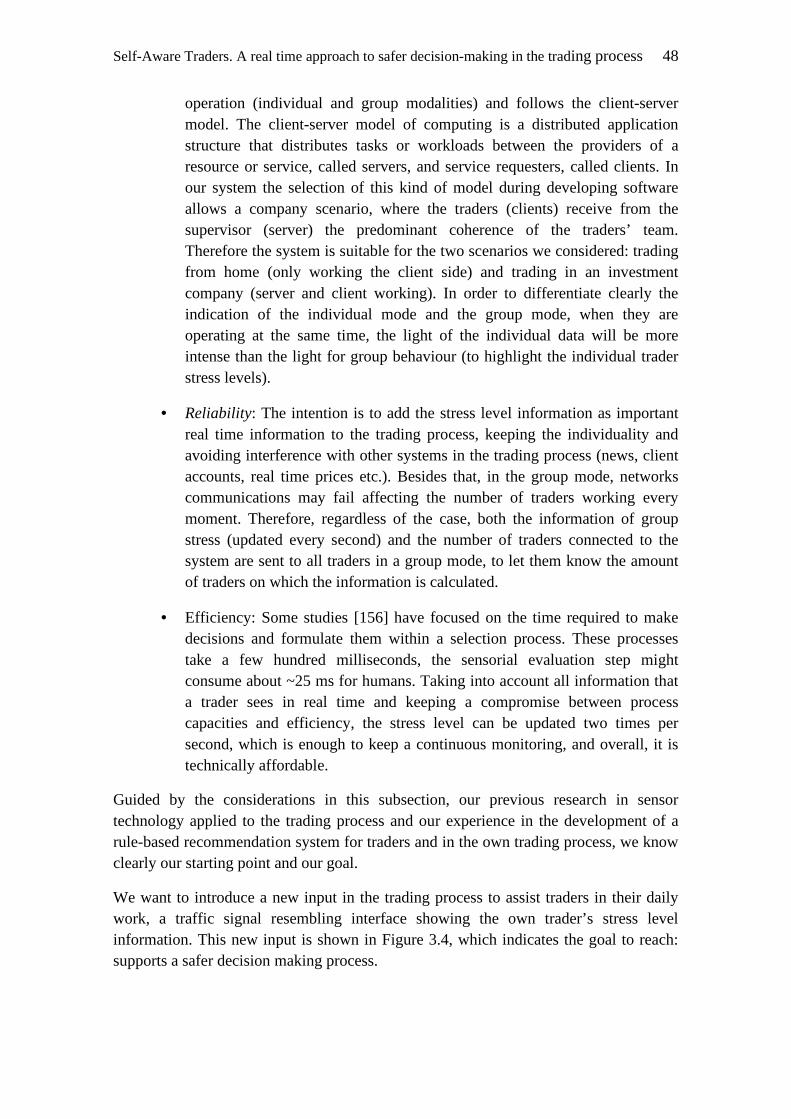
Self-Aware Traders. A real time approach to safer decision-making in the trading process 48
operation (individual and group modalities) and follows the client-server model. The client-server model of computing is a distributed application structure that distributes tasks or workloads between the providers of a resource or service, called servers, and service requesters, called clients. In our system the selection of this kind of model during developing software allows a company scenario, where the traders (clients) receive from the supervisor (server) the predominant coherence of the traders’ team. Therefore the system is suitable for the two scenarios we considered: trading from home (only working the client side) and trading in an investment company (server and client working). In order to differentiate clearly the indication of the individual mode and the group mode, when they are operating at the same time, the light of the individual data will be more intense than the light for group behaviour (to highlight the individual trader stress levels).
• Reliability: The intention is to add the stress level information as important real time information to the trading process, keeping the individuality and avoiding interference with other systems in the trading process (news, client accounts, real time prices etc.). Besides that, in the group mode, networks communications may fail affecting the number of traders working every moment. Therefore, regardless of the case, both the information of group stress (updated every second) and the number of traders connected to the system are sent to all traders in a group mode, to let them know the amount of traders on which the information is calculated.
• Efficiency: Some studies [156] have focused on the time required to make decisions and formulate them within a selection process. These processes take a few hundred milliseconds, the sensorial evaluation step might consume about ~25 ms for humans. Taking into account all information that a trader sees in real time and keeping a compromise between process capacities and efficiency, the stress level can be updated two times per second, which is enough to keep a continuous monitoring, and overall, it is technically affordable.
Guided by the considerations in this subsection, our previous research in sensor technology applied to the trading process and our experience in the development of a rule-based recommendation system for traders and in the own trading process, we know clearly our starting point and our goal.
We want to introduce a new input in the trading process to assist traders in their daily work, a traffic signal resembling interface showing the own trader’s stress level information. This new input is shown in Figure 3.4, which indicates the goal to reach: supports a safer decision making process.
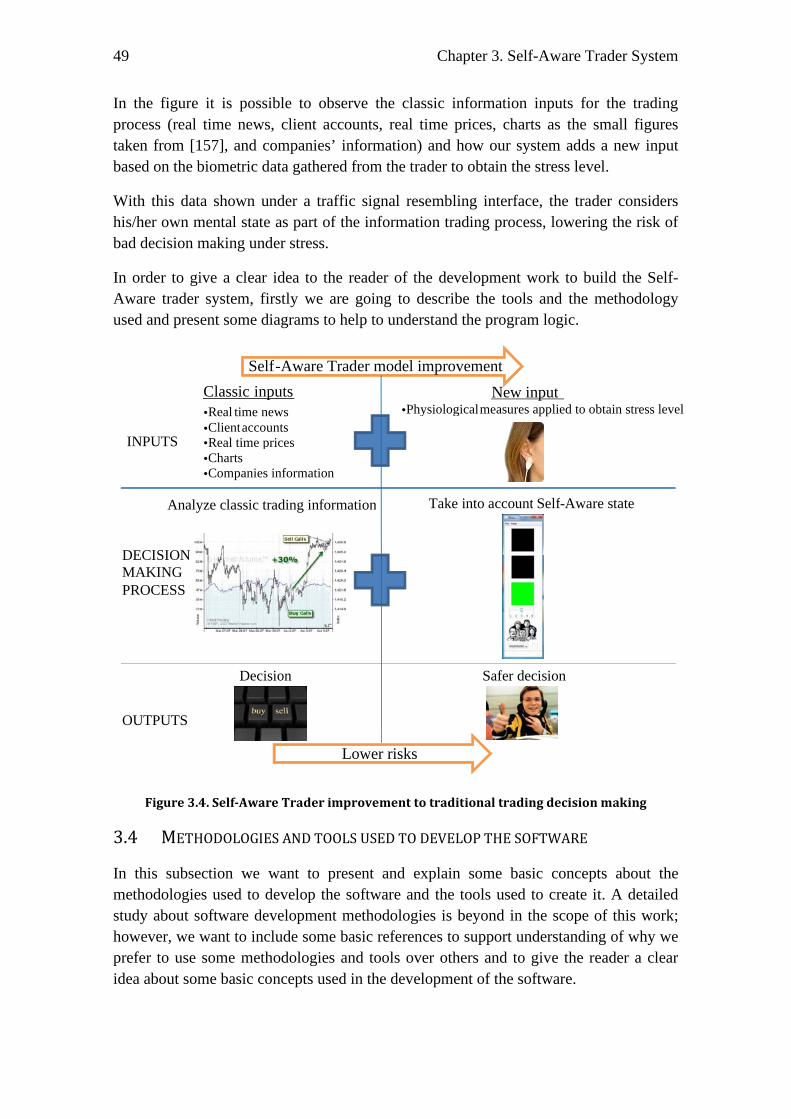
49 Chapter 3. Self-Aware Trader System
In the figure it is possible to observe the classic information inputs for the trading process (real time news, client accounts, real time prices, charts as the small figures taken from [157], and companies’ information) and how our system adds a new input based on the biometric data gathered from the trader to obtain the stress level.
With this data shown under a traffic signal resembling interface, the trader considers his/her own mental state as part of the information trading process, lowering the risk of bad decision making under stress.
In order to give a clear idea to the reader of the development work to build the Self-Aware trader system, firstly we are going to describe the tools and the methodology used and present some diagrams to help to understand the program logic.
Figure 3.4. Self-Aware Trader improvement to traditional trading decision making
3.4 METHODOLOGIES AND TOOLS USED TO DEVELOP THE SOFTWARE
In this subsection we want to present and explain some basic concepts about the methodologies used to develop the software and the tools used to create it. A detailed study about software development methodologies is beyond in the scope of this work; however, we want to include some basic references to support understanding of why we prefer to use some methodologies and tools over others and to give the reader a clear idea about some basic concepts used in the development of the software.
New input • Physiological measures applied to obtain stress level
Safer decision
Lower risks
Self-Aware Trader model improvement
Classic inputs
INPUTS
OUTPUTS
DECISIONMAKING
PROCESS
•Real time news•Client accounts•Real time prices •Charts•Companies information
Decision
Analyze classic trading information Take into account Self-Aware state

Self-Aware Traders. A real time approach to safer decision-making in the trading process 50
The Self-Aware Trader system has been designed bearing in mind the crucial role of the traders’ acceptability and the integration with the other trading information systems.
The author considers from his own experience as trader the importance of the continuous feedback to traders from global concepts to small details to reach a full satisfaction in the use of the system allowing a full integration in their daily work. Therefore every piece of software has been tested in advance (from internal changes in data bases to small details in interface). This is a crucial point to decide that we prefer a methodology that highlights the feedback of the users in every moment of the development, in this case, the traders.
We have decided to use of an Iterative and incremental development methodology (called IID) [158]. With IID, the system is developed through iterative cycles and in incremental time periods. In this way, it is possible to take advantage of the accumulated experience of previous versions. In each iteration, it is important to obtain the user’s feedback to enhance the previous version.
We decide to use a program design that will be able to be reutilized, changing only the proper characteristics of the context domain. Therefore, our software design follows the Object Oriented Design paradigm (called OOD). Object Oriented Design (OOD) is based on three important concepts in software design: modularity, abstraction, and encapsulation. OOD concepts were first introduced by Abbot in 1983 [159] and were subsequently enhanced by Booch in 1986 [160].
We have used some diagrams to represent the classes and the objects used in the development. Some of these diagrams will be shown in the next subsections. These have been made under UML (current version 2.0 [161], [162]). The Unified Modeling Language (UML) is currently the standard notation for software architecture (including structural and behavioural views). The UML includes the following representations: use case diagrams, sequence diagrams, interaction diagrams, collaboration diagrams, etc.
There are a lot of tools to draw these diagrams. We used Visual Paradigm for UML 8.2 Community Edition [163].
The programming language chosen to fit with these methodologies has been Java. Java [164] is an object-oriented programming language designed to have few implementation dependencies. It was originally developed by James Gosling at Sun Microsystems and released in 1995 as a core component of Sun Microsystems' Java platform.
After choosing the program language, we select the Netbeans platform 6.91 [165] to as the Integrated Development Environment (IDE). NetBeans is an open-source software development project. NetBeans started as a student project (originally called Xelfi) in 1996. Xelfi was the first Java IDE written in Java, with its first pre-releases in 1997 [166].
We have selected the Netbeans platform instead other platforms (as eclipse) because, under the point of view of the author, Netbeans has a friendlier interface to design the
51 Chapter 3. Self-Aware Trader System
interface of the application. The selection does not have any influence on the principal result obtained and it would have been possible to choose an alternative platform.
Finally, in the development of the system, we save plenty of information to present different reports and to be able to trace the traders’ state in the whole session. We use the open platform MySQL to store and manage all this information (explained in group mode). MySQL [167] is a relational database management system (RDBMS, [168]) that runs as a server providing multi-user access to a number of databases. It uses Structured Query Language [169]. Concretely we used the MySQL Server 5.1 version to manage all the information saved.
In the next subsections we will present in detail the development of the system and how the system works and reaches the goal within the two modes of operation for a single trader (individual mode) and for a team of traders (group mode).
3.5 INDIVIDUAL MODE OF OPERATION
This section explains how the Self-Aware Trader system works in the individual modality. This modality is ready to work with one trader. It is designed thinking in traders working from home and traders working from companies but not related with other traders. We will explain in two subsections the architecture used and the software development.
In the architecture subsection it is possible to see a general architecture proposed for a general context where the stress situation could have a high impact in the human decision making. In this proposal the trading fits in this architecture as a specific context among others where the general architecture could be used.
The steps followed for the development of the Self-Aware Trader Software in individual mode are explained in the software subsection. This explanation is organized hierarchically. The explanation starts from a basic UML diagram to represent the main system to develop, to some sequence diagrams to understand the information flow and the logic used within the own software.
It is necessary to bear in mind that the individual mode of operation deployment (architecture and software) is the base to the group mode of operation. Therefore, the concepts explained in this section are suitable for the group mode operation, being the group mode an extension of the individual mode.
3.5.1 INDIVIDUAL MODE ARCHITECTURE
A general Self-Aware individual architecture has been designed suitable for all decision making scenarios in stress situations. Trading is a specific scenario within this general architecture. A modular architecture allows taking advantage of this work in other scenarios, changing only the necessary parameters and modules according to the different contexts. Figure 3.5 represents the Self-Aware architecture in an individual
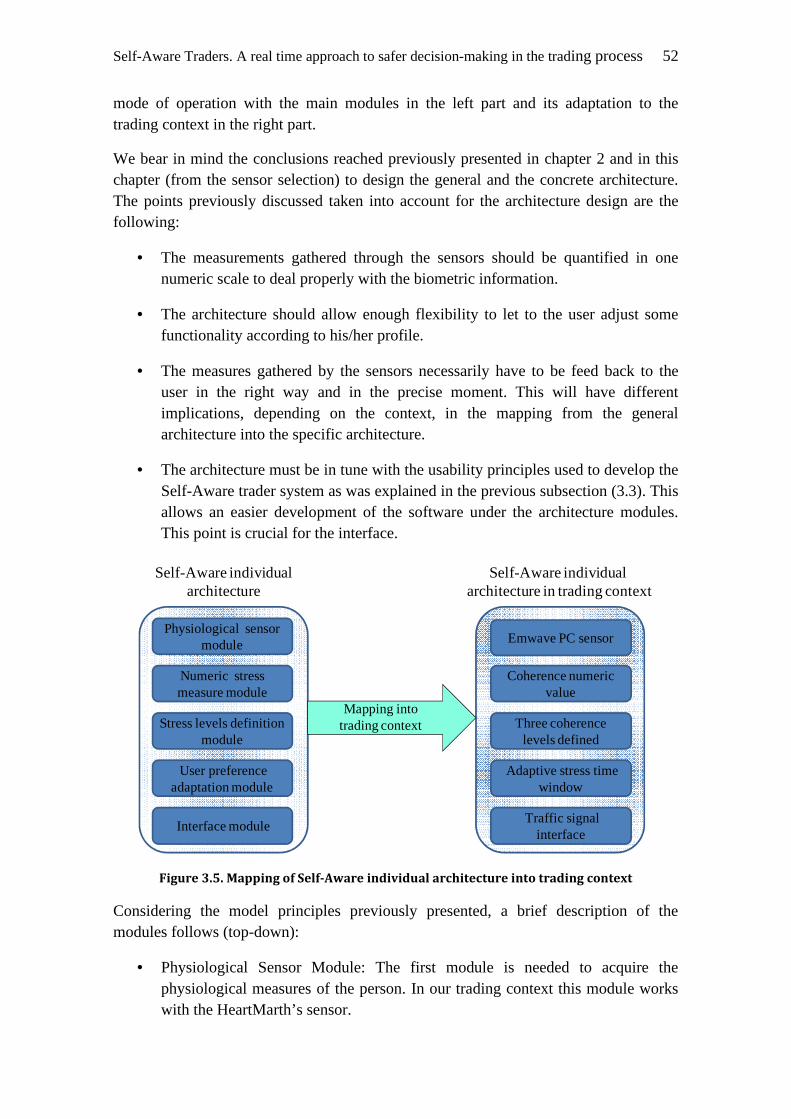
Self-Aware Traders. A real time approach to safer decision-making in the trading process 52
mode of operation with the main modules in the left part and its adaptation to the trading context in the right part.
We bear in mind the conclusions reached previously presented in chapter 2 and in this chapter (from the sensor selection) to design the general and the concrete architecture. The points previously discussed taken into account for the architecture design are the following:
• The measurements gathered through the sensors should be quantified in one numeric scale to deal properly with the biometric information.
• The architecture should allow enough flexibility to let to the user adjust some functionality according to his/her profile.
• The measures gathered by the sensors necessarily have to be feed back to the user in the right way and in the precise moment. This will have different implications, depending on the context, in the mapping from the general architecture into the specific architecture.
• The architecture must be in tune with the usability principles used to develop the Self-Aware trader system as was explained in the previous subsection (3.3). This allows an easier development of the software under the architecture modules. This point is crucial for the interface.
Physiological sensor module
Numeric stress measure module
Stress levels definition module
User preference adaptation module
Interface module
Emwave PC sensor
Coherence numeric value
Three coherence levels defined
Adaptive stress time window
Traffic signal interface
Self-Aware individual architecture
Self-Aware individualarchitecture in trading context
Mapping into trading context
Figure 3.5. Mapping of Self-Aware individual architecture into trading context
Considering the model principles previously presented, a brief description of the modules follows (top-down):
• Physiological Sensor Module: The first module is needed to acquire the physiological measures of the person. In our trading context this module works with the HeartMarth’s sensor.
53 Chapter 3. Self-Aware Trader System
• Numeric Stress Measure Module: Depending of the data gathered (hearth rate, breath rate, temperature, etc.) within the first module, here the data is processed to obtain only one numeric data indicating the stress measure. We extract this data (the coherence value) from the Emwave software (included with the HeartMarth’s sensor).
• Stress Levels Definition Module: It defines the necessary levels of stress to be indicated to the user. The system applied in trading context will differentiate among different states of the users, each state being associated to different ranges of coherence. The levels of coherence for each range will be defined in this module. We selected three coherence levels (low, moderate and high) for the trading context.
• User Preference Adaptation Module: Every person has different reactions and different biometric responses in every situation. It is necessary to allow the user to select the sensibility required in each circumstance. The adaptive stress time window (trader’s predominant coherence in a certain time window) is our way to allow the trader to manage it.
• Interface module: The physical context conditions are critical in this point. The interface should fit to the use case. For example is common in extreme conditions to use augmented reality to see the information without external equipment (for example, for gas welders working with extreme brightness some information could be presented in glasses [170]). In our case a traffic light signal presents the status.
Once we have defined the mapping from the general architecture into the trading context domain, the next step is the development of the necessary software to be able to test the system with real traders and check if our system reaches the objectives proposed in chapter 1.
3.5.2 INDIVIDUAL MODE SOFTWARE IMPLEMENTATION DESCRIPTION
The Self-Aware Trader software running in individual mode is a Java program that shows an interface using the metaphor of a traffic light system to feedback to the trader his/her coherence state. This allows the trader to be aware in real time of his/her real coherence state in a time window chosen by him/herself. Using the traffic light design, a red light represents a bad coherence, yellow light is a medium coherence and a green light is a high coherence. The program uses as source data the measurements gathered through Emwave software, so the Emwave software included with the sensor needs to be running as a requirement prior to execute the Self-Aware Trader software program.
Following, the main algorithms and the main structure of the program are explained. Besides we detail the options contemplated to allow the user a better integration with the trading information process. Please notice that some elements presented in the individual mode operation are shared by the group mode operation (for example the
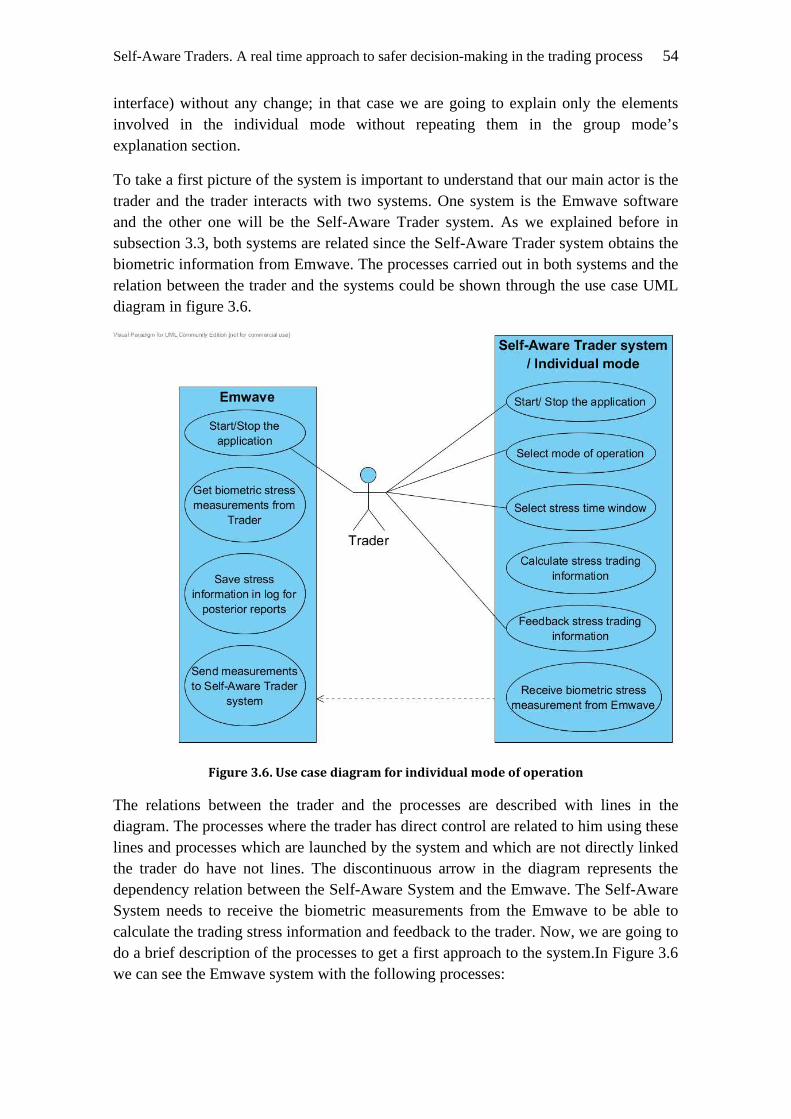
Self-Aware Traders. A real time approach to safer decision-making in the trading process 54
interface) without any change; in that case we are going to explain only the elements involved in the individual mode without repeating them in the group mode’s explanation section.
To take a first picture of the system is important to understand that our main actor is the trader and the trader interacts with two systems. One system is the Emwave software and the other one will be the Self-Aware Trader system. As we explained before in subsection 3.3, both systems are related since the Self-Aware Trader system obtains the biometric information from Emwave. The processes carried out in both systems and the relation between the trader and the systems could be shown through the use case UML diagram in figure 3.6.
Figure 3.6. Use case diagram for individual mode of operation
The relations between the trader and the processes are described with lines in the diagram. The processes where the trader has direct control are related to him using these lines and processes which are launched by the system and which are not directly linked the trader do have not lines. The discontinuous arrow in the diagram represents the dependency relation between the Self-Aware System and the Emwave. The Self-Aware System needs to receive the biometric measurements from the Emwave to be able to calculate the trading stress information and feedback to the trader. Now, we are going to do a brief description of the processes to get a first approach to the system.In Figure 3.6 we can see the Emwave system with the following processes:
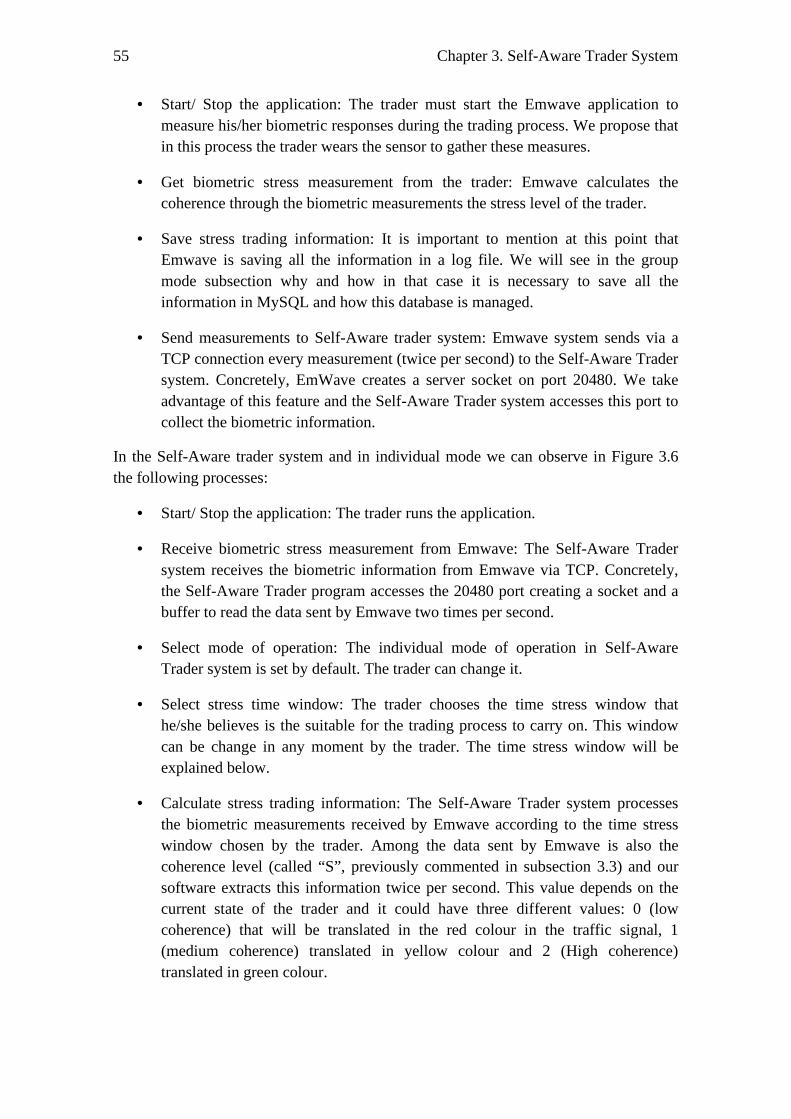
55 Chapter 3. Self-Aware Trader System
• Start/ Stop the application: The trader must start the Emwave application to measure his/her biometric responses during the trading process. We propose that in this process the trader wears the sensor to gather these measures.
• Get biometric stress measurement from the trader: Emwave calculates the coherence through the biometric measurements the stress level of the trader.
• Save stress trading information: It is important to mention at this point that Emwave is saving all the information in a log file. We will see in the group mode subsection why and how in that case it is necessary to save all the information in MySQL and how this database is managed.
• Send measurements to Self-Aware trader system: Emwave system sends via a TCP connection every measurement (twice per second) to the Self-Aware Trader system. Concretely, EmWave creates a server socket on port 20480. We take advantage of this feature and the Self-Aware Trader system accesses this port to collect the biometric information.
In the Self-Aware trader system and in individual mode we can observe in Figure 3.6 the following processes:
• Start/ Stop the application: The trader runs the application.
• Receive biometric stress measurement from Emwave: The Self-Aware Trader system receives the biometric information from Emwave via TCP. Concretely, the Self-Aware Trader program accesses the 20480 port creating a socket and a buffer to read the data sent by Emwave two times per second.
• Select mode of operation: The individual mode of operation in Self-Aware Trader system is set by default. The trader can change it.
• Select stress time window: The trader chooses the time stress window that he/she believes is the suitable for the trading process to carry on. This window can be change in any moment by the trader. The time stress window will be explained below.
• Calculate stress trading information: The Self-Aware Trader system processes the biometric measurements received by Emwave according to the time stress window chosen by the trader. Among the data sent by Emwave is also the coherence level (called “S”, previously commented in subsection 3.3) and our software extracts this information twice per second. This value depends on the current state of the trader and it could have three different values: 0 (low coherence) that will be translated in the red colour in the traffic signal, 1 (medium coherence) translated in yellow colour and 2 (High coherence) translated in green colour.
Self-Aware Traders. A real time approach to safer decision-making in the trading process 56
• Feedback stress trading information: The information is shown to the trader via traffic light signal interface being refreshed twice per second as minimum and twice per minute as maximum. This period depends on the stress time windows chosen by the trader and in every period, the colour (green, yellow or red) that represents the stress of the trader in this time window will be shown.
According to Kopetz [171], a real time computer system is a computer system in which the correctness of the system behaviour depends not only on the logical results of the computations, but also on the physical instant at which these results are produced. It states: “The right answer late is wrong”. In real time systems, performance requirements are as important as functional requirements, so not only do we have to perform the correct functions, but there are clear bounds within which these must be completed.
The trading process is one of the clearest examples where the information in real time is crucial for a good decision making. The Self-Aware Trader system must fit in this subject and must show the information to the trader when the trader needs it. This requirement is translated into a time stress window.
The Self-Aware Trader system creates a time stress window where the coherence level is saved during some seconds (depending on the trader selection). Once the time selected by the user is reached, the most repeated coherence during this time window is shown through the representative colour. We call this “predominant coherence” and it is calculated through the mode in statistics terms.
The user can choose the sensibility/size of this window between five options with a slider bar, where 1 implies 1 second (most sensible), 2 implies 5 seconds, 3 implies 10 seconds (and it is the default value), 4 implies 15 seconds and 5 implies 30 seconds (less sensible). Since the mode is not a unique value, and in a given set of data it could take more than one value, it was decided that if such case was to happen, the system would take the most restrictive of the values to show in the interface. For example, if 10 green values and 10 yellow values appear in 10 seconds, then a yellow light is shown.
Regarding the choice of the time window coherence, we suggest the following tips for the traders. These tips are the consequence of the author’s experience in trading and some comments of other traders:
• Low sensibility, higher time window coherence: It is preferred for share markets where time pressure is not so critical and we have more time to make decisions. The lowest sensibility allowed is 30 seconds (60 measures of coherence).
• Medium sensibility, medium time window coherence (by default): It is recommended for users that are concurring in some market at the same time (shares, commodities, bonds, etc.). This value is defined by default in 10 seconds (20 measures).
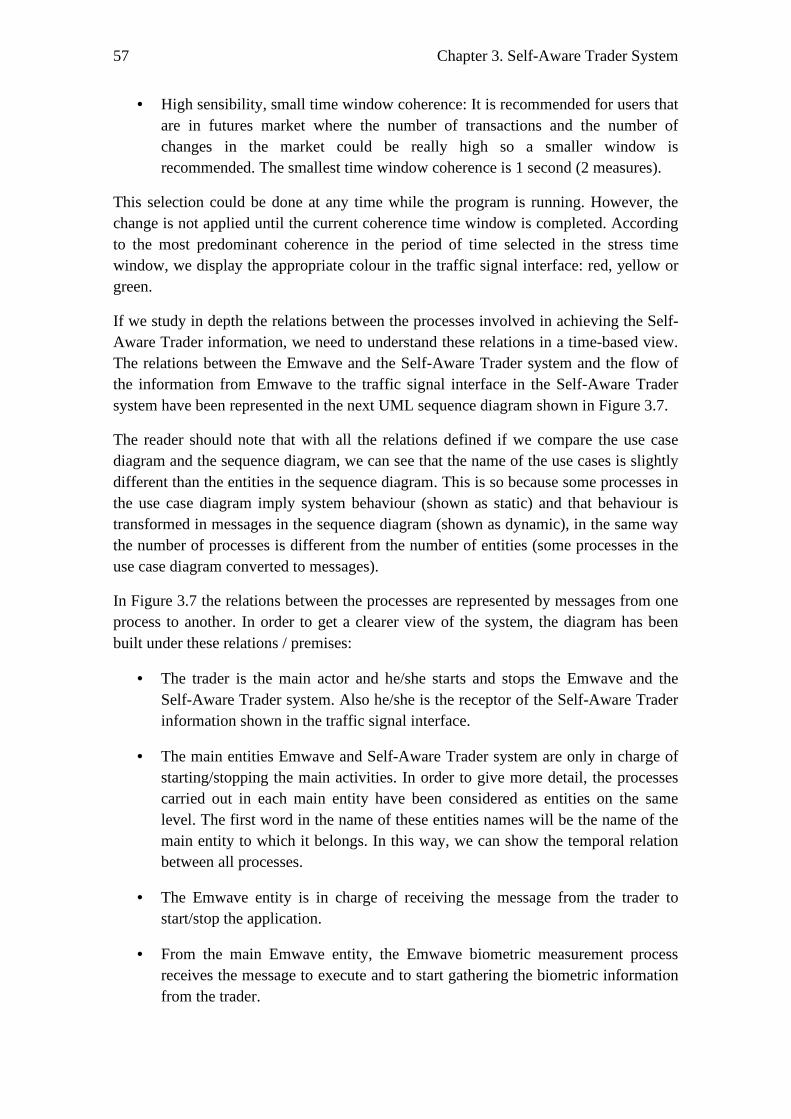
57 Chapter 3. Self-Aware Trader System
• High sensibility, small time window coherence: It is recommended for users that are in futures market where the number of transactions and the number of changes in the market could be really high so a smaller window is recommended. The smallest time window coherence is 1 second (2 measures).
This selection could be done at any time while the program is running. However, the change is not applied until the current coherence time window is completed. According to the most predominant coherence in the period of time selected in the stress time window, we display the appropriate colour in the traffic signal interface: red, yellow or green.
If we study in depth the relations between the processes involved in achieving the Self-Aware Trader information, we need to understand these relations in a time-based view. The relations between the Emwave and the Self-Aware Trader system and the flow of the information from Emwave to the traffic signal interface in the Self-Aware Trader system have been represented in the next UML sequence diagram shown in Figure 3.7.
The reader should note that with all the relations defined if we compare the use case diagram and the sequence diagram, we can see that the name of the use cases is slightly different than the entities in the sequence diagram. This is so because some processes in the use case diagram imply system behaviour (shown as static) and that behaviour is transformed in messages in the sequence diagram (shown as dynamic), in the same way the number of processes is different from the number of entities (some processes in the use case diagram converted to messages).
In Figure 3.7 the relations between the processes are represented by messages from one process to another. In order to get a clearer view of the system, the diagram has been built under these relations / premises:
• The trader is the main actor and he/she starts and stops the Emwave and the Self-Aware Trader system. Also he/she is the receptor of the Self-Aware Trader information shown in the traffic signal interface.
• The main entities Emwave and Self-Aware Trader system are only in charge of starting/stopping the main activities. In order to give more detail, the processes carried out in each main entity have been considered as entities on the same level. The first word in the name of these entities names will be the name of the main entity to which it belongs. In this way, we can show the temporal relation between all processes.
• The Emwave entity is in charge of receiving the message from the trader to start/stop the application.
• From the main Emwave entity, the Emwave biometric measurement process receives the message to execute and to start gathering the biometric information from the trader.
Self-Aware Traders. A real time approach to safer decision-making in the trading process 58
• The Emwave log process receives the message to save the data from the main Emwave entity.
• The Emwave Communication Self-Aware system receives the messages from the main entity Emwave to open/close the port 20480 and to send the trader’s biometric information to Self-Aware Trader system
• The Self-Aware Trader System main entity receives the start/stop message from the trader.
• The Self-Aware Trader System Communication entity receives the messages from the main entity Self-Aware Trader System to open/close the port 20480 and to receive the trader’s biometric information from Emwave Communication Self-Aware.
• The Self-Aware Stress time window receives from the trader the message to select the period of the time window.
• The Self-Aware Stress trading information receives from the Self-Aware Stress time window the period of time selected. Also it receives the message with the trader’s biometric information from The Self-Aware Trader System Communication. With the period and the trader’s biometric information, this entity extracts the trader’s coherence, it calculates the self-aware trader information based on the period of the time window and it sends this to the traffic signal interface the information.
• The Self-Aware Stress feedback receives from the Self-Aware Stress trading information the Self-aware trader information. Based on this information it sets the colour in the traffic signal interface.
• The individual mode is selected by default so this information is not included in the diagram to avoid confusion with more entities.
The software architecture diagram for the individual mode is represented in Figure 3.8. Bear in mind that Emwave is an external application so in the figure it is only contemplated as an external package linked with the Self-Aware trader system under a dependency relation.
The reader should note that we use the word Client in the main entity of the system. In the following subsection related with the Group-Aware traders we are going to use the structure Client/Server. This software architecture will be a basic part for the future client structure.
Finally, the last step is translating the information extracted from the sequence diagram into the necessary algorithms. These algorithms are shown in the next subsection.
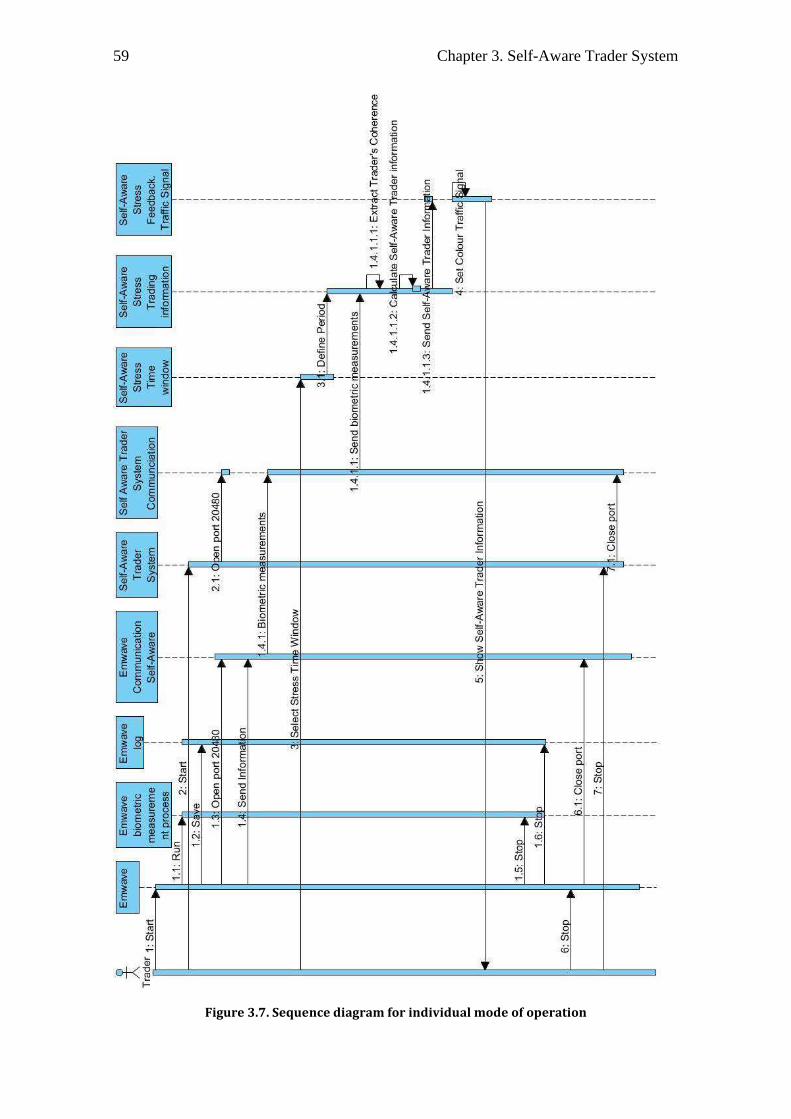
59 Chapter 3. Self-Aware Trader System
Figure 3.7. Sequence diagram for individual mode of operation
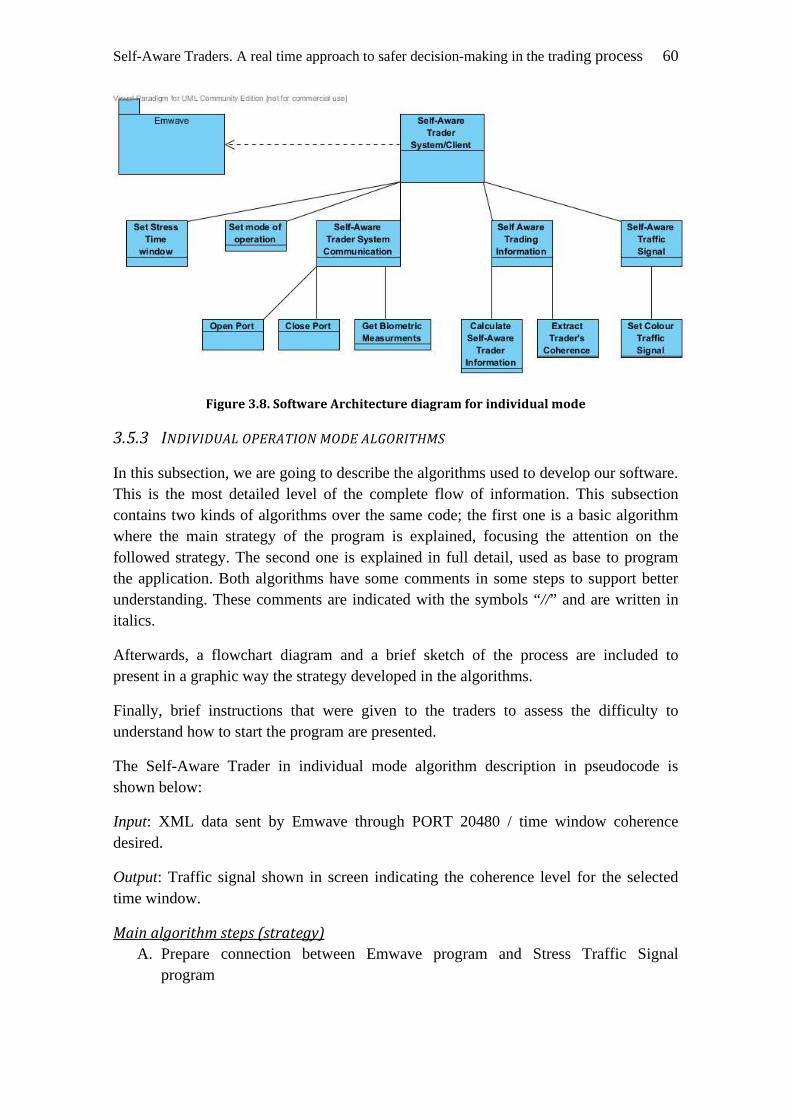
Self-Aware Traders. A real time approach to safer decision-making in the trading process 60
Figure 3.8. Software Architecture diagram for individual mode
3.5.3 INDIVIDUAL OPERATION MODE ALGORITHMS
In this subsection, we are going to describe the algorithms used to develop our software. This is the most detailed level of the complete flow of information. This subsection contains two kinds of algorithms over the same code; the first one is a basic algorithm where the main strategy of the program is explained, focusing the attention on the followed strategy. The second one is explained in full detail, used as base to program the application. Both algorithms have some comments in some steps to support better understanding. These comments are indicated with the symbols “//” and are written in italics.
Afterwards, a flowchart diagram and a brief sketch of the process are included to present in a graphic way the strategy developed in the algorithms.
Finally, brief instructions that were given to the traders to assess the difficulty to understand how to start the program are presented.
The Self-Aware Trader in individual mode algorithm description in pseudocode is shown below:
Input: XML data sent by Emwave through PORT 20480 / time window coherence desired.
Output: Traffic signal shown in screen indicating the coherence level for the selected time window.
Main algorithm steps (strategy)
A. Prepare connection between Emwave program and Stress Traffic Signal program

61 Chapter 3. Self-Aware Trader System
B. Establish communication between Emwave program and Stress Traffic Signal program
C. Print Traffic Signal in the screen with the lights off
D. User defines sensibility in the system (time window coherence desired) // User can change this parameter at any time. This change will be applied in the next coherence time window cycle.
E. Current time window coherence and Coherence counters (3), one per traffic signal are defined and initialized
F. Search in the data sent through Emwave the exact location of the real time coherence
G. While (User is connected to application)
a. Extract real time coherence value from Emwave program
b. Increment current time window coherence counter
c. If Current time window coherence < time window coherence desired
• Increment the right coherence counter (green, yellow or red) according to the coherence real time value
d. Else // Only enter here when the time window coherence reach the sensibility of the user, meanwhile the algorithm only increment the counters and the traffic signal light does not change
• If user changed time window coherence, time window coherence desired is updated with the new value
• Compare the value of the three counters and put in the traffic signal light the colour of the counter with the higher value
• Restart the current time window coherence counter and the three coherence counters for the next cycle
e. End if //Notice that if there is a draw between the counters, the traffic signal does not change and keeps the previous light.
H. End while
I. Close communications, close socket and close buffer.
Now we will see the algorithm in more detail with all the steps. The reader can follow the correlation with the strategy algorithm due the uppercase letters introduced in the steps of the detailed algorithm. Each letter implies the starting of the correspondence

Self-Aware Traders. A real time approach to safer decision-making in the trading process 62
strategic step from the strategic algorithm. Notice that one step in the strategic algorithm could be several steps in the detailed algorithm.
Algorithm in detail:
1. Create Socket to read from Port 20480 (A)
2. Create Buffer reader to save the data read
3. Establish communication between Emwave program and Stress Traffic Signal program (B)
4. Print Traffic Signal in the screen with lights off (C)
5. User defines sensibility in the system (time window coherence desired) // User can change this parameter at any time. This change will be applied in the next coherence time window cycle. (D)
6. Sensibility variable (time window coherence desired) is initialized with user input data between 1 second and 30 seconds. The default value is a medium sensibility, 10 seconds.
i. If input data <> default value then
I. Time window coherence desired = input data.
7. Current time window coherence is initialized (E)
i. Current time window coherence counter = 0
8. Coherence counters (3), one per signal are initialized
i. Red Counter =0
ii. Yellow Counter = 0
iii. Green Counter = 0
9. Create a string variable to search in the string the exact location of the real time coherence (F)
10. Initialize the search string variable with “ S=”
11. While (data in buffer != null) (G)
i. Read buffer (a)
ii. Current time window coherence counter = Current time window coherence counter +1 (b)
iii. Search the coherence real time value through the search variable
iv. If Current time window coherence counter < sensibility desired (c)

63 Chapter 3. Self-Aware Trader System
I. Increment the right coherence counter according to the coherence real time value
• If coherence real time value = = 0 then
o Red Counter = red counter +1
• If coherence real time value = = 1 then
o Yellow Counter = yellow counter +1
• If coherence real time value = = 2 then
o Green Counter = green counter +1
v. Else // Only enter here when the time window coherence reaches the sensibility of the user, meanwhile the algorithm only increments the counters and the traffic signal light does not change (d)
I. Current time window coherence counter =0
II. If input data <> time window coherence desired then
• Time window coherence desired = input data.
III. Compare the value of the 3 counters and obtain the counter with the higher value
• If (red counter > Yellow Counter) and (red counter > green counter) then
o Turn off Traffic signal
o Traffic signal = red
• If (Yellow Counter > red counter) and (yellow counter > green counter) then
o Turn off Traffic signal
o Traffic signal = Yellow
• If (green counter > Yellow Counter) and (green counter > red counter) then
o Turn off Traffic signal
o Traffic signal = green
IV. Restart Counters
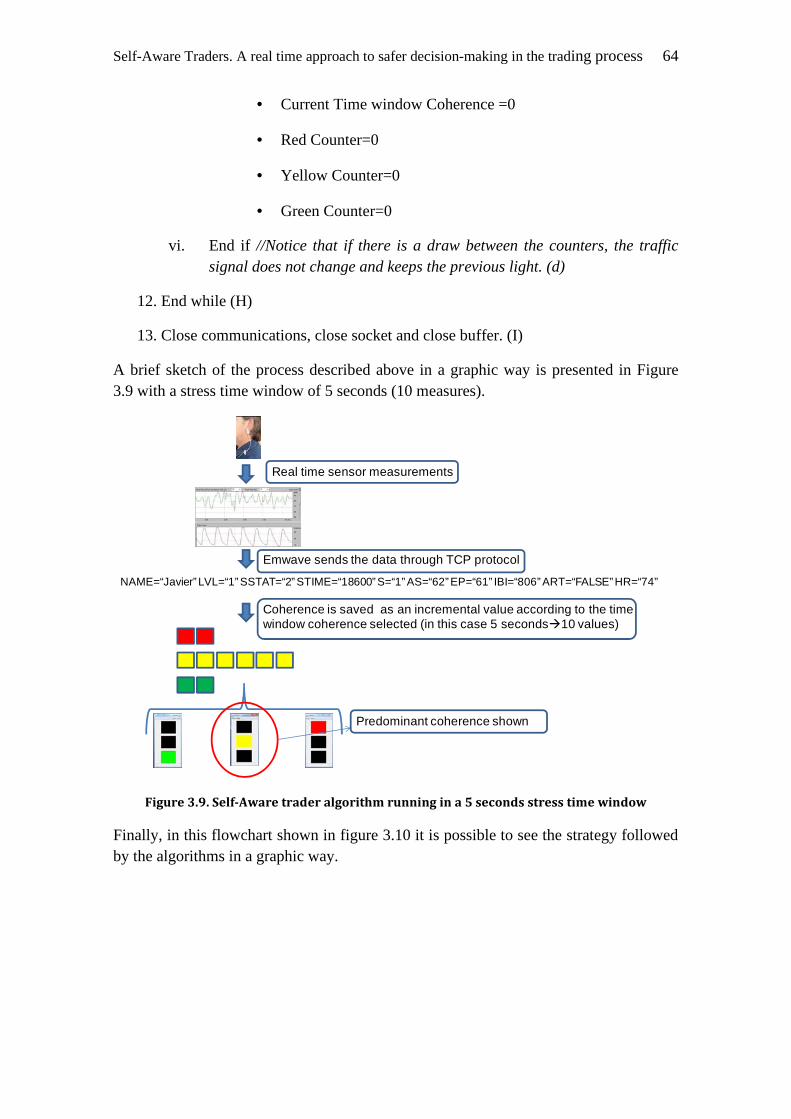
Self-Aware Traders. A real time approach to safer decision-making in the trading process 64
• Current Time window Coherence =0
• Red Counter=0
• Yellow Counter=0
• Green Counter=0
vi. End if //Notice that if there is a draw between the counters, the traffic signal does not change and keeps the previous light. (d)
12. End while (H)
13. Close communications, close socket and close buffer. (I)
A brief sketch of the process described above in a graphic way is presented in Figure 3.9 with a stress time window of 5 seconds (10 measures).
Real time sensor measurements
Emwave sends the data through TCP protocol
Coherence is saved as an incremental value according to the time window coherence selected (in this case 5 seconds�10 values)
Predominant coherence shown
NAME=“Javier” LVL=“1” SSTAT=“2” STIME=“18600” S=“1” AS=“62” EP=“61” IBI=“806” ART=“FALSE” HR=“74”
Figure 3.9. Self-Aware trader algorithm running in a 5 seconds stress time window
Finally, in this flowchart shown in figure 3.10 it is possible to see the strategy followed by the algorithms in a graphic way.
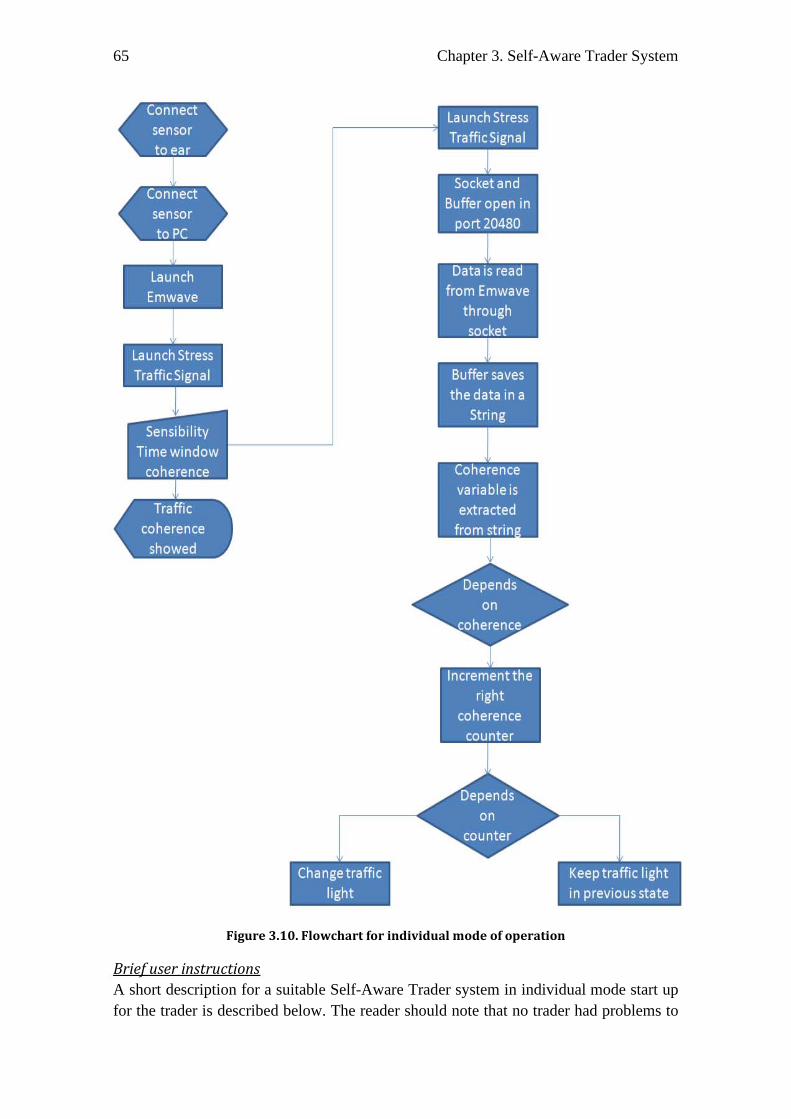
65 Chapter 3. Self-Aware Trader System
Figure 3.10. Flowchart for individual mode of operation
Brief user instructions
A short description for a suitable Self-Aware Trader system in individual mode start up for the trader is described below. The reader should note that no trader had problems to
Changetrafflc
Ilght
Keeptrafflc Ilght
In prevlousstate

Self-Aware Traders. A real time approach to safer decision-making in the trading process 66
understand these steps. These instructions were given to the traders in the tests presented in chapter 4.
The trader should follow the next steps:
• Put on the sensor in the ear
• Plug the cable sensor to the USB Emwave unit.
• Plug the Emwave unit to the PC.
• Start the Emwave applications and run a session.
• Launch the Self-Aware Trader application
• Chose the window coherence level desired with the slider bar.
• A traffic signal will be showed with the time window coherence.
• When the session is finished close firstly the traffic signal application and later the Emwave Program.
Once we are able to work with the Self-Aware Trader system in individual mode, now following the objectives of this work, we want to extend the concept from Self-Aware traders to Group-Aware traders. This concept is achieved with the Self-Aware Trader system running in group-mode of operation. This mode is explained in the next subsection so the benefits that we can get from the Group-Aware concept.
3.6 GROUP MODE OF OPERATION
One of the most important problems in trading is the difficulty to gather in real time an indicator of the stress level experienced by the market, e.g., an immediate measure of the collective stress level that operating traders are experiencing.
The collective reaction to news during the session, for example, could cause high stress state (even panic) and risky decisions. According to Lori, [172] the movements of the stocks markets are very connected with the emotional state of the collective emerging opinion and reaction of traders that are operating in the market itself. Even a recent study [173] using the social network twitter predicts the movements of the stocks markets. The authors of this study concluded that there is a correlation between the emotional status of the users of twitter and the stock market. When the calmness of tweets (twitters messages) changed, two to six days later the Dow would fluctuate in about the same way. “Calm + Happy” also seemed to be able to predict the Dow. However, it does not provide a real time correlation and hence is of very limited help.
The advantage of the Self-Aware Trader system in group mode operation is that it can perform this correlation in real time. Therefore, if a trader is able to see at the same time his/her state and the statistical picture of the state of his/her partners, this allows him/her
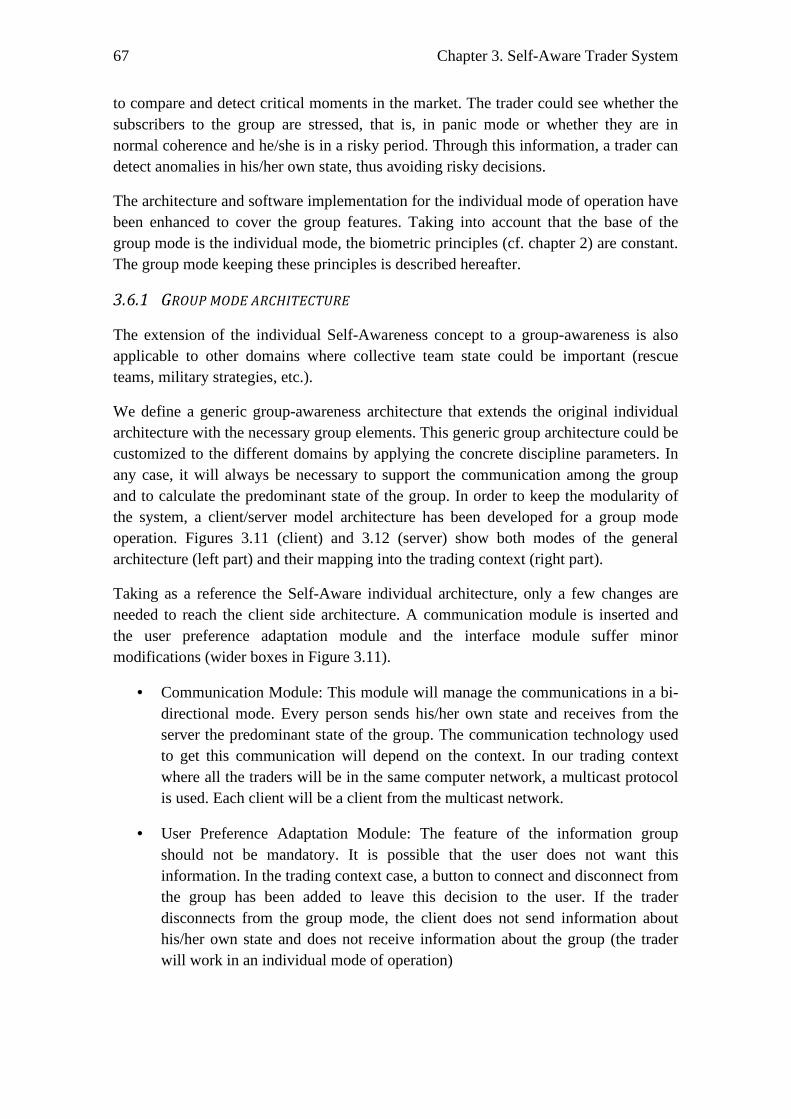
67 Chapter 3. Self-Aware Trader System
to compare and detect critical moments in the market. The trader could see whether the subscribers to the group are stressed, that is, in panic mode or whether they are in normal coherence and he/she is in a risky period. Through this information, a trader can detect anomalies in his/her own state, thus avoiding risky decisions.
The architecture and software implementation for the individual mode of operation have been enhanced to cover the group features. Taking into account that the base of the group mode is the individual mode, the biometric principles (cf. chapter 2) are constant. The group mode keeping these principles is described hereafter.
3.6.1 GROUP MODE ARCHITECTURE
The extension of the individual Self-Awareness concept to a group-awareness is also applicable to other domains where collective team state could be important (rescue teams, military strategies, etc.).
We define a generic group-awareness architecture that extends the original individual architecture with the necessary group elements. This generic group architecture could be customized to the different domains by applying the concrete discipline parameters. In any case, it will always be necessary to support the communication among the group and to calculate the predominant state of the group. In order to keep the modularity of the system, a client/server model architecture has been developed for a group mode operation. Figures 3.11 (client) and 3.12 (server) show both modes of the general architecture (left part) and their mapping into the trading context (right part).
Taking as a reference the Self-Aware individual architecture, only a few changes are needed to reach the client side architecture. A communication module is inserted and the user preference adaptation module and the interface module suffer minor modifications (wider boxes in Figure 3.11).
• Communication Module: This module will manage the communications in a bi-directional mode. Every person sends his/her own state and receives from the server the predominant state of the group. The communication technology used to get this communication will depend on the context. In our trading context where all the traders will be in the same computer network, a multicast protocol is used. Each client will be a client from the multicast network.
• User Preference Adaptation Module: The feature of the information group should not be mandatory. It is possible that the user does not want this information. In the trading context case, a button to connect and disconnect from the group has been added to leave this decision to the user. If the trader disconnects from the group mode, the client does not send information about his/her own state and does not receive information about the group (the trader will work in an individual mode of operation)
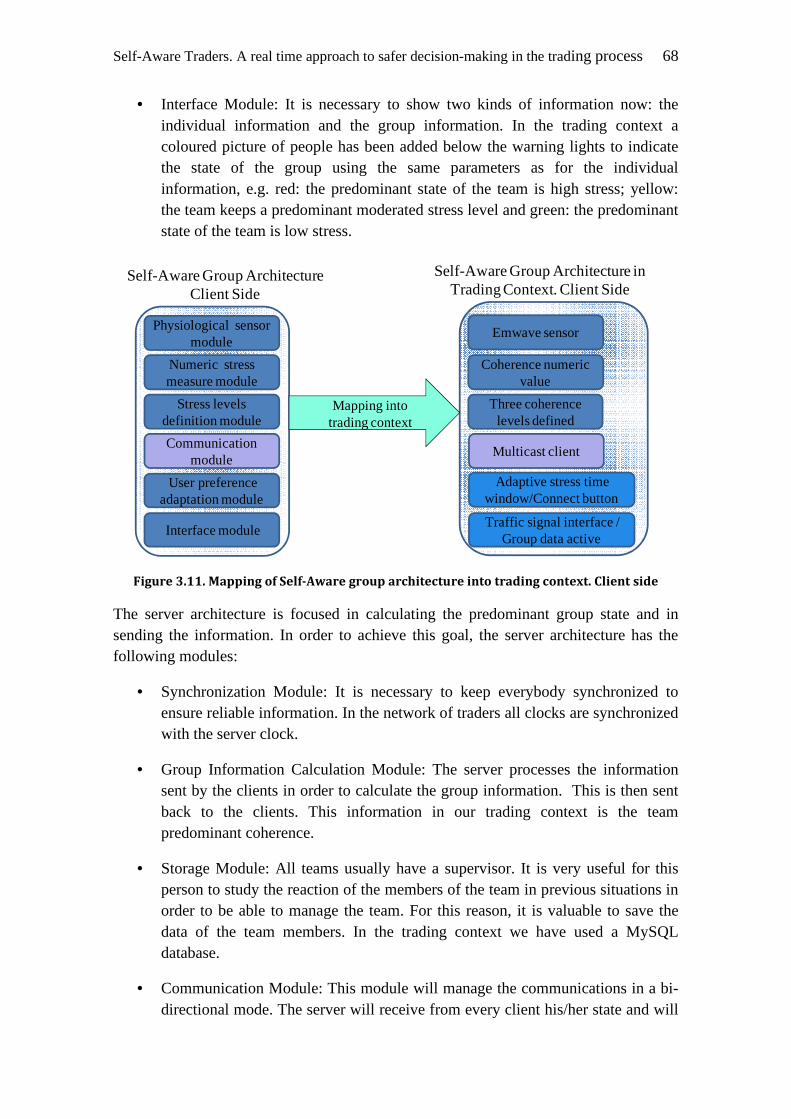
Self-Aware Traders. A real time approach to safer decision-making in the trading process 68
• Interface Module: It is necessary to show two kinds of information now: the individual information and the group information. In the trading context a coloured picture of people has been added below the warning lights to indicate the state of the group using the same parameters as for the individual information, e.g. red: the predominant state of the team is high stress; yellow: the team keeps a predominant moderated stress level and green: the predominant state of the team is low stress.
Physiological sensor module
Numeric stress measure module
Stress levels definition module
User preference adaptation module
Interface module
Emwave sensor
Coherence numeric value
Three coherence levels defined
Adaptive stress time window/Connect button
Traffic signal interface / Group data active
Communication module
Multicast client
Self-Aware Group ArchitectureClient Side
Self-Aware Group Architecture in Trading Context. Client Side
Mapping into trading context
Figure 3.11. Mapping of Self-Aware group architecture into trading context. Client side
The server architecture is focused in calculating the predominant group state and in sending the information. In order to achieve this goal, the server architecture has the following modules:
• Synchronization Module: It is necessary to keep everybody synchronized to ensure reliable information. In the network of traders all clocks are synchronized with the server clock.
• Group Information Calculation Module: The server processes the information sent by the clients in order to calculate the group information. This is then sent back to the clients. This information in our trading context is the team predominant coherence.
• Storage Module: All teams usually have a supervisor. It is very useful for this person to study the reaction of the members of the team in previous situations in order to be able to manage the team. For this reason, it is valuable to save the data of the team members. In the trading context we have used a MySQL database.
• Communication Module: This module will manage the communications in a bi-directional mode. The server will receive from every client his/her state and will
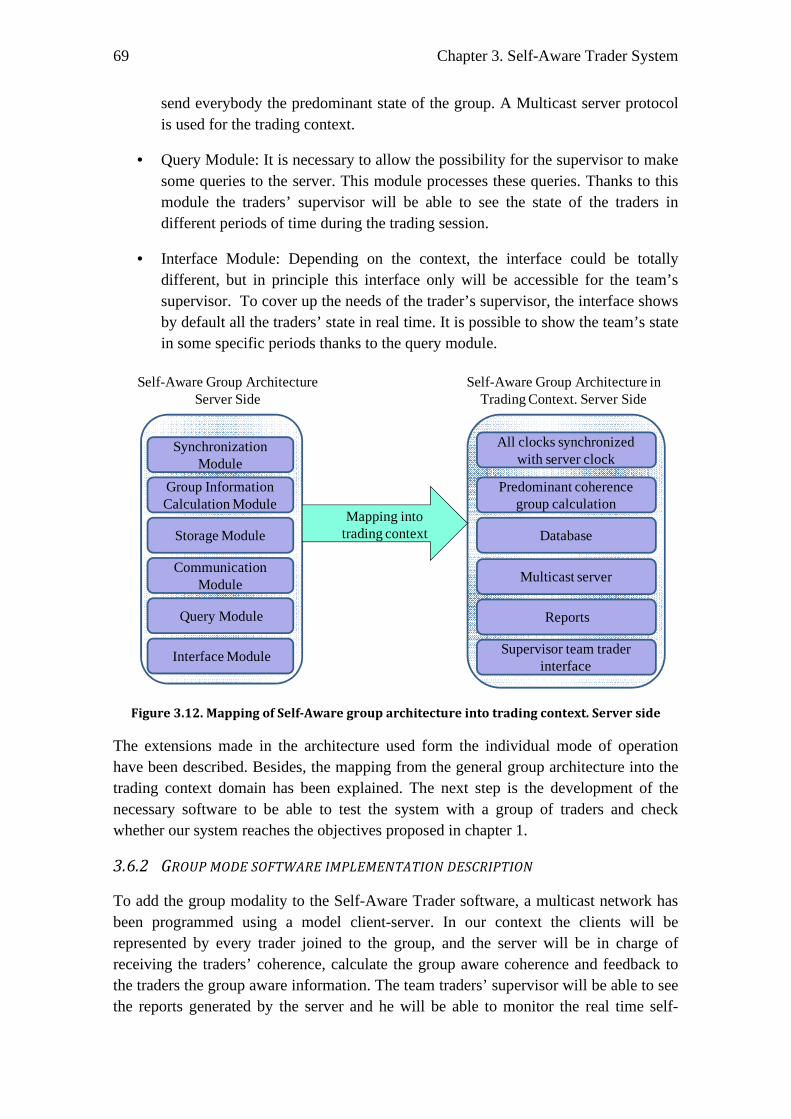
69 Chapter 3. Self-Aware Trader System
send everybody the predominant state of the group. A Multicast server protocol is used for the trading context.
• Query Module: It is necessary to allow the possibility for the supervisor to make some queries to the server. This module processes these queries. Thanks to this module the traders’ supervisor will be able to see the state of the traders in different periods of time during the trading session.
• Interface Module: Depending on the context, the interface could be totally different, but in principle this interface only will be accessible for the team’s supervisor. To cover up the needs of the trader’s supervisor, the interface shows by default all the traders’ state in real time. It is possible to show the team’s state in some specific periods thanks to the query module.
Synchronization Module
Group Information Calculation Module
Storage Module
Query Module
Interface Module
All clocks synchronized with server clock
Predominant coherence group calculation
Database
Reports
Supervisor team trader interface
Communication Module Multicast server
Self-Aware Group ArchitectureServer Side
Self-Aware Group Architecture in Trading Context. Server Side
Mapping into trading context
Figure 3.12. Mapping of Self-Aware group architecture into trading context. Server side
The extensions made in the architecture used form the individual mode of operation have been described. Besides, the mapping from the general group architecture into the trading context domain has been explained. The next step is the development of the necessary software to be able to test the system with a group of traders and check whether our system reaches the objectives proposed in chapter 1.
3.6.2 GROUP MODE SOFTWARE IMPLEMENTATION DESCRIPTION
To add the group modality to the Self-Aware Trader software, a multicast network has been programmed using a model client-server. In our context the clients will be represented by every trader joined to the group, and the server will be in charge of receiving the traders’ coherence, calculate the group aware coherence and feedback to the traders the group aware information. The team traders’ supervisor will be able to see the reports generated by the server and he will be able to monitor the real time self-
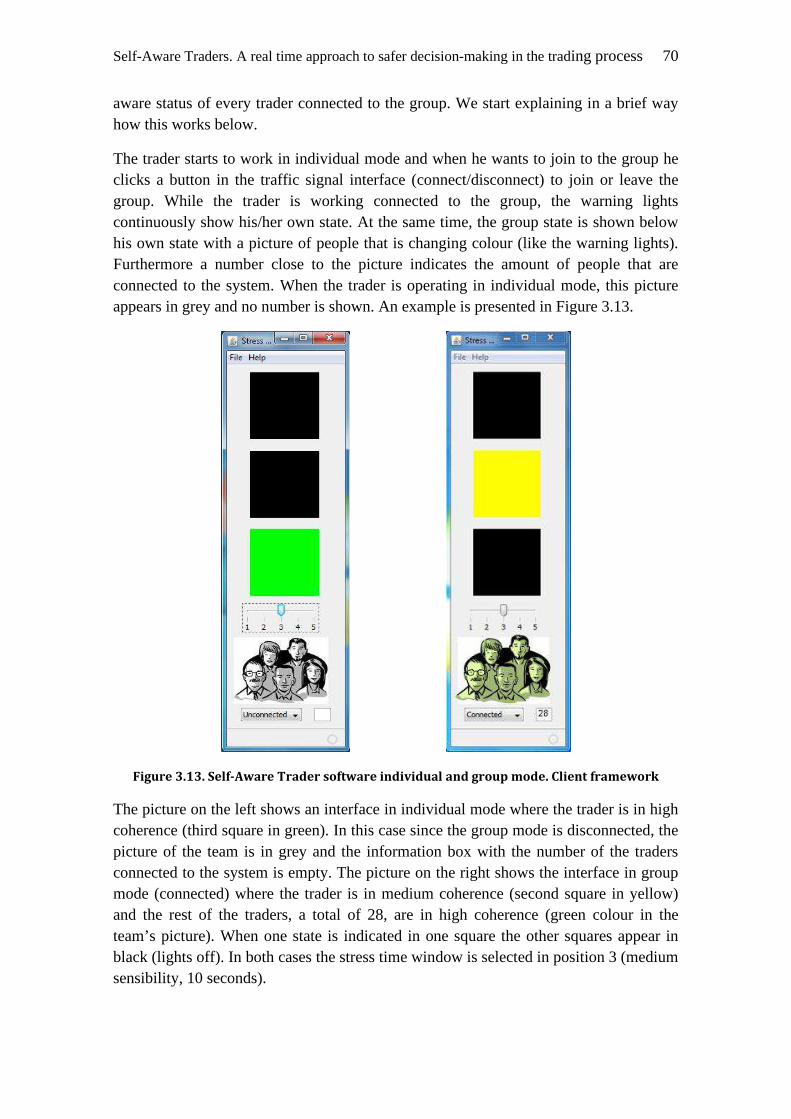
Self-Aware Traders. A real time approach to safer decision-making in the trading process 70
aware status of every trader connected to the group. We start explaining in a brief way how this works below.
The trader starts to work in individual mode and when he wants to join to the group he clicks a button in the traffic signal interface (connect/disconnect) to join or leave the group. While the trader is working connected to the group, the warning lights continuously show his/her own state. At the same time, the group state is shown below his own state with a picture of people that is changing colour (like the warning lights). Furthermore a number close to the picture indicates the amount of people that are connected to the system. When the trader is operating in individual mode, this picture appears in grey and no number is shown. An example is presented in Figure 3.13.
Figure 3.13. Self-Aware Trader software individual and group mode. Client framework
The picture on the left shows an interface in individual mode where the trader is in high coherence (third square in green). In this case since the group mode is disconnected, the picture of the team is in grey and the information box with the number of the traders connected to the system is empty. The picture on the right shows the interface in group mode (connected) where the trader is in medium coherence (second square in yellow) and the rest of the traders, a total of 28, are in high coherence (green colour in the team’s picture). When one state is indicated in one square the other squares appear in black (lights off). In both cases the stress time window is selected in position 3 (medium sensibility, 10 seconds).
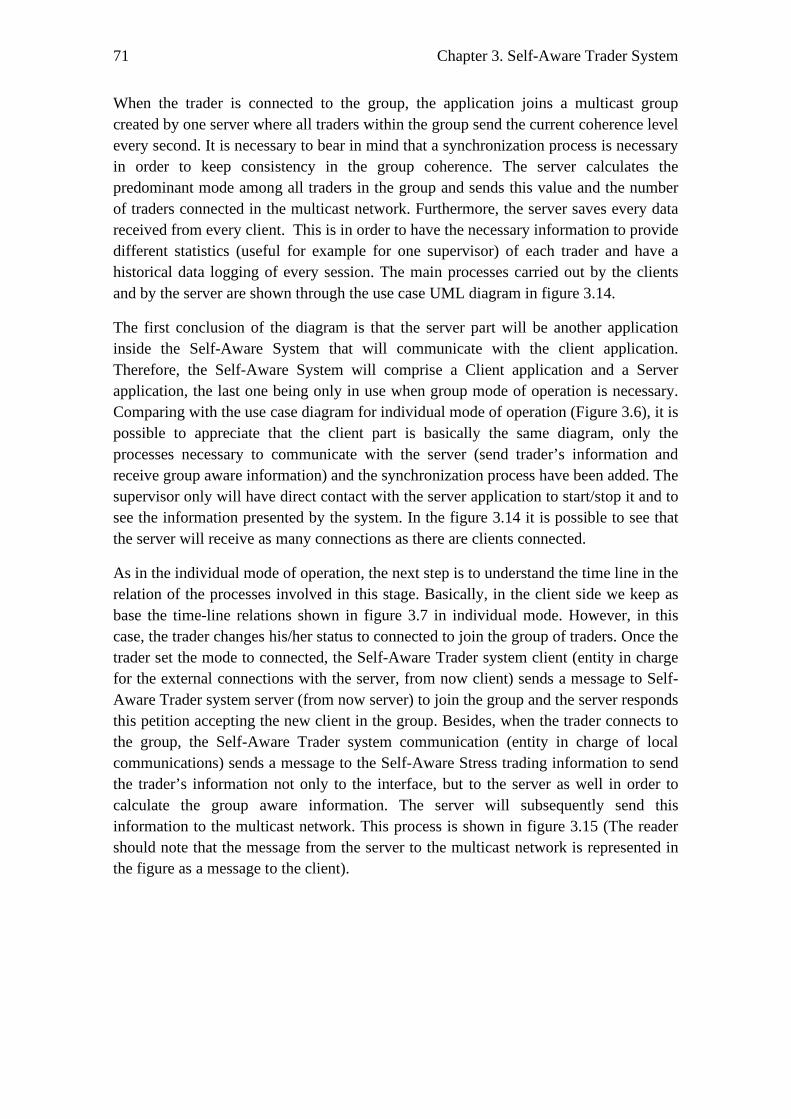
71 Chapter 3. Self-Aware Trader System
When the trader is connected to the group, the application joins a multicast group created by one server where all traders within the group send the current coherence level every second. It is necessary to bear in mind that a synchronization process is necessary in order to keep consistency in the group coherence. The server calculates the predominant mode among all traders in the group and sends this value and the number of traders connected in the multicast network. Furthermore, the server saves every data received from every client. This is in order to have the necessary information to provide different statistics (useful for example for one supervisor) of each trader and have a historical data logging of every session. The main processes carried out by the clients and by the server are shown through the use case UML diagram in figure 3.14.
The first conclusion of the diagram is that the server part will be another application inside the Self-Aware System that will communicate with the client application. Therefore, the Self-Aware System will comprise a Client application and a Server application, the last one being only in use when group mode of operation is necessary. Comparing with the use case diagram for individual mode of operation (Figure 3.6), it is possible to appreciate that the client part is basically the same diagram, only the processes necessary to communicate with the server (send trader’s information and receive group aware information) and the synchronization process have been added. The supervisor only will have direct contact with the server application to start/stop it and to see the information presented by the system. In the figure 3.14 it is possible to see that the server will receive as many connections as there are clients connected.
As in the individual mode of operation, the next step is to understand the time line in the relation of the processes involved in this stage. Basically, in the client side we keep as base the time-line relations shown in figure 3.7 in individual mode. However, in this case, the trader changes his/her status to connected to join the group of traders. Once the trader set the mode to connected, the Self-Aware Trader system client (entity in charge for the external connections with the server, from now client) sends a message to Self-Aware Trader system server (from now server) to join the group and the server responds this petition accepting the new client in the group. Besides, when the trader connects to the group, the Self-Aware Trader system communication (entity in charge of local communications) sends a message to the Self-Aware Stress trading information to send the trader’s information not only to the interface, but to the server as well in order to calculate the group aware information. The server will subsequently send this information to the multicast network. This process is shown in figure 3.15 (The reader should note that the message from the server to the multicast network is represented in the figure as a message to the client).
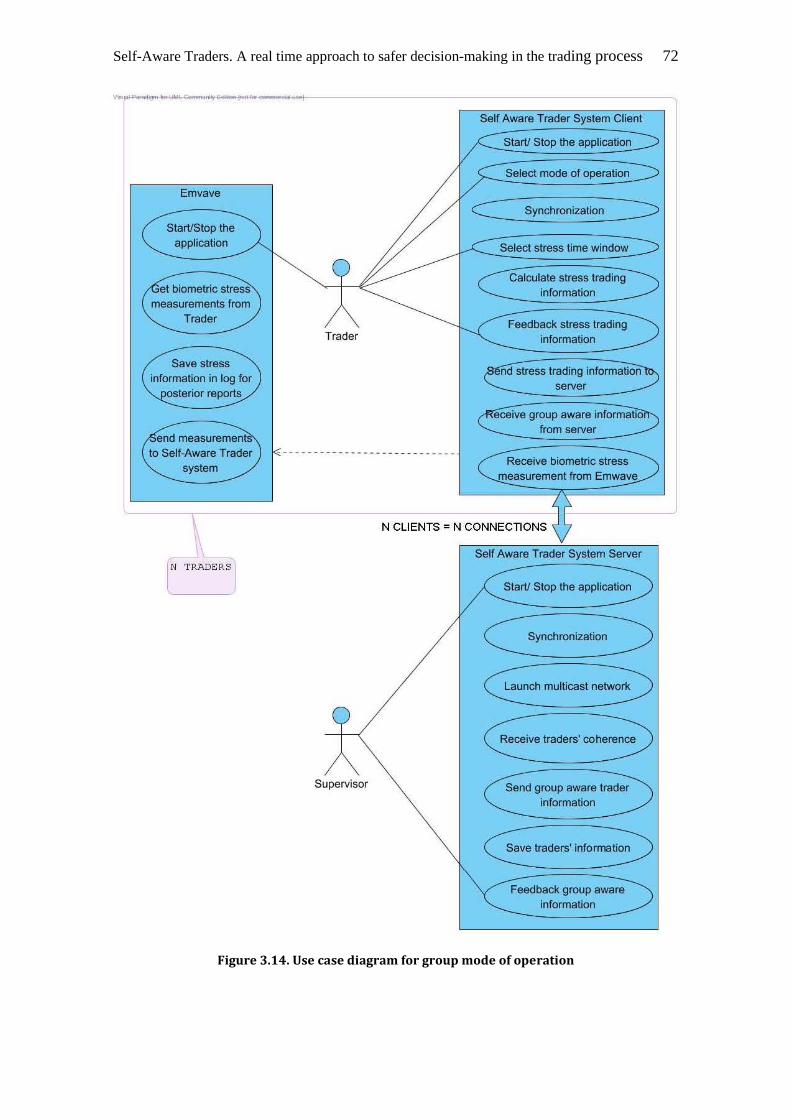
Self-Aware Traders. A real time approach to safer decision-making in the trading process 72
Figure 3.14. Use case diagram for group mode of operation
Emvave
StartlStop the application
et biometric stress
Save stress information in lag for
sterior reports
end measurement to Self-Aware Trader
system
[N TR~DERS
Trader
Supervisor
Self Aware Trader System Client
Startl Stop the application
Select mode of operation
C::-::====S=,:"=C=h=ffi="=;z=a=tio="======::>
Select stress time window
Calculate stress trading information
Feedback stress trading information
nd stress trading information server
eceive group aware informatio from server
Receive biometric stress measurement from Emwave
N CLlENTS = N CONNECTIONS
Self Aware Trader System Server
Startl Stop the application
e Synchronization ~
Launch multicast network
Receive traders' coherence
Send group aware trader information
Save traders' information
Feedback group aware information
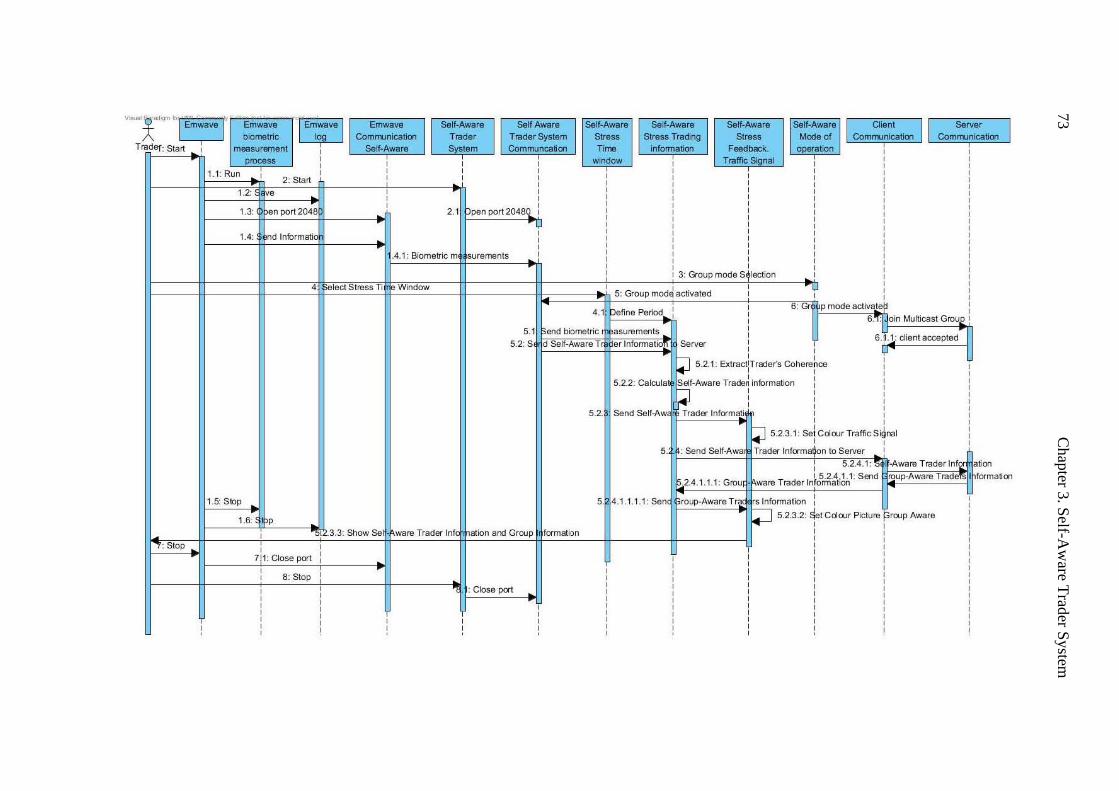
73 C
hapter 3. Self-A
ware T
rader System
~-'*·~·'O-'-" ~ Emwave Emwave Emwave Comrrunlcatioo
Trad"f: Start I , I Sa~-Aware I I :;vs¡em
Se~ Aware
Trader System Communcation I ~- , I ' "'''' l' "'"U",, .. ,"", I I T~';~-;;~ I 1' u~ .. u'''' I
Cl ien! Communlcatloo
s.~,
Communlcatiol
I EfOCEI$$ I , , , ,
, , , ,
1.1: Run ,
, , , , ,
2: Start , , ,
,
1.2: , , , , ,
1.3: pen port2048 ,
" ,
pen port20480 I
1.4: pnd Inbrmat ' ~
, ,
.4.1: Biomelric m ureroonls ,
, leC! Stress n Window
", 5.2: S
1.5: Sb p
1.6: p , I .3.3: Show Se l ware Trader Inl ation aro:! Groop
: Stop , ,
7j1 : C lase p<rt , ,
, , , 8 : Stop
: Ciose p<rt
, ,
, , ,
! ! ! !
window
3: Group moda S~ection
5: Group mod~ activated ' ~
::lefine Period , 6 : Gr p moda activa!
" ,
" a in Mull icaSI Grou
ood bornelric asu re menlS d Se lf-Awa re T er Informatio s."~ , 6 .1.1: cl ienlaccepled
, y ~_ 521 Extract rade~s Cohe ... i.ce ,
, , ,
5.2.2 : Ca lcu la ' , , ~~Aware Traden InbrmattOn I ,
, , , , , , , , ,
5.2. Send Se lf-Aw Tradar Inlc.-mall I , , ,
~_ 5.2.3.1: Selcolcur Traftlc S~M I , ,
" : Send Se lf -Awa Trader Infa maljon 10 Server I
, 5.2.4 .1: -Aware Traderlnfo:
.2.4 .1.1.1 : Grou ware Trader Inl~~~i,1;,l : SMd roup-Awarl'l Trade
S. 4 .1.1.1.1: Sen rOl(l-Aware Tr~ s Information :
:;:J 5.2.3.2 : ~t Cdoor Picture roup Aware
l<Ymatbn
, , lti ro
:<Ymatiro
Self-Aware Traders. A real time approach to safer decision-making in the trading process 74
Figure 3.15. Sequence diagram for group mode of operation. Client side
This process is run by every client, so if there are 10 traders connected, the server receives 10 trader coherence values and sends the group aware information received by the 10 traders to the multicast network. Thanks to the multicast network the server only has to send one message. This is crucial when the network is loaded with many clients. For example, if there are 1000 traders connected at the same time, in the case that multicast is not available; the server should send 1 message per trader, so probably every second (time chosen to update the information) the server would send 1000 messages thus congesting the system’s network. In this way, in communications terms it is indifferent the number of traders connected to the network because the server always need to send only one message.
It is expected that a possible congesting problem could be detected first in the data base than in the network. Anyway, the system has been designed to be ready to work in team’s scenarios where it is not expected more than 100 traders connected.
Another crucial aspect considered for the design was synchronization. The first relation between the clients and the server is the synchronization. The clients and the server should be timed-synchronized in order to get the information that really is happening in that moment. To calculate the group-aware information in a precise moment, the server needs the traders’ coherence in that precise moment. In the same way to save the information consistently we have to be sure of a total synchronization of the information.
One possible solution contemplated was to synchronize the server and the clients with one free atomic hour server available through internet. However, in the trading context due the security of the systems and the value of the information, usually the network where the trading information is present is closed for this kind of connections.
In order to keep the compromise of a total integration with the trading information process, we decide to use the server internal clock as primary clock to synchronize all the clients. In this way, when the client joins to the multicast network the first task is to ask to the server (through a socket connection) the time and the server responds with its local time. From this moment on, the client calculates the difference between its time and the server time and applies this difference in every information send to the server. In other words, the client clock is a “fake” clock with the server time. This process is described in the diagram in the figure 3.16.
Another decision adopted in this design was the frequency at which the server sends the Group-Aware information. Our first approach was to use the same frequency at which Emwave sends the biometric trader’s information, twice per second. We tested this option and the multicast connection between server and clients worked without problems. However, after the initial tests we found arguments to reduce the frequency of messages to 1 per second.
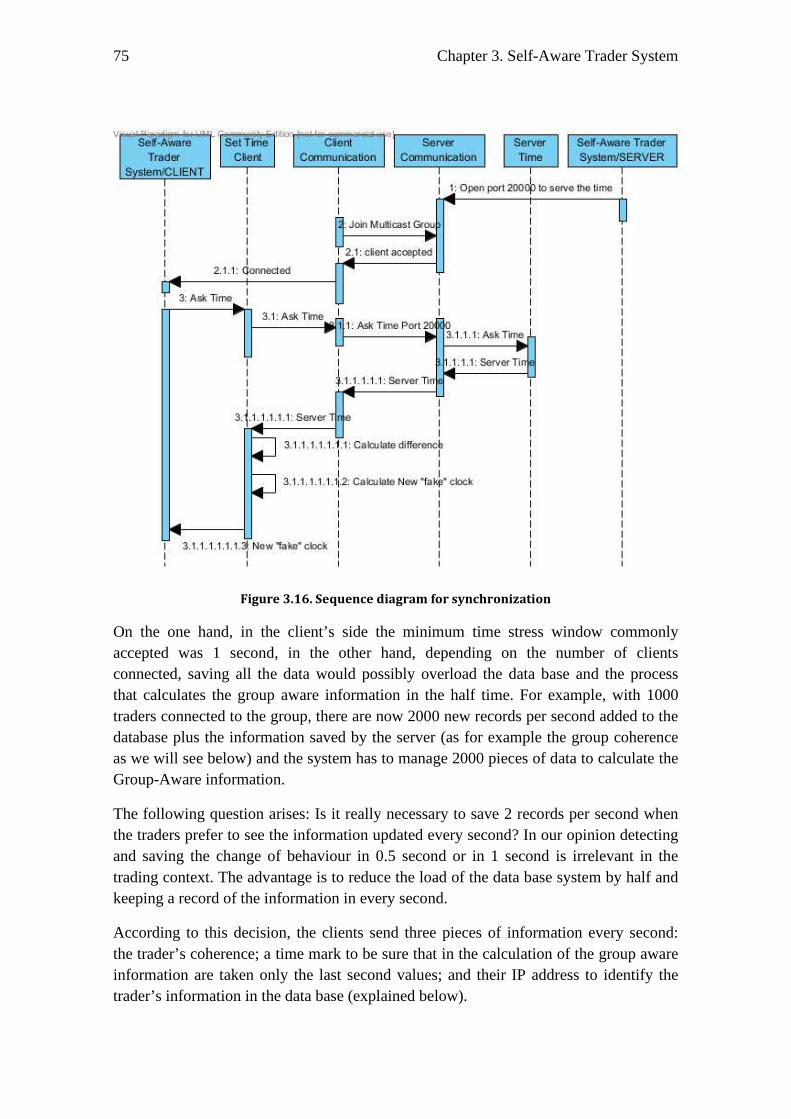
75 Chapter 3. Self-Aware Trader System
Figure 3.16. Sequence diagram for synchronization
On the one hand, in the client’s side the minimum time stress window commonly accepted was 1 second, in the other hand, depending on the number of clients connected, saving all the data would possibly overload the data base and the process that calculates the group aware information in the half time. For example, with 1000 traders connected to the group, there are now 2000 new records per second added to the database plus the information saved by the server (as for example the group coherence as we will see below) and the system has to manage 2000 pieces of data to calculate the Group-Aware information.
The following question arises: Is it really necessary to save 2 records per second when the traders prefer to see the information updated every second? In our opinion detecting and saving the change of behaviour in 0.5 second or in 1 second is irrelevant in the trading context. The advantage is to reduce the load of the data base system by half and keeping a record of the information in every second.
According to this decision, the clients send three pieces of information every second: the trader’s coherence; a time mark to be sure that in the calculation of the group aware information are taken only the last second values; and their IP address to identify the trader’s information in the data base (explained below).
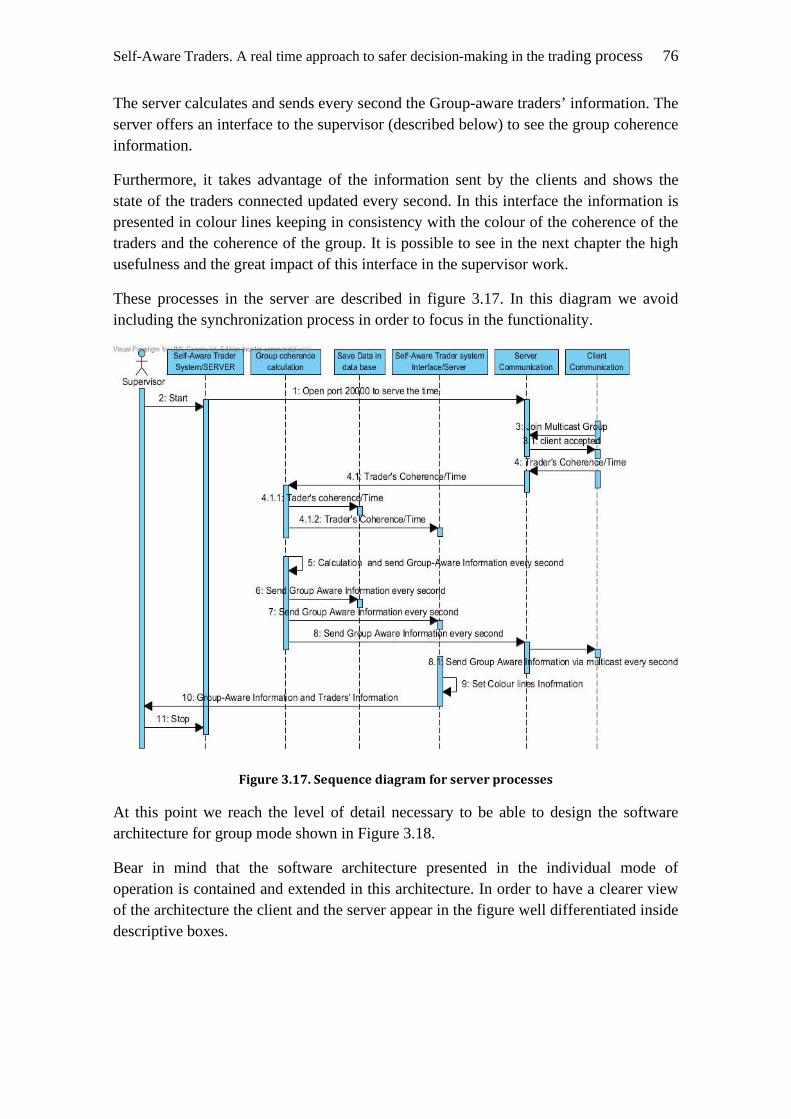
Self-Aware Traders. A real time approach to safer decision-making in the trading process 76
The server calculates and sends every second the Group-aware traders’ information. The server offers an interface to the supervisor (described below) to see the group coherence information.
Furthermore, it takes advantage of the information sent by the clients and shows the state of the traders connected updated every second. In this interface the information is presented in colour lines keeping in consistency with the colour of the coherence of the traders and the coherence of the group. It is possible to see in the next chapter the high usefulness and the great impact of this interface in the supervisor work.
These processes in the server are described in figure 3.17. In this diagram we avoid including the synchronization process in order to focus in the functionality.
Figure 3.17. Sequence diagram for server processes
At this point we reach the level of detail necessary to be able to design the software architecture for group mode shown in Figure 3.18.
Bear in mind that the software architecture presented in the individual mode of operation is contained and extended in this architecture. In order to have a clearer view of the architecture the client and the server appear in the figure well differentiated inside descriptive boxes.
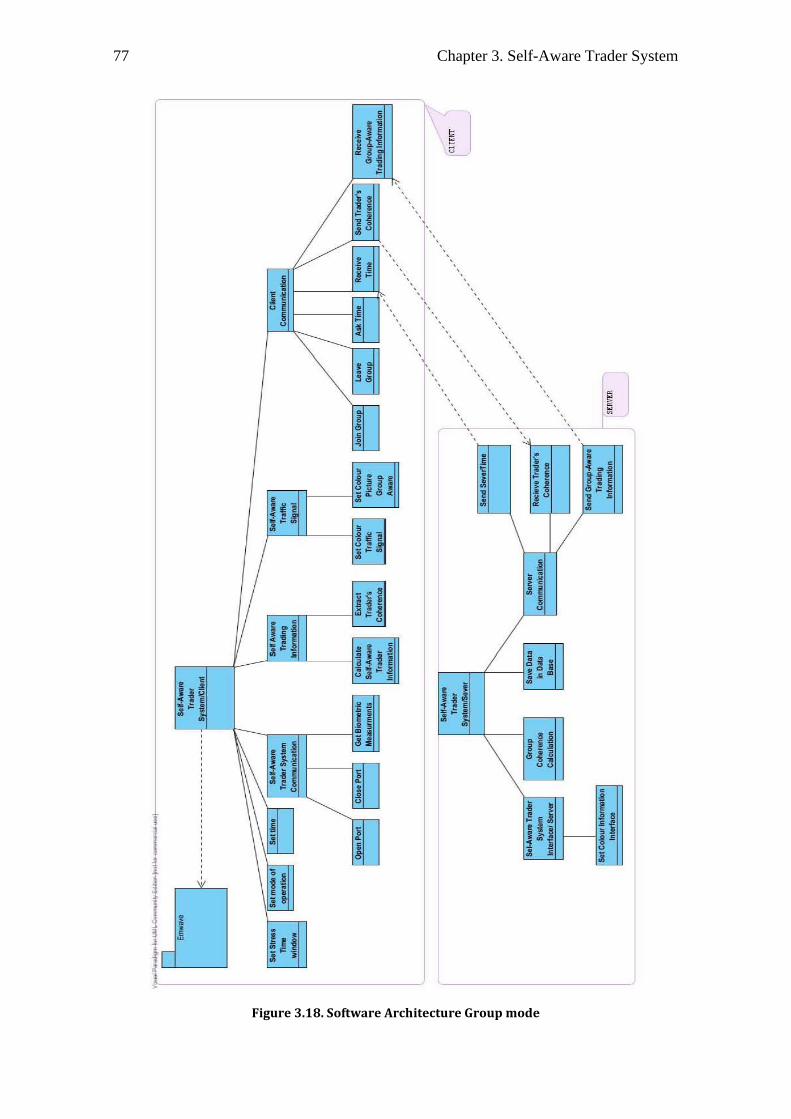
77 Chapter 3. Self-Aware Trader System
Figure 3.18. Software Architecture Group mode
1
1 1
111 l·q ~ .
Self-Aware Traders. A real time approach to safer decision-making in the trading process 78
For the database server we want to describe the decisions made and where the information is saved. This database (cf. subsection 3.4) is a MySQL data base system. Points to consider in the design of the database are the following:
• It is necessary to have a fast access storing few information (at least one record writing per second)
• The server is in charge of managing all information to and from the database. Saving the group coherence calculated per second and the traders’ coherence allow the supervisor to monitor the system.
• The server should be considered in the data base as one client more connected with the same data (the coherence of the server will be the group coherence). This allows saving all the information in one record (clients’ coherence and group coherence).
• It is important to manage the time at least in seconds in the data base since in every second new information is recorded.
Responding to these points, a centralized data base was chosen; it is called stressawarelog with only one table. This table is created per day and the name is the date (day_month_year) followed by “_marketfeeling” making reference to the content. Creating a table per day gives us two advantages, the first one is avoiding the overload and the consequent slow down in the managing of the table; the second one is that we get the “log” effect in an easy way, so the supervisor can check easily the trading session of one concrete day. This is extremely useful in audit cases. This table is created automatically when the supervisor starts the system (if the system is restarted, it detects that the table is present and skips the creation step). The table is composed of the following fields in every record:
• Id: Every table has a primary key, in this case with few information it is more efficient to include in the table an auto incremental field being this the primary key.
• TimeStamp: As the name indicates, it is a field to save the timestamp. The TimeStamp saves information in the format year-month-day- hour- minute-second-millisecond. This is enough precision for our purposes.
• Ip: Saves the Ip address allowing the system to know to whom the coherence saved belongs. The information is saved as a string (in MySQL notation is a VARCHAR 15)
• Coherence: Save the coherence value 0 for bad coherence, 1 for medium and 2 for good. The information is saved as small int. (in MySQL notation is a TINYINT)
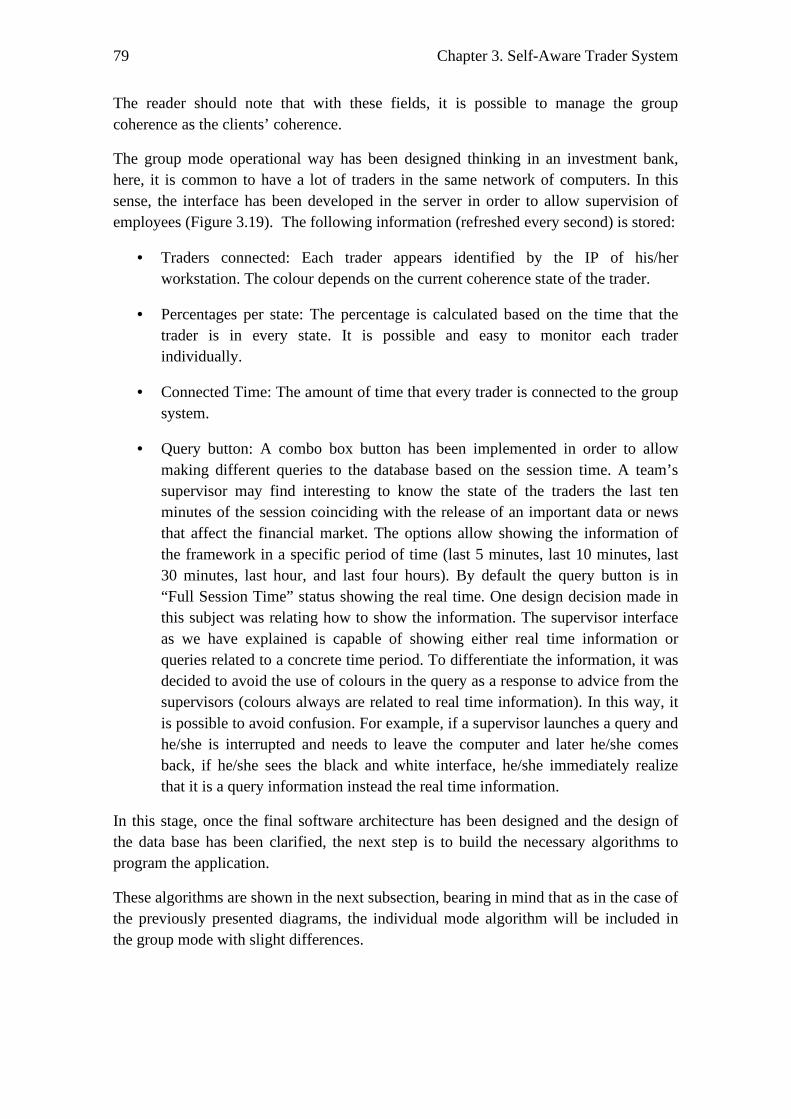
79 Chapter 3. Self-Aware Trader System
The reader should note that with these fields, it is possible to manage the group coherence as the clients’ coherence.
The group mode operational way has been designed thinking in an investment bank, here, it is common to have a lot of traders in the same network of computers. In this sense, the interface has been developed in the server in order to allow supervision of employees (Figure 3.19). The following information (refreshed every second) is stored:
• Traders connected: Each trader appears identified by the IP of his/her workstation. The colour depends on the current coherence state of the trader.
• Percentages per state: The percentage is calculated based on the time that the trader is in every state. It is possible and easy to monitor each trader individually.
• Connected Time: The amount of time that every trader is connected to the group system.
• Query button: A combo box button has been implemented in order to allow making different queries to the database based on the session time. A team’s supervisor may find interesting to know the state of the traders the last ten minutes of the session coinciding with the release of an important data or news that affect the financial market. The options allow showing the information of the framework in a specific period of time (last 5 minutes, last 10 minutes, last 30 minutes, last hour, and last four hours). By default the query button is in “Full Session Time” status showing the real time. One design decision made in this subject was relating how to show the information. The supervisor interface as we have explained is capable of showing either real time information or queries related to a concrete time period. To differentiate the information, it was decided to avoid the use of colours in the query as a response to advice from the supervisors (colours always are related to real time information). In this way, it is possible to avoid confusion. For example, if a supervisor launches a query and he/she is interrupted and needs to leave the computer and later he/she comes back, if he/she sees the black and white interface, he/she immediately realize that it is a query information instead the real time information.
In this stage, once the final software architecture has been designed and the design of the data base has been clarified, the next step is to build the necessary algorithms to program the application.
These algorithms are shown in the next subsection, bearing in mind that as in the case of the previously presented diagrams, the individual mode algorithm will be included in the group mode with slight differences.
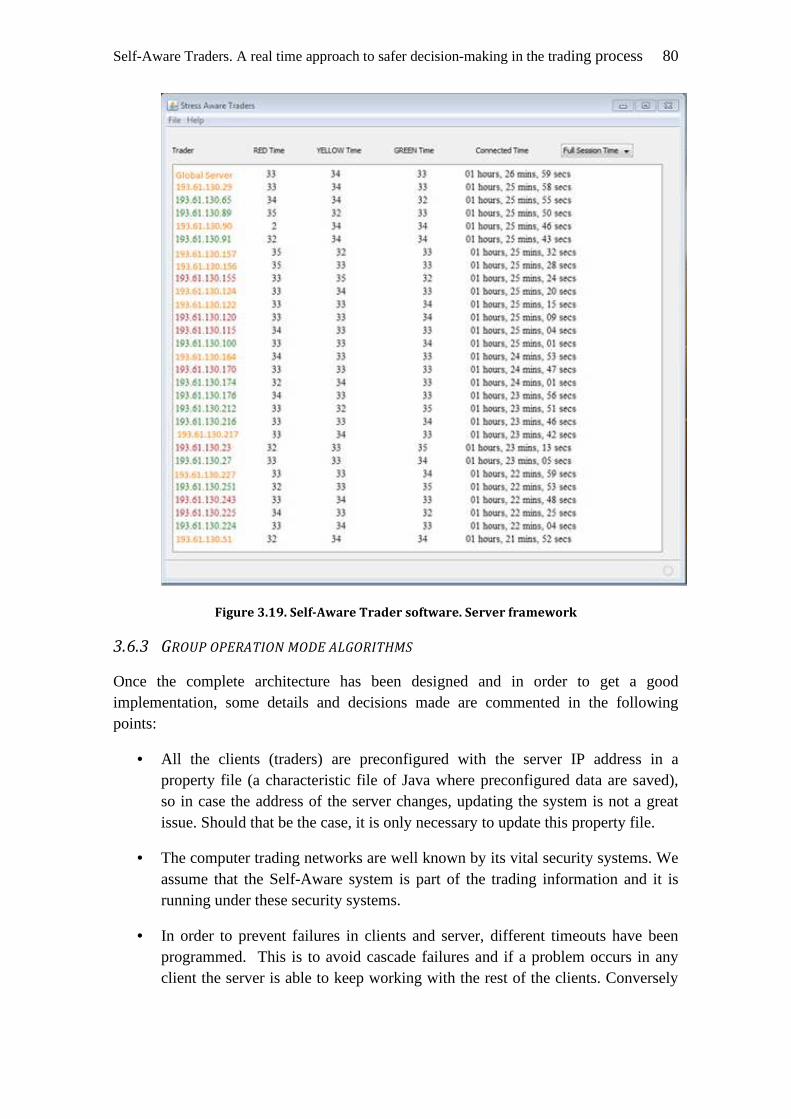
Self-Aware Traders. A real time approach to safer decision-making in the trading process 80
Figure 3.19. Self-Aware Trader software. Server framework
3.6.3 GROUP OPERATION MODE ALGORITHMS
Once the complete architecture has been designed and in order to get a good implementation, some details and decisions made are commented in the following points:
• All the clients (traders) are preconfigured with the server IP address in a property file (a characteristic file of Java where preconfigured data are saved), so in case the address of the server changes, updating the system is not a great issue. Should that be the case, it is only necessary to update this property file.
• The computer trading networks are well known by its vital security systems. We assume that the Self-Aware system is part of the trading information and it is running under these security systems.
• In order to prevent failures in clients and server, different timeouts have been programmed. This is to avoid cascade failures and if a problem occurs in any client the server is able to keep working with the rest of the clients. Conversely
81 Chapter 3. Self-Aware Trader System
if the server has a problem the rest of the clients are able to keep working in individual mode.
For this development every trader (client) has been implemented managing the following communications:
• One socket connection to receive the sensor data (two measures per second)
• One socket connection to send the current coherence to the server (one per second)
• One multicast connection to receive the current coherence to the server (one per second)
In the server side, the following communications are managed:
• One socket connection for synchronization (every time a new trader joins to the group)
• One multi socket connection to receive the data from the clients (one read per client per second)
• One multicast connection to send the current coherence to all clients and the number of the traders connected to the system (one per second)
• One mysql connection to save the data in the database (one write per trader per second)
The algorithms used as previous step to program the group mode of operation are the final algorithms to develop the application. These algorithms really represent the full system. We want to reach this level as highest degree of detail and to give to the reader the complete flow of the information. As in section 3.5.2.1, the main strategy of the program is explained for the client and the server and the algorithms with full details are following explained. Some comments are indicated with the symbols “//”.
In this case and since in the flowchart diagrams threads cannot be properly seen, we avoid this presentation for the group mode of operation. However, the reader could find a full detailed explanation (including threats) in the previously presented sequence diagrams.
Finally, brief instructions that were given to the supervisors to check the difficulty to understand how to start and work with the program are presented.
The Self-Aware Trader Client in group mode algorithm description is shown in a pseudocode way (the steps added to the individual mode it is highlighted in bold):
Input: XML data send by Emwave through PORT 20480
Self-Aware Traders. A real time approach to safer decision-making in the trading process 82
Output: Traffic signal showed in screen indicating the time window coherence level and picture of the group showing the group’ coherence.
Main algorithm client steps (strategy)
A. Prepare connection between Emwave program and Stress Traffic Signal program
B. Establish communication between Emwave program and Stress Traffic Signal program
C. Print Traffic Signal in the screen with the lights off
D. User defines sensibility in the system (time window coherence desired) // User can change this parameter at any time. This change will be applied in the next coherence time window cycle.
E. Current time window coherence and Coherence counters (3), one per traffic signal are defined and initialized
F. Search in the data send through Emwave the exact location of the real time coherence
G. User connects to group
H. Synchronize with Server
I. While (User is connected to application)
a. Extract real time coherence value from Emwave program
b. Increment current time window coherence counter
c. Send every second the current coherence to server // It is important to bear in mind that the trader keep watching the coherence according with his/her time window. However, the coherence of the group is showing every second, so it is send every second.
d. Receive the group coherence from server. // This process always is hearing (Threat)
e. Set the colour of group picture
f. If Current time window coherence < time window coherence desired
• Increment the right coherence counter (green, yellow or red) according to the coherence real time value
g. Else // Only enter here when the time window coherence reaches the sensibility of the user, meanwhile the algorithm only increments the counters and the traffic signal light does not change
83 Chapter 3. Self-Aware Trader System
• If user changed time window coherence, time window coherence desired is updated with the new value
• Compare the value of the 3 counters and put in the traffic signal light the colour of the counter with the higher value
• Restart the current time window coherence counter and the 3 coherence counters for the next cycle
h. End if // Notice that if there is a draw between the coherence counters, the traffic signal does not change and keeps the previous light. We considered that with this approach we avoid false positives.
J. End while
K. Close communications, close socket and close buffer.
The algorithm in more detail is explained below. It is highlighted in bold the steps added to the individual mode
Algorithm Client in detail:
1. Create Socket to read from Port 20480 (A)
2. Create Buffer reader to save the data read
3. Establish communication between Emwave program and Stress Traffic Signal program (B)
4. Print Traffic Signal in the screen with lights off (C)
5. User defines sensibility in the system (time window coherence desired) // User can change this parameter at any time. This change will be applied in the next coherence time window cycle. (D)
6. Sensibility variable (time window coherence desired) is initialized with user input data between 1 second and 30 seconds. The default value is a medium sensibility, 10 seconds.
i. If input data <> default value then
1. Time window coherence desired = input data.
7. Current time window coherence is initialized (E)
i. Current time window coherence counter = 0
8. Coherence counters (3), one per signal are initialized
i. Red Counter =0
ii. Yellow Counter = 0

Self-Aware Traders. A real time approach to safer decision-making in the trading process 84
iii. Green Counter = 0
9. Create a string variable to search in the string the exact location of the real time coherence (F)
10. Initialize the search string variable with “ S=”
11. User click connect to group (G)
12. Synchronize with Server (H)
i. Ask time to server through socket 20000
ii. Receive time
iii. Calculate difference with local time
13. While (data in buffer != null) (I)
i. Read buffer (a)
ii. Current time window coherence counter = Current time window coherence counter +1 (b)
iii. Send every second the current coherence to server through multicast
1. fake time = local time - difference
2. It is send in this way (Coherence, IP, “fake time”)
iv. Receive the group coherence through multicast (Threat)
v. Set the colour of the figure
1. If coherence group == 0
a. Picture group colour = red
2. If coherence group == 1
b. Picture group colour = Yellow
3. If coherence group == 2
c. Picture group colour = Green
vi. Search the coherence real time value through the search variable
vii. If Current time window coherence counter < sensibility desired (c)
2. Increment the right coherence counter according to the coherence real time value

85 Chapter 3. Self-Aware Trader System
3. If coherence real time value = = 0 then
a. Red Counter = red counter +1
4. If coherence real time value = = 1 then
a. Yellow Counter = yellow counter +1
5. If coherence real time value = = 2 then
a. Green Counter = green counter +1
viii. Else // Only enter here when the time window coherence reach the sensibility of the user, meanwhile the algorithm only increment the counters and the traffic signal light does not change (d)
1. Current time window coherence counter =0
2. If input data <> time window coherence desired then
a. Time window coherence desired = input data.
b. Compare the value of the 3 counters and obtain the counter with the higher value
3. If (red counter > Yellow Counter) and (red counter > green counter) then
a. Turn off Traffic signal
b. Traffic signal = red
4. If (Yellow Counter > red counter) and (yellow counter > green counter) then
a. Turn off Traffic signal
b. Traffic signal = Yellow
5. If (green counter > Yellow Counter) and (green counter > red counter) then
a. Turn off Traffic signal
b. Traffic signal = green
6. Restart Counters
7. Current Time window Coherence =0
8. Red Counter=0

Self-Aware Traders. A real time approach to safer decision-making in the trading process 86
9. Yellow Counter=0
10. Green Counter=0
ix. End if //Notice that if there are a draw between the counters the traffic signal does not change and keep the previous light. (d)
14. End while (H)
15. Close communications, close socket and close buffer. (I)
Now it is presented the Self-Aware Trader server in group mode algorithm description in a Pseudo – code way is showed (it is highlighted in bold the steps added to the individual mode). It is important to take into account that the steps presented are not sequential since the oriented based programming allows us to define multi threats of execution allowing in parallel some routines:
Input: Data send by clients through multicast
Output: Interface supervisor with traders’ coherence in real time, possible queries and data saved in data base.
Main algorithm server steps (strategy)
A. Prepare multicast connection to receive data from clients and wait//Threat 1
B. Prepare server connection to serve the time for the clients and wait //Threat 2
C. Create diary data base
D. Print Supervisor interface empty. No clients are connected.
E. Trader connect to group // Until this moment the server is waiting.
F. Increment the number of traders connected
G. Save the information in the data base
H. Refresh information in supervisor interface.
I. While (traders) // Threat 3
a. Calculate coherence group between all the traders connected
b. Send every second the current group coherence to multicast network
c. Write in data base coherence group information
J. End while
K. User decides to see a query // This step is only execute when is received a order from the user and not implies the stopping of the previous steps.
87 Chapter 3. Self-Aware Trader System
a. Access to the data base and do the query selected
b. Present the results
c. Wait until detect user select “Full session time”
L. User decide close the program // This step is only execute when is received a order from the user
a. Close communications, close database.
The algorithm in more detail is explained below.
Algorithm Server in detail:
1. Create multicast connection to receive data from clients and wait//Threat 1 (A)
2. Create socket connection port 20000 to serve the time for the clients and wait //Threat 2 (B)
3. If !data base (C)
a. Create data base
4. Print supervisor interface empty (D)
5. Socket newclient accepted (E, F, G)
a. Read the current value
b. If !(list traders)
i. Create vector of traders
ii. Create list of values inside every trader
c. If Ip !found in list traders
i. Add new trader to the vector of traders
d. Add the value to the list of values of the trader
e. Insert value in data base
6. Refresh information in supervisor interface.(H)
7. While (traders) // Threat 3 (I)
a. For trader 1 to trader n connected get value last second
b. Make mode from values //Same process detailed before to set the colour of the traffic signal
c. Send via multicast Coherence group
Self-Aware Traders. A real time approach to safer decision-making in the trading process 88
d. Insert into data base ( Ip server, Coherence group, Timestamp)
8. End while
9. User select in combo a query // This step is only execute when is received a order from the user and not implies the stopping of the previous steps. (K)
a. Access to the data base and do the query selected (5 minutes, 10 minutes, last hour, last 4 hours)
b. Present the results
c. Wait until detect user select “Full session time”
10. User decide close the program // This step is only execute when is received a order from the user (L)
a. Close server socket clients data information
b. Close server socket Time
c. Close data base
Brief server instructions
A short description for start up of the system for the supervisor is described below. In the tests explained in the next chapter, we will see that the supervisor had no problems to understand these steps.
The supervisor follows the next steps.
• Start the Self-Aware Trader system supervisor application
• Chose in the interface the query desired with the combo box. If none query is selected the traders’ coherence information in real time is presented.
• When the session is finished close application.
The software development went through an overload test in the laboratories of the School of Computing and Mathematics of the University of Ulster and was tested with 30 clients running without anomalies (as we can see in the figure 3.20 previously presented).
The next chapter describes the tests carried out with some real traders to validate the system and a discussion of the results is shown.
Chapter 4
Este capítulo está dedicado a la presentación de los experimentos más destacados realizados durante la presente tesis. Se presentan de igual modo en cada experimento los resultados obtenidos así como su análisis. En este capítulo se pueden encontrar experimentos realizados bajo los dos modos de operación del sistema: individual y grupal. Unas conclusiones extraídas tras el análisis de los resultados obtenidos en todos los test cierran el presente capítulo.
This chapter is dedicated to the most representative experiments realized during this work. In every experiment an analysis and discussion of the results is presented. Besides, this chapter comprises experiments under the two modes of operation: individual and group. Finally, the conclusions obtained during the analysis of the results are closing this chapter.
4. CASE STUDIES – VALIDATION
4.1 INTRODUCTION
This chapter describes tests made with traders in two scenarios, individual trading from home and trading in a company (individual and collective). The global intention with these tests is to establish the real impact of information on the coherence levels of traders during the trading process through the Self- Aware Trader Software.
Depending on the specific scenario, the setup of the test is different with different objectives. These tests are described in detail in the following subsections and a discussion of the results is presented.
It should be noticed that since the trading context is a quite closed environment with high confidentiality needs, it was hard to find some traders to test the system in real operating conditions. Besides, every moment in the stock markets and the state of each trader is different so any test is unrepeatable under the same circumstances. This fact put high pressure to compile the maximum number of data in these tests.
Therefore, the tests made in the company Louis Capital markets to validate the group mode of operation and gather information from a traders’ team supervisor needed some permissions to allow carry out these experiments.
We thank Louis Capital Markets for the opportunity to be able to validate the system and allow us to gather all the necessary information. We were even allowed to take some pictures and present them in this work.
The chapter will start with the validation of the individual mode of operation with some tests from individual traders (usually his/her trading process is carried on from home) and some first conclusions drawn. After that, he company tests are described. It is
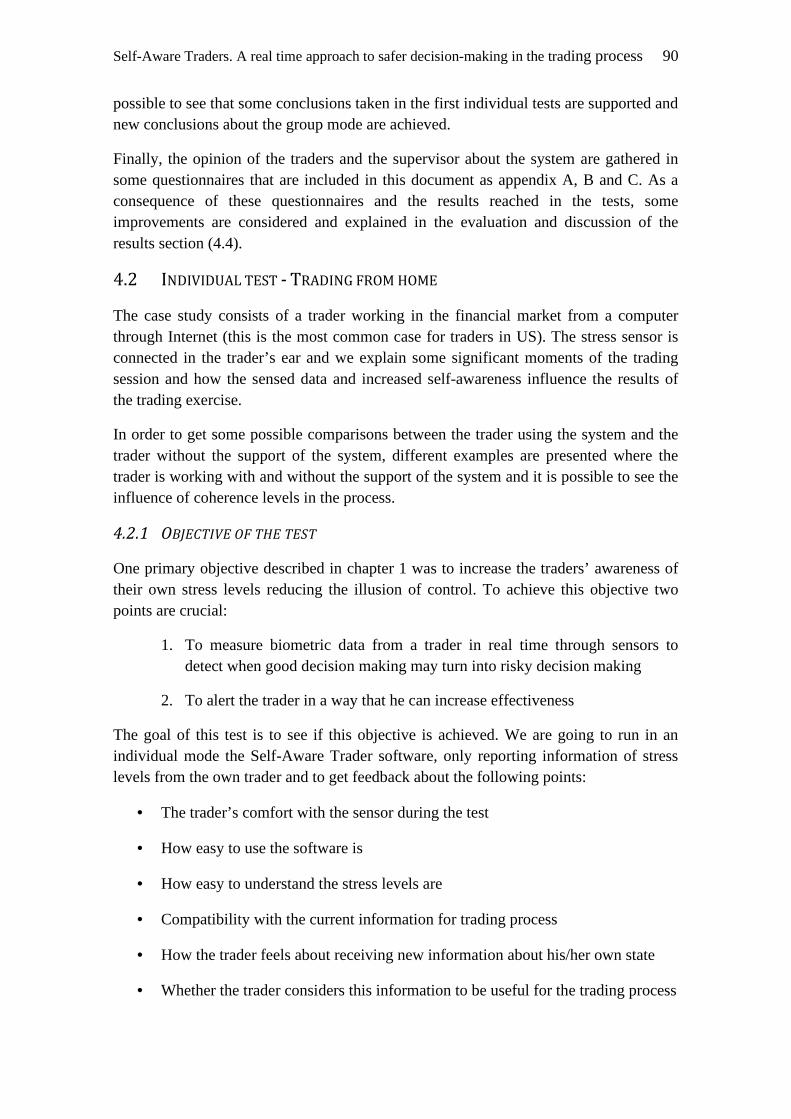
Self-Aware Traders. A real time approach to safer decision-making in the trading process 90
possible to see that some conclusions taken in the first individual tests are supported and new conclusions about the group mode are achieved.
Finally, the opinion of the traders and the supervisor about the system are gathered in some questionnaires that are included in this document as appendix A, B and C. As a consequence of these questionnaires and the results reached in the tests, some improvements are considered and explained in the evaluation and discussion of the results section (4.4).
4.2 INDIVIDUAL TEST - TRADING FROM HOME
The case study consists of a trader working in the financial market from a computer through Internet (this is the most common case for traders in US). The stress sensor is connected in the trader’s ear and we explain some significant moments of the trading session and how the sensed data and increased self-awareness influence the results of the trading exercise.
In order to get some possible comparisons between the trader using the system and the trader without the support of the system, different examples are presented where the trader is working with and without the support of the system and it is possible to see the influence of coherence levels in the process.
4.2.1 OBJECTIVE OF THE TEST
One primary objective described in chapter 1 was to increase the traders’ awareness of their own stress levels reducing the illusion of control. To achieve this objective two points are crucial:
1. To measure biometric data from a trader in real time through sensors to detect when good decision making may turn into risky decision making
2. To alert the trader in a way that he can increase effectiveness
The goal of this test is to see if this objective is achieved. We are going to run in an individual mode the Self-Aware Trader software, only reporting information of stress levels from the own trader and to get feedback about the following points:
• The trader’s comfort with the sensor during the test
• How easy to use the software is
• How easy to understand the stress levels are
• Compatibility with the current information for trading process
• How the trader feels about receiving new information about his/her own state
• Whether the trader considers this information to be useful for the trading process
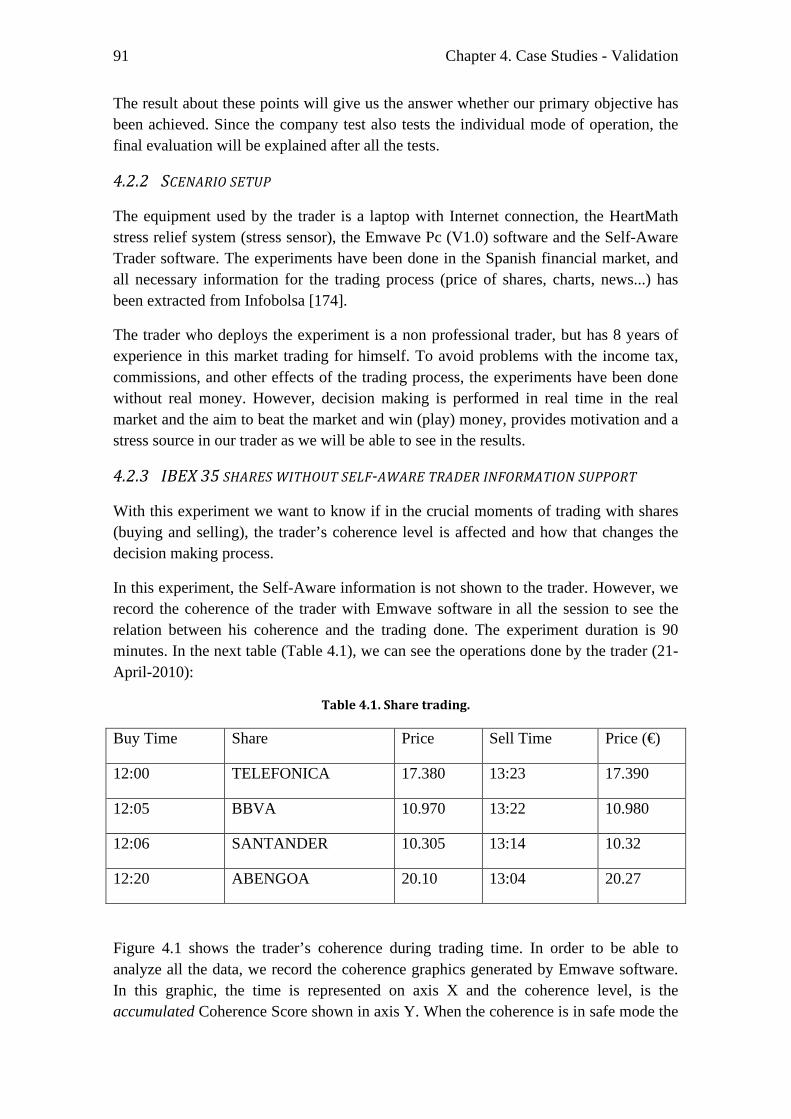
91 Chapter 4. Case Studies - Validation
The result about these points will give us the answer whether our primary objective has been achieved. Since the company test also tests the individual mode of operation, the final evaluation will be explained after all the tests.
4.2.2 SCENARIO SETUP
The equipment used by the trader is a laptop with Internet connection, the HeartMath stress relief system (stress sensor), the Emwave Pc (V1.0) software and the Self-Aware Trader software. The experiments have been done in the Spanish financial market, and all necessary information for the trading process (price of shares, charts, news...) has been extracted from Infobolsa [174].
The trader who deploys the experiment is a non professional trader, but has 8 years of experience in this market trading for himself. To avoid problems with the income tax, commissions, and other effects of the trading process, the experiments have been done without real money. However, decision making is performed in real time in the real market and the aim to beat the market and win (play) money, provides motivation and a stress source in our trader as we will be able to see in the results.
4.2.3 IBEX 35 SHARES WITHOUT SELF-AWARE TRADER INFORMATION SUPPORT
With this experiment we want to know if in the crucial moments of trading with shares (buying and selling), the trader’s coherence level is affected and how that changes the decision making process.
In this experiment, the Self-Aware information is not shown to the trader. However, we record the coherence of the trader with Emwave software in all the session to see the relation between his coherence and the trading done. The experiment duration is 90 minutes. In the next table (Table 4.1), we can see the operations done by the trader (21-April-2010):
Table 4.1. Share trading.
Buy Time Share Price Sell Time Price (€)
12:00 TELEFONICA 17.380 13:23 17.390
12:05 BBVA 10.970 13:22 10.980
12:06 SANTANDER 10.305 13:14 10.32
12:20 ABENGOA 20.10 13:04 20.27
Figure 4.1 shows the trader’s coherence during trading time. In order to be able to analyze all the data, we record the coherence graphics generated by Emwave software. In this graphic, the time is represented on axis X and the coherence level, is the accumulated Coherence Score shown in axis Y. When the coherence is in safe mode the
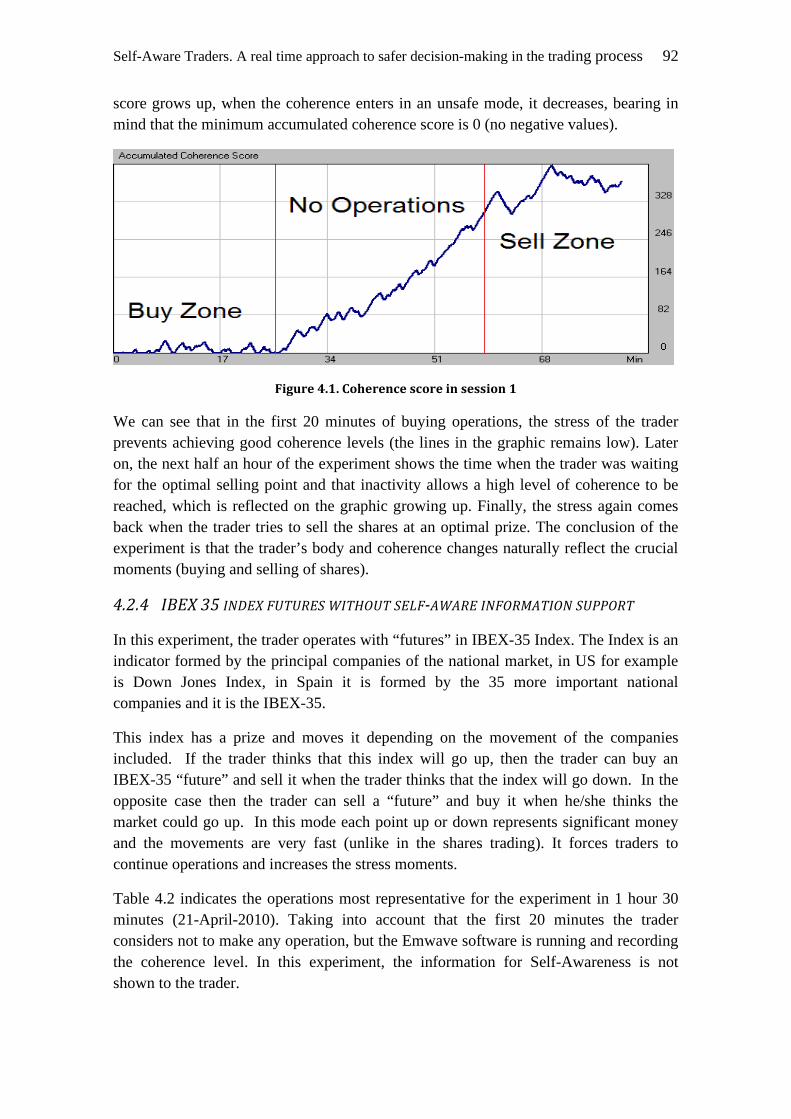
Self-Aware Traders. A real time approach to safer decision-making in the trading process 92
score grows up, when the coherence enters in an unsafe mode, it decreases, bearing in mind that the minimum accumulated coherence score is 0 (no negative values).
Figure 4.1. Coherence score in session 1
We can see that in the first 20 minutes of buying operations, the stress of the trader prevents achieving good coherence levels (the lines in the graphic remains low). Later on, the next half an hour of the experiment shows the time when the trader was waiting for the optimal selling point and that inactivity allows a high level of coherence to be reached, which is reflected on the graphic growing up. Finally, the stress again comes back when the trader tries to sell the shares at an optimal prize. The conclusion of the experiment is that the trader’s body and coherence changes naturally reflect the crucial moments (buying and selling of shares).
4.2.4 IBEX 35 INDEX FUTURES WITHOUT SELF-AWARE INFORMATION SUPPORT
In this experiment, the trader operates with “futures” in IBEX-35 Index. The Index is an indicator formed by the principal companies of the national market, in US for example is Down Jones Index, in Spain it is formed by the 35 more important national companies and it is the IBEX-35.
This index has a prize and moves it depending on the movement of the companies included. If the trader thinks that this index will go up, then the trader can buy an IBEX-35 “future” and sell it when the trader thinks that the index will go down. In the opposite case then the trader can sell a “future” and buy it when he/she thinks the market could go up. In this mode each point up or down represents significant money and the movements are very fast (unlike in the shares trading). It forces traders to continue operations and increases the stress moments.
Table 4.2 indicates the operations most representative for the experiment in 1 hour 30 minutes (21-April-2010). Taking into account that the first 20 minutes the trader considers not to make any operation, but the Emwave software is running and recording the coherence level. In this experiment, the information for Self-Awareness is not shown to the trader.
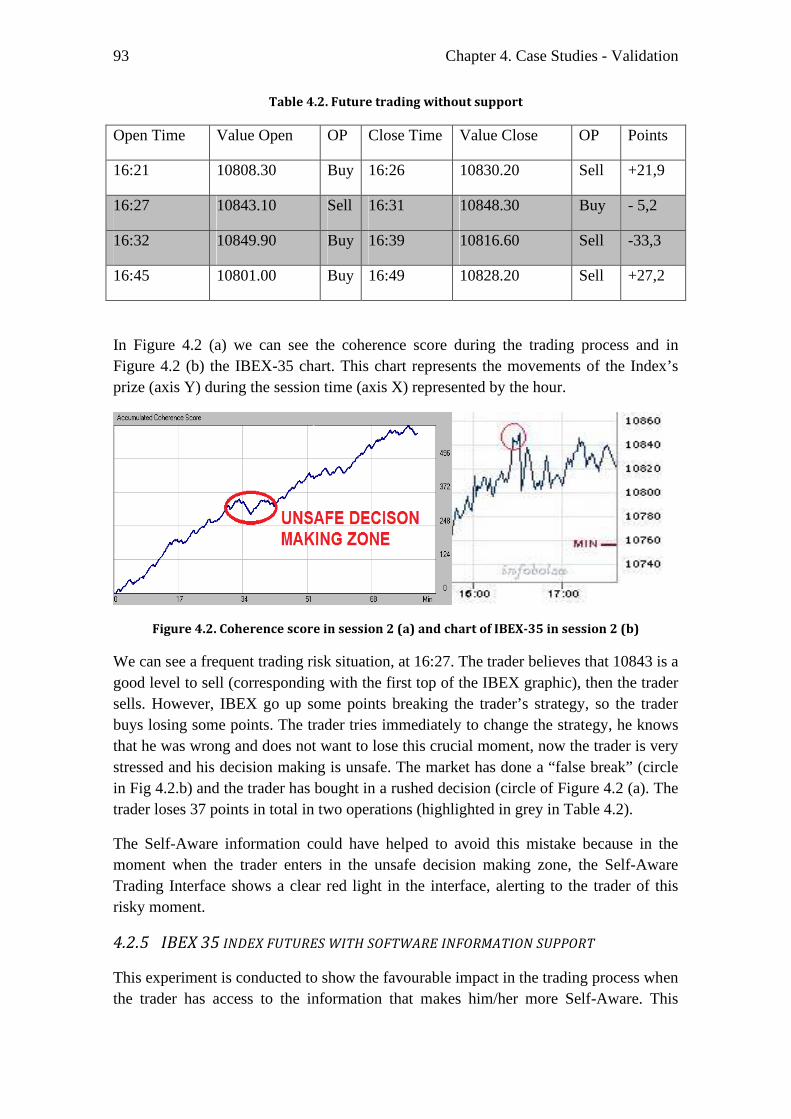
93 Chapter 4. Case Studies - Validation
Table 4.2. Future trading without support
Open Time Value Open OP Close Time Value Close OP Points
16:21 10808.30 Buy 16:26 10830.20 Sell +21,9
16:27 10843.10 Sell 16:31 10848.30 Buy - 5,2
16:32 10849.90 Buy 16:39 10816.60 Sell -33,3
16:45 10801.00 Buy 16:49 10828.20 Sell +27,2
In Figure 4.2 (a) we can see the coherence score during the trading process and in Figure 4.2 (b) the IBEX-35 chart. This chart represents the movements of the Index’s prize (axis Y) during the session time (axis X) represented by the hour.
Figure 4.2. Coherence score in session 2 (a) and chart of IBEX-35 in session 2 (b)
We can see a frequent trading risk situation, at 16:27. The trader believes that 10843 is a good level to sell (corresponding with the first top of the IBEX graphic), then the trader sells. However, IBEX go up some points breaking the trader’s strategy, so the trader buys losing some points. The trader tries immediately to change the strategy, he knows that he was wrong and does not want to lose this crucial moment, now the trader is very stressed and his decision making is unsafe. The market has done a “false break” (circle in Fig 4.2.b) and the trader has bought in a rushed decision (circle of Figure 4.2 (a). The trader loses 37 points in total in two operations (highlighted in grey in Table 4.2).
The Self-Aware information could have helped to avoid this mistake because in the moment when the trader enters in the unsafe decision making zone, the Self-Aware Trading Interface shows a clear red light in the interface, alerting to the trader of this risky moment.
4.2.5 IBEX 35 INDEX FUTURES WITH SOFTWARE INFORMATION SUPPORT
This experiment is conducted to show the favourable impact in the trading process when the trader has access to the information that makes him/her more Self-Aware. This
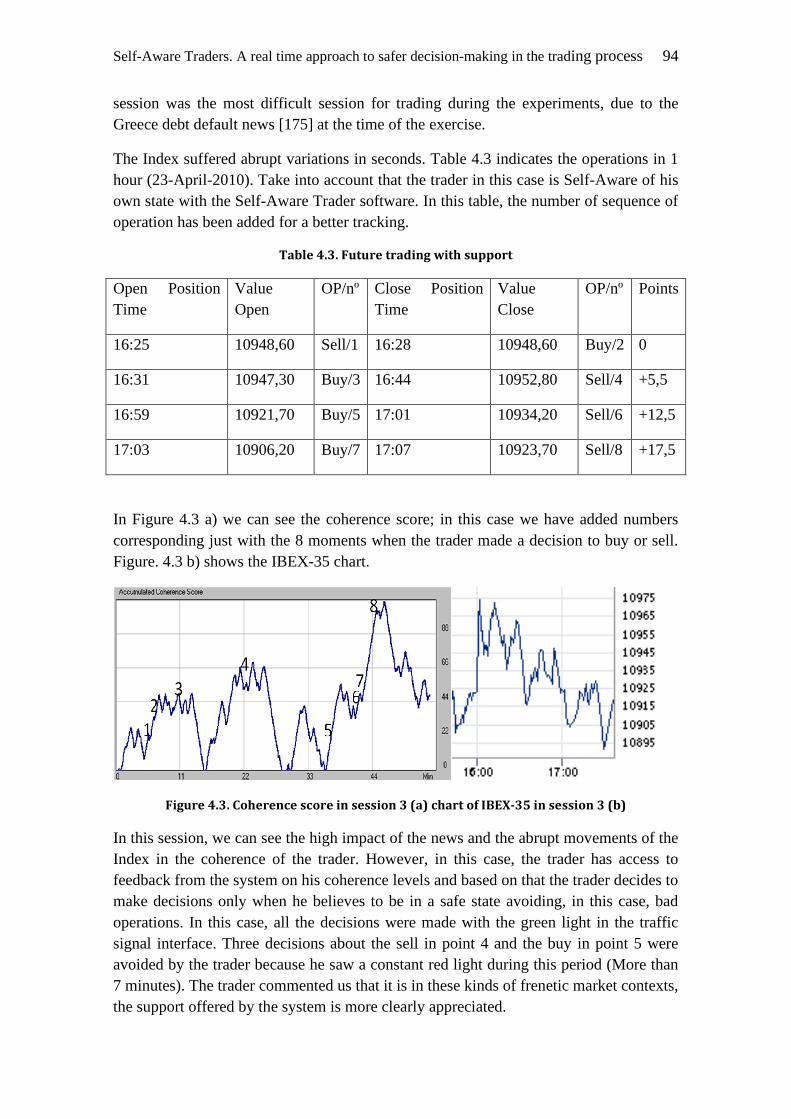
Self-Aware Traders. A real time approach to safer decision-making in the trading process 94
session was the most difficult session for trading during the experiments, due to the Greece debt default news [175] at the time of the exercise.
The Index suffered abrupt variations in seconds. Table 4.3 indicates the operations in 1 hour (23-April-2010). Take into account that the trader in this case is Self-Aware of his own state with the Self-Aware Trader software. In this table, the number of sequence of operation has been added for a better tracking.
Table 4.3. Future trading with support
Open Position Time
Value Open
OP/nº Close Position Time
Value Close
OP/nº Points
16:25 10948,60 Sell/1 16:28 10948,60 Buy/2 0
16:31 10947,30 Buy/3 16:44 10952,80 Sell/4 +5,5
16:59 10921,70 Buy/5 17:01 10934,20 Sell/6 +12,5
17:03 10906,20 Buy/7 17:07 10923,70 Sell/8 +17,5
In Figure 4.3 a) we can see the coherence score; in this case we have added numbers corresponding just with the 8 moments when the trader made a decision to buy or sell. Figure. 4.3 b) shows the IBEX-35 chart.
Figure 4.3. Coherence score in session 3 (a) chart of IBEX-35 in session 3 (b)
In this session, we can see the high impact of the news and the abrupt movements of the Index in the coherence of the trader. However, in this case, the trader has access to feedback from the system on his coherence levels and based on that the trader decides to make decisions only when he believes to be in a safe state avoiding, in this case, bad operations. In this case, all the decisions were made with the green light in the traffic signal interface. Three decisions about the sell in point 4 and the buy in point 5 were avoided by the trader because he saw a constant red light during this period (More than 7 minutes). The trader commented us that it is in these kinds of frenetic market contexts, the support offered by the system is more clearly appreciated.

95 Chapter 4. Case Studies - Validation
4.3 COMPANY TEST
On Friday December 10th 2010 we carried out tests in the company Louis Capital Markets UK in London [176]. Louis Capital Markets is a global independent agency broker-dealer providing execution, value-added sales, trading and research services on a variety of Equity, Commodity, Fixed Income and Foreign Exchange products.
Some of the traders kindly allowed us to test our system and we gathered some important data, which will be shown in this section. It is worth mentioning that the company FCC Performance [177] (New TakeTen Ltd) licensed by the HeartMath Institute supported us lending all HeartMath sensors necessary to make this test possible.
4.3.1 OBJECTIVE OF THE TEST
One primary objective described in Chapter 1 was to extend the trader’s awareness concept to a group mode and use this information as a measure of the predominant state of the market in real time (advisor’s sentiment or market feeling). This test consisted in running our system in a professional and real environment. The objective was to get feedback about the following point: Is it possible to achieve one of the primary objectives with the Self-Aware Trader system in group mode? The points to consider were the following:
• Various traders using the system in individual mode
• Various traders using the system in group mode
• Supervisor feedback about the system
The traders filled some questionnaires (See appendices A and B) on an anonymous basis after the tests in order to provide us with their personal opinion about the system. The impressions gathered will be explained in the different sections ahead. In the next subsections every test carried out will be explained in detail.
The trading operations are not described due to confidentiality reasons so the traders’ identity and details of the operations are protected but the experiment was carried out in the real market with real money and real clients and traders.
4.3.2 SCENARIO SETUP
The first premise of our tests was not to alter the work environment or disturb the traders. The market information and the usual devices required for their daily work were as normal, even respecting their usual position.
We added a laptop close to each trader with the HeartMath stress relief system (stress sensor), the Emwave Pc (V1.0) software and the Self-Aware Trader software installed in the laptop. The position of the laptops was close to their screens (usually more than two per trader) serving as an extension of the screens. In the laptop’s screen was the
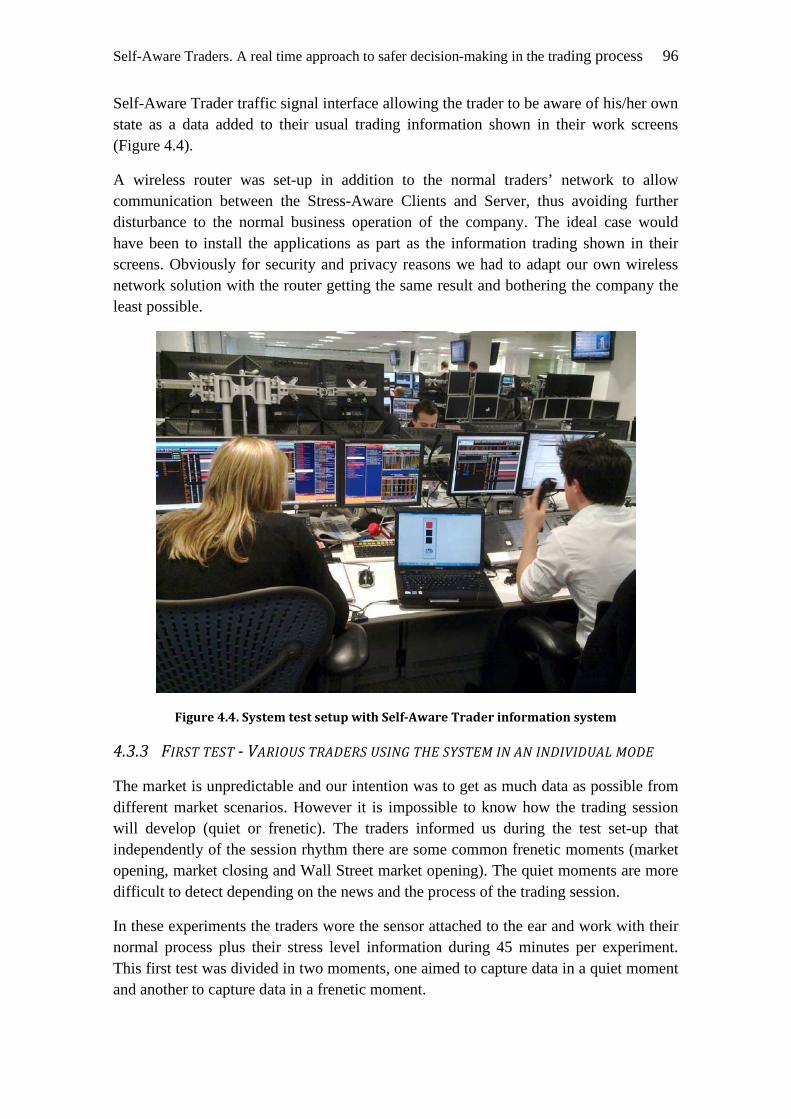
Self-Aware Traders. A real time approach to safer decision-making in the trading process 96
Self-Aware Trader traffic signal interface allowing the trader to be aware of his/her own state as a data added to their usual trading information shown in their work screens (Figure 4.4).
A wireless router was set-up in addition to the normal traders’ network to allow communication between the Stress-Aware Clients and Server, thus avoiding further disturbance to the normal business operation of the company. The ideal case would have been to install the applications as part as the information trading shown in their screens. Obviously for security and privacy reasons we had to adapt our own wireless network solution with the router getting the same result and bothering the company the least possible.
Figure 4.4. System test setup with Self-Aware Trader information system
4.3.3 FIRST TEST - VARIOUS TRADERS USING THE SYSTEM IN AN INDIVIDUAL MODE
The market is unpredictable and our intention was to get as much data as possible from different market scenarios. However it is impossible to know how the trading session will develop (quiet or frenetic). The traders informed us during the test set-up that independently of the session rhythm there are some common frenetic moments (market opening, market closing and Wall Street market opening). The quiet moments are more difficult to detect depending on the news and the process of the trading session.
In these experiments the traders wore the sensor attached to the ear and work with their normal process plus their stress level information during 45 minutes per experiment. This first test was divided in two moments, one aimed to capture data in a quiet moment and another to capture data in a frenetic moment.
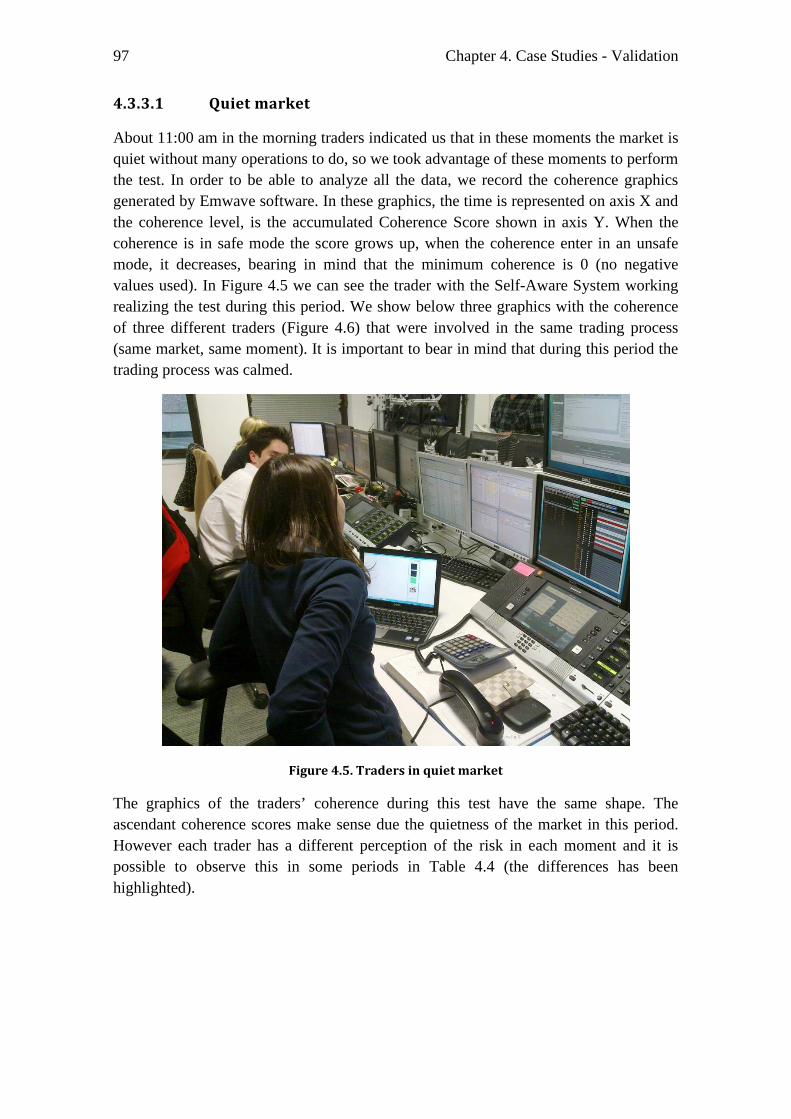
97 Chapter 4. Case Studies - Validation
4.3.3.1 Quiet market
About 11:00 am in the morning traders indicated us that in these moments the market is quiet without many operations to do, so we took advantage of these moments to perform the test. In order to be able to analyze all the data, we record the coherence graphics generated by Emwave software. In these graphics, the time is represented on axis X and the coherence level, is the accumulated Coherence Score shown in axis Y. When the coherence is in safe mode the score grows up, when the coherence enter in an unsafe mode, it decreases, bearing in mind that the minimum coherence is 0 (no negative values used). In Figure 4.5 we can see the trader with the Self-Aware System working realizing the test during this period. We show below three graphics with the coherence of three different traders (Figure 4.6) that were involved in the same trading process (same market, same moment). It is important to bear in mind that during this period the trading process was calmed.
Figure 4.5. Traders in quiet market
The graphics of the traders’ coherence during this test have the same shape. The ascendant coherence scores make sense due the quietness of the market in this period. However each trader has a different perception of the risk in each moment and it is possible to observe this in some periods in Table 4.4 (the differences has been highlighted).
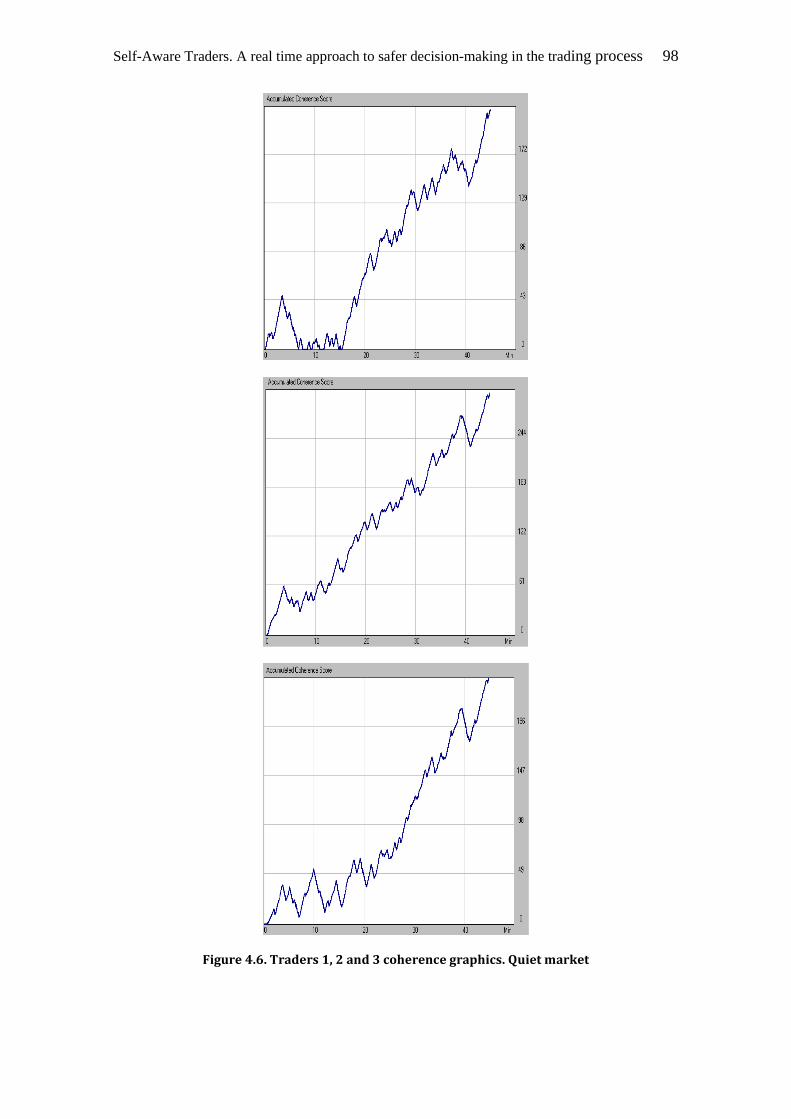
Self-Aware Traders. A real time approach to safer decision-making in the trading process 98
Figure 4.6. Traders 1, 2 and 3 coherence graphics. Quiet market
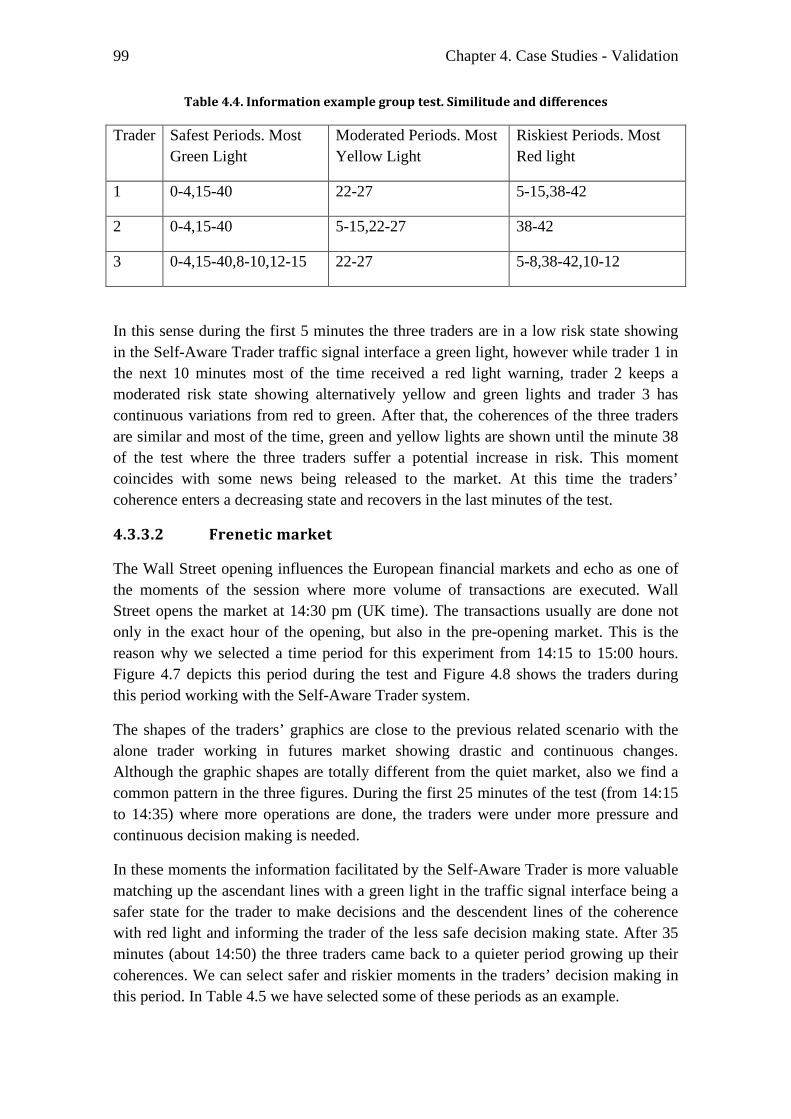
99 Chapter 4. Case Studies - Validation
Table 4.4. Information example group test. Similitude and differences
Trader Safest Periods. Most Green Light
Moderated Periods. Most Yellow Light
Riskiest Periods. Most Red light
1 0-4,15-40 22-27 5-15,38-42
2 0-4,15-40 5-15,22-27 38-42
3 0-4,15-40,8-10,12-15 22-27 5-8,38-42,10-12
In this sense during the first 5 minutes the three traders are in a low risk state showing in the Self-Aware Trader traffic signal interface a green light, however while trader 1 in the next 10 minutes most of the time received a red light warning, trader 2 keeps a moderated risk state showing alternatively yellow and green lights and trader 3 has continuous variations from red to green. After that, the coherences of the three traders are similar and most of the time, green and yellow lights are shown until the minute 38 of the test where the three traders suffer a potential increase in risk. This moment coincides with some news being released to the market. At this time the traders’ coherence enters a decreasing state and recovers in the last minutes of the test.
4.3.3.2 Frenetic market
The Wall Street opening influences the European financial markets and echo as one of the moments of the session where more volume of transactions are executed. Wall Street opens the market at 14:30 pm (UK time). The transactions usually are done not only in the exact hour of the opening, but also in the pre-opening market. This is the reason why we selected a time period for this experiment from 14:15 to 15:00 hours. Figure 4.7 depicts this period during the test and Figure 4.8 shows the traders during this period working with the Self-Aware Trader system.
The shapes of the traders’ graphics are close to the previous related scenario with the alone trader working in futures market showing drastic and continuous changes. Although the graphic shapes are totally different from the quiet market, also we find a common pattern in the three figures. During the first 25 minutes of the test (from 14:15 to 14:35) where more operations are done, the traders were under more pressure and continuous decision making is needed.
In these moments the information facilitated by the Self-Aware Trader is more valuable matching up the ascendant lines with a green light in the traffic signal interface being a safer state for the trader to make decisions and the descendent lines of the coherence with red light and informing the trader of the less safe decision making state. After 35 minutes (about 14:50) the three traders came back to a quieter period growing up their coherences. We can select safer and riskier moments in the traders’ decision making in this period. In Table 4.5 we have selected some of these periods as an example.
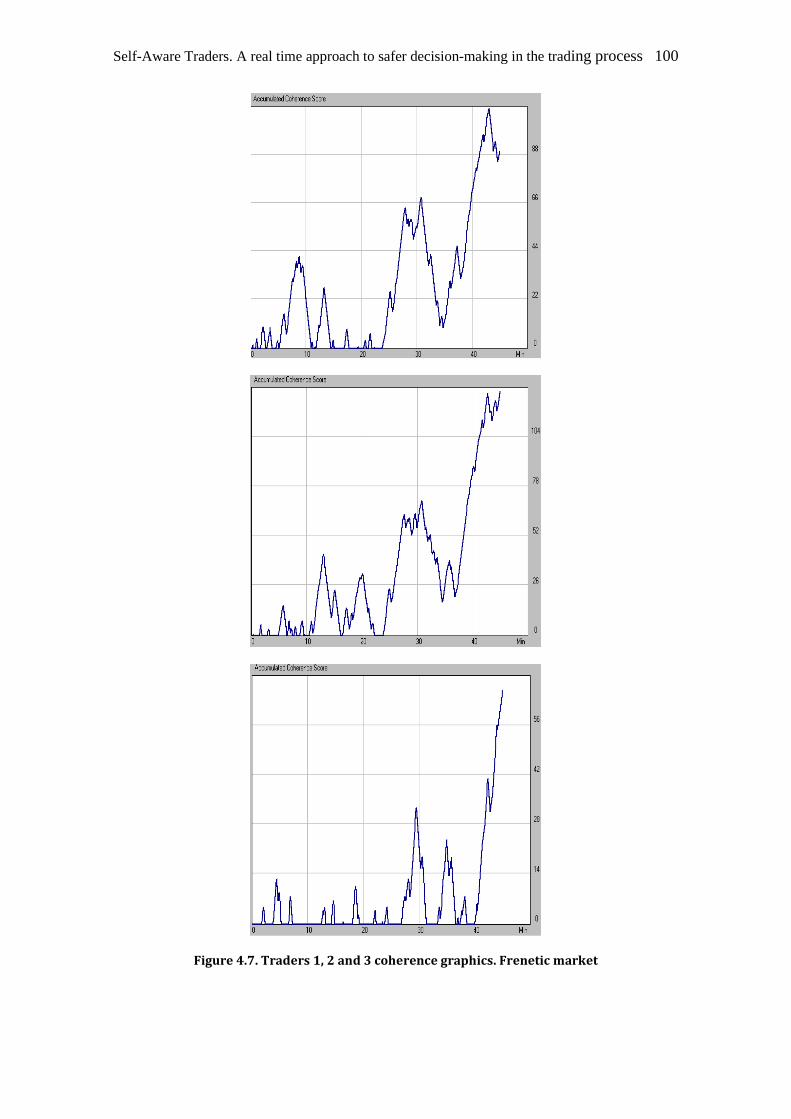
Self-Aware Traders. A real time approach to safer decision-making in the trading process 100
Figure 4.7. Traders 1, 2 and 3 coherence graphics. Frenetic market
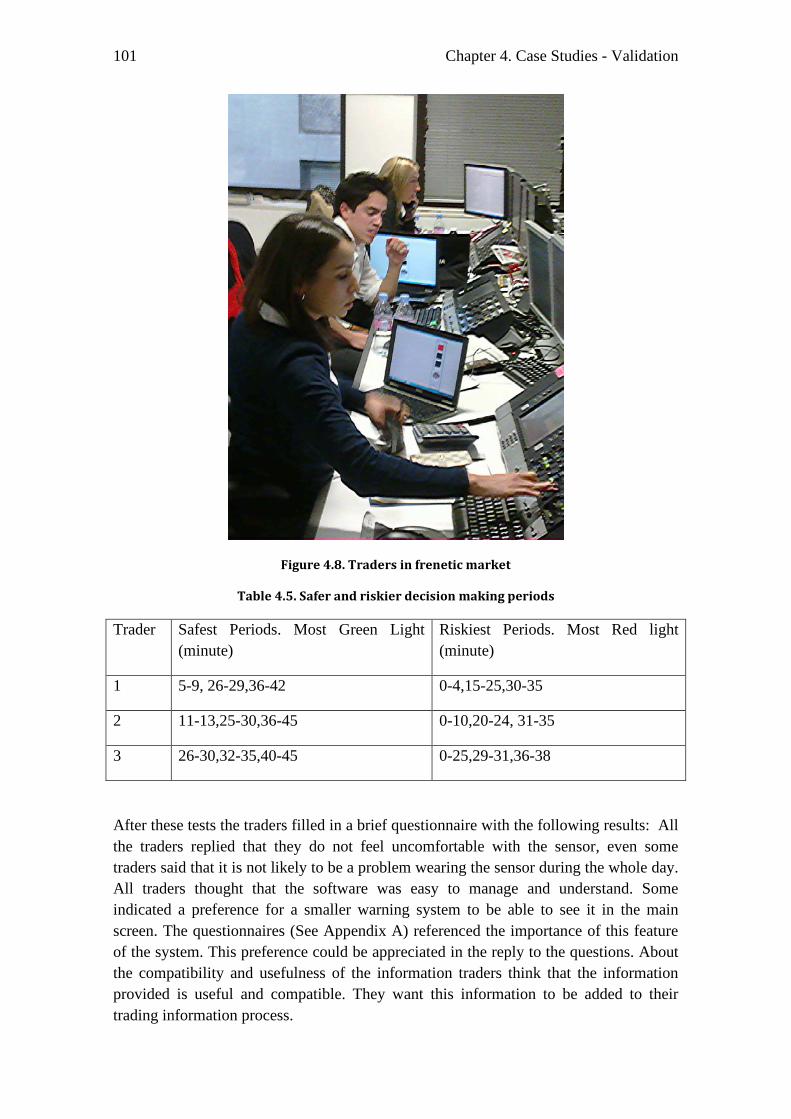
101 Chapter 4. Case Studies - Validation
Figure 4.8. Traders in frenetic market
Table 4.5. Safer and riskier decision making periods
Trader Safest Periods. Most Green Light (minute)
Riskiest Periods. Most Red light (minute)
1 5-9, 26-29,36-42 0-4,15-25,30-35
2 11-13,25-30,36-45 0-10,20-24, 31-35
3 26-30,32-35,40-45 0-25,29-31,36-38
After these tests the traders filled in a brief questionnaire with the following results: All the traders replied that they do not feel uncomfortable with the sensor, even some traders said that it is not likely to be a problem wearing the sensor during the whole day. All traders thought that the software was easy to manage and understand. Some indicated a preference for a smaller warning system to be able to see it in the main screen. The questionnaires (See Appendix A) referenced the importance of this feature of the system. This preference could be appreciated in the reply to the questions. About the compatibility and usefulness of the information traders think that the information provided is useful and compatible. They want this information to be added to their trading information process.
Self-Aware Traders. A real time approach to safer decision-making in the trading process 102
Taking into account the data gathered shown in the previous figures and tables, we can observe that the same team working in the same market at the same time have similar graphic shape due the correlation in their trading process (as it is possible to see around minute 40 in both markets). However, every person has different biometric measures producing different coherence graphics (evidenced in the first 15 minutes), and it is possible to observe how trader 3 in this test undergoes more stress than his/her partners, so the individual information is a valuable data in all sessions for the trading independently of the state of the market.
4.3.4 SECOND TEST - VARIOUS TRADERS USING THE SYSTEM IN GROUP MODE
In this case, the traders are working with the Self-Aware system in group mode, so it is possible for the traders to get the following information:
• Their own state as in individual mode shown in the traffic signal interface
• The predominant market perception of the group shown with the group picture
• The traders connected to the system with a number displayed just close to the group picture
Bearing in mind that in the previous experiment where we can see a similar shape of the coherence graphic of the team, the Self-Aware system takes advantage of this point when it is working in group mode. The information of the predominant stress of the group tells to the trader whether he/she is correlated with the current team’s stress profile or whether his/her state is different. In this case, a safe decision making could be at risk (indicating either overconfidence or undue levels of worry).
In the same way for a supervisor, when one trader is different to the rest of the traders for an unusual period of time, it is easier to detect that his/her decision making could be compromised (explained in the next test). Now the traders have two indications in the interface in real time. With the new group information the trader can continuously compare his/her own state with the predominant team’s state. In this way if his/her state remains in a continuously opposite state to the group, it could be a sign of a non-safe decision making moment for this trader.
During this test, one of the traders (Trader 2) showed a red warning for an extended period of time after a phone call (from minute 20 to minute 31) showed in Figure 4.9, which is reflected in a prolonged decline of the coherence score in the graphic. Figure 4.10 shows the graphic coherence of the traders in this test during 45 minutes.
However, in this period the rest of the traders maintain a balanced level. This is the situation where the stress aware system working in group mode shows its potential. It is able to detect and feedback to the own trader and the supervisor that the decision making of this trader could be at risk. It is possible to see this in a clearer way in the Table 4.6 where some periods of the session are highlighting the moment where trader 2 keeps a red signal during 10 minutes in opposite way to his/her partners.
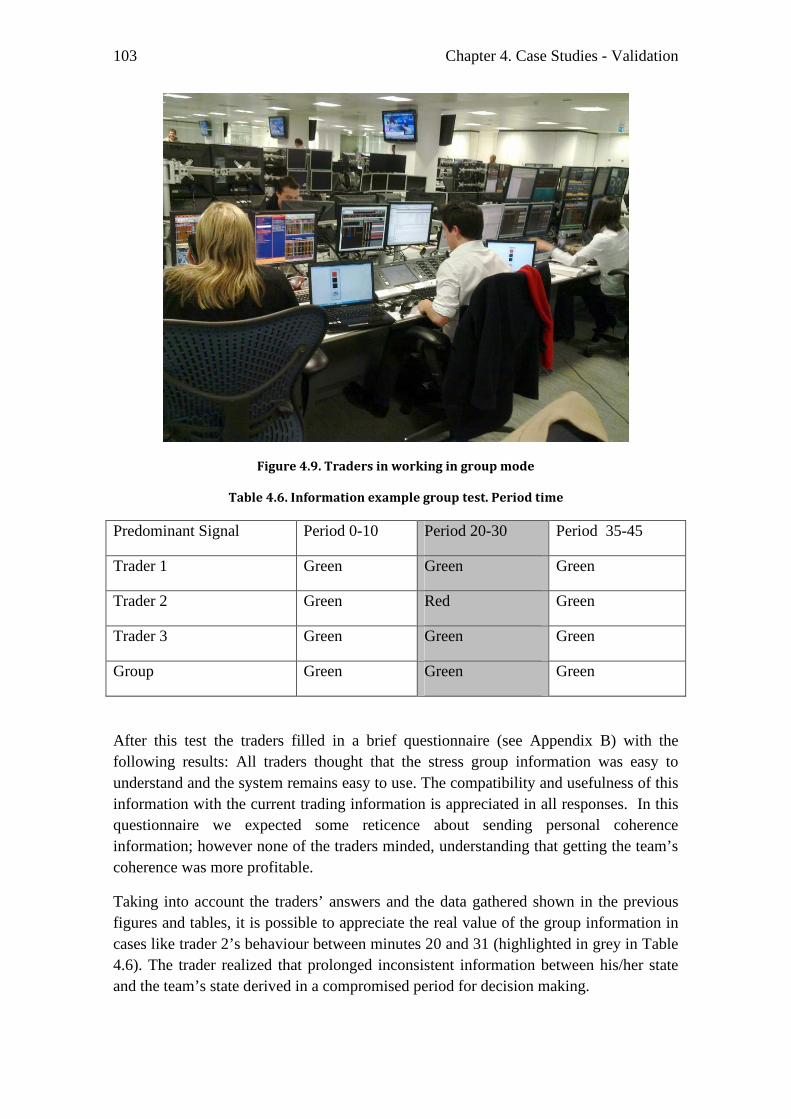
103 Chapter 4. Case Studies - Validation
Figure 4.9. Traders in working in group mode
Table 4.6. Information example group test. Period time
Predominant Signal Period 0-10 Period 20-30 Period 35-45
Trader 1 Green Green Green
Trader 2 Green Red Green
Trader 3 Green Green Green
Group Green Green Green
After this test the traders filled in a brief questionnaire (see Appendix B) with the following results: All traders thought that the stress group information was easy to understand and the system remains easy to use. The compatibility and usefulness of this information with the current trading information is appreciated in all responses. In this questionnaire we expected some reticence about sending personal coherence information; however none of the traders minded, understanding that getting the team’s coherence was more profitable.
Taking into account the traders’ answers and the data gathered shown in the previous figures and tables, it is possible to appreciate the real value of the group information in cases like trader 2’s behaviour between minutes 20 and 31 (highlighted in grey in Table 4.6). The trader realized that prolonged inconsistent information between his/her state and the team’s state derived in a compromised period for decision making.
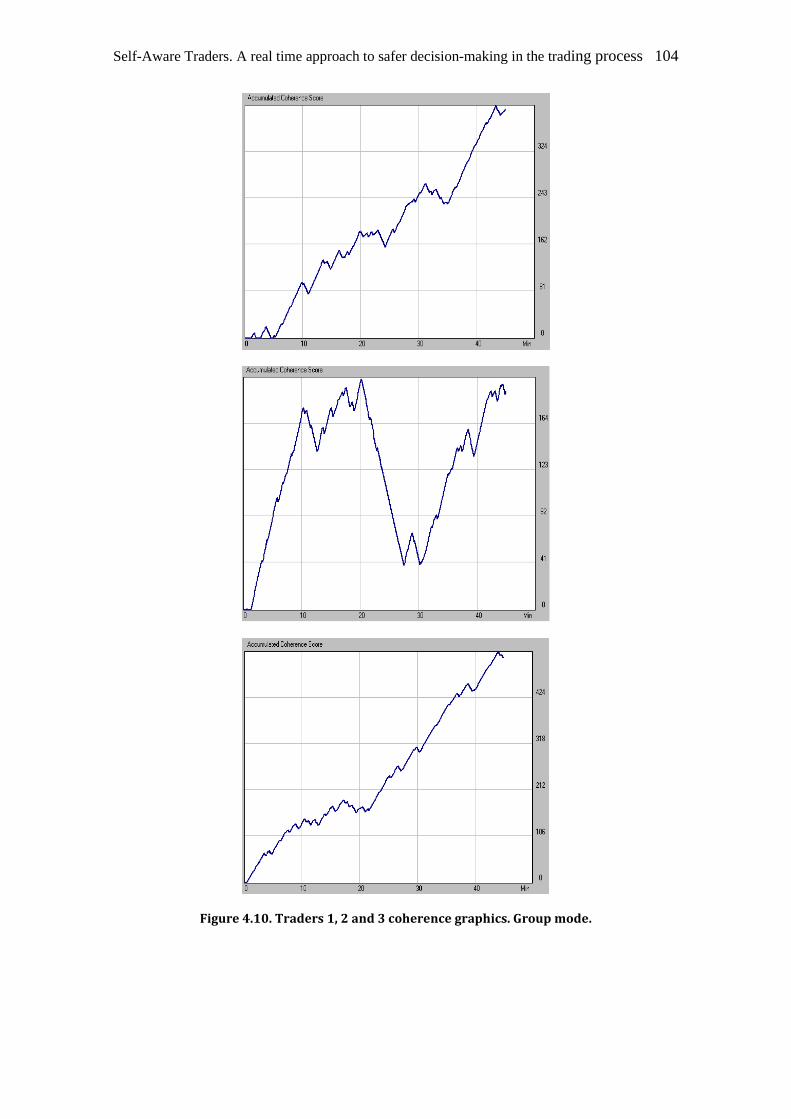
Self-Aware Traders. A real time approach to safer decision-making in the trading process 104
Figure 4.10. Traders 1, 2 and 3 coherence graphics. Group mode.
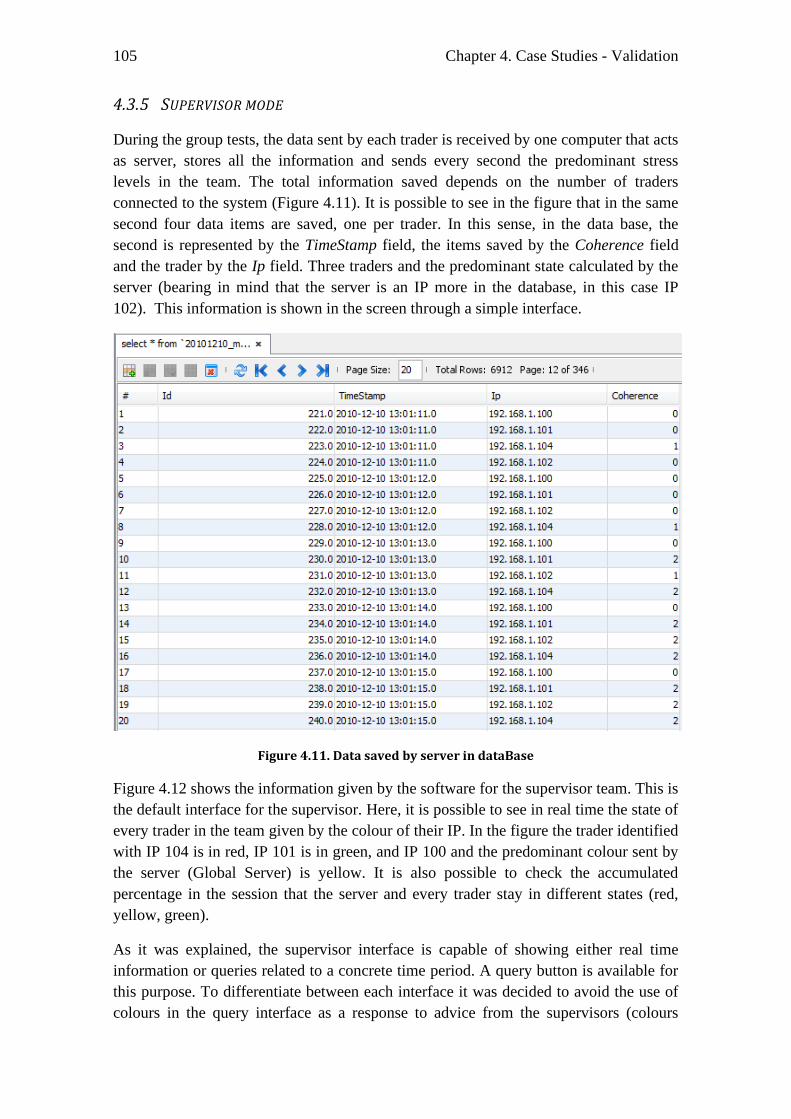
105 Chapter 4. Case Studies - Validation
4.3.5 SUPERVISOR MODE
During the group tests, the data sent by each trader is received by one computer that acts as server, stores all the information and sends every second the predominant stress levels in the team. The total information saved depends on the number of traders connected to the system (Figure 4.11). It is possible to see in the figure that in the same second four data items are saved, one per trader. In this sense, in the data base, the second is represented by the TimeStamp field, the items saved by the Coherence field and the trader by the Ip field. Three traders and the predominant state calculated by the server (bearing in mind that the server is an IP more in the database, in this case IP 102). This information is shown in the screen through a simple interface.
Figure 4.11. Data saved by server in dataBase
Figure 4.12 shows the information given by the software for the supervisor team. This is the default interface for the supervisor. Here, it is possible to see in real time the state of every trader in the team given by the colour of their IP. In the figure the trader identified with IP 104 is in red, IP 101 is in green, and IP 100 and the predominant colour sent by the server (Global Server) is yellow. It is also possible to check the accumulated percentage in the session that the server and every trader stay in different states (red, yellow, green).
As it was explained, the supervisor interface is capable of showing either real time information or queries related to a concrete time period. A query button is available for this purpose. To differentiate between each interface it was decided to avoid the use of colours in the query interface as a response to advice from the supervisors (colours
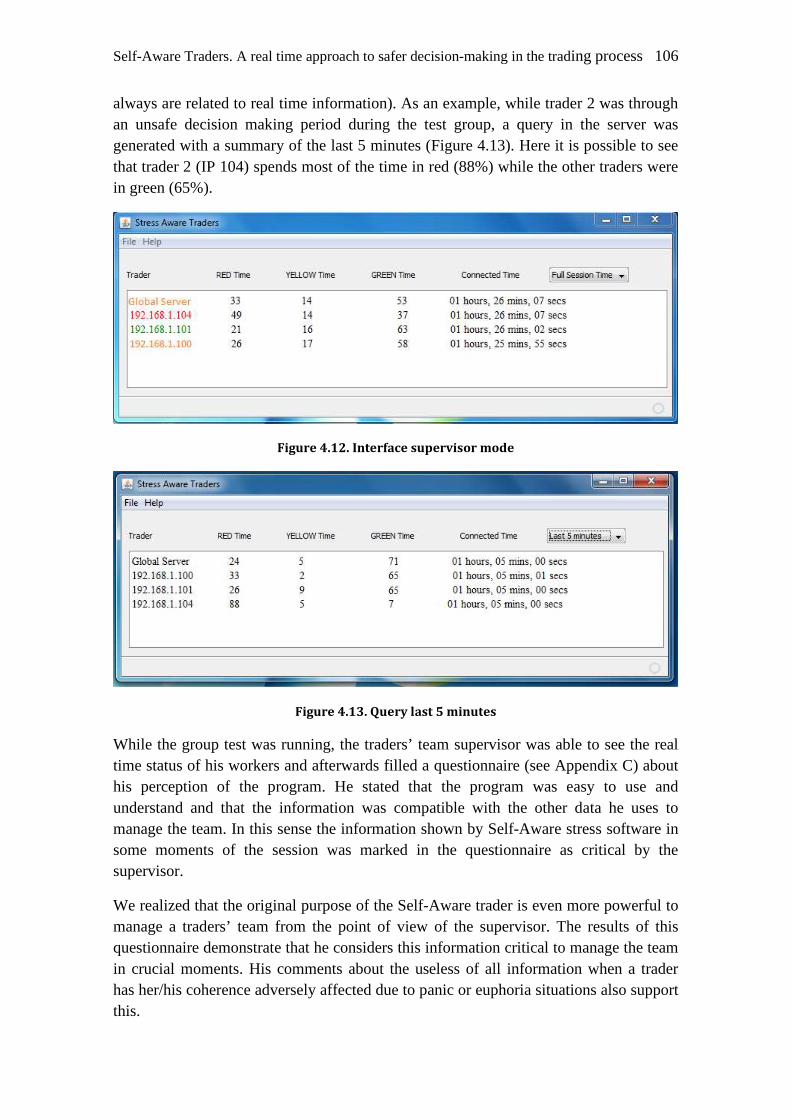
Self-Aware Traders. A real time approach to safer decision-making in the trading process 106
always are related to real time information). As an example, while trader 2 was through an unsafe decision making period during the test group, a query in the server was generated with a summary of the last 5 minutes (Figure 4.13). Here it is possible to see that trader 2 (IP 104) spends most of the time in red (88%) while the other traders were in green (65%).
Figure 4.12. Interface supervisor mode
Figure 4.13. Query last 5 minutes
While the group test was running, the traders’ team supervisor was able to see the real time status of his workers and afterwards filled a questionnaire (see Appendix C) about his perception of the program. He stated that the program was easy to use and understand and that the information was compatible with the other data he uses to manage the team. In this sense the information shown by Self-Aware stress software in some moments of the session was marked in the questionnaire as critical by the supervisor.
We realized that the original purpose of the Self-Aware trader is even more powerful to manage a traders’ team from the point of view of the supervisor. The results of this questionnaire demonstrate that he considers this information critical to manage the team in crucial moments. His comments about the useless of all information when a trader has her/his coherence adversely affected due to panic or euphoria situations also support this.
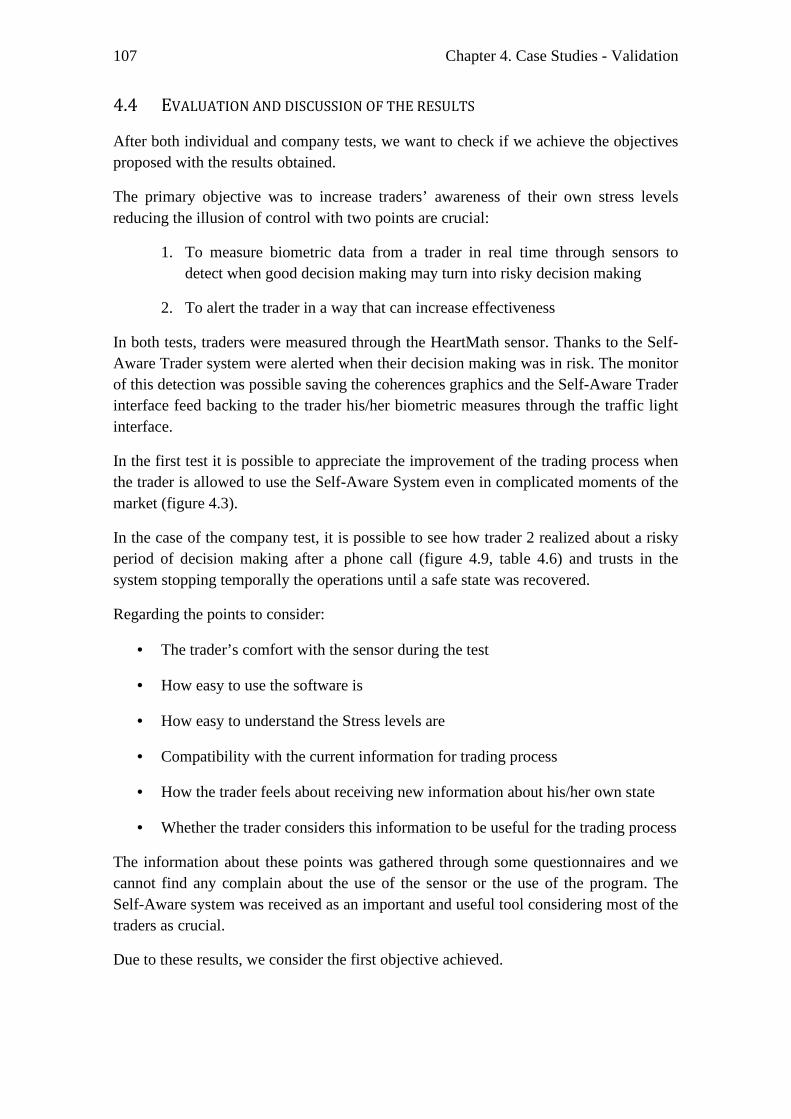
107 Chapter 4. Case Studies - Validation
4.4 EVALUATION AND DISCUSSION OF THE RESULTS
After both individual and company tests, we want to check if we achieve the objectives proposed with the results obtained.
The primary objective was to increase traders’ awareness of their own stress levels reducing the illusion of control with two points are crucial:
1. To measure biometric data from a trader in real time through sensors to detect when good decision making may turn into risky decision making
2. To alert the trader in a way that can increase effectiveness
In both tests, traders were measured through the HeartMath sensor. Thanks to the Self-Aware Trader system were alerted when their decision making was in risk. The monitor of this detection was possible saving the coherences graphics and the Self-Aware Trader interface feed backing to the trader his/her biometric measures through the traffic light interface.
In the first test it is possible to appreciate the improvement of the trading process when the trader is allowed to use the Self-Aware System even in complicated moments of the market (figure 4.3).
In the case of the company test, it is possible to see how trader 2 realized about a risky period of decision making after a phone call (figure 4.9, table 4.6) and trusts in the system stopping temporally the operations until a safe state was recovered.
Regarding the points to consider:
• The trader’s comfort with the sensor during the test
• How easy to use the software is
• How easy to understand the Stress levels are
• Compatibility with the current information for trading process
• How the trader feels about receiving new information about his/her own state
• Whether the trader considers this information to be useful for the trading process
The information about these points was gathered through some questionnaires and we cannot find any complain about the use of the sensor or the use of the program. The Self-Aware system was received as an important and useful tool considering most of the traders as crucial.
Due to these results, we consider the first objective achieved.
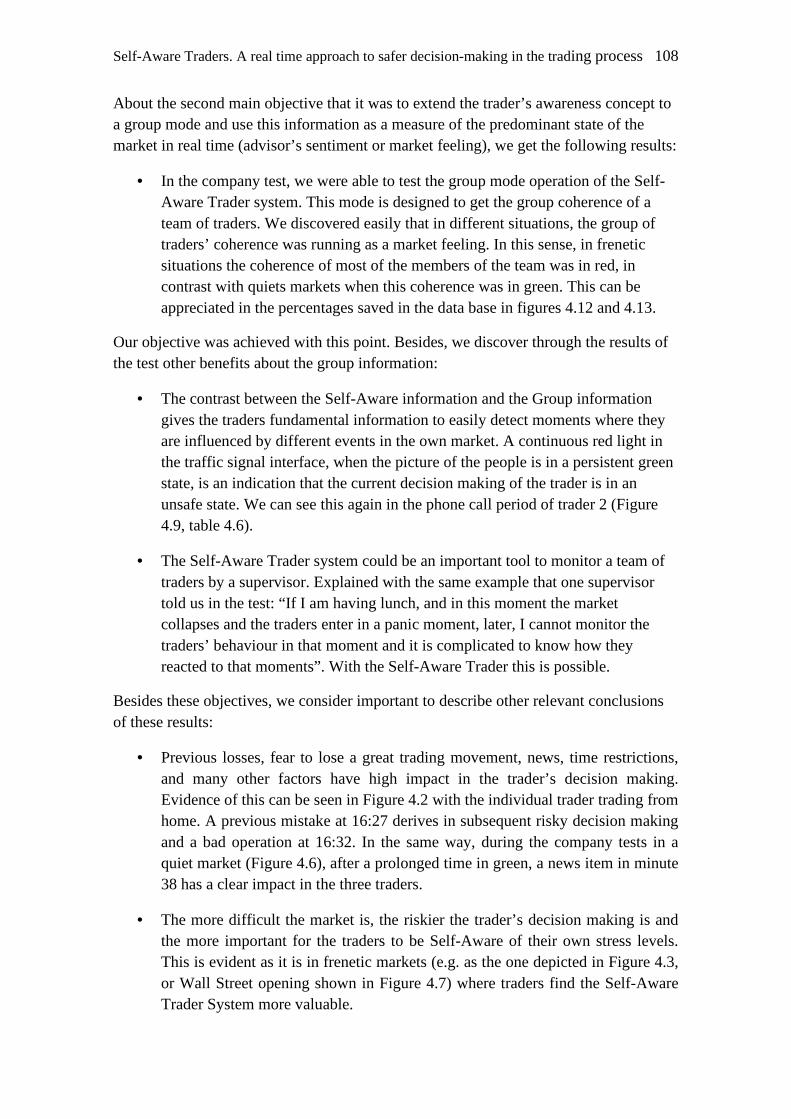
Self-Aware Traders. A real time approach to safer decision-making in the trading process 108
About the second main objective that it was to extend the trader’s awareness concept to a group mode and use this information as a measure of the predominant state of the market in real time (advisor’s sentiment or market feeling), we get the following results:
• In the company test, we were able to test the group mode operation of the Self-Aware Trader system. This mode is designed to get the group coherence of a team of traders. We discovered easily that in different situations, the group of traders’ coherence was running as a market feeling. In this sense, in frenetic situations the coherence of most of the members of the team was in red, in contrast with quiets markets when this coherence was in green. This can be appreciated in the percentages saved in the data base in figures 4.12 and 4.13.
Our objective was achieved with this point. Besides, we discover through the results of the test other benefits about the group information:
• The contrast between the Self-Aware information and the Group information gives the traders fundamental information to easily detect moments where they are influenced by different events in the own market. A continuous red light in the traffic signal interface, when the picture of the people is in a persistent green state, is an indication that the current decision making of the trader is in an unsafe state. We can see this again in the phone call period of trader 2 (Figure 4.9, table 4.6).
• The Self-Aware Trader system could be an important tool to monitor a team of traders by a supervisor. Explained with the same example that one supervisor told us in the test: “If I am having lunch, and in this moment the market collapses and the traders enter in a panic moment, later, I cannot monitor the traders’ behaviour in that moment and it is complicated to know how they reacted to that moments”. With the Self-Aware Trader this is possible.
Besides these objectives, we consider important to describe other relevant conclusions of these results:
• Previous losses, fear to lose a great trading movement, news, time restrictions, and many other factors have high impact in the trader’s decision making. Evidence of this can be seen in Figure 4.2 with the individual trader trading from home. A previous mistake at 16:27 derives in subsequent risky decision making and a bad operation at 16:32. In the same way, during the company tests in a quiet market (Figure 4.6), after a prolonged time in green, a news item in minute 38 has a clear impact in the three traders.
• The more difficult the market is, the riskier the trader’s decision making is and the more important for the traders to be Self-Aware of their own stress levels. This is evident as it is in frenetic markets (e.g. as the one depicted in Figure 4.3, or Wall Street opening shown in Figure 4.7) where traders find the Self-Aware Trader System more valuable.
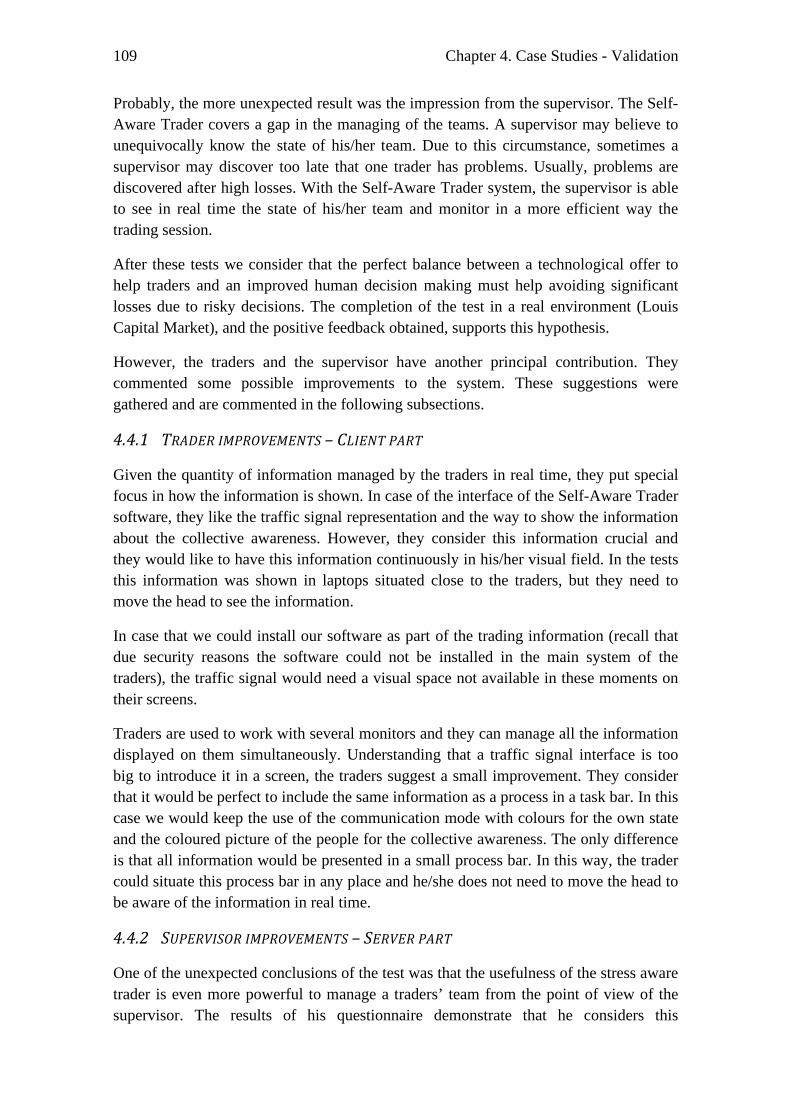
109 Chapter 4. Case Studies - Validation
Probably, the more unexpected result was the impression from the supervisor. The Self-Aware Trader covers a gap in the managing of the teams. A supervisor may believe to unequivocally know the state of his/her team. Due to this circumstance, sometimes a supervisor may discover too late that one trader has problems. Usually, problems are discovered after high losses. With the Self-Aware Trader system, the supervisor is able to see in real time the state of his/her team and monitor in a more efficient way the trading session.
After these tests we consider that the perfect balance between a technological offer to help traders and an improved human decision making must help avoiding significant losses due to risky decisions. The completion of the test in a real environment (Louis Capital Market), and the positive feedback obtained, supports this hypothesis.
However, the traders and the supervisor have another principal contribution. They commented some possible improvements to the system. These suggestions were gathered and are commented in the following subsections.
4.4.1 TRADER IMPROVEMENTS – CLIENT PART
Given the quantity of information managed by the traders in real time, they put special focus in how the information is shown. In case of the interface of the Self-Aware Trader software, they like the traffic signal representation and the way to show the information about the collective awareness. However, they consider this information crucial and they would like to have this information continuously in his/her visual field. In the tests this information was shown in laptops situated close to the traders, but they need to move the head to see the information.
In case that we could install our software as part of the trading information (recall that due security reasons the software could not be installed in the main system of the traders), the traffic signal would need a visual space not available in these moments on their screens.
Traders are used to work with several monitors and they can manage all the information displayed on them simultaneously. Understanding that a traffic signal interface is too big to introduce it in a screen, the traders suggest a small improvement. They consider that it would be perfect to include the same information as a process in a task bar. In this case we would keep the use of the communication mode with colours for the own state and the coloured picture of the people for the collective awareness. The only difference is that all information would be presented in a small process bar. In this way, the trader could situate this process bar in any place and he/she does not need to move the head to be aware of the information in real time.
4.4.2 SUPERVISOR IMPROVEMENTS – SERVER PART
One of the unexpected conclusions of the test was that the usefulness of the stress aware trader is even more powerful to manage a traders’ team from the point of view of the supervisor. The results of his questionnaire demonstrate that he considers this
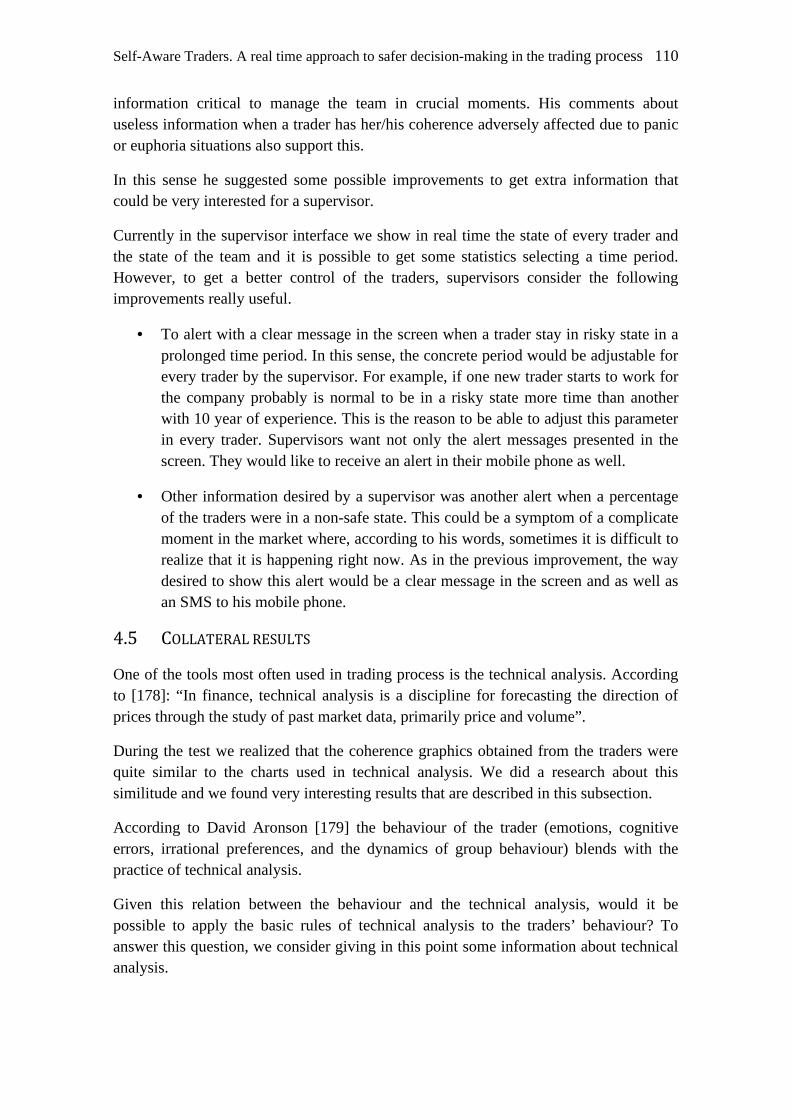
Self-Aware Traders. A real time approach to safer decision-making in the trading process 110
information critical to manage the team in crucial moments. His comments about useless information when a trader has her/his coherence adversely affected due to panic or euphoria situations also support this.
In this sense he suggested some possible improvements to get extra information that could be very interested for a supervisor.
Currently in the supervisor interface we show in real time the state of every trader and the state of the team and it is possible to get some statistics selecting a time period. However, to get a better control of the traders, supervisors consider the following improvements really useful.
• To alert with a clear message in the screen when a trader stay in risky state in a prolonged time period. In this sense, the concrete period would be adjustable for every trader by the supervisor. For example, if one new trader starts to work for the company probably is normal to be in a risky state more time than another with 10 year of experience. This is the reason to be able to adjust this parameter in every trader. Supervisors want not only the alert messages presented in the screen. They would like to receive an alert in their mobile phone as well.
• Other information desired by a supervisor was another alert when a percentage of the traders were in a non-safe state. This could be a symptom of a complicate moment in the market where, according to his words, sometimes it is difficult to realize that it is happening right now. As in the previous improvement, the way desired to show this alert would be a clear message in the screen and as well as an SMS to his mobile phone.
4.5 COLLATERAL RESULTS
One of the tools most often used in trading process is the technical analysis. According to [178]: “In finance, technical analysis is a discipline for forecasting the direction of prices through the study of past market data, primarily price and volume”.
During the test we realized that the coherence graphics obtained from the traders were quite similar to the charts used in technical analysis. We did a research about this similitude and we found very interesting results that are described in this subsection.
According to David Aronson [179] the behaviour of the trader (emotions, cognitive errors, irrational preferences, and the dynamics of group behaviour) blends with the practice of technical analysis.
Given this relation between the behaviour and the technical analysis, would it be possible to apply the basic rules of technical analysis to the traders’ behaviour? To answer this question, we consider giving in this point some information about technical analysis.
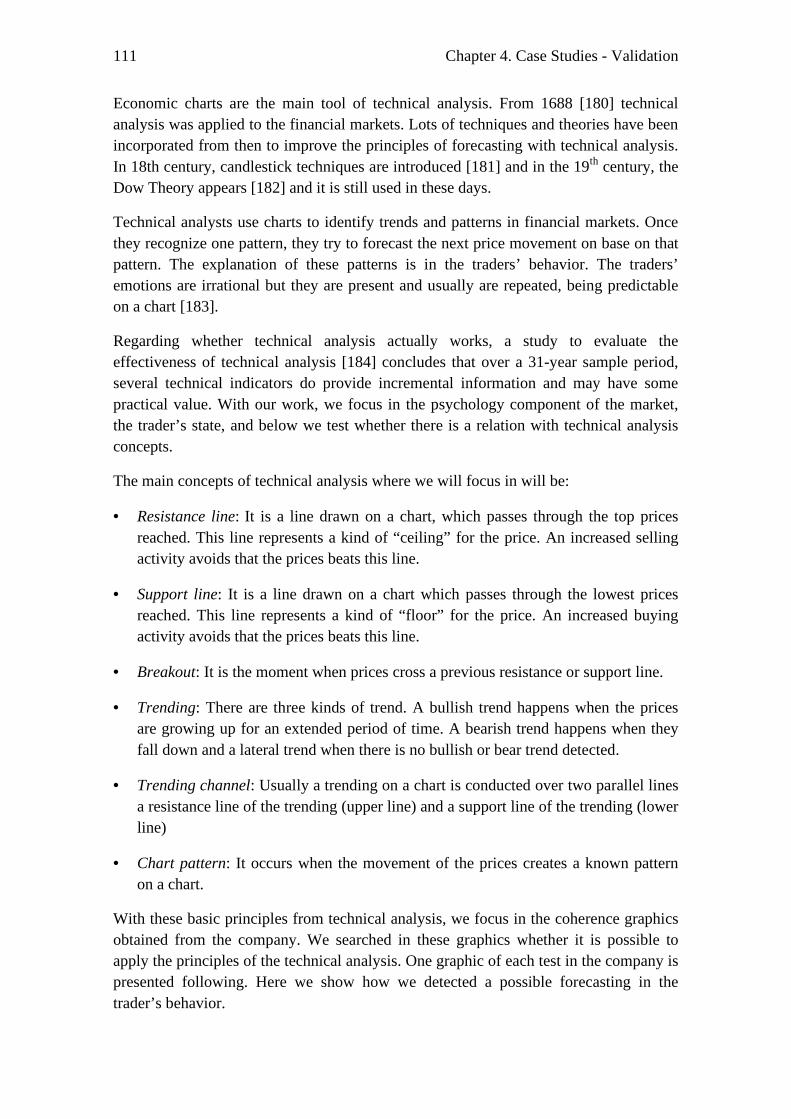
111 Chapter 4. Case Studies - Validation
Economic charts are the main tool of technical analysis. From 1688 [180] technical analysis was applied to the financial markets. Lots of techniques and theories have been incorporated from then to improve the principles of forecasting with technical analysis. In 18th century, candlestick techniques are introduced [181] and in the 19th century, the Dow Theory appears [182] and it is still used in these days.
Technical analysts use charts to identify trends and patterns in financial markets. Once they recognize one pattern, they try to forecast the next price movement on base on that pattern. The explanation of these patterns is in the traders’ behavior. The traders’ emotions are irrational but they are present and usually are repeated, being predictable on a chart [183].
Regarding whether technical analysis actually works, a study to evaluate the effectiveness of technical analysis [184] concludes that over a 31-year sample period, several technical indicators do provide incremental information and may have some practical value. With our work, we focus in the psychology component of the market, the trader’s state, and below we test whether there is a relation with technical analysis concepts.
The main concepts of technical analysis where we will focus in will be:
• Resistance line: It is a line drawn on a chart, which passes through the top prices reached. This line represents a kind of “ceiling” for the price. An increased selling activity avoids that the prices beats this line.
• Support line: It is a line drawn on a chart which passes through the lowest prices reached. This line represents a kind of “floor” for the price. An increased buying activity avoids that the prices beats this line.
• Breakout: It is the moment when prices cross a previous resistance or support line.
• Trending: There are three kinds of trend. A bullish trend happens when the prices are growing up for an extended period of time. A bearish trend happens when they fall down and a lateral trend when there is no bullish or bear trend detected.
• Trending channel: Usually a trending on a chart is conducted over two parallel lines a resistance line of the trending (upper line) and a support line of the trending (lower line)
• Chart pattern: It occurs when the movement of the prices creates a known pattern on a chart.
With these basic principles from technical analysis, we focus in the coherence graphics obtained from the company. We searched in these graphics whether it is possible to apply the principles of the technical analysis. One graphic of each test in the company is presented following. Here we show how we detected a possible forecasting in the trader’s behavior.
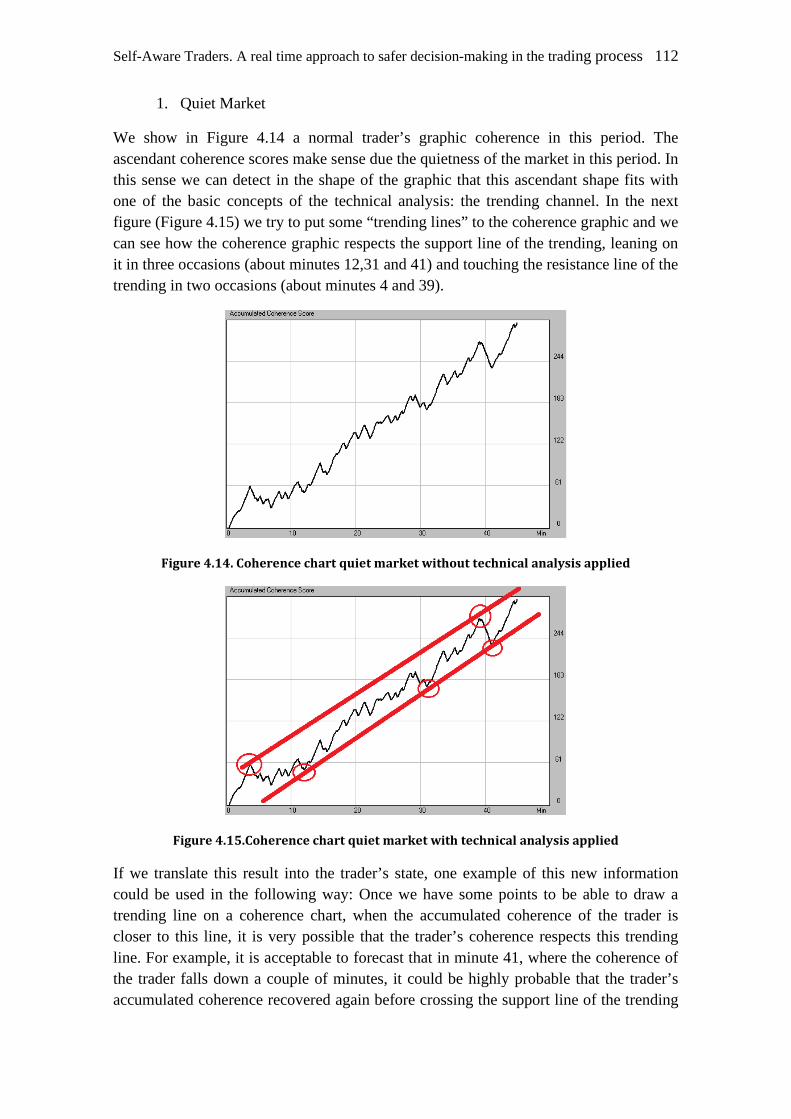
Self-Aware Traders. A real time approach to safer decision-making in the trading process 112
1. Quiet Market
We show in Figure 4.14 a normal trader’s graphic coherence in this period. The ascendant coherence scores make sense due the quietness of the market in this period. In this sense we can detect in the shape of the graphic that this ascendant shape fits with one of the basic concepts of the technical analysis: the trending channel. In the next figure (Figure 4.15) we try to put some “trending lines” to the coherence graphic and we can see how the coherence graphic respects the support line of the trending, leaning on it in three occasions (about minutes 12,31 and 41) and touching the resistance line of the trending in two occasions (about minutes 4 and 39).
Figure 4.14. Coherence chart quiet market without technical analysis applied
Figure 4.15.Coherence chart quiet market with technical analysis applied
If we translate this result into the trader’s state, one example of this new information could be used in the following way: Once we have some points to be able to draw a trending line on a coherence chart, when the accumulated coherence of the trader is closer to this line, it is very possible that the trader’s coherence respects this trending line. For example, it is acceptable to forecast that in minute 41, where the coherence of the trader falls down a couple of minutes, it could be highly probable that the trader’s accumulated coherence recovered again before crossing the support line of the trending
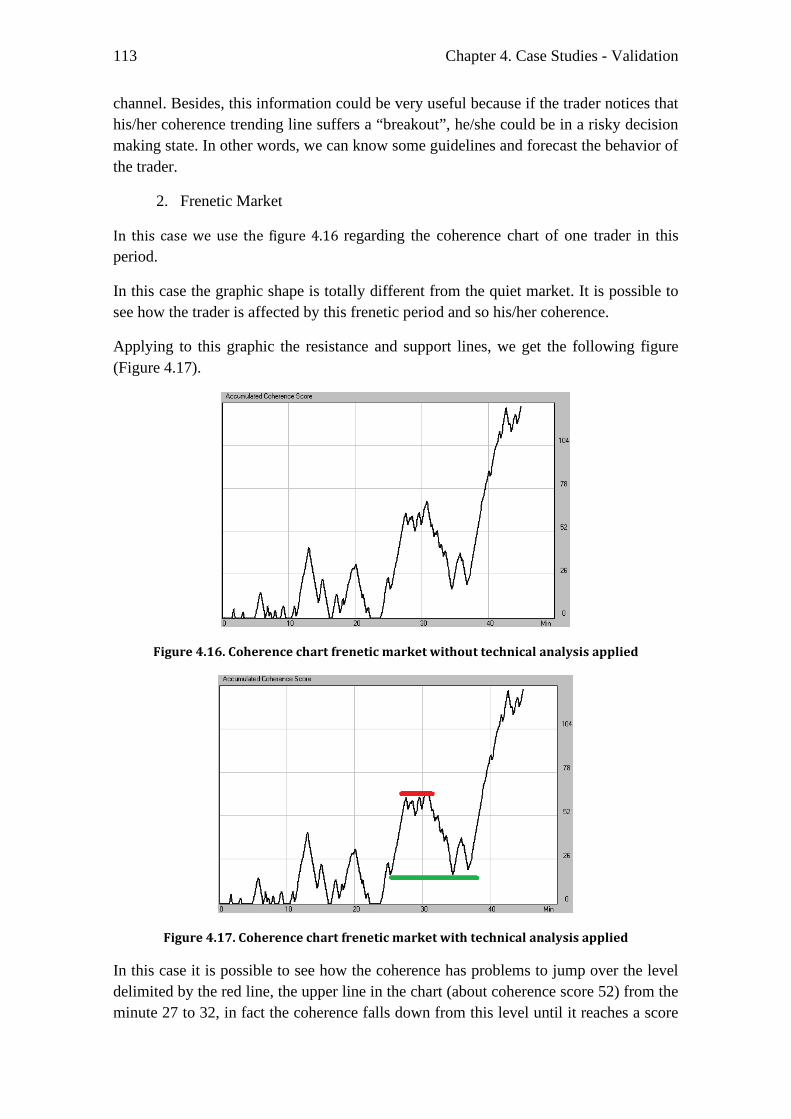
113 Chapter 4. Case Studies - Validation
channel. Besides, this information could be very useful because if the trader notices that his/her coherence trending line suffers a “breakout”, he/she could be in a risky decision making state. In other words, we can know some guidelines and forecast the behavior of the trader.
2. Frenetic Market
In this case we use the figure 4.16 regarding the coherence chart of one trader in this period.
In this case the graphic shape is totally different from the quiet market. It is possible to see how the trader is affected by this frenetic period and so his/her coherence.
Applying to this graphic the resistance and support lines, we get the following figure (Figure 4.17).
Figure 4.16. Coherence chart frenetic market without technical analysis applied
Figure 4.17. Coherence chart frenetic market with technical analysis applied
In this case it is possible to see how the coherence has problems to jump over the level delimited by the red line, the upper line in the chart (about coherence score 52) from the minute 27 to 32, in fact the coherence falls down from this level until it reaches a score
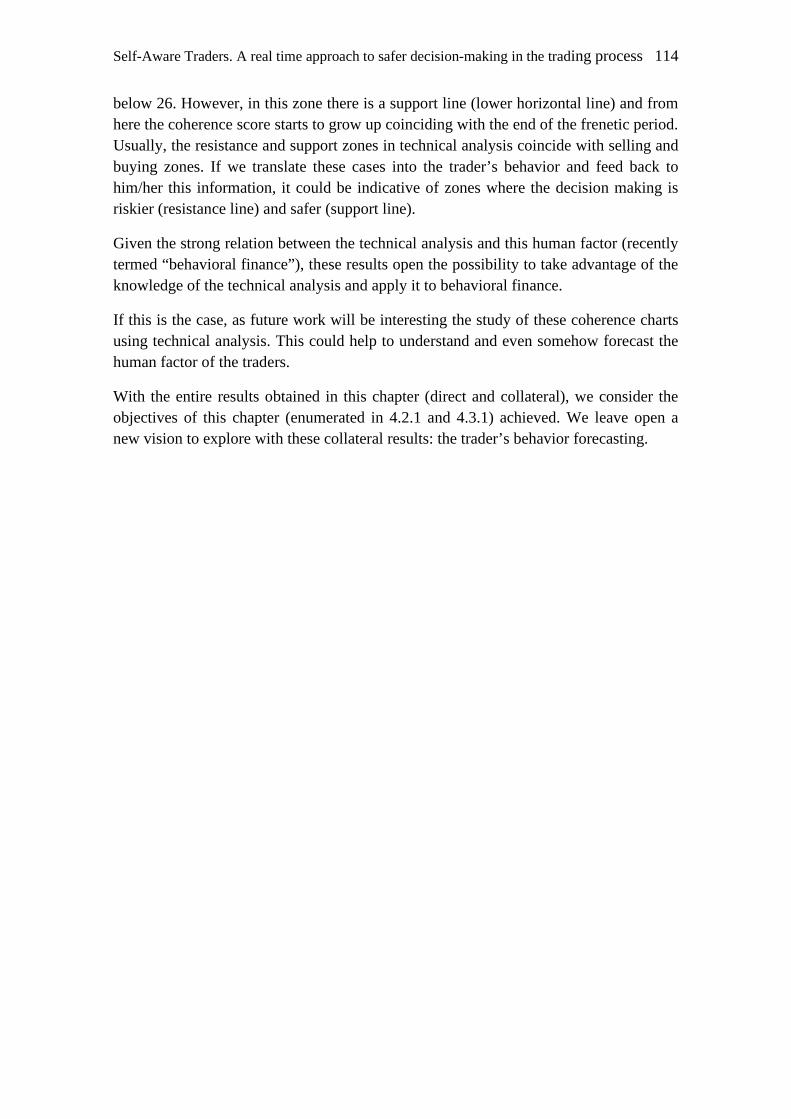
Self-Aware Traders. A real time approach to safer decision-making in the trading process 114
below 26. However, in this zone there is a support line (lower horizontal line) and from here the coherence score starts to grow up coinciding with the end of the frenetic period. Usually, the resistance and support zones in technical analysis coincide with selling and buying zones. If we translate these cases into the trader’s behavior and feed back to him/her this information, it could be indicative of zones where the decision making is riskier (resistance line) and safer (support line).
Given the strong relation between the technical analysis and this human factor (recently termed “behavioral finance”), these results open the possibility to take advantage of the knowledge of the technical analysis and apply it to behavioral finance.
If this is the case, as future work will be interesting the study of these coherence charts using technical analysis. This could help to understand and even somehow forecast the human factor of the traders.
With the entire results obtained in this chapter (direct and collateral), we consider the objectives of this chapter (enumerated in 4.2.1 and 4.3.1) achieved. We leave open a new vision to explore with these collateral results: the trader’s behavior forecasting.
Chapter 5
5. CONCLUSIONS AND FUTURE WORK Este capítulo concluye esta tesis doctoral. En primer lugar, se resumen a grandes rasgos las ideas planteadas en la misma. Posteriormente se exponen las principales contribuciones realizadas. Finalmente, se proponen cuestiones de posible estudio futuro que pueden ser desarrolladas a partir del presente trabajo This chapter finishes this work. Firstly, the main ideas of this work are presented in a general way. After that, the main contributions realized are described. Finally, future work is proposed to be developed based on this work.
5.1 GENERAL CONCLUSIONS
This work focused on supporting with new technologies the vulnerability of the human decision making in critical situations where stress is high. In Chapter 1, we established some basic objectives to support with sensors the traders’ decision making during the trading session. In the whole work, these proposed objectives were kept in mind and in the next subsection will be analyzed in detail.
During the study of the influence of stress in the decision making process made in Chapter 2, it is possible to see how stress degrades the quality of this process. However, in stressful situations, good decision making could be crucial. The cost of a bad decision depends on the application field; from economical as in the trading process to human lives in critical situations as crisis management in natural disasters.
Is it possible to avoid bad decision making? Obviously the human factor introduces a mistake probability in the decision making process; however, it is possible to reduce this probability. Some psychological studies show that the main problem is that in these crucial situations, where our decision making process is degraded, we do not realize it. Well-known effects as illusion of control avoid realizing that our decision making is risky. Usually we realize the risk after a wrong decision is made. However, technological support offers help. If we can add the self-information about our own status, we can make a decision in a safer way.
Stress not only has an effect in our decision making, also it has an effect in our human body, reflected in physiological changes (hearth rate, breath rating, skin conductance, etc.) We take advantage of these changes and monitor these variables with a suitable sensor support. It is possible to feed back this information to the person to let him/her be aware in real time about how his/her own state to make decisions is.
A software system has been developed in order to cover the current gap of self-aware information. This system integrates the use of sensors to measure the biometric

116 Chapter 5. Conclusions and future work
variables affected with the stress. It was developed in a general and modular way to be able to be used in any application field where the stress management is relevant.
This work presents and applies a global architecture using sensor support in stressful situations. The idea was born due to the vacuum of information detected in the decision making in the trading process.
In Chapter 3, in the financial market field, we developed a concrete architecture and software to manage the stress in trading context. The system developed allows two kinds of operative: the individual mode focused in traders working alone (usually from home) and the group mode focused in the traders working in cooperative mode (usually from financial companies).
Different tests are presented in Chapter 4 for individual and collective situations. Given the high confidentiality carried out in trading companies, we really appreciated the Louis Capital Markets London company support to allow us to test our system. In all the described tests, it is possible to see the stress influence in the traders and how a self-aware trader can cope in a better way with complicated situations and have a safer decision making.
A lot of systems are developed to replace the human factor with artificial intelligence techniques in any field, avoiding irrational decision making. We consider that a total replacement of the human factor is not the optimal way. For example we can see the current problems in trading context with the high frequency systems (the flash crash on 6 May 2010 was attributed to the use of these systems). With this work, we do not try to replace the human factor, we try to enforce it by supporting it with suited technology.
In the trading process, the life cycle of the automatic systems is extremely short due the continuous evolution of traders’ behaviour working with these systems. This behaviour evolution changes the patterns of these automatic systems and they become useless. Furthermore, effects as illusion of control do not permit to take full advantage of these systems because in stressful moments (panic, euphoria, fear, anxiety) decisions are made in an irrational way. A Self-Aware trader improves himself/herself in real time allowing taking full advantage of the systems used avoiding risky decision making and being fully compatible with any advance in technology.
5.2 SUMMARY OF CONTRIBUTIONS
This work presents the following contributions:
• Sensor biometric principles to characterize the state of the user. Priorization of these principles for the trading context and classification of the current commercial sensor market based on these principles.
• Sensor system design guidelines for trading context.
Self-Aware Traders. A real time approach to safer decision-making in the trading process 117
• Self-Aware trader system that feedbacks the user’s stress level according to the design guidelines
• Backend server system that aggregates individual stress information and gives an approximation to the advisor’s sentiment value in real time (market feeling)
• Trading supervisor interface providing features to monitor and control his team.
5.3 PHD BRIEF
This work merges knowledge on stress effects and sensor technology in order to establish a system to feed back the stress level information in real time to persons in a general scheme and to traders in a concrete scheme applied in the financial markets. The objectives achieved are enumerated below:
1. State of the art study and related works.
The existing studies about stress and sensor technology are focused in their specific disciplines. This work applies these studies to the trading process and provides a detailed review in the context of trading. Additionally, a detailed discussion is provided in Chapter 2 about some guidelines to consider on the design of the sensors in trading process as well as a comparison (Table 2.7 and Table 2.8) between the products that we can currently find on the market (Tables 2.2-2.6).
The review of some important current research projects where sensor technology is used independently from the target of the project is also shown within Chapter 2. Here, it is possible to see the great development existing and the fast dissemination of this technology in our daily lives: sport, health care, work.
Furthermore, we have complementary works to this PhD dealing some aspects in more detail. In [151] the focus of our work was to highlight the difference between Stress-Aware and standard traders in order to establish how sensor technology can in fact assist them. Once we saw the big difference between a Stress-Aware Trader and a standard trader, our next step [152] focused in confirming whether it is possible with current sensing technology to design a preliminary model to help traders. Finally, in [153], we realized that current automatic trading mechanisms miss the psychology approach, necessary in our opinion to design an effective system.
2. Identifying basic biometric principles in sensor technology for the trading process.
Usually biometric sensor principles [99] are focused in identification purposes. In this work, we change slightly the focus and we propose in subsection 2.3.2.1 basic principles focused in the state of the trader. These principles are used to compare the existing available sensors in the market and give us the clue of what we need to assess a successful integration of the sensor support in the trading process.
118 Chapter 5. Conclusions and future work
3. Identifying issues in the trading process where sensor technology can be decisive.
While [75] and [86] show the relation between the emotions of the traders and the movement of the financial market with sensor technology, this work identifies the potentially crucial role of sensor technology in the trading process. Sensor technology could be used to enable traders to become aware of their stress levels when making decisions, thus covering this current information gap. In this way, sensor technology becomes an active element in the trading process.
4. Guidelines for designers.
Another contribution is the identification of some common needs that are desirable for the successful integration of sensor technology in the trading process. It does so by explicitly highlighting some papers ([147], [148], [149], [150]) in Chapter 2 about the importance of how sensors should show the relevant data to traders and in this context, the parameters that should be adapted (manually or automatically) to the trader’s profile preference (stress time window). The purpose of the discussion about Table 2.7 in this work is to consider some characteristics to obtain the most suitable sensing infrastructure for the trading progress giving some recommended guidelines for designers in Table 2.8.
5. Self-Aware system model deployment.
In this work, the Self-Aware system model has been deployed. It is used to feed back to the person the stress level information to allow a safer decision making. This system is the result of the deployment of a general model described in Chapter 3 called Self-Aware system.
6. Specific context trading architecture deployment.
This objective was achieved with the development of the Self-Aware trading architecture and software described in Chapter 3. The Self-Aware trader system keeps the Self-Aware system model premises, focusing the context in trading in financial markets. The effectiveness of the concrete model deployment has been tested in a real environment with real traders.
7. To increase traders’ awareness of their own stress levels reducing the illusion of control.
To achieve this objective, two points are crucial:
• To measure biometric data from a trader in real time through sensors to detect when good decision making may turn into risky decision making. After a complete study of the sensors available, the HeartMarth’s sensor with Emwave software was chosen and used to gather the biometric data necessary and was used as an input of our system.
Self-Aware Traders. A real time approach to safer decision-making in the trading process 119
• To alert the trader in a way that can increase effectiveness: Not only technical aspects were considered to design the system. Psychological aspects based on research studies were took in account to develop an interface suitable for the trading process.
The achievement of this objective was commented in detail in the results section of Chapter 4.
8. To extend the trader’s awareness concept to a group mode and use this information as a measure of the predominant state of the market in real time (advisor’s sentiment or market feeling)
To cover the most usual cases in trading process, we included two modes of operation in the system (explained in Chapter 3).
• An individual mode. The trader’s stress level is fed back through a traffic signal interface (red: high stress, yellow: moderate stress and green no stress detected). The trader can select the period of time to calculate the stress (stress time window).
• Group mode: When the trader is connected in group mode, the application joins a multicast group created by one server where all traders within the group send the current coherence level every second. With all the data received from the traders, the server calculates the predominant coherence among all traders in the group and sends this value and the number of traders connected to all the traders connected in the multicast network. Furthermore the server saves every data received from every client. This is in order to have the necessary information to provide different statistics (useful for example for one supervisor) of each trader and have a historical data logging of every session. In this way we get an immediate measure of the collective stress level that traders operating are experiencing.
The achievement of this objective was commented in detail in the results section of Chapter 4.
9. Get feedback from traders in real environment.
The objectives of the tests presented in Chapter 4 are to run the Self-Aware Trader system in a real environment and to get feedback about the following points:
• The trader’s comfort with the sensor during the test
• How easy to use the software is
• How easy to understand the Stress levels are
• Compatibility with the current information for trading process
120 Chapter 5. Conclusions and future work
• How the trader feels about receiving new information about his/her own state
• How the trader feels about receiving new information about the collective state
• Whether the trader considers this information to be useful for the trading process
After these tests, we consider that the perfect balance between a technological offer to help traders and an improved human decision making must help avoiding significant losses due to risky decisions. The completion of the test in a real environment (Louis Capital Market), and the positive feedback obtained, supports this hypothesis.
5.4 FUTURE WORK LINES
This work proved the viability to merge the psychological concepts and the technological concepts in a system to allow a safer decision making in the context of trading processes. Based on these results and on the comments provided by the traders themselves, it is hoped that it will inspire other researchers to take up the challenge to investigate some of the issues raised in this work as combinations from different disciplines such as trading (economy), stress (medical) and sensors (technological).
These other research lines could include the improvement of the model proposed in this work as well as algorithms used integrating the System-Aware Trader system as part of a complex trading platform. Another possibility could be to incorporate the group mode of work as part of a subscription mode for home trading.
5.4.1 INTERCONNECTION WITH A INTELLIGENT TRADING PLATFORM
The current implementation is designed to support a trader without interfering with the other technical support that the trader uses.
Once we have developed the Self-Aware Trader system and checked how traders feel comfortable using the system, the next step could be a total integration in the current trading platform.
This integration could be a good trigger for other technical decision support used by traders. For example for automatic systems (such as expert systems) that are capable of making decisions under determinate circumstances. The trigger of this systems could be when the trader lost a minimum level of coherence fixed by himself/herself in the case of home trading or even fixed by a supervisor in the case of company.
The core of the architecture could run as an OSGi 4 framework [185] since OSGi is service oriented architecture. According to this architecture, the system could be organized in the following modules (bundles under OSGi architecture):
• Self-Aware Trader Module: Represents this work. It is responsible for detecting the right moment to trigger the expert system. The process is continuously running and collecting data from the sensors. It will activate the expert system
Self-Aware Traders. A real time approach to safer decision-making in the trading process 121
module when the user enters into panic mode and may even block the current operation (depending on configuration preferences).
• Sensors Module: Represents the module that gathers the trader’s biometric information through the sensors.
• My Profile Module: This module is responsible for measuring the risk profile of the user depending on his age and experience in financial markets since the biometric responses are also conditioned by these rules. It could be an automatic learning system helping to set up critical levels for the Self-Aware Trader module.
• Stock Information Module: This module connects to the Internet and it will provide stock information in real time. An example of this module would be Infobolsa PowerStation [186] belonging to Infobolsa.
• Storage Module: Various databases are needed to store stock information that will be used later by the expert system for making automatic decisions.
• Update Databases Module: This module will be activated at the end of each session. It stores tracking data of the stock data documents information relevant for the proper function of the expert system.
• Expert System Module: This module comes into operation when the alert module activates it and it is responsible for the operation.
• External Interfaces Module: This module contains the necessary interfaces to be able to communicate with proprietary traders solutions.
A possible regular way of operation could fit to the following:
The user uploads his profile (age, experience, type of market in that will operate, etc.) and connects to the sensors. The Self-Aware trader module monitors and feeds back to the trader his/her own state, checking that critical levels are not reached. In case a threshold is passed and the user enters in a non safe mode (panic mode), the expert system is triggered and calculates the more suitable operation in this moment, sending the proposal to the user, who must approve the operation.
5.4.2 EXTENSION TO SUBSCRIPTION MODE FOR HOME TRADING
The Self-Aware system currently works with two operation modes (individual and group). In case of home trading, the group mode is inactive and the trader works in individual mode. Usually, the real time information in these cases is realized via a subscription to a service. For example, it is not the same one service where the user can see the national index than one service where the user can manage information from two indexes. Obviously, the quote subscription for the second service is more expensive.
122 Chapter 5. Conclusions and future work
In this sense, given that different information is currently presented to the users, if we include the collective awareness as a service, it is possible to be able to manage the users subscribed to this service as the network of traders described in this work.
This extension should have a strong security control in all the communications, because in the current model, this security control is under the network of the company of the traders. Also users should allow sending his/her state in an anonymous way.
Although apparently the delay of the communications could be a problem, usually the trading information platforms work under dedicated lines and satellite communications, so this problem is already solved and only a small effort is requested for bidirectional communication (the client would need to send his/her own state).
In the case of the service provider company, one server would need to process all the data of the users with this service active. As a first approximation it would be necessary to make a discrimination process, at least, according to the market where the user is operating. It makes no sense that two users operating in different markets (for example shares of IBEX-35 and commodities as gold) send the coherence levels to each other.
As an advantage, this service would have a high impact on the current trading system where is not possible to provide real time measurement of the collective stress in the market.
5.5 APPLYING THE SELF- AWARE MODEL IN OTHER STRESSFUL AREAS
In Chapter 3 we presented a general Self-Aware model and this model was applied in the trading context. Every context has some particularities. It is necessary to bear them in mind to develop the concrete system. For example, the selection of the sensor or the interface are processes linked to the concrete context where the model is applied.
If we want to transfer the general model into another application area, it is necessary to take into account not only the technical details but to bear in mind the physiological details. For example, a rescue team needs different technical capabilities, like for example feedback in radio mode as in Morse code, but also very different sensors and models to measure stress. In order to remain compatible, it is recommended to follow the global architecture proposed in this work.
The trading context model could be adapted to other fields of research by designing (equivalence) relationships suited for model transfer and thus extending this model to similar application areas requiring real time response.
REFERENCES [1] H. Selye, “A Syndrome Produced by Diverse Nocuous Agents,” in Nature, vol.
138, p. 32, Jul. 1936. [2] H. Selye, “Stress and disease,” in Science, vol. 122, p. 625-631, Oct. 1955. [3] J.E. McGrath, “Stress and behavior in organizations,” in Handbook of industrial
and organizational psychology, M.D. Dunnette, Ed. Chicago: Rand McNally, 1976, pp. 1351–1395.
[4] D. I. Tepas and J. M. Price, “What is stress and what is fatigue?,” in Stress, workload, and fatigue, P.A. Hancock and P.A. Desmond, Eds. Mahwah, NJ: L. Erlbaum, 2001, pp. 607-622.
[5] T. Granaham, (2007, Dec.). Drugs and Today’s Wall Street, Dealbook, [Online]. Available: http://dealbook.blogs.nytimes.com/2007/12/21/drugs-and-todays-wall-street/
[6] K. M. Kowalski, T. Scharf and C. Vaught, “Judgment and decision making under stress: an overview for emergency manager,” in International J. Emergency Management, vol. 1, No.3, 2003, pp. 278- 289.
[7] M. Adya and G. Phillips-Wren, “Risky Decisions and Decision Support - Does Stress Make a Difference?,” in Proc. JAIS Theory Development workshop, Vol. 9, 2009, Art. 55.
[8] C. A Brown, I. Holland and R. Mesch, “TRADER: an expert system for trading commodities futures,” in Proc. Artificial Intelligence on Wall Street, 1991, pp. 92-96.
[9] J. R. Wolberg, Expert Trading Systems: Modeling Financial Markets with Kernel Regression, 1st ed., New York: John Wiley and Sons 2000, pp. 45-49.
[10] K. K. Ang and C. Quek, “Stock Trading Using RSPOP: A Novel Rough Set-Based Neuro-Fuzzy Approach,” in IEEE Trans. on Neural Networks, vol. 17, no. 5, 2006, pp. 1301-1315.
[11] C. Zhang, "Developing Actionable Trading Strategies for Trading Agents," in IEEE/WIC/ACM International Joint Conferences on Web Intelligence and Intelligent Agent Technologies, vol.2, 2009, pp.9.
[12] M. R. Delgado, and A. J. Porcelli, “Acute Stress Modulates Risk Taking in Financial Decision Making,” in Psychological Science, vol. 20, no.3, 2009, pp.278-83.
[13] E. Fama, "Efficient Capital Markets: A Review of Theory and Empirical Work," The Journal of Finance, vol. 25 (2), 1970, pp. 383-417.
[14] U.S. Securities and Exchange Commission and the Commodity Futures Trading Commission, "Findings Regarding the Market Events of May 6, 2010", September 30, 2010, [Online]. Available: http://www.sec.gov/news/studies/2010/marketevents-report.pdf
[15] T. Connolly, H. R. Arkes and K. R. Hammond, Judgment and decision making, 2nd ed., New York: Cambridge University Press, 2000, p. 53.
[16] J. A. Deutsch and D. Deutsch. “Attention: Some theoretical considerations,” in Psychological Review, vol. 70, 1963, pp. 80–90.
[17] S. Deutsch and R. Pew, “Modelling human error in a real-world teamwork environment,” in Proc. 24th Annual Meeting of the Cognitive Science Society, 2002, pp.274–279.
[18] K, Leiden, K. R. Laughery, J. Keller, J. French, W. Warwick, and S. D. Wood. (Sept. 2001). A review of human performance models for the prediction of human error. NASA system-wide accident prevention program. [Online].
124 Chapter 5. Conclusions and future work
Available: http://humansystems.arc.nasa.gov/groups/HCSL/publications/HumanErrorModels.pdf
[19] R. W. J. Neufeld, “Dynamic differentials of stress and coping,” in Psychological Review, vol. 106, 1999, pp. 385–397.
[20] I. Janis and L. Mann, Decision making, New York: Free press, 1977, p. 132. [21] I. Janis, P. Defares and P. Grossman, “Hyper vigilant reactions to threat,” in
Selye’s guide to stress research, H. Selye Ed. New York: Van Nostrand Reinhold, 1983, vol. 3, pp. 1-42.
[22] G. Keinan, “Decision making under stress: Scanning of alternatives under controllable and uncontrollable threats,” in J. Personality and Social Psychology, vol. 52, 1987, pp. 639–644.
[23] R. Vecchio, “Theoretical and empirical examination of cognitive resource theory,” in J. Applied Psychology, vol.75 (2), 1980, pp. 141-147.
[24] M. R. P. Dougherty and J. Hunter, “Probability judgment and subadditivity: The role of working memory capacity and constraining retrieval,” in Memory & Cognition, vol. 31(6), 2003, pp. 968–982.
[25] G. Gigerenzer and R. Selten, Bounded rationality: The adaptive toolbox. Cambridge, MA: MIT Press, 2001, pp. 37-50.
[26] H. P. Young, “Adaptive Heuristics," in The New Palgrave Dictionary of Economics, 2nd ed., S.N. Durlauf and L.E. Blume Eds. London: Macmillan, 2008, pp 1-6.
[27] G. Gigerenzer, P.M. Todd and the ABC Research Group, Simple Heuristics that make us smart. New York: Oxford University Press, 1999, p.46.
[28] A. Broder, “Assessing the empirical validity of the Take-the-Best heuristic as a model of human probabilistic inference,” in J. Experimental Psychology: Learning, Memory, and Cognition, vol. 26, 2000, pp. 1332-1346.
[29] A. Broder, “Decision making with the adaptive toolbox: Influence of environmental structure, intelligence, and working memory load,” in J. Experimental Psychology: Learning, Memory, and Cognition, vol. 29(4), 2003, pp. 611–625.
[30] N. Ahituv, M. Igbaria, and A. Sella. “The effects of time pressure and completeness of information on decision making,” in J. Management Information System, vol. 15 (2), 1998, pp. 153-172.
[31] L. Mann and C. Tan, “The hassled decision maker: The effects of perceived time pressure on information processing in decision making,” in Australian J. Management, vol. 18(2), 1993, pp. 197-209.
[32] O. Svenson, A. Edland and G. Karlsson, “The effect of numerical and verbal information and time stress on judgments of the attractiveness of decision alternatives,” in Proc. of the IFIP WG 8.3 working Conference, 1985, pp. 133-144.
[33] E. E Entin and D. Serfaty. “Information gathering and decision making under stress,” NTIS HCA05/MF A01. Tech. Rep. TR-454, 1990.
[34] J. Baradell and K. Klein, “Relationship of life stress and body consciousness to hypervigilant decision making,” in J. Personality and Social Psychology, vol. 64(2), 1993, pp. 267- 273.
[35] V. Arnold, S.C. Hayne, C.A.P. Smith and S. Sutton, “An investigation of computer support systems on managerial group decision making under time pressure,” in Advances in Management Accounting, vol. 6, 1998, pp. 17-38.
Self-Aware Traders. A real time approach to safer decision-making in the trading process 125
[36] P. Lehner, M. Seyed-Solorforough, M.F. O'Connor, S. Sak and T. Mullin, “Cognitive biases and time stress in team decision making,” in IEEE Trans. on Systems, Man, & Cybernetics Part A: Systems & Humans, vol. 27, 1997, pp. 698–703.
[37] S. Maghout-Juratli, J. Janisse, K. Schwartz and B. B. Arnetz, “The causal role of fatigue in the stress-perceived health relationship: a MetroNet study” in J Am Board Fam Med, vol. 23, 2010, pp. 212-219.
[38] E. Soetens, J. Hueting and F. Wauters, “Traces of fatigue in an attention task,” in Bulletin of the Psychonomic Society, vol. 30, 1992, pp. 97–100.
[39] R.S. Lazarus, Stress and Emotion: A New Synthesis, B. Tucker Ed. Springer, New York, 2006, p. 35.
[40] J. Ledoux, The Emotional Brain, Weidenfeld & Nicholson eds., The Orion Publishing Group Ltd., London, UK, 1998, pp. 69-70.
[41] A. Bechara, “The role of emotion in decision-making: Evidence from neurological patients with orbitofrontal damage,” in Brain and Cognition, vol. 55, 2004, pp. 30-40.
[42] A. Damasio, Descartes' Error: Emotion, Reason, and the Human Brain, Avon Books, New York, USA, 1995, pp: 114-127.
[43] J. Pixley, “Finance organizations, decisions and emotions,” in British J. Sociology, vol. 53 (1), 2002, pp. 41-65.
[44] J. Mercer, “Rationality and psychology in international politics,” in International Organization, vol.59, 2005, pp. 77-106.
[45] G. Dreisbach and T. Goschke, “How positive affect modulates cognitive control: Reduced perseveration at the cost of increase distractability,” in J. Experimental Psychology: Learning, Memory, and Cognition, vol. 30(2), 2004, pp. 343-353.
[46] M. G. Calvo and M. D. Castillo, “Selective interpretation in anxiety: Uncertainty for threatening events,” in Cognition and Emotion, vol. 15, 2001, pp. 299–320.
[47] S. M. Doane, Y. W. Sohn and M. T. Jodlowski, “Pilot ability to anticipate the consequences of flight actions as a function of expertise,” in Human Factors, vol. 46(1), 2004, pp. 92-103.
[48] A. F. Stokes, “Sources of stress-resistant performance in aeronautical decision making: The role of knowledge representation and trait anxiety,” in Proc. 39th Human Factors and Ergonomics Society Annual Meeting, Vol. 2, 1995, p. 887–890.
[49] P. Shafto and J. D. Coley, “Development of categorization and reasoning in the natural world: Novices to experts, naïve to similarity to ecological knowledge,” in J. Experimental Psychology: Learning, Memory, and Cognition, vol. 29(4), 2003, pp. 641–649.
[50] G. A. Klein, Recognition-primed decision (RPD) in Advances in man machine systems, W.B. Rouse Ed., 1989, pp. 47-92.
[51] A. W. K. Gaillard and C. J. E. Wientjes, “Mental load and work stress as two types of energy mobilization,” in work & Stress, vol. 8, 1994, pp. 141-152.
[52] H. Akil, S. Campeau, W. E. Cullinan, R. M. Lechan, R. Toni, S. J. Watson and R. M. Moore, “Neuroendocrine Systems I: Overview, Thyroid and Adrenal Axes,” in Fundamental neuroscience, F. E. Bloom, S. C. Landis, J. L. Roberts, L. R. Squire and M. J. Igmond Eds., New York: Academic Press., 1999, pp. 1127-150.
[53] M. A. Staal (2004, Aug.). Stress, Cognition, and Human Performance: A Literature Review and Conceptual Framework. NASA, Ames Research Centre. [Online]. Available:
126 Chapter 5. Conclusions and future work
http://human-factors.arc.nasa.gov/flightcognition/Publications/IH_054_Staal.pdf [54] W. B. Cannon, Bodily changes in pain, hunger, fear, and rage. New York:
Appleton, 1915, pp.22-39. [55] F.J. Mills, “The endocrinology of stress,” in Aviation, Space, and Environmental
Medicine, vol. 56, 1985, pp. 642–650. [56] J. M. Coates and J. Herbert. (2008) “Endogenous steroids and financial risk
taking on a London trading floor,” in Proc.National Academy of Sciences, Vol. 105, No.16, 2008, pp. 6167-6172.
[57] H. Zeier, “workload and psychophysiological stress reactions in air traffic controllers,” in Ergonomics, vol. 37, 1994, pp. 525-539.
[58] S. Farrace, R. Biselli, L. Urbani, and C. Ferlini, “Evaluation of stress induced by flight activity by measuring the hormonal response” in Biofeedback & Self Regulation, vol. 21, 1996, pp. 217–228.
[59] N. Bohnen, N. Nicolson, J. Sulon and J. Jolles, “Coping style, trait anxiety and cortisol reactivity during mental stress,” in J. Psychosomatic Research, vol. 35(2/3), 1991, pp. 141-147.
[60] V. S. Johnston, “Why We Feel, the Science of Human Emotions,” in Evolution and Human Behavior, vol. 21(2), 2000, pp. 141-144.
[61] F. J. Braceland, “Hormones and Their Influence on the Emotions,” in Bull N Y Acad Med, vol. 29(10), 1953, pp. 765–777.
[62] R. R. Avent, C. T. Ng and J. A. Neal, “Machine vision recognition of facial affect using backpropagation neural networks,” in 16th IEEE Conference on Engineering in Medicine and Biology Society, 1994, pp. 1364-1365.
[63] M. Rosenblum, Y. Yacoob and L.S. Davis, “Human expression recognition from motion using radial basis function network architecture,” in IEEE Transactions on Neural Networks, vol. 7(5), 1996, pp. 1121-1138.
[64] T. Moriyama and S. Ozawa, “Emotion recognition and synthesis system on speech,” in IEEE International Conference on Multimedia Computing and Systems, 1999, pp. 840-844.
[65] J. Nicholson, K. Takahashi and R. Nakatsu, “Emotion recognition in speech using neural networks,” in Neural Computing and Applications, vol. 9 (4), 2000, pp. 290-296.
[66] K.Yoshiharu and T. Yuji, “Feeling recognition of spoken words for advanced communication with emotional information processing,” in IEIC Technical Report, vol.101, 2002, pp. 49-54.
[67] K. H. Kim, S. W. Bang, S .R. Kim, “Development of person-independent emotion recognition systems based on multiple physiological signals,” in 2nd Joint EMBS/BMES Conference, 2002, pp. 50-51.
[68] F. Nasoz, C.L. Lisetti, K. Alvarez and N. Finkelstein, “Emotion recognition from physiological signals for user modelling of affect,” in 3rd workshop Affective and Attitude User Modelling, 2003, pp.1-8.
[69] R. Picard, E. Vyzaz and J. Healey, “Toward machine emotional intelligence: Analysis of affective physiological state,” in IEEE Transactions on Pattern Analysis and Machine Intelligence, vol. 23 (10), 2001, pp. 1175-1191.
[70] A. Haag, S. Goronzy, P. Schaich and J. Williams, “Emotion Recognition Using Bio-Sensors: First Step Towards an Automatic System, Affective Dialogue Systems,” in LNCS Affective Dialogue Systems, vol. 3068, 2004, pp. 36-48.
[71] L.C. De Silva and P.C. Ng, “Bimodal emotion recognition,” in IEEE International Conference on Automatic Face and Gesture Recognition, 2000, pp. 332-335.
Self-Aware Traders. A real time approach to safer decision-making in the trading process 127
[72] Y. Yoshitomi, S.-Ill Kim, T. Kawano and T. Kitazoe, “Effect of sensor fusion for recognition of emotional states using voice, face image and thermal image of face,” in IEEE International workshop on Robot and Human Interactive Communication, 2000, pp. 178-183.
[73] H. Schultheis, “IPRA_Enhancing the sensing abilities of ambient intelligence,” in Computational Intelligence, vol. 23 (4), 2007, pp. 464-483.
[74] R. Sinha, W.R. Lovallo and O.A. Parsons, “Cardiovascular differentiation of emotions,” in Psychosomatic Medicine, vol. 54 (4), 1992, pp. 422-435.
[75] A. Lo, R. Dmitry and B. Steenbarger, “Fear and Greed in Financial Markets: A Clinical Study of Day-Traders,” in American Economic Review, vol. 95, 2005, pp. 352-59.
[76] J. T. Cacioppo, “Social neuroscience: Autonomic, neuroendocrine, and immune responses to stress,” in Psychophysiology, vol. 31, 1994, pp. 113-128.
[77] B. Cryer, R. McCraty and D. Childre, “Pull the plug on stress” in Harvard Business Review, vol. 81(7), 2003, pp. 102-107.
[78] T. W. Frazier, S. R. Steinhauer and M. E. Strauss, ”Respiratory sinus arrhythmia as an index of emotional response in young adults” in Psychophysiology, vol. 41, 2004, pp. 75-83.
[79] S. Sakuragi, Y. Sugiyama and K. Takeuchi, “Effects of laughing and weeping on mood and heart rate variability” in J.Physiological Anthropology and Applied Human Science, vol.21, 2002, pp. 159-165.
[80] A. K. Blangsted, N. Fallentin, N. Hjortskov, U. Lundberg, D. Risse´n, and K. Søgaard, “The effect of mental stress on heart rate variability and blood pressure during computer work,” in Eur J Appl Physiol, vol. 92, 2004, pp. 84-89.
[81] O. Barnea and V. Shusterman, “Analysis of Skin-Temperature Variability compared to Variability of Blood Pressure and Heart Rate,” in IEEE Engineering in Medicine and Biology Society, vol. 2, 1995, pp. 766-771.
[82] P. Lang, M. Greenwald, M. Bradley and O. Hamm,”Looking at pictures: Affective, facial, visceral, and behavioral reactions,” in Psychophysiology, vol.30, 1993, pp.261-273.
[83] S. Adams, A. Alkon, W. T. Boyce, M. Chesney, B. Chesterman, F. Cohen, S. Folkman, P. Kaiser, J. M. Tschann and D. Wara, “Psychobiologic reactivity to stress and childhood respiratory illnesses: results of two prospective studies,” in Psychosom Med, vol. 57, 1995, pp. 411-422.
[84] H.C. Ossebaard, “Stress reduction by technology? An experimental study into the effects of brainmachines on burnout and state anxiety,” in Appl Psychophysiology Biofeedback, vol.25, 2000, pp. 93-101.
[85] K. Yamanaka and M. Kawakami, “Convenient evaluation of mental stress with pupil diameter,” in International J. occupational safety and ergonomics: JOSE, vol. 15(4), 2009, pp. 447-50.
[86] A.W. Lo and D.V. Repin, "The Psychophysiology of Real-Time Financial Risk Processing," in J. Cognitive Neuroscience, vol. 14(3), pp. 323-339.
[87] N. Kobayashi, M. Sagawa, T. Iuryu and Y. Saitoh,” A New Mental Stress Detection Method Using Biosignals under Visual Search Tasks,” in Proc. 1st Joint BMES/EMBS Conference Serving Humanity, Advancing Technology, 1999, pp. 957.
[88] A. Sui, J. Shin, C. Lee, Y. Yoon and J. Principe, “Evaluation of Stress Reactivity and Recovery using Biosignals and Fuzzy Theory,” in Proc. 2nd Joint EMBS/BMES Conference, vol. 1, 2002, pp. 32-33.
128 Chapter 5. Conclusions and future work
[89] J. Healey, J. Seger and R. Picard, “Quantifying Driver Stress: Developing a System for Collecting and Processing Bio-Metric Signals in Natural Situations,” in Proc. the Rocky Mountain Bio-Engineering Symposium, 1999, pp. 1-6.
[90] F. Braudel, “Civilisation matérielle économie et capitalisme XVe- XVIIIe siècle”, tomeII – Les jeux de l’échange, Paris, ed. “Le Livre de Poche” Armand Colin, 1979.
[91] A. Preda, “On ticks and tapes: financial knowledge, communicative practices, and information technologies on 19th century financial markets,” in: New York Conference on Social Studies of Finance, Columbia University, New York, 2002.
[92] S. Lee, M. Telerate,”Technology and the markets,” in: Taylor, F. (Ed.), Mastering Foreign Exchange and Currency Options: A Practitioner’s Guide to the New Marketplace. Prentice-Hall, FT Press, London, 2003.
[93] M.I. Barrett, S.V. Scott, “Electronic Trading and the Process of Globalization in Traditional Futures Exchanges: A Temporal Perspective. European,” in Journal of Information Systems, vol. 13 (1), 2004, pp 65-79.
[94] C. Zaloom, Out of the Pits: Traders and Technology from Chicago to London. Chicago University Press, 2006.
[95] C. Sorensen, A. Al-Taitoon, “Organisational Usability of Mobile Computing: Volatility and Control in Mobile Foreign Exchange Trading,” in International Journal of Human-Computer Studies, 2008, vol. 66(12), pp 916-929.
[96] M. Kothare and P. A. Laux, “Trading costs and the trading systems for nasdaq stocks,” in Financial Analysts Journal, vol. 51 (2), 1995, pp 42-53.
[97] C. A. E. Goodhart, M. O'Hara, “High frequency data in financial markets: Issues and applications,” in Journal of Empirical Finance, Vol. 4, 1997, pp. 73-114.
[98] C. Heath and P. Luff, Technology in Action. Cambridge, United Kingdom: Cambridge University Press, 2000.
[99] A.K. Jain, R. Bolle and S. Pankanti: "Personal Identification in Networked society," Kluwer Academic Publisher, 1999.
[100] D. H. Barlow and V. M. Durand. Abnormal psychology: an integrative approach, 5th ed., Belmont, CA: Wadsworth Cengage Learning, 2009, pp. 331.
[101] Polar RS800cx. (2011, Aug. 21). [Online]. Available: http://www.polar.fi/en/products/maximize_performance/running_multisport/RS800CX_Pro_Training_Edition_PREMIUM
[102] GSR2. (2011, Aug. 21). [Online]. Available: http://www.thoughttechnology.com/gsr.htm
[103] HEM – 790IT. (2011, Aug. 21). [Online]. Available: http://www.omronhealthcare.com/products/hem-790it/
[104] PS2133. (2011, Aug. 21). [Online]. Available: ftp://ftp.pasco.com/Support/Documents/English/PS/PS-2133/012-08370A.pdf
[105] SC911. (2011, Aug. 21). [Online]. Available: http://www.bio-medical.com/product_info.cfm?inventory__imodel=SC911P
[106] Pocket A3. (2011, Aug. 21). [Online]. Available: http://www.pocket-neurobics.com/
[107] Clinical EMG. (2011, Aug. 21). [Online]. Available: http://www.metron.com.au/electrotherapy.html
[108] S225. (2011, Aug. 21). [Online]. Available: http://www.qubitsystems.com/Merchant2/merchant.mvc?Screen=PROD&Store_Code=QS&Product_Code=S225
Self-Aware Traders. A real time approach to safer decision-making in the trading process 129
[109] Biopac Mp150. (2011, Aug. 21). [Online]. Available: http://www.biopac.com/data-acquisition-system-mp150-system-glp-win-specifications#LowerTab
[110] Nexus 10. (2011, Aug. 21). [Online]. Available: http://www.mindmedia.nl/english/nexus10.php
[111] I-330-C2+. (2011, Aug. 21). [Online]. Available: http://www.jjengineering.com/C12.htm
[112] Flexcomp Infinity. (2011, Aug. 21). [Online]. Available: http://www.thoughttechnology.com/flexinf.htm
[113] J. Augusto, “Ambient intelligence: The confluence of pervasive computing and artificial intelligence,” in Intelligent Computing Everywhere, A. Schuster, Ed. Springer, 2007, pp. 213-234.
[114] H. Mattila, “Intelligent textiles and clothing – a part of our intelligent ambience,” in Intelligent textiles and clothing, H.R Mattila, Ed. Woodhead Publishing, 2006, pp. 1-4.
[115] A. Pantelopoulos, N. G. Bourbakis, “Survey on Wearable Sensor-Based Systems for Health Monitoring and Prognosis,” in IEEE Trans. On Systems, Man and Cybernetics – Part C: Applications and reviews, vol. 40, no. 1, 2010, pp. 1-13.
[116] E. Leon, G. Clarke, V. Callaghan and F. Doctor, “Affect-aware behaviour modelling and control inside an intelligent environment,” in Pervasive and Mobile Computing, In Press, 2010.
[117] LifeShit. (2011, Aug. 21). [Online]. Available: http://www.raesystems.com/products/lifeshirt
[118] VitalJacket. (2011, Aug. 21). [Online]. Available: http://www.optima-life.com/vitaljacket/index.html
[119] Y. Yang, M. Chuang, S. Lou and J. Wang, “Thick-film textile-based amperometric sensors and biosensors, ” in Analyst, 2010, vol. 135, pp. 1230-1234.
[120] Exmocare BT2, (2011, Aug. 21). [Online]. Available: http://www.exmovere.com/healthcare.html
[121] Emsense, (2011, Aug. 21). [Online]. Available: http://www.emsense.com/index.php
[122] Firstbeat Stress Monitoring, (2011, Aug. 21). [Online]. Available: http://www.firstbeattechnologies.com/index.php?page=3&sub_page=19&sub_page_2=93
[123] Emwave desktop. (2011, Aug. 21). [Online]. Available: http://www.heartmathstore.com/category/emwave-desktop/emwave-desktop-anxiety-relief
[124] Rationalizer, (2011, Aug. 21). [Online]. Available: www.design.philips.com/about/design/designnews/pressreleases/rationalizer.page
[125] Stresseraser. (2011, Aug. 21). [Online]. Available: http://stresseraser.com/ [126] Personal stress reliever. (2011, Aug. 21). [Online]. Available:
http://www.heartmathstore.com/category/emWave/emwave-stress-reliever [127] Emotional Mouse. (2011, Aug. 21). [Online]. Available:
http://www.ecse.rpi.edu/homepages/qji/HCI/mouse.html [128] Wearable EOG goggles. (2011, Aug. 21). [Online]. Available:
http://www.wearable.ethz.ch/research/groups/context/eye_movements/handout_wearable_eye-tracker.pdf
130 Chapter 5. Conclusions and future work
[129] Vitalsense XHR. (2011, Aug. 21). [Online]. Available: http://www.vitalsense.respironics.com/features.asp#XHR
[130] DARPA-ASSIST project, (2011, Aug. 21). [Online]. Available: http://www.darpa.mil/ipto/programs/assist/assist_obj.asp
[131] A. Raj, A. Subramanya, D. Fox and J. Bilmes, “Rao-Blackwellized Particle Filters for Recognizing Activities and Spatial Context from Wearable Sensors” in Springer Tracts in Advanced Robotics, vol. 39, 2008, pp. 211-221.
[132] B. A. Weiss, C. Schlenoff, M. Shneier, and A. Virts, “Technology evaluations and performance metrics for soldier-worn sensors for assist,” in Performance Metrics for Intelligent Systems workshop, 2006, pp. 157-164.
[133] SESAME project, (2011, Aug. 21). [Online]. Available: http://www.cl.cam.ac.uk/research/dtg/sesame
[134] Healthcare@home project, (2011, Aug. 21). [Online]. Available: http://www.healthcareathome.info/
[135] M. Subramanian, E. C. Conley, O. F. Rana, A. Hardisty, A. S. Ali, S. Luzio, D. R. Owens, S. Wright, T. Donovan, B. Bedi, D. Conway-Jones, D. Vyvyan, G. Arnold, C. Creasey, A. Horgan, T. Cox and R. Waite, “Novel Sensor Technology Integration for Outcome-Based Risk Analysis in Diabetes,” in Proc. First Int'l Conf. Health Informatics, vol. 2, 2008, pp. 119-126.
[136] Wearitatwork project, (2011, Aug. 21). [Online]. Available: http://www.wearitatwork.com/
[137] E. Pasher and M. Lawo, Intelligent clothing. Empowering the mobile worker by wearable computiting, R. Pezzlo Ed., AKA, Netherlands, 2009, p. 7.
[138] Heartcycle project, (2011, Aug. 21). [Online]. Available: http://heartcycle.med.auth.gr/
[139] K. J. Heilman and S.W. Porges, “Accuracy of the LifeshirtR_ (Vivometrics) in the detection of cardiac rhythms,” in Biol. Psychol., vol. 3, 2007, pp. 300-305.
[140] R. Bouhenguel, I. Mahgoub and M. Ilyas, “Bluetooth security in wearable computing applications,” in Proc. Int. Symp. High Capacity Opt. Net.Enabling Tech., 2008, pp. 182–186.
[141] C. T. Hager and S. F. Midkiff, “An analysis of bluetooth security vulnerabilities,” in Proc. IEEE WCNC, 2003, pp. 1825–1831.
[142] C. Heath, C, M. Jirotka, P. Luff, and J. Hindmarsh, “Unpacking Collaboration: the Interactional Organisation of Trading in a City Dealing Room,” in Proc. of the Third European Conference on Computer-Supported Cooperative Work, 1993, pp. 155-170.
[143] Reuters 3000 Xtra, (2011, Aug. 21). [Online]. Available: http://thomsonreuters.com/products_services/financial/financial_products/equities_derivatives/americas/3000_xtra
[144] CMS Forex, (2011, Aug. 21). [Online]. Available: http://www.cmsfx.com/es/forex-education/learn-vt-trader/vt-quick-start-guide/vt-trader-interface/reports/
[145] J.D. Schwager, J. D. The New Market Wizards. Conversations with America's Top Traders. New York: HarperCollins Publishers, 1992.
[146] K. Weick, “The Collapse of Sensemaking in Organizations: The Man Gulch Disaster,” in Administrative Science Quarterly, vol. 38, 1993, pp. 628-652.
[147] C. Speier, J. S. Valacich and I. Vessey, “The influence of task interruption on individual decision making: An information overload perspective,” in Decision Sciences, vol. 30(2), 1999, pp. 337-360.
Self-Aware Traders. A real time approach to safer decision-making in the trading process 131
[148] E. M. Altmann and J. G. Trafton, “Timecourse of recovery from task interruption: Data and a model,” in Psychonomic Bullletin & Review, vol. 14 (6), 2007, pp. 1079-1084.
[149] R.W. Picard, K.K. Liu, “Relative Subjective Count and Assessment of Interruptive Technologies Applied to Mobile Monitoring of Stress,” in International Journal of Human–Computer Studies vol. 65, 2007, pp. 361-375.
[150] D. Serfaty, E. E. Entin and J. H. Johnston, “Team coordination training,” in Making decisions under stress, J.A. Cannon-Bowers and E. Salas, Eds., Washington, D.C.: American Psychological Association, 1998, pp. 221-245.
[151] J. M. Fernández, J.C. Augusto, R. Seepold, N. Martínez Madrid, “Why Traders Need Ambient Intelligence,” in Advances in Intelligent and Soft Computing series, Springer-Verlag Berlin Heidelberg, vol. 72, pp. 229-236.
[152] J. M. Fernandez, J. C. Augusto, R. Seepold, N. Martínez Madrid, ”Sensors in Trading Process: A Stress–Aware Trader,” in 8th Proc. IEEE workshop on Intelligent Solutions in Embedded Systems, 2010, pp. 17-21.
[153] A.I.Heyn and J. M. Fernández, “Expert system for the recommendation of the IBEX-35 shares on Internet”, Degree Project, 2002.
[154] Rogue Trader movie, (2011, Aug. 21). [Online]. Available: http://www.imdb.com/title/tt0131566/
[155] N. Bevan, International Standards for HCI and Usability. International Journal of Human-Computer Studies, 2001, vol.55 (4).
[156] T.R. Stanford, S. Shankar, D.P.Massoglia, M.G. Costello and E. Salinas, Perceptual decision making in less than 30 miliseconds, Nature Neuroscience, 2010, vol.13, 379-385.
[157] MarketVolume charts, (2011, Aug. 21). [Online]. Available: http://www.marketvolume.com/
[158] C. Larman and V.R. Basili, "Iterative and incremental developments. a brief history," Computer , vol.36, no.6, 2003, pp. 47- 56.
[159] R. J. Abbott, "Program Design by Informal English Descriptions," Communications of the ACM, Vol. 26, no. 11, 1983, pp. 882 - 894.
[160] G. Booch, "Object Oriented Development," IEEE Transactions on Software Engineering, vol. SE-12, No. 2, 1986, pp. 211 - 221.
[161] Object Management Group (OMG). UML 2.0 Infrastructure Specification, Julio 2005.
[162] Object Management Group (OMG). UML 2.0 Superstructure Specification, Julio 2005.
[163] Visual paradigm, (2011, Aug. 21). [Online]. Available: http://www.visual-paradigm.com/
[164] Java, (2011, Aug. 21). [Online]. Available: http://www.java.com/es/ [165] Netbeans, (2011, Aug. 21). [Online]. Available: http://netbeans.org/index.html [166] Netbeans history, (2011, Aug. 21). [Online]. Available:
http://netbeans.org/about/history.html [167] Mysql, (2011, Aug. 21). [Online]. Available: http://www.mysql.com/ [168] Robin Schumacher, Arjen Lentz. "Dispelling the Myths", MySQL AB. (2011,
Aug. 21). [Online]. Available: http://dev.mysql.com/tech-resources/articles/dispelling-the-myths.html.
[169] History of MySQL, MySQL 5.1 Reference Manual. MySQL AB. (2011, Aug. 21). [Online]. Available: http://dev.mysql.com/doc/refman/5.1/en/history.html.
132 Chapter 5. Conclusions and future work
[170] P. Tschirner, B. Hillers and A. Graser: "A concept for the application of augmented reality in manual gas metal arc welding," Mixed and Augmented Reality, 2002. ISMAR 2002, 2002, pp. 257- 258.
[171] H. Kopetz. “Real-Time Systems, Design Principles for Distributed Embedded”, Real-Time systems series. Vol.25, 2011.
[172] G. Lori, A micro simulation of traders activities in the stock market: The role of heterogeneity, agents interaction and trade frictions, Journal of Economic Behaviour and Organization, 2002, vol. 49, pp. 269-285.
[173] J. Bollen, H. Mao, and X.-J. Zeng (2010). Twitter mood predicts the stock market. (2011, Aug. 21). [Online]. Available: http://arxiv.org/abs/1010.3003
[174] Infobolsa, (2011, Aug. 21). [Online]. Available: http://www.ifobolsa.es [175] S. Flanders, Greece: Ceding defeat, but not (yet) default, BBC economic news,
Available: http://www.bbc.co.uk/blogs/thereporters/stephanieflanders/2010/04/ceding_defeat_but_not_yet_defa.html (2011, Mar. 10].
[176] Louis Capital Markets, (2011, Aug. 21). [Online]. Available: http://www.louiscapital.com/
[177] Fcc Performance, (2011, Aug. 21). [Online]. Available: http://www.fccperformance.com/
[178] D. Kirkpatrick and J.R. Dahlquist. “Technical Analysis: The Complete Resource for Financial Market Technicians”. in Financial Times Press, 2006, p 3.
[179] D. R. Aronson, “Evidence-Based Technical Analysis”, Hoboken, New Jersey: John Wiley and Sons, 2006, pp 357, 355-356, 342.
[180] J. de la Vega, Confusión de Confusiones, 1688. [181] G.L. Morris, “Candlestick Charting Explained: Timeless Techniques for Trading
Stocks and Futures”, McGraw-Hill, 2006. [182] R. Rhea, “The dow Theory”, Fraser Publishing Library, 1994 [183] J. Murphy, Technical Analysis of the Financial Markets. New York Institute of
Finance, 1999, pp. 1-5, 24-31. [184] A. W. Lo, H. Mamaysky, J. Wang, "Foundations of Technical Analysis:
Computational Algorithms, Statistical Inference, and Empirical Implementation", Journal of Finance, 2000, vol 55, pp. 1705–1765.
[185] OSGi Alliance, (2011, Aug. 21). [Online]. Available: http://www.osgi.org/Main/HomePage
[186] Infobolsa powerstation, (2011, Aug. 21) [Online]. Available: http://www.infobolsa.es/136.htm

Self-Aware Traders. A real time approach to safer decision-making in the trading process 133
APPENDIX A. QUESTIONNAIRE CLIENT TEST (TRADER NOT
CONNECTED TO STRESS AWARE GROUP)
The objective of this test is to run an “off line” session of the Stress Aware Trader software, only reporting information of stress levels for the own trader (It would be desired 30 minutes time test). Please fill the suitable mark with your opinion:
• The trader’s comfort with the sensor during the test (one sensor in the ear to measure the heart rate and communicate to the trader her/his own stress). 1 – Bad, I feel uncomfortable with the sensor, 2- I do not feel uncomfortable but I do not want to wear the sensor during trading process, 3 – Good, I do not mind wearing the sensor for a while, it is comfortable, 4 – Very good, I do not mind wearing the sensor the whole session.
1 - � 2 - � 3 - � 4 - �
• Ease of use for the software. (1 – Bad, I think it is very difficult to use, 2- I think I need time to use it , 3 – Good, I think it is easy to manage 4 – Very good, I think it is very intuitive.)
1 - � 2 - � 3 - � 4 - �
• Ease to understand the Stress levels. (1 – Bad, I think it is very difficult to understand, 2- I think I need time to understand it, 3 – Good, I think it is easy to understand 4 – Very good, I think it is very intuitive.)
1 - � 2 - � 3 - � 4 - �
• Compatibility with the current information for trading process. (1 – Bad, I think it is impossible to add this information. It is incompatible, 2- I think it is compatible but I do not think it fits my user preferences, 3 – Good, I think it is compatible and it fits my user preferences 4 – Very good, I think it is compatible and it should be in my trading process information.)
1 - � 2 - � 3 - � 4 - �
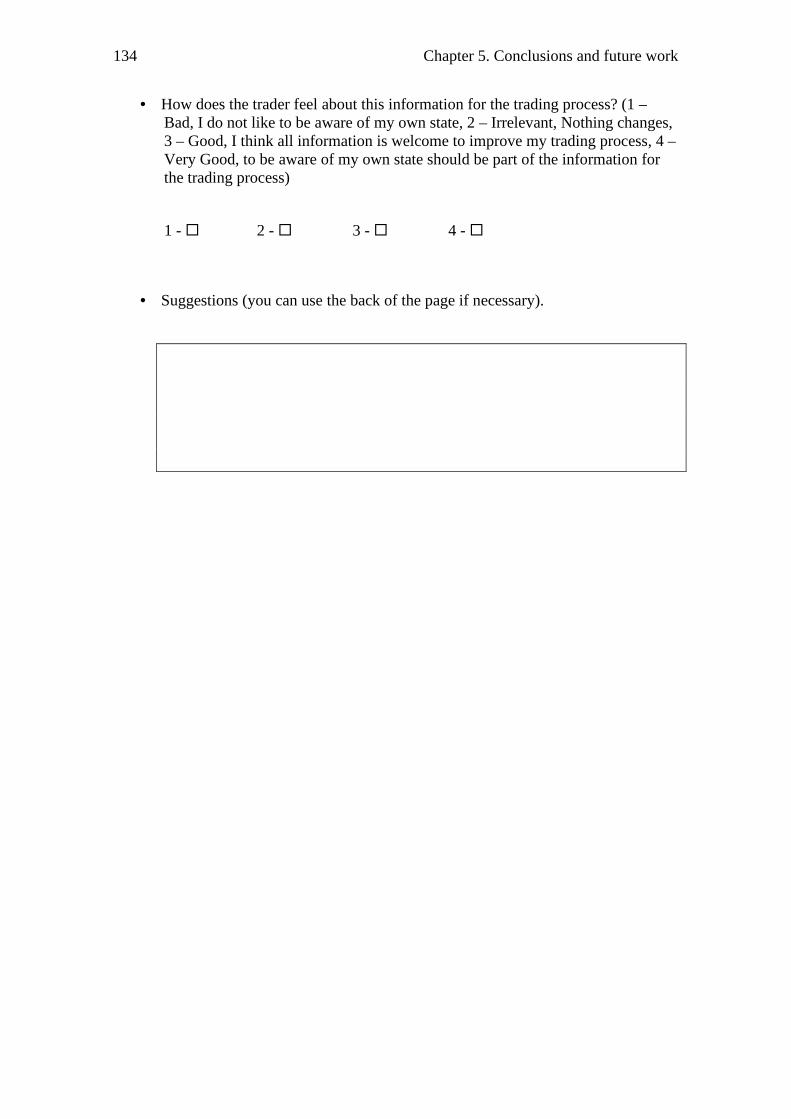
134 Chapter 5. Conclusions and future work
• How does the trader feel about this information for the trading process? (1 – Bad, I do not like to be aware of my own state, 2 – Irrelevant, Nothing changes, 3 – Good, I think all information is welcome to improve my trading process, 4 – Very Good, to be aware of my own state should be part of the information for the trading process)
1 - � 2 - � 3 - � 4 - �
• Suggestions (you can use the back of the page if necessary).
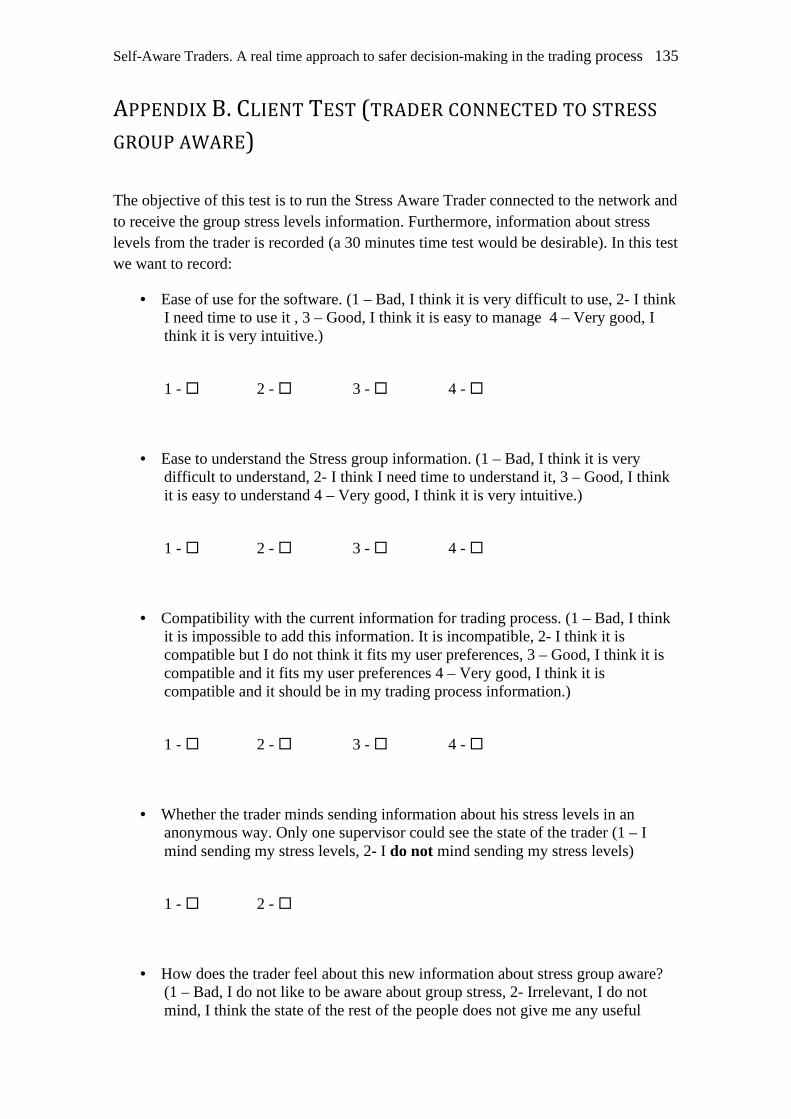
Self-Aware Traders. A real time approach to safer decision-making in the trading process 135
APPENDIX B. CLIENT TEST (TRADER CONNECTED TO STRESS
GROUP AWARE)
The objective of this test is to run the Stress Aware Trader connected to the network and to receive the group stress levels information. Furthermore, information about stress levels from the trader is recorded (a 30 minutes time test would be desirable). In this test we want to record:
• Ease of use for the software. (1 – Bad, I think it is very difficult to use, 2- I think I need time to use it , 3 – Good, I think it is easy to manage 4 – Very good, I think it is very intuitive.)
1 - � 2 - � 3 - � 4 - �
• Ease to understand the Stress group information. (1 – Bad, I think it is very difficult to understand, 2- I think I need time to understand it, 3 – Good, I think it is easy to understand 4 – Very good, I think it is very intuitive.)
1 - � 2 - � 3 - � 4 - �
• Compatibility with the current information for trading process. (1 – Bad, I think it is impossible to add this information. It is incompatible, 2- I think it is compatible but I do not think it fits my user preferences, 3 – Good, I think it is compatible and it fits my user preferences 4 – Very good, I think it is compatible and it should be in my trading process information.)
1 - � 2 - � 3 - � 4 - �
• Whether the trader minds sending information about his stress levels in an anonymous way. Only one supervisor could see the state of the trader (1 – I mind sending my stress levels, 2- I do not mind sending my stress levels)
1 - � 2 - �
• How does the trader feel about this new information about stress group aware? (1 – Bad, I do not like to be aware about group stress, 2- Irrelevant, I do not mind, I think the state of the rest of the people does not give me any useful
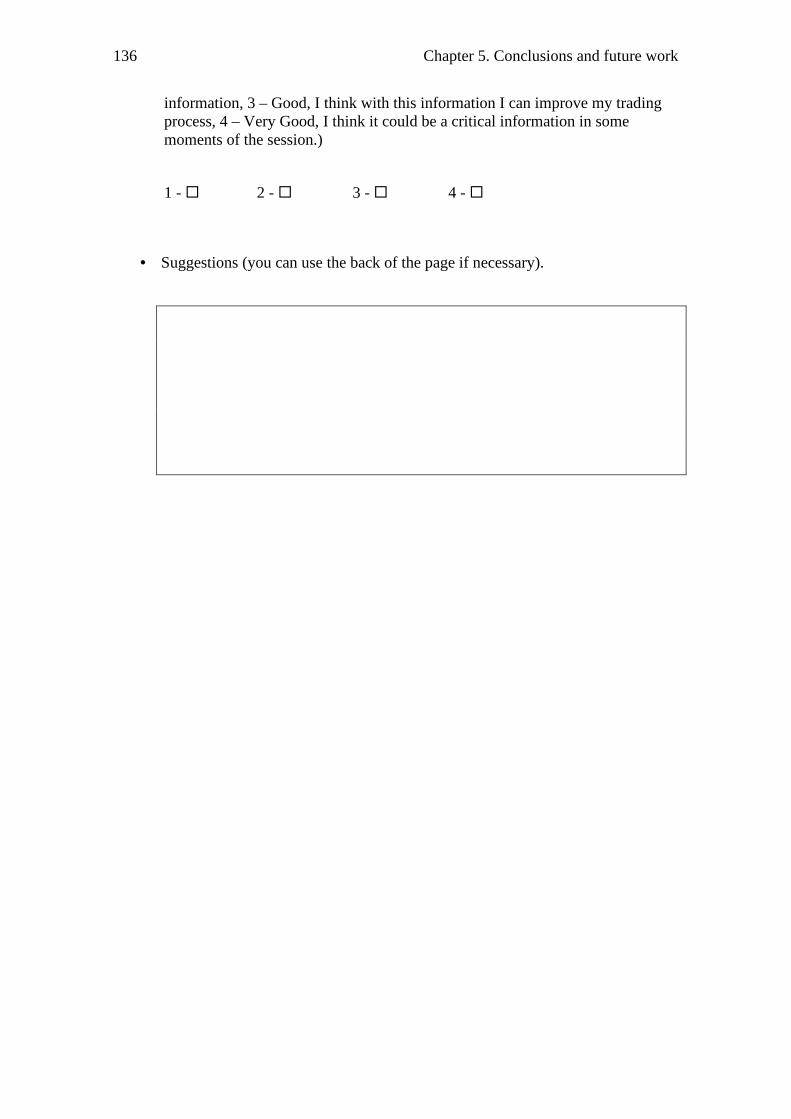
136 Chapter 5. Conclusions and future work
information, 3 – Good, I think with this information I can improve my trading process, 4 – Very Good, I think it could be a critical information in some moments of the session.)
1 - � 2 - � 3 - � 4 - �
• Suggestions (you can use the back of the page if necessary).
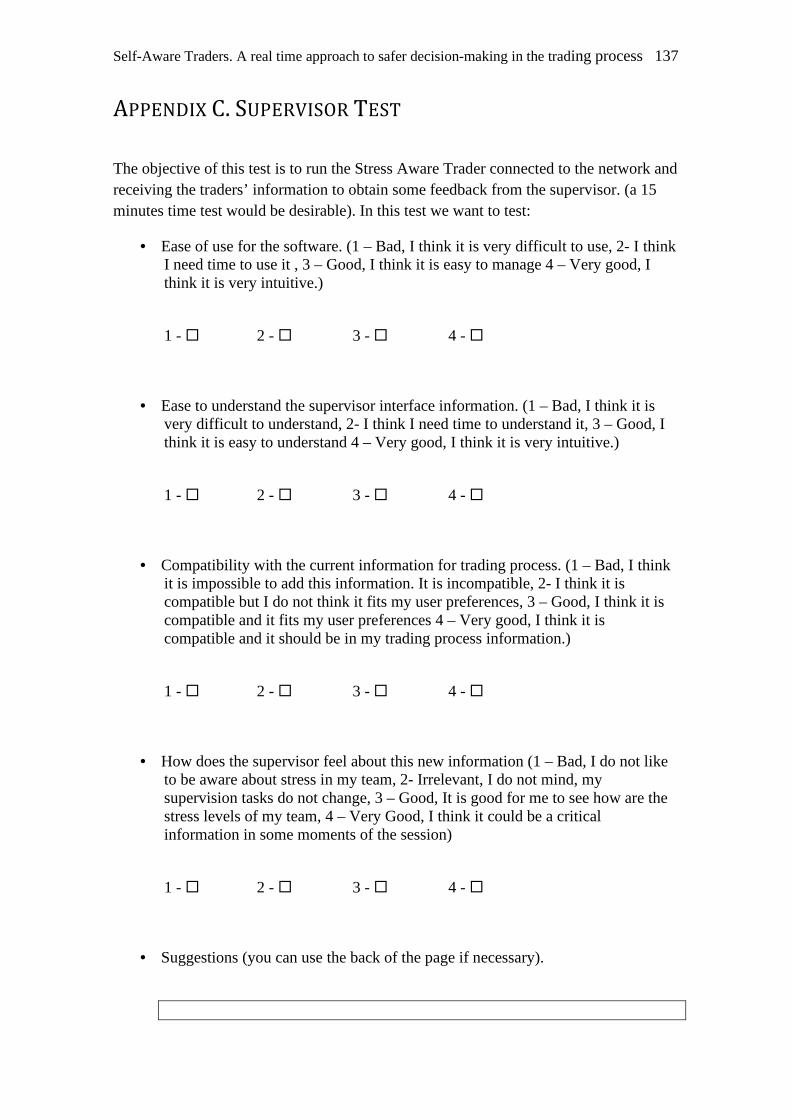
Self-Aware Traders. A real time approach to safer decision-making in the trading process 137
APPENDIX C. SUPERVISOR TEST
The objective of this test is to run the Stress Aware Trader connected to the network and receiving the traders’ information to obtain some feedback from the supervisor. (a 15 minutes time test would be desirable). In this test we want to test:
• Ease of use for the software. (1 – Bad, I think it is very difficult to use, 2- I think I need time to use it , 3 – Good, I think it is easy to manage 4 – Very good, I think it is very intuitive.)
1 - � 2 - � 3 - � 4 - �
• Ease to understand the supervisor interface information. (1 – Bad, I think it is very difficult to understand, 2- I think I need time to understand it, 3 – Good, I think it is easy to understand 4 – Very good, I think it is very intuitive.)
1 - � 2 - � 3 - � 4 - �
• Compatibility with the current information for trading process. (1 – Bad, I think it is impossible to add this information. It is incompatible, 2- I think it is compatible but I do not think it fits my user preferences, 3 – Good, I think it is compatible and it fits my user preferences 4 – Very good, I think it is compatible and it should be in my trading process information.)
1 - � 2 - � 3 - � 4 - �
• How does the supervisor feel about this new information (1 – Bad, I do not like to be aware about stress in my team, 2- Irrelevant, I do not mind, my supervision tasks do not change, 3 – Good, It is good for me to see how are the stress levels of my team, 4 – Very Good, I think it could be a critical information in some moments of the session)
1 - � 2 - � 3 - � 4 - �
• Suggestions (you can use the back of the page if necessary).

138 Chapter 5. Conclusions and future work