Embed Size (px)
Citation preview
A strategy for scaling up the Fischer–Tropsch
bubble column slurry reactor
R. Krishna� and J.M. van Baten
Department of Chemical Engineering, University of Amsterdam, Nieuwe Achtergracht 166, 1018 WV Amsterdam, The Netherlands
For successful scale-up of the bubble column slurry reactor for Fischer–Tropsch synthesis, we need to have proper description
of hydrodynamics and transport phenomena (gas and liquid holdups, liquid-phase residence time distribution, gas–liquid mass
transfer, heat transfer to cooling tubes) as a function of reactor scale (column diameter and height) and operating conditions
(superficial gas velocity, system pressure, slurry concentration, . . .). We discuss and develop a scale-up strategy using computational
fluid dynamics, with a minimum amount of experimental input from hydrodynamic studies carried out on a relatively small scale.
KEY WORDS: gas holdup; bubble columns; scale effects; computational fluid dynamics; liquid circulations; concentrated slurries.
1. Introduction
The Fischer–Tropsch reaction that was discovered inGermany nearly three-quarters of a century ago hasrecently become a subject of renewed interest, particu-larly in the context of the conversion of remote naturalgas to liquid transportation fuels. For economic andlogistic reasons, such conversions are best carried out inlarge-scale projects, and the capability of up-scaling istherefore an important consideration in the selection ofreactors for synthesis gas generation as well as inFischer–Tropsch synthesis. It is now widely acceptedthat the bubble column slurry reactor is the best choiceof reactor type for large-scale plants with capacities ofthe order of 40 000 bbl/day. Typical design and operat-ing conditions of a Fischer–Tropsch slurry bubblecolumn diameter for an optimally designed reactor canbe obtained from the information given by Maretto andKrishna [1]:
. The column diameter ranges from 6–10m.
. The column height is in the range of 30–40m.
. The reactor operates at a pressure of between 3 and5Mpa.
. The reactor temperature is about 513–523K.
. The superficial gas velocity is in the range 0.10–0.4m/s,depending on the catalyst activity and the catalystconcentration in the slurry phase.
. For high reactor productivities, the highest slurryconcentrations consistent with catalyst handleabilityshould be used. In practice, the volume fraction ofcatalyst in the slurry phase, "s, is in the range 0.3–0.4.
. For removing the heat of reaction, 5000–8000 verticalcooling tubes, say of 50-mm diameter and 150-mmpitch, will need to be installed in a reactor of, say, 6m.
The success of the process largely depends on theability to achieve deep syngas conversions, say, exceed-ing 95%. Reliable design of the reactor to achieve suchhigh conversion levels requires reasonably accurateinformation on the following hydrodynamics and masstransfer parameters:
. Gas holdup.
. Interphase mass transfer between the gas bubbles andthe slurry.
. Axial dispersion of the liquid (slurry) phase.
. Axial dispersion of the gas phase.
. Heat transfer coefficient to cooling tubes.
Most of the above-mentioned hydrodynamic para-meters are interrelated. For a given column diameter,the bubble rise velocity affects the gas holdup and alsodetermines the strength of the liquid circulations and,consequently, the axial dispersion coefficient of theliquid phase. The distribution of bubble sizes and risevelocities determines the axial dispersion coefficient ofthe gas phase. The heat transfer to the cooling tubes isinfluenced by the renewal rate of the liquid film on thetube surface, which in turn is dictated by the bubble risevelocity. Increasing the column diameter has the effectof increasing the liquid circulations, which enhances thebubble rise velocity; this impacts on all the hydro-dynamic parameters. For a proper description of thehydrodynamics at different scales, we make use ofcomputational fluid dynamics (CFD) in the Eulerianframework; this technique has been applied with somesuccess in the description of hydrodynamics of bubblecolumn reactors [2–11]. In the CFD model developed inthe present communication, the interphase momentumexchange or drag coefficient is obtained from experi-mental measurements on a relatively small scale.
In order to demonstrate our scale-up approach, wehave carried out experimental studies on slurry bubble
�To whom correspondence should be addressed.
E-mail: [email protected]
Topics in Catalysis Vol. 26, Nos. 1–4, December 2003 (# 2003) 21
1022-5528/03/1200–0021/0 # 2003 Plenum Publishing Corporation
columns in columns of 0.1, 0.19 and 0.38m in diameter.These experimental results are compared with CFDsimulations. Furthermore, we perform CFD simulationsfor a 6-m column to demonstrate the significantinfluence of scale on column hydrodynamics.
2. Experimental setup and results
Experiments were performed in polyacrylate columnswith inner diameters of 0.1, 0.19 and 0.38m. The gasdistributors used in the three columns were all made ofsintered bronze plate (with a mean pore size of 50�m).The gas flow rates entering the column were measuredwith the use of a set of rotameters, placed in parallel, asshown in figure 1 for the 0.38-m column. This setup wastypical. Air was used as the gas phase in all experiments.Firstly, experiments were performed with paraffin oil(density, �L ¼ 790 kg=m3; viscosity, �L ¼ 0:0029 Pa.s;surface tension, � ¼ 0:028N=m) as liquid phase towhich solid particles in varying concentrations wereadded. The solid phase used consisted of poroussilica particles whose properties were determined tobe as follows: skeleton density ¼ 2100 kg=m3; pore
volume ¼ 1:05mL=g; particle size distribution, dp: 10%< 27�m; 50% < 38�m; 90% < 47�m. The solids con-centration, "s, is expressed as the volume fraction ofsolids in gas-free slurry. The pore volume of the particles(liquid filled during operation) is counted as being part ofthe solid phase. Further details of the experimental workis available in [3,4,9,12,13].
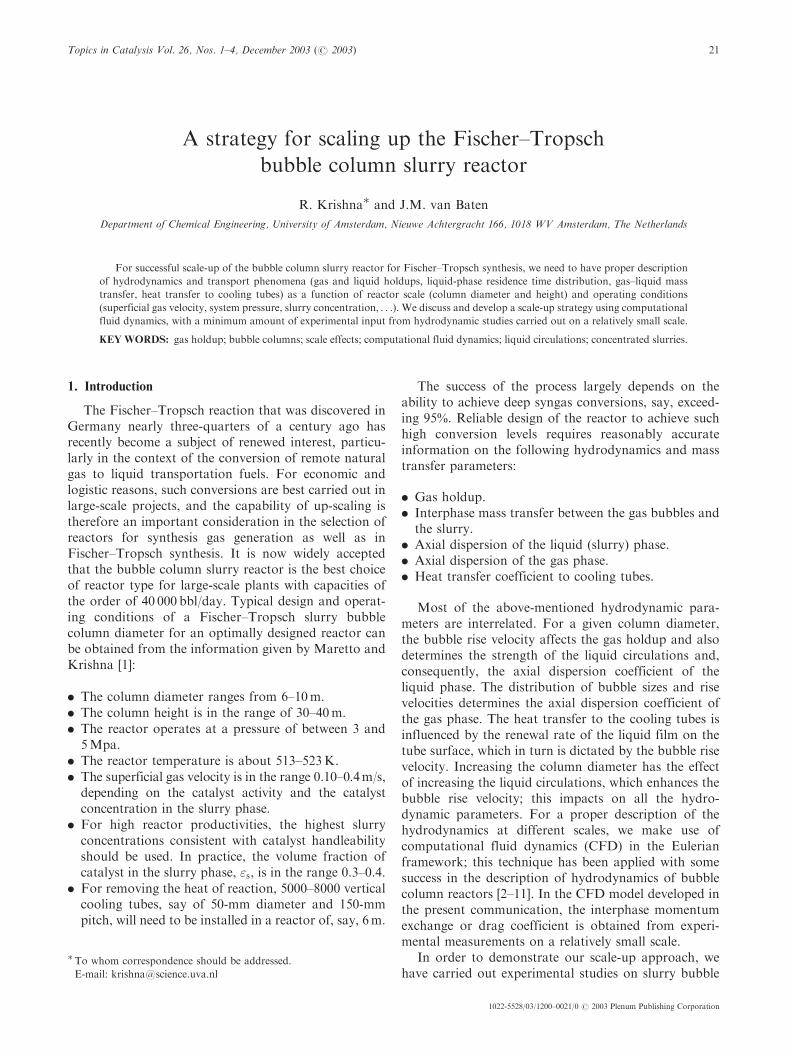
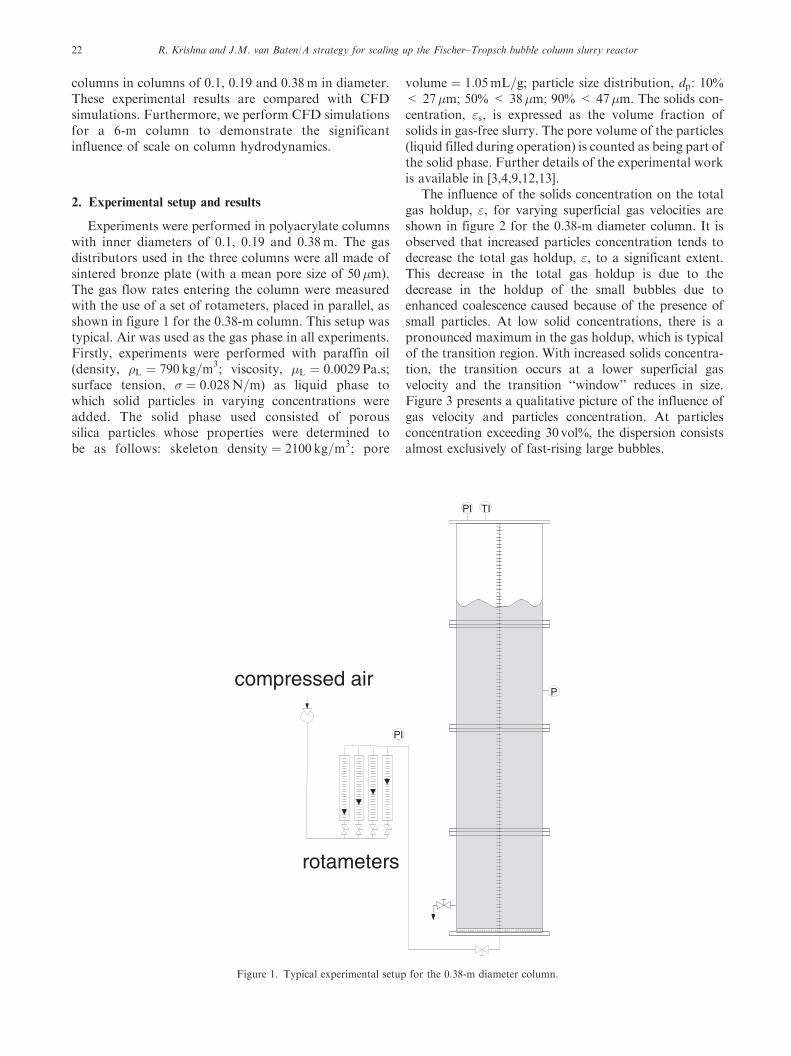
The influence of the solids concentration on the totalgas holdup, ", for varying superficial gas velocities areshown in figure 2 for the 0.38-m diameter column. It isobserved that increased particles concentration tends todecrease the total gas holdup, ", to a significant extent.This decrease in the total gas holdup is due to thedecrease in the holdup of the small bubbles due toenhanced coalescence caused because of the presence ofsmall particles. At low solid concentrations, there is apronounced maximum in the gas holdup, which is typicalof the transition region. With increased solids concentra-tion, the transition occurs at a lower superficial gasvelocity and the transition ‘‘window’’ reduces in size.Figure 3 presents a qualitative picture of the influence ofgas velocity and particles concentration. At particlesconcentration exceeding 30 vol%, the dispersion consistsalmost exclusively of fast-rising large bubbles.
compressed air
rotameters
PI
PI TI
P
Figure 1. Typical experimental setup for the 0.38-m diameter column.
R. Krishna and J.M. van Baten/A strategy for scaling up the Fischer–Tropsch bubble column slurry reactor22
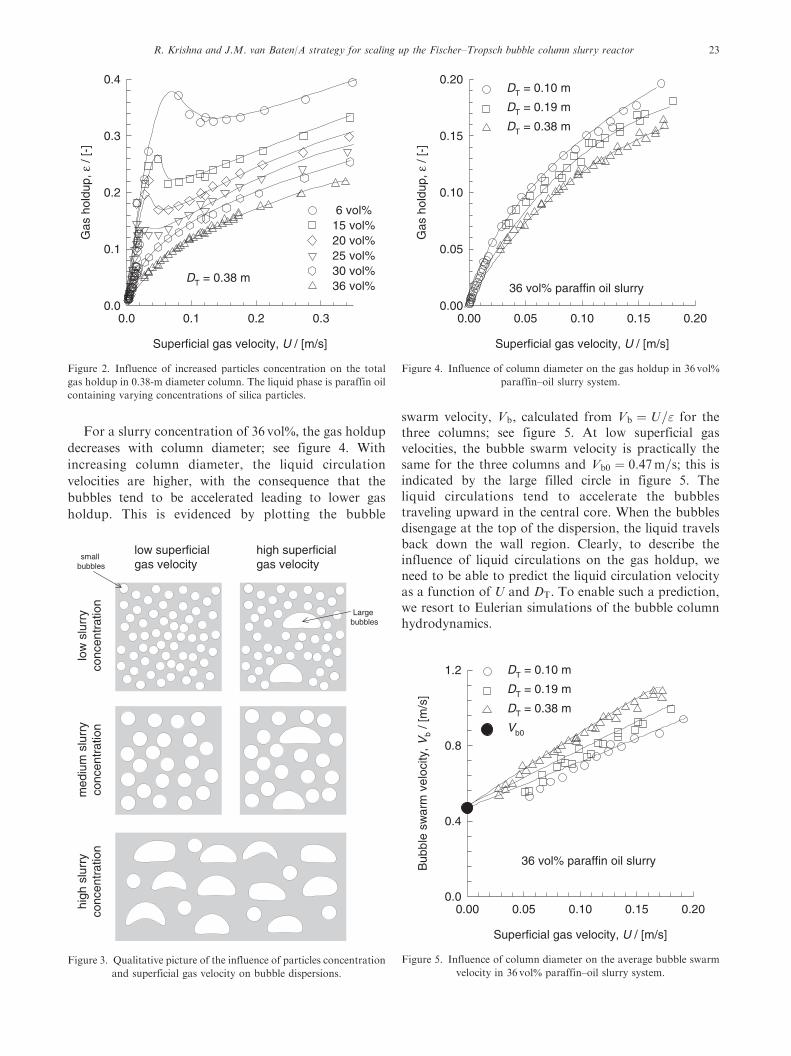
For a slurry concentration of 36 vol%, the gas holdup
decreases with column diameter; see figure 4. With
increasing column diameter, the liquid circulation
velocities are higher, with the consequence that the
bubbles tend to be accelerated leading to lower gas
holdup. This is evidenced by plotting the bubble
swarm velocity, Vb, calculated from Vb ¼ U=" for thethree columns; see figure 5. At low superficial gasvelocities, the bubble swarm velocity is practically thesame for the three columns and Vb0 ¼ 0:47m=s; this isindicated by the large filled circle in figure 5. Theliquid circulations tend to accelerate the bubblestraveling upward in the central core. When the bubblesdisengage at the top of the dispersion, the liquid travelsback down the wall region. Clearly, to describe theinfluence of liquid circulations on the gas holdup, weneed to be able to predict the liquid circulation velocityas a function of U and DT. To enable such a prediction,we resort to Eulerian simulations of the bubble columnhydrodynamics.
Superficial gas velocity, U / [m/s]
0.0 0.1 0.2 0.3
Gas
hol
dup,
ε /
[-]
0.0
0.1
0.2
0.3
0.4
6 vol%15 vol%20 vol%25 vol%30 vol%36 vol%
DT = 0.38 m
Figure 2. Influence of increased particles concentration on the total
gas holdup in 0.38-m diameter column. The liquid phase is paraffin oil
containing varying concentrations of silica particles.
low superficialgas velocity
high superficialgas velocity
low
slu
rry
conc
entr
atio
nm
ediu
m s
lurr
yco
ncen
trat
ion
high
slu
rry
conc
entr
atio
n
Large bubbles
small bubbles
Figure 3. Qualitative picture of the influence of particles concentration
and superficial gas velocity on bubble dispersions.
Superficial gas velocity, U / [m/s]
0.00 0.05 0.10 0.15 0.20
Gas
hol
dup,
ε /
[-]
0.00
0.05
0.10
0.15
0.20DT = 0.10 m
DT = 0.19 m
DT = 0.38 m
36 vol% paraffin oil slurry
Figure 4. Influence of column diameter on the gas holdup in 36 vol%
paraffin–oil slurry system.
Superficial gas velocity, U / [m/s]
0.00 0.05 0.10 0.15 0.20
Bub
ble
swar
m v
eloc
ity, V
b / [
m/s
]
0.0
0.4
0.8
1.2 DT = 0.10 m
DT = 0.19 m
DT = 0.38 m
Vb0
36 vol% paraffin oil slurry
Figure 5. Influence of column diameter on the average bubble swarm
velocity in 36 vol% paraffin–oil slurry system.
R. Krishna and J.M. van Baten/A strategy for scaling up the Fischer–Tropsch bubble column slurry reactor 23
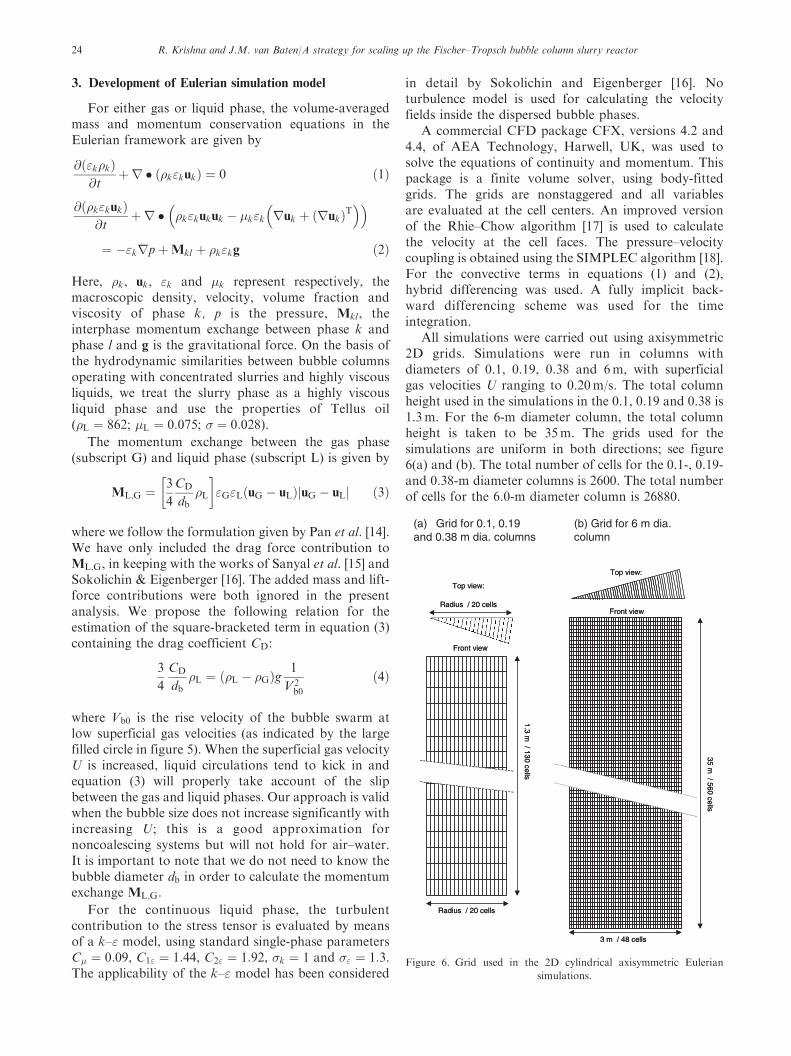
3. Development of Eulerian simulation model
For either gas or liquid phase, the volume-averagedmass and momentum conservation equations in theEulerian framework are given by
@ð"k�kÞ@t
þr � ð�k"kukÞ ¼ 0 ð1Þ
@ð�k"kukÞ@t
þr � �k"kukuk � �k"k ruk þ ðrukÞT� �� �
¼ �"krpþMkl þ �k"kg ð2Þ
Here, �k, uk, "k and �k represent respectively, themacroscopic density, velocity, volume fraction andviscosity of phase k, p is the pressure, Mkl, theinterphase momentum exchange between phase k andphase l and g is the gravitational force. On the basis ofthe hydrodynamic similarities between bubble columnsoperating with concentrated slurries and highly viscousliquids, we treat the slurry phase as a highly viscousliquid phase and use the properties of Tellus oil(�L ¼ 862; �L ¼ 0:075; � ¼ 0:028).
The momentum exchange between the gas phase(subscript G) and liquid phase (subscript L) is given by
ML;G ¼ 3
4
CD
db�L
� �"G"LðuG � uLÞjuG � uLj ð3Þ
where we follow the formulation given by Pan et al. [14].We have only included the drag force contribution toML;G, in keeping with the works of Sanyal et al. [15] andSokolichin & Eigenberger [16]. The added mass and lift-force contributions were both ignored in the presentanalysis. We propose the following relation for theestimation of the square-bracketed term in equation (3)containing the drag coefficient CD:
3
4
CD
db�L ¼ ð�L � �GÞg
1
V2b0
ð4Þ
where Vb0 is the rise velocity of the bubble swarm atlow superficial gas velocities (as indicated by the largefilled circle in figure 5). When the superficial gas velocityU is increased, liquid circulations tend to kick in andequation (3) will properly take account of the slipbetween the gas and liquid phases. Our approach is validwhen the bubble size does not increase significantly withincreasing U; this is a good approximation fornoncoalescing systems but will not hold for air–water.It is important to note that we do not need to know thebubble diameter db in order to calculate the momentumexchange ML;G.
For the continuous liquid phase, the turbulentcontribution to the stress tensor is evaluated by meansof a k–" model, using standard single-phase parametersC� ¼ 0:09, C1" ¼ 1:44, C2" ¼ 1:92, �k ¼ 1 and �" ¼ 1:3.The applicability of the k–" model has been considered
in detail by Sokolichin and Eigenberger [16]. Noturbulence model is used for calculating the velocityfields inside the dispersed bubble phases.
A commercial CFD package CFX, versions 4.2 and4.4, of AEA Technology, Harwell, UK, was used tosolve the equations of continuity and momentum. Thispackage is a finite volume solver, using body-fittedgrids. The grids are nonstaggered and all variablesare evaluated at the cell centers. An improved versionof the Rhie–Chow algorithm [17] is used to calculatethe velocity at the cell faces. The pressure–velocitycoupling is obtained using the SIMPLEC algorithm [18].For the convective terms in equations (1) and (2),hybrid differencing was used. A fully implicit back-ward differencing scheme was used for the timeintegration.
All simulations were carried out using axisymmetric2D grids. Simulations were run in columns withdiameters of 0.1, 0.19, 0.38 and 6m, with superficialgas velocities U ranging to 0.20m/s. The total columnheight used in the simulations in the 0.1, 0.19 and 0.38 is1.3m. For the 6-m diameter column, the total columnheight is taken to be 35m. The grids used for thesimulations are uniform in both directions; see figure6(a) and (b). The total number of cells for the 0.1-, 0.19-and 0.38-m diameter columns is 2600. The total numberof cells for the 6.0-m diameter column is 26880.
Top view:
Radius / 20 cells
Front view
Radius / 20 cells
1.3 m / 130 cells
Top view:
Radius / 20 cells
Front view
Radius / 20 cells
1.3 m / 130 cells
3 m / 48 cells
35 m / 560 cells
Top view:
Front view
3 m / 48 cells
35 m / 560 cells
Top view:
Front view
(a) Grid for 0.1, 0.19 and 0.38 m dia. columns
(b) Grid for 6 m dia.column
Figure 6. Grid used in the 2D cylindrical axisymmetric Eulerian
simulations.
R. Krishna and J.M. van Baten/A strategy for scaling up the Fischer–Tropsch bubble column slurry reactor24
To prevent a circulation pattern in which the liquidflows up near the wall and comes down in the core, thegas was not injected homogeneously over the fullbottom area. Instead, the injection of gas was performedon the inner 75% of the radius (15 out of 20 grid cells inthe 0.1-, 0.19- and 0.38-m diameter columns and 36 outof the 48 cells in the 6-m diameter column).
A pressure boundary condition was applied to thetop of the column. A standard no-slip boundarycondition was applied at the wall. The 0.1-, 0.19- and0.38-m diameter columns were initially filled only withliquid, up to a height of 0.8–1m, depending on thesuperficial gas velocity. The initial liquid height for the6-m diameter columns was 25m. Transient simulationsof the column hydrodynamics were then carried out byimposing a constant superficial gas velocity at thebottom inlet. The time-stepping strategy used in thetransient simulations was 100 steps at 5� 10�5 s, 100steps at 1� 10�4 s, 100 steps at 5� 10�4 s, 100 steps at
1� 10�3 s, 200 steps at 3� 10�3 s, 1400 steps at5� 10�3 s and the remaining steps until steady stateat 1� 10�2 s. Steady state was obtained when noneof the state variables in the system were subject tochange.
The simulations were carried out on Silicon GraphicsPower Indigo workstation with 75-MHz R8000 proces-sors. Each simulation was completed in about 24 h forthe three smaller column diameters. Each of the 6-mcolumn simulations took 4 weeks to complete. Whensteady state is established, the cumulative gas holdupcan be determined along the column height. All the gasholdup data reported in this paper correspond to thecumulative gas holdup at a height of 0.9m above thedistributor for the smaller diameter column and 23m forthe 6-m diameter column.
Further details of the simulations, including anima-tions of column start-up dynamics are available on ourwebsite: http://ct-cr4.chem.uva.nl/viscousbc.
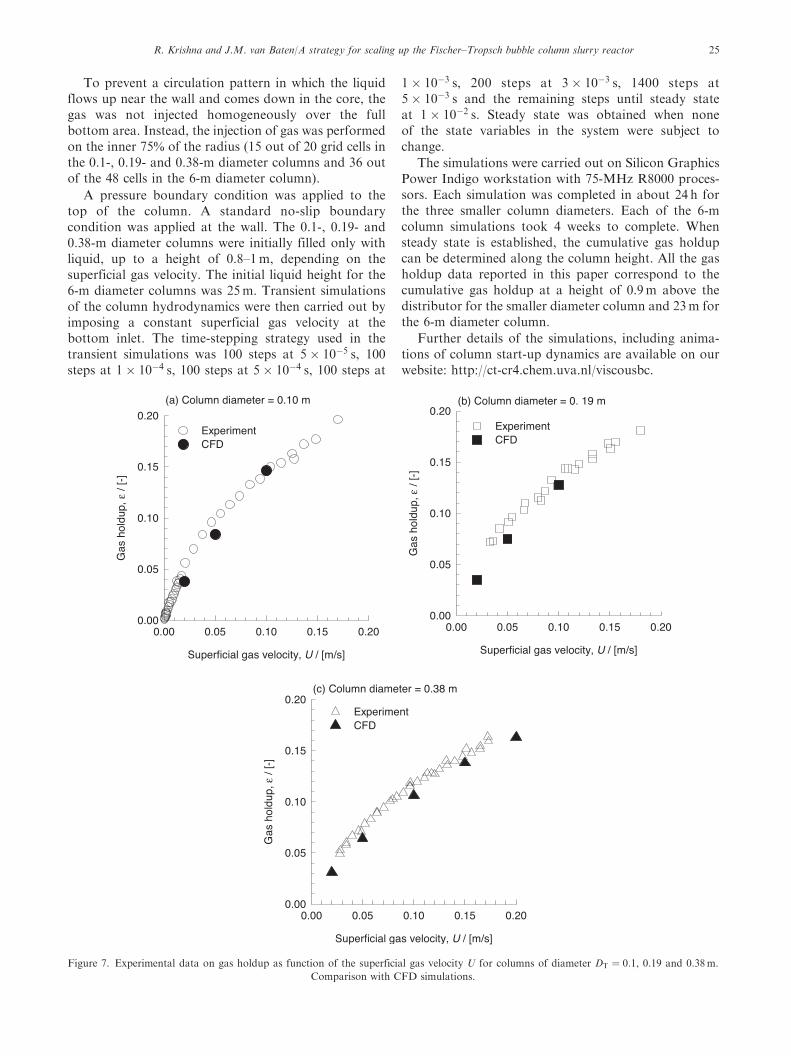
Figure 7. Experimental data on gas holdup as function of the superficial gas velocity U for columns of diameter DT ¼ 0:1, 0.19 and 0.38m.
Comparison with CFD simulations.
R. Krishna and J.M. van Baten/A strategy for scaling up the Fischer–Tropsch bubble column slurry reactor 25
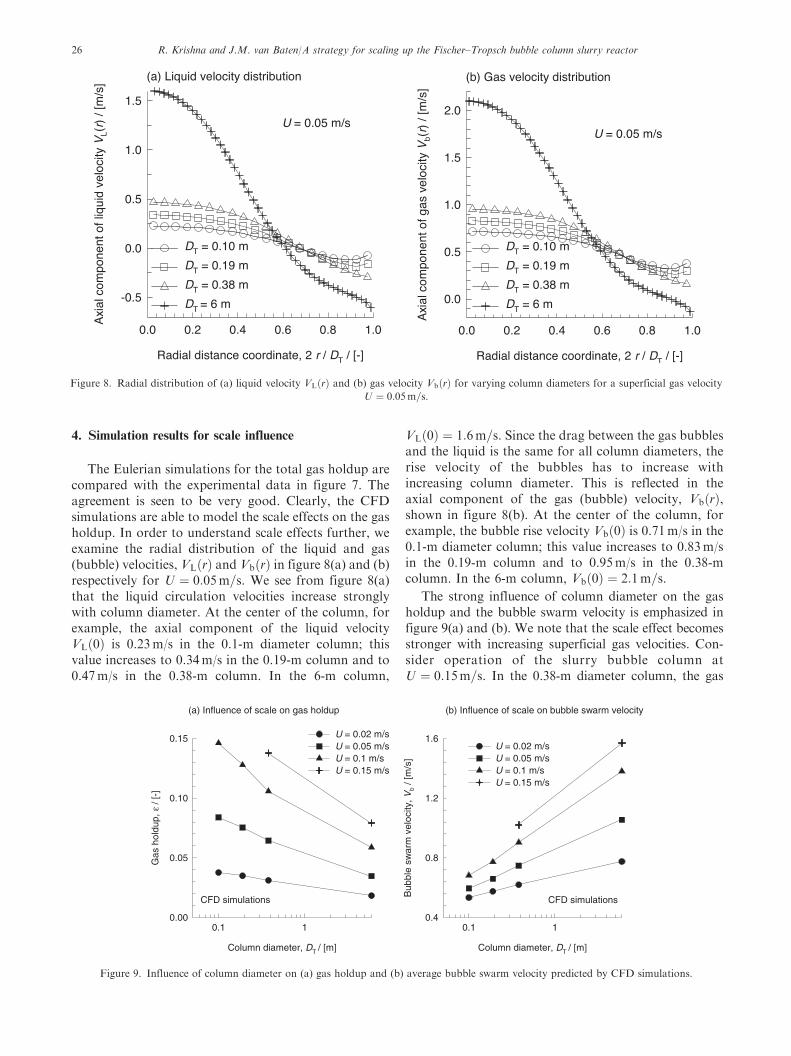
4. Simulation results for scale influence
The Eulerian simulations for the total gas holdup arecompared with the experimental data in figure 7. Theagreement is seen to be very good. Clearly, the CFDsimulations are able to model the scale effects on the gasholdup. In order to understand scale effects further, weexamine the radial distribution of the liquid and gas(bubble) velocities, VLðrÞ and VbðrÞ in figure 8(a) and (b)respectively for U ¼ 0:05m=s. We see from figure 8(a)that the liquid circulation velocities increase stronglywith column diameter. At the center of the column, forexample, the axial component of the liquid velocityVLð0Þ is 0.23m/s in the 0.1-m diameter column; thisvalue increases to 0.34m/s in the 0.19-m column and to0.47m/s in the 0.38-m column. In the 6-m column,
VLð0Þ ¼ 1:6m=s. Since the drag between the gas bubblesand the liquid is the same for all column diameters, therise velocity of the bubbles has to increase withincreasing column diameter. This is reflected in theaxial component of the gas (bubble) velocity, VbðrÞ,shown in figure 8(b). At the center of the column, forexample, the bubble rise velocity Vbð0Þ is 0.71m/s in the0.1-m diameter column; this value increases to 0.83m/sin the 0.19-m column and to 0.95m/s in the 0.38-mcolumn. In the 6-m column, Vbð0Þ ¼ 2:1m=s.
The strong influence of column diameter on the gasholdup and the bubble swarm velocity is emphasized infigure 9(a) and (b). We note that the scale effect becomesstronger with increasing superficial gas velocities. Con-sider operation of the slurry bubble column atU ¼ 0:15m=s. In the 0.38-m diameter column, the gas
Figure 8. Radial distribution of (a) liquid velocity VLðrÞ and (b) gas velocity VbðrÞ for varying column diameters for a superficial gas velocity
U ¼ 0:05m=s.
Column diameter, DT / [m]
0.1 1
Bub
ble
swar
m v
eloc
ity, V
b / [
m/s
]
0.4
0.8
1.2
1.6U = 0.02 m/sU = 0.05 m/sU = 0.1 m/sU = 0.15 m/s
CFD simulations
Column diameter, DT / [m]
0.1 1
Gas
hol
dup,
ε /
[-]
0.00
0.05
0.10
0.15 U = 0.02 m/sU = 0.05 m/sU = 0.1 m/sU = 0.15 m/s
CFD simulations
(a) Influence of scale on gas holdup (b) Influence of scale on bubble swarm velocity
Figure 9. Influence of column diameter on (a) gas holdup and (b) average bubble swarm velocity predicted by CFD simulations.
R. Krishna and J.M. van Baten/A strategy for scaling up the Fischer–Tropsch bubble column slurry reactor26
holdup is 0.138; this reduces to a value " ¼ 0:079 in the 6-m diameter column, which amounts to a 40% reduction.
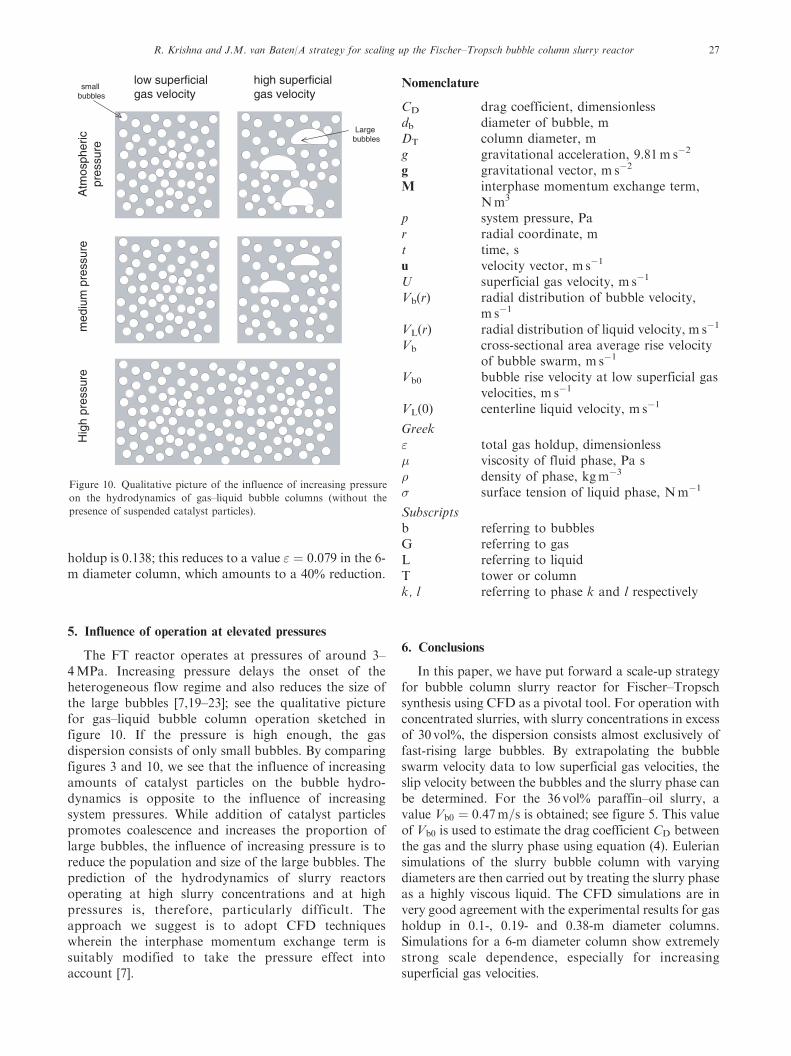
5. Influence of operation at elevated pressures
The FT reactor operates at pressures of around 3–4MPa. Increasing pressure delays the onset of theheterogeneous flow regime and also reduces the size ofthe large bubbles [7,19–23]; see the qualitative picturefor gas–liquid bubble column operation sketched infigure 10. If the pressure is high enough, the gasdispersion consists of only small bubbles. By comparingfigures 3 and 10, we see that the influence of increasingamounts of catalyst particles on the bubble hydro-dynamics is opposite to the influence of increasingsystem pressures. While addition of catalyst particlespromotes coalescence and increases the proportion oflarge bubbles, the influence of increasing pressure is toreduce the population and size of the large bubbles. Theprediction of the hydrodynamics of slurry reactorsoperating at high slurry concentrations and at highpressures is, therefore, particularly difficult. Theapproach we suggest is to adopt CFD techniqueswherein the interphase momentum exchange term issuitably modified to take the pressure effect intoaccount [7].
Nomenclature
CD drag coefficient, dimensionlessdb diameter of bubble, mDT column diameter, mg gravitational acceleration, 9.81m s�2
g gravitational vector, m s�2
M interphase momentum exchange term,Nm3
p system pressure, Par radial coordinate, mt time, su velocity vector, m s�1
U superficial gas velocity, m s�1
Vb(r) radial distribution of bubble velocity,m s�1
VL(r) radial distribution of liquid velocity, m s�1
Vb cross-sectional area average rise velocityof bubble swarm, m s�1
Vb0 bubble rise velocity at low superficial gasvelocities, m s�1
VL(0) centerline liquid velocity, m s�1
Greek" total gas holdup, dimensionless� viscosity of fluid phase, Pa s� density of phase, kgm�3
� surface tension of liquid phase, Nm�1
Subscriptsb referring to bubblesG referring to gasL referring to liquidT tower or columnk, l referring to phase k and l respectively
6. Conclusions
In this paper, we have put forward a scale-up strategyfor bubble column slurry reactor for Fischer–Tropschsynthesis using CFD as a pivotal tool. For operation withconcentrated slurries, with slurry concentrations in excessof 30 vol%, the dispersion consists almost exclusively offast-rising large bubbles. By extrapolating the bubbleswarm velocity data to low superficial gas velocities, theslip velocity between the bubbles and the slurry phase canbe determined. For the 36 vol% paraffin–oil slurry, avalue Vb0 ¼ 0:47m=s is obtained; see figure 5. This valueof Vb0 is used to estimate the drag coefficient CD betweenthe gas and the slurry phase using equation (4). Euleriansimulations of the slurry bubble column with varyingdiameters are then carried out by treating the slurry phaseas a highly viscous liquid. The CFD simulations are invery good agreement with the experimental results for gasholdup in 0.1-, 0.19- and 0.38-m diameter columns.Simulations for a 6-m diameter column show extremelystrong scale dependence, especially for increasingsuperficial gas velocities.
Atm
osph
eric
pres
sure
med
ium
pre
ssur
eH
igh
pres
sure
low superficialgas velocity
high superficialgas velocity
Large bubbles
small bubbles
Figure 10. Qualitative picture of the influence of increasing pressure
on the hydrodynamics of gas–liquid bubble columns (without the
presence of suspended catalyst particles).
R. Krishna and J.M. van Baten/A strategy for scaling up the Fischer–Tropsch bubble column slurry reactor 27
Once the bubble hydrodynamics have been determinedfor the commercial scale reactor of, say, 6m, morereliable estimates can be made of the axial dispersioncoefficients, mass and heat transfer coefficients.
Acknowledgment
The Netherlands Organisation for Scientific Research(NWO) is gratefully acknowledged for providing finan-cial assistance in the form of a ‘‘programmasubsidie’’ fordevelopment of novel concepts in reactive separationstechnology.
References
[1] C. Maretto and R. Krishna, Catal. Today 52 (1999) 279.
[2] R. Krishna and J.M. van Baten, Chem. Eng. Technol. 25 (2002)
1015.
[3] R. Krishna, J.M. van Baten, M.I. Urseanu and J. Ellenberger,
Chem. Eng. Sci. 56 (2001) 537.
[4] R. Krishna, J.M. van Baten, M.I. Ursenu and J. Ellenberger,
Catal. Today 66 (2001) 199.
[5] R. Krishna, J.M. van Baten and M.I. Urseanu, Chem. Eng.
Technol. 24 (2001) 451.
[6] R. Krishna and J.M. van Baten, Chem. Eng. Res. Des. 79 (2001)
283.
[7] R. Krishna and J.M. van Baten, Chem. Eng. Sci. 56 (2001) 6249.
[8] R. Krishna, J.M. van Baten and M.I. Urseanu, Chem. Eng. Sci.
55 (2000) 3275.
[9] R. Krishna, Oil Gas Sci. Technol. 55 (2000) 359.
[10] R. Krishna, M.I. Urseanu, J.M. van Baten and J. Ellenberger,
Chem. Eng. Sci. 54 (1999) 4903.
[11] J.M. van Baten and R. Krishna, Chem. Eng. Sci. 56 (2001) 503.
[12] R. Krishna, J.W.A. de Swart, J. Ellenberger, G.B. Martina, C.
Maretto, AIChE J. 43 (1997) 311.
[13] R. Krishna, M.I. Urseanu, J.W.A. de Swart and J. Ellenberger,
Can. J. Chem. Eng. 78 (2000) 442.
[14] Y. Pan, M.P. Dudukovic and M. Chang, Chem. Eng. Sci. 54
(1999) 2481.
[15] J. Sanyal, S. Vasquez, S. Roy and M.P. Dudukovic, Chem. Eng.
Sci. 54 (1999) 5071.
[16] A. Sokolichin and G. Eigenberger, Chem. Eng. Sci. 54 (1999)
2273.
[17] C.M. Rhie and W.L. Chow, AIAA J. 21 (1983) 1525.
[18] J. van Doormal and G.D. Raithby, Numer. Heat Transfer 7
(1984) 147.
[19] H.M. Letzel, J.C. Schouten, R. Krishna and C.M. van den Bleek,
Chem. Eng. Sci. 52 (1997) 4447.
[20] H.M. Letzel, J.C. Schouten, C.M. van den Bleek and R. Krishna,
Chem. Eng. Sci. 52 (1997) 3733.
[21] M.H. Letzel, J.C. Schouten, C.M. van den Bleek and R. Krishna,
AIChE J. 44 (1998) 2333.
[22] H.M. Letzel, J.C. Schouten, R. Krishna and C.M. van den Bleek,
Chem. Eng. Sci. 54 (1999) 2237.
[23] R. Krishna, M.I. Urseanu and A.J. Dreher, Chem. Eng. Process.
39 (2000) 371.
R. Krishna and J.M. van Baten/A strategy for scaling up the Fischer–Tropsch bubble column slurry reactor28