Embed Size (px)
Citation preview
A Strategy for Controlling Histamine Formation at Tuna Precooking
“Heat treatment to confirm a 5-log reduction of the histamine-forming bacterium Morganella morganii”

INTRODUCTION“What is the purpose of this control strategy?”
Abstract
• This is a strategy for controlling histamine formation at tuna precooking by applying sufficient heat treatment to achieve a calculated lower limit of 60°C and confirm a 5-log reduction of the histamine-forming bacterium Morganella morganii.
• It involves measuring the core temperature of 36 fish after every precook batch, following a variable acceptance sampling plan, with 95% confidence and 99% reliability, and testing the distribution of the results for normality by the Ryan-Joiner method.
• It is presented in an HACCP format, and includes details of procedures for corrective actions and verification.
'Fish & Fisheries Products Hazards & Controls Guidance'
• Chapter 7 “Scombrotoxin (Histamine) Formation” of the US FDA Fish and Fishery Products Hazards and Controls Guidancespecifies…
◦ During processing (e.g., thawing, butchering, cooling, cleaning, packing and seaming)…
◦ Histamine-forming fish that have been previously frozen and… ◦ …are processed in a manner where there may be
recontamination with histamine-forming bacteria...◦ …should not be exposed to ambient temperatures above 4.4°C
(40°F) for more than 12 hours, cumulatively, if any portion of that time is at temperatures above 21.1°C (70°F)
FDA Fish and Fishery Products Hazards and Controls Guidance, 4th Edition (April, 2011), Chapter 7, Scombrotoxin (Histamine) Formation
Why is this a problem?
• This means that the processor has only 12 hours from the time the fish leaves temperature-control (cold storage); until retorting (canned tuna) or freezing (loins). In other words, once the fish has been exposed to an ambient temperature above 4.4°C (40°F), the 12-hour clock starts.
• This is not sufficient for processing all but the smallest sizes of tuna, as the cumulative time of thawing, cooking and processing for larger fish sizes commonly exceeds 12 hours.
HACCP“Applying HACCP principles to this control strategy”
HACCP
• This control strategy is intended as a critical control point (CCP) within a company’s existing HACCP plan for the production of commercial tuna products.
• It is intended to comply with U.S. FDA Seafood HACCP regulations 'Seafood HACCP Regulation' (21 CFR 123) and FDA’s 'Fish and Fishery Products Hazards and Controls Guidance, 4th edition‘.
• It follows the seven HACCP Principles detailed on the United States Department of Agriculture (USDA) Food Safety and Inspection Service website.
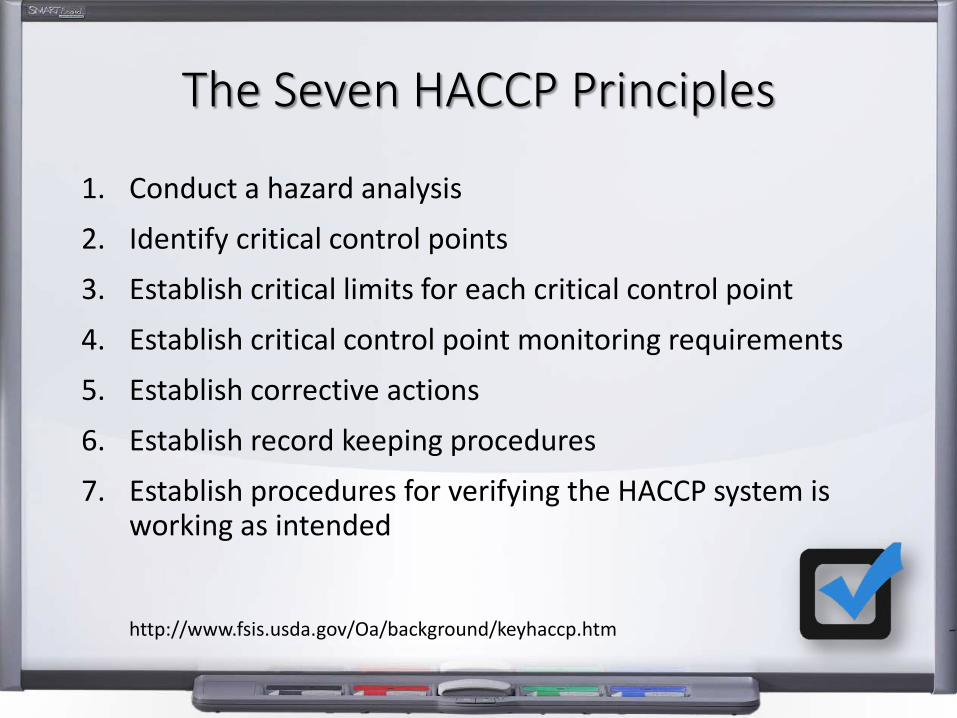
The Seven HACCP Principles
1. Conduct a hazard analysis2. Identify critical control points
3. Establish critical limits for each critical control point
4. Establish critical control point monitoring requirements5. Establish corrective actions
6. Establish record keeping procedures7. Establish procedures for verifying the HACCP system is
working as intended
http://www.fsis.usda.gov/Oa/background/keyhaccp.htm
HAZARD“What is histamine?”
Understand the Potential Hazard• Scombrotoxin (histamine) formation as a result of time and
temperature abuse of certain species of fish can cause consumer illness. The illness is closely linked to the development of histamine in these fish. In most cases, histamine levels in illness-causing fish have been above 200 ppm, often above 500 ppm.
• Symptoms of scombrotoxin poisoning include tingling or burning in the mouth or throat; rash or hives on the upper body; headache; dizziness; itching of the skin; nausea; vomiting; diarrhea; and constriction of the air passage. Symptoms usually occur within a few minutes or hours of consumption, and last from 12 hours to a few days.U.S. Department of Health and Human Services, Food and Drug Administration, Center for Food Safety and Applied Nutrition, Fish and Fishery Products Hazards and Controls Guidance, 4th Edition (April, 2011), Chapter 7, Scombrotoxin (Histamine) Formation
Scombrotoxin (histamine) formation
• Certain bacteria produce the enzyme histidine decarboxylase during growth. This enzyme reacts with histidine, a naturally occurring amino acid that is present in larger quantities in some fish than in others. The result is the formation of scombrotoxin (histamine).
U.S. Department of Health and Human Services, Food and Drug Administration, Center for Food Safety and Applied Nutrition, Fish and Fishery Products Hazards and Controls Guidance, 4th Edition (April, 2011), Chapter 7, Scombrotoxin (Histamine) Formation
Hazard
The hazard in this control strategyis histamine formation
CRITICAL CONTROL POINT“Controlling histamine formation”
What is a Critical Control Point?
• A critical control point (CCP) is a point, step, or procedure in a food process at which control can be applied and, as a result, a food safety hazard can be prevented, eliminated, reduced or maintained at an acceptable level.
• A food safety hazard is any biological, chemical, or physical property that may cause a food to be unsafe for human consumption.
http://www.fsis.usda.gov/Oa/background/keyhaccp.htm
Precooking as a CCP
• This control strategy proposes extending the FDA recommended limit of 12 hours, from thawing until retorting or freezing, by applying sufficient heat treatment at precooking to achieve a 5-log reduction in the histamine-forming bacterium M. morganii.
• This effectively resets the clock to allow for a full 12 hours from the end of precooking until retorting or freezing, hence enabling the processing of larger fish sizes.
Vogl, F., R. Salazar, F. Nolte, G. Kontoh, G. Ybanez. 2012. Validation for pre-cooking as a control for potential histamine production in tuna loins for subsequent canning. Paper presented at: TAFT 2012. Proceedings of the 4th Trans-Atlantic Fisheries Technology Conference; Oct 30-Nov 2, 2012; Clearwater Beach, Florida
Critical Control Point (CCP)
The CCP in this controlstrategy is precooking

PREREQUISITE PROGRAMS“What needs to be done prior to precooking?”
Types of Prerequisite Programs
• Prerequisite programs (PRP) are generic controls established prior to conducting any hazard analysis for HACCP. They are applied to maintain a hygienic environment in order to reduce the risk to food safety. Examples include: design of facilities and production equipment, cleaning and sanitation, hygiene, pest control, training, supplier control, and product recall.
• Steps in the process identified by the hazard analysis as requiring control in order for the CCP to be properly controlled are referred to as 'operational' prerequisite programs (OPRP).
https://www.bayt.com/en/specialties/q/36099/what-is-the-difference-between-prp-oprp-amp-ccp/
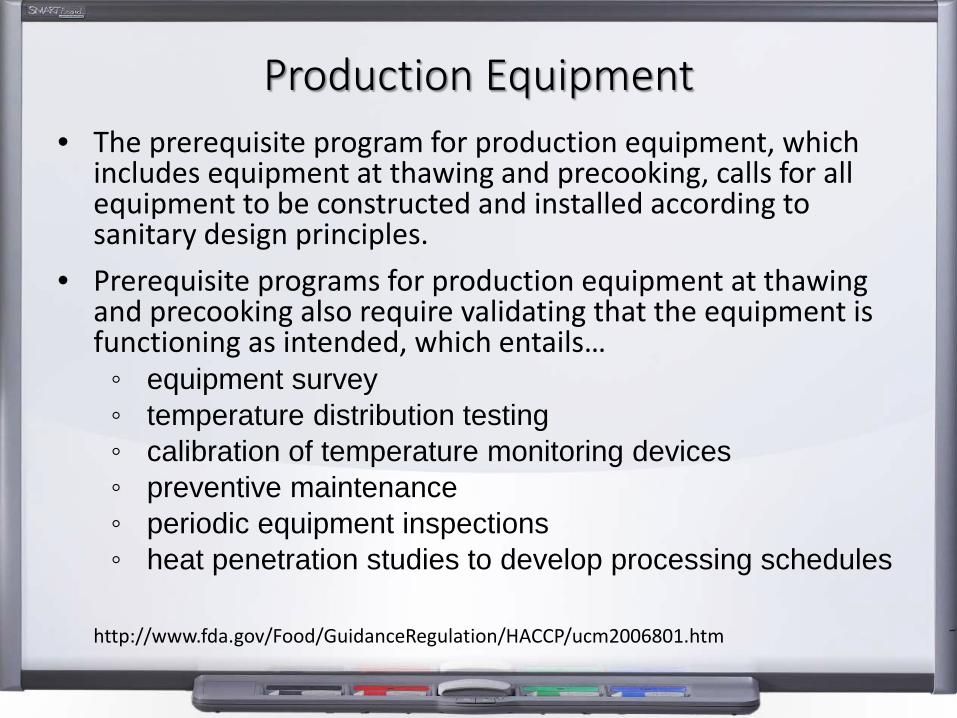
Production Equipment• The prerequisite program for production equipment, which
includes equipment at thawing and precooking, calls for all equipment to be constructed and installed according to sanitary design principles.
• Prerequisite programs for production equipment at thawing and precooking also require validating that the equipment is functioning as intended, which entails…◦ equipment survey◦ temperature distribution testing◦ calibration of temperature monitoring devices◦ preventive maintenance◦ periodic equipment inspections◦ heat penetration studies to develop processing schedules
http://www.fda.gov/Food/GuidanceRegulation/HACCP/ucm2006801.htm
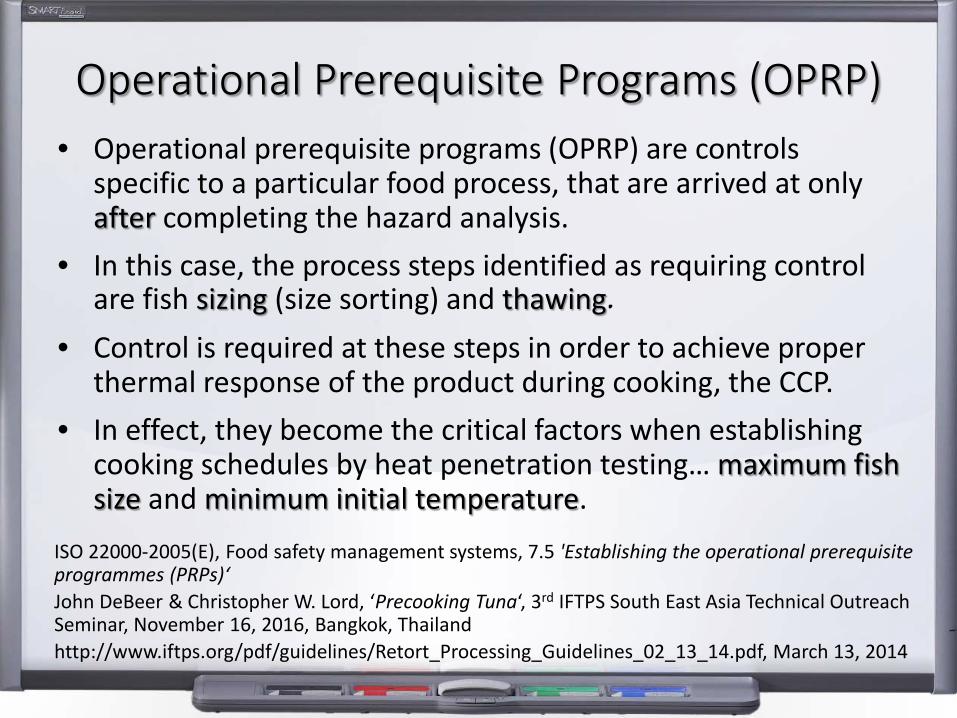
Operational Prerequisite Programs (OPRP)• Operational prerequisite programs (OPRP) are controls
specific to a particular food process, that are arrived at only after completing the hazard analysis.
• In this case, the process steps identified as requiring control are fish sizing (size sorting) and thawing.
• Control is required at these steps in order to achieve proper thermal response of the product during cooking, the CCP.
• In effect, they become the critical factors when establishing cooking schedules by heat penetration testing… maximum fish size and minimum initial temperature.
ISO 22000-2005(E), Food safety management systems, 7.5 'Establishing the operational prerequisite programmes (PRPs)‘John DeBeer & Christopher W. Lord, ‘Precooking Tuna‘, 3rd IFTPS South East Asia Technical Outreach Seminar, November 16, 2016, Bangkok, Thailandhttp://www.iftps.org/pdf/guidelines/Retort_Processing_Guidelines_02_13_14.pdf, March 13, 2014
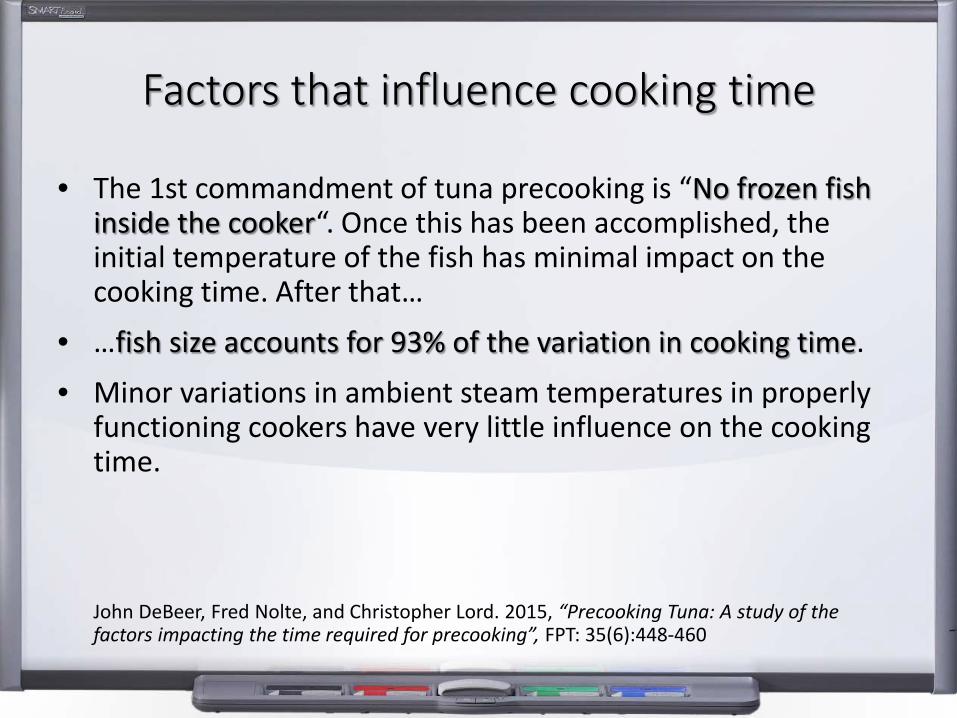
Factors that influence cooking time
• The 1st commandment of tuna precooking is “No frozen fish inside the cooker“. Once this has been accomplished, the initial temperature of the fish has minimal impact on the cooking time. After that…
• …fish size accounts for 93% of the variation in cooking time.
• Minor variations in ambient steam temperatures in properly functioning cookers have very little influence on the cooking time.
John DeBeer, Fred Nolte, and Christopher Lord. 2015, “Precooking Tuna: A study of the factors impacting the time required for precooking”, FPT: 35(6):448-460
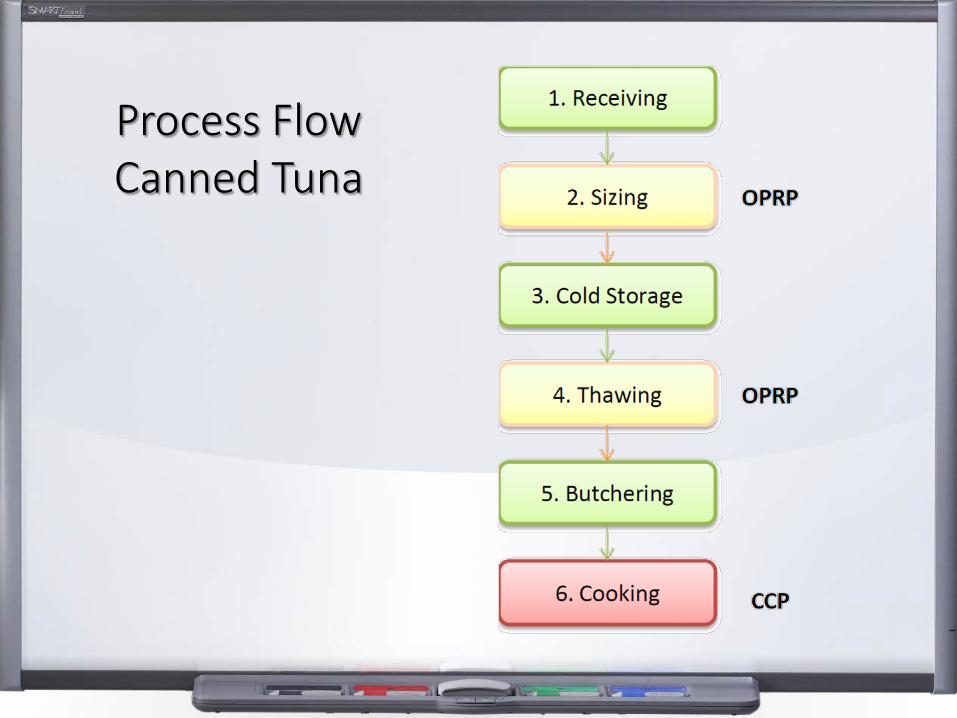
Process FlowCanned Tuna
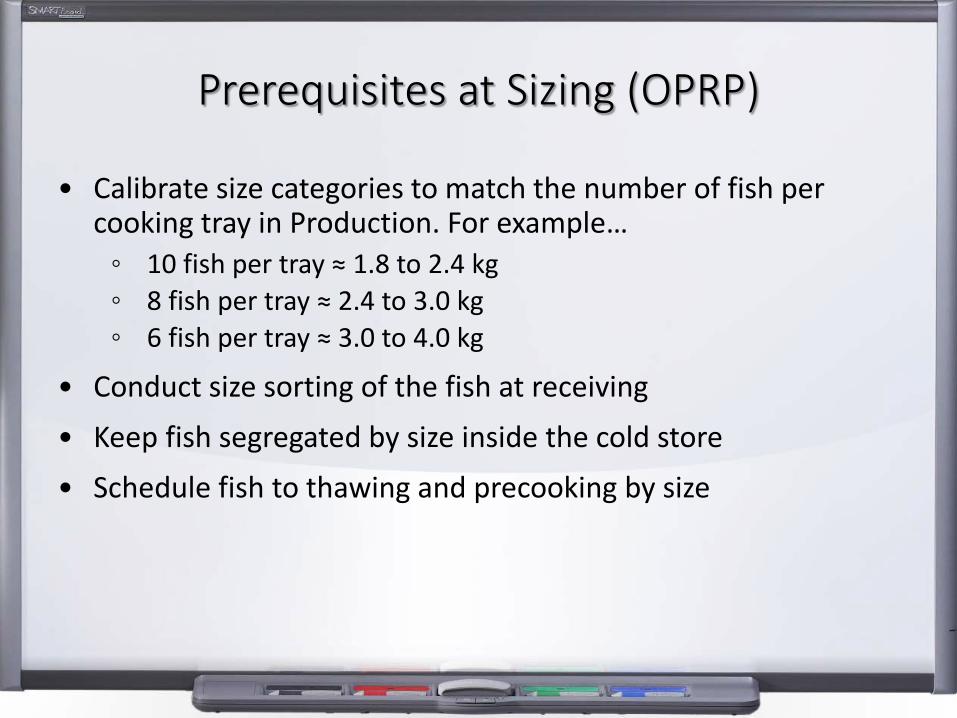
Prerequisites at Sizing (OPRP)
• Calibrate size categories to match the number of fish per cooking tray in Production. For example…
◦ 10 fish per tray ≈ 1.8 to 2.4 kg◦ 8 fish per tray ≈ 2.4 to 3.0 kg◦ 6 fish per tray ≈ 3.0 to 4.0 kg
• Conduct size sorting of the fish at receiving• Keep fish segregated by size inside the cold store
• Schedule fish to thawing and precooking by size
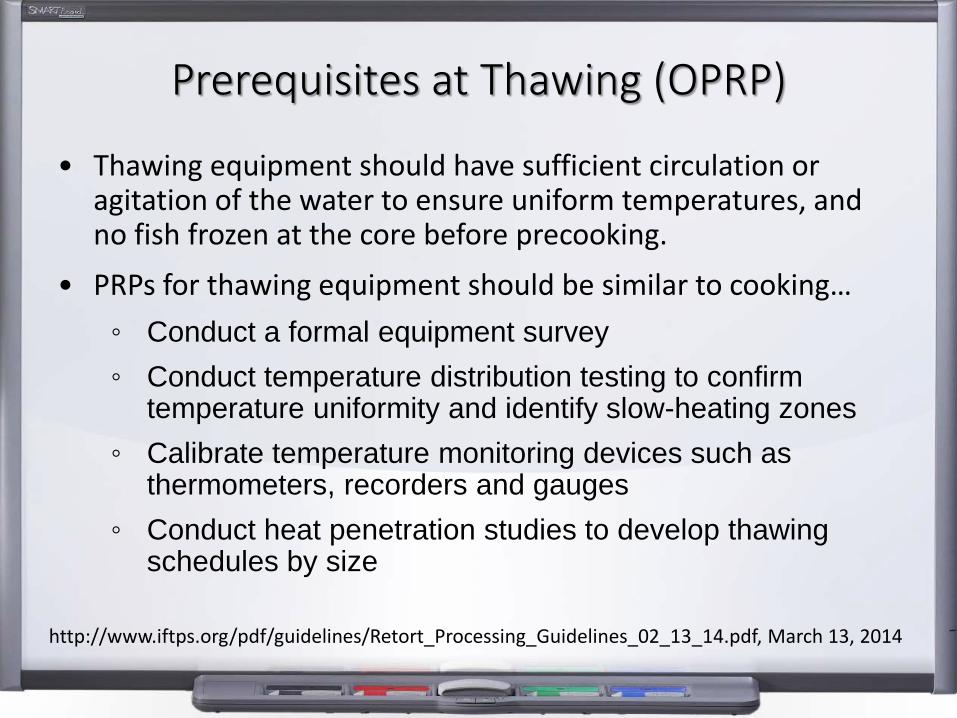
Prerequisites at Thawing (OPRP)
• Thawing equipment should have sufficient circulation or agitation of the water to ensure uniform temperatures, and no fish frozen at the core before precooking.
• PRPs for thawing equipment should be similar to cooking…◦ Conduct a formal equipment survey◦ Conduct temperature distribution testing to confirm
temperature uniformity and identify slow-heating zones◦ Calibrate temperature monitoring devices such as
thermometers, recorders and gauges◦ Conduct heat penetration studies to develop thawing
schedules by size
http://www.iftps.org/pdf/guidelines/Retort_Processing_Guidelines_02_13_14.pdf, March 13, 2014
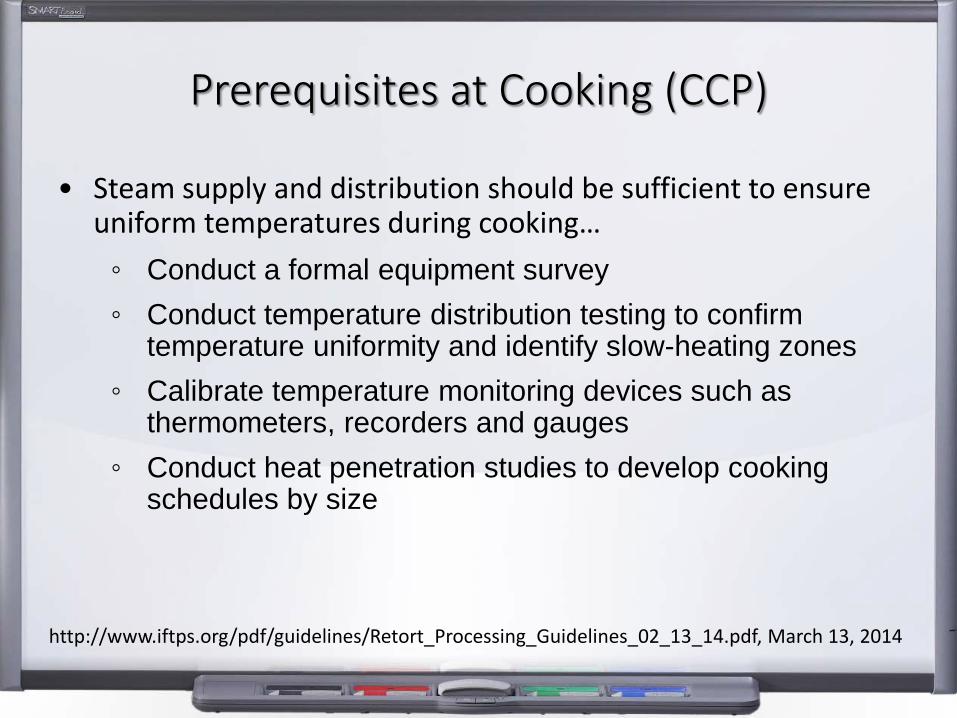
Prerequisites at Cooking (CCP)
• Steam supply and distribution should be sufficient to ensure uniform temperatures during cooking…◦ Conduct a formal equipment survey◦ Conduct temperature distribution testing to confirm
temperature uniformity and identify slow-heating zones◦ Calibrate temperature monitoring devices such as
thermometers, recorders and gauges◦ Conduct heat penetration studies to develop cooking
schedules by size
http://www.iftps.org/pdf/guidelines/Retort_Processing_Guidelines_02_13_14.pdf, March 13, 2014
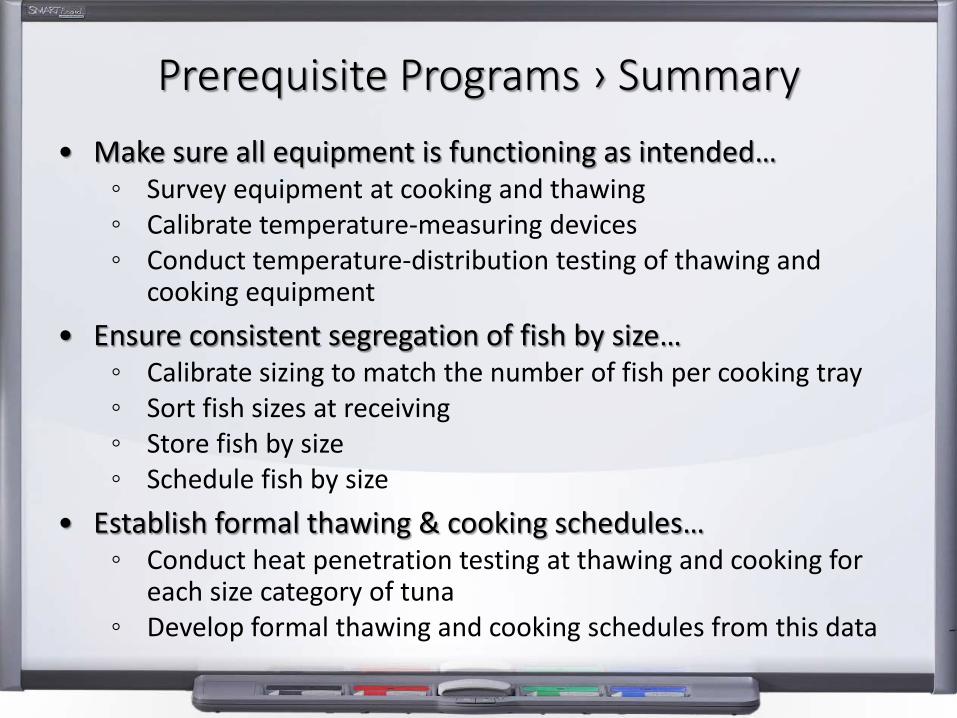
Prerequisite Programs › Summary• Make sure all equipment is functioning as intended…
◦ Survey equipment at cooking and thawing◦ Calibrate temperature-measuring devices◦ Conduct temperature-distribution testing of thawing and
cooking equipment• Ensure consistent segregation of fish by size…
◦ Calibrate sizing to match the number of fish per cooking tray◦ Sort fish sizes at receiving◦ Store fish by size◦ Schedule fish by size
• Establish formal thawing & cooking schedules…◦ Conduct heat penetration testing at thawing and cooking for
each size category of tuna◦ Develop formal thawing and cooking schedules from this data
CONTROL MEASURES“Monitoring control of the hazard”
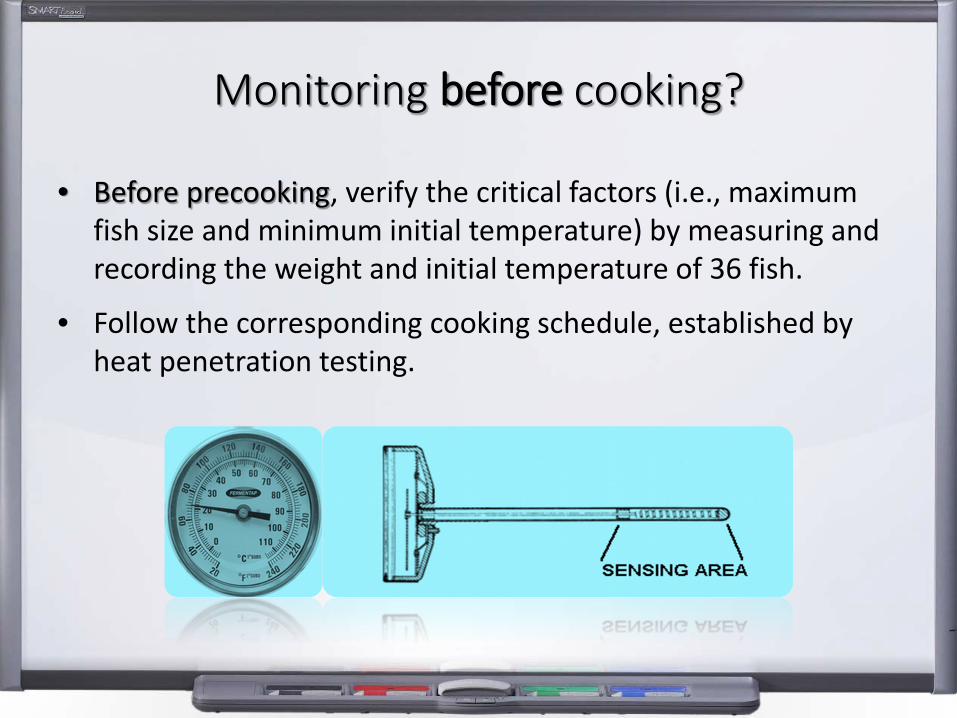
Monitoring before cooking?
• Before precooking, verify the critical factors (i.e., maximum fish size and minimum initial temperature) by measuring and recording the weight and initial temperature of 36 fish.
• Follow the corresponding cooking schedule, established by heat penetration testing.
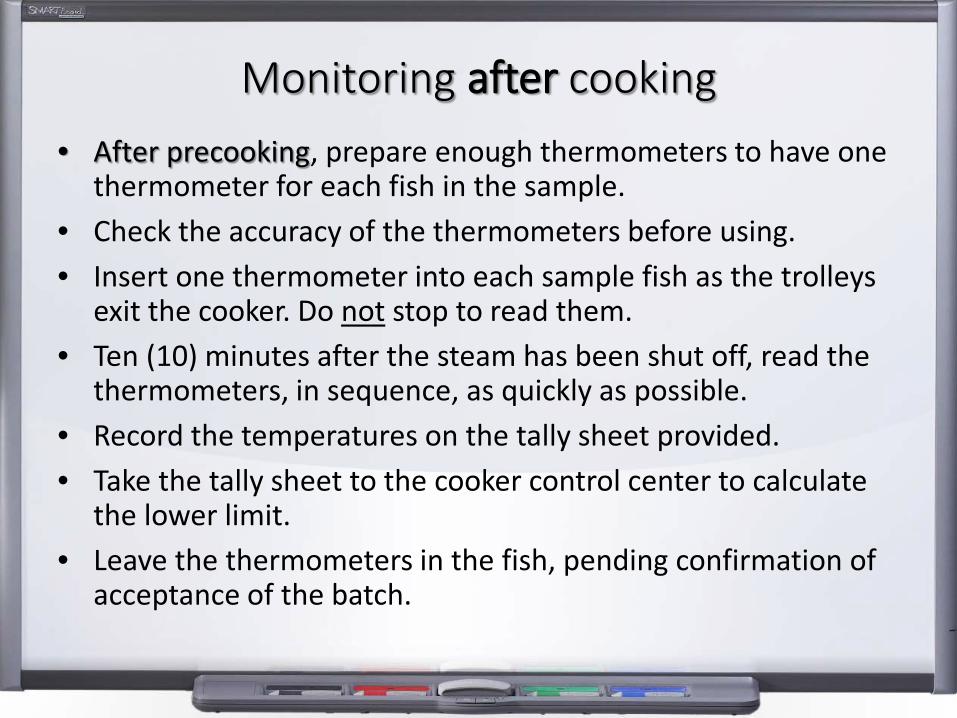
Monitoring after cooking• After precooking, prepare enough thermometers to have one
thermometer for each fish in the sample.• Check the accuracy of the thermometers before using.• Insert one thermometer into each sample fish as the trolleys
exit the cooker. Do not stop to read them.• Ten (10) minutes after the steam has been shut off, read the
thermometers, in sequence, as quickly as possible.• Record the temperatures on the tally sheet provided.• Take the tally sheet to the cooker control center to calculate
the lower limit.• Leave the thermometers in the fish, pending confirmation of
acceptance of the batch.
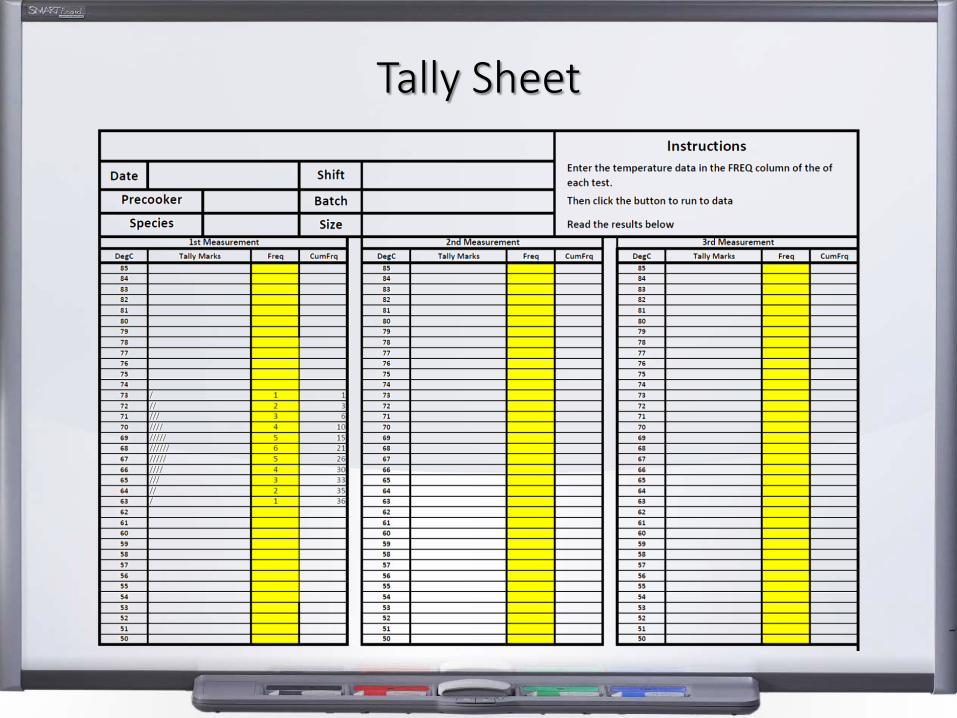
Tally Sheet
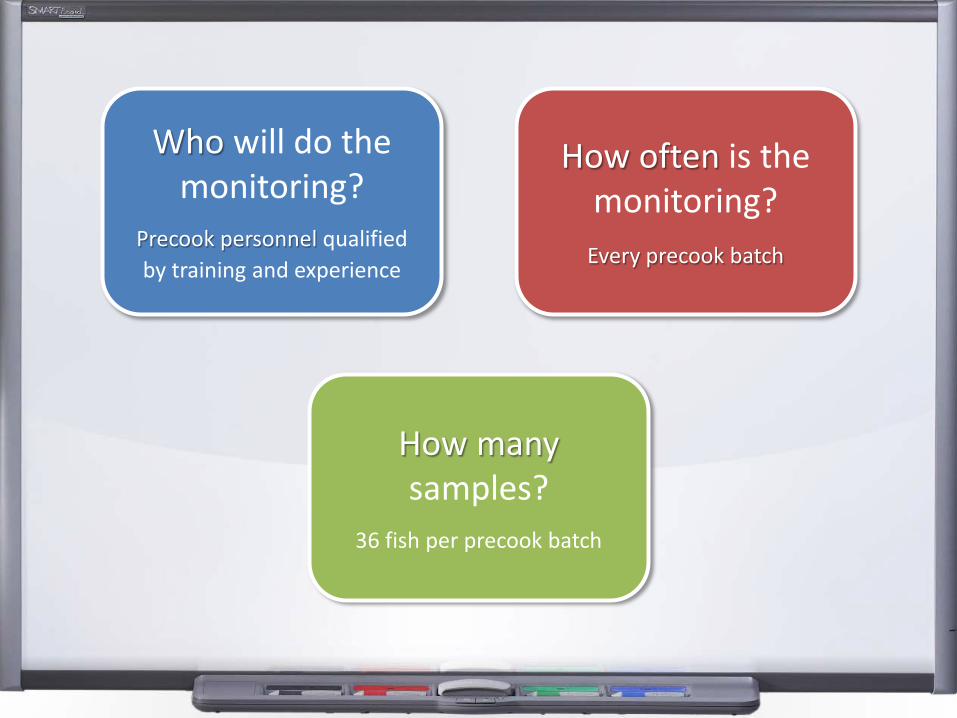
How manysamples?
36 fish per precook batch
Who will do the monitoring?
Precook personnel qualified by training and experience
How often is the monitoring?
Every precook batch
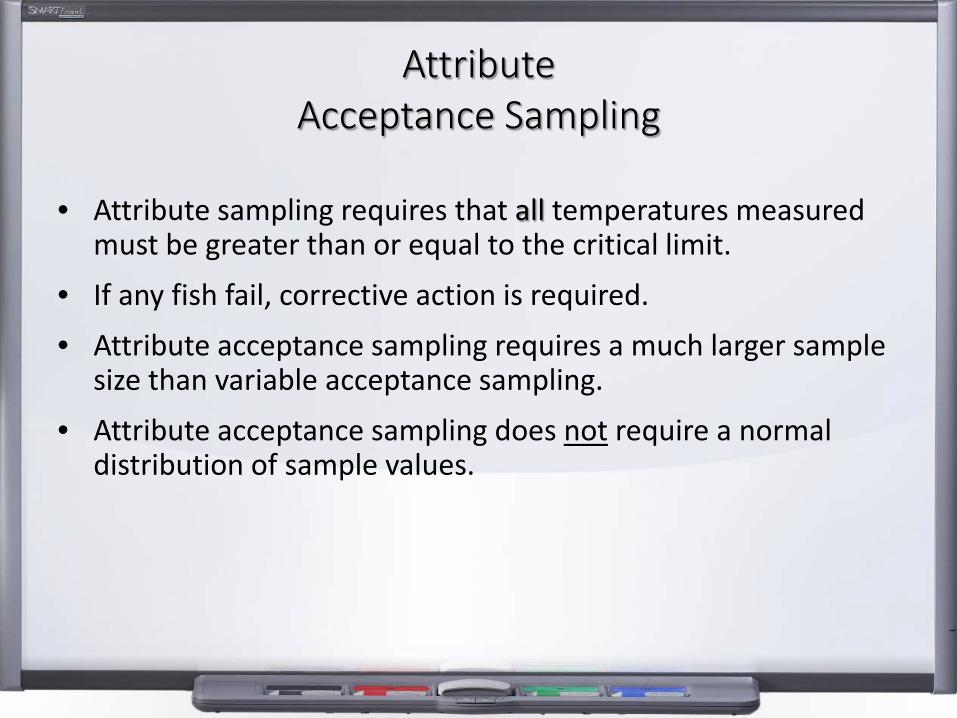
AttributeAcceptance Sampling
• Attribute sampling requires that all temperatures measured must be greater than or equal to the critical limit.
• If any fish fail, corrective action is required.• Attribute acceptance sampling requires a much larger sample
size than variable acceptance sampling.• Attribute acceptance sampling does not require a normal
distribution of sample values.
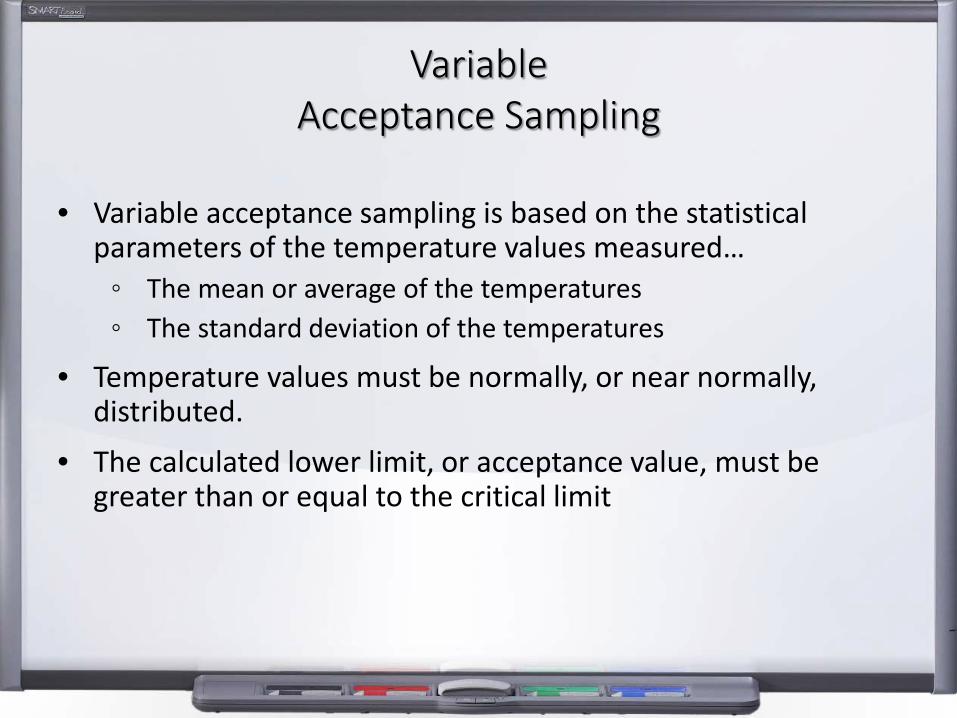
Variable Acceptance Sampling
• Variable acceptance sampling is based on the statistical parameters of the temperature values measured…
◦ The mean or average of the temperatures◦ The standard deviation of the temperatures
• Temperature values must be normally, or near normally, distributed.
• The calculated lower limit, or acceptance value, must be greater than or equal to the critical limit
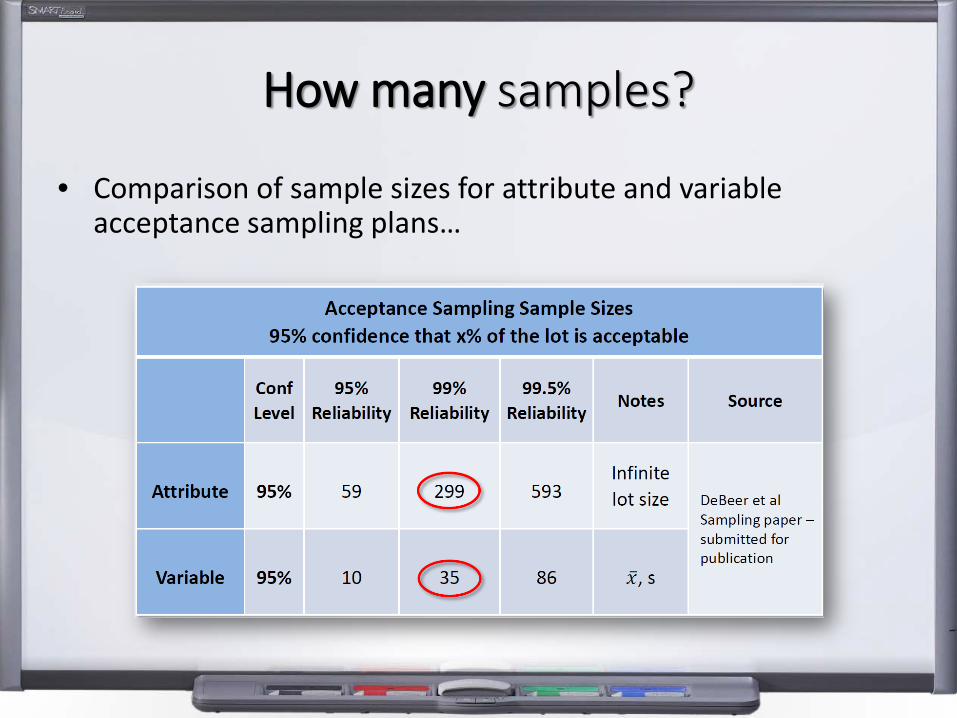
How many samples?
• Comparison of sample sizes for attribute and variable acceptance sampling plans…
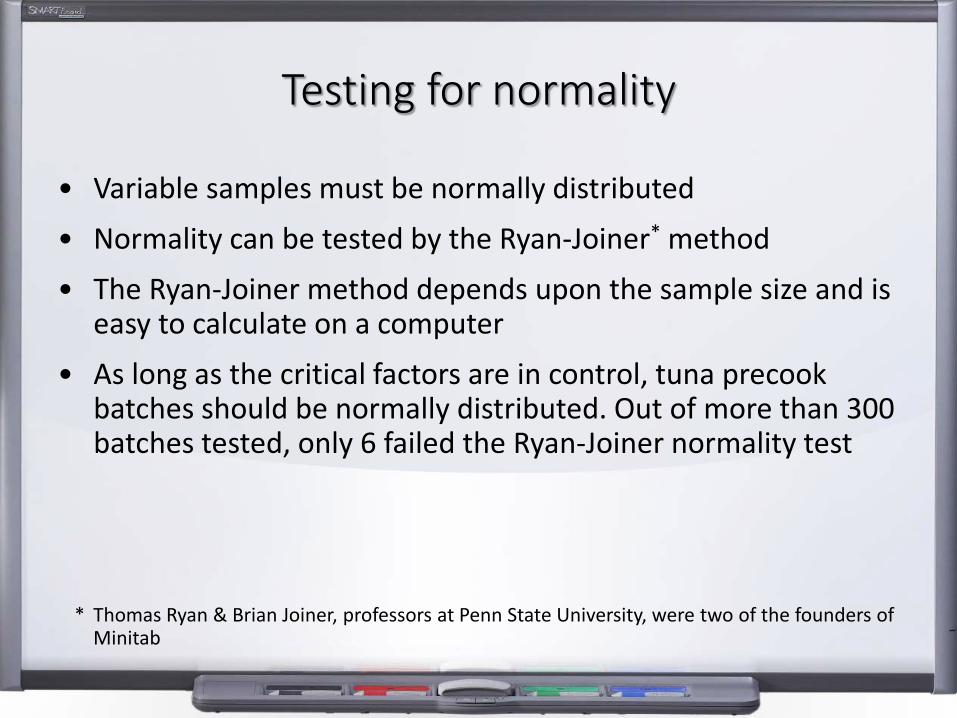
Testing for normality
• Variable samples must be normally distributed• Normality can be tested by the Ryan-Joiner* method
• The Ryan-Joiner method depends upon the sample size and is easy to calculate on a computer
• As long as the critical factors are in control, tuna precook batches should be normally distributed. Out of more than 300 batches tested, only 6 failed the Ryan-Joiner normality test
* Thomas Ryan & Brian Joiner, professors at Penn State University, were two of the founders of Minitab
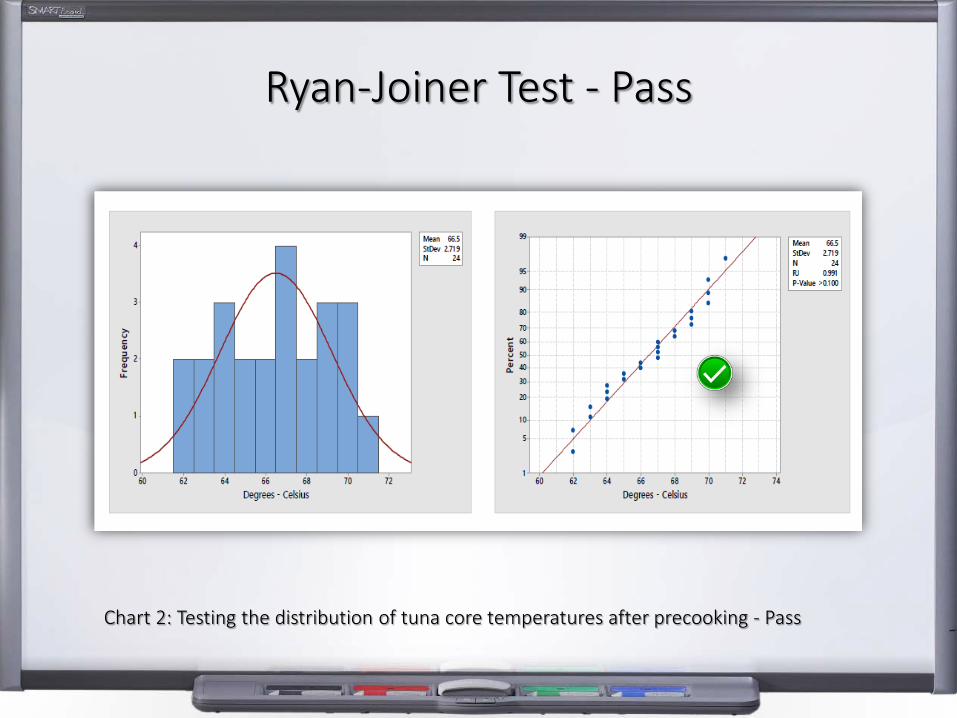
Ryan-Joiner Test - Pass
Chart 2: Testing the distribution of tuna core temperatures after precooking - Pass
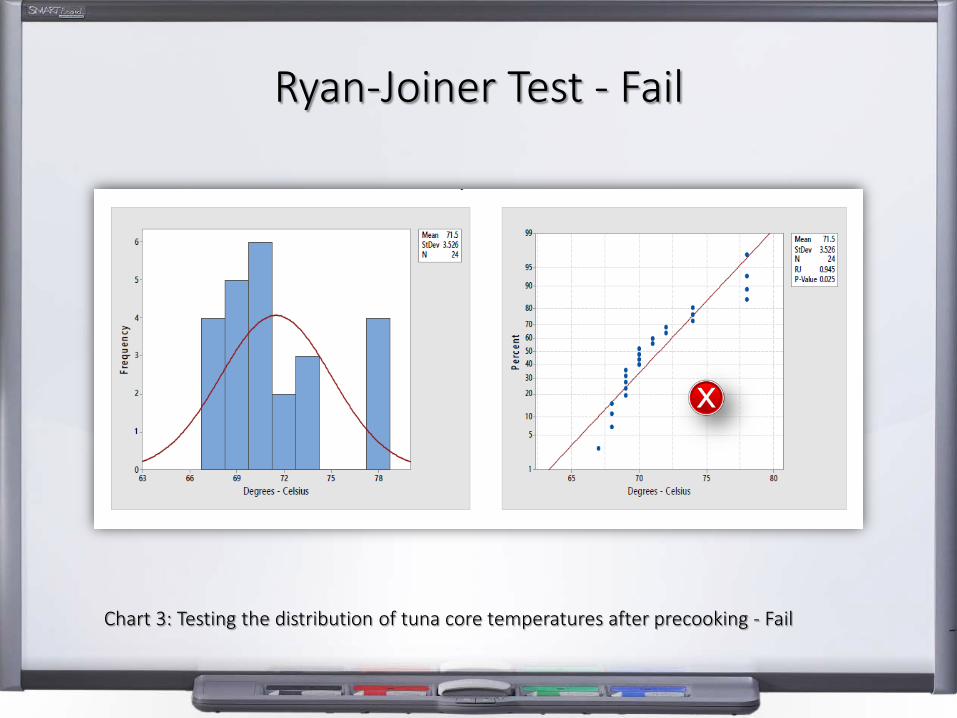
Ryan-Joiner Test - Fail
Chart 3: Testing the distribution of tuna core temperatures after precooking - Fail
Non-Normal Distribution
• If the sample fails the Ryan-Joiner test for normality after cooking…
– Revert to an attribute sampling plan with a sample size of 299 fish, or…
– Return the fish to the cooker for further cooking and then resampling.
Sampling › Summary
• This control strategy follows a variable acceptance sampling plan with 95% confidence and 99% reliability.
• The sample size is 36 fish from every precook batch.
• The distribution of temperatures from each batch is tested for normality using the Ryan-Joiner test.
Control Measures
The control measure in this control strategy is measuring fish core temperatures after precooking
CRITICAL LIMIT“How much cooking is enough?”
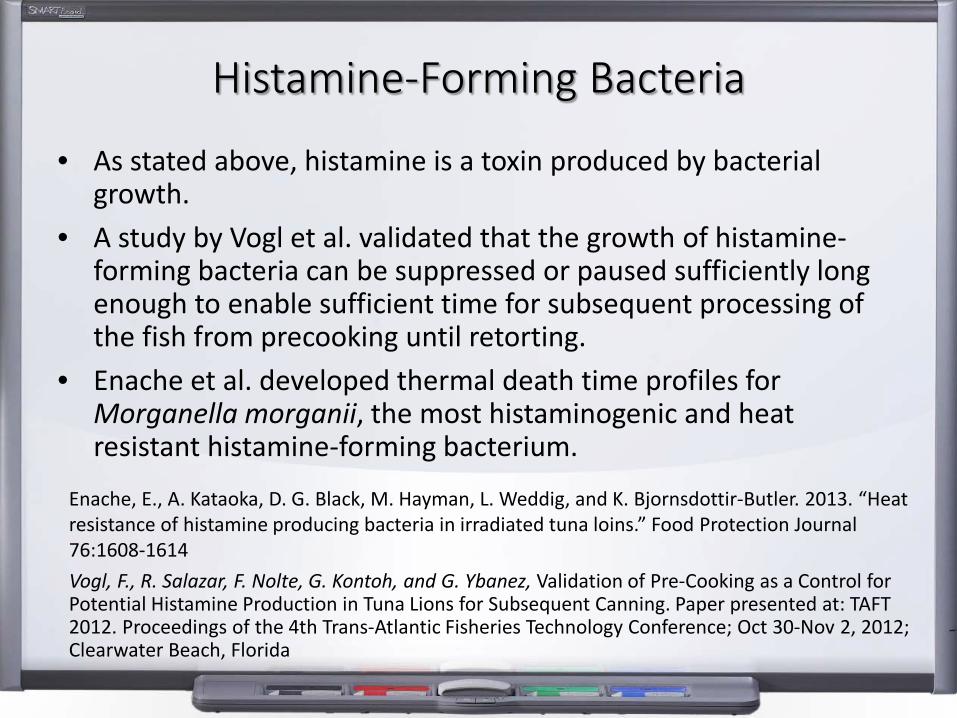
Histamine-Forming Bacteria
• As stated above, histamine is a toxin produced by bacterial growth.
• A study by Vogl et al. validated that the growth of histamine-forming bacteria can be suppressed or paused sufficiently long enough to enable sufficient time for subsequent processing of the fish from precooking until retorting.
• Enache et al. developed thermal death time profiles for Morganella morganii, the most histaminogenic and heat resistant histamine-forming bacterium.
Enache, E., A. Kataoka, D. G. Black, M. Hayman, L. Weddig, and K. Bjornsdottir-Butler. 2013. “Heat resistance of histamine producing bacteria in irradiated tuna loins.” Food Protection Journal 76:1608-1614Vogl, F., R. Salazar, F. Nolte, G. Kontoh, and G. Ybanez, Validation of Pre-Cooking as a Control for Potential Histamine Production in Tuna Lions for Subsequent Canning. Paper presented at: TAFT 2012. Proceedings of the 4th Trans-Atlantic Fisheries Technology Conference; Oct 30-Nov 2, 2012; Clearwater Beach, Florida
EPIPT
• Based on these studies, Nolte et al. developed a technique validating that a 60°C End Point Internal Product Temperature (EPIPT) was sufficient to reduce the M. morganii population by 5 logs.
• With this technique, tuna processors are able to use precooking, with proper heating temperatures and times, as a critical control point to extend FDA’s 12-hour time limit.
Nolte, Fred, D. Glenn Black, John DeBeer, Elena Enache. 2014. 'Use of end point internal product temperature to control histamine formation in tuna at pre-cooking step'. Food Protection Trends. 03/2014. 34:94-100
Critical Limit
• The National Fisheries Institute’s Tuna Council, “HACCP Guidance for Canned Tuna” followed suit by recommending a minimum 60° C pre-cooker exit fish core temperature to provide at least 12 hours from the end of pre-cooking to the start of retorting without histamine formation.
• In addition, the work of Kanki et al. (2007) indicated that the activity of the enzyme histidine decarboxylase is substantially reduced at 60° C.
National Fisheries Institute’s Tuna Council. 2013. HACCP Guidance for Canned Tuna, 1st
edition, pre-release. CCP3: Precooking. Pg. 6-30.Masashi Kanki, Tomoko Yoda, Teizo Tsukamoto, and Eiichiroh Baba. 2012. Histidine Decarboxylases and Their Role in Accumulation of Histamine in Tuna and Dried Saury. Applied and Environmental Microbiology, Mar. 2007, Vol. 73, No. 5, 0099-2240/07
Lower Limit
• As previously stated, variable acceptance sampling is based on the statistical parameters of the temperature values measured…
◦ The mean or average of the temperatures◦ The standard deviation of the temperatures
• The lower limit is defined as the mean minus 3 standard deviations:
Calculated lower limit = [ x̅ - (3 x Std Dev) ]
• If all core temperatures and the lower limit are ≥ 60˚C, the batch is deemed to be acceptable.
Acceptance Value - Examples
• Example 1: The average of the temperature values is 70˚C, with a standard deviation of ± 3.0˚C
◦ Lower limit = 70˚C - (3.0˚C x 3) = 61˚C
• Example 2: The average of the temperature values is 65˚C , with a standard deviation of ± 2.5˚C
◦ Lower limit = 65˚C - (2.5˚C x 3) = 57.5˚C• The batch in example 1 would be acceptable, while the batch
in example 2 would require corrective action.
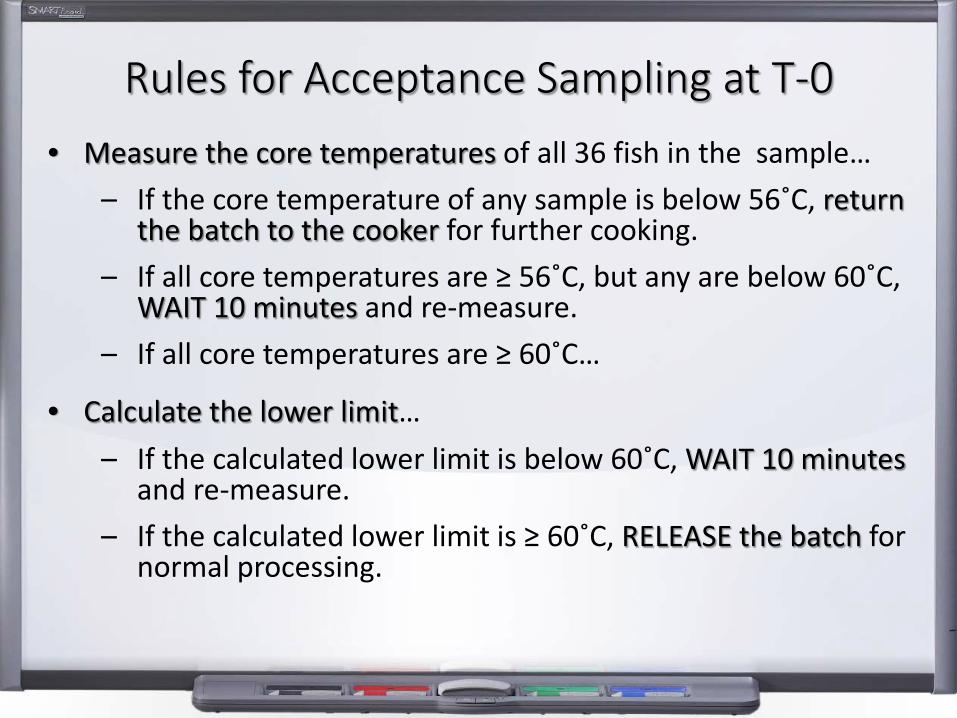
Rules for Acceptance Sampling at T-0• Measure the core temperatures of all 36 fish in the sample…
– If the core temperature of any sample is below 56˚C, return the batch to the cooker for further cooking.
– If all core temperatures are ≥ 56˚C, but any are below 60˚C, WAIT 10 minutes and re-measure.
– If all core temperatures are ≥ 60˚C…
• Calculate the lower limit…– If the calculated lower limit is below 60˚C, WAIT 10 minutes
and re-measure.– If the calculated lower limit is ≥ 60˚C, RELEASE the batch for
normal processing.
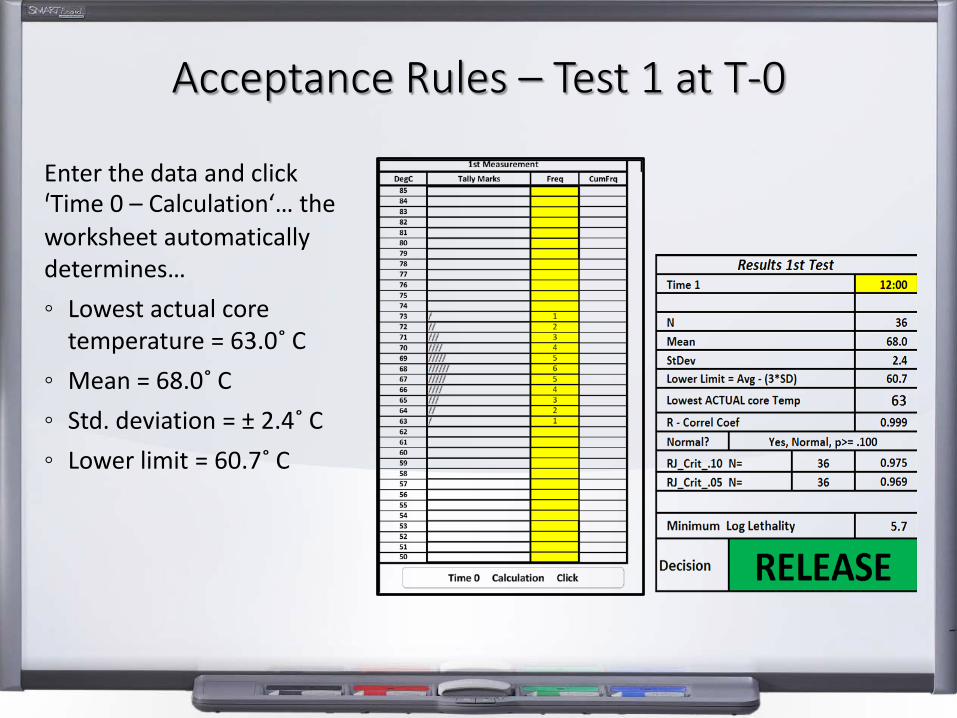
Acceptance Rules – Test 1 at T-0
Enter the data and click 'Time 0 – Calculation‘… the worksheet automatically determines…◦ Lowest actual core
temperature = 63.0˚ C◦ Mean = 68.0˚ C◦ Std. deviation = ± 2.4˚ C◦ Lower limit = 60.7˚ C
Disposition – Test 1
• In this case, all core temperatures and the Lower Limit were ≥ 60.0˚C, so the worksheet determined that the disposition of the batch was RELEASE.
• What if the lower limit was below 60.0˚C?• Let’s look at another example…
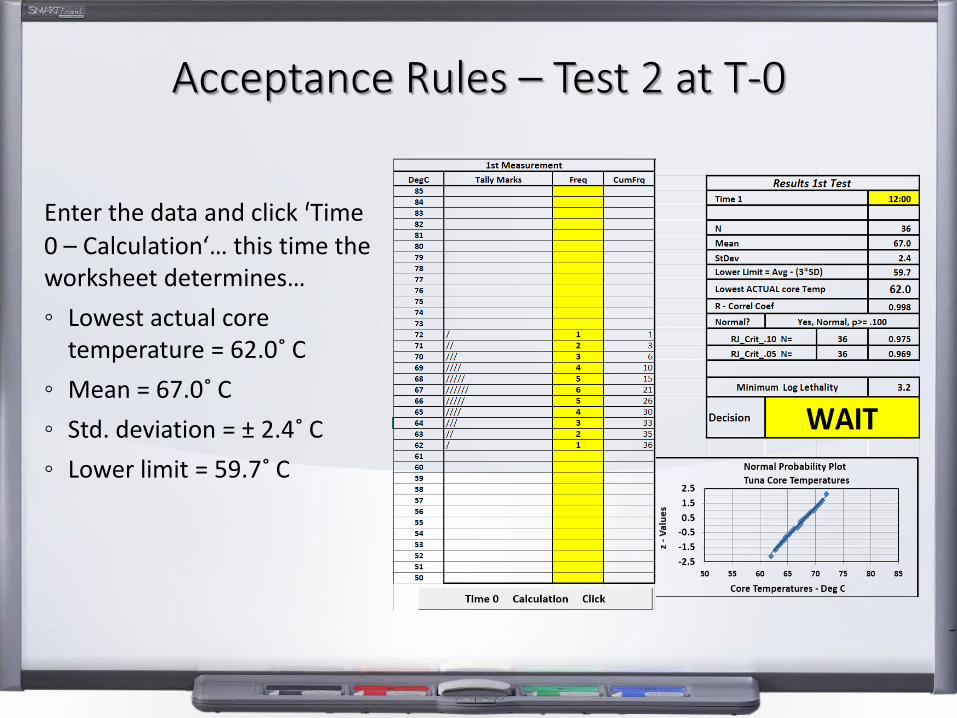
Acceptance Rules – Test 2 at T-0
Enter the data and click 'Time 0 – Calculation‘… this time the worksheet determines…◦ Lowest actual core
temperature = 62.0˚ C◦ Mean = 67.0˚ C◦ Std. deviation = ± 2.4˚ C◦ Lower limit = 59.7˚ C
Disposition – Test 2
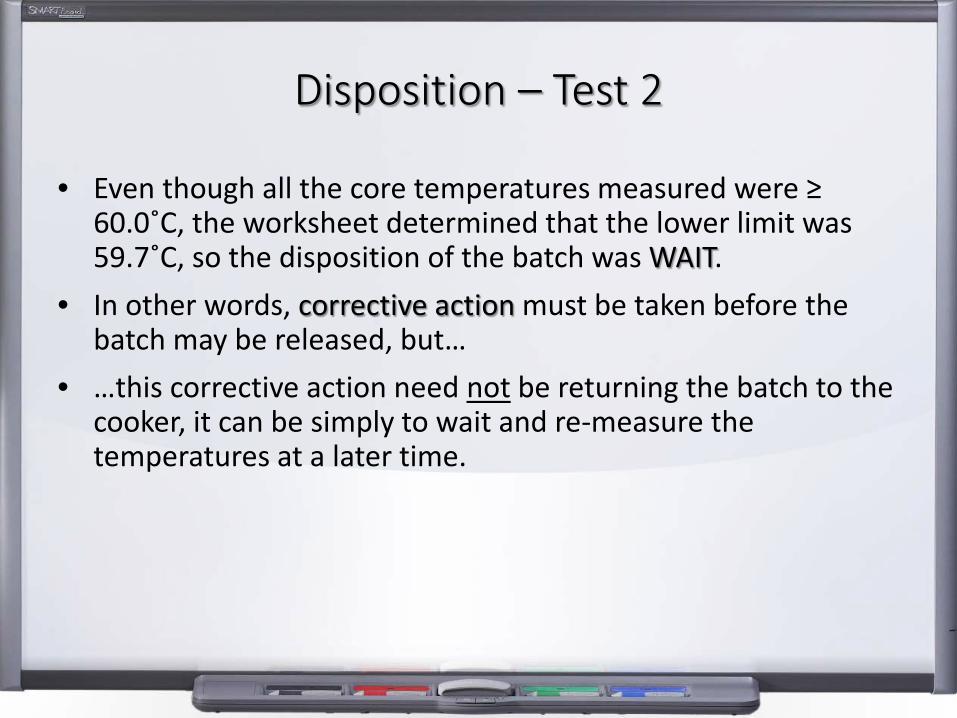
• Even though all the core temperatures measured were ≥ 60.0˚C, the worksheet determined that the lower limit was 59.7˚C, so the disposition of the batch was WAIT.
• In other words, corrective action must be taken before the batch may be released, but…
• …this corrective action need not be returning the batch to the cooker, it can be simply to wait and re-measure the temperatures at a later time.
Critical Limit
The critical limit in this control strategy is all core temperatures and the calculated lower limit must be ≥ 60˚C after precooking

CORRECTIVE ACTION“What if the batch fails?”
Proposed rules for Acceptance Sampling at T-10
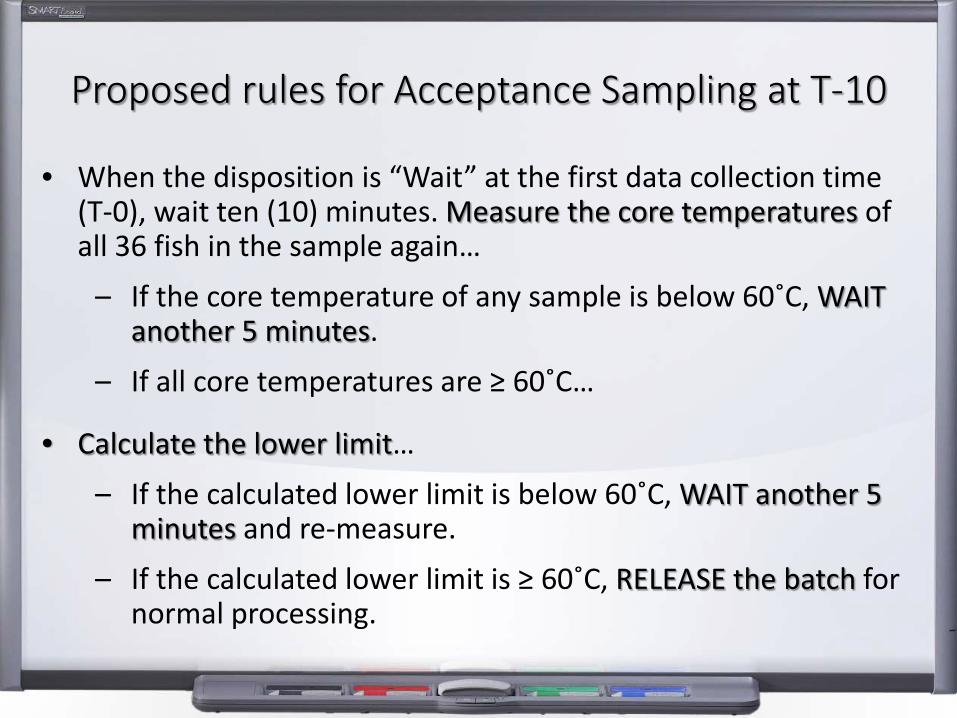
• When the disposition is “Wait” at the first data collection time (T-0), wait ten (10) minutes. Measure the core temperatures of all 36 fish in the sample again…
– If the core temperature of any sample is below 60˚C, WAIT another 5 minutes.
– If all core temperatures are ≥ 60˚C…
• Calculate the lower limit…– If the calculated lower limit is below 60˚C, WAIT another 5
minutes and re-measure.
– If the calculated lower limit is ≥ 60˚C, RELEASE the batch for normal processing.
Acceptance Rules at T-10
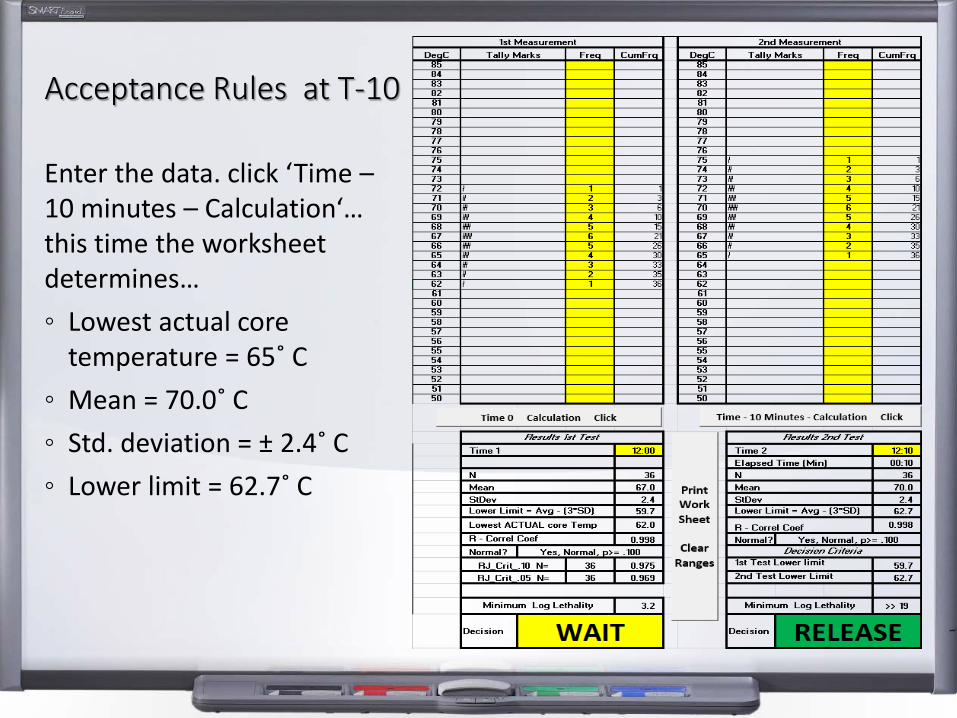
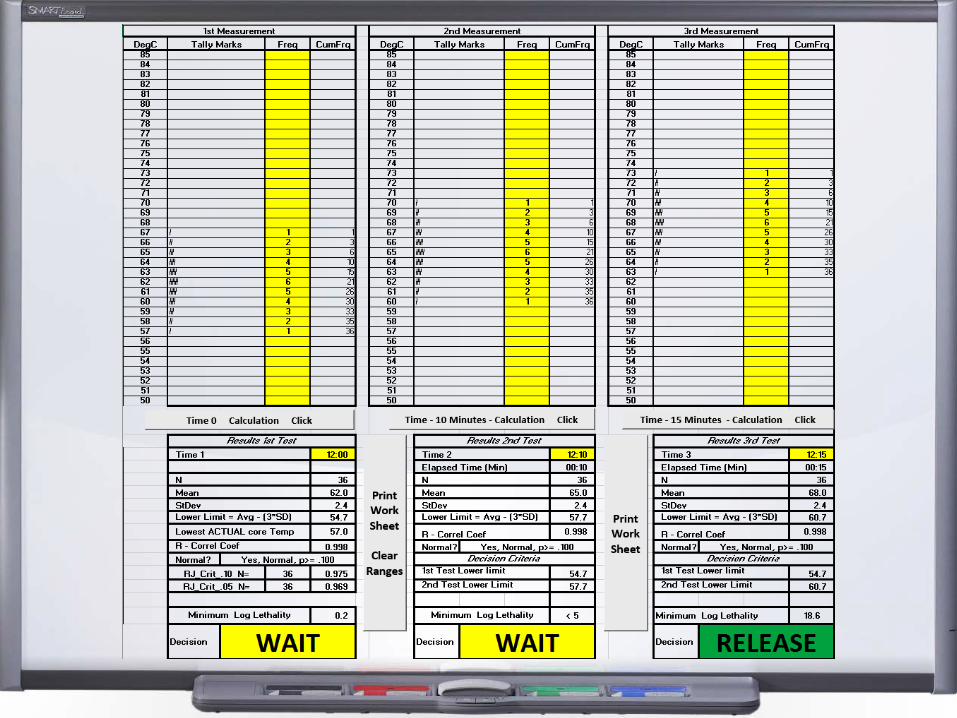
Enter the data. click ‘Time –10 minutes – Calculation‘… this time the worksheet determines…◦ Lowest actual core
temperature = 65˚ C◦ Mean = 70.0˚ C◦ Std. deviation = ± 2.4˚ C◦ Lower limit = 62.7˚ C
Disposition at T-10
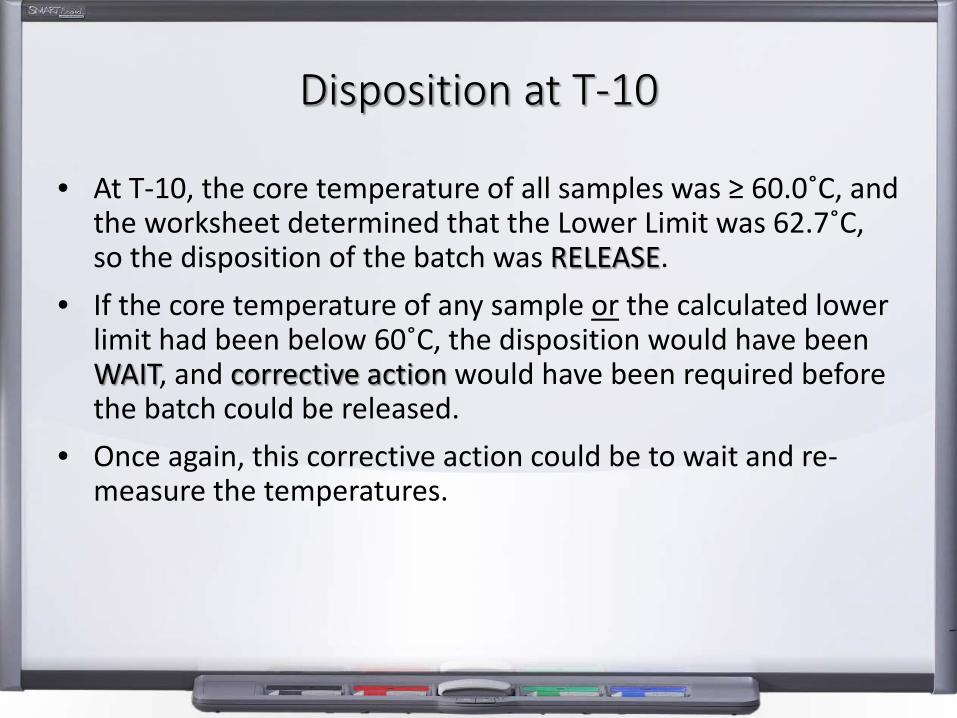
• At T-10, the core temperature of all samples was ≥ 60.0˚C, andthe worksheet determined that the Lower Limit was 62.7˚C, so the disposition of the batch was RELEASE.
• If the core temperature of any sample or the calculated lower limit had been below 60˚C, the disposition would have been WAIT, and corrective action would have been required before the batch could be released.
• Once again, this corrective action could be to wait and re-measure the temperatures.
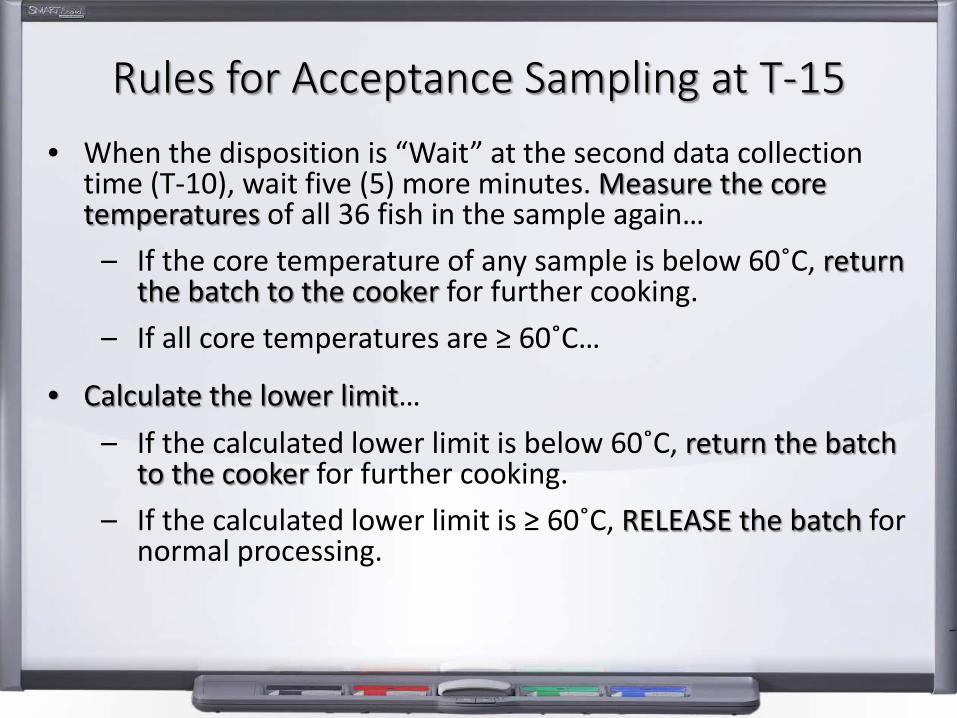
Rules for Acceptance Sampling at T-15• When the disposition is “Wait” at the second data collection
time (T-10), wait five (5) more minutes. Measure the core temperatures of all 36 fish in the sample again…
– If the core temperature of any sample is below 60˚C, return the batch to the cooker for further cooking.
– If all core temperatures are ≥ 60˚C…
• Calculate the lower limit…– If the calculated lower limit is below 60˚C, return the batch
to the cooker for further cooking.– If the calculated lower limit is ≥ 60˚C, RELEASE the batch for
normal processing.
Disposition at T-15
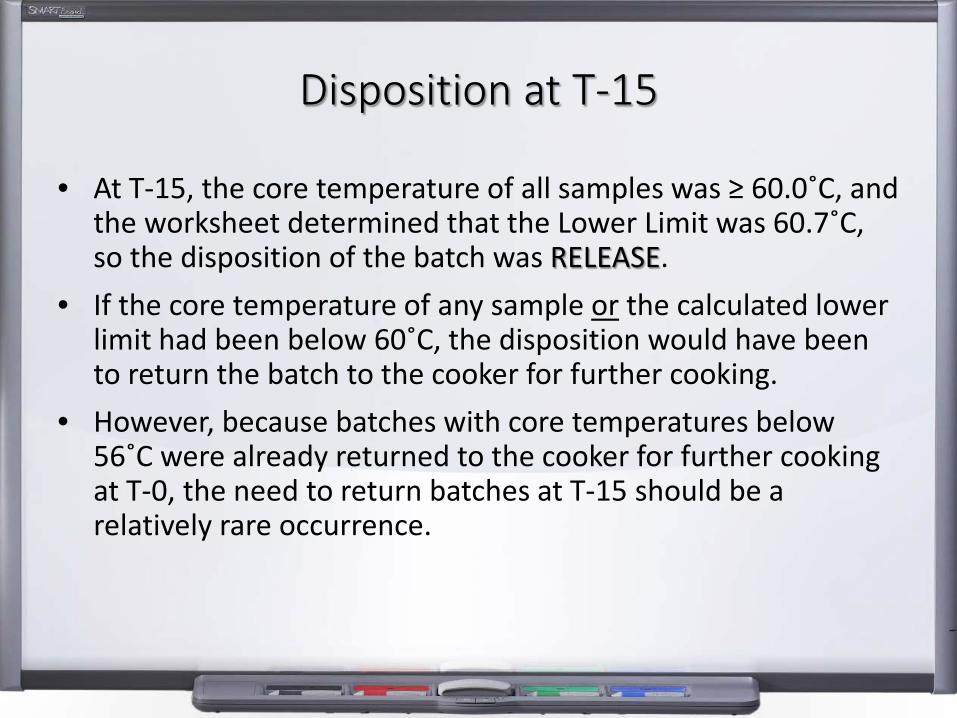
• At T-15, the core temperature of all samples was ≥ 60.0˚C, andthe worksheet determined that the Lower Limit was 60.7˚C, so the disposition of the batch was RELEASE.
• If the core temperature of any sample or the calculated lower limit had been below 60˚C, the disposition would have been to return the batch to the cooker for further cooking.
• However, because batches with core temperatures below 56˚C were already returned to the cooker for further cooking at T-0, the need to return batches at T-15 should be a relatively rare occurrence.
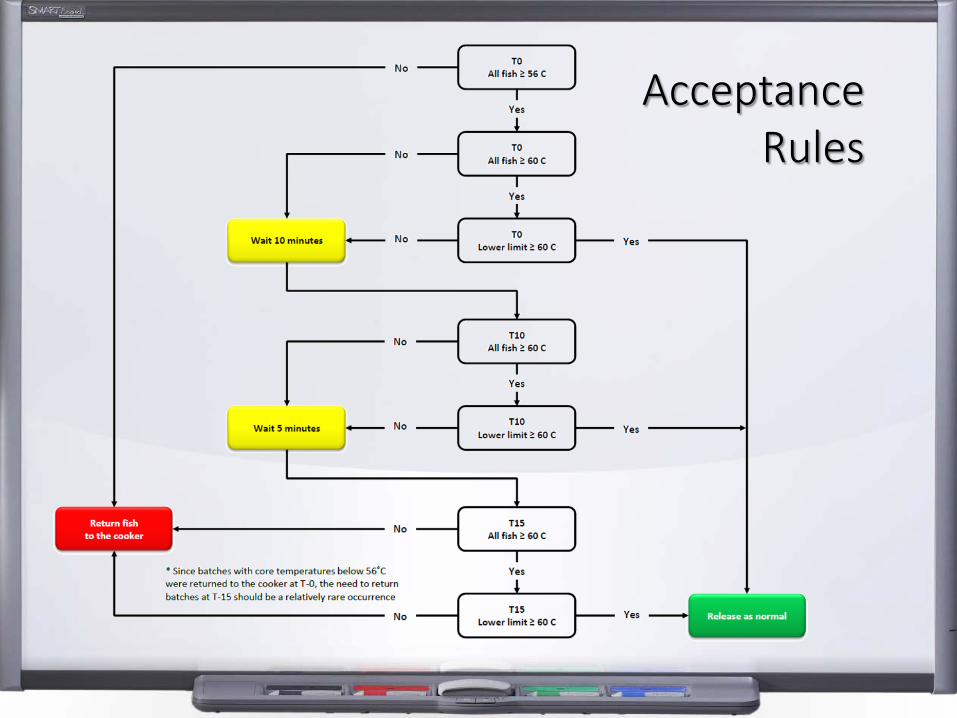
Acceptance Rules
Corrective Action
Corrective actions in this control strategy are…• Wait until all core temperatures and
the calculated lower limit are ≥ 60˚C after precooking, or…
• Return the batch to the cooker for further cooking
VERIFICATION“Did the cook achieve what was intended?”

Thermal Death Times
• Nolte et al. developed a linear heating and cooling model was to determine a critical limit for precooking tuna, in order to achieve a 5-log reduction of the most prolific histamine-forming bacterium, M. morganii.
• The thermal death time values used in a General Method calculation employed the Trapezoidal rule, where D60˚C of 0.26m and z = 4.1˚C.
Nolte, Fred, D. Glenn Black, John DeBeer, Elena Enache. 2014. 'Use of end point internal product temperature to control histamine formation in tuna at pre-cooking step'. Food Protection Trends. 03/2014. 34:94-100
Measuring Heat Resistance
• Bacterial heat resistance is measured in D and z values and is specific to an organism
• The D value is the number of minutes at a specific temperature which reduces a population of a specific bacterial organism by 90%, or one log cycle
• The z-value is the number of degrees change which will result in a 10-fold difference in the D value
• Enache et al’s results of the heat resistance studies of M. morganii…
D 60˚C of M. morganii = 0.26 minz value = 4.1˚C
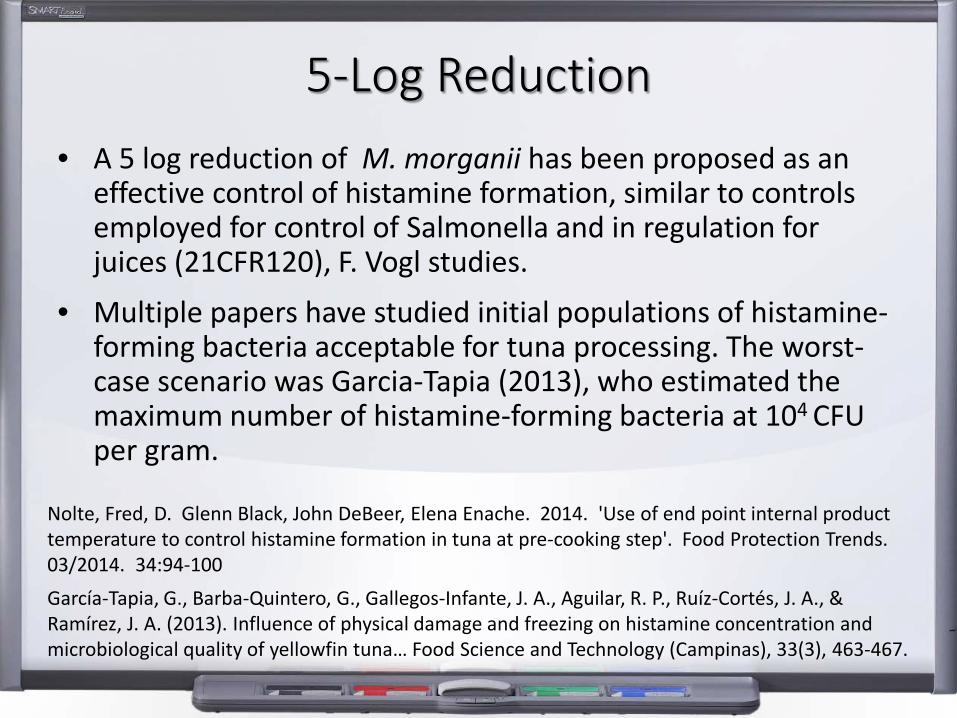
5-Log Reduction• A 5 log reduction of M. morganii has been proposed as an
effective control of histamine formation, similar to controls employed for control of Salmonella and in regulation for juices (21CFR120), F. Vogl studies.
• Multiple papers have studied initial populations of histamine-forming bacteria acceptable for tuna processing. The worst-case scenario was Garcia-Tapia (2013), who estimated the maximum number of histamine-forming bacteria at 104 CFU per gram.
Nolte, Fred, D. Glenn Black, John DeBeer, Elena Enache. 2014. 'Use of end point internal product temperature to control histamine formation in tuna at pre-cooking step'. Food Protection Trends. 03/2014. 34:94-100García-Tapia, G., Barba-Quintero, G., Gallegos-Infante, J. A., Aguilar, R. P., Ruíz-Cortés, J. A., & Ramírez, J. A. (2013). Influence of physical damage and freezing on histamine concentration and microbiological quality of yellowfin tuna… Food Science and Technology (Campinas), 33(3), 463-467.
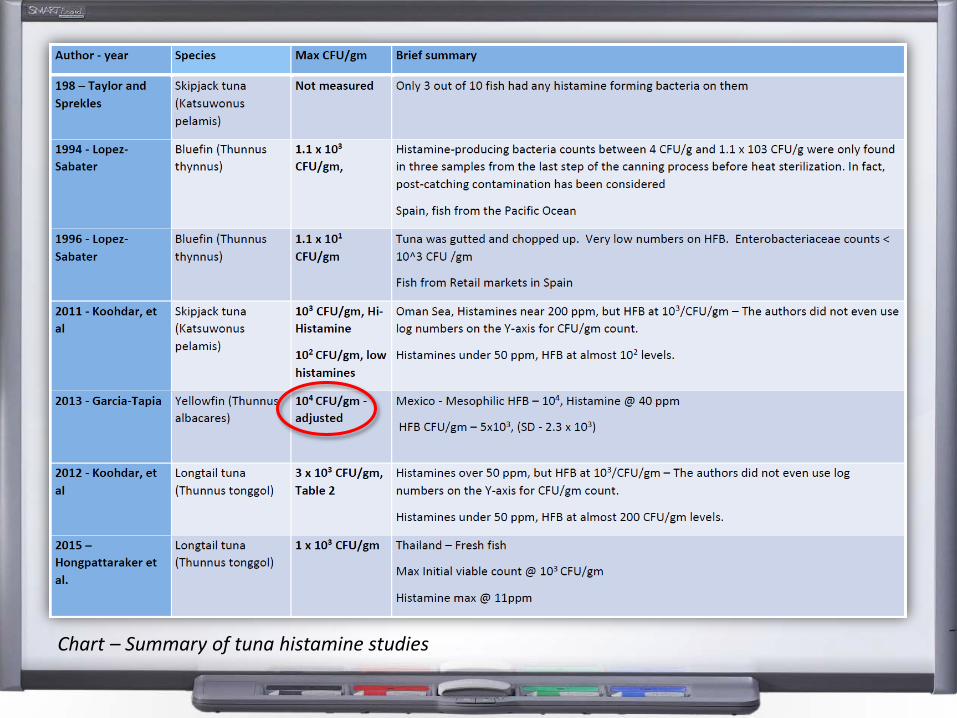
Chart – Summary of tuna histamine studies
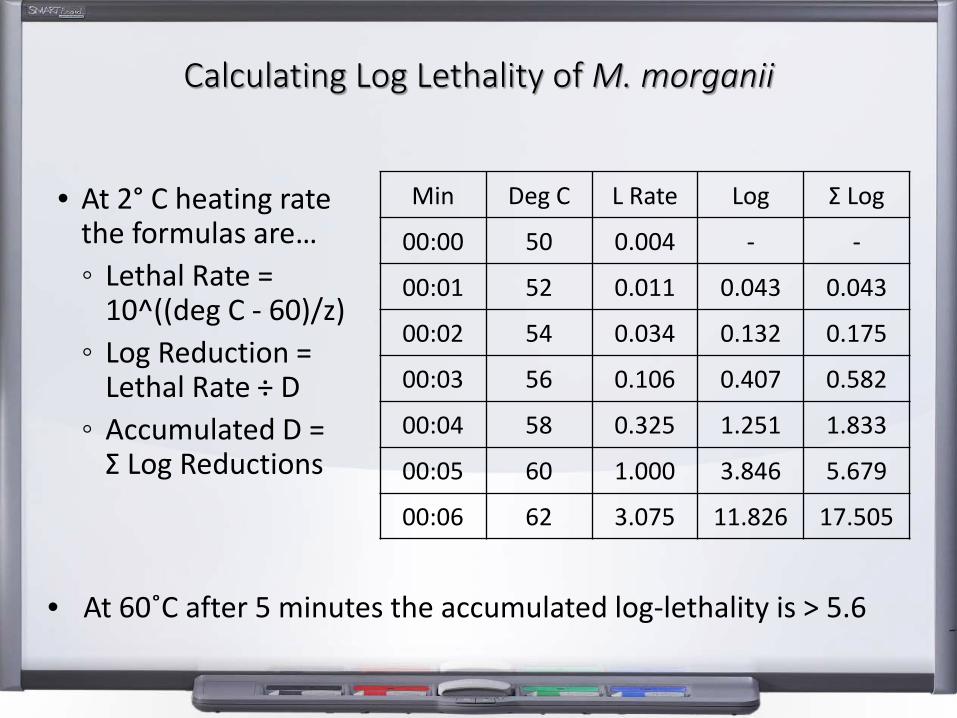
Calculating Log Lethality of M. morganii
Min Deg C L Rate Log Σ Log
00:00 50 0.004 - -
00:01 52 0.011 0.043 0.043
00:02 54 0.034 0.132 0.175
00:03 56 0.106 0.407 0.582
00:04 58 0.325 1.251 1.833
00:05 60 1.000 3.846 5.679
00:06 62 3.075 11.826 17.505
• At 2° C heating ratethe formulas are…◦ Lethal Rate =
10^((deg C - 60)/z)◦ Log Reduction =
Lethal Rate ÷ D◦ Accumulated D =
Σ Log Reductions
• At 60˚C after 5 minutes the accumulated log-lethality is > 5.6
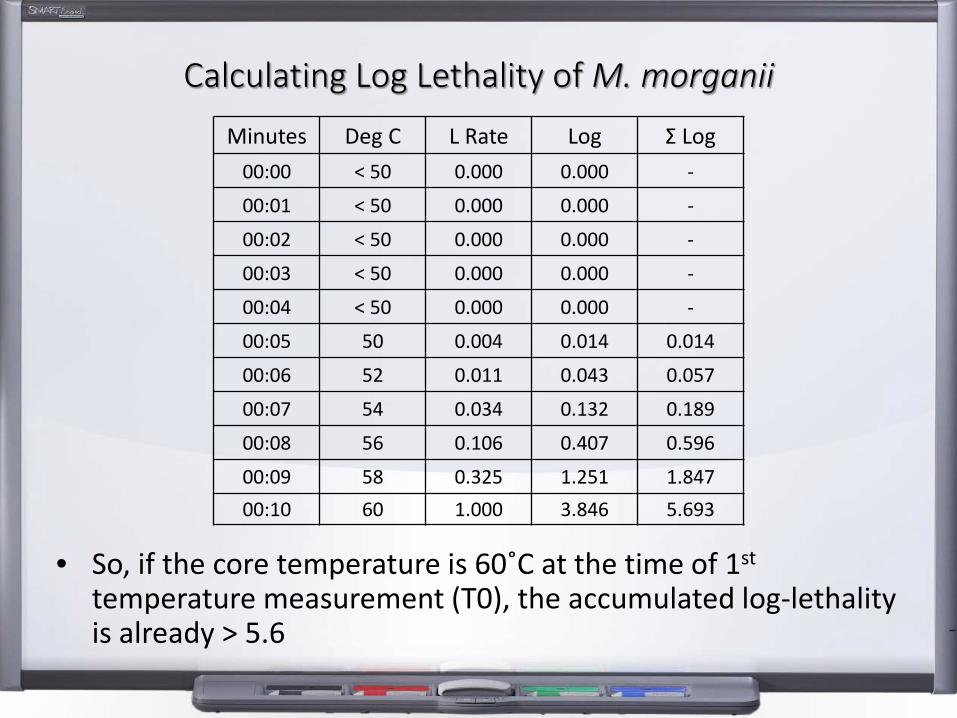
Calculating Log Lethality of M. morganii
Minutes Deg C L Rate Log Σ Log00:00 < 50 0.000 0.000 -
00:01 < 50 0.000 0.000 -
00:02 < 50 0.000 0.000 -
00:03 < 50 0.000 0.000 -
00:04 < 50 0.000 0.000 -
00:05 50 0.004 0.014 0.014
00:06 52 0.011 0.043 0.057
00:07 54 0.034 0.132 0.189
00:08 56 0.106 0.407 0.596
00:09 58 0.325 1.251 1.84700:10 60 1.000 3.846 5.693
• So, if the core temperature is 60˚C at the time of 1st
temperature measurement (T0), the accumulated log-lethality is already > 5.6
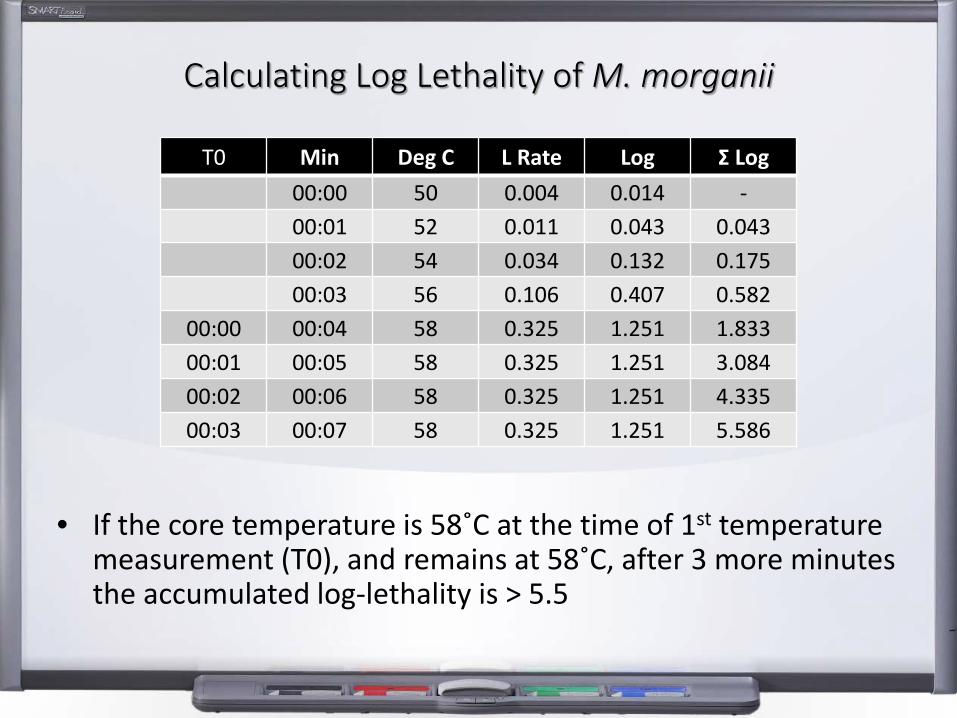
Calculating Log Lethality of M. morganii
T0 Min Deg C L Rate Log Σ Log00:00 50 0.004 0.014 -00:01 52 0.011 0.043 0.04300:02 54 0.034 0.132 0.17500:03 56 0.106 0.407 0.582
00:00 00:04 58 0.325 1.251 1.83300:01 00:05 58 0.325 1.251 3.08400:02 00:06 58 0.325 1.251 4.33500:03 00:07 58 0.325 1.251 5.586
• If the core temperature is 58˚C at the time of 1st temperature measurement (T0), and remains at 58˚C, after 3 more minutes the accumulated log-lethality is > 5.5
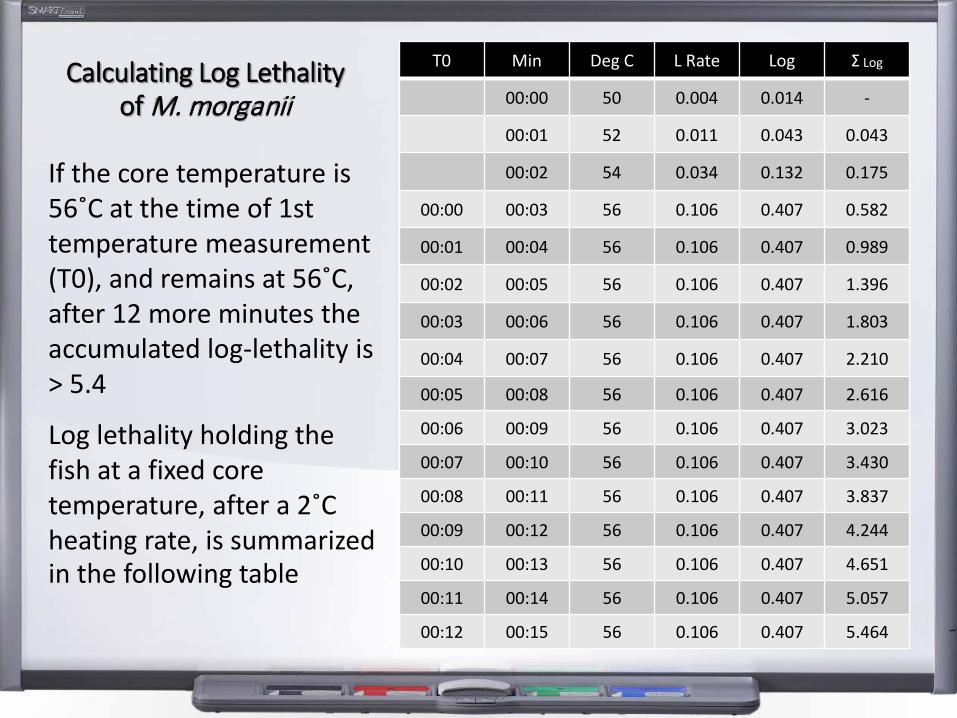
Calculating Log Lethality of M. morganii
T0 Min Deg C L Rate Log Σ Log
00:00 50 0.004 0.014 -
00:01 52 0.011 0.043 0.043
00:02 54 0.034 0.132 0.175
00:00 00:03 56 0.106 0.407 0.582
00:01 00:04 56 0.106 0.407 0.989
00:02 00:05 56 0.106 0.407 1.396
00:03 00:06 56 0.106 0.407 1.803
00:04 00:07 56 0.106 0.407 2.210
00:05 00:08 56 0.106 0.407 2.616
00:06 00:09 56 0.106 0.407 3.023
00:07 00:10 56 0.106 0.407 3.430
00:08 00:11 56 0.106 0.407 3.837
00:09 00:12 56 0.106 0.407 4.244
00:10 00:13 56 0.106 0.407 4.651
00:11 00:14 56 0.106 0.407 5.057
00:12 00:15 56 0.106 0.407 5.464
If the core temperature is 56˚C at the time of 1st temperature measurement (T0), and remains at 56˚C, after 12 more minutes the accumulated log-lethality is > 5.4
Log lethality holding the fish at a fixed core temperature, after a 2˚C heating rate, is summarized in the following table
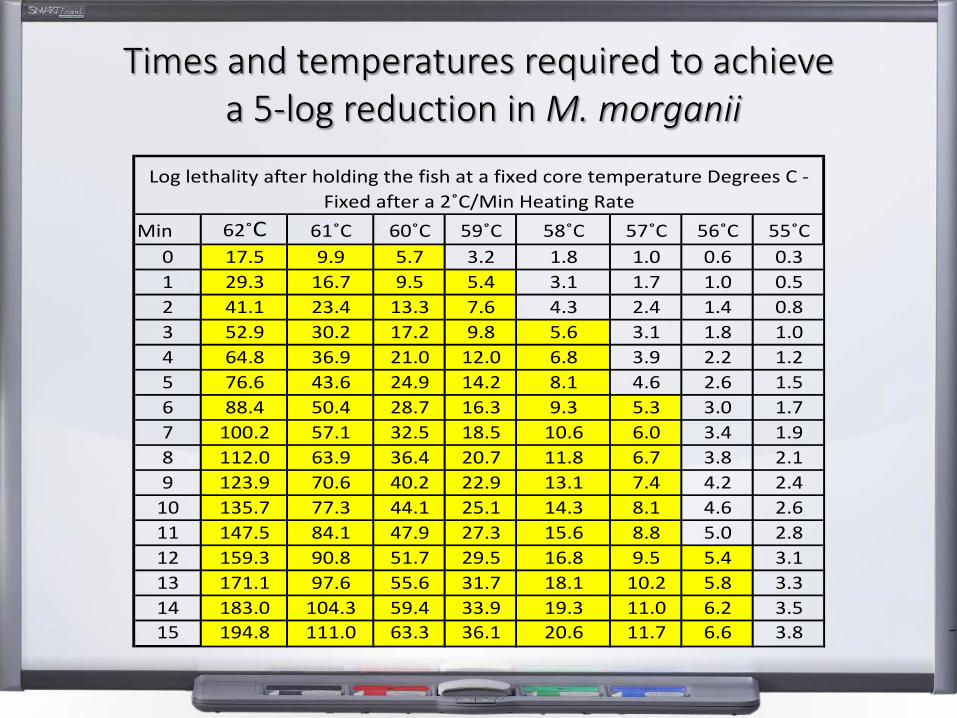
Times and temperatures required to achievea 5-log reduction in M. morganii
Min 62˚C 61˚C 60˚C 59˚C 58˚C 57˚C 56˚C 55˚C0 17.5 9.9 5.7 3.2 1.8 1.0 0.6 0.31 29.3 16.7 9.5 5.4 3.1 1.7 1.0 0.52 41.1 23.4 13.3 7.6 4.3 2.4 1.4 0.83 52.9 30.2 17.2 9.8 5.6 3.1 1.8 1.04 64.8 36.9 21.0 12.0 6.8 3.9 2.2 1.25 76.6 43.6 24.9 14.2 8.1 4.6 2.6 1.56 88.4 50.4 28.7 16.3 9.3 5.3 3.0 1.77 100.2 57.1 32.5 18.5 10.6 6.0 3.4 1.98 112.0 63.9 36.4 20.7 11.8 6.7 3.8 2.19 123.9 70.6 40.2 22.9 13.1 7.4 4.2 2.4
10 135.7 77.3 44.1 25.1 14.3 8.1 4.6 2.611 147.5 84.1 47.9 27.3 15.6 8.8 5.0 2.812 159.3 90.8 51.7 29.5 16.8 9.5 5.4 3.113 171.1 97.6 55.6 31.7 18.1 10.2 5.8 3.314 183.0 104.3 59.4 33.9 19.3 11.0 6.2 3.515 194.8 111.0 63.3 36.1 20.6 11.7 6.6 3.8
Log lethality after holding the fish at a fixed core temperature Degrees C - Fixed after a 2˚C/Min Heating Rate
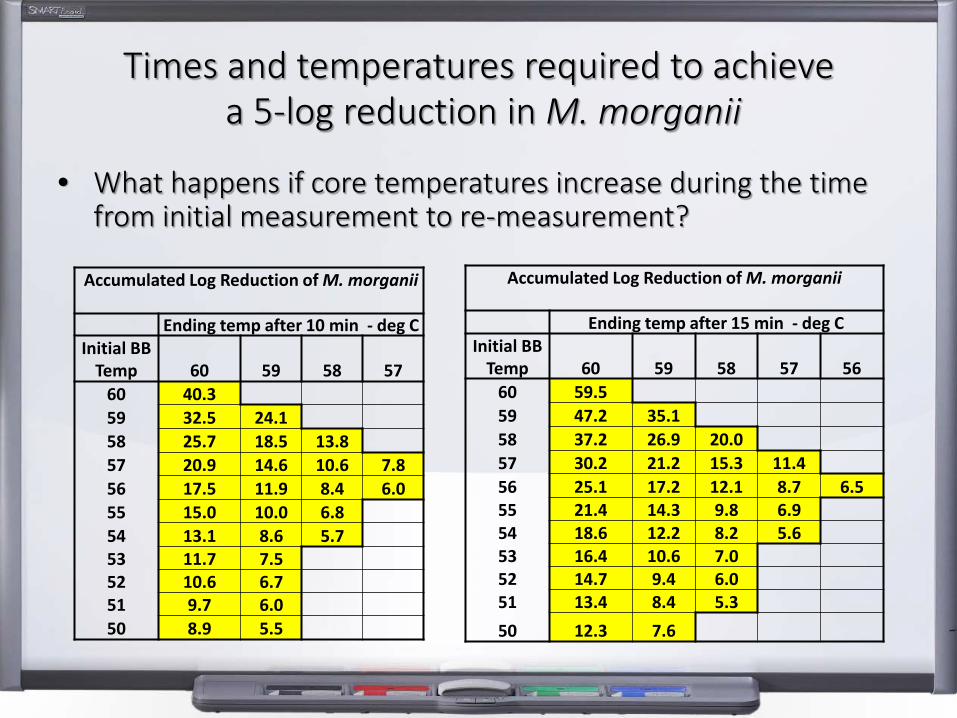
Times and temperatures required to achievea 5-log reduction in M. morganii
• What happens if core temperatures increase during the time from initial measurement to re-measurement?
Accumulated Log Reduction of M. morganii
Ending temp after 10 min - deg CInitial BB
Temp 60 59 58 5760 40.359 32.5 24.158 25.7 18.5 13.857 20.9 14.6 10.6 7.856 17.5 11.9 8.4 6.055 15.0 10.0 6.854 13.1 8.6 5.753 11.7 7.552 10.6 6.751 9.7 6.050 8.9 5.5
Accumulated Log Reduction of M. morganii
Ending temp after 15 min - deg CInitial BB
Temp 60 59 58 57 5660 59.559 47.2 35.158 37.2 26.9 20.057 30.2 21.2 15.3 11.456 25.1 17.2 12.1 8.7 6.555 21.4 14.3 9.8 6.954 18.6 12.2 8.2 5.653 16.4 10.6 7.052 14.7 9.4 6.051 13.4 8.4 5.350 12.3 7.6
Verification
Calculating log lethality from time/temperature data collected from every cook provides verification that a 5-log reduction of the histamine-forming bacterium Morganella morganii has been achieved

RECORD KEEPING“How will you document what has happened?”

Record Keeping
Note: Records should include all pertinent lot and batch information and should be signed by the operator
HACCP › SUMMARY“How does this all fit together?”
HACCP Summary
• All of the above can be summarized in a conventional HACCP table in US FDA format…
• For an example, see Table 7-4 “Control Strategy Example 2 –Histamine Testing”, Chapter 7, Page 136, of the US FDA 'Fish and Fishery Products Hazards and Controls Guidance, 4th
edition.
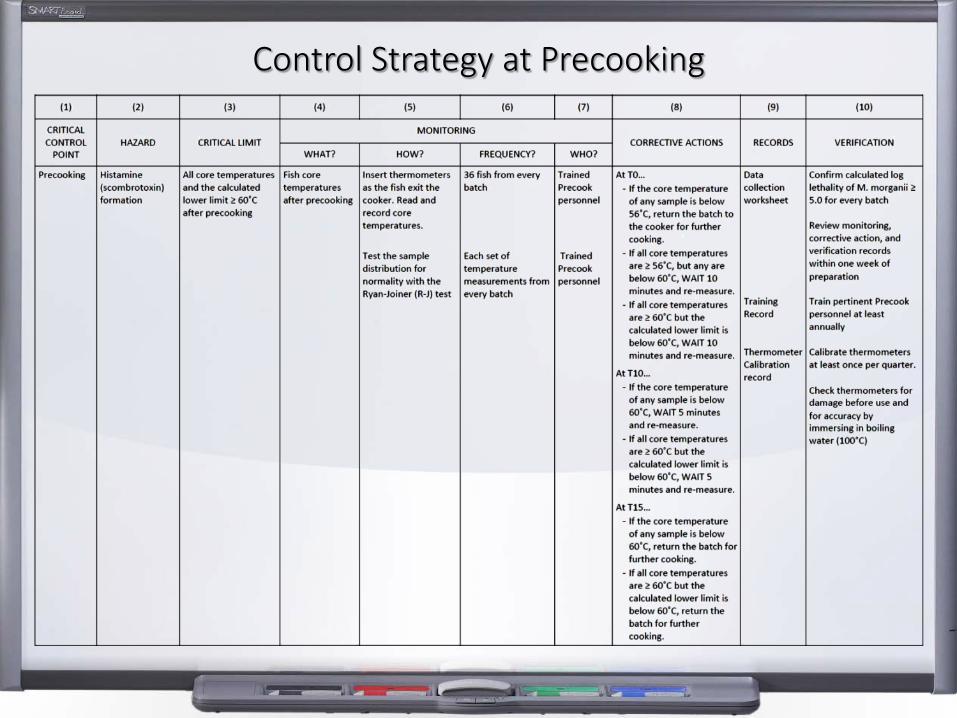
Control Strategy at Precooking

EXECUTIVE SUMMARY“Have you achieved what you intended?”
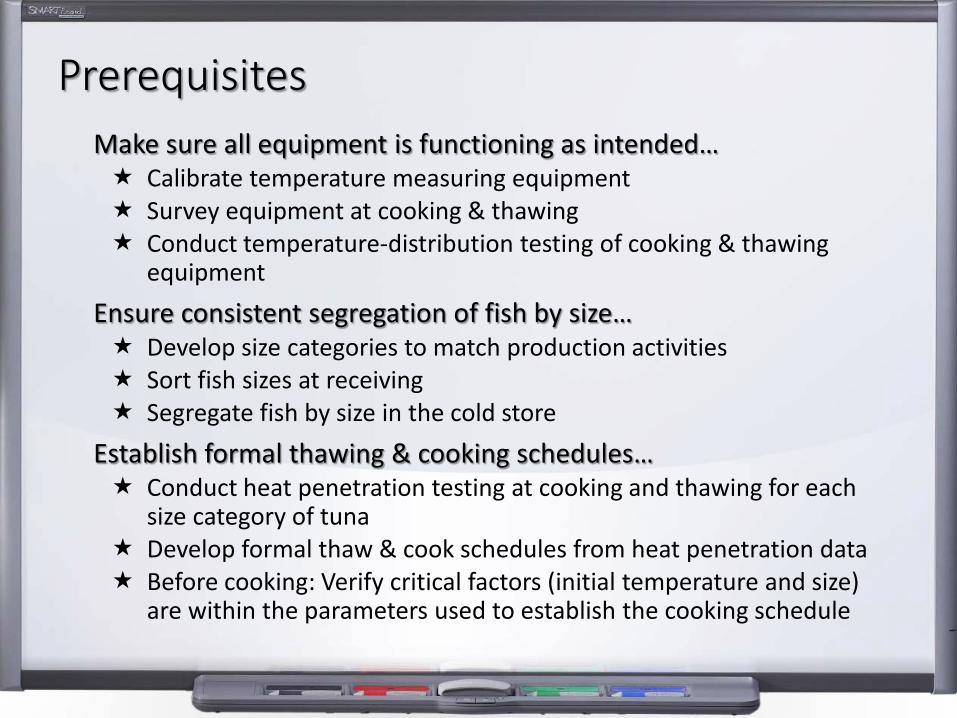
PrerequisitesMake sure all equipment is functioning as intended… Calibrate temperature measuring equipment Survey equipment at cooking & thawing Conduct temperature-distribution testing of cooking & thawing
equipmentEnsure consistent segregation of fish by size… Develop size categories to match production activities Sort fish sizes at receiving Segregate fish by size in the cold store
Establish formal thawing & cooking schedules… Conduct heat penetration testing at cooking and thawing for each
size category of tuna Develop formal thaw & cook schedules from heat penetration data Before cooking: Verify critical factors (initial temperature and size)
are within the parameters used to establish the cooking schedule
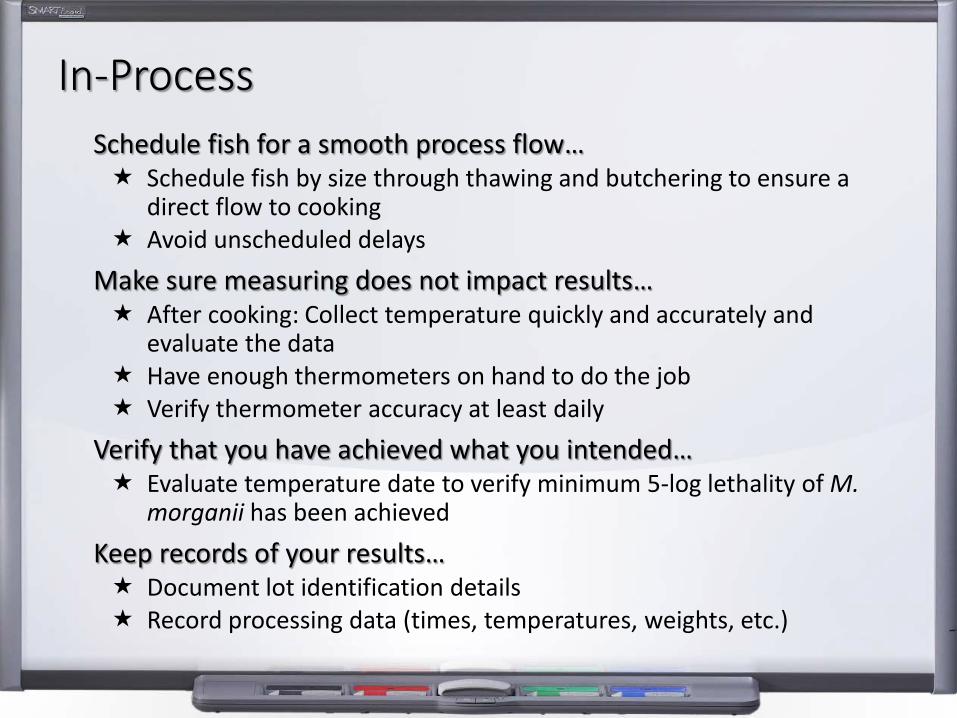
In-ProcessSchedule fish for a smooth process flow… Schedule fish by size through thawing and butchering to ensure a
direct flow to cooking Avoid unscheduled delays
Make sure measuring does not impact results… After cooking: Collect temperature quickly and accurately and
evaluate the data Have enough thermometers on hand to do the job Verify thermometer accuracy at least daily
Verify that you have achieved what you intended… Evaluate temperature date to verify minimum 5-log lethality of M.
morganii has been achievedKeep records of your results… Document lot identification details Record processing data (times, temperatures, weights, etc.)

DISCUSSION“What are some of the most common problems encountered?”
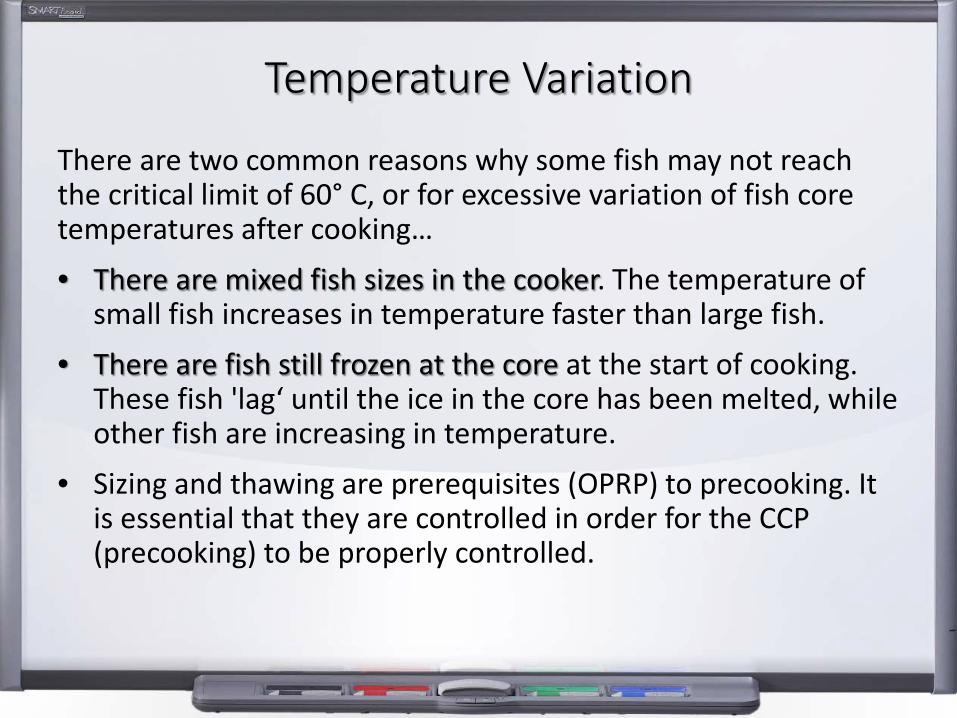
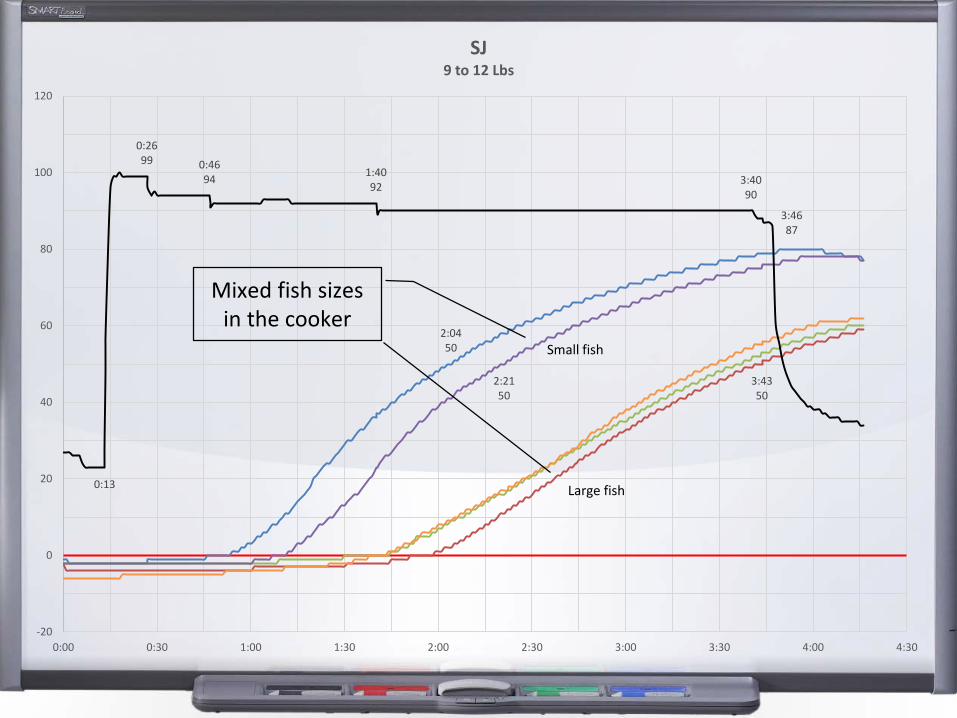
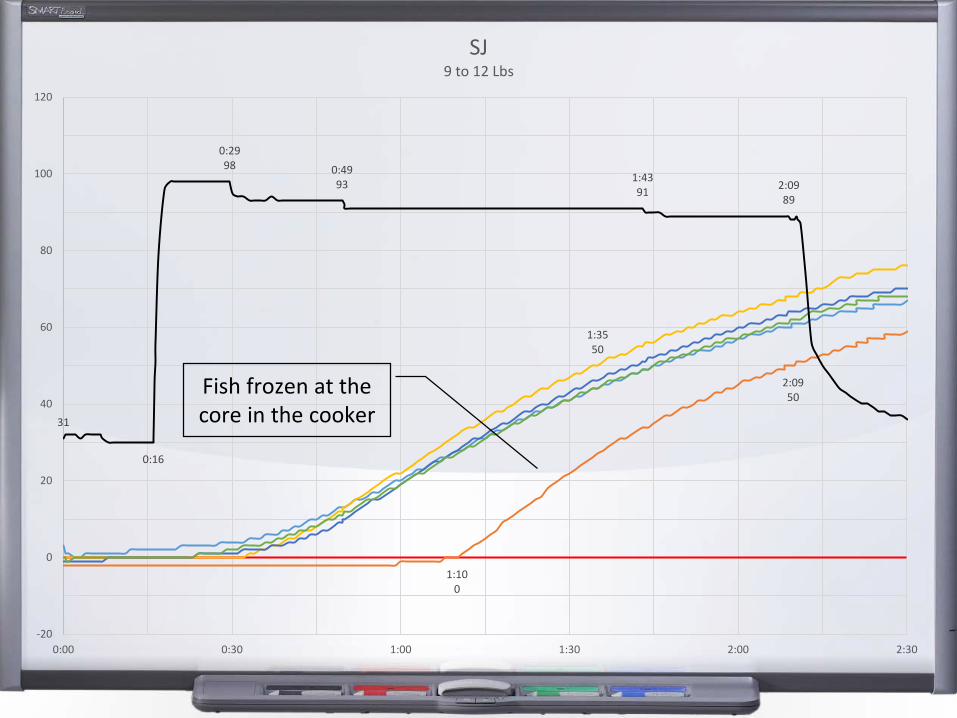
Temperature Variation
There are two common reasons why some fish may not reach the critical limit of 60° C, or for excessive variation of fish core temperatures after cooking…• There are mixed fish sizes in the cooker. The temperature of
small fish increases in temperature faster than large fish.• There are fish still frozen at the core at the start of cooking.
These fish 'lag‘ until the ice in the core has been melted, while other fish are increasing in temperature.
• Sizing and thawing are prerequisites (OPRP) to precooking. It is essential that they are controlled in order for the CCP (precooking) to be properly controlled.
2:0450
3:4350
2:2150
0:13
0:2699 0:46
94 1:4092 3:40
90
3:4687
-20
0
20
40
60
80
100
120
0:00 0:30 1:00 1:30 2:00 2:30 3:00 3:30 4:00 4:30
SJ9 to 12 Lbs
Mixed fish sizes in the cooker
Large fish
Small fish
1:100
2:0950
1:3550
31
0:16
0:2998 0:49
93 1:4391 2:09
89
-20
0
20
40
60
80
100
120
0:00 0:30 1:00 1:30 2:00 2:30
SJ9 to 12 Lbs
Fish frozen at the core in the cooker
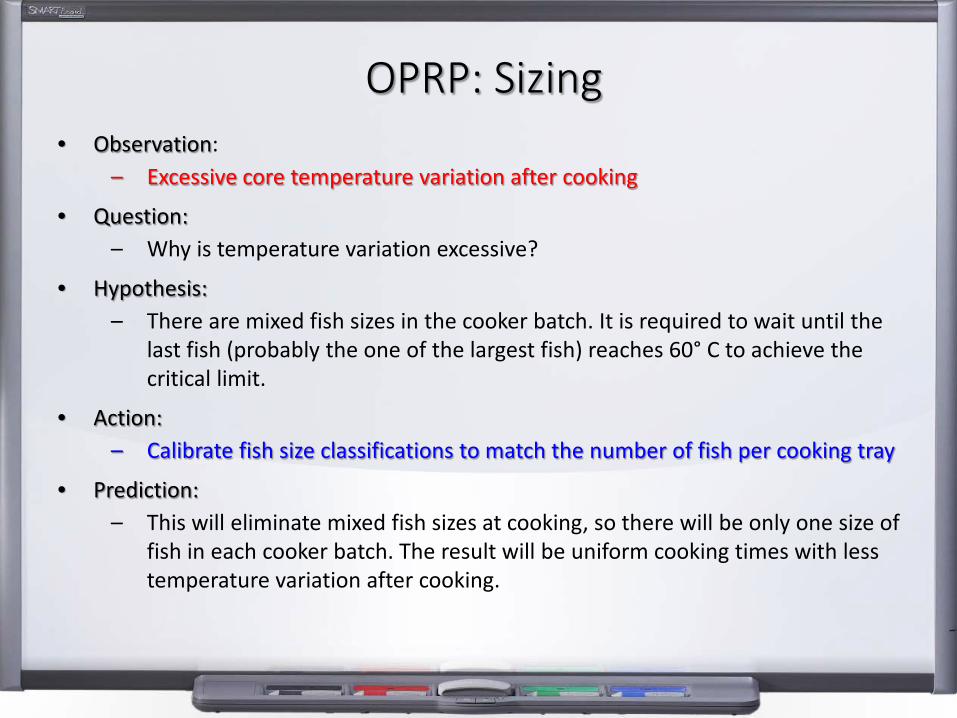
OPRP: Sizing• Observation:
– Excessive core temperature variation after cooking
• Question:– Why is temperature variation excessive?
• Hypothesis:– There are mixed fish sizes in the cooker batch. It is required to wait until the
last fish (probably the one of the largest fish) reaches 60° C to achieve the critical limit.
• Action:– Calibrate fish size classifications to match the number of fish per cooking tray
• Prediction:– This will eliminate mixed fish sizes at cooking, so there will be only one size of
fish in each cooker batch. The result will be uniform cooking times with less temperature variation after cooking.
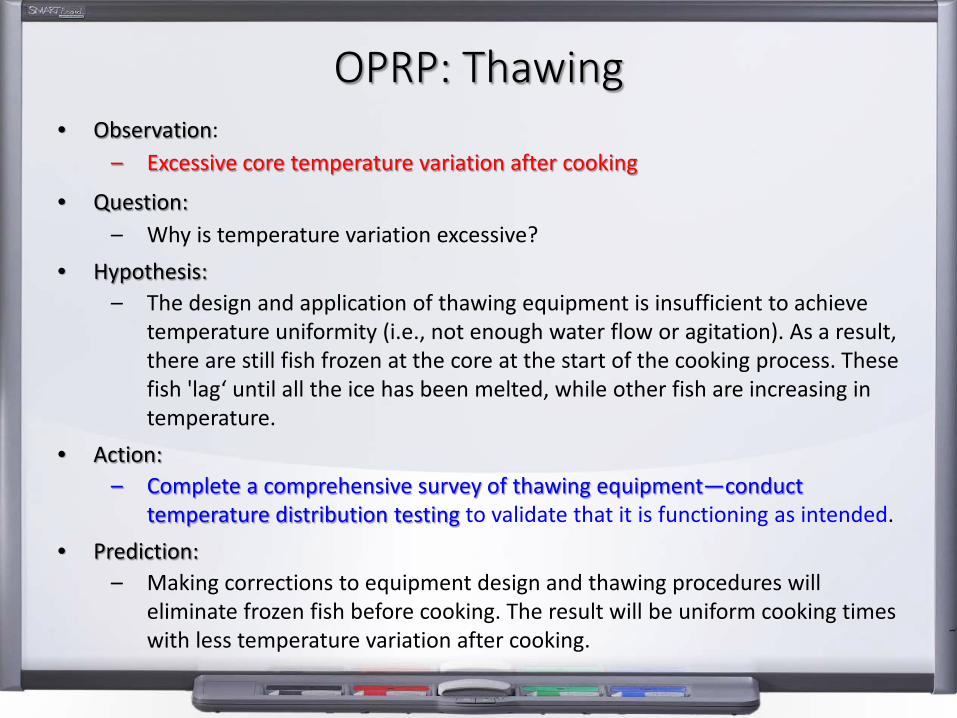
OPRP: Thawing• Observation:
– Excessive core temperature variation after cooking
• Question:– Why is temperature variation excessive?
• Hypothesis:– The design and application of thawing equipment is insufficient to achieve
temperature uniformity (i.e., not enough water flow or agitation). As a result, there are still fish frozen at the core at the start of the cooking process. These fish 'lag‘ until all the ice has been melted, while other fish are increasing in temperature.
• Action:– Complete a comprehensive survey of thawing equipment—conduct
temperature distribution testing to validate that it is functioning as intended.• Prediction:
– Making corrections to equipment design and thawing procedures will eliminate frozen fish before cooking. The result will be uniform cooking times with less temperature variation after cooking.
Temperature Variation
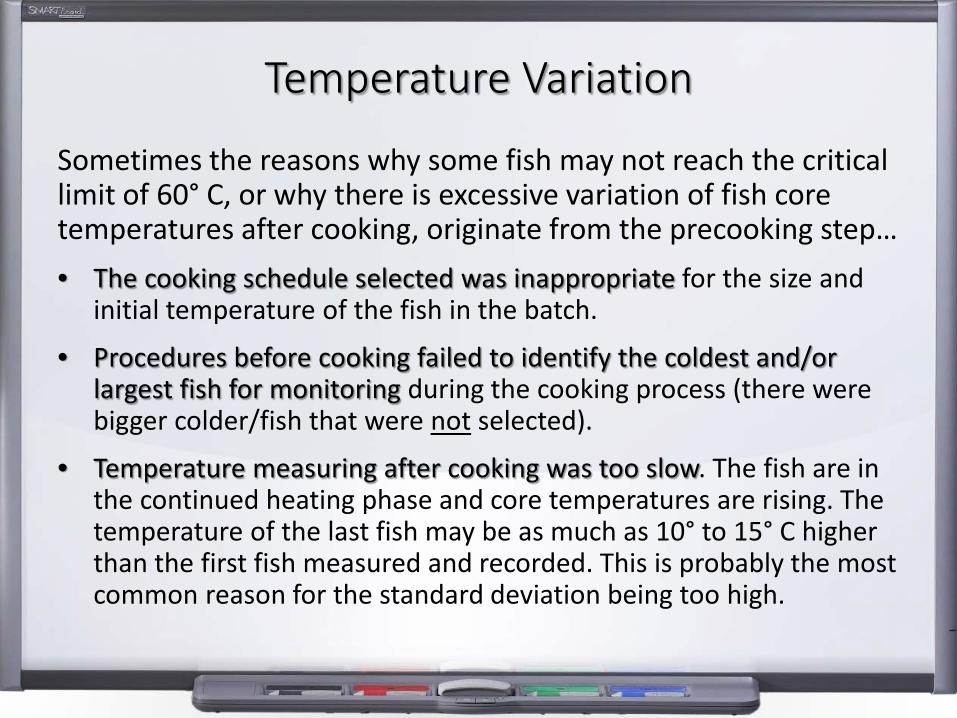
Sometimes the reasons why some fish may not reach the critical limit of 60° C, or why there is excessive variation of fish core temperatures after cooking, originate from the precooking step…• The cooking schedule selected was inappropriate for the size and
initial temperature of the fish in the batch.
• Procedures before cooking failed to identify the coldest and/or largest fish for monitoring during the cooking process (there were bigger colder/fish that were not selected).
• Temperature measuring after cooking was too slow. The fish are in the continued heating phase and core temperatures are rising. The temperature of the last fish may be as much as 10° to 15° C higher than the first fish measured and recorded. This is probably the most common reason for the standard deviation being too high.
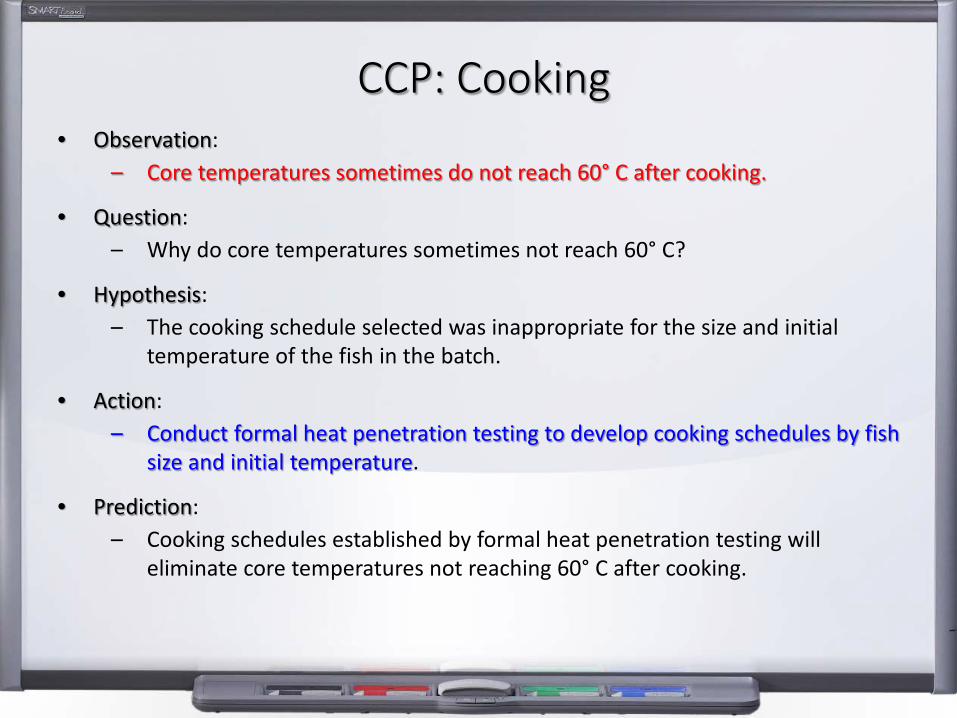
CCP: Cooking• Observation:
– Core temperatures sometimes do not reach 60° C after cooking.
• Question:– Why do core temperatures sometimes not reach 60° C?
• Hypothesis:– The cooking schedule selected was inappropriate for the size and initial
temperature of the fish in the batch.
• Action:– Conduct formal heat penetration testing to develop cooking schedules by fish
size and initial temperature.
• Prediction:– Cooking schedules established by formal heat penetration testing will
eliminate core temperatures not reaching 60° C after cooking.
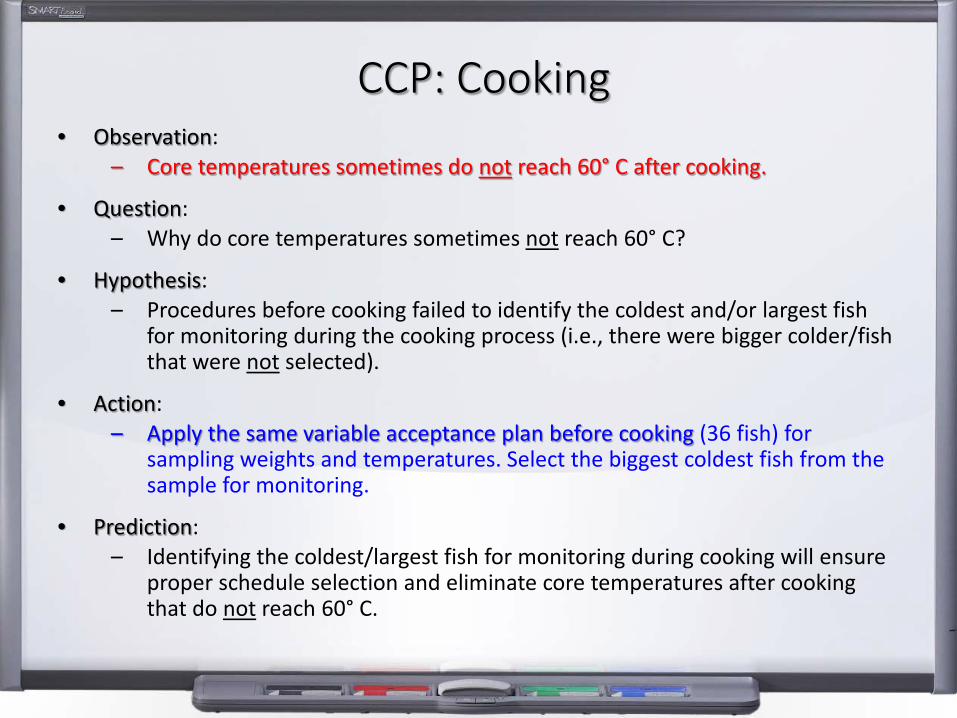
CCP: Cooking• Observation:
– Core temperatures sometimes do not reach 60° C after cooking.
• Question:– Why do core temperatures sometimes not reach 60° C?
• Hypothesis:– Procedures before cooking failed to identify the coldest and/or largest fish
for monitoring during the cooking process (i.e., there were bigger colder/fish that were not selected).
• Action:– Apply the same variable acceptance plan before cooking (36 fish) for
sampling weights and temperatures. Select the biggest coldest fish from the sample for monitoring.
• Prediction:– Identifying the coldest/largest fish for monitoring during cooking will ensure
proper schedule selection and eliminate core temperatures after cooking that do not reach 60° C.
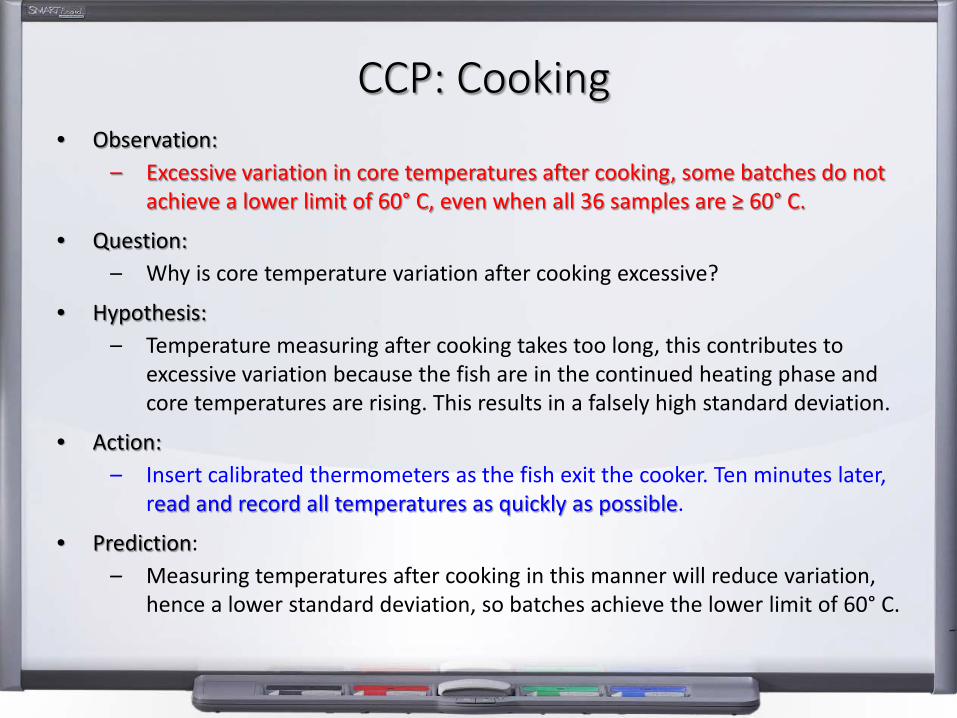
CCP: Cooking• Observation:
– Excessive variation in core temperatures after cooking, some batches do not achieve a lower limit of 60° C, even when all 36 samples are ≥ 60° C.
• Question:– Why is core temperature variation after cooking excessive?
• Hypothesis:– Temperature measuring after cooking takes too long, this contributes to
excessive variation because the fish are in the continued heating phase and core temperatures are rising. This results in a falsely high standard deviation.
• Action:– Insert calibrated thermometers as the fish exit the cooker. Ten minutes later,
read and record all temperatures as quickly as possible.
• Prediction:– Measuring temperatures after cooking in this manner will reduce variation,
hence a lower standard deviation, so batches achieve the lower limit of 60° C.
Precooking
• Normal cooking curves follow a typical pattern…◦ Lag◦ Heating◦ Continued heating after 'steam off'◦ Cooling
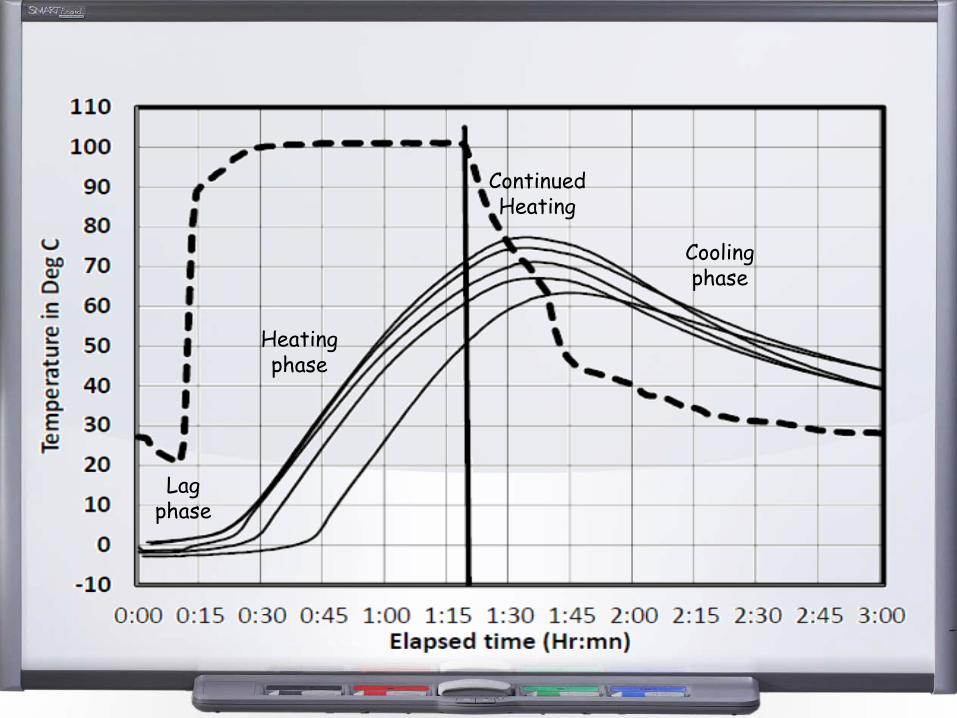
Lag phase
Heating phase
Continued Heating
Cooling phase
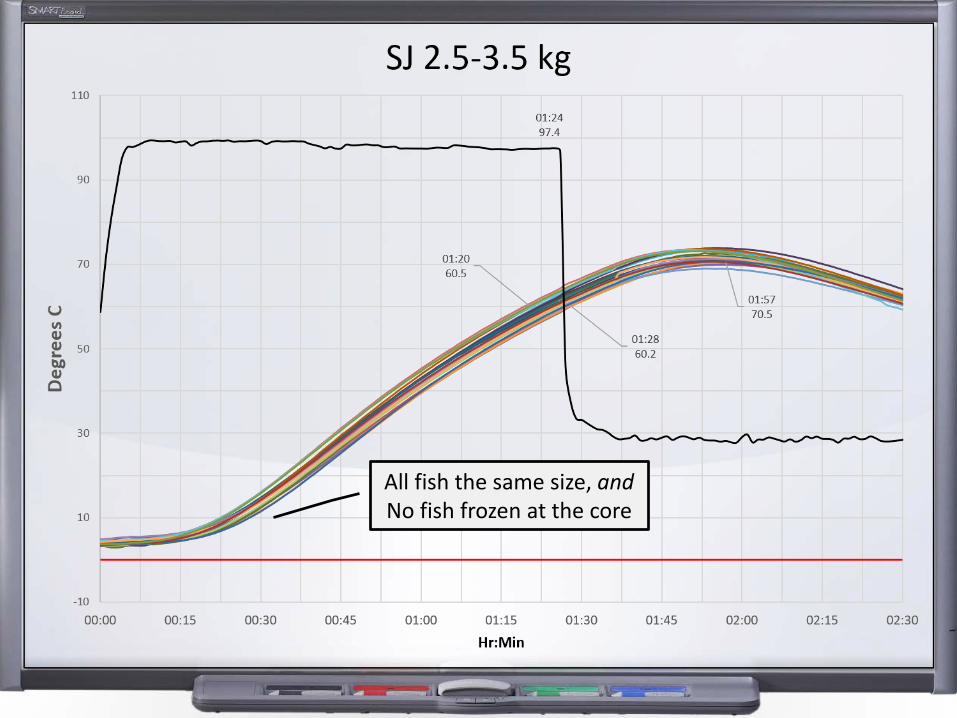
All fish the same size, andNo fish frozen at the core
“A Strategy for Controlling Histamine Formation at Tuna Precooking”
Thank you
Prepared by: John DeBeer & Chris Lord