Embed Size (px)
Citation preview
A STRATEGIC COOPERATIVE GAME-THEORETIC MODEL FOR MARKET SEGMENTATION WITH APPLICATION
TO BANKING IN EMERGING ECONOMIES
Faramak Zandi1, Madjid Tavana2, Aidan O’Connor3
1Management Department, La Salle University, Philadelphia, PA 19141, U.S.A. 2Business Systems and Analytics Department, Lindback Distinguished Chair of Information Systems
and Decision Sciences, La Salle University, Philadelphia, PA 19141, U.S.A. 3ESCEM School of Business and Management, Tours-Poitiers, France
E-mails: [email protected]; [email protected] (corresponding author); [email protected]
Received 15 August 2011; accepted 16 October 2011
Abstract. Market segmentation is essential to target efficaciously core-segment customers and to obtain a competitive advantage. Firms when confronted by the range of market segments, have difficulty in deciding the core-segment customers who are the most probable purchasers of their product and services. We propose a novel fuzzy group multi-criteria method for market entry and segment evaluation and selection. This proposed method provides a comprehensive and systematic framework that combines bi-level multi-objective optimization with real option analysis (ROA) and fuzzy cooperative n-person game theory. The contribution of the proposed segment evaluation and selection method is fivefold: (1) it addresses the gaps in the marketing literature on the efficacious and effective assessment of market segments; (2) it provides a comprehensive and systematic framework that combines bi-level multi-objective optimization with ROA and fuzzy cooperative n-person game theory; (3) it considers fuzzy logic and fuzzy sets to represent ambiguous, uncertain or imprecise information; (4) it does not insist on consensus but synthesizes a representative outcome based on qualitative judgments and quantitative data; and (5) it is applicable to national and international market segmentation. The practical application of this proposed framework illustrates the efficacy of the procedures and algorithms.
Keywords: bi-level multi-objective optimization, real option analysis, cooperative n-person game, services and product segmentation, emerging market economies, bank market entry.
Reference to this paper should be made as follows: Zandi, F.; Tavana, M.; O’Connor, A. 2012. A strategic cooperative game-theoretic model for market segmentation with application to bank-ing in emerging economies, Technological and Economic Development of Economy 18(3): 389–423.
JEL Classification: C71, D70, F23.
Copyright © 2012 Vilnius Gediminas Technical University (VGTU) Press Technika http://www.tandfonline.com/TTED
Technological and economic developmenT oF economY
iSSn 2029-4913 print/iSSn 2029-4921 online
2012 Volume 18(3): 389–423 doi:10.3846/20294913.2012.688072
Dow
nloa
ded
by [
Mad
jid T
avan
a] a
t 07:
44 0
2 O
ctob
er 2
012
1. Introduction
The rapid growth and importance of financial markets in the world economy has prompted governments in emerging market economies to initiate programs to develop their banking systems, banks and institutional and legal configuration to attract foreign banks to invest directly, especially where the banking system is a formerly state-owned activity. One of the most important decisions facing bank and marketing managers is the definition of product-market-customer types to be targeted in the foreign market. Segmentation is the process of defining products, markets, as well as, customers with similar characteristics and demands who are likely to exhibit similar purchasing behavior, that translates into profitability for firms. According to Montoya-Weiss and Calentone (1999), there are four steps in the market segmentation process. These are problem structuring, segment formation, segment evalua-tion and selection, and description of segment strategy. The vast majority of research on the segment evaluation and selection part of the market segmentation process has focused on evaluating different segmentation methods and techniques (Lu 2003), evaluating segment stability (Blocker, Flint 2007; Fonseca, Cardoso 2007; Jonker et al. 2004), internal homogene-ity (Askegaard, Madsen 1998), and segment profitability (Jang et al. 2002). In fact, segment evaluation and selection as a separate process is seldom considered in general studies of market segmentation (Ou et al. 2009).
The segmentation process is complex and inherently imprecise as it involves subjective conditions and information, linguistic assessments, and multiple and conflicting criteria. The multi-dimensional nature of segmentation justifies the use of multi-criteria decision making (MCDM) methods. The criteria in MCDM can be qualitative and quantitative and they usually have different units of measurement (Turskis et al. 2009). MCDM methods are generally cat-egorized as continuous or discrete, depending on the domain of alternatives. Hwang and Yoon (1981) have classified the MCDM methods into two categories: multi-objective decision making (MODM) and multi-attribute decision making (MADM). MODM has been widely studied by means of mathematical programming methods with well-formulated theoretical frameworks. MODM methods have decision variable values that are determined in a continuous or integer domain with either an infinitive or a large number of alternative choices, the best of which should satisfy the decision maker (DM) constraints and preference priorities (Hwang, Masud 1979; Ehrgott, Wiecek 2005). MADM methods, on the other hand, have been used to resolve the decision making process with discrete decision spaces and a predetermined or a limited number of alternative choices. The MADM solution process requires inter and intra-attribute comparisons and involves implicit or explicit tradeoffs (Hwang, Yoon 1981). Zavadskas and Turskis (2011) have provided an excellent panorama of MCDM methods in economics and summarized the pioneering studies that support decisions under conditions of multiple criteria.
The costs and benefits associated with segmentation are ascertained through real option analysis (ROA). Discounted cash flow approaches cannot properly determine management’s flexibility to adapt and revise decisions in response to environmental uncertainties (Trigeorgis 1996). In recent years, several researchers have proposed methods for estimating the range of option values across a wide spectrum of future scenarios in MCDM. Conventional MCDM methods tend to be less effective in eliminating imprecision and vagueness. This led to the
390 F. Zandi et al. A strategic cooperative game-theoretic model for market segmentation...
Dow
nloa
ded
by [
Mad
jid T
avan
a] a
t 07:
44 0
2 O
ctob
er 2
012
development of fuzzy set theory by Zadeh (1965). Subjective judgment and imprecision are always present in segmentation due to the presence of (a) ambiguous information, (b) subjec-tive information, (c) incomplete information, and (b) conflicting information (Chen, Hwang 1992; Yeh et al. 2000). Zadeh (1965) proposed that the essential elements in human thinking are not numbers but labels of fuzzy sets. Much information in the real world is fuzzy rather than precise and fuzzy ROA assists DMs cope with the environmental uncertainties in MCDM.
Carlsson and Fullér (2003) introduced a (heuristic) real option rule in a fuzzy setting, where the present values of expected cash flows and expected costs were estimated by trap-ezoidal fuzzy numbers. Chen et al. (2007) developed a comprehensive but simple methodology to evaluate information technology investment in a nuclear power station based on fuzzy risk analysis and the real option approach. Kjærland (2007) used the conceptual real option framework of Dixit and Pindyck (1994) to estimate the value of investment opportunities in the Norwegian hydropower industry. Villani (2008) combined two successful theories, namely real option and game theory, to value the investment opportunity and the value of flexibility as a real option while analyzing the competition with game theory. Yan (2011) incorporated game theory and fuzzy set theory for the development of a bargaining model for improving the manager’s reasoning process of pricing decisions.
Collan et al. (2009) presented a new method for real option valuation using fuzzy num-bers. Their method considered the dynamic nature of the profitability assessment, that is, the assessment is modified when information is different. As the temporal dimension of future cash flows diminishes, that is, the financial aspects of business transactions are due to be finalized, so do the necessary information adjustments and the associated transaction risk and uncertainty. Chrysafis and Papadopoulos (2009) proposed a new method using statistical data of constructing fuzzy estimators for the parameters of a given probability distribution function. Wang and Hwang (2007) developed a fuzzy research and development portfolio selection model to hedge against environmental uncertainties. To model uncertain and flexible project information fuzzy set theory was applied. Since traditional project valuation methods often underestimate the riskiness of a project, a fuzzy compound-options model is applied to evaluate the value of each project. The portfolio selection was formulated as a fuzzy zero–one integer programming model that could manage both uncertain and flexible parameters and determine the optimal project portfolio. A new transformation method based on qualitative possibility theory was developed to convert the fuzzy portfolio selection model into a crisp mathematical model from the risk-averse perspective and this model was solved by an optimization technique.
MCDM issues with numerous DMs, are often modeled with game theory and these gener-ally depend on the behavior of the DMs and on their coalitions. When the DMs are willing to cooperate with each other the game is cooperative. Cooperative game models are used extensively in cost and revenue allocation and voting power, or the weighting of the various DMs influence in the decision making process (Shubik 1985; Young 1985). There are many propositions in game theory literature to solve cooperative games (Kapliński, Tamošaitiene 2010). The von Neumann stable set, the core, the kernel, the Shapley value, the nucleolus, the Nash bargaining solution are the most common concepts (Maali 2009; Nash 1950a; Pekec 2001; Shapley 1953). Stein (2010) investigated Pareto‐efficiency and fairness of agreements
391Technological and Economic Development of Economy, 2012, 18(3): 389–423
Dow
nloa
ded
by [
Mad
jid T
avan
a] a
t 07:
44 0
2 O
ctob
er 2
012
in coalition and network games stability. Peldschus (2008) discussed solutions of two‐per-son zero‐sum games as well as approaches to fuzzy games. Peldschus and Zavadskas (2005) proposed a framework by combining fuzzy sets and matrix game theories for multi-criteria decision-making. Conversely, when there is no cooperation between DMs the methodology of non-cooperative games is the right approach and the Nash-equilibrium is the most com-monly accepted solution (Nash 1950b, 1951).
The bi-level optimization issue may be classified as either bi-level single-objective opti-mization or bi-level multi-objective optimization. In bi-level single objective optimization both the upper and the lower level optimization tasks involve exactly one objective each. There are many studies of bi-level single-objective optimization, such as, Ahlatcioglu and Tiryaki (2007); Colson et al. (2007); Pramanik and Kumar Roy (2006); Sakawa and Nishizaki (2002); Sakawa et al. (2002); Shih and Lee (2000); Shih et al. (1996); Sinha (2003); Sinha, S. and Sinha, S. B. (2002); and Yin (2000). Bi-level multi-objective optimization involves two levels of optimization where an upper level solution is feasible only if it is one of the optimal solutions in the lower level optimization problem. The upper level optimization is intended to find an optimal solution corresponding to one or more different (higher level) objectives and the lower level optimization ensures certain requirements which make a solution accept-able. In contrast to bi-level single-objective optimization, there are few studies applying the classical bi-level multi-objective optimization methods (Deb, Sinha 2009).
The application of membership function of fuzzy set theory to bi-level multi-objective issue determination for satisfactory decisions was first introduced by Lai (1996). Shih et al. (1996) extended the satisfactory solution concept proposed by Lai (1996) with the use of the max–min operator of Bellman and Zadeh (1970). Osman et al. (2004) extended the fuzzy approach proposed by Shih et al. (1996) for solving bi-level and three-level non-linear multi-objective programming problems. Several approaches are proposed in the literature for the evaluation and selection of markets in electronic business.
This paper is organized into five sections. The following section presents the mathemati-cal notations and definitions used in our model. The details of the proposed framework are outlined in section 3. The proposed model is applied to decision making by a foreign bank entering an emerging market economy to demonstrate the relevance and applicability of the framework and exhibit the efficacy of the procedures and algorithms in section 4. In section 5 the conclusions and future research directions are specified.
2. Mathematical notations and definitions
Let us introduce the following mathematical notations and definitions used throughout this paper:A The company (as a player) evaluating potential market segments
jY The major cooperating player j in the market
1l The number of market segmentsis The market segment i
2l The number of market sub-segments
392 F. Zandi et al. A strategic cooperative game-theoretic model for market segmentation...
Dow
nloa
ded
by [
Mad
jid T
avan
a] a
t 07:
44 0
2 O
ctob
er 2
012
( )is f The market sub-segment f
( )iA s The company dealing with market segment i
( )j iY s The major cooperating player j dealing with market segment i
( )hA t The company dealing with the investment in the market segments at time h
( )j hY t The major cooperating player j dealing with the investment in the market segments at time h
1p The number of the team members
kv The voting power of team member k
n The number of players
D A coalition that defines a subset of players as one player
D A complementary coalition of D ( )D N D= −
( )( )ht iv A s The characteristic function value of the company for market segment i at time h
( )( )ht j iv Y s The characteristic function value of player j for market segment i at time h
( )( )ht iv A s′ The characteristic function normalized value of the company for market
segment i at time h
( )( )ht j iv Y s′ The characteristic function normalized value of player j for market segment
i at time h
( )( )ht iu A s′ The imputation value of company for market segment i at time h
( )( )ht j iu Y s′ The imputation value of player j for market segment i at time h
( )( )ihB A t
The weighted collective fuzzy present value of the expected benefits for the company dealing with market segment i at time h
( )( )ij hB Y t
The weighted collective fuzzy present value of the expected benefits for player
j dealing with market segment i at time h
( )( )ihC A t
The weighted collective fuzzy present value of the expected costs for the company dealing with market segment i at time h
( )( )ij hC Y t
The weighted collective fuzzy present value of the expected costs for player
j dealing with market segment i at time h
( )( )kihB A t
The individual fuzzy present value of the expected benefits for the company dealing with market segment i at time h evaluated by team member k
( )( )kij hB Y t
The individual fuzzy present value of the expected benefits for player j dealing
with market segment i at time h evaluated by team member k
393Technological and Economic Development of Economy, 2012, 18(3): 389–423
Dow
nloa
ded
by [
Mad
jid T
avan
a] a
t 07:
44 0
2 O
ctob
er 2
012
( )( )kihC A t
The individual fuzzy present value of the expected costs for the company dealing with market segment i at time h evaluated by team member k
( )( )kij hC Y t
The individual fuzzy present value of the expected costs for player j
dealing with market segment i at time h evaluated by team member k
( )( )ihE B A t
The possibilistic mean value of the weighted collective present value of the expected benefits of the company for market segment i at time h
( )( )ij hE B Y t
The possibilistic mean value of the weighted collective present value of
the expected benefits of player j for market segment i at time h
( )( )ihE C A t
The possibilistic mean value of the weighted collective expected costs of the company for market segment i at time h
( )( )ij hE C Y t
The possibilistic mean value of the weighted collective expected costs of
player j for market segment i at time h
( )( )ihA tσ The standard deviation of the weighted collective fuzzy present value of
the expected payoffs of the company for market segment i at time h
( )( )ij hY tσ The standard deviation of the weighted collective fuzzy present value of
the expected payoffs of player j for market segment i at time h
iδ The value loss over the duration of the option
ir The risk-free interest rate
( ){ }1 ( )ihn d A t
The probability that a random draw from a standard normal distribution will be less than ( )1 ( )i
hd A t
( ){ }2 ( )ihn d A t
The probability that a random draw from a standard normal distribution will be less than ( )2 ( )i
hd A t
( ){ }1 ( )ij hn d Y t
The probability that a random draw from a standard normal distribution
will be less than ( )1 ( )ij hd Y t
( ){ }2 ( )ij hn d Y t
The probability that a random draw from a standard normal distribution
will be less than ( )2 ( )ij hd Y t
mt The maximum deferral time for investment in the market segments
1t The minimum deferral time for investment in the market segments
( )( )h itROV A s
The fuzzy real option value of the company for investment in market
segment i at time h
( )( )h j itROV Y s
The fuzzy real option value of player j for investment in market segment
i at time h
394 F. Zandi et al. A strategic cooperative game-theoretic model for market segmentation...
Dow
nloa
ded
by [
Mad
jid T
avan
a] a
t 07:
44 0
2 O
ctob
er 2
012
3. Proposed framework
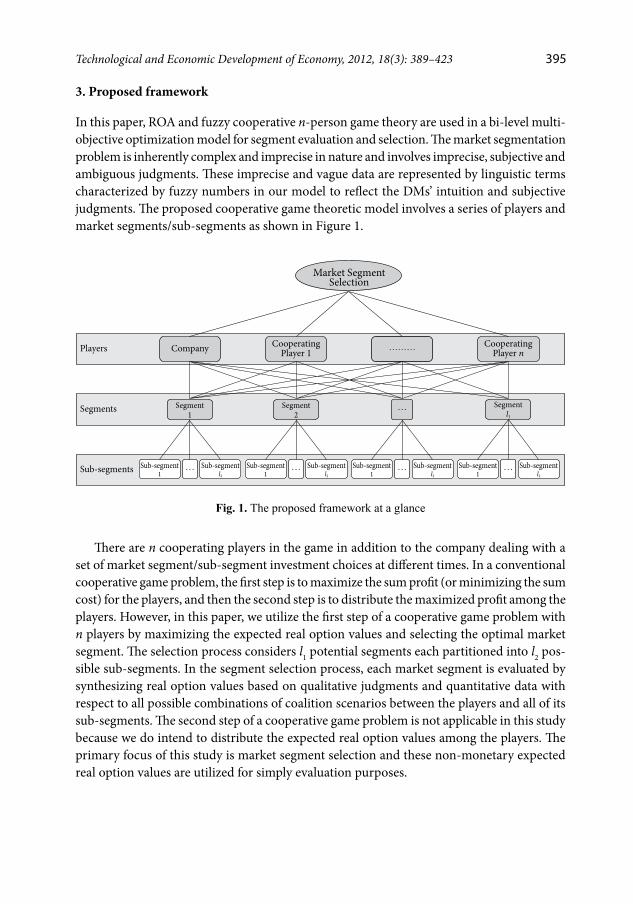
In this paper, ROA and fuzzy cooperative n-person game theory are used in a bi-level multi-objective optimization model for segment evaluation and selection. The market segmentation problem is inherently complex and imprecise in nature and involves imprecise, subjective and ambiguous judgments. These imprecise and vague data are represented by linguistic terms characterized by fuzzy numbers in our model to reflect the DMs’ intuition and subjective judgments. The proposed cooperative game theoretic model involves a series of players and market segments/sub-segments as shown in Figure 1.
Company CooperatingPlayer 1
CooperatingPlayer n………Players
…Segments Segment1
Segment2
Segmentl1
Sub-segments Sub-segment1
Sub-segmentl2
Sub-segment1
Sub-segment1
Sub-segmentl2
Sub-segmentl2
Sub-segmentl2
… … … …Sub-segment1
Market Segment Selection
Fig. 1. The proposed framework at a glance
There are n cooperating players in the game in addition to the company dealing with a set of market segment/sub-segment investment choices at different times. In a conventional cooperative game problem, the first step is to maximize the sum profit (or minimizing the sum cost) for the players, and then the second step is to distribute the maximized profit among the players. However, in this paper, we utilize the first step of a cooperative game problem with n players by maximizing the expected real option values and selecting the optimal market segment. The selection process considers l1 potential segments each partitioned into l2 pos-sible sub-segments. In the segment selection process, each market segment is evaluated by synthesizing real option values based on qualitative judgments and quantitative data with respect to all possible combinations of coalition scenarios between the players and all of its sub-segments. The second step of a cooperative game problem is not applicable in this study because we do intend to distribute the expected real option values among the players. The primary focus of this study is market segment selection and these non-monetary expected real option values are utilized for simply evaluation purposes.
395Technological and Economic Development of Economy, 2012, 18(3): 389–423
Dow
nloa
ded
by [
Mad
jid T
avan
a] a
t 07:
44 0
2 O
ctob
er 2
012
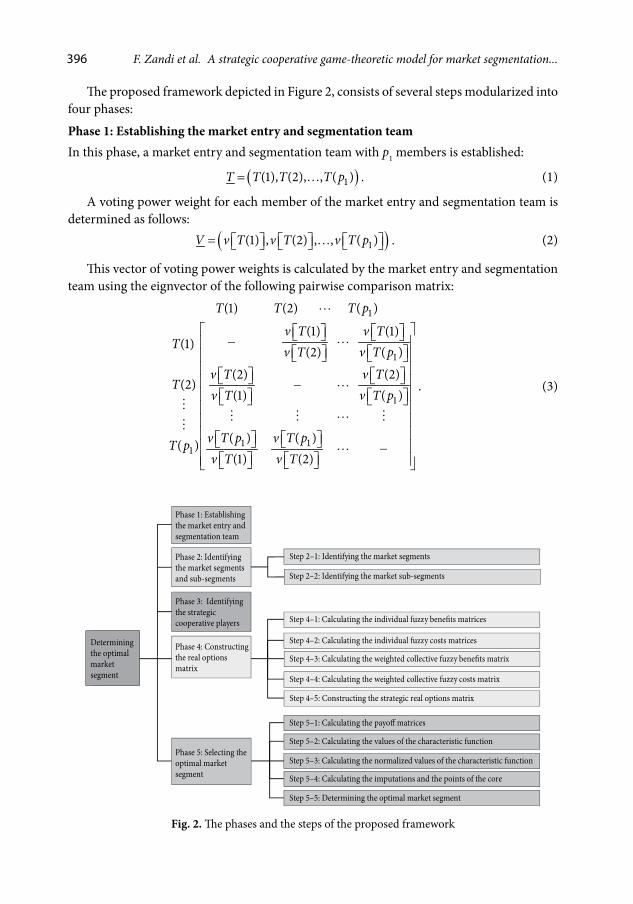
The proposed framework depicted in Figure 2, consists of several steps modularized into four phases:
Phase 1: Establishing the market entry and segmentation teamIn this phase, a market entry and segmentation team with p1 members is established:
( )1(1), (2), , ( )T T T T p= . (1)
A voting power weight for each member of the market entry and segmentation team is determined as follows:
( )1(1) , (2) , , ( )V v T v T v T p= . (2)
This vector of voting power weights is calculated by the market entry and segmentation team using the eignvector of the following pairwise comparison matrix:
1
1
1
1 11
(1) (2) ( )
(1) (1)(1) (2) ( )
(2) (2)(2)
(1) ( )
( ) ( )( )(1) (2)
T T T p
v T v TT v T v T p
v T v TT
v T v T p
v T p v T pT pv T v T
−
− −
. (3)
Phase 2: Identifyingthe market segmentsand sub-segments
Phase 1: Establishingthe market entry andsegmentation team
Determiningthe optimalmarketsegment
Phase 5: Selecting theoptimal marketsegment
Phase 4: Constructingthe real optionsmatrix
Phase 3: Identifyingthe strategiccooperative players
Step 4–1: Calculating the individual fuzzy bene�ts matrices
Step 2–2: Identifying the market sub-segments
Step 4–3: Calculating the weighted collective fuzzy bene�ts matrix
Step 4–4: Calculating the weighted collective fuzzy costs matrix
Step 4–5: Constructing the strategic real options matrix
Step 5–1: Calculating the payo� matrices
Step 5–2: Calculating the values of the characteristic function
Step 5–3: Calculating the normalized values of the characteristic function
Step 5–4: Calculating the imputations and the points of the core
Step 5–5: Determining the optimal market segment
Step 4–2: Calculating the individual fuzzy costs matrices
Step 2–1: Identifying the market segments
Fig. 2. The phases and the steps of the proposed framework
396 F. Zandi et al. A strategic cooperative game-theoretic model for market segmentation...
Dow
nloa
ded
by [
Mad
jid T
avan
a] a
t 07:
44 0
2 O
ctob
er 2
012
Phase 2: Identifying the market segments and sub-segmentsThis phase is divided into the following five steps:Step 2–1: Identifying the market segmentsIn this step, the market entry and segmentation team determines a list of the market seg-ments based on the scope of the target market. Let us assume that the team has identified 1l market segments as follows:
11 2, ,... , ,i lS s s s s =
. (4)
Step 2–2: Identifying the market sub-segmentsIn this step, the market entry and segmentation team identifies a set of sub-segments for each market segment. Let us assume that the team has identified 2l market sub-segments for each segment as follows:
2(1), (2),..., ( )i i i iS s s s l = . (5)
Phase 3: Identifying the strategic cooperative players
In this phase, the market entry and segmentation team identifies the strategic cooperative players in the market. Let us assume that the team has identified n cooperative players and let N denote the set of players as follows:
{ }1 2, , , nN Y Y Y= . (6)
Phase 4: Constructing the real option matrices
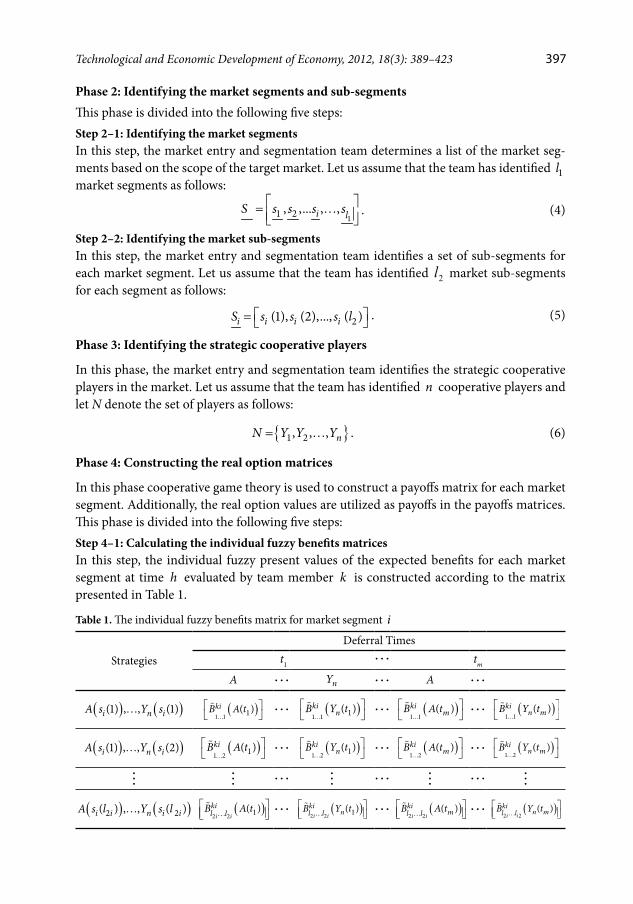
In this phase cooperative game theory is used to construct a payoffs matrix for each market segment. Additionally, the real option values are utilized as payoffs in the payoffs matrices. This phase is divided into the following five steps:Step 4–1: Calculating the individual fuzzy benefits matricesIn this step, the individual fuzzy present values of the expected benefits for each market segment at time h evaluated by team member k is constructed according to the matrix presented in Table 1.
Table 1. The individual fuzzy benefits matrix for market segment i
Strategies
Deferral Timest1
tm
A nY A
( ) ( )(1) , , (1)i n iA s Y s ( )1 1 1( )kiB A t
( )
1 1 1( )kinB Y t
( )1 1
( )kimB A t
( )1 1
( )kin mB Y t
( ) ( )(1) , , (2)i n iA s Y s ( )1 2 1( )kiB A t
( )1 2 1( )ki
nB Y t
( )1 2
( )kimB A t
( )1 2
( )kin mB Y t
( ) ( )2 2( ) , , ( )i i n i iA s l Y s l ( )2 2 1( )
i ikil lB A t
( )2 2 1( )
i iki
nl lB Y t
( )2 2
( )i i
kiml lB A t
( )2 2
( )i i
kin ml lB Y t
397Technological and Economic Development of Economy, 2012, 18(3): 389–423
Dow
nloa
ded
by [
Mad
jid T
avan
a] a
t 07:
44 0
2 O
ctob
er 2
012
The following trapezoidal fuzzy numbers are used to find the fuzzy present value of the expected benefits given in Table 1:
( ) ( )( ) ( )( ) ( )( ) ( )( )( ) ( ) , ( ) , ( ) , ( )c dki ki ki ki ki
h h h h hB A t B A t B A t B A t B A tα β =
, (7)
( ) ( )( ) ( )( ) ( )( ) ( )( )( ) ( ) , ( ) , ( ) , ( )c d
ki ki ki ki kij h j h j h j h j hB Y t B Y t B Y t B Y t B Y t
α β =
. (8)
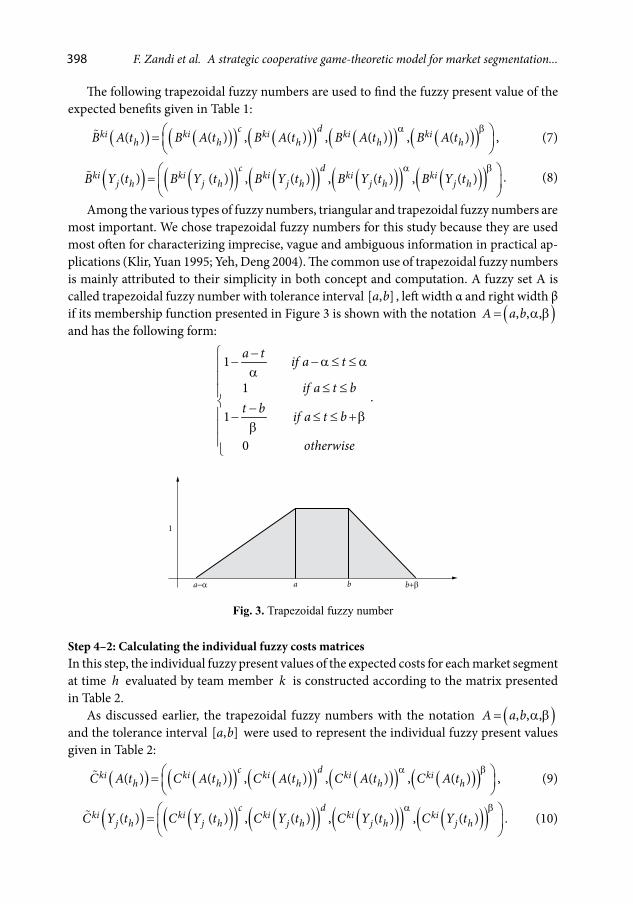
Among the various types of fuzzy numbers, triangular and trapezoidal fuzzy numbers are most important. We chose trapezoidal fuzzy numbers for this study because they are used most often for characterizing imprecise, vague and ambiguous information in practical ap-plications (Klir, Yuan 1995; Yeh, Deng 2004). The common use of trapezoidal fuzzy numbers is mainly attributed to their simplicity in both concept and computation. A fuzzy set A is called trapezoidal fuzzy number with tolerance interval [ , ]a b , left width α and right width β if its membership function presented in Figure 3 is shown with the notation ( ), , ,A a b= α β and has the following form:
1
1
1
0
a t if a t
if a t bt b if a t b
otherwise
− − −α ≤ ≤ α α ≤ ≤ − − ≤ ≤ +β
β
.
1
a−α b+βa b
Fig. 3. Trapezoidal fuzzy number
Step 4–2: Calculating the individual fuzzy costs matricesIn this step, the individual fuzzy present values of the expected costs for each market segment at time h evaluated by team member k is constructed according to the matrix presented in Table 2.
As discussed earlier, the trapezoidal fuzzy numbers with the notation ( ), , ,A a b= α β and the tolerance interval [ , ]a b were used to represent the individual fuzzy present values given in Table 2:
( ) ( )( ) ( )( ) ( )( ) ( )( )( ) ( ) , ( ) , ( ) , ( )c dki ki ki ki ki
h h h h hC A t C A t C A t C A t C A tα β =
, (9)
( ) ( )( ) ( )( ) ( )( ) ( )( )( ) ( ) , ( ) , ( ) , ( )c d
ki ki ki ki kij h j h j h j h j hC Y t C Y t C Y t C Y t C Y t
α β =
. (10)
398 F. Zandi et al. A strategic cooperative game-theoretic model for market segmentation...
Dow
nloa
ded
by [
Mad
jid T
avan
a] a
t 07:
44 0
2 O
ctob
er 2
012
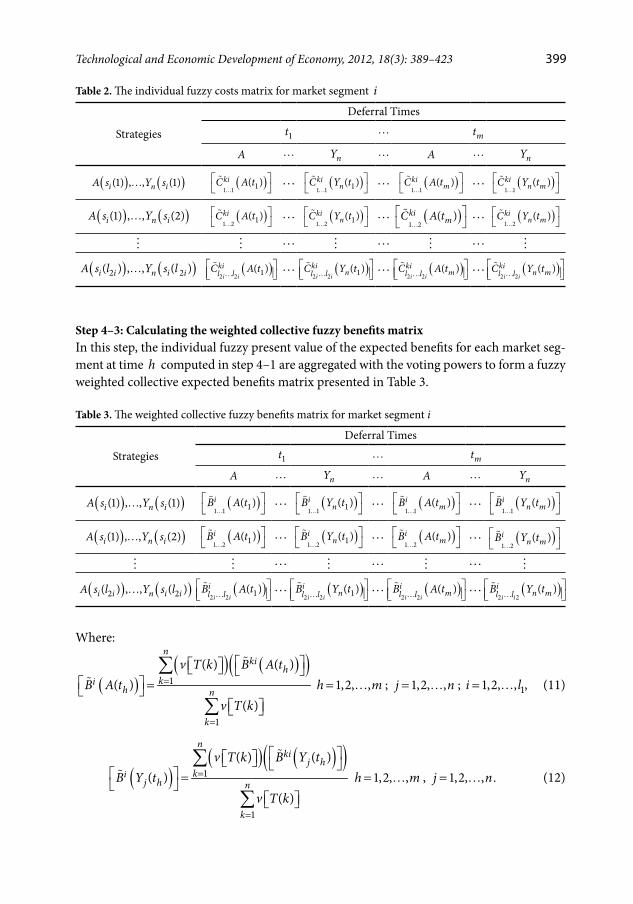
Table 2. The individual fuzzy costs matrix for market segment i
Strategies
Deferral Times
1t mt
A nY A nY
( ) ( )(1) , , (1)i n iA s Y s ( )1 1 1( )kiC A t
( )1 1 1( )ki
nC Y t
( )1 1
( )kimC A t
( )1 1
( )kin mC Y t
( ) ( )(1) , , (2)i n iA s Y s ( )1 2 1( )kiC A t
( )1 2 1( )ki
nC Y t
( )1 2
( )kimC A t
( )1 2
( )kin mC Y t
( ) ( )2 2( ) , , ( )i i n i iA s l Y s l ( )2 2 1( )
i ikil lC A t
( )2 2 1( )
i iki
nl lC Y t
( )2 2
( )i i
kiml lC A t
( )2 2
( )i i
kin ml lC Y t
Step 4–3: Calculating the weighted collective fuzzy benefits matrixIn this step, the individual fuzzy present value of the expected benefits for each market seg-ment at time h computed in step 4–1 are aggregated with the voting powers to form a fuzzy weighted collective expected benefits matrix presented in Table 3.
Table 3. The weighted collective fuzzy benefits matrix for market segment i
Strategies
Deferral Times
1t mt
A nY A nY
( ) ( )(1) , , (1)i n iA s Y s ( )1 1 1( )iB A t
( )1 1 1( )i
nB Y t
( )1 1
( )imB A t
( )1 1
( )in mB Y t
( ) ( )(1) , , (2)i n iA s Y s ( )1 2 1( )iB A t
( )1 2 1( )i
nB Y t
( )1 2
( )imB A t
( )1 2
( )in mB Y t
( ) ( )2 2( ) , , ( )i i n i iA s l Y s l ( )2 2 1( )
i iil lB A t
( )2 2 1( )
i ii
nl lB Y t
( )2 2
( )i i
iml lB A t
( )2 2
( )i i
in ml lB Y t
Where:
( )( ) ( )( )
1
1
( ) ( )( )
( )
nki
hki
h n
k
v T k B A tB A t
v T k
=
=
=
∑
∑
1,2, ,h m= ; 1,2, ,j n= ; 11,2, ,i l= , (11)
( )( ) ( )( )
1
1
( ) ( )( )
( )
nki
j hki
j h n
k
v T k B Y tB Y t
v T k
=
=
=
∑
∑
1,2, ,h m= , 1,2, ,j n= . (12)
399Technological and Economic Development of Economy, 2012, 18(3): 389–423
Dow
nloa
ded
by [
Mad
jid T
avan
a] a
t 07:
44 0
2 O
ctob
er 2
012
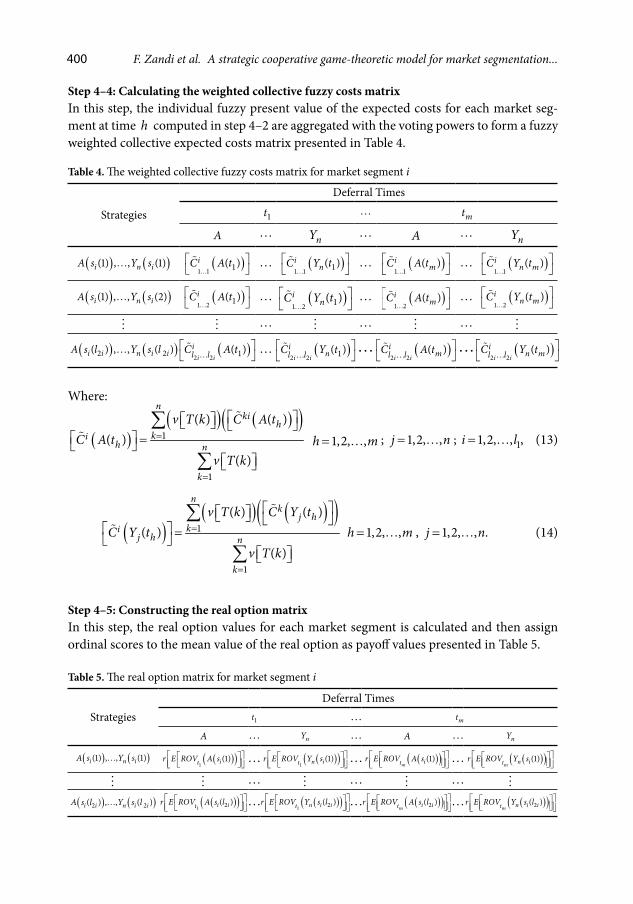
Step 4–4: Calculating the weighted collective fuzzy costs matrixIn this step, the individual fuzzy present value of the expected costs for each market seg-ment at time h computed in step 4–2 are aggregated with the voting powers to form a fuzzy weighted collective expected costs matrix presented in Table 4.
Table 4. The weighted collective fuzzy costs matrix for market segment i
Strategies
Deferral Times
1t mt
A nY A nY
( ) ( )(1) , , (1)i n iA s Y s ( )1 1 1( )iC A t
( )1 1 1( )i
nC Y t
( )1 1
( )imC A t
( )1 1
( )in mC Y t
( ) ( )(1) , , (2)i n iA s Y s ( )1 2 1( )iC A t
( )1 2 1( )i
nC Y t
( )1 2
( )imC A t
( )1 2
( )in mC Y t
( ) ( )2 2( ) , , ( )i i n i iA s l Y s l ( )2 2 1( )
i iil lC A t
( )2 2 1( )
i ii
nl lC Y t
( )2 2
( )i i
iml lC A t
( )2 2
( )i i
in ml lC Y t
Where:
( )( ) ( )( )
1
1
( ) ( )( )
( )
nki
hki
h n
k
v T k C A tC A t
v T k
=
=
=
∑
∑
1,2, ,h m=
; 1,2, ,j n= ; 11,2, ,i l= , (13)
( )( ) ( )( )
1
1
( ) ( )( )
( )
nk
j hki
j h n
k
v T k C Y tC Y t
v T k
=
=
=
∑
∑
1,2, ,h m= , 1,2, ,j n= . (14)
Step 4–5: Constructing the real option matrixIn this step, the real option values for each market segment is calculated and then assign ordinal scores to the mean value of the real option as payoff values presented in Table 5.
Table 5. The real option matrix for market segment i
StrategiesDeferral Times
1t mt
A nY A nY
( ) ( )(1) , , (1)i n iA s Y s ( )( )1
(1)itr E ROV A s
( )( )1
(1)n itr E ROV Y s
( )( )(1)m itr E ROV A s
( )( )(1)
m n itr E ROV Y s
( ) ( )2 2( ) , , ( )i i n i iA s l Y s l ( )( )1 2( )i itr E ROV A s l
( )( )
1 2( )n i itr E ROV Y s l
( )( )2( )m i itr E ROV A s l
( )( )2( )
m n i itr E ROV Y s l
400 F. Zandi et al. A strategic cooperative game-theoretic model for market segmentation...
Dow
nloa
ded
by [
Mad
jid T
avan
a] a
t 07:
44 0
2 O
ctob
er 2
012
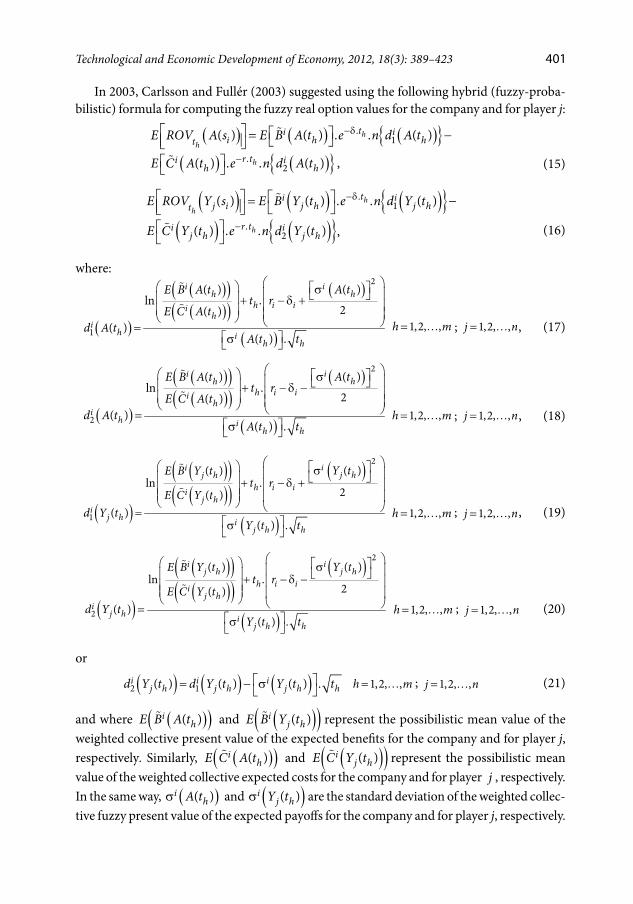
In 2003, Carlsson and Fullér (2003) suggested using the following hybrid (fuzzy-proba-bilistic) formula for computing the fuzzy real option values for the company and for player j:
( ) ( ) ( ){ }( ) ( ){ }
−δ
−
= −
.1
.2
( ) ( ) . . ( )
( ) . . ( )
hh
h
ti ii h ht
r ti ih h
E ROV A s E B A t e n d A t
E C A t e n d A t (15)
( ) ( ) ( ){ }( ) ( ){ }
−δ
−
= −
.1
.2
( ) ( ) . . ( )
( ) . . ( )
hh
h
ti ij i j h j ht
r ti ij h j h
E ROV Y s E B Y t e n d Y t
E C Y t e n d Y t (16)
where:
( )
( )( )( )( )
( )
( )
2
1
( )( )ln .
2( )( )
( ) .
iihh
h i iih
ih i
h h
A tE B A tt r
E C A td A t
A t t
σ + − δ + = σ
1,2, ,h m= ; 1,2, ,j n= , (17)
( )
( )( )( )( )
( )
( )
2
2
( )( )ln .
2( )( )
( ) .
iihh
h i iih
ih i
h h
A tE B A tt r
E C A td A t
A t t
σ + − δ − = σ
1,2, ,h m= ; 1,2, ,j n= , (18)
( )
( )( )( )( )
( )
( )
2
1
( )( )ln .
2( )( )
( ) .
iij hj h
h i iij h
ij h i
j h h
Y tE B Y tt r
E C Y td Y t
Y t t
σ + − δ + = σ
1,2, ,h m= ; 1,2, ,j n=
, (19)
( )
( )( )( )( )
( )
( )
2
2
( )( )ln .
2( )( )
( ) .
iij hj h
h i iij h
ij h i
j h h
Y tE B Y tt r
E C Y td Y t
Y t t
σ + − δ − = σ
1,2, ,h m= ; 1,2, ,j n=
(20)
or
( ) ( ) ( )2 1( ) ( ) ( ) .i i ij h j h j h hd Y t d Y t Y t t = − σ
1,2, ,h m= ; 1,2, ,j n=
(21)
and where ( )( )( )ihE B A t and ( )( )( )i
j hE B Y t represent the possibilistic mean value of the weighted collective present value of the expected benefits for the company and for player j, respectively. Similarly, ( )( )( )i
hE C A t and ( )( )( )ij hE C Y t represent the possibilistic mean
value of the weighted collective expected costs for the company and for player j , respectively. In the same way, ( )( )i
hA tσ and ( )( )ij hY tσ are the standard deviation of the weighted collec-
tive fuzzy present value of the expected payoffs for the company and for player j, respectively.
,
,
401Technological and Economic Development of Economy, 2012, 18(3): 389–423
Dow
nloa
ded
by [
Mad
jid T
avan
a] a
t 07:
44 0
2 O
ctob
er 2
012
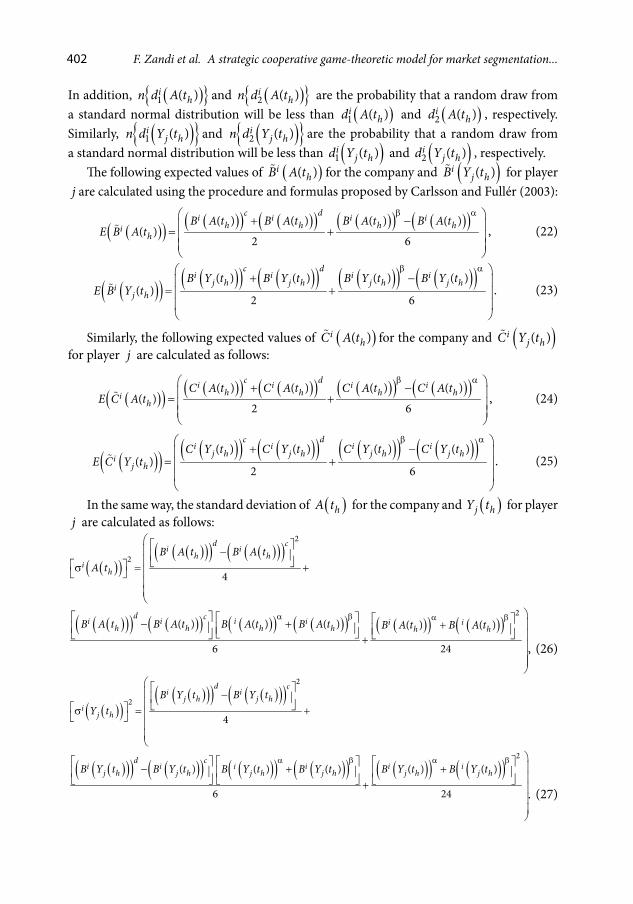
In addition, ( ){ }1 ( )ihn d A t and ( ){ }2 ( )i
hn d A t are the probability that a random draw from a standard normal distribution will be less than ( )1 ( )i
hd A t and ( )2 ( )ihd A t , respectively.
Similarly, ( ){ }1 ( )ij hn d Y t and ( ){ }2 ( )i
j hn d Y t are the probability that a random draw from a standard normal distribution will be less than ( )1 ( )i
j hd Y t and ( )2 ( )i
j hd Y t , respectively.The following expected values of ( )( )i
hB A t for the company and ( )( )ij hB Y t for player
j are calculated using the procedure and formulas proposed by Carlsson and Fullér (2003):
( )( ) ( )( ) ( )( ) ( )( ) ( )( )( ) ( ) ( ) ( )( )
2 6
c di i i ih h h hi
hB A t B A t B A t B A t
E B A tβ α + − = +
, (22)
( )( ) ( )( ) ( )( ) ( )( ) ( )( )( ) ( ) ( ) ( )( )
2 6
c di i i i
j h j h j h j hij h
B Y t B Y t B Y t B Y tE B Y t
β α + −
= +
. (23)
Similarly, the following expected values of ( )( )ihC A t for the company and ( )( )i
j hC Y t for player j are calculated as follows:
( )( ) ( )( ) ( )( ) ( )( ) ( )( )( ) ( ) ( ) ( )( )
2 6
c di i i ih h h hi
hC A t C A t C A t C A t
E C A tβ α + − = +
, (24)
( )( ) ( )( ) ( )( ) ( )( ) ( )( )( ) ( ) ( ) ( )( )
2 6
c di i i i
j h j h j h j hij h
C Y t C Y t C Y t C Y tE C Y t
β α + −
= +
. (25)
In the same way, the standard deviation of ( )hA t for the company and ( )j hY t for player j are calculated as follows:
( )( )( )( )( ) ( )( )( )
( )( )( ) ( )( ) ( )( ) ( )( ) ( )( ) ( )( )α β α β
− σ = +
− + + +
2
2
2
4
( ) ( ) ( ) ( ) ( )
6 24
d ci ih h
ih
d ci i i i i ih h h h h h
B A t B A tA t
B A t B A t B A t B A t B A t B A t
, (26)
( )( )( )( )( ) ( )( )( )
( )( )( ) ( )( ) ( )( ) ( )( ) ( )( ) ( )( )α β α β
− σ = +
− + + +
2
2
2
4
( ) ( ) ( ) ( ) ( )
6 24
d ci i
j h j hi
j h
d ci i i i i i
j h j h j h j h j h j h
B Y t B Y tY t
B Y t B Y t B Y t B Y t B Y t B Y t
. (27)
402 F. Zandi et al. A strategic cooperative game-theoretic model for market segmentation...
Dow
nloa
ded
by [
Mad
jid T
avan
a] a
t 07:
44 0
2 O
ctob
er 2
012
The possibility distribution of the expected costs and the present value of the expected benefits could also be represented by non-linear (e.g. Gaussian) membership functions. How-ever, from a computational point of view it is easier to use linear membership functions and, more importantly, as suggested by Klir and Yuan (1995) and Yeh and Deng (2004), trapezoi-dal fuzzy numbers are used most often for characterizing imprecise, vague and ambiguous information in practical applications.
Phase 5: Selecting the optimal market segment
This phase is divided into the following four steps:
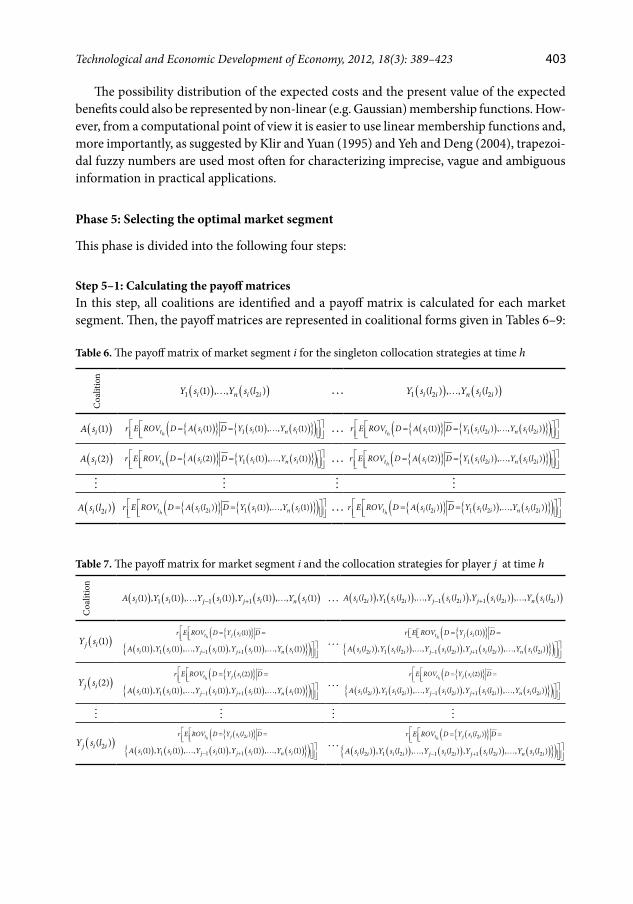
Step 5–1: Calculating the payoff matricesIn this step, all coalitions are identified and a payoff matrix is calculated for each market segment. Then, the payoff matrices are represented in coalitional forms given in Tables 6–9:
Table 6. The payoff matrix of market segment i for the singleton collocation strategies at time h
Coa
litio
n
( ) ( )1 2(1) , , ( )i n i iY s Y s l ( ) ( )1 2 2( ) , , ( )i i n i iY s l Y s l
( )(1)iA s ( ){ } ( ) ( ){ }( )1(1) (1) , , (1)ht i i n ir E ROV D A s D Y s Y s = =
( ){ } ( ) ( ){ }( )1 2 2(1) ( ) , , ( )ht i i i n i ir E ROV D A s D Y s l Y s l = =
( )(2)iA s ( ){ } ( ) ( ){ }( )1(2) (1) , , (1)ht i i n ir E ROV D A s D Y s Y s = =
( ){ } ( ) ( ){ }( )1 2 2(2) ( ) , , ( )ht i i i n i ir E ROV D A s D Y s l Y s l = =
( )2( )i iA s l ( ){ } ( ) ( ){ }( )2 1( ) (1) , , (1)ht i i i n ir E ROV D A s l D Y s Y s = =
( ){ } ( ) ( ){ }( )2 1 2 2( ) ( ) , , ( )ht i i i i n i ir E ROV D A s l D Y s l Y s l = =
Table 7. The payoff matrix for market segment i and the collocation strategies for player j at time h
Coa
litio
n
( ) ( ) ( ) ( ) ( )1 1 1(1) , (1) , , (1) , (1) , , (1)i i j i j i n iA s Y s Y s Y s Y s− +
( ) ( ) ( ) ( ) ( )2 1 2 1 2 1 2 2( ) , ( ) , , ( ) , ( ) , , ( )i i i i j i i j i i n i iA s l Y s l Y s l Y s l Y s l− +
( )(1)j iY s( ){ }( (1)
ht j ir E ROV D Y s D = = ( ) ( ) ( ) ( ) ( ){ })1 1 1(1) , (1) , , (1) , (1) , , (1)i i j i j i n iA s Y s Y s Y s Y s− +
( ){ }( (1)ht j ir E ROV D Y s D= =
( ) ( ) ( ) ( ) ( ){ })2 1 2 1 2 1 2 2( ) , ( ) , , ( ) , ( ) , , ( )i i i i j i i j i i n i iA s l Y s l Y s l Y s l Y s l− +
( )(2)j iY s( ){ }( (2)
ht j ir E ROV D Y s D = = ( ) ( ) ( ) ( ) ( ){ })1 1 1(1) , (1) , , (1) , (1) , , (1)i i j i j i n iA s Y s Y s Y s Y s− +
( ){ }( (2)ht j ir E ROV D Y s D = =
( ) ( ) ( ) ( ) ( ){ })2 1 2 1 2 1 2 2( ) , ( ) , , ( ) , ( ) , , ( )i i i i j i i j i i n i iA s l Y s l Y s l Y s l Y s l− +
( )2( )j i iY s l( ){ }( 2( )
ht j i ir E ROV D Y s l D = = ( ) ( ) ( ) ( ) ( ){ })1 1 1(1) , (1) , , (1) , (1) , , (1)i i j i j i n iA s Y s Y s Y s Y s− +
( ){ }( 2( )ht j i ir E ROV D Y s l D = =
( ) ( ) ( ) ( ) ( ){ })2 1 2 1 2 1 2 2( ) , ( ) , , ( ) , ( ) , , ( )i i i i j i i j i i n i iA s l Y s l Y s l Y s l Y s l− +
403Technological and Economic Development of Economy, 2012, 18(3): 389–423
Dow
nloa
ded
by [
Mad
jid T
avan
a] a
t 07:
44 0
2 O
ctob
er 2
012
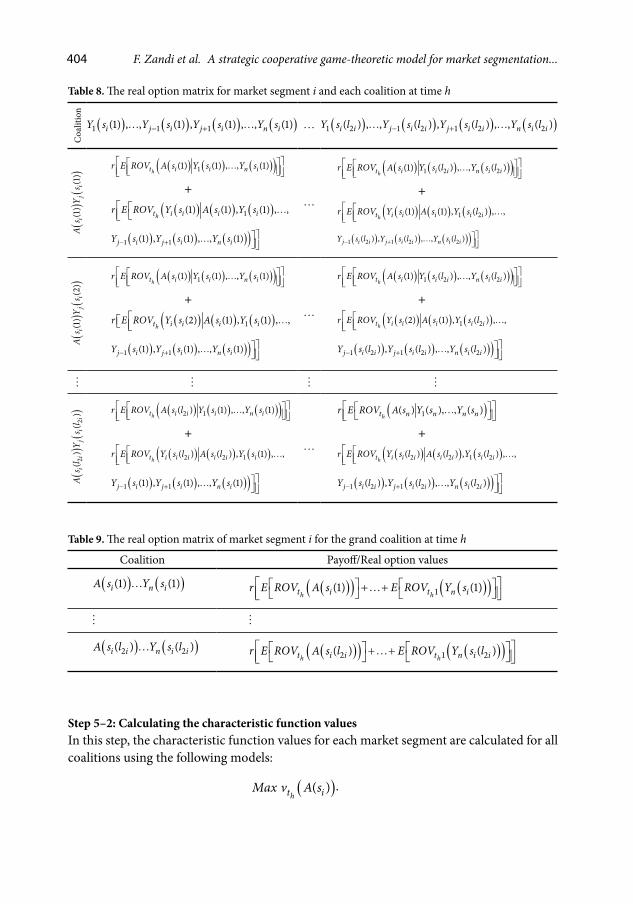
Table 8. The real option matrix for market segment i and each coalition at time hC
oalit
ion
( ) ( ) ( ) ( )1 1 1(1) , , (1) , (1) , , (1)i j i j i n iY s Y s Y s Y s− + ( ) ( ) ( ) ( )1 2 1 2 1 2 2( ) , , ( ) , ( ) , , ( )i i j i i j i i n i iY s l Y s l Y s l Y s l− +
()
()
(1)
(1)
ij
iA
sY
s
( ) ( ) ( )( )1(1) (1) , , (1)ht i i n ir E ROV A s Y s Y s
+
( )( ( ) ( )1(1) (1) , (1) , ,ht i i i ir E ROV Y s A s Y s
( ) ( ) ( ))1 1(1) , (1) , , (1)j i j i n iY s Y s Y s− +
( ) ( ) ( )( )1 2 2(1) ( ) , , ( )ht i i i n i ir E ROV A s Y s l Y s l
+
( ) ( ) ( )( 1 2(1) (1) , ( ) , ,ht i i i i ir E ROV Y s A s Y s l
( ) ( ) ( ))1 2 1 2 2( ) , ( ) , , ( )j i i j i i n i iY s l Y s l Y s l− +
()
()
(1)
(2)
ij
iA
sY
s
( ) ( ) ( )( )1(1) (1) , , (1)ht i i n ir E ROV A s Y s Y s
+
( ) ( ) ( )( 1(2) (1) , (1) , ,ht i i i ir E ROV Y s A s Y s
( ) ( ) ( ))1 1(1) , (1) , , (1)j i j i n iY s Y s Y s− +
( ) ( ) ( )( )1 2 2(1) ( ) , , ( )ht i i i n i ir E ROV A s Y s l Y s l
+
( ) ( ) ( )( 1 2(2) (1) , ( ) , ,ht i i i i ir E ROV Y s A s Y s l
( ) ( ) ( ))1 2 1 2 2( ) , ( ) , , ( )j i i j i i n i iY s l Y s l Y s l− +
()
()
22
()
()
ii
ji
iA
sl
Ys
l
( ) ( ) ( )( )2 1( ) (1) , , (1)ht i i i n ir E ROV A s l Y s Y s
+
( ) ( ) ( )( 2 2 1( ) ( ) , (1) , ,ht i i i i i ir E ROV Y s l A s l Y s
( ) ( ) ( ))1 1(1) , (1) , , (1)j i j i n iY s Y s Y s− +
( )1( ) ( ), , ( )ht n n n nr E ROV A s Y s Y s
+
( ) ( ) ( )( 2 2 1 2( ) ( ) , ( ) , ,ht i i i i i i ir E ROV Y s l A s l Y s l
( ) ( ) ( ))1 2 1 2 2( ) , ( ) , , ( )j i i j i i n i iY s l Y s l Y s l− +
Table 9. The real option matrix of market segment i for the grand coalition at time h
Coalition Payoff/Real option values
( ) ( )(1) (1)i n iA s Y s ( )( ) ( )( )1(1) (1)h ht i t n ir E ROV A s E ROV Y s + +
( ) ( )2 2( ) ( )i i n i iA s l Y s l ( )( ) ( )( )2 1 2( ) ( )h ht i i t n i ir E ROV A s l E ROV Y s l + +
Step 5–2: Calculating the characteristic function valuesIn this step, the characteristic function values for each market segment are calculated for all coalitions using the following models:
( )( )ht iMax v A s .
404 F. Zandi et al. A strategic cooperative game-theoretic model for market segmentation...
Dow
nloa
ded
by [
Mad
jid T
avan
a] a
t 07:
44 0
2 O
ctob
er 2
012
Subject to: (Strategic Game Model 1F )
( ){ } ( ) ( ){ }( ) ( )2
11
. (1) ( ) , , ( ) ( ) 1,2, ,i
h h
l
a t i i n i t ia
p r E ROV D A s D Y s a Y s a v A s h m=
= = ≥ = ∑
( ){ } ( ) ( ){ }( ) ( )2
2 1 2 21
. ( ) ( ) , , ( ) ( )i
h h
l
a t i i i i n i i t ia
p r E ROV D A s L D Y s l Y s l v A s=
= = ≥ ∑
21 2 1
ilp p p+ + + =
21 2, , , 0
ilp p p ≥
( )( )ht iv A s : Free variable
( ) ( ) ( ) ( ){ }( )1 1( ), ( ) , ( ) . ( ) , ( ) , , ( )
h ht i i n i a t i i n ia
Max v A s Y s Y s p r E ROV D A s f Y s f Y s f = = ∑
Subject to: (Strategic Game Model gF )
0 1 2 1np p p p+ + + + =
0 1 2, , , , 0np p p p ≥
( )1( ), ( ) , ( )ht i i n iv A s Y s Y s : Free variable
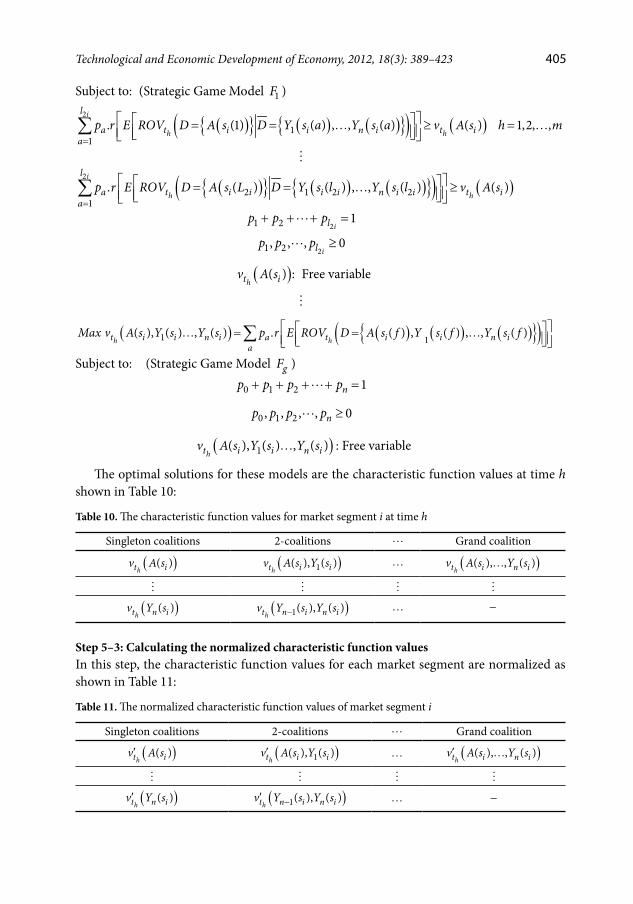
The optimal solutions for these models are the characteristic function values at time h shown in Table 10:
Table 10. The characteristic function values for market segment i at time h
Singleton coalitions 2-coalitions Grand coalition
( )( )ht iv A s ( )1( ), ( )
ht i iv A s Y s ( )( ), , ( )ht i n iv A s Y s
( )( )ht n iv Y s ( )1( ), ( )
ht n i n iv Y s Y s− −
Step 5–3: Calculating the normalized characteristic function valuesIn this step, the characteristic function values for each market segment are normalized as shown in Table 11:
Table 11. The normalized characteristic function values of market segment i
Singleton coalitions 2-coalitions Grand coalition
( )( )ht iv A s′ ( )1( ), ( )
ht i iv A s Y s′ ( )( ), , ( )
ht i n iv A s Y s′
( )( )ht n iv Y s′ ( )1( ), ( )
ht n i n iv Y s Y s−′ −
405Technological and Economic Development of Economy, 2012, 18(3): 389–423
Dow
nloa
ded
by [
Mad
jid T
avan
a] a
t 07:
44 0
2 O
ctob
er 2
012
Where:
( ) ( )
( ) ( )
i a
i N
v a v iv
v N v i
∈
∈
−′ =
−
∑
∑. (28)
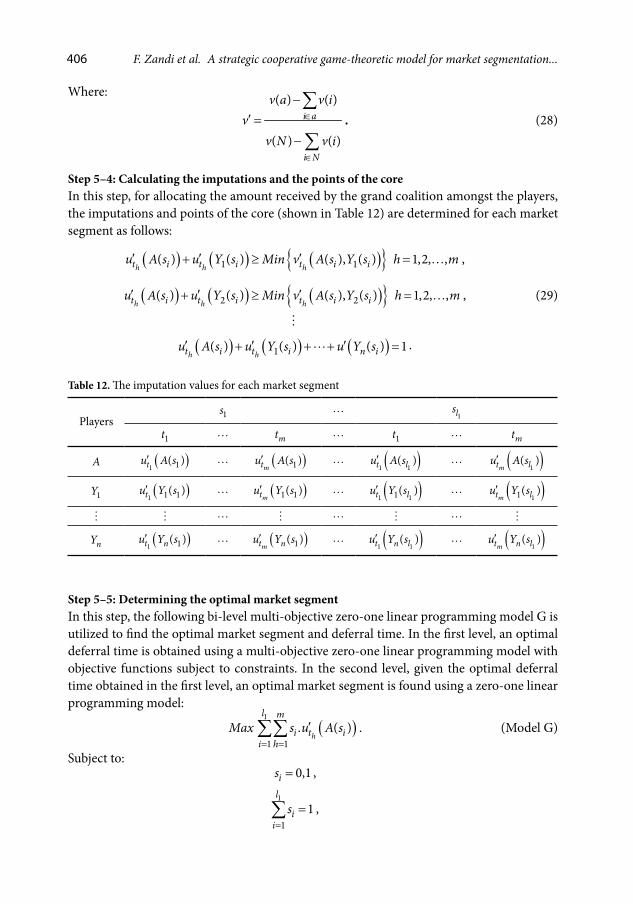
Step 5–4: Calculating the imputations and the points of the coreIn this step, for allocating the amount received by the grand coalition amongst the players, the imputations and points of the core (shown in Table 12) are determined for each market segment as follows:
( ) ( ) ( ){ }1 1( ) ( ) ( ), ( )h h ht i t i t i iu A s u Y s Min v A s Y s′ ′ ′+ ≥ 1,2, ,h m= ,
( ) ( ) ( ){ }2 2( ) ( ) ( ), ( )h h ht i t i t i iu A s u Y s Min v A s Y s′ ′ ′+ ≥ 1,2, ,h m= , (29)
( ) ( ) ( )1( ) ( ) ( ) 1
h ht i t i n iu A s u Y s u Y s′ ′ ′+ + + =
.
Table 12. The imputation values for each market segment
Players1s
1ls
1t mt 1t mt
A ( )1 1( )tu A s′ ( )1( )
mtu A s′ ( )1 1
( )t lu A s′ ( )1( )
mt lu A s′
1Y ( )1 1 1( )tu Y s′ ( )1 1( )
mtu Y s′ ( )1 11( )t lu Y s′ ( )11( )
mt lu Y s′
nY ( )1 1( )t nu Y s′ ( )1( )
mt nu Y s′ ( )1 1( )t n lu Y s′ ( )1
( )mt n lu Y s′
Step 5–5: Determining the optimal market segmentIn this step, the following bi-level multi-objective zero-one linear programming model G is utilized to find the optimal market segment and deferral time. In the first level, an optimal deferral time is obtained using a multi-objective zero-one linear programming model with objective functions subject to constraints. In the second level, given the optimal deferral time obtained in the first level, an optimal market segment is found using a zero-one linear programming model:
( )1
1 1. ( )
h
l m
i t ii h
Max s u A s= =
′∑∑ . (Model G)
Subject to: 0,1is = ,
1
11
l
ii
s=
=∑ ,
406 F. Zandi et al. A strategic cooperative game-theoretic model for market segmentation...
Dow
nloa
ded
by [
Mad
jid T
avan
a] a
t 07:
44 0
2 O
ctob
er 2
012
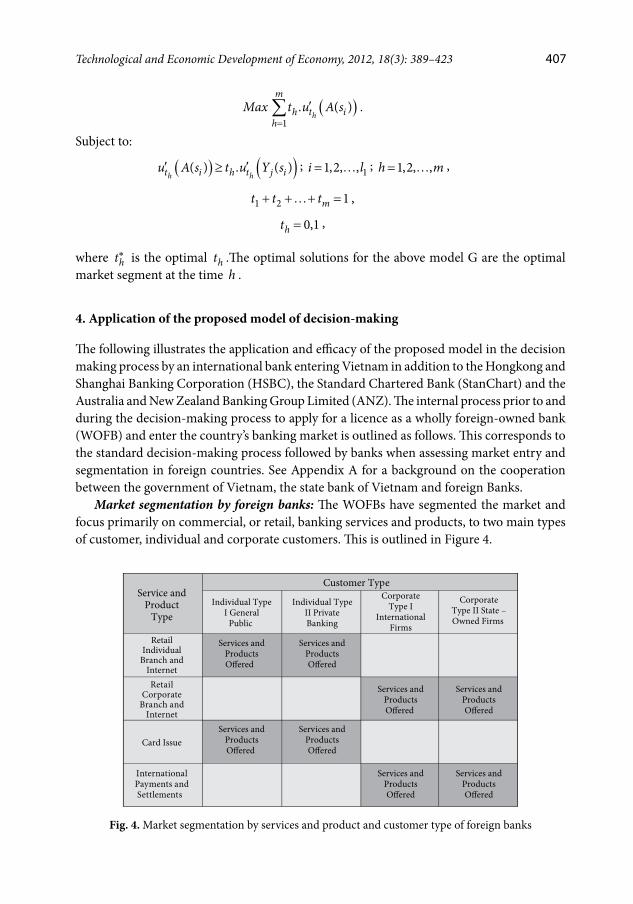
( )1
. ( )h
m
h t ih
Max t u A s=
′∑ .
Subject to:
( ) ( )( ) . ( )h ht i h t j iu A s t u Y s′ ′≥ ; 11,2, ,i l=
; 1,2, ,h m=
,
1 2 1mt t t+ + + = ,
0,1ht = ,
where ht∗ is the optimal ht .The optimal solutions for the above model G are the optimal market segment at the time h .
4. Application of the proposed model of decision-making
The following illustrates the application and efficacy of the proposed model in the decision making process by an international bank entering Vietnam in addition to the Hongkong and Shanghai Banking Corporation (HSBC), the Standard Chartered Bank (StanChart) and the Australia and New Zealand Banking Group Limited (ANZ). The internal process prior to and during the decision-making process to apply for a licence as a wholly foreign-owned bank (WOFB) and enter the country’s banking market is outlined as follows. This corresponds to the standard decision-making process followed by banks when assessing market entry and segmentation in foreign countries. See Appendix A for a background on the cooperation between the government of Vietnam, the state bank of Vietnam and foreign Banks.
Market segmentation by foreign banks: The WOFBs have segmented the market and focus primarily on commercial, or retail, banking services and products, to two main types of customer, individual and corporate customers. This is outlined in Figure 4.
Services andProductsO�ered
RetailCorporate
Branch andInternet
Card Issue
Customer Type
InternationalPayments andSettlements
Service andProduct
Type
RetailIndividual
Branch andInternet
Individual TypeI General
Public
Individual TypeII PrivateBanking
CorporateType I
InternationalFirms
CorporateType II State –Owned Firms
Services andProductsO�ered
Services andProductsO�ered
Services andProductsO�ered
Services andProductsO�ered
Services andProductsO�ered
Services andProductsO�ered
Services andProductsO�ered
Fig. 4. Market segmentation by services and product and customer type of foreign banks
407Technological and Economic Development of Economy, 2012, 18(3): 389–423
Dow
nloa
ded
by [
Mad
jid T
avan
a] a
t 07:
44 0
2 O
ctob
er 2
012
The foreign banks are at disadvantage in that they are required to establish their WOFB de novo. Therefore, they must compete on superior quality services and products and must focus on the main urban areas and specific types of customers. The government of Vietnam is promoting electronic payments and settlements and the accession of Vietnam to the World Trade Organization (WTO) in 2007 has increased international trade and this has led to a demand for international payments and settlements services and this is an advantage for foreign banks as they have the technological expertise and the international networks. Technology, therefore, is a means of overcoming the disadvantages of geographic reach in Vietnam by focusing on and being prominent in electronic banking through card issuing and through internet banking. They could extend their geographic market share relative to their branch market reach by attracting customers who are spatially at a distance and who want quality banking services and products that may be accessed remotely. This applies to both technologically advanced individual and corporate customers.
Internet banking, mobile banking, and Automated Teller Machines (ATMs) reduce the requirement to have a network of branches and the cost of branches and increases potential geographic scope. It also eliminates temporal constraints on bank branches. The foreign banks have specifically used this to their advantage, as well, as being members of the national clear-ing system managed by the State Bank of Vietnam (SBV), and the integrated card alliances, and also having stakes in domestic banks.
International payments and settlements services and products are increasing for corpo-rate customers especially those involved in foreign trade and the international banks have an advantage through their networks. Commercial banks have prioritized the card market as being one that is underdeveloped and a possible source of additional revenue. Checks are not widely used in Vietnam for payments and settlements due to the delay in clearing. This is an advantage for the foreign banks. Although according to Nielsen Viet Nam only 23% of the population uses debit cards. Furthermore, there are over 40.000 merchants accepting payment cards the amount of Electronic Funds Transfer at Point Of Sale (EFTPOS) units are limited due to and merchants’ unwillingness to pay charges.
Cooperation strategies: In order to operate banking services banks must be part of clearing and funds transfer systems. Therefore, WOFBs have to cooperate with existing clearing and payments and settlements systems. The SBV centrally manages payments through its inter-bank payment system and in 2008 extended the system throughout to the entire the country to include more provincial branches of the SBV, the SBV financial accounting department, all credit institutions, the check clearing system, the card clearing system.
In order to issue branded cards banks must enter an agreement with the main interna-tional card issuers and payments organizations for branding purposes and for merchant payments EFTPOS units, and reciprocal acceptance of different branded cards, nationally and internationally. This cooperation with the branded card issuers is with different banks that compete with the same branded cards. In 2010 there were three state-owned bank card issuers, 33 Joint Stock Commercial Banks, and 11 foreign bank card issuers1. By 2010 these 47 banks had issued 28.5 million cards. This required cooperation between the card issuing banks to share ATM distributors and EFTPOS units.
1 State Bank of Vietnam, Memo No: 7723/NHNN-TT dated 8 October 2010.
408 F. Zandi et al. A strategic cooperative game-theoretic model for market segmentation...
Dow
nloa
ded
by [
Mad
jid T
avan
a] a
t 07:
44 0
2 O
ctob
er 2
012

Payment gateways cooperation: The government wants to improve and increase the use of the electronic payments and settlements system and directed Smartlink and BanknetVN, the two largest card alliances, to interconnect their systems in 2008 and to interconnect with VNBC in 2009. The integrated card alliances’ systems and reciprocity of Banknetvn, Smartlink or VNBC allows 20 million cards holders access to any of the 10,200 ATMs and 37,000 EFTPOSs of member banks. Techcombank in which HSBC has a stake, ACB in which StanChart has a stake, Sacombank of which ANZ has a stake, are member banks of the alli-ance. The alliance also reduces the cost of installing EFTPOS and ATMs and should increase the use of cards and electronic payments and settlements.
Strategy formulation: Four senior managers of the bank were selected to be part of a team to study market segmentation in Vietnam. The team comprised of four representatives of the Strategy Department, Marketing Department, Economics Department and the Tax Accounting Department.
The team analyzed the foreign banking market prior to applying for a licence and following this assessment the bank agreed internally that they should enter the country and negoti-ate the best possible licence agreement for the bank and one that would also be acceptable to the Vietnamese government, considering that the Vietnamese government is requesting additional foreign banks to enter its banking market. The team also had a remit to deter-mine the segments for providing services and products and the most profitable customer segments. As this is potentially a high growth market and there are many opportunities to provide banking services at a relatively low marginal cost by transferring capital, knowledge, and products, technology and systems that they have already developed and delivered in many other countries a decision is made to apply for a licence despite the presence of other foreign banks, such as, HSBC, StanChart and ANZ.
The experts ascertained three main cooperative players in their preferred markets and four types of services and products to be introduced over three years. Essentially the strategies available to the bank were based on customer type and service and product type. As it could not endeavour to satisfy the demand of all potential customers, due to entering the market de novo, having limited resources, the bank had to decide on the segments and sub-segments of customer type and on the segments and sub-segments of the services and products type that it is to offer.
It was decided that the basis for applying for the licence was based on providing com-mercial banking services and products and to offer four generic types of commercial banking services and products to only two generic types of customers. These were individual customers and corporate customers. The commercial banking market for individual customers was also segmented by financial net worth, so that there were two main sub-segments, individuals with an income below a determined level and those considered financially high net worth individuals. Likewise, corporate customers were segmented into state-owned firms and international firms.
Competitors for coalition: Foreign banks and the Vietnamese government consider they both gain from entering into an agreement. The government’s regulations were negotiable depending on the brand and financial status of the bank requesting a licence. These could be classified on three levels of outcome. That is, the ideal outcome for the government that
409Technological and Economic Development of Economy, 2012, 18(3): 389–423
Dow
nloa
ded
by [
Mad
jid T
avan
a] a
t 07:
44 0
2 O
ctob
er 2
012
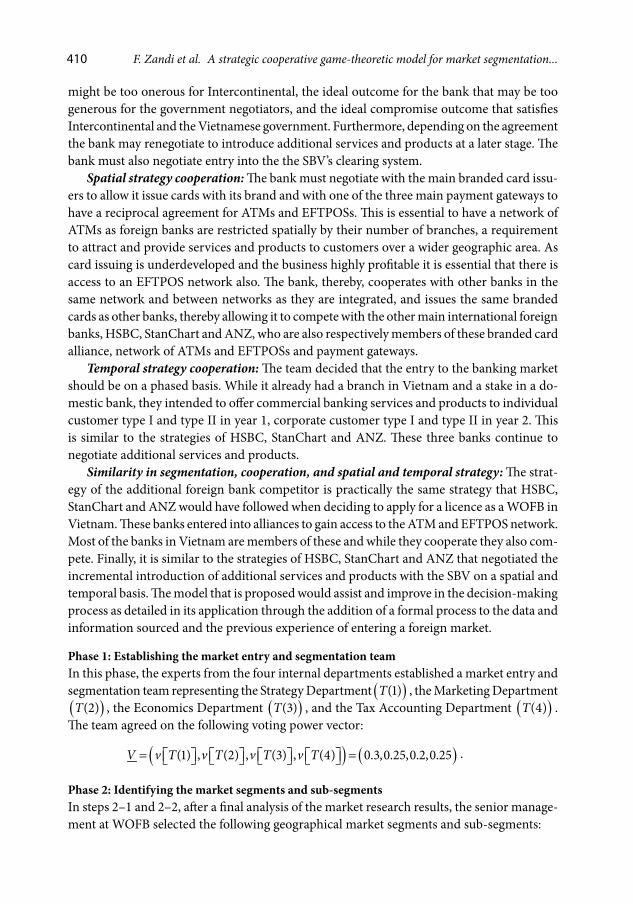
might be too onerous for Intercontinental, the ideal outcome for the bank that may be too generous for the government negotiators, and the ideal compromise outcome that satisfies Intercontinental and the Vietnamese government. Furthermore, depending on the agreement the bank may renegotiate to introduce additional services and products at a later stage. The bank must also negotiate entry into the the SBV’s clearing system.
Spatial strategy cooperation: The bank must negotiate with the main branded card issu-ers to allow it issue cards with its brand and with one of the three main payment gateways to have a reciprocal agreement for ATMs and EFTPOSs. This is essential to have a network of ATMs as foreign banks are restricted spatially by their number of branches, a requirement to attract and provide services and products to customers over a wider geographic area. As card issuing is underdeveloped and the business highly profitable it is essential that there is access to an EFTPOS network also. The bank, thereby, cooperates with other banks in the same network and between networks as they are integrated, and issues the same branded cards as other banks, thereby allowing it to compete with the other main international foreign banks, HSBC, StanChart and ANZ, who are also respectively members of these branded card alliance, network of ATMs and EFTPOSs and payment gateways.
Temporal strategy cooperation: The team decided that the entry to the banking market should be on a phased basis. While it already had a branch in Vietnam and a stake in a do-mestic bank, they intended to offer commercial banking services and products to individual customer type I and type II in year 1, corporate customer type I and type II in year 2. This is similar to the strategies of HSBC, StanChart and ANZ. These three banks continue to negotiate additional services and products.
Similarity in segmentation, cooperation, and spatial and temporal strategy: The strat-egy of the additional foreign bank competitor is practically the same strategy that HSBC, StanChart and ANZ would have followed when deciding to apply for a licence as a WOFB in Vietnam. These banks entered into alliances to gain access to the ATM and EFTPOS network. Most of the banks in Vietnam are members of these and while they cooperate they also com-pete. Finally, it is similar to the strategies of HSBC, StanChart and ANZ that negotiated the incremental introduction of additional services and products with the SBV on a spatial and temporal basis. The model that is proposed would assist and improve in the decision-making process as detailed in its application through the addition of a formal process to the data and information sourced and the previous experience of entering a foreign market.
Phase 1: Establishing the market entry and segmentation teamIn this phase, the experts from the four internal departments established a market entry and segmentation team representing the Strategy Department ( )(1)T , the Marketing Department ( )(2)T , the Economics Department ( )(3)T , and the Tax Accounting Department
( )(4)T . The team agreed on the following voting power vector:
( ) ( )(1) , (2) , (3) , (4) 0.3,0.25,0.2,0.25V v T v T v T v T= = .
Phase 2: Identifying the market segments and sub-segmentsIn steps 2–1 and 2–2, after a final analysis of the market research results, the senior manage-ment at WOFB selected the following geographical market segments and sub-segments:
410 F. Zandi et al. A strategic cooperative game-theoretic model for market segmentation...
Dow
nloa
ded
by [
Mad
jid T
avan
a] a
t 07:
44 0
2 O
ctob
er 2
012
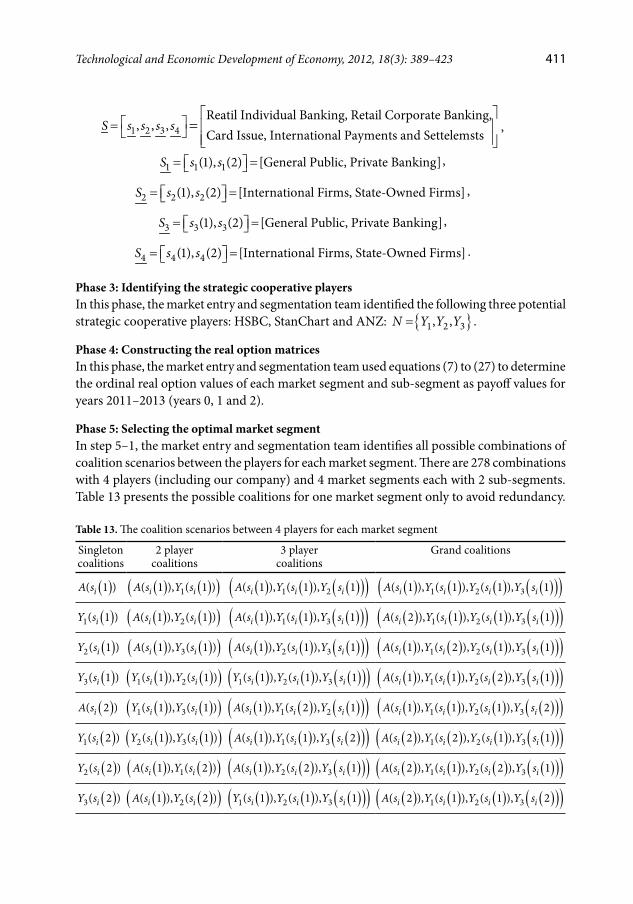
1 2 3 4Reatil Individual Banking, Retail Corporate Banking,
, , ,Card Issue, International Payments and Settelemsts
S s s s s
= = ,
1 1 1(1), (2) [General Public, Private Banking]S s s= = ,
2 2 2(1), (2) [International Firms, State-Owned Firms]S s s= = ,
= = 3 3 3(1), (2) [General Public, Private Banking]S s s ,
= = 4 4 4(1), (2) [International Firms, State-Owned Firms]S s s .
Phase 3: Identifying the strategic cooperative playersIn this phase, the market entry and segmentation team identified the following three potential strategic cooperative players: HSBC, StanChart and ANZ: { }1 2 3, ,N Y Y Y= .
Phase 4: Constructing the real option matricesIn this phase, the market entry and segmentation team used equations (7) to (27) to determine the ordinal real option values of each market segment and sub-segment as payoff values for years 2011–2013 (years 0, 1 and 2).
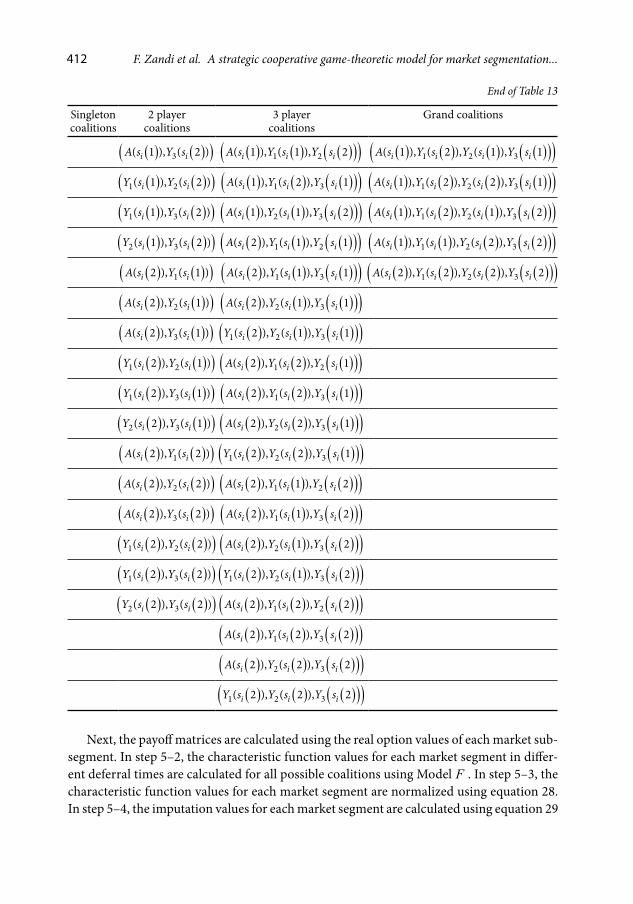
Phase 5: Selecting the optimal market segmentIn step 5–1, the market entry and segmentation team identifies all possible combinations of coalition scenarios between the players for each market segment. There are 278 combinations with 4 players (including our company) and 4 market segments each with 2 sub-segments. Table 13 presents the possible coalitions for one market segment only to avoid redundancy.
Table 13. The coalition scenarios between 4 players for each market segment
Singleton coalitions
2 playercoalitions
3 playercoalitions
Grand coalitions
( )( 1 )iA s ( ) ( )( )1( 1 ), ( 1 )i iA s Y s ( ) ( ) ( )( )( )1 2( 1 ), ( 1 ), 1i i iA s Y s Y s ( ) ( ) ( ) ( )( )( )1 2 3( 1 ), ( 1 ), ( 1 ), 1i i i iA s Y s Y s Y s
( )1( 1 )iY s ( ) ( )( )2( 1 ), ( 1 )i iA s Y s ( ) ( ) ( )( )( )1 3( 1 ), ( 1 ), 1i i iA s Y s Y s ( ) ( ) ( ) ( )( )( )1 2 3( 2 ), ( 1 ), ( 1 ), 1i i i iA s Y s Y s Y s
( )2( 1 )iY s ( ) ( )( )3( 1 ), ( 1 )i iA s Y s ( ) ( ) ( )( )( )2 3( 1 ), ( 1 ), 1i i iA s Y s Y s ( ) ( ) ( ) ( )( )( )1 2 3( 1 ), ( 2 ), ( 1 ), 1i i i iA s Y s Y s Y s
( )3( 1 )iY s ( ) ( )( )1 2( 1 ), ( 1 )i iY s Y s ( ) ( ) ( )( )( )1 2 3( 1 ), ( 1 ), 1i i iY s Y s Y s ( ) ( ) ( ) ( )( )( )1 2 3( 1 ), ( 1 ), ( 2 ), 1i i i iA s Y s Y s Y s
( )( 2 )iA s ( ) ( )( )1 3( 1 ), ( 1 )i iY s Y s ( ) ( ) ( )( )( )1 2( 1 ), ( 2 ), 1i i iA s Y s Y s ( ) ( ) ( ) ( )( )( )1 2 3( 1 ), ( 1 ), ( 1 ), 2i i i iA s Y s Y s Y s
( )1( 2 )iY s ( ) ( )( )2 3( 1 ), ( 1 )i iY s Y s ( ) ( ) ( )( )( )1 3( 1 ), ( 1 ), 2i i iA s Y s Y s ( ) ( ) ( ) ( )( )( )1 2 3( 2 ), ( 2 ), ( 1 ), 1i i i iA s Y s Y s Y s
( )2( 2 )iY s ( ) ( )( )1( 1 ), ( 2 )i iA s Y s ( ) ( ) ( )( )( )2 3( 1 ), ( 2 ), 1i i iA s Y s Y s ( ) ( ) ( ) ( )( )( )1 2 3( 2 ), ( 1 ), ( 2 ), 1i i i iA s Y s Y s Y s
( )3( 2 )iY s ( ) ( )( )2( 1 ), ( 2 )i iA s Y s ( ) ( ) ( )( )( )1 2 3( 1 ), ( 1 ), 1i i iY s Y s Y s ( ) ( ) ( ) ( )( )( )1 2 3( 2 ), ( 1 ), ( 1 ), 2i i i iA s Y s Y s Y s
411Technological and Economic Development of Economy, 2012, 18(3): 389–423
Dow
nloa
ded
by [
Mad
jid T
avan
a] a
t 07:
44 0
2 O
ctob
er 2
012
Singleton coalitions
2 playercoalitions
3 playercoalitions
Grand coalitions
( ) ( )( )3( 1 ), ( 2 )i iA s Y s ( ) ( ) ( )( )( )1 2( 1 ), ( 1 ), 2i i iA s Y s Y s ( ) ( ) ( ) ( )( )( )1 2 3( 1 ), ( 2 ), ( 1 ), 1i i i iA s Y s Y s Y s
( ) ( )( )1 2( 1 ), ( 2 )i iY s Y s ( ) ( ) ( )( )( )1 3( 1 ), ( 2 ), 1i i iA s Y s Y s ( ) ( ) ( ) ( )( )( )1 2 3( 1 ), ( 2 ), ( 2 ), 1i i i iA s Y s Y s Y s
( ) ( )( )1 3( 1 ), ( 2 )i iY s Y s ( ) ( ) ( )( )( )2 3( 1 ), ( 1 ), 2i i iA s Y s Y s ( ) ( ) ( ) ( )( )( )1 2 3( 1 ), ( 2 ), ( 1 ), 2i i i iA s Y s Y s Y s
( ) ( )( )2 3( 1 ), ( 2 )i iY s Y s ( ) ( ) ( )( )( )1 2( 2 ), ( 1 ), 1i i iA s Y s Y s ( ) ( ) ( ) ( )( )( )1 2 3( 1 ), ( 1 ), ( 2 ), 2i i i iA s Y s Y s Y s
( ) ( )( )1( 2 ), ( 1 )i iA s Y s ( ) ( ) ( )( )( )1 3( 2 ), ( 1 ), 1i i iA s Y s Y s ( ) ( ) ( ) ( )( )( )1 2 3( 2 ), ( 2 ), ( 2 ), 2i i i iA s Y s Y s Y s
( ) ( )( )2( 2 ), ( 1 )i iA s Y s ( ) ( ) ( )( )( )2 3( 2 ), ( 1 ), 1i i iA s Y s Y s
( ) ( )( )3( 2 ), ( 1 )i iA s Y s ( ) ( ) ( )( )( )1 2 3( 2 ), ( 1 ), 1i i iY s Y s Y s
( ) ( )( )1 2( 2 ), ( 1 )i iY s Y s ( ) ( ) ( )( )( )1 2( 2 ), ( 2 ), 1i i iA s Y s Y s
( ) ( )( )1 3( 2 ), ( 1 )i iY s Y s ( ) ( ) ( )( )( )1 3( 2 ), ( 2 ), 1i i iA s Y s Y s
( ) ( )( )2 3( 2 ), ( 1 )i iY s Y s ( ) ( ) ( )( )( )2 3( 2 ), ( 2 ), 1i i iA s Y s Y s
( ) ( )( )1( 2 ), ( 2 )i iA s Y s ( ) ( ) ( )( )( )1 2 3( 2 ), ( 2 ), 1i i iY s Y s Y s
( ) ( )( )2( 2 ), ( 2 )i iA s Y s ( ) ( ) ( )( )( )1 2( 2 ), ( 1 ), 2i i iA s Y s Y s
( ) ( )( )3( 2 ), ( 2 )i iA s Y s ( ) ( ) ( )( )( )1 3( 2 ), ( 1 ), 2i i iA s Y s Y s
( ) ( )( )1 2( 2 ), ( 2 )i iY s Y s ( ) ( ) ( )( )( )2 3( 2 ), ( 1 ), 2i i iA s Y s Y s
( ) ( )( )1 3( 2 ), ( 2 )i iY s Y s ( ) ( ) ( )( )( )1 2 3( 2 ), ( 1 ), 2i i iY s Y s Y s
( ) ( )( )2 3( 2 ), ( 2 )i iY s Y s ( ) ( ) ( )( )( )1 2( 2 ), ( 2 ), 2i i iA s Y s Y s
( ) ( ) ( )( )( )1 3( 2 ), ( 2 ), 2i i iA s Y s Y s
( ) ( ) ( )( )( )2 3( 2 ), ( 2 ), 2i i iA s Y s Y s
( ) ( ) ( )( )( )1 2 3( 2 ), ( 2 ), 2i i iY s Y s Y s
Next, the payoff matrices are calculated using the real option values of each market sub-segment. In step 5–2, the characteristic function values for each market segment in differ-ent deferral times are calculated for all possible coalitions using Model F . In step 5–3, the characteristic function values for each market segment are normalized using equation 28. In step 5–4, the imputation values for each market segment are calculated using equation 29
End of Table 13
412 F. Zandi et al. A strategic cooperative game-theoretic model for market segmentation...
Dow
nloa
ded
by [
Mad
jid T
avan
a] a
t 07:
44 0
2 O
ctob
er 2
012
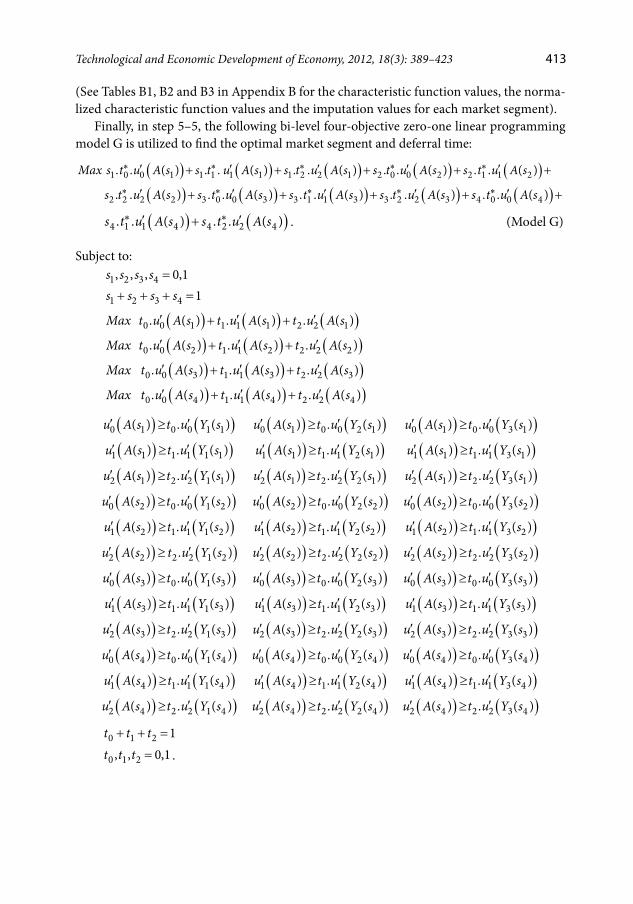
(See Tables B1, B2 and B3 in Appendix B for the characteristic function values, the norma-lized characteristic function values and the imputation values for each market segment).
Finally, in step 5–5, the following bi-level four-objective zero-one linear programming model G is utilized to find the optimal market segment and deferral time:
( ) ( ) ( ) ( ) ( )1 0 0 1 1 1 1 1 1 2 2 1 2 0 0 2 2 1 1 2. . ( ) . . ( ) . . ( ) . . ( ) . . ( )Max s t u A s s t u A s s t u A s s t u A s s t u A s∗ ∗ ∗ ∗ ∗′ ′ ′ ′ ′+ + + + +
( ) ( ) ( ) ( ) ( )2 2 2 2 3 0 0 3 3 1 1 3 3 2 2 3 4 0 0 4. . ( ) . . ( ) . . ( ) . . ( ) . . ( )s t u A s s t u A s s t u A s s t u A s s t u A s∗ ∗ ∗ ∗ ∗′ ′ ′ ′ ′+ + + + +
( ) ( )4 1 1 4 4 2 2 4. . ( ) . . ( )s t u A s s t u A s∗ ∗′ ′+ . (Model G)
Subject to: 1 2 3 4, , , 0,1s s s s = 1 2 3 4 1s s s s+ + + =
( ) ( ) ( )0 0 1 1 1 1 2 2 1. ( ) . ( ) . ( )Max t u A s t u A s t u A s′ ′ ′+ +
( ) ( ) ( )0 0 2 1 1 2 2 2 2. ( ) . ( ) . ( )Max t u A s t u A s t u A s′ ′ ′+ +
( ) ( ) ( )0 0 3 1 1 3 2 2 3. ( ) . ( ) . ( )Max t u A s t u A s t u A s′ ′ ′+ +
( ) ( ) ( )0 0 4 1 1 4 2 2 4. ( ) . ( ) . ( )Max t u A s t u A s t u A s′ ′ ′+ +
( ) ( )0 1 0 0 1 1( ) . ( )u A s t u Y s′ ′≥ ( ) ( )0 1 0 0 2 1( ) . ( )u A s t u Y s′ ′≥ ( ) ( )0 1 0 0 3 1( ) . ( )u A s t u Y s′ ′≥
( ) ( )1 1 1 1 1 1( ) . ( )u A s t u Y s′ ′≥ ( ) ( )1 1 1 1 2 1( ) . ( )u A s t u Y s′ ′≥ ( ) ( )1 1 1 1 3 1( ) . ( )u A s t u Y s′ ′≥
( ) ( )2 1 2 2 1 1( ) . ( )u A s t u Y s′ ′≥ ( ) ( )2 1 2 2 2 1( ) . ( )u A s t u Y s′ ′≥ ( ) ( )2 1 2 2 3 1( ) . ( )u A s t u Y s′ ′≥
( ) ( )0 2 0 0 1 2( ) . ( )u A s t u Y s′ ′≥ ( ) ( )0 2 0 0 2 2( ) . ( )u A s t u Y s′ ′≥ ( ) ( )0 2 0 0 3 2( ) . ( )u A s t u Y s′ ′≥
( ) ( )1 2 1 1 1 2( ) . ( )u A s t u Y s′ ′≥ ( ) ( )1 2 1 1 2 2( ) . ( )u A s t u Y s′ ′≥ ( ) ( )1 2 1 1 3 2( ) . ( )u A s t u Y s′ ′≥
( ) ( )2 2 2 2 1 2( ) . ( )u A s t u Y s′ ′≥ ( ) ( )2 2 2 2 2 2( ) . ( )u A s t u Y s′ ′≥ ( ) ( )2 2 2 2 3 2( ) . ( )u A s t u Y s′ ′≥
( ) ( )0 3 0 0 1 3( ) . ( )u A s t u Y s′ ′≥ ( ) ( )0 3 0 0 2 3( ) . ( )u A s t u Y s′ ′≥ ( ) ( )0 3 0 0 3 3( ) . ( )u A s t u Y s′ ′≥
( ) ( )1 3 1 1 1 3( ) . ( )u A s t u Y s′ ′≥ ( ) ( )1 3 1 1 2 3( ) . ( )u A s t u Y s′ ′≥ ( ) ( )1 3 1 1 3 3( ) . ( )u A s t u Y s′ ′≥
( ) ( )2 3 2 2 1 3( ) . ( )u A s t u Y s′ ′≥ ( ) ( )2 3 2 2 2 3( ) . ( )u A s t u Y s′ ′≥ ( ) ( )2 3 2 2 3 3( ) . ( )u A s t u Y s′ ′≥
( ) ( )0 4 0 0 1 4( ) . ( )u A s t u Y s′ ′≥ ( ) ( )0 4 0 0 2 4( ) . ( )u A s t u Y s′ ′≥ ( ) ( )0 4 0 0 3 4( ) . ( )u A s t u Y s′ ′≥
( ) ( )1 4 1 1 1 4( ) . ( )u A s t u Y s′ ′≥ ( ) ( )1 4 1 1 2 4( ) . ( )u A s t u Y s′ ′≥ ( ) ( )1 4 1 1 3 4( ) . ( )u A s t u Y s′ ′≥
( ) ( )2 4 2 2 1 4( ) . ( )u A s t u Y s′ ′≥ ( ) ( )2 4 2 2 2 4( ) . ( )u A s t u Y s′ ′≥ ( ) ( )2 4 2 2 3 4( ) . ( )u A s t u Y s′ ′≥
0 1 2 1t t t+ + =
0 1 2, , 0,1t t t = .
413Technological and Economic Development of Economy, 2012, 18(3): 389–423
Dow
nloa
ded
by [
Mad
jid T
avan
a] a
t 07:
44 0
2 O
ctob
er 2
012
In the first level, an optimal deferral time is obtained using the above four-objective zero-one linear programming model subject to 1 1 3 3 4 1 37mnl + = × × + = linear constraints and three zero-one variables. After solving this model, the first investment year, 2012, was determined as the optimal deferral time.
In the second level, given the optimal deferral time of year 2012 obtained in the first level, market segment 1s (retail individual banking) with sub-segments 1(1)s and (general public and private banking) was found as the optimal market segment using the above zero-one linear programming model with four zero-one variables. Consequently, the WFOB made a conscious decision for investment in Retail Individual Banking segment in year 2012.
It is often said that it is better to be a relatively big fish in a small pond than a small fish in a big pond. In practice, most companies achieve objective this by shrinking their target market because they have finite resources and cannot invest in all segments of the market. The best that can be aimed for is to invest in selected market segments. Successful market segment evaluation and selection is the essence of winning marketing strategies, and the bi-level model G proposed here is a useful method for achieving this success.
5. Conclusions and future research directions
Marketing segmentation is designed to cultivate the core-segment customers through an on-line delivery of the right products to the right prime prospects (market segments) at the right price and at the right time. How to comprehensively evaluate market segments is a complex task and when dealing by the range of market segments, organizations struggle to identify the one most appropriate to their needs. The presence of multiple and conflicting criteria along with subjectivity and imprecision in the decision making process further complicates the evaluation and selection process. More recently, the MCDM research community has extended their interest in fuzzy set theory (Zadeh 1998). The integration of MCDM with fuzzy sets for handling uncertainty is of major interest, both from a research and practical perspective (Kaliszewski 2006; Zopounidis, Doumpos 2001).
To adequately address these problems, a novel fuzzy group multi-criteria method for market segment evaluation and selection is proposed. This method provides a comprehensive and systematic framework that combines bi-level multi-objective optimization with ROA and fuzzy cooperative n-person game theory. The proposed method does not insist on consensus but synthesizes a representative outcome based on the qualitative judgments and quantita-tive data while considering fuzzy logic and fuzzy sets to represent ambiguous, uncertain or imprecise information. An actual application was also presented to demonstrate the applica-bility of the proposed framework and exhibit the efficacy of the procedures and algorithms.
The proposed model in this study could be easily modified to perform a wide range of sensitivity analysis of the stated preferences and parameters. There are no limits on the number of market segments and sub-segments to be assessed. In addition, DMs may be able to provide only imprecise or vague information because of time constraint or lack of data. In addition, the DM may feel more comfortable evaluating qualitative attributes by using linguistic variables resulting in two potential problems: (1) how to reconcile quantitative and
414 F. Zandi et al. A strategic cooperative game-theoretic model for market segmentation...
Dow
nloa
ded
by [
Mad
jid T
avan
a] a
t 07:
44 0
2 O
ctob
er 2
012
qualitative attributes and (2) how to deal with imprecise and vague information rationally and consistently. The proposed approach is capable of addressing these issues and assisting DMs reach a robust decision as illustrated.
Our framework helps the DMs to think systematically about complex market segment selection problems. The market selection problem is decomposed of manageable steps and integrates the results to arrive at a solution consistent with managerial goals and objectives. This decomposition encourages DMs to carefully consider the elements of uncertainty. The proposed structured framework does not imply a deterministic approach in market entry and segmentation. While our approach enables DMs to assimilate the precise data and imprecise or ambiguous judgments in a formal systematic approach, it should be used with care and in conjunction with management experience. Managerial judgment is an integral component of the market segment selection decisions; therefore, the effectiveness of the model relies heavily on the DMs cognitive capabilities.
There are a number of challenges involved in the proposed research. These challenges pro-vide a great deal of fruitful scope for future research. The ROA enables managers and DMs to estimate the value of system flexibility. Incorporating this capability into the market entry and segmentation enables managers to adjust the subsystem implementation as needed when new information becomes available. It is intended to extend this research and propose a fuzzy group multi-criteria method for market segment evaluation and selection by combining multi-level multi-objective optimizations with ROA and fuzzy cooperative n-person game theory.
Acknowledgment
The authors would like to thank the anonymous reviewers for their insightful comments and suggestions.
References
Ahlatcioglu, M.; Tiryaki, F. 2007. Interactive fuzzy programming for decentralized two-level linear frac-tional programming (DTLLFP) problems, Omega 35: 432–450. http://dx.doi.org/10.1016/j.omega.2005.08.005
Askegaard, S.; Madsen, T. K. 1998. The local and the global: exploring traits of homogeneity and hetero-geneity in European food cultures, International Business Review 7(6): 549–568. http://dx.doi.org/10.1016/S0969-5931(98)00028-6
Bellman, R. E.; Zadeh, L. A. 1970. Decision-making in a fuzzy environment, Management Science 17: 141–164. http://dx.doi.org/10.1287/mnsc.17.4.B141
Blocker, C. P.; Flint, D. J. 2007. Customer segments as moving targets: integrating customer value dyna-mism into segment instability logic, Industrial Marketing Management 36(6): 810–822. http://dx.doi.org/10.1016/j.indmarman.2006.05.016
Carlsson, C.; Fullér, R. 2003. A fuzzy approach to real option valuation, Fuzzy Sets and Systems 139(2): 297–312.http://dx.doi.org/10.1016/S0165-0114(02)00591-2
Chen, S. J.; Hwang, C. L. 1992. Fuzzy Multiple Attribute Decision Making: Methods and Applications. New York: Springer. http://dx.doi.org/10.1007/978-3-642-46768-4
415Technological and Economic Development of Economy, 2012, 18(3): 389–423
Dow
nloa
ded
by [
Mad
jid T
avan
a] a
t 07:
44 0
2 O
ctob
er 2
012
Chen, T.; Zhang, J.; Liu, S.; Yu, B. 2007. Fuzzy real option analysis for IT investment in nuclear power station, Computational Science – ICCS 2007, 953–959.
Chrysafis, K. A.; Papadopoulos, B. K. 2009. On theoretical pricing of options with fuzzy estimators, Journal of Computational and Applied Mathematics 223(2): 552–566. http://dx.doi.org/10.1016/j.cam.2007.12.006
Collan, M.; Fullér, R.; Mezei, J. 2009. A fuzzy pay-off method for real option valuation, Journal of Applied Mathematics and Decision Sciences vol. 2009, Article ID 238196. 14 p.
Colson, B.; Marcotte, P.; Savard, G. 2007. An overview of bilevel optimization, Annals of Operational Research 153: 235–256. http://dx.doi.org/10.1007/s10479-007-0176-2
Deb, K.; Sinha, A. 2009. Solving bilevel multi-objective optimization problems using evolutionary algo-rithms, in Lecture Notes in Computer Science 5467, Evolutionary Multi-Criterion Optimization. Berlin: Springer, 110–124. http://dx.doi.org/10.1007/978-3-642-01020-0_13
Dixit, A.; Pindyck, R. S. 1994. Investment Under Uncertainty. Princeton University Press, Princeton, NJ.Ehrgott, M.; Wiecek, M. M. 2005. Multiobjective programming, in Figueira, J.; Greco, S.; Ehrgott, M. (Eds.).
Multiple Criteria Decision Analysis: State of the Art Surveys. Boston, MA: Springer-Verlag, 667–722.Fonseca, J. R. S.; Cardoso, M. G. M. S. 2007. Supermarket customers segments stability, Journal of Targeting,
Measurement and Analysis for Marketing 15: 210–221. http://dx.doi.org/10.1057/palgrave.jt.5750052Hwang, C. L.; Yoon, K. 1981. Multiple Attribute Decision Making: Methods and Applications. New York,
NY: Springer-Verlag. http://dx.doi.org/10.1007/978-3-642-48318-9Hwang, C. L.; Masud, A. S. 1979. Multi Objective Decision Making: Methods and Applications. Berlin:
Springer. http://dx.doi.org/10.1007/978-3-642-45511-7Jang, S. C.; Morrison, A. M.; O’Leary, J. T. 2002. Benefit segmentation of Japanese pleasure travelers to
the USA and Canada: selecting target markets based on the profitability and risk of individual market segments, Tourism Management 23(4): 367–378. http://dx.doi.org/10.1016/S0261-5177(01)00096-6
Jonker, J.-J.; Piersma, N.; Van den Poel, D. 2004. Joint optimization of customer segmentation and mar-keting policy to maximize long-term profitability, Expert Systems with Applications 27(2): 159–168. http://dx.doi.org/10.1016/j.eswa.2004.01.010
Kaliszewski, I. 2006. Soft Computing for Complex Multiple Criteria Decision Making. Berlin: Springer.Kapliński, O.; Tamošaitiene, J. 2010. Game theory applications in construction engineering and manage-
ment, Technological and Economic Development of Economy 16(2): 348–363. http://dx.doi.org/10.3846/tede.2010.22
Kjærland, F. 2007. A real option analysis of investments in hydropower: the case of Norway, Energy Policy 35(11): 5901–5908. http://dx.doi.org/10.1016/j.enpol.2007.07.021
Klir, G. J.; Yuan, B. 1995. Fuzzy Sets and Fuzzy Logic: Theory and Applications. New York: Prentice-Hall.Lai, Y. J. 1996. Hierarchical optimization: a satisfactory solution, Fuzzy Sets and Systems 77: 321–335.
http://dx.doi.org/10.1016/0165-0114(95)00086-0Lu, C.-S. 2003. Market segment evaluation and international distribution centers, Transportation Research
Part E: Logistics and Transportation Review 39(1): 49–60. http://dx.doi.org/10.1016/S1366-5545(02)00022-4
Maali, Y. 2009. A multi-objective approach for solving cooperative n-person games, Electrical Power and Energy Systems 31: 608–610. http://dx.doi.org/10.1016/j.ijepes.2009.06.021
Montoya-Weiss, M.; Calentone, R. J. 1999. Development and implementation of a segment selection procedure for industrial product markets, Marketing Science 18(3): 373–395. http://dx.doi.org/10.1287/mksc.18.3.373
Nash, J. F. 1950a. The bargaining problem, Econometrica 18(2): 155–162. http://dx.doi.org/10.2307/1907266Nash, J. F. 1950b. Equilibrium points in n-person games, Proceedings of the National Academy of Sciences
of the United States of America 36(1): 48–49. http://dx.doi.org/10.1073/pnas.36.1.48
416 F. Zandi et al. A strategic cooperative game-theoretic model for market segmentation...
Dow
nloa
ded
by [
Mad
jid T
avan
a] a
t 07:
44 0
2 O
ctob
er 2
012
Nash, J. F. 1951. Non-cooperative games, The Annals of Mathematics 54(2): 286–295. http://dx.doi.org/10.2307/1969529
Osman, M. S.; Abo–Sinna, M. A.; Amer, A. H.; Emam, O. E. 2004. A multi-level nonlinear multi-objective decision making under fuzziness, Journal of Applied Mathematics and Computation 153: 239–252. http://dx.doi.org/10.1016/S0096-3003(03)00628-3
Ou, C.-W.; Chou, S.-Y.; Chang, Y.-H. 2009. Using a strategy-aligned fuzzy competitive analysis approach for market segment evaluation and selection, Expert Systems with Applications 36: 527–541. http://dx.doi.org/10.1016/j.eswa.2007.09.018
Pekec, A. 2001. Meaningful and meaningless solutions for cooperative n-person games, European Journal of Operational Research 133(3): 608–623. http://dx.doi.org/10.1016/S0377-2217(00)00208-3
Peldschus, F. 2008. Experience of the game theory application in construction management, Technological and Economic Development of Economy 14(4): 531–545. http://dx.doi.org/10.3846/1392-8619.2008.14.531-545
Peldschus, F.; Zavadskas, E. K. 2005. Fuzzy matrix games multi-criteria model for decision-making in engineering, Informatica 16(1): 107–120.
Pramanik, S.; Kumar Roy, T. 2006. Fuzzy goal programming approach to multi-level programming problems, European Journal of Operational Research 176: 1151–1166. http://dx.doi.org/10.1016/j.ejor.2005.08.024
Sakawa, M.; Nishizaki, I. 2002. Interactive fuzzy programming for decentralized two-level linear program-ming problems, Fuzzy Sets and Systems 125: 301–315. http://dx.doi.org/10.1016/S0165-0114(01)00042-2
Sakawa, M.; Nishizaki, I.; Uemura, Y. 2002. A decentralized two-level transportation problem in a housing material manufacturer: interactive fuzzy programming approach, European Journal of Operational Research 141: 167–185. http://dx.doi.org/10.1016/S0377-2217(01)00273-9
Shapley, L. 1953. A value for n-person games, in Kuhn, H. W.; Tucker, A. W. (Eds.). Contributions to the Theory of Games. Princeton University Press, Princeton, NJ., 207–317.
Shih, H. S.; Lai, Y. J.; Lee, E. S. 1996. Fuzzy approach for multi-level programming problems, Computers and Operations Research 23(1): 73–91. http://dx.doi.org/10.1016/0305-0548(95)00007-9
Shih, S. H.; Lee, E. S. 2000. Compensatory fuzzy multiple level decision making, Fuzzy Sets and Systems 114: 71–87. http://dx.doi.org/10.1016/S0165-0114(98)00409-6
Shubik, M. 1985. Game Theory in Social Sciences. Cambridge, MA: MIT Press.Sinha, S. 2003. Fuzzy programming approach to multi-level programming problems, Fuzzy Sets and
Systems 136: 189–202. http://dx.doi.org/10.1016/S0165-0114(02)00362-7Sinha, S.; Sinha, S. B. 2002. KKT transformation approach for multi-objective multi-level linear program-
ming problems, European Journal of Operational Research 143: 19–31. http://dx.doi.org/10.1016/S0377-2217(01)00323-X
Stein, H. D. 2010. Allocation rules with outside option in cooperation games with time‐inconsistency, Journal of Business Economics and Management 11(1): 56–96. http://dx.doi.org/10.3846/jbem.2010.04
Trigeorgis, L. 1996. Real Options: Managerial Flexibility and Strategy in Resource Allocation. Cambridge, MA: MIT Press.
Turskis, Z.; Zavadskas, E. K.; Peldschus, F. 2009. Multi-criteria optimization system for decision making in construction design and management, Inzinerine Ekonomika – Engineering Economics (1): 7–17.
Villani, G. 2008. An R&D investment game under uncertainty in real option analysis, Computational Economics 32(1–2): 199–219. http://dx.doi.org/10.1007/s10614-008-9133-7
Wang, J.; Hwang, W.-L. 2007. A fuzzy set approach for R&D portfolio selection using a real options valu-ation model, Omega 35(3): 247–257. http://dx.doi.org/10.1016/j.omega.2005.06.002
417Technological and Economic Development of Economy, 2012, 18(3): 389–423
Dow
nloa
ded
by [
Mad
jid T
avan
a] a
t 07:
44 0
2 O
ctob
er 2
012
Yan, M.-R. 2011. A fuzzy logic enhanced bargaining model for business pricing decision support in joint venture projects, Journal of Business Economics and Management 12(2): 234–247. http://dx.doi.org/10.3846/16111699.2011.573281
Yeh, C. H.; Deng, H. 2004. A practical approach to fuzzy utilities comparison in fuzzy multi-criteria analysis, International Journal of Approximate Reasoning 35(2): 179–194. http://dx.doi.org/10.1016/j.ijar.2003.09.002
Yeh, C. H.; Deng, H.; Chang, Y. H. 2000. Fuzzy multicriteria analysis for performance evaluation of bus companies, European Journal of Operational Research 126(3): 459–473. http://dx.doi.org/10.1016/S0377-2217(99)00315-X
Yin, Y. 2000. Genetic algorithm based approach for bilevel programming models, Journal of Transporta-tion Engineering 126(2): 115–120. http://dx.doi.org/10.1061/(ASCE)0733-947X(2000)126:2(115)
Young, H. 1985. Monotonic solutions of cooperative games, International Journal of Game Theory 14: 65–72. http://dx.doi.org/10.1007/BF01769885
Zadeh, L. A. 1965. Fuzzy sets, Information and Control 8: 338–353. http://dx.doi.org/10.1016/S0019-9958(65)90241-X
Zadeh, L. A. 1998. Roles of soft computing and fuzzy logic in the conception, design and deployment of information/intelligent systems, in Kaynak, O.; Zadeh, L. A.; Turksen, B.; Rudas, I. J. (Eds.). Compu-tational Intelligence: Soft Computing and Fuzzy-Neuro Integration with Applications. Berlin: Springer. http://dx.doi.org/10.1007/978-3-642-58930-0_1
Zavadskas, E. K.; Turskis, Z. 2011. Multiple criteria decision making (MCDM) methods in economics: an overview, Technological and Economic Development of Economy 17(2): 397–427. http://dx.doi.org/10.3846/20294913.2011.593291
Zopounidis, C.; Doumpos, M. 2001. Multicriteria decision aid in uncertainty and financial risk manage-ment, in Gil-Aluja, J. (Ed.). Handbook of Management Under Uncertainty. Kluwer Academic Publishers, Dordrecht. http://dx.doi.org/10.1007/978-1-4613-0285-8_5
APPENDIX A
Cooperation between the government of Vietnam, the state bank of Vietnam and foreign Banks
The government of Vietnam, an emerging market economy, through the State Bank of Vietnam (SBV), promotes the entry of foreign banks accessing its banking market as it considers that their entry would develop the banking system, banks, and banking products. It also considers that the entry of foreign banks would enhance the competencies of bank management in their country and widen access banking for most of the population. Besides allowing foreign banks to open branches and representative offices since the mid 1990s, the government recently decided to allow foreign banks to fully incorporate in Vietnam as a wholly foreign-owned bank (WFOB), and foreign banks were requested to tender for a limited number of licences available. The government also insisted that foreign banks could not acquire indigenous banks. They must establish de novo. There were conditions applied to a licence to operate and these obliged the foreign bank to sign a formal agreement to transfer capital, knowledge, products, technology and systems and to develop indigenous bank management. The foreign bank must also satisfy capital adequacy regulations. There were no stipulations as to the types of customer the bank may target or the type of business.
418 F. Zandi et al. A strategic cooperative game-theoretic model for market segmentation...
Dow
nloa
ded
by [
Mad
jid T
avan
a] a
t 07:
44 0
2 O
ctob
er 2
012
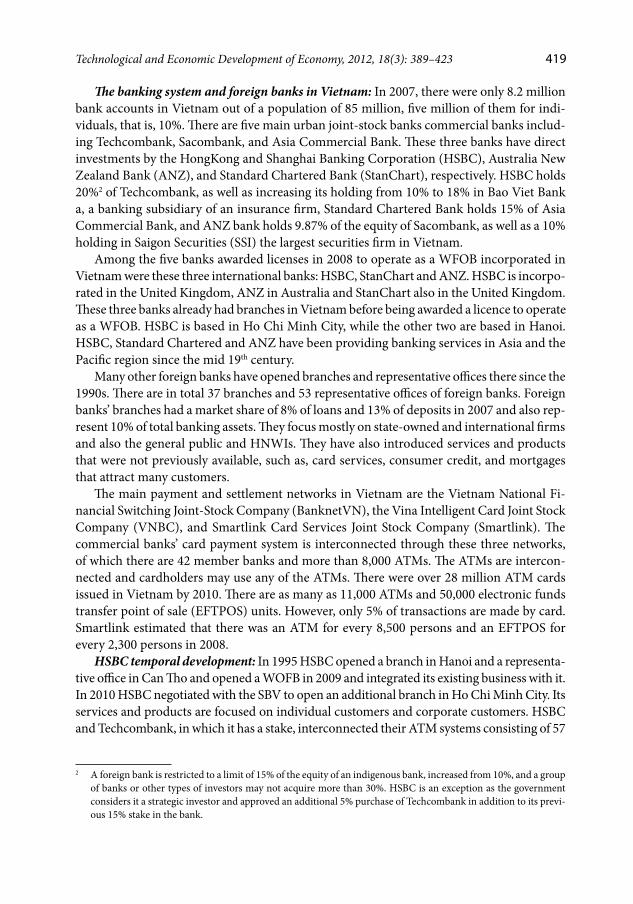
The banking system and foreign banks in Vietnam: In 2007, there were only 8.2 million bank accounts in Vietnam out of a population of 85 million, five million of them for indi-viduals, that is, 10%. There are five main urban joint-stock banks commercial banks includ-ing Techcombank, Sacombank, and Asia Commercial Bank. These three banks have direct investments by the HongKong and Shanghai Banking Corporation (HSBC), Australia New Zealand Bank (ANZ), and Standard Chartered Bank (StanChart), respectively. HSBC holds 20%2 of Techcombank, as well as increasing its holding from 10% to 18% in Bao Viet Bank a, a banking subsidiary of an insurance firm, Standard Chartered Bank holds 15% of Asia Commercial Bank, and ANZ bank holds 9.87% of the equity of Sacombank, as well as a 10% holding in Saigon Securities (SSI) the largest securities firm in Vietnam.
Among the five banks awarded licenses in 2008 to operate as a WFOB incorporated in Vietnam were these three international banks: HSBC, StanChart and ANZ. HSBC is incorpo-rated in the United Kingdom, ANZ in Australia and StanChart also in the United Kingdom. These three banks already had branches in Vietnam before being awarded a licence to operate as a WFOB. HSBC is based in Ho Chi Minh City, while the other two are based in Hanoi. HSBC, Standard Chartered and ANZ have been providing banking services in Asia and the Pacific region since the mid 19th century.
Many other foreign banks have opened branches and representative offices there since the 1990s. There are in total 37 branches and 53 representative offices of foreign banks. Foreign banks’ branches had a market share of 8% of loans and 13% of deposits in 2007 and also rep-resent 10% of total banking assets. They focus mostly on state-owned and international firms and also the general public and HNWIs. They have also introduced services and products that were not previously available, such as, card services, consumer credit, and mortgages that attract many customers.
The main payment and settlement networks in Vietnam are the Vietnam National Fi-nancial Switching Joint-Stock Company (BanknetVN), the Vina Intelligent Card Joint Stock Company (VNBC), and Smartlink Card Services Joint Stock Company (Smartlink). The commercial banks’ card payment system is interconnected through these three networks, of which there are 42 member banks and more than 8,000 ATMs. The ATMs are intercon-nected and cardholders may use any of the ATMs. There were over 28 million ATM cards issued in Vietnam by 2010. There are as many as 11,000 ATMs and 50,000 electronic funds transfer point of sale (EFTPOS) units. However, only 5% of transactions are made by card. Smartlink estimated that there was an ATM for every 8,500 persons and an EFTPOS for every 2,300 persons in 2008.
HSBC temporal development: In 1995 HSBC opened a branch in Hanoi and a representa-tive office in Can Tho and opened a WOFB in 2009 and integrated its existing business with it. In 2010 HSBC negotiated with the SBV to open an additional branch in Ho Chi Minh City. Its services and products are focused on individual customers and corporate customers. HSBC and Techcombank, in which it has a stake, interconnected their ATM systems consisting of 57
2 A foreign bank is restricted to a limit of 15% of the equity of an indigenous bank, increased from 10%, and a group of banks or other types of investors may not acquire more than 30%. HSBC is an exception as the government considers it a strategic investor and approved an additional 5% purchase of Techcombank in addition to its previ-ous 15% stake in the bank.
419Technological and Economic Development of Economy, 2012, 18(3): 389–423
Dow
nloa
ded
by [
Mad
jid T
avan
a] a
t 07:
44 0
2 O
ctob
er 2
012
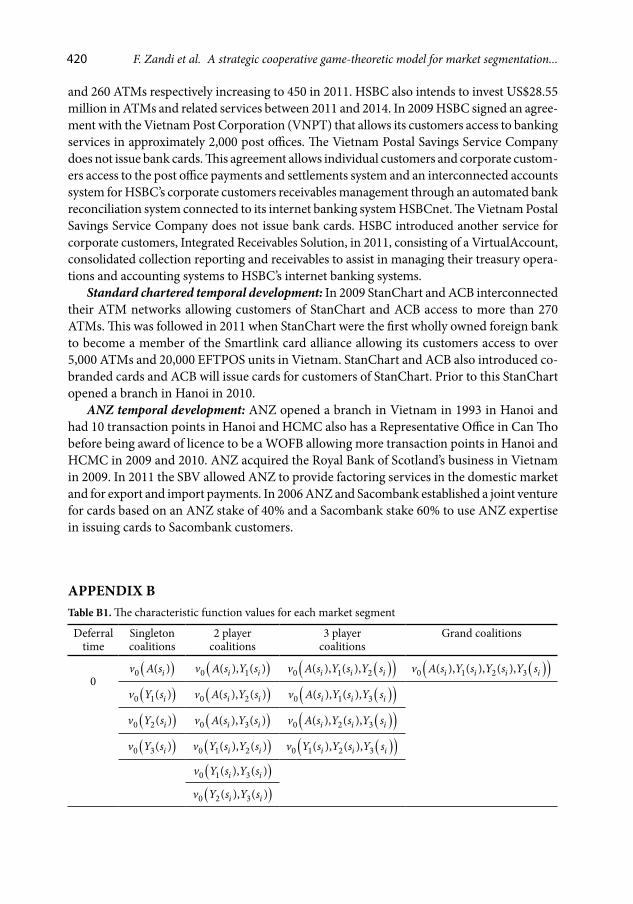
and 260 ATMs respectively increasing to 450 in 2011. HSBC also intends to invest US$28.55 million in ATMs and related services between 2011 and 2014. In 2009 HSBC signed an agree-ment with the Vietnam Post Corporation (VNPT) that allows its customers access to banking services in approximately 2,000 post offices. The Vietnam Postal Savings Service Company does not issue bank cards. This agreement allows individual customers and corporate custom-ers access to the post office payments and settlements system and an interconnected accounts system for HSBC’s corporate customers receivables management through an automated bank reconciliation system connected to its internet banking system HSBCnet. The Vietnam Postal Savings Service Company does not issue bank cards. HSBC introduced another service for corporate customers, Integrated Receivables Solution, in 2011, consisting of a VirtualAccount, consolidated collection reporting and receivables to assist in managing their treasury opera-tions and accounting systems to HSBC’s internet banking systems.
Standard chartered temporal development: In 2009 StanChart and ACB interconnected their ATM networks allowing customers of StanChart and ACB access to more than 270 ATMs. This was followed in 2011 when StanChart were the first wholly owned foreign bank to become a member of the Smartlink card alliance allowing its customers access to over 5,000 ATMs and 20,000 EFTPOS units in Vietnam. StanChart and ACB also introduced co-branded cards and ACB will issue cards for customers of StanChart. Prior to this StanChart opened a branch in Hanoi in 2010.
ANZ temporal development: ANZ opened a branch in Vietnam in 1993 in Hanoi and had 10 transaction points in Hanoi and HCMC also has a Representative Office in Can Tho before being award of licence to be a WOFB allowing more transaction points in Hanoi and HCMC in 2009 and 2010. ANZ acquired the Royal Bank of Scotland’s business in Vietnam in 2009. In 2011 the SBV allowed ANZ to provide factoring services in the domestic market and for export and import payments. In 2006 ANZ and Sacombank established a joint venture for cards based on an ANZ stake of 40% and a Sacombank stake 60% to use ANZ expertise in issuing cards to Sacombank customers.
APPENDIX BTable B1. The characteristic function values for each market segment
Deferral time
Singleton coalitions
2 playercoalitions
3 playercoalitions
Grand coalitions
0( )0 ( )iv A s ( )0 1( ), ( )i iv A s Y s ( )( )0 1 2( ), ( ),i i iv A s Y s Y s ( )( )0 1 2 3( ), ( ), ( ),i i i iv A s Y s Y s Y s
( )0 1( )iv Y s ( )0 2( ), ( )i iv A s Y s ( )( )0 1 3( ), ( ),i i iv A s Y s Y s
( )0 2( )iv Y s ( )0 3( ), ( )i iv A s Y s ( )( )0 2 3( ), ( ),i i iv A s Y s Y s
( )0 3( )iv Y s ( )0 1 2( ), ( )i iv Y s Y s ( )( )0 1 2 3( ), ( ),i i iv Y s Y s Y s
( )0 1 3( ), ( )i iv Y s Y s
( )0 2 3( ), ( )i iv Y s Y s
420 F. Zandi et al. A strategic cooperative game-theoretic model for market segmentation...
Dow
nloa
ded
by [
Mad
jid T
avan
a] a
t 07:
44 0
2 O
ctob
er 2
012
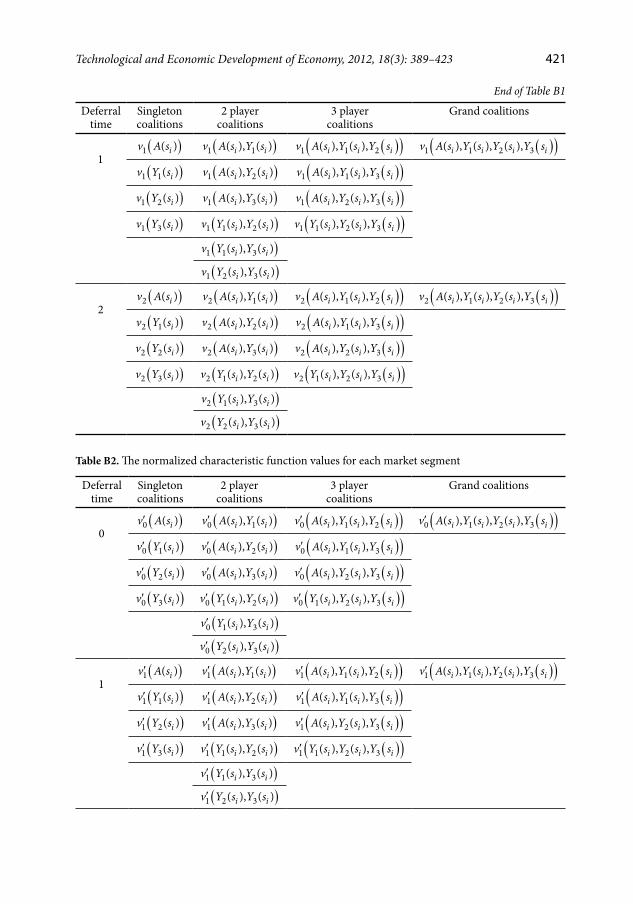
Deferral time
Singleton coalitions
2 playercoalitions
3 playercoalitions
Grand coalitions
1( )1 ( )iv A s ( )1 1( ), ( )i iv A s Y s ( )( )1 1 2( ), ( ),i i iv A s Y s Y s ( )( )1 1 2 3( ), ( ), ( ),i i i iv A s Y s Y s Y s
( )1 1( )iv Y s ( )1 2( ), ( )i iv A s Y s ( )( )1 1 3( ), ( ),i i iv A s Y s Y s
( )1 2( )iv Y s ( )1 3( ), ( )i iv A s Y s ( )( )1 2 3( ), ( ),i i iv A s Y s Y s
( )1 3( )iv Y s ( )1 1 2( ), ( )i iv Y s Y s ( )( )1 1 2 3( ), ( ),i i iv Y s Y s Y s
( )1 1 3( ), ( )i iv Y s Y s
( )1 2 3( ), ( )i iv Y s Y s
2( )2 ( )iv A s ( )2 1( ), ( )i iv A s Y s ( )( )2 1 2( ), ( ),i i iv A s Y s Y s ( )( )2 1 2 3( ), ( ), ( ),i i i iv A s Y s Y s Y s
( )2 1( )iv Y s ( )2 2( ), ( )i iv A s Y s ( )( )2 1 3( ), ( ),i i iv A s Y s Y s
( )2 2( )iv Y s ( )2 3( ), ( )i iv A s Y s ( )( )2 2 3( ), ( ),i i iv A s Y s Y s
( )2 3( )iv Y s ( )2 1 2( ), ( )i iv Y s Y s ( )( )2 1 2 3( ), ( ),i i iv Y s Y s Y s
( )2 1 3( ), ( )i iv Y s Y s
( )2 2 3( ), ( )i iv Y s Y s
Table B2. The normalized characteristic function values for each market segment
Deferral time
Singleton coalitions
2 playercoalitions
3 playercoalitions
Grand coalitions
0( )0 ( )iv A s′ ( )0 1( ), ( )i iv A s Y s′ ( )( )0 1 2( ), ( ),i i iv A s Y s Y s′ ( )( )0 1 2 3( ), ( ), ( ),i i i iv A s Y s Y s Y s′
( )0 1( )iv Y s′ ( )0 2( ), ( )i iv A s Y s′ ( )( )0 1 3( ), ( ),i i iv A s Y s Y s′
( )0 2( )iv Y s′ ( )0 3( ), ( )i iv A s Y s′ ( )( )0 2 3( ), ( ),i i iv A s Y s Y s′
( )0 3( )iv Y s′ ( )0 1 2( ), ( )i iv Y s Y s′ ( )( )0 1 2 3( ), ( ),i i iv Y s Y s Y s′
( )0 1 3( ), ( )i iv Y s Y s′
( )0 2 3( ), ( )i iv Y s Y s′
1( )1 ( )iv A s′ ( )1 1( ), ( )i iv A s Y s′ ( )( )1 1 2( ), ( ),i i iv A s Y s Y s′ ( )( )1 1 2 3( ), ( ), ( ),i i i iv A s Y s Y s Y s′
( )1 1( )iv Y s′ ( )1 2( ), ( )i iv A s Y s′ ( )( )1 1 3( ), ( ),i i iv A s Y s Y s′
( )1 2( )iv Y s′ ( )1 3( ), ( )i iv A s Y s′ ( )( )1 2 3( ), ( ),i i iv A s Y s Y s′
( )1 3( )iv Y s′ ( )1 1 2( ), ( )i iv Y s Y s′ ( )( )1 1 2 3( ), ( ),i i iv Y s Y s Y s′
( )1 1 3( ), ( )i iv Y s Y s′
( )1 2 3( ), ( )i iv Y s Y s′
End of Table B1
421Technological and Economic Development of Economy, 2012, 18(3): 389–423
Dow
nloa
ded
by [
Mad
jid T
avan
a] a
t 07:
44 0
2 O
ctob
er 2
012

Deferral time
Singleton coalitions
2 playercoalitions
3 playercoalitions
Grand coalitions
2( )2 ( )iv A s′ ( )2 1( ), ( )i iv A s Y s′ ( )( )2 1 2( ), ( ),i i iv A s Y s Y s′ ( )( )2 1 2 3( ), ( ), ( ),i i i iv A s Y s Y s Y s′
( )2 1( )iv Y s′ ( )2 2( ), ( )i iv A s Y s′ ( )( )2 1 3( ), ( ),i i iv A s Y s Y s′
( )2 2( )iv Y s′ ( )2 3( ), ( )i iv A s Y s′ ( )( )2 2 3( ), ( ),i i iv A s Y s Y s′
( )2 3( )iv Y s′ ( )2 1 2( ), ( )i iv Y s Y s′ ( )( )2 1 2 3( ), ( ),i i iv Y s Y s Y s′
( )2 1 3( ), ( )i iv Y s Y s′
( )2 2 3( ), ( )i iv Y s Y s′
Table B3. The imputation values for each market segment
Market Segments
DeferralTime
PlayersA
1Y 2Y 3Y
1s
0 ( )0 1( )u A s′ ( )0 1 1( )u Y s′ ( )0 2 1( )u Y s′ ( )0 3 1( )u Y s′
1 ( )1 1( )u A s′ ( )1 1 1( )u Y s′ ( )1 2 1( )u Y s′ ( )1 3 1( )u Y s′
2 ( )2 1( )u A s′ ( )2 1 1( )u Y s′ ( )2 2 1( )u Y s′ ( )2 3 1( )u Y s′
2s
0 ( )0 2( )u A s′ ( )0 1 2( )u Y s′ ( )0 2 2( )u Y s′ ( )0 3 2( )u Y s′
1 ( )1 2( )u A s′ ( )1 1 2( )u Y s′ ( )1 2 2( )u Y s′ ( )1 3 2( )u Y s′
2 ( )2 2( )u A s′ ( )2 1 2( )u Y s′ ( )2 2 2( )u Y s′ ( )2 3 2( )u Y s′
3s
0 ( )0 3( )u A s′ ( )0 1 3( )u Y s′ ( )0 2 3( )u Y s′ ( )0 3 3( )u Y s′
1 ( )1 3( )u A s′ ( )1 1 3( )u Y s′ ( )1 2 3( )u Y s′ ( )1 3 3( )u Y s′
2 ( )2 3( )u A s′ ( )2 1 3( )u Y s′ ( )2 2 3( )u Y s′ ( )2 3 3( )u Y s′
4s
0 ( )0 4( )u A s′ ( )0 1 4( )u Y s′ ( )0 2 4( )u Y s′ ( )0 3 4( )u Y s′
1 ( )1 4( )u A s′ ( )1 1 4( )u Y s′ ( )1 2 4( )u Y s′ ( )1 3 4( )u Y s′
2 ( )2 4( )u A s′ ( )2 1 4( )u Y s′ ( )2 2 4( )u Y s′ ( )2 3 4( )u Y s′
Faramak ZANDI is a lecturer of Management Information Systems and Decision Sciences in the Busi-ness Systems and Analytics Department at La Salle University. He holds a M.S. and PhD in Industrial Engineering from Iran University of Science and Technology. His research interests include information technology, enterprise architectures, decision making, quality management systems and transportation planning. He has published in Advances in Space Research, Expert Systems with Applications, Computers & Industrial Engineering, Journal of Intelligent Transportation Systems, International Journal of Logistics, International Journal of Information Systems in the Service Sector, Knowledge Management Research & Practice, International Journal of Information Technology and Management, International Journal of Business Information Systems, and International Journal of Mathematics in Operational Research.
End of Table B2
422 F. Zandi et al. A strategic cooperative game-theoretic model for market segmentation...
Dow
nloa
ded
by [
Mad
jid T
avan
a] a
t 07:
44 0
2 O
ctob
er 2
012
Madjid TAVANA is a Professor of Business Systems and Analytics and the Lindback Distinguished Chair of Information Systems and Decision Sciences at La Salle University where he served as Chairman of the Management Department and Director of the Center for Technology and Management. He has been a Distinguished NASA Research Fellow at Kennedy Space Center, Johnson Space Center, Naval Research Laboratory - Stennis Space Center, and Air Force Research Laboratory. He was recently honored with the prestigious Space Act Award by NASA. He holds an MBA, a PMIS, and a PhD in Management Information Systems and received his post-doctoral diploma in strategic information systems from the Wharton School of the University of Pennsylvania. He is the Editor-in-Chief for Decision Analytics, the International Journal of Strategic Decision Sciences, the International Journal of Enterprise Information Systems, and the International Journal of Applied Decision Sciences. He has published over one hun-dred research papers in academic journals such as Decision Sciences, Information Systems, Interfaces, Annals of Operations Research, Omega, Information and Management, Advances in Space Research, Expert Systems with Applications, European Journal of Operational Research, Journal of the Operational Research Society, Computers and Operations Research, Knowledge Management Research and Practice, Computers and Industrial Engineering, Applied Soft Computing, Journal of Advanced Manufacturing Technology, and Advances in Engineering Software, among others.
Aidan O’CONNOR is Professor of Strategy and International Business at ESCEM School of Business and Management, France. He has extensive experience in banking and academic experience in several European countries. He is Visiting Professor in Strategy and in International Business at the Univer-sität Osnabrück, Germany. He was previously Visiting Professor of Financial Markets and Institutions at Freie Universität Bozen – Libera Università di Bolzano, Italy. He obtained his Doctorate from HEC Ecole des Hautes Commerciales, Université de Lausanne, Switzerland, with a specialisation in trade in services and the strategy of banks. He was awarded a Postgraduate Diploma in Statistics and a Master of Science in Economics from Trinity College, University of Dublin, Ireland. His research focuses on international strategy, trade in services and, in particular, the strategy of banks. He is Associate Editor and Book Review Editor of the International Journal of Strategic Decision Sciences, Associate Editor of the International Journal of Applied Decision Sciences, Associate Editor of Decision Analytics, and is a Member of the Scientific Committee and Correspondent for the United Kingdom and Ireland of VSE, the official journal of ANDESE, l’Association Nationale des Docteurs en Sciences Economiques et en Sciences de Gestion.
423Technological and Economic Development of Economy, 2012, 18(3): 389–423
Dow
nloa
ded
by [
Mad
jid T
avan
a] a
t 07:
44 0
2 O
ctob
er 2
012