Embed Size (px)
Citation preview
Computers Educ. Vol. 17, No. 3, pp. 235-242, 1991 F’rinted in Great Britain. All rights reserved
0360-1315191 $3.00+0.00 Copyright Q 1991 Pergaman Press plc
A SPREADSHEET PROGRAM FOR LEARNING SOME ASPECTS OF PROJECT MANAGEMENT
I. M. PREMACHANDRA*
University of New Hampshire, Whittemore School of Business and Economics, Durham, NH 03824. U.S.A.
(Received IO April 1990; accepred 15 June 1991)
Abstract-This paper proposes a spreadsheet program designed to study some aspects of Project Management. Applicability of the program is illustrated through a classroom exercise and the students (undergraduates) found it very useful and user friendly. The purpose of the paper is to highlight the applicabiiity of the spreadsheet programs in learning important areas of Management Science such as Project Management. This program also sets an example for the Management Science students to think of other applications of spreadsheets in quantitative techniques.
1. INTRODUCTION
Project Management[l,2] is an important area in Management Science. A “Project” is a series of related activities (jobs or tasks) directed toward a specific goal and completed within a specific time frame. Planning and scheduling of such a project is Project Management. Often these projects, such as constructing a building, involve a large number of activities. In order to keep track of these activities we use Project management techniques; PERT (Program Evaluation and Review Technique) and CPM (Critical Path Method). A graphical representation of the interdependencies and precedence reiationships among the activities is called a “Project Network”.
One of the products of interest in analyzing a Project Network using PERT/CPM techniques is a “time schedule” which illustrates the total resource (such as manpower) requirements for each day of the project duration. In obtaining such a time schedule, we try to level the manpower requirements throughout the project duration. This is called “resource leveling”.
Resource leveling minimizes labor idling time, operating costs and labor problems. Consider, for example, a company who has undertaken a project the site of which is located away from the main office. In this case, when there is not a smooth manpower requirement schedule, the daily manpower requirements may fluctuate heavily, and therefore the company will have to spend a lot of money in transposing extra labor from time to time or recruiting new crews. Sometimes the company may even find it economical to retain crews in excess of requirements at the site if they are needed a few days later. But, this situation leads to idling of resources and hence, labor problems.
In order to obtain ar, optimum solution to this resource leveling problem, the daily resource requirements for different project schedules with varying activity start times have to be computed and compared graphically since no technique has yet been developed for this purpose. Because of the numerous computations involved, this manual trial and error method becomes tedious, especially when the project contains a large number of activities. In a classroom environment, the students often find it difficult to understand the concept behind this technique because of the tedious procedures they have to follow in computing the results and plotting the graphs for comparison.
The purpose of this paper is to propose a spreadsheet model which automatically generates the resource requirement schedule in graphical form when the activity start times are input. The students in the Operations Research class found it very convenient to generate these graphs and obtain the optimum schedule by comparison.
In order to develop the prototype version of the spreadsheet model proposed in this paper, we select the software package LOTUS 123[3].
*Present address: Department of Quantitative and Computer Studies, University of Otago, P.O. Box 56, Dunedin, New Zealand.
23.5
236 I.M. PREMACHAN5RA
2. AN OVERVIEW OF PROJECT NETWORK ANALYSIS
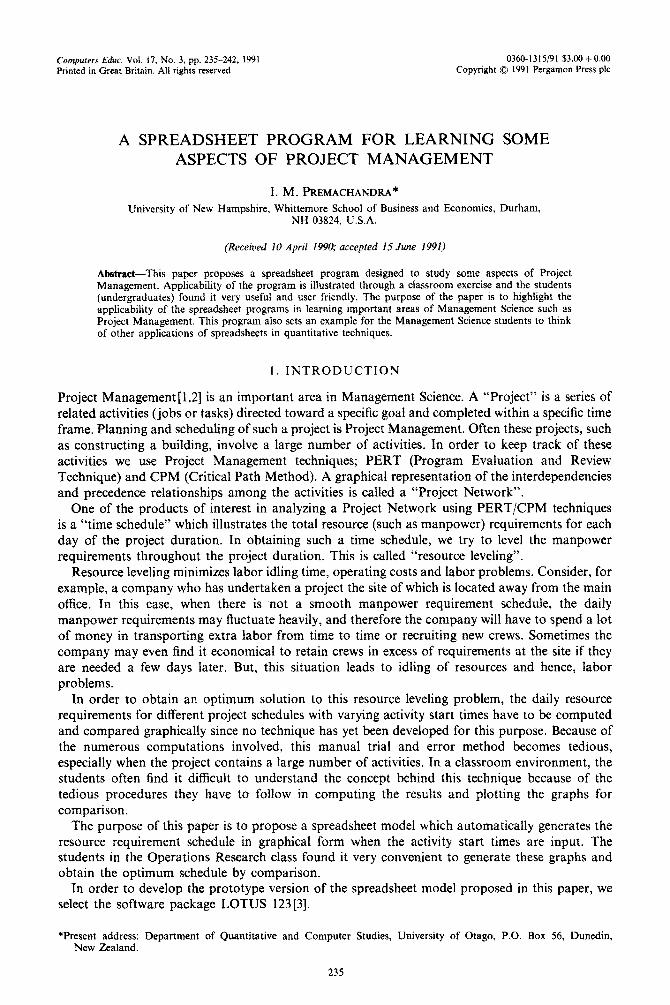
For the purpose of illustrating the concepts behind PERT/CPM techniques we consider a classroom exercise which is illustrated in Fig. 1.
The time (Di) required to perform the activities l-2, 24, 2-3, , . , etc., are indicated under the arrows in Fig. 1. In constructing the above network, the interdependencies and precedence relationships among the activities are determined on the basis of the knowledge available about the activities. A detailed discussion on network construction is available in[1,2] and in this paper we focus our attention on the resource Ieveling concept.
The first step of the analysis is to calculate the Earliest Start times (ES,) and the Latest Finish times (LF,) of each activity in the network. The earliest start time for an activity leaving a particular node is equal to the largest of the earliest finish times (EF,) for all activities entering the node, where
EF, = ES, + Di.
Proceeding in a forward pass through the network. starting from the “start” node, these quantities can be calculated and are marked in square brackets on each arrow. The latest finish time for an activity entering a particular node is equal to the smallest of the latest start times (LS,) for all activities leaving the node, where,
LS, = LF, - D,.
Proceeding in a backward pass through the network starting from the “end” node, these quantities can be calculated and are marked in square brackets under each arrow. After obtaining the above quantities, the slack (Free Float) associated with each activity can be calculated using:
slack, = LS, - ES, = LF, - EF,.
We define the critical path of the network as the chain of activities with zero slack. In the network in Fig. 1, the critical path is therefore l-2-345--6. The activities on the critical path are catled critical activities since they cannot be delayed without affecting the entire project. Other activities in the network, which we call noncritical activities, can be delayed by an amount of time equal to their slack without affecting the entire project. Therefore, in resource leveling, we change the start times of only the noncritical activities to obtain a smooth resource allocation schedule.
3. SPREADSHEET PROGRAM
The spreadsheet model proposed in this paper eliminates the tedium involved in the computation
of daily resource requirements during the project period and plotting the data on graphs for comparison. Hence, the student can devote much time to understanding the concepts behind it, rather than wasting time on doing computations. On the other hand, when a project contains a large number of noncritical activities, one may find a large number of possible combinations of starting times that can be given for noncritical activities. Therefore, the manual procedure often fails when dealing with large project networks. The user friendliness of the program is the other
--- dummy activity
Fig. 1. A project network.
A spreadsheet program for learning some aspects of project management 231
attraction. Since the program is fully automated, a studen can easily obtain the results without any special training.
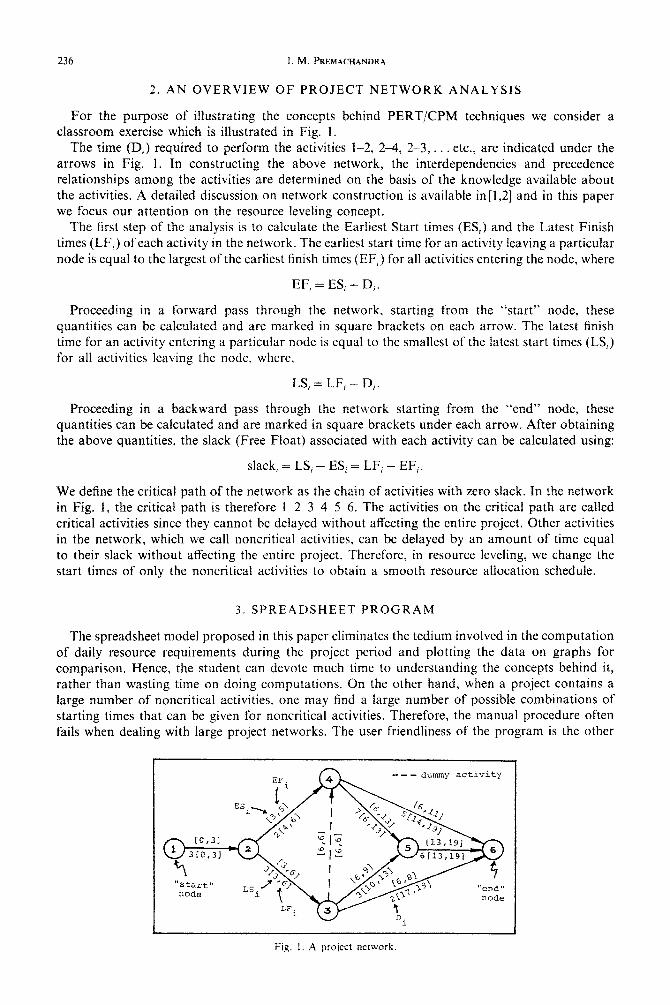
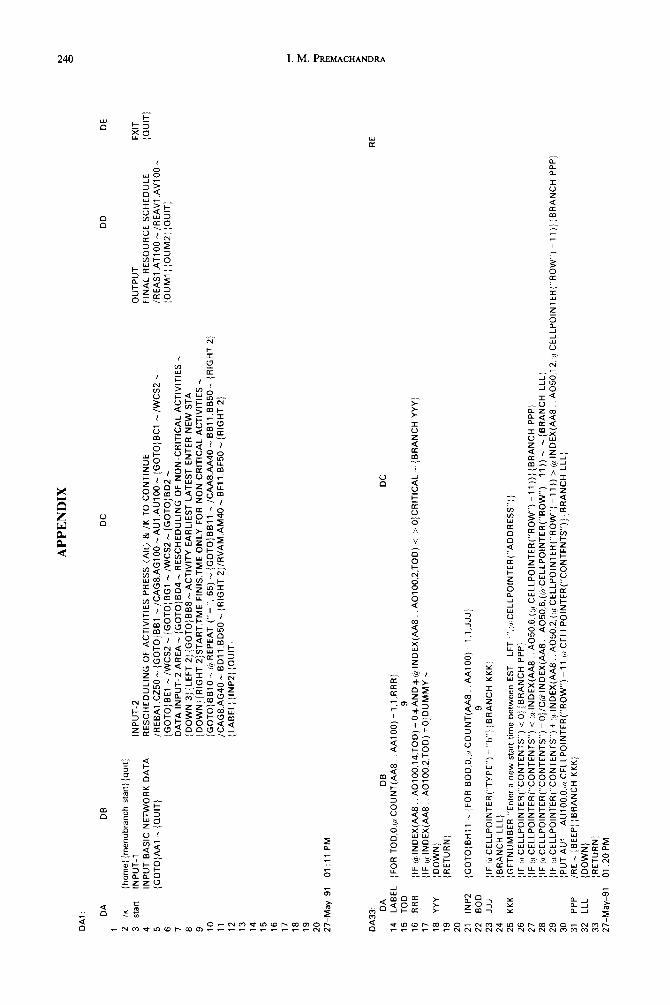
The program (see Appendix) is a menu driven one with the options INPUT-l, INPUT-2, OUTPUT and EXIT and can be invoked by pressing the keys Alt and K. The student can input the data pertaining to the project network in two stages. In stage 1, the student selects the option INPUT-l, so that the Data input- 1 area (Fig. 2) will be displayed on the screen with the cell-pointer positioned at the cell AA 1. The range of cells BA 1 . . CZ50 of the worksheet is reserved for this purpose. Here the student has to input only the activity label (Column AA), activity time (Column AC), number of resource units required/day/activity (Column AE), earliest start time (Column AG) and the latest start time (Column AI) of each activity. The rest of the quantities in the table; earliest finish time, latest finish time and free float are calculated automatically by the following formulas defined in the cells. In cell AK8 the formula:
+ AG8 + AC8
is entered and is copied to the range of cells AK9 . . AKlOO. The formula:
+ AI8 + AC8
is entered in cell AM8 and is copied to the range of cells AM9 . . . AMlOO. In order to calculate the free float, the formula:
+ AI8 - AG8
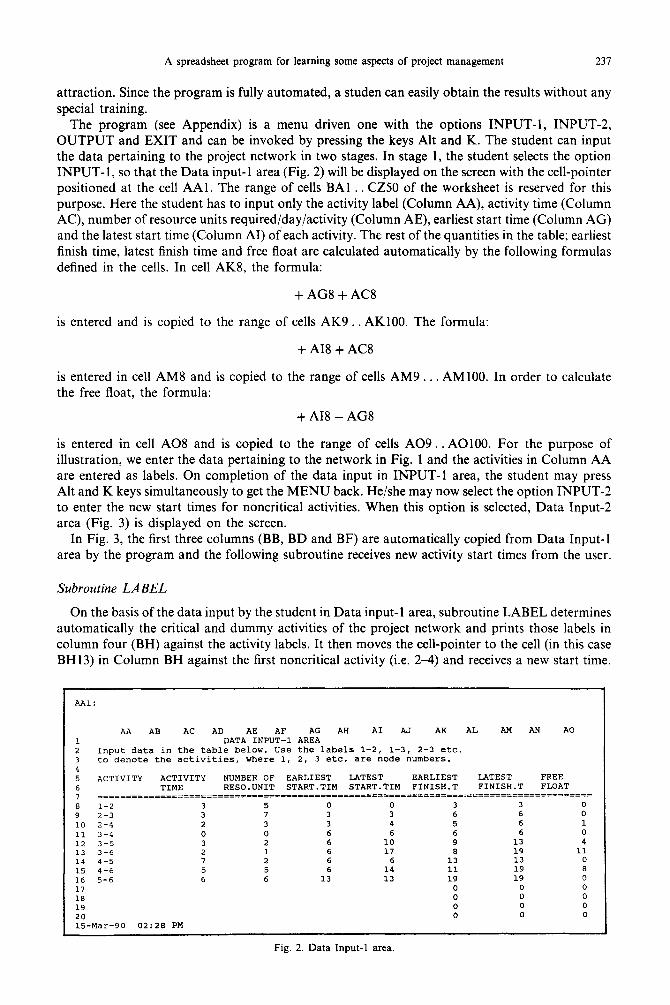
is entered in cell A08 and is copied to the range of cells A09. . AOlOO. For the purpose of illustration, we enter the data pertaining to the network in Fig. 1 and the activities in Column AA are entered as labels. On completion of the data input in INPUT-l area, the student may press Alt and K keys simultaneously to get the MENU back. He/she may now select the option INPUT-2 to enter the new start times for noncritical activities. When this option is selected, Data Input-2 area (Fig. 3) is displayed on the screen.
In Fig. 3, the first three columns (BB, BD and BF) are automatically copied from Data Input-l area by the program and the following subroutine receives new activity start times from the user.
Subroutine LABEL
On the basis of the data input by the student in Data input-l area, subroutine LABEL determines automatically the critical and dummy activities of the project network and prints those labels in column four (BH) against the activity labels. It then moves the cell-pointer to the cell (in this case BH13) in Column BH against the first noncritical activity (i.e. 2-4) and receives a new start time.
I AA1:
1 2 3 4 5 6 7 a 9 10 11 12 13 14 15 16 17 18 19
ACTIVITY ACTIVITY NUMBER OF EARLIEST LATEST EARLIEST LATEST FREE TIME RESO.UNIT START.TIM START.TIM FIN1SH.T FIN1SH.T FLOAT
---- =======_==========E====================_===____-==~============~=~====================
1-2 3 5 0 0 3 3 0
2-3 3 7 3 3 6 6 0
2-4 2 3 3 4 5 6 1
3-4 0 0 6 6 6 6 0
3-5 3 2 6 10 9 13 4 3-6 2 1 6 17 S 19 11 4-5 7 2 6 6 13 13 0
4-6 5 5 6 14 11 19 8
5-6 6 6 13 13 19 19 0 0 0 0 0 0 0 0 0 0 0 0 0
1 :k.lar-90 02:28 PM
AA AB AC AD AE AF AG AH AI AJ AK AL AM AN A0 DATA INPUT-l AREA
Input data in the table below. Use the labels l-2, 1-3, 2-3 etc. to denote the activities, where 1, 2, 3 etc. are node numbers.
Fig. 2. Data Input-l area,
238 1. M. PREMACHANDRA
BK20: READY
BB BC BD BE BF BG BH BI 5J BK 1 2 DATA INPUT-2 AREA 3 4 RESCHEDULING OF NON-CRITICAL ACTIVITIES 5 6 7 8 ACTIVITY EARLIEST LATEST ENTER NEW START TIMES 9 START.TME FINIS.TME ONLY FOR NON CRITICAL ACTIVITIES 10 ===========================================================---___
11 l-2 0 3 CRITICAL 12 2-3 3 6 CRITICAL 13 2-4 3 6 3 14 3-4 6 6 DUMMY 15 3-5 6 13 6 16 3-6 6 19 6 17 4-5 6 13 CRITICAL 18 4-6 6 19 6 19 5-6 13 19 CRITICAL 20 0 15-Mar-90 02:33 PM
Fig. 3. Data Input-2 area.
Before the new input is recorded in the cell, LABEL validates the input in the following ways in order to eliminate any accidental errors the student may make.
l If the new start time of the activity is ~0, l If the new start time of the activity + D, > LF, l If the new start time of the activity < ES,.
In each of the above cases, LABEL rings the bell to indicate an error and pauses the student to input a new value. If the entry is an acceptable one, LABEL prints the value in the cell and then the cell-pointer is automatically moved to the next cell corresponding to the next noncritical activity and so on. In case the student wants the program to assume the earliest start time (ES,) as the new start time of a particular activity, he/she can just press the return key to indicate it. This process continues until the LABEL receives new start times for all the noncritical activities.
The student may then press Alt and K keys again to display the menu and select the option OUTPUT. When this option is selected, the following subroutines are executed.
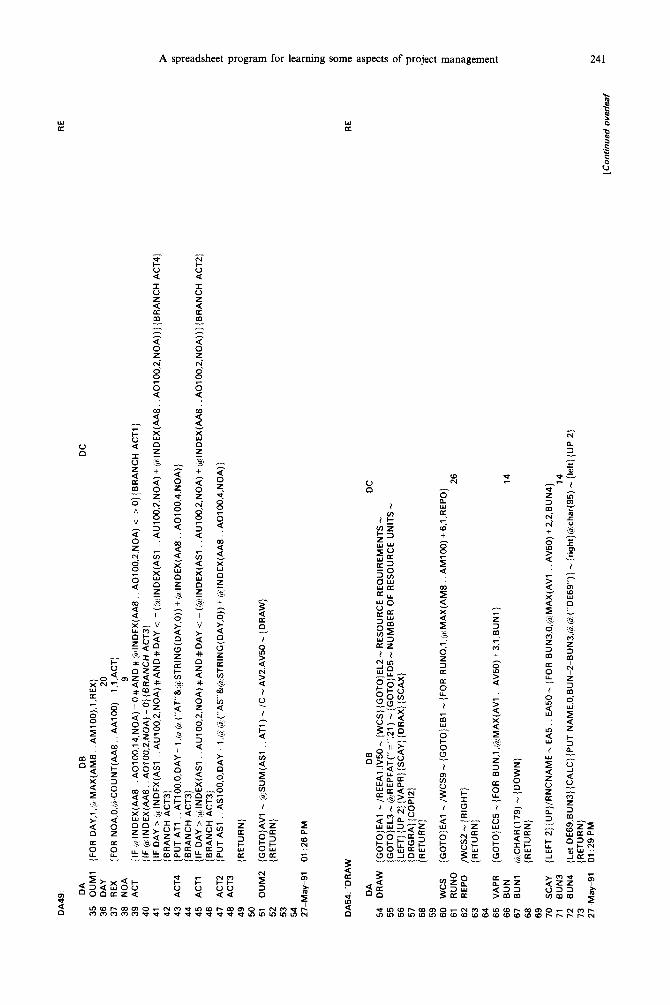
Subroutine OUMl
This subroutine uses the data entered by the student in Data input-l and Data input-2 areas in order to calculate the daily resource requirements during the project period. These values are printed by OUMl in the range of cells AVl . AVlOO.
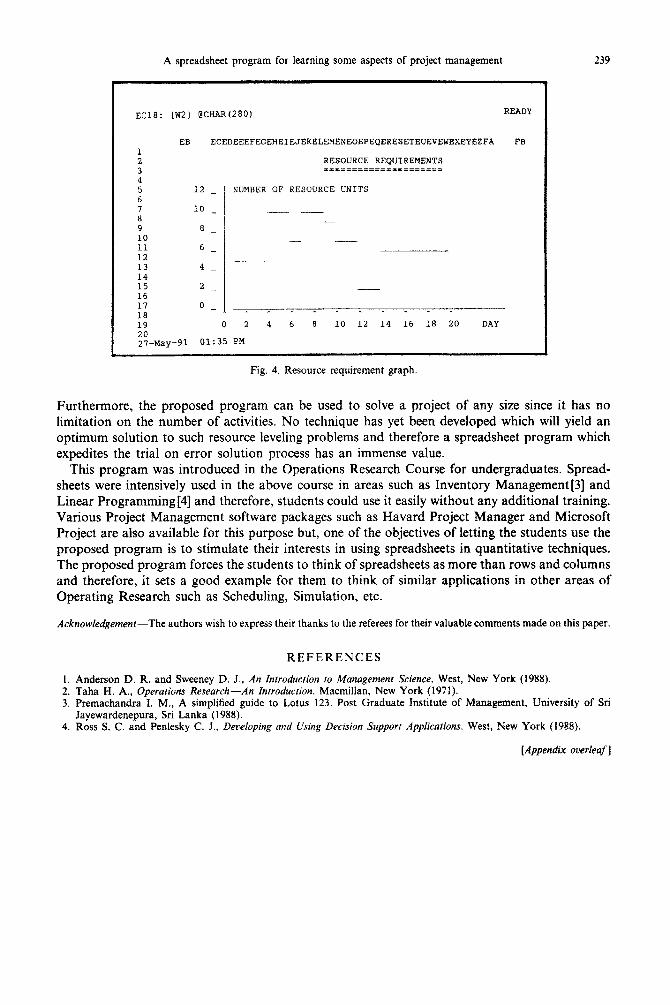
Subroutine DRAW
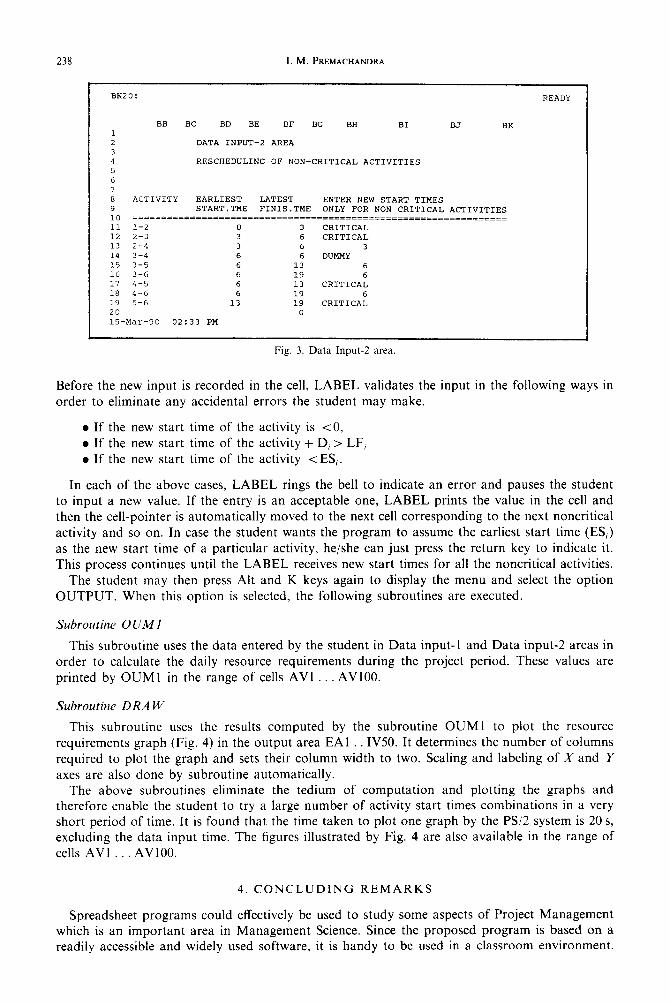
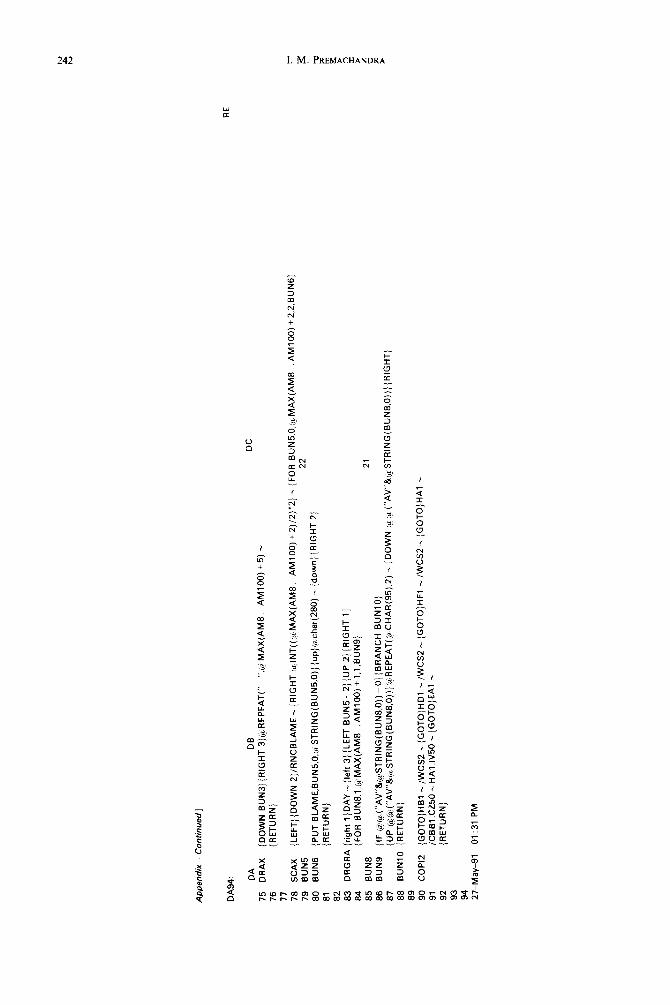
This subroutine uses the results computed by the subroutine OUMl to plot the resource requirements graph (Fig. 4) in the output area EAl . IV50. It determines the number of columns required to plot the graph and sets their column width to two. Scaling and labeling of X and Y axes are also done by subroutine automatically.
The above subroutines eliminate the tedium of computation and plotting the graphs and therefore enable the student to try a large number of activity start times combinations in a very short period of time. It is found that the time taken to plot one graph by the PS/2 system is 20 s, excluding the data input time. The figures illustrated by Fig. 4 are also available in the range of
cells AVl . . . AVlOO.
4. CONCLUDING REMARKS
Spreadsheet programs could effectively be used to study some aspects of Project Management which is an important area in Management Science. Since the proposed program is based on a readily accessible and widely used software, it is handy to be used in a classroom environment.
A spreadsheet program for learning some aspects of project management 239
EC18: [W21 @CHnR(280) READY
EB ECEDEEEFEGEHEIEJEKELEMENEOEPEQERESETEU~V~WEX~YSZFA FB 1
t RESOURCE REQUIREMENTS ===================I3
4 5 12 NUMBER OF RESOURCE CNITS - 6
7 10 - -I_ 8 - 9 S- 10 - 11 6_ 12 13 4 I- - 14 15 2_ 16 17 18
I O- ^^^^_^^_^_
19 0 2 4 6 8 10 12 14 16 18 20 DAY 20 27-May-91 cl:35 PM
Fig. 4. Resource requirement graph.
Furthermore, the proposed program can be used to solve a project of any size since it has no limitation on the number of activities. No technique has yet been developed which will yield an optimum solution to such resource leveling problems and therefore a spreadsheet program which expedites the trial on error solution process has an immense value.
This program was introduced in the Operations Research Course for undergraduates. Spread- sheets were intensively used in the above course in areas such as Inventory Management[3] and Linear Programming[4] and therefore, students could use it easily without any additional training. Various Project Management software packages such as Havard Project Manager and Microsoft Project are also available for this purpose but, one of the objectives of letting the students use the proposed program is to stimulate their interests in using spreadsheets in quantitative techniques. The proposed program forces the students to think of spreadsheets as more than rows and columns and therefore, it sets a good example for them to think of similar applications in other areas of Operating Research such as Scheduling, Simulation, etc.
Acknowledgement-The authors wish to express their thanks to the referees for their valuable comments made on this paper.
REFERENCES
I. Anderson D. R. and Sweeney D. J., An Introduction to Management Science. West, New York (1988). 2. Taha W. A., Operations Research-An Introduction. Macmillan, New York (1971). 3. Premachandra I. M., A simplified guide to Lotus 123. Post Graduate Institute of Management, University of Sri
Jayewardenepura, Sri Lanka (1988). 4. Ross S. C. and Penlesky C. J., developing and Using Decision Support App~icaf~ons. West, New York (1988).
[Appendix overleaf]
AP
PE
ND
IX
DA
1 : DA
D
E
DC
D
D
DE
2 lk
{h
ome}
{m
enub
ranc
h st
art)
{q
ult)
3 S
tart
IN
PU
T-l
4 IN
PU
T
BA
SIC
N
ET
WO
RK
D
ATA
5 :G
OT
O}A
Al
- {Q
UIT
]
6 7 8 9 10
11
12
13
14
15
16
17
18
19
20
27-M
ay-9
1
DA
33:
DA
14
LAB
EL
15
TO
D
16
RR
R
17
18
WY
19
20
21
INP
2
22
BO
D
23
JJJ
24
25
KK
K
26
27
28
29
30
31
PP
P
32
LL
L
33
27-M
ay-9
1
01 :
11
PM
DB
D
C
INP
UT
-2
OU
TPU
T E
XIT
RE
SC
HE
DU
LIN
G
OF
A
CT
IVIT
IES
P
RE
SS
(A
lt)
&
/K
TO
C
ON
TIN
UE
/RE
BA
l .C
Z50
-
(GO
TO
\BB
l -
/CA
G8.
AG
lOO
-
AU
1 .A
UlO
O
- {G
OT
O)B
Cl
- /W
CS
2.
(GO
TO
}BE
l -
/WC
S2
- {G
OT
OJB
Gl
- /W
CS
2-
(GO
TO
}BD
Z
-
DA
TA
INP
UT
-2
AR
EA
- (G
OT
O)B
D4-
R
ES
CH
ED
ULI
NG
O
F
NO
N-C
RIT
ICA
L A
CT
IVIT
IES
-
(DO
WN
3)
{L
EF
T
2)
(GO
TO
jBB
8 -
AC
TIV
ITY
E
AR
LIE
ST
LA
TE
ST
E
NT
ER
N
EW
S
TA
(DO
WN
){R
IGH
T
~}S
TA
RT
.TM
E
FIN
IS.T
ME
O
NLY
F
OR
N
ON
C
RIT
ICA
L A
CT
IVIT
IES
-
{GO
TO
}BB
I~-
(?R
EP
EA
T
(“=
“,
65)
- {G
OT
O)B
BII
-/cA
A8.
AA
40-
BB
ii.B
Bso
- {R
IGH
T
2;
/CA
GB
.AG
40
- B
DI
1 .B
D50
-
{RIG
HT
2)
/RV
AM
.AM
40
- B
FI 1 .B
F50
-
{RIG
HT
2)
(LA
BE
L)/IN
P2J
jQU
IT}
FIN
AL
RE
SO
UR
CE
S
CH
ED
ULE
(Q
UIT
)
/RE
AS
l .A
TlO
O
- /R
EA
Vl
.AV
lOO
-
jOU
M1
)(O
UM
2;
(QU
IT;
RE
(FO
R
TO
D.O
.(~
CO
UN
T(A
A~
~~
100)
~
.I,R
RR
]
(IF
(a
IND
EX
(AA
8.
A01
00.1
4.T
0D)=
0X~N
DX
(uIN
DE
X(A
A8.
.A
O10
0,2,
TO
D)
< >O
}CR
ITIC
AL-
{B
RA
NC
H
YY
Y)
(IF
(s
IN
DE
X(A
A8.
A
Ol0
0.2,
TO
D)
=O}D
UM
MY
-
{DO
WN
}
{RE
TU
RN
)
{GO
TO
;BH
ll -
[FO
R
BO
D,O
.cu
CO
UN
T(A
A8.
A
AlO
O)-
l.l,J
JJ)
9
{IF
((
1 CE
LLP
OlN
TE
R(“
TY
PE
”)
=“b”
/ {B
RA
NC
H
KK
K;
{BR
AN
CH
LL
L;
[GE
TN
UM
BE
R
“Ent
er
a ne
w
star
t t,m
e be
twee
n E
ST
LF
T
.“,(
<I
CE
LLP
OlN
TE
R(“
AD
DR
ES
S”)
j
{IF
kI
CE
LLP
OIN
TE
R(“
CO
NT
EN
TS
”)
< oj
{B
RA
NC
H
PP
P;
(IF
(u
CE
LLP
OlN
TE
R(“
CO
NT
EN
TS
”)
< (u
IN
DE
X(A
A8
A05
0,6,
(fa
CE
LLP
OIN
TE
R(“
RO
W”)
11,)) (
BR
AN
CH
P
PP
)
(IF
(u
CE
LLP
OlN
TE
Fi(“
CO
NT
EN
TS
”)
=0)
/C@
IN
DE
X(A
A8.
. A
050,
6.((
u C
ELL
PO
INT
ER
(“R
OW
”)
11))
-
- {B
RA
NC
H
LLL;
(IF
(u
CE
LLP
OlN
TE
R(“
CO
NT
EN
TS
”)
+ C
R IN
DE
X(A
A8
A05
0,2.
((u
CE
LLP
OIN
TE
R(“
RO
W”)
11
))
> (a
IN
DE
X(A
A8.
. A
050.
12,~
a C
ELL
PO
INT
ER
(“R
OW
”)
11)) {
BR
AN
CH
P
PP
)
{PU
T
AU
1 A
UlO
O,O
.iu
CE
LLP
OIN
TE
R(“
RO
W”)
-
11 .
,a C
CLL
PO
lNT
ER
(“C
ON
TE
NT
S”)
} (B
RA
NC
H
LLL)
IRE
-
{BE
EP
{ (B
RA
NC
H
KK
K}
(DO
WN
}
(RE
TU
RN
)
01 .
2OP
M
DA
49:
DA
35
OU
Ml
36
DA
Y
37
RE
X
38
NO
A
39
AC
T
40
41
42
43
AC
T4
44
45
AC
T1
46
47
AC
T2
48
AC
T3
49
50
51
OU
M2
52
53
54
27-M
ay-9
1
DA
54:
‘DR
AW
DA
54
DR
AW
55
56
57
58
59
60
WC
S
61
RU
N0
62
RE
P0
63
64
65
VA
PR
66
BU
N
67
BU
N1
68
69
70
SC
AY
71
BU
N3
72
BU
N4
73
27-M
ay-9
1
{FO
R
DA
Y.1
.C
MA
X(A
:. .A
MlO
O),
l,RE
X)
DC
{FO
R
NO
A,O
,(a
CO
UN
T(A
A8.
. A
AlO
O)
- l,:
:AC
T)
{IF
(~
IND
EX
(AA
~..A
~~~O
,~~,
NO
A)=
O#A
~DX
~~~I
ND
EX
(AA
~..A
O~O
O,~
.NO
A)
< >O
)(B
RA
NC
H
AC
Tl}
(IF
@
IN
DE
X(A
A8.
. A
OlO
O.2
,NO
A)
=O}{
BR
AN
CH
A
CT
3)
{IF
D
AY
z
@IN
DE
X(A
Sl
..AU
l00,
2,N
OA
)#A
ND
#DA
Y
< =(
@lN
DE
X(A
Sl
..AU
l00.
2.N
OA
)+@
IND
EX
(AA
8.
.AO
lOO
,2,N
OA
))}[B
RA
NC
H
KT
4)
(BR
AN
CH
~
c~3:
(PU
T
AT
1 A
TlO
O,O
,DA
Y
- 1
,(a
(?I (
“AT
”&@
ST
RlN
G(D
AY
,O))
+
@:IN
DE
X(A
A8.
. A
OlO
O.4
.NO
A)}
{BR
AN
CH
A
CT
B}
(IF
D
AY
>
(ulN
DE
X(A
S1
..AU
l00,
2,N
OA
)#A
NO
#DA
Y
< =(
@lN
DE
X(A
Sl
.AU
lOO
.2.N
OA
)+(~
~lN
DE
X(A
A8.
.AO
lOO
,2.N
OA
))}{
BR
AN
CH
A
CT
2}
(BR
AN
CH
A
CT
S}
(PU
T
AS
1 A
SlO
O,O
,DA
Y-l,
@
(+ (
“AS
”&(a
ST
RIN
G(D
AY
,O))
+@
lND
EX
(AA
8.
.AO
lOO
,4,N
OA
))
(RE
TU
RN
)
(GO
TO
JAV
l -
(u S
UM
(AS
1 A
Tl)
- /C
-
AV
2.A
V50
-
(DR
AW
)
(RE
TU
RN
]
01:2
6 P
M
{GO
TO
JEA
l -,
RE
EA
l.l:!O
-{W
CS
}(G
OT
O)E
LL-R
ES
OU
RC
E
RE
QU
IRE
ME
NT
S-
DC
{GO
TO
JELB
-
@R
EP
EA
T(“
=“,
21)
- {G
OT
O}E
D5
- N
UM
BE
R
OF
R
ES
OU
RC
E
UN
ITS
-
{LE
FT
] {U
P
Z}(
VA
PR
}(S
CA
Y)
{DR
AX
] (S
CA
X)
(DR
GR
A]{
CO
Pl2
}
{RE
TU
RN
)
{GO
TO
}EA
l -
/WC
S9
- (G
OT
OJE
Bl
- {F
OR
R
UN
O.1
,@
MA
X(A
M8.
. A
MlO
O)
+G.l,
RE
PO
]
26
/WC
S2
- {R
IGH
T}
{RE
TU
RN
}
{GO
TO
]EC
5-(F
OR
B
UN
,l,@
MA
X(A
Vl
.AV
50)+
3,l,B
UN
l}
14
@C
HA
R(l7
9)
-{D
OW
N)
{RE
TU
RN
]
{LE
FT
2)
{u
P)/R
NC
NA
ME
-
EA
T..
~~
50
- (F
OR
B
uN3,
0,(a
MA
x(A
vl
Av5
0)
+2,
2,B
u~4)
14
{Let
D
E69
,BU
N3]
{CA
LC}{
P
UT
N
AM
E.O
,BU
N-2
-BU
N3,
@i(a
‘(“D
E69
”)}
- {r
ight
}@ch
ar(B
fi)
- {le
ft]
{UP
2)
{RE
TU
RN
}
01:2
9 P
M
RE
RE
242 I.M.PREMACHANDRA