Embed Size (px)
Citation preview

COVER SHEET
This is the author version of article published as:
Frost, Ray and Musumeci, Anthony (2007) A spectroscopic and thermoanalytical study of the mineral Hoganite. Spectrochimica Acta Part A: Molecular and Biomolecular Spectroscopy 67(1):pp. 48-57.
Copyright 2007 Elsevier Accessed from http://eprints.qut.edu.au

1
A spectroscopic and thermoanalytical study of the mineral Hoganite
Anthony Musumeci and Ray L. Frost• Inorganic Materials Research Program, School of Physical and Chemical Sciences, Queensland University of Technology, GPO Box 2434, Brisbane Queensland 4001, Australia. Abstract A comprehensive spectroscopic analysis consisting of Raman, infrared (IR) and near infrared (NIR) spectroscopy was undertaken on the newly discovered mineral Hoganite (Copper(II) acetate monohydrate (Cu(CH3COO)2·H2O)). Assignments of vibrational bands due to the acetate anion have been made in all three forms of spectroscopy. Thermal analysis of the mineral was undertaken to follow its decomposition under a nitrogen atmosphere. Two major mass loss steps at 90 and ~220 °C were revealed. These mass losses correspond very well to firstly, the loss of a single water molecule, and then the loss of the acetate anion which quickly decomposes to form carbon dioxide and water. Key words: Hoganite, copper acetate, Raman spectroscopy, infrared spectroscopy,
near infrared spectroscopy, thermal stability Introduction The vibrational spectroscopy of acetates in both aqueous media and solid state have been comprehensively studied over a long period of time [1-4]. Though one of the major difficulties associated with studying the spectroscopy of acetates is the large amount of variation in the reported literature [5]. In recent years there has been spectral data published on Mg, Ni, Co, Na and many other metal acetates [1, 6-8] though limited data has been published on copper acetate. One of the reasons for this is the lack of suitable samples. One sample that may be used is a naturally occurring copper acetate known as Hoganite [9]. Copper(II) acetate monohydrate, formally known as the mineral Hoganite, is an interesting metal acetate that is found naturally as bluish green crystals embedded in ferruginous gossan at the Potosi Pit, Broken Hill, New South Wales Australia [9]. Hoganite is found in a monohydrate form as the acetate anion is known to bond to the hydroxyl surface with a 1:1 ratio. Detailed thermogravimetric analysis [10, 11] and X-ray diffraction [9] of the mineral has been published, but to the best of this author’s knowledge an in-depth spectral analysis of hoganite has not been documented in the literature. Thus the objective of this work is to determine the Raman, infrared and near infrared spectral characteristics of the mineral Hoganite. Experimental
Mineral
• Author to whom correspondence should be addressed ([email protected])

2
The mineral Hoganite was obtained from the Potosi Pit, Broken Hill. Chemical analysis of Hoganite gave (wt%) C 23.85; H 3.95; Cu 31.6; Fe 0.4; O (by difference) 40.2, yielding an empirical formula of C4H7.89O5.07Cu1.00Fe0.01 [9]. The simplified formula is C4H8O5Cu or Cu(CH3COO)2.H2O, the mineral being identical to the synthetic compound of the same formula. All subsequent analyses were undertaken on the mineral Hoganite X-ray diffraction X-ray diffraction (XRD) patterns were recorded using CuKα radiation (n = 154.18 pm) on a Philips PANalytical X-Pert PRO diffractometer operating at 45 kV and 35 mA with 0.125° divergence slit, 0.25° anti-scatter slit, between 3 and 75° (2θ) at a step size of 0.02°.
Thermal Analysis Thermal decomposition of the mineral was carried out in a TA® Instruments Incorporated high-resolution thermogravimetric analyzer (series Q500) in a flowing nitrogen atmosphere (80 cm3/min). Approximately 25 mg of sample was heated in an open platinum crucible at a rate of 6.0 °C/min up to 1000 °C, incorporating a controlled rate thermal analysis program. The TGA instrument was coupled to a Balzers (Pfeiffer) mass spectrometer for gas analysis. Only selected gases were analyzed.
Infrared spectroscopy
Infrared spectra were obtained using a Nicolet Nexus 870 FTIR spectrometer with a smart endurance single bounce diamond ATR cell. Spectra over the 4000−525 cm-1 range were obtained by the co-addition of 64 scans with a resolution of 4 cm-1 and a mirror velocity of 0.6329 cm/s. Spectral manipulation such as baseline adjustment, smoothing and normalisation was performed using the GRAMS® software package (Galactic Industries Corporation, Salem, NH, USA). Near-infrared spectroscopy Near infrared spectra were collected on a Nicolet Nexus FT-IR spectrometer with a Nicolet Near-IR Fibreport accessory. A white light source was used, with a quartz beam splitter and TEC NIR InGaAs detector. Spectra were obtained from 11 000 to 4000 cm-1 by the co-addition of 128 scans at a resolution of 8cm-1. A mirror velocity of 1.2659 cm/s was used. The spectra were transformed using the Kubelka-Munk algorithm to provide spectra for comparison with absorption spectra. Spectral manipulation such as baseline adjustment, smoothing and normalisation were performed using the Spectracalc software package GRAMS. Band component analysis was undertaken using the Jandel ‘Peakfit’ software package which enabled the type of fitting function to be selected and allowed specific parameters to be fixed or varied accordingly. Band fitting was done using a Lorentz-Gauss cross-product function with the minimum number of component bands used for the fitting process. The Gauss-Lorentz ratio was maintained at values greater than 0.7 and fitting was

3
undertaken until reproducible results were obtained with squared correlations greater than 0.995.
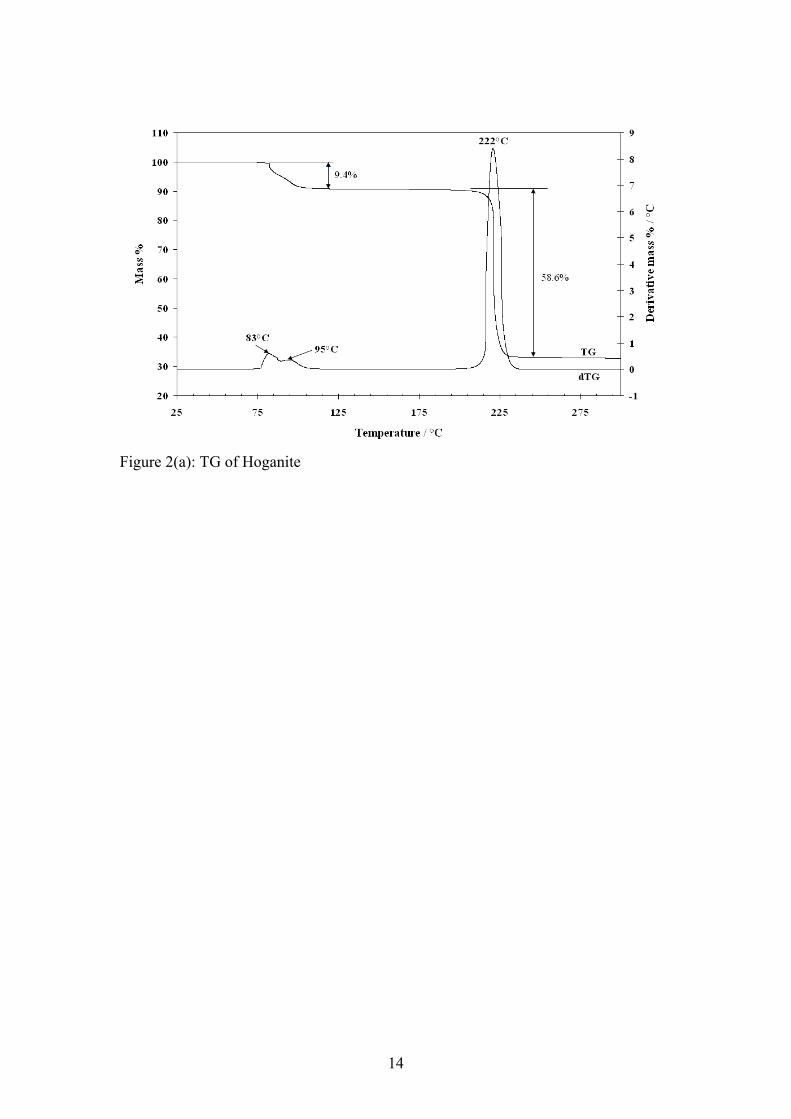
Raman spectroscopy The crystals of Hoganite were placed on the stage of an Olympus BHSM microscope, equipped with 10x and 50x objectives. The microscope is part of a Renishaw 1000 Raman microscope system, which also includes a monochromator, a filter system and a charge coupled device (CCD). Raman spectra were excited by a double Nd-YAG laser (532 nm) at a resolution of 2 cm-1 in the range between 100 and 4000 cm-1. Repeated acquisitions using the highest magnification were accumulated to improve the signal to noise ratio. Spectra were calibrated using the 520.5 cm-1 line of a silicon wafer. Previous studies by the authors provide more details of the experimental techniques [12, 13]. Spectral manipulation such as baseline adjustment, smoothing and normalisation was performed using the GRAMS® software package. Scanning electron microscopy (SEM) Samples were prepared for SEM by placement of a small amount of the calcined product on to an aluminium stub with the aid of double sided carbon tape. The samples were then coated with a thin layer of carbon to reduce charging during analysis. Secondary electron images were obtained using an FEI Quanta 200 scanning electron microscope. Elemental sample analysis was undertaken as required using energy dispersive X-ray (EDX) microanalysis. Results and discussion: X-ray diffraction X-Ray diffraction of the obtained mineral was undertaken (Figure 1(a)) to confirm its identity as copper acetate monohydrate. From the XRD spectrum we see the sample obtained is a near perfect match to the copper acetate hydrate reference pattern (27-145). Both the copper acetate and Hoganite compounds belong to the monoclinic crystal system. Hoganite has cell parameters of a = 13.845, b = 8.528 and c = 13.197, whilst the reference pattern copper acetate hydrate has cell parameters of a =13.863, b= 8.558 and c=13.171 which are very similar. The crystal structure of the mineral Hoganite is shown in Figure 1(b) clearly showing the relative spatial orientation of the water, acetate and copper groups. Thermogravimetric analysis: Thermogravimetric analysis of Hoganite and the mass spectrum of the evolved gases upon decomposition are shown below in Figures 2(a) and (b) respectively. The thermogravimetric (TG) and differential thermogravimetric (dTG) curves, shown in figure 2(a), show two distinct mass loss steps. The mass loss step between 83 °C and 95 °C is most likely due to the loss of the single molecule of water attached to the monohydrated acetate. This claim is supported by peaks in the mass spectrum between 82 °C and 96 °C, for the 18 m/z ratio curve which is indicative of water. The mass loss of 9.4% also correlates well with the expected 9.0% mass loss for a single molecule of water, as is shown in the equation for mass loss step 1.
4
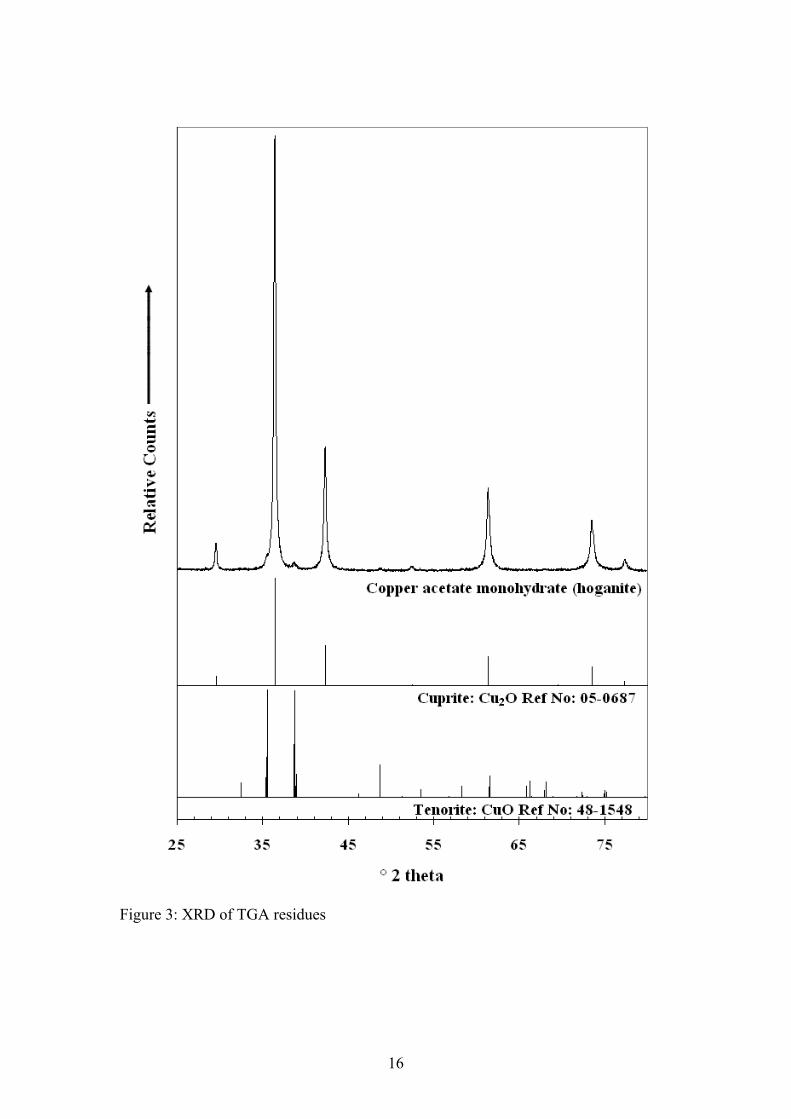
Step 1 between 83 and 95°C Cu(CH3COO)2·H2O → Cu(CH3COO)2 + H2O The major mass loss of 58.6% at 222°C is attributed to the loss of the acetate anion as gaseous carbon dioxide and water. This theory is supported by peaks in the mass spectrum for mass to charge ratios of 44 and 18 (figure 2(b)). Quite clearly the equation for step 2 is not balanced with respect to the oxygen, as the apparatus may have been sucking in a small amount of air which was confirmed by the nature of the 32 m/z curve. The nitrogen used may also have contained a small amount of oxygen which is known to be inherently difficult to eliminate. Step 2 at 222°C 2Cu(CH3COO)2 → Cu2O + 8CO2 + 6H2O X-ray diffraction of the TGA residues was also performed (figure 3) and revealed that the predominant copper oxide phase was cuprite (Cu2O) with a very small amount of tenorite (CuO) present as well. It is quite evident that there is only a very small amount of tenorite in the residue and that the copper(I) oxide is being converted to the more stable copper(II) oxide. Thus for simplicity we have only indicated Copper(I) oxide as the final product in the decomposition reactions of hoganite shown previously. Scanning electron microscope images of the TGA residues (figure 4(a)) were also acquired along with EDX analysis of the residual powder. There is thought to be a possibility that the copper acetate mineral may form copper oxide nanotubes or other nanostructures upon heating. Such nanotructures may be possible as the copper acetate contains both a metallic copper catalyst and acetate molecules which may act to provide the framework for such nanostructures. Unfortunately, analysis of the calcined product only illustrated the presence of a residual copper oxide (determined by EDX analysis (figure 4(b))) in the form of a typical high surface area sintered metal oxide. No interesting nanostructured materials were found in the residual powder. Near-Infrared Spectroscopy For the mineral Hoganite, the NIR spectrum consists of both O-H vibrations resulting from water units and C-H vibrations from the methyl group of the acetate anion. The spectrum has been divided into three regions being; the first fundamental O-H overtones (Figure 5(a)), O-H and C-H overtones (Figure 5(b)) and the O-H and C-H combination bands (Figure 5(c)). Results of band component analysis for the NIR, IR and Raman spectra are shown in Table 1. The first fundamental overtone region shown in Figure 5(a) (6200-7500 cm-1) is due to overtones of the water O-H stretching vibrations evident in the infrared spectrum. The NIR bands that were resolved at 6939, 6856, 6723, 6441 cm-1 are most likely due to overtones of the mid-IR bands that are present at 3471, 3427, 3368 and 3210 cm-1 due to the close match observed from simply doubling these bands. The NIR spectrum of the water, O-H, and methyl, C-H, overtones is shown in Figure 5(b) in the region from 5500-6100 cm-1. The two well resolved bands at 6001 and 5943 cm-1

5
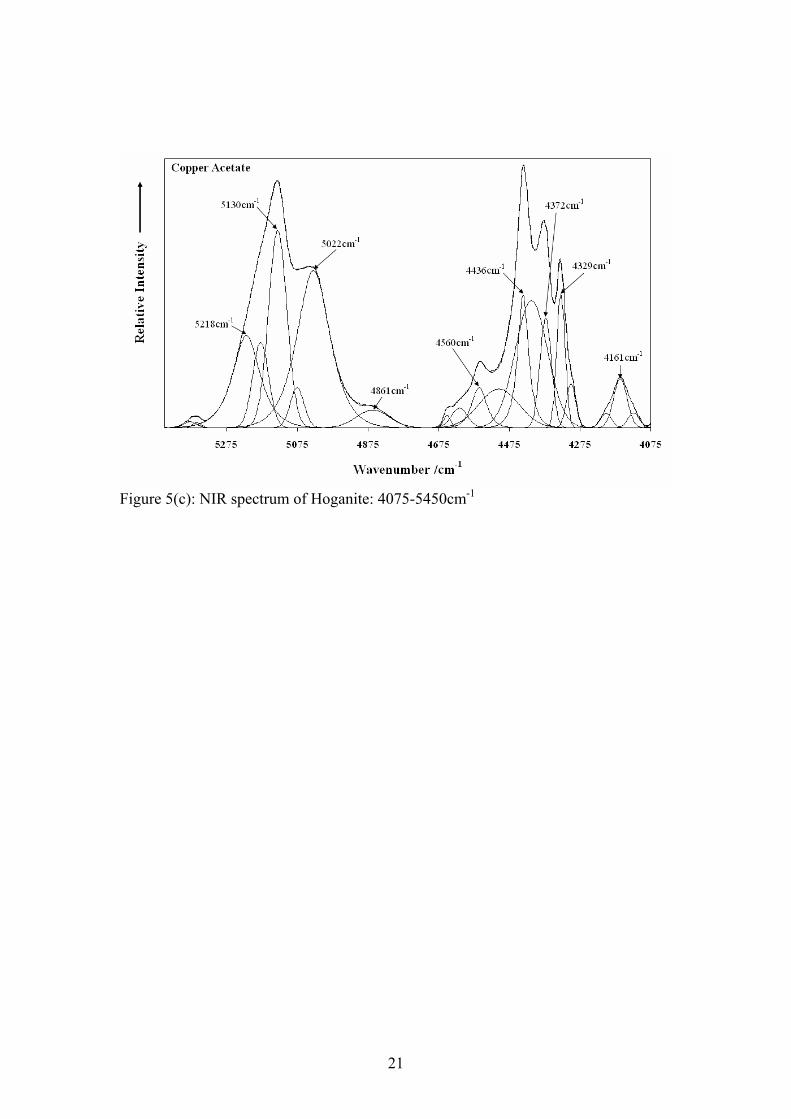
are likely to be the first overtone of the two small C-H stretching vibrations present in the mid IR and Raman spectra at ~2988 and ~2942 cm-1. Whilst the four bands that are present at 5800, 5719, 5654 and 5630 cm-1 are due to water overtones and are typical of a water type spectrum for minerals [14]. Figure 5(c) shows the region of the NIR spectrum from 4075-5450 cm-1 which is dominated by combination bands involving O-H stretching and deformations as well as C-H stretching and deformations. The complex series of bands present from 4600-4300 cm-1 are due to the combination of Raman active bands present between 3024-2862 cm-1 (attributed to C-H stretching vibrations) with bands between 1360-1450 cm-1 (attributed to C-H deformations). The number of resolved bands in this region simply demonstrates the complexity of the hoganite molecular structure. Finally the bands present at 5218, 5130, 5022 and 4861 cm-1 in the NIR spectrum are due to combinations of the O-H stretching vibrations evident in the mid-IR between 3210-3528cm-1 with the weak O-H deformations which were observed in the Raman spectrum between 1640-1670cm-1. Infrared spectroscopy The infrared spectrum of copper acetate hydrate at room temperature is provided in Figures 6(a)-(c). Figure 6(a) shows the infrared spectrum in the region from 2850-3700 cm-1. The spectrum is dominated by three large peaks at 3471, 3368 and 3269 cm-1 which are due to O-H stretching vibrations from the single molecule of water that is associated with the acetate anion. Quite clearly there are at least three different environments of the O-H units leading to three intense bands with variation in the location of the stretching vibrations due to differences in the strength of the hydrogen bonds. There are also two small broad peaks present at 2942 cm-1 and 2988 cm-1 which are commonly observed in any acetate spectra and are due to the A1 v(CH) stretch and the B1 v(CH) stretching vibrations [15]. Figure 6(b) shows the infrared spectrum in the region from 1200-17000 cm-1. A small sharp peak is present at 1354 cm-1 which is due to the A1 δ(CH3) rocking vibration. Upon band component analysis of the peaks around 1430 cm-1, three bands were found. The band at 1418 cm-1 is due to the A1 (COO) stretching vibration, the small broad band at 1439 cm-1 is due to the B1 δ(CH3) deformation and finally the intense band at 1443 cm-1 is due to the B2 δ(CH3) deformation [16]. There is also one other very intense peak in the spectrum present at 1598 cm-1 which we attribute to the B1 (COO) asymmetric stretching vibration of the acetate[5]. Figure 6(c) shows the low wave number region from 575-1075 cm-1. The infrared spectrum in this region is dominated by two intense bands at 627 cm-1 and 687 cm-1 which are attributed to B2 π(COO) rocking and A1 δ(OCO) deformation of the acetate anion [5, 15]. There are two other bands in this region of the spectrum at 1033 cm-1 and 1051 cm-1 which can be attributed to the B1 and B2 ργ(CH3) rocking vibration. All band assignments in the infrared correlate well with other values published on various other metal acetates [5]. Raman spectroscopy
6
The Raman spectrum of hoganite displaying the C-H and O-H stretching region is shown in the Figure 7(a). Quite clearly we see a single, weak band at 3478 cm-1 which we attribute to the O-H stretching from the water molecule. There are a number of sharp, intense bands at 2941, 2989 and 3024 cm-1 due to C-H stretching within the methyl group. More specifically the vibrational bands at 3024 and 2989 cm-1 are due to B1 and B2 v(CH) stretching whilst the band at 2941 cm-1 is due to the A1 C-H symmetric stretching vibration [16] . When salts of carboxylic acids such as acetic are formed the C=O and C-O bonds are replaced by two equivalent C O bonds with a bond order of 1.5 [3, 17-20]. These two C O bonds interact in-phase and out of phase to give two bands: the asymmetric stretching vibration which is intense in the infrared spectrum but relatively weak in the Raman spectrum, and a symmetric stretching band which is weak in intensity in the infrared spectrum but strong and polarised in the Raman spectrum [5]. These two vibrations are normally found in the 1540-1650 and 1360-1450cm-1 regions respectively [18, 20]. The Raman spectrum of the C O stretching region of the acetates is shown in Figure 7(b), in the region of 1325-1500cm-1. We quite clearly see three distinct peaks upon band component analysis in the region from 1410-1450 cm-1, which we can attribute to the symmetric stretching vibrations of the C O bond and deformations of the methyl substituent. The band at 1449 cm-1 is due to the B2 δ(CH3) deformation, whilst the band at 1440 cm-1 is attributed to the A1 v(COO) stretching vibration and finally the band at 1418 cm-1 is attributed to the B1 δ(CH3) deformation [5]. The asymmetric stretching vibrations could not be resolved from the background noise in the region from 1540-1650 cm-1 in the Raman spectrum, though was observed to be a very intense band in the infrared at 1598 cm-1, as stated earlier. Figure 7(b) also shows a clearly resolved A1 methyl (HCH) deformation at 1360 cm-1, which is to be expected in the Raman spectrum of a metal acetate [5]. Figure 7(c) depicts the 150-1000 cm-1 region of the Raman spectrum for hoganite. We see two sets of peaks at 948 and 938 cm-1 and 703 and 684cm-1 which are attributed to the A1 v(CC) stretch and the A1 δ(OCO) deformation on the acetate anion. Interestingly, a well resolved split of each of these vibrations can be observed, leading us to believe that the acetate anion is present in two different conformations in the crystal structure Conclusions A comprehensive spectroscopic and thermal analysis of the mineral Hoganite was undertaken. Vibrational bands due to the acetate anion have been assigned in Raman, IR and NIR spectroscopic techniques. Thermal analysis of the mineral revealed two major mass loss steps, the first step at around 90°C is due to the loss of the water molecule whilst the major mass loss step at 222°C is thought to be the result of the loss of the acetate anion as carbon dioxide and water vapour. The resulting sintered metal oxide formed after TGA was comprised mainly of a Copper(I) oxide phase, as confirmed by X-ray diffraction and EDX analysis. Acknowledgments
7
The financial and infra-structure support of the Queensland University of Technology Inorganic Materials Research Program of the School of Physical and Chemical Sciences is gratefully acknowledged. The Australian Research Council (ARC) is thanked for funding.

8
References [1]. G. S. Raghuvanshi, M. Pal, M. B. Patel and H. D. Bist, Journal of Molecular
Structure 101 (1983) 7. [2]. G. S. Raghuvanshi, D. P. Khandelwal and H. B. Bist, Spectrochimica Acta
Part A: Molecular and Biomolecular Spectroscopy 37 (1981). [3]. K. Ito and H. J. Bernstein, Can. J. Chem. 34 (1956) 170. [4]. L. H. Jones and E. J. Mclaren, Journal of Chemical Physics 22 (1954) 1796. [5]. R. L. Frost and J. T. Kloprogge, Journal of Molecular Structure 526 (2000)
131. [6]. G. S. Raghuvanshi, D. P. Khandelwal and H. D. Bist, Spectrochimica Acta,
Part A: Molecular and Biomolecular Spectroscopy 41A (1985) 391. [7]. R. I. Bickley, H. G. M. Edwards, S. J. Rose and R. Gustar, Journal of
Molecular Structure 238 (1990) 15. [8]. Z. Nickolov, I. Ivanov, G. Georgiev and D. Stoilova, Journal of Molecular
Structure 377 (1996) 13. [9]. D. E. Hibbs, U. Kolitsch, P. Leverett, J. L. Sharpe and P. A. Williams,
Mineralogical Magazine 66 (2002) 459. [10]. K. Zhang, J. Hong, G. Cao, D. Zhan, Y. Tao and C. Cong, Thermochimica
Acta 437 (2005) 145. [11]. A. Y. Obaid, A. O. Alyoubi, A. A. Samarkandy, S. A. Al-Thabaiti, S. S. Al-
Juaid, A. A. El-Bellihi and E.-H. M. Deifallah, Journal of Thermal Analysis and Calorimetry 61 (2000) 985.
[12]. R. L. Frost, W. N. Martens and P. A. Williams, Journal of Raman Spectroscopy 33 (2002) 475.
[13]. R. L. Frost, W. Martens, J. T. Kloprogge and P. A. Williams, Journal of Raman Spectroscopy 33 (2002) 801.
[14]. R. L. Frost, K. L. Erickson, O. Carmody and M. L. Weier, Spectrochimica Acta Part A: Molecular and Biomolecular Spectroscopy 61 (2005) 749.
[15]. K. Nakamoto, Infrared Spectra of Inorganic and Coordination Compounds, John Wiley & Sons, New York, 1963.
[16]. V. Koleva, Croatica chemica acta 78 (2005) 581. [17]. E. Spinner, Journal of the Chemical Society, Abstracts (1964) 4217. [18]. N. B. Colthup, L. H. Daly and S. E. Wiberly, Introduction to infrared and
Raman spectroscopy, 3 ed., Academic, New York, 1974. [19]. J. Semmler, D. E. Irish and T. Ozeki, Geochimica et Cosmochimica Acta 54
(1990) 947. [20]. D. Lin-Vien, N. B. Colthup, W. G. Fateley and J. G. Graselli, The handbook of
infrared and Raman characteristic frequencies of organic molecules, Academic, SanDiego, 1991.

9
List of Tables: Table 1: NIR, IR and Raman combined spectroscopic analysis data table
10
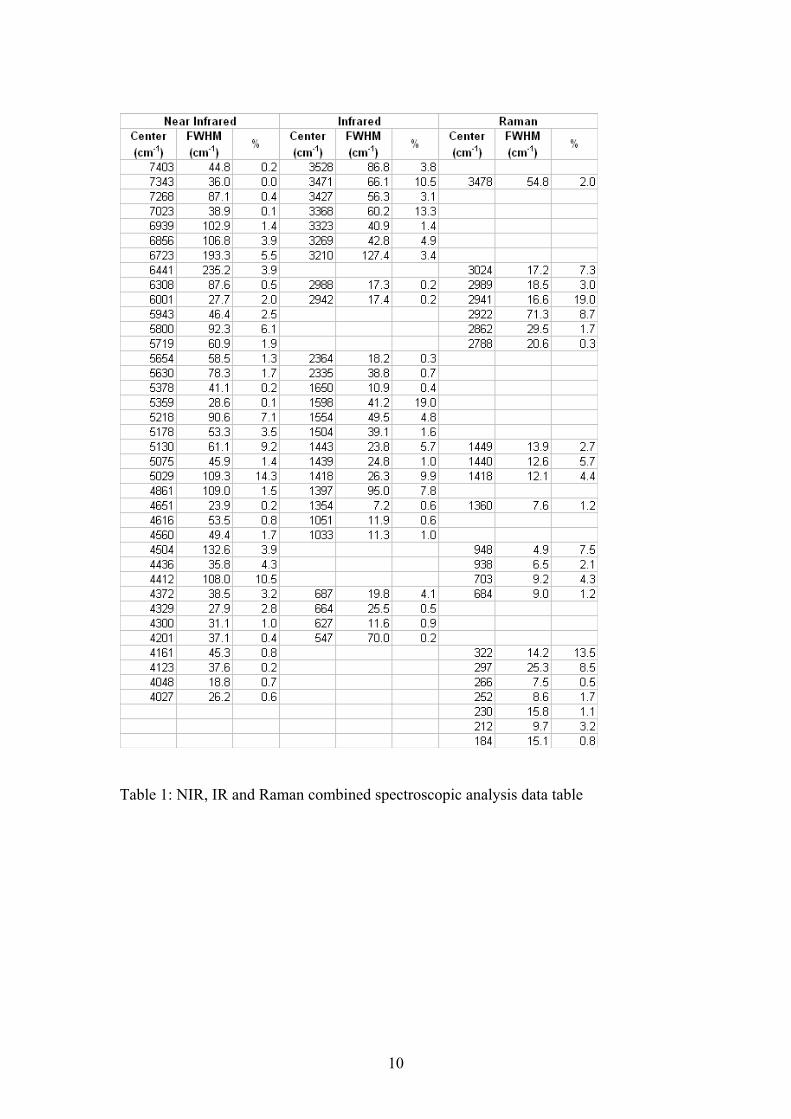
Table 1: NIR, IR and Raman combined spectroscopic analysis data table

11
List of Figures: Figure 1(a): XRD of Hoganite (b): Crystal structure of Hoganite Figure 2(a): TG analysis of Hoganite (b): MS analysis of Hoganite Figure 3: XRD of TGA residues Figure 4(a): SEM image of calcined Hoganite 4(b): EDX spectrum of calcined Hoganite surface Figure 5(a): NIR spectrum of Hoganite: 6200-7500cm-1
(b): NIR spectrum of Hoganite: 5500-6100cm-1
(c): NIR spectrum of Hoganite: 4075-5450cm-1
Figure 6(a): Infrared spectrum of Hoganite: 2850-3700cm-1
(b): Infrared spectrum of Hoganite: 1200-1700cm-1 (c): Infrared spectrum of Hoganite: 575-1075cm-1
Figure 7(a): Raman spectrum of Hoganite: 2750-3600cm-1
(b): Raman spectrum of Hoganite: 1325-1500cm-1
(c): Raman spectrum of Hoganite: 150-1000cm-1

12
Figure 1(a): XRD of Hoganite and the reference pattern of copper acetate hydrate

13
Figure 1(b) Crystal structure of Hoganite.
14
Figure 2(a): TG of Hoganite

15
Figure 2(b): MS of Hoganite
16
Figure 3: XRD of TGA residues

17
Figure 4(a): SEM image of calcined Hoganite

18
Figure 4(b): EDX analysis of calcined Hoganite surface.

19
Figure 5(a): NIR spectrum of Hoganite: 6200-7500cm-1

20
Figure 5(b): NIR spectrum of Hoganite: 5500-6100cm-1
21
Figure 5(c): NIR spectrum of Hoganite: 4075-5450cm-1

22
Figure 6(a): Infrared spectrum of Hoganite: 2850-3700cm-1

23
Figure 6(b): Infrared spectrum of Hoganite: 1200-1700cm-1

24
Figure 6(c): Infrared spectrum of Hoganite: 575-1075cm-1

25
Figure 7(a): Raman spectrum of Hoganite: 2750-3600cm-1

26
Figure 7(b): Raman spectrum of Hoganite: 1325-1500cm-1

27
Figure 7(c): Raman spectrum of Hoganite: 150-1000cm-1