Embed Size (px)
Citation preview
Portland State University Portland State University
PDXScholar PDXScholar
Dissertations and Theses Dissertations and Theses
1974
A Spectrographic Analysis of Bahasa Indonesia A Spectrographic Analysis of Bahasa Indonesia
Vowel Phonemes Under Primary Stress in CVC Vowel Phonemes Under Primary Stress in CVC
Words Words
Ingrid T Hanna Portland State University
Follow this and additional works at httpspdxscholarlibrarypdxeduopen_access_etds
Part of the Linguistic Anthropology Commons
Let us know how access to this document benefits you
Recommended Citation Recommended Citation Hanna Ingrid T A Spectrographic Analysis of Bahasa Indonesia Vowel Phonemes Under Primary Stress in CVC Words (1974) Dissertations and Theses Paper 2138 httpsdoiorg1015760etd2136
This Thesis is brought to you for free and open access It has been accepted for inclusion in Dissertations and Theses by an authorized administrator of PDXScholar Please contact us if we can make this document more accessible pdxscholarpdxedu
AN ABSTRACT OF THE THESIS OF Ingrid T Hanna for the Master
of Arts in Anthropology presented May 13 1974
Title A Spectrographic Analysis of Eahasa Indonesia
Vowel Phonemes Under Primary 5tr3ss in evc Words
APPROVED BY MEMBERS OF THE THESIS COMMITTEE
__ Doe E Pierce Chairma n
Daniel J Schsa
This study is an investigation into the natureof the
vowel phonemes of Bahasa Indonesia in monosyllabic words
under primary stress and consisting of a consonant followshy
ed by a vowel followed by a consonant Bahasa Indonesia is
-the national language of the Republic of Indonesia All of
the material in the literature relating to the vowel quality
of this language is highly impressionistic Some of the
descriptions are comparisons with vowels in various modern
Indo-European languages rather than scientific descriptions
of strictly Indonesian vowel quality_
In order to derive a more accurate picture of the
phonetic qualities of Bahasa Indonesian vowels the acousshy
2
tic spectrograph was utilized This instrument analyzes
a complex human speech wave and produces a visual image
of the frequencies in the wave which are not filtered out
by the articulators The data consisted of recordings of
eighty-eight words as produced by a native speaker Every
phoneme was contrasted with every other middotvowel phoneme in
identical environments Spectrograms were then made of
every phoneme in every environment that it occurred The
information derived from these spectrograms was then charted
These charts show the approximate range of sound quality
which native speakers recognize as a particular phoneme in
the specified environment
The results of the study show that Bahasa Indonesia
has three front vowels contrasting high mid and low tongue
positions and two back vowels contrasting high and mid
tongue positions The three front vowels have slightly overshy
lapping distributions this may partially be due to the fact
that the words in which the phonemes were found had no conshy
trasting word containing a neighboring phoneme This differs
markedly with the back vowels where the distributions are
sharply separated
The aforementioned charts of vowels have a distinct
resemblance to the traditional vowel charts Thus after
all the evidence was gathered and analyzed a traditional
vowel diagram was drawn for thes~ particular vowels of
Bahasa Indonesia
TO THE OFFICE OF GRADUATE STUDIES AND RESEARCH
The members of the Committee approve the thesis of
Ingrid T Hanna presented May 13 1974
e E Pierce Chairman
Studies
of Anthropology
May 13 1974
A SPECTROGRAPHIC ANALYSIS
OF
BAHASA INDONESIA VOWEL PHONEMES
UNDER PRIMARY STRESS IN eve WORDS
by
INGRID T HANNA
A thesis submitted in partialfulfillment of the requirements for th~ degree of
MASTER OF ARTS in
ANTHROPOLOGY
Portland State University 1974
ACKNOWLEDGEMENTS
I would like to thank the faculty members on my
thesis committee for their help and contributions
am especially grateful to Prof Joe E Pierce for his
continual advise and mor~l support
Mostly I would like to thank my husband withoutmiddot
whose understanding constant encouragement and proshy
fessional advise I could not have survived the entire
effort
I
TABLE OF CONTENTS
PAGE
ACKNOWLEDGEMENTS iii
CHAPTERi r I INTRODUCTION 1
Language Justification for Study Statement of the Problem Delimitations of the Study
II THEORETICAL BACKGROUND 7
PhoneticsPhonemics Acoustic Theory FundamentalsHarmonics Acoustics vs Articulation Spectrograph
I I I METHODOLOGY bull bull bull bull bull bull bull bull bull bull bull bull bull bull bull bull bull bull bull bull bull bull bull bull bull bull bull bull bull 1 5 I
Phoneme Identification Spectrograms
IV FINDINGS I 24
V SUMMARY AND CONCLUSIONS bullbullbullbullbullbullbullbullbullbullbullbullbullbullbullbullbullbull 67
EIBLIOGRAPHY ~ bullbull _bullbull _ __ bull __ 690 __ bull _
Sources Sources
Cited Consulted
APPENDIX A 71
List of Words
APPENDIX B bull --- bull bull - bull bull bull bull bull bull I bull bull bull Linguistic Symbolization Used
73
CHAPTER I
INTRODUCTION
Language
Bahasa Indonesia the official name applied to the
Indonesian language is a member of the Malayo-Polyrresian
language family The term Bahasa Indonesia is often used
synonymously with modern Malay or Malay dialect (Uhlenbeck
1967) References to a similar form of this Malay based
language are found as early as the 16th cent~ry by traders
such as th~ Chinese the Hindu and the Arabs (Woodman 1955)
Words were added to the language known as Melaju Pasar or
Bazaar Malay as trade with foreigners increased (Woodman
1955) These foreign elements in Melaju Pasar formed the
essential differences between it and the Malay spoken on the
Ma~ay Peninsula (Woodman 1955) Bahasa Indonesia differs
little from the standard dialect of the Malay Peninsula and
daes so mainly in its relatively large and growing vocabulashy
ry borrowed from European and indigenous languages (Amerishy
can University 1970) Bahasa Indonesia is then an adaptashy
tion of Malay inasmuch as it has been changed by the origishy
nal regional languages and modern European languages (Alisshy
jahbana 1949)
2
Today Bahasa Indonesia is the official language of the
Republic of Indonesia It has been estimated that over 200I
region~l languages are spoken in this country of wide cul-
I tural diversity (Wo~dman 1955) When Indonesia beganto
I strive for independence from Dutch colonialists a common
language seemed eSsential in an effort to unify the nationI Indonesian political leaders desirous of revitalizing r th people br9ught (to bare) the most effective means of
organizing them in the greatest numbers (Alisjahbana 1949)
Attention was focused upon the Malay language which was the
lingua Franca for most of Southeast Asia Javanese was
rejected although it possessed a thousand-year-old literary
tradition and was the language of the largest ethnic group
in the islands (American University 1970) The Javanese
language has a fairly ~igid system of vo~abulary differshy
ences based on social class Thus Malay became the basis
of the national language At the 1928 conference of the
pertemuan Muda (Meeting of Youth) Malay was chosen to be
the basis of the national language (American University
1970) By 1930 then the term Malay Language was officshy
ially changed to the Indonesian language (Uhlenbeck 1967)
It became the language for scholarly endeavors and the langshy
uage of leaders and officials During the Japanese occupashy
tion in 1942 the language made further gains In an effort
to combat Dutch cultural influence it was made the compulshy
3
sory language uied in schools from elementary and up
Bahasa Indonesia became the official national language
when the Republic of Indonesia was farmed in 1945
Justification For Study
Phonemic descriptions of Bahasa Indonesia are almost
non-existent and very limited f from a linguistic point of
view Most descriptions of the sounds of Indonesian are
of a comparative nature i e Bahasa Indonesian sounds are
likened to sounds of modern Indo-European languages Echols
and Shadilys An Indonesian-English Dictionary describes
Indonesian sounds in relation to the similar sounds in
English For instance they argue that the e in the Indoshy
nesian word sen is like the e in the English word make n
only shorter Statements such as the aforementionedmay
be practical for most purposes but are not necessarily
linguistically sound and almost certainly inaccurate
Another deficiency which seems to be present in phonshy
emic analyses not only in Indonesian is the impressionistic
nature of these analyses When dealing with a lang~ag8
the linguist must attempt to remove all linguistic biases
and comparisons because phonetic details may escape the
ear of the analyst f especially in a foreign language upon
which he is likely to impose depending upon the degree of
his skill any of the few prejudices of his native phonemic
scale (Pulgram 1965) Even when the investigator does nat
4
I
rely on comparative methods of description he cannot compshy
letely remove all the sounds in his linguistic memory when
describing a new language He will invariably hear sounds
that are very similar to those he knows and may not be able
to discern certain minor although perhaps crucial differshy
ences Phonemic descriptions are most often of this impresshy
sionistic variety
Spectrographic analyses of the sounds of a language
provide an objective measure of the quality of the sounds
of a language Spectrographs record precise sound qualities
produced by a speaker particuiarly vowels This mode of
description will delete the impressions of the investigator
and will map precise quality for sounds in question what
shows on a spectrogram is an acous~ic reality whether the
analyst hears it or not (Pulgram 1965) It is these
precise sound qualities of Bahasa Iridonesian vowel phonemes
that this investigation will attempt to ascertain Instrushy
mentaltesting of hypotheses has been a part of scientific
study for many years but very little has been done to
date in linguistics (Pierce 1963) The acoustic specshy
trograph can provide definite answers as to the phonetic
quality of vowels
The science of phonemics developed out of the realizashy
tion that some phoneti6 features of a language differentiate
one word from another while others do not Edward Sapir
(1921) argues
5
Back of the purely objective system of sounds that is peculiar to a language and which can be arrived at only by a painstaking phonetic analysis there is -a more restricted inner or ideal system which perhaps equally unconscious as a system to the naive speaker can far more readily than the other be brought to his consciousness as a finished pattern a psychological mechanism The inner sound system overlaid though it may be by the mechanical or the irrelevant is a real important principle in the life of a language
Once it was accepted that language had a definite phonologshy
ical structure a method was devised to describe this undershy
lying system This method became the science of phonemics
The phonemic structure of a language represents the minimal
number of sound signals which make transmission of informashy
tion possible Spectrographic analyses of t~ese minimal
sound signals provide objective and empirical measurements
of the quality of these minimal sound features
Statement of the Problem
This investigation will determine the range of free
variation of Bahasa Indonesian vowel phonemes in a given
phonemic environment and types of conditioned variation
from one environment to another The nature and ra~ge of
the vowel quality for each phoneme will be determined by
spectrographic measurements
Delimitations of the Study
This study will only deal with Bahasa Indonesian
vowels sounds produced with vibration of the vocal cords
6
by unobstructed passage of air through the oral cavity
and not constricted enough to cause audible friction
Pei 1966) They will be the vowels found in monoshy
syllabic Indonesian wo~ds under primary stress and in a
consonant~vowel-cDnsonant pattern Each word will also
be part of a minimal pair ie every word must be conshy
trasted with another word in which only the medial vowel
is different andto which a different semantic meaning is
attached
CHAPTER II
THEORETICAL BACKGROUND
PhoneticsPhonemics
Phonetics is the branch of linguistics which deals
with the actual speech sounds of a language When dealing
with the phonetic level of linguistic analysis one describes
the sounds of a language in terms of articulation or acoustic
features In articulatory phonetics one describes sounds
in middotterms 9f manner of articulation ie whether it is a
stop fricat~ve etc point of articulation ie) bilabial
(be~ween the lips) dental etc or vowel quality ie
high-front-close (the highest part of the tongue-is very
high in the front of the mouth for producing this particular
sound) etc In acoustic phonetics sounds are described in
terms of the distributions of frequencies characteristic of
the sounds of a language The relationship generally acshy
cepted as existing between artic~latory and ~coustic phonetshy
ics is that certain articulations produce certain distinctive
patterns of frequency distributions It must be emphasized
at this point that both of the aforementioned types of deshy
scriptians deal with all human speech sounds not necessarily
those which perform a signalling function in a particular I
aspect of the language
I I
f
8
Distinctlve features are used to denote signalling
functions The label distinctive feature is used in the
literature to mean two quite different things Bloomfield
describes the categorization with examples which imply
that distinctive sound feature means any feature of the vocal
sound which when changed changes the meaning of a given
word eg pill and bill sin and sing etcri (Pierce 1965)
There Bloomfi~ld labels p as a distinctive sound feature
and b as a different sound feature Later Roman Jakobson
Gunnar M Fant and Morris Halle in their Preliminaries of
sectpeech Analysis take the phonemes of a language and break
them down into their component phonetic features some of
which are distinctive eg voicing in English b vs p
while others are not eg aspiration in English p~ in pin
as opposed to p in spin Anyone language code has a
finite set of distinctive features bullbullbull (Jakobson Fant and
Halle 1961) In English the feature of voicing in the b
of bill as opposed to the absence of voicing for the p
in pill is the phonetic feature which distinguishes these
two sounds A similar presence vs absence of aspiration
does not alter the meaning of any English utterance in fact
it is difficult to make English speakers aware of the fact
that aspiration is or is not present Implicit in this
theoretical approach is the concept that the variation in
human speech for the most part re~resents presence vs
9
1
absence of non-distinctive features of sound
One theoretical approach to linguistic structures
views the phoneme as concurrent bundles of distinctive
features (Jakobson Fant and Halle 1961) Each language
has a finite set of rules for grouping them (distinctive
features) into phQnemes (Jakobson Fant and Halle 1961)
Every phoneme in the language then is composed of a unique
set of distinctive features such that it is different from
any other phoneme by at least one of such distinctive feashy
tures This manner of linguistic signalling has important
implicat~ons toward phonemic analysis of sound systems As
previously mentioned a phoneme is a bundle of distinctive
features which when altered changes meaning In order
to verify whether a sound is a phoneme or not one must
show a word in which the replacement of at least one disti~c-
tive feature makes another word ie a minimal pair difshy
ferentiated by only a single distinctive feature and having
two distinct grammatical or semantical meanings
Phonemics the study of phonem~s is the level of lingushy
istic analysis which answers the question of how language
utilizes sound matter selecting certain of its elements and
adapting them for various ends The prima~y functions of
sound in a language is to distinguish one utterance from anshy
other in normal conversation Phonemic analysis as an opshy
eration examines a~ailable data in order to discover an unshy
derlying structure bullbullbull not an operation which forces a mass
1 0
of data into a structure (Pulgram 19~5) The nature of
each feature is of the essence Thus the composition of
each phoneme becomes of primary importance in a language
The phoneme can only be defined in reference to the larger
frame whi~h is the language of which it is a structured
feature (Pulgram 1965) It is the shortest stretch of
sound which serves a signalling function
Acoustic Theory
I Distinctive feature theory as previously describedI I seems to handle such phonemes s stops fricatives and
I nasals quite well eg the airflow out of the mouth is I
either stopped or it is allowed to escape On the other
1 hand vowels seem to be ranges of phonetic quality whichI
are extremely difficult if not impossible to distinguish
in terms of presence vs ab~~nce of distinctive features
Since this study will not be concerned with consonants but
only w~th vowels it is only necessary to discuss the acousshy
tic nature of vowel qualities from this point on
FundamentalsHarmonics
Vowel quality is determined by a combination of a fundashy
mental and its harmonics A vowel quality displayed on an
oscilloscope shows a very complex single wave form This
wave form is in reality the mathematical sum of a number
of simple wave forms or at least for theoretical purposes
1 1
can be treated as such These wave forms are generated
in the oral tract by the opening and closing of the glotshy
tis The fundamental wave is a sine wave with a frequency
equal to the number of times the glottis opens and closes
each second and an amplitude which is directly pro~ortion-
al to air pressure in the lungs Because of the nature
of sound waves a harmonic is generated at every multiple
of this fundamental eg if the fundamental is 100 cycles
per second then a harmonic is generated at 200 300
400 bullbullbull CO As soon as the complex wave leaves the vocal
chords harmoni6s are filtered out by the nature of the
tissue surrounding the oral tract as well as the cavities
in and adj o 1ning the oral tract The complex wave emerging
from the mouth is the mathematical sum of fundamental and
the harmonics which have not been filtered out by the oral
tract cf Martin Joos Acoustic Phonetics (1 948) chapshy
ters 1 and 2 for a fuller explanation of this process
Acoustics vs Articulation
In the last century far too much energy has b~en exshy
pended in attempts to relate acoustic features to specific
articulatory movements Bloch (1942) illustrates this by
stating qualities are identified by ear but in linguisshy
tic works they are traditionally defined in terms of their
assumed production by the vocal organs This type ofmiddotstudy
is misdirected because the only things that impinge on the
I I
- I
12
human ear are the harmonics which were not filtered out
The articulatory movements which cause the filtration ie
movement of the tongue from front to back creating a series
of filters each of which removes different harmonics
from the complex waves are irrelevant Pike (1943) argues
one should analyze and describe the sounds (or sound waves)
themselves rather than the movements ~roducing them
It has long been noted by acousticians that a variety
of articulatory movements remove the same harmonics and
r~sult in the production of very similar sounds Pierce
(1962) illustrates this by saying
As long as the formants are in their praper positions ie the proper frequencies are passed through the speech mechanism it does not matter whether the unwanted frequencies are filtered out by rounding the lips or moving the tongue to the back ThuQ when Holbrook and Carmody give one front-back position for the tongue for a given English vowel and IPA (International Pho~etic Alphabet) gives another it is quite probable that both are completely correct and that the formant shift is made by compensating for the lack of tongue movement in the speech of some speakers by additional lip rounding bullbullbullbull
Since the hearer of a stream of speech can hear 9nly those harmonics which emerge from the mouth as componshyents of the final complex wave the placement of the formant is of primary importance not the articulation which produced the sound
Therefore a study of the phonetic quality of vowels
demands an instrument which is capable of making an accurate
record of the presence or absence of all the harmonics
having sufficient amplitude to significantly alter the final
wave form The acoustic spectrograph is such an instrument
13
it was the first instrument to make large scale acoustic
a n a ly s e sapr act i c a I po s sibiIi t Y n ( Lad e fog ed 1 967 ) bull
Spectrograph
The acoustic spectrograph is a device ~hich records a
stream of speech 2~4 seconds or less in length This
recording is then fed into the analyzing part of the specshy
trograph where at each successive playing ne frequency
or rather one frequency band is lifted outof the total by
the variable filter (Pulgram 1965) A black ma~king is
made on a piece ofmiddot electro-sensitive paper each time there
is a harmonic present within the frequency band being anashy
lyzed Since the articulators are constantly moving and
changing the filtration characteristics of thevocal tract
the black markings ma~e by a stylus reflect the movements
of the articula~ors in a very broad sense More important
however it makes a precise record of the stimulus ie
the harmonics which reach the ear of the listener Dunn
(1950) says the vowels have asso~iated with them different
frequency regions in which the sound is more intense than
elsewhere in the spectrum The name formant has been apshy
plied to these regions
The next problem then is to relate the concentrations
of power mentioned above ie the formants to human pershy
ception of speech sounds The most widely utilized techshy
nique in this area is one devised by Martin Joos (1948)
~______________________________________~S___________________________________________________shy1
14
generally referred to as his 2 Formant Theory This techshy
nique represents the plotting of formant 1 and formant 2
in a specific wayan a particular chart cf Chart 1 on
p~ 23 This technique is clearly described by Ladefoged
(1967)
The relations between the formant structures of the vowels in a number of words can be conveniently represented by means of formant charts which show the frequency of the firs~ formant at a time in the word when the formant structure is changing at a minimum rate plotted against the frequency of the second formant at the same time
When making these kinds of plots a charting is derived of
vowels for any language which is remarkably like the tradishy
tional impressionistic vowel charts of the 19th century
Esner (1947) illustrated that if the frequency of the first
formant was plotted against the frequency of the second
formant it seemed to equal the relation between formant
frequency and the traditional vowel diagram
Basically this study will reproduce such vowel charts
for a number of examples of each sound in Bahasa Indonesia
Formant 1 will be platted against formant 2 for each vowel
phoneme in a variety of phonemic environments -The purpose
of this will be to determine the range of variation for
every vowel in each e~vironment as produced by a single native
speaker
CHAPTER III
METHODOLOGY
Phoneme Identification
In order to assess the phonetic quality of vowel phoshy
nemes one must first ascertain the number and relationshy
ship of sound contrasts in a language ie the phonemes
The visual representation of the actualization of the phoshy
neme ie the spectrogram can only be made on the basis
of a preceding decision of the linguist on the types and
number of phonemes in the l~nguage to be anaiyzed (Pulgram
1965)~ Phonemic analysis cannot be made with phonetic
data alone it must be made with phonetic data plus a sershy
ies of phonemic premises and procedures (Pike 1947) A
spectrogram conveys phonetic information which aids the
linguist in determining which phonetic features are consisshy
tently present in order to reach the most accurate phonetic
description
There are a variety of premises and procedures which
the investigator may utilize in order to discover the phoshy
nemic structure of a language Pike (1947) argues that the
investigator must have at hand observable native reaction
to native sounds andor know structural facts pertaining to
the phonetic nature of the sounds and their distribution
As stated before a phoneme is a bundle of sound f~atures
1
j
16
which when substituted for another bundle creates a difshy
ference in meaning Since the creation of a different morshy
pheme is the result of the substitution of a different sound
feature these sound features are said to be phonemes
A pair of words in which the first word is the same as the second except for the fact that one segment is replaced by a different but phonetic~lly similar segment in the second word constitutes proof that the two similar segments are phonemically distinct~ bullbullbull Word pairs of this type are said to be MINIMALshyLY DIFFERENJ because no smaller difference in the language can make a differ~nce in meahing in words (Pike 1947)
Hence minimal pairs of words were used to find phonemes
Minimal~y different word pairs prove to be the beginners
single most important tool for the analysis of phonemic difshy
ferences (Pike 1947)
Thus Echols and Shadilys An Indonesian-English Dicshy
tionarv (1968) was ut~lized to find three-phoneme words
containing two consonant sounds with a vowel in medial poshy
sition The process was simply to go through all the words
beginning with consonants and find minimally different t~ree
phoneme words This was done on a purely anthr~poscopic
basis on the part of the investigator If a different letshy
ter was employed to distinguish a different meaning it was
assumed to be a different phoneme The following ~ord pairs
and their meanings are examples of the words found in the
dictionary
ban--tire bin--son of
das-- a shot dos--small box carton
I
1 7
pal--pole pel--field
rang--rank position ring--ring
teh--tea toh--yet nevertheless
After having obtained the words from the dictionary
a native informant was called upon to verify ~he differshy
ance in meaning in the minimal pairs and to pronounce
them so that ~hey could be phonetically transcribed in
al1 impressionistic manner The informant employed was Kok
Djen Su a student at Portland State University from Yogshy
jakartai Indonesia He has been a student in the United
States for approximately two years and speaks broken al shy
though very understandable English Mr Su was horn to Mr
and Mrs Su Hendry Su who both speak Bahasa Indonesia Jashy
vanese and a small amount of Chinese Since his birth the
informant was exposed to a mixture of Javanese and Bahasa
Indonesia but has employed the national language of Indoshy
nesia since the age of three at school His bilingual upshy
bringing it seems to the author does not craate a subshy
stantial difference in the competence of Mr Su in Bahasa
Indonesia In fact he was able to distinguish the proshy
nunciation Qf words in both Javanese and in Bahasa Indoshy
nesia The utilization of one informant deletes any reshy
gional variation or individual variation between informshy
ants Since here we are attempting to ascertain the relashy
tive range of phonetic quality of vowel phonemes in Bahashy
sa Indonesia the informants bilingualism ahould cause
none or very few phonetic distortions
After-having verified the difference in meaning of
the word pairs Kok Djen ~u pronounced the word The
following impressionistic version of the Ihdonesian voshy
wel system was described
front central back
high
mid 1 I
I I low j
i I I
I
u-
E 0
A
1 Spectrograms
The phonemic entities symbolized in the preceding
section represent range-units of phonetic quality The
symbols and their position on the chart are based on the
aural perceptions of the investigator The purpose of the
spectrographic analysis of this data is to determine as
accurately as possible the actual phonetic range represenshy
ted by each of thephonemic symbols
I
i
1 9
In order to make spectrograms from which meani~gful
conclusions can be drawn one must have a native informant
of the language to be studied Spectrograms were made of
the speech of Mr Su the informant described earlier
In order to conserve the time of the informant a
sample of three-phoneme words were recorded The three-
phoneme words begin and end with consonants ahd contain a
vowel in medial position The list appears in Appendix A
The list of words was specifically selec~ed to eliminate
in so far as possible all variatiqn other than that which
is specifically caused by the preceding and following consoshy
nants This is true because by utilizing a single informant
the influence of dialects both regional and social are eshy
liminated and by utilizing one sy~lable words under primary
1stress sequential influences such as the Markov Process
are eliminated since there is no sequence beyond one phoshy
neme preceding and following the vowel This being the case
one should be able to derive from a series of spectrograms
of those vowels both the range of free variation and the
specific influence of each particular consonant on the voshy
weI quality of each medial phoneme
The n~xt st~p in the procedure was to play the tape-
recordings into the spectrograph two or three wo~ds at a
1The Markoy Process is a mechanical way of handling enshytropy in sequential operations IQ linguistics this is stashyted in terms ofthe probability of the occurrence of a parshyticular phoneme morpheme etc in a precise sequence
20
time The machine can handle 24 seconds of speech on one
spectrogram thus two or three words could be analyzed at
the same time as one with no loss in quality or precision
Unfortunately the recordings had to be played into a
microphone which picks up some background noise but by
placing the microp~one of the spectrograph very close to
the loudspeaker of the tape recorder and turning the volume
up slightly this background was eliminated for all pracshy
tical purposes middotIt would have been better to have had a
direct connection between the recordar and the spectrograph
but unfortunately no such devce was available Background
noise shows up as very small specks scattered more or less
at random and unless the volume of such noise is exceedshy
ingly strong does not interfere with the reading of the
spectrograms
Once the machine had completed the analys~s and produced
the graphic record of the list of words a frequency measur~
ing device was produced by the machine cf example below
1 11amp II~ill c=
- n- HE to
11r -shy
bull b mmiddot 1 bull bull L
-
gIl F Jamp u
n _ If
bull III
21
This measuring device is in reality a spectrogram with horishy
zontal markings The first line on the chart represents a
frequency of 0 hertz (hz) Each line above the first repshy
resents a multiple of 500 hz The device is used to locate
th~ center of formants 1 and 2 Since it is graduated in
500 hz it is necessary to interpolate when the center ofmiddot
power for a particular formant falls between two of these
lines This is done by dividing the area between the two
lines in half then dividing one of the halves in half which
gives a range of 125 hz within which the measurement falls
and an estimate is made of the precise measurement within
the 125 hz range This should give formant positions with
an accuraci of greater than plusmn25 hz
When visual location of the formant centers becprnes
difficult a section of the formant can be made cf exshy
ample below Such difficulties with visual location usually
arise when two weak formants overlap Such overlapping
produc~s what appears to the naked eye to be a band of modeshy
rately dark grey bands The sectioner is a built in mech-
IshyfL__---
tete we tt
~
I
1 I
22
anism capable of handling such problems In the preceding
I example the amplitude of each harmonic is proportional
to the length of the line representing that harmonic I
This makes it possible to locate formant centers when vi-
I sual location is difficult
The measurements were then transferred to formant
charts cf Chart 1 on the following page
6
23
CHART I
~
t
1+
t5
1amp
Ie
z~ 2t 2p 16 12 la 8 Iii
I ~
~
I S
l I
I I
~
V V
V T
l( FORMANT V CHART
Vi ~ CcdiOrate4 ift luutdnM I V ~ cycle ~ concf
V 10 eeentl~rsI~ V
V U 5millimctcrs - I $milton
2 zk2 lis ty
I
FOlWAlfT CHART
Placing a single point on this cha-t is an assertion that formants have been observed at two frequencies one fOrrUlt at the frequency named along the right or left edge the other formant atmiddotthe frequency named along the top or bottom edge
ex Martin Joos~ Acoustic Phonetics (1948)
CHAPTER IV
FINDINGS
The data provided by the preceding methodology conshy
sisted of a series of scatter patterns on the vowel charts
Each of the dots within the pattern represented one occurshy
rence of a particular vowel To determine the range ofmiddot each
phoneme f the most divergent points in each pattern were con-
nected by a line These lines then circumscribe an area
which included the range of all the vowels in the sample
recognized ~y the informantmiddotas a particular phoneme
Verbal descriptions the actual charts of the phonemes
and the spectrograms utilized willbe found on the followshy
ing pages
25
The distribution for the sounds which the informant
produced and recognized as the phoneme 1 range~ on the
vowel chart in a broad scattering from 300-500 hz for forshy
mant 1 and 1500-2100 hz for formant 2
CHART II
1
lid
13
bull
~
It
iA
Ml
ztr Zit zp 1 S lIZ middot1 I a r 8 6
I
f
I I
Ii 3
[7l I I V 1 I
) ~I I i I bull
V I I i bull r J
I V t I I I I I
i tt I
Kl7 I I I iI ~
I I I I I I I I I i I
I I I i I f I ltII
I I l7 I VI
I [7 1
1 I I I Va FORMANTc7 CHART
I
I I I I 173 CaEiIw-atd icw~[7 rf ltfer C0ItdI I I
j I I I i 7 10 e centlCMta1 oct4v
I V 5miU~ bull itonI
r I f 711 t14 j I I I Ik IV
FoiUlAhT CHRT
Placing asinge point on this chart is an assertion that fortcants have been observed at two frequencies one formant at tn(l frequerlcy nameu Slong the right or eft cdampe the other formant at the frequency named along the top or bottom edge
26
l 1I I - -~
I I iI I
I
[bIs] [bIn]
lt-- -_- -1I
lt i
1 ~ i1_ -shy Ir ~ tmiddotmiddot lt
-- - - ---~--- - - - ----- --
-i -_~ ~ shyI 1
i I I
I I bullbullq_-
I ~~~-~--shyr ~~~~~ -~- I------------------------shy
-----I
[dIm] [sIh]
27
I -[blr]
i1 1 I I
i Ii I
I i I I
ii ___ -J
rmiddot I i
I 1 j
-~ ~~~ ~-~IIlIr~~~
I
1 ____~~l_~~--=~ _ ~--~~~~~~~~~- -
51 hI$ PiiB PD~ii~i
-~ - -- -- ----- ~------- - --- _-- - _ - shy [rIll) [klr]
28
1 I I I
---~S~ -~~~fi~ ~~~~~-~
~l_ middot~ ___
[klk]
I I I
r [dlk]
29
-------- --
-~- shy~--I~~
[tIll]
30
The distribution for the sounds which the informant
produced and recognized as the phoneme lEI ranged on the
vowel chart in a thin oval shaped distribution from 400-625
hz for formant 1 and from 1400-2000 hz for formant 2
CHART III
lEI
i
I
1 I
1
1middot
II~~ 5 I~ I lOa I ~--~~~I-+--+-4-+--+---+--++-+-+-+-+--r--t-t--r--t--r--1
I
I I I I
t I
4
I I 1 I ~ I I I I
I t I ~
I I ~
-r--- r--- I V~~~-r~+-+-~~~+-+-~~~~~~~--T-~-r~-r~-r~-T---T--r~
V~~~++4-~~~-4-+-+~~~~~+-~-T-rV~7
~iA~~~~~I+-~~~~~I--~~~-r~~~~~8 FORMANT HHHH~~r+~~-r~+-~+-~I~-I~~rl7V CHART
I II 11I I V9 CaZiLrww 1ft huncirccLJ
-+-f-+-II-f-+-+-+-+--+-+--+--+----+-+--+-1--t-+-1---t---t--7 rtf eye 04 ~ I 11 V pq-+-+-I~-+--i--+I-t-t--+~i-I---t--+--tr -t--t-Tj-ri~middotltJ ecentimeters 1octGy
I V 5miU~ - aemiton ~~~~I~~+-~~l~-~-T~I~~~r~
t i lt~ I I IS I I liV
FolUlAn C1LBT
Placing a single point on this chart is an assertion T hat rormants have been observed at two frequencies one formant at the frequency namfu along the right or left edge the other formant at the frequency named along the top or bottom edge
31
I I
I ~_ f __
~~~ - - ---~ _-shy
I -- shyI - _v-- _ l
i _~~E~~~~middotmiddotmiddot ~---~--~~-it--_ ~_~ 1gt_ bullbull bull -_gt-~~~ ~ bullI
P~J r_i~=~~~ ~-~~~- - -1 I -----~ -~-~ _ ---_
~~Wa~~Ji~~L ____ __ _____ _
[PEs]
I __ shy
-- --shy
~~ ~ -Qt-shy
-~=-=----
~~~7=~~ L___ __ __ ____ _ ______~
[rFm]
32
[PEt]
bull - -IIot-__
- ---~~--
[dEk]
---
33
f ~
I
) I I
I
I I
I 1 I
I I
I
1
__ -~_~i~~-yen-=-- ~~-~= --
------------------------
[dEn] [sEn]
i
~ ----shybull __ ~
[cEr)]
34
1J i i
~
--~~ ~-
~~
-~- ~ -~ ~~ ~gt-- ~- ~~
I ~IJItt- F ~ 111 i~-~_~--- ~--- - _ =-- 4e -~~~-~_-_~-- _~
bull vf middotmiddot~~tmiddotmiddotl____________________~____ j
[sEp] [bEk]
[bEl]
~ shy~~--_o-
J -~~~
~~t~-~~J~ r~~7~ _
I middot---=i---=-~_4~ __ ~~~~~___I _ _~
~g_i$fj bull - ~-~~~z~ir~~ ~~~ leal -~I_ iiIB
L_________ __~________ _____~
[lEs]
I f
I
35
- --- ---- - ---- ----------
~-------- shy
bull
j
i
[tEll][dan]
[dEp]
36
The distribution for the sounds which the informant
produced and recognized as the phoneme A range~ on the
vowel chart from 600-750 hz for formant 1 and from 1600-2300
hz for formant 2
CHART IV
A
i6
i I I
I I
I I
I I
1 0
I
I I I
I I
I I
s
It
i j I Ii i I
I I
6
~ I 1 I I I I ~
I I I V~ FORMANT ~~~~~I~1~4-+-~~~--~1-+~~I~-~-r17 CHART
~~~~~~l~~~~I~i~~~~I~+I~~lr_I~I~~~$ ~U~~~h~~ ~ I I I I I ~ 7 J eye ptI -cony
1f4-i--~--+---I----t--I-4--~1--+---+--+---+---1-~i7-to e cVltJte1 oct4v
i I I I 1 5miU~ - bull iton ~~~~~~~~~middot~~~~4-~I~I--~+~middoti i
2~ I I
F01UlANT CiLlT
Placing a single point on this chart is an assertion tnlt rorreints have bE-en obsered at two frequencies one formant at the frlquerJcy nSleU aiong he right 01 eft edge the other formant nt the frequency named along the top or bottom edge
37
I I i
-shy
I
I
I
~1iI
p~~~~==~~~~i~~~~
I I
[lAs]
_7 -~
-- -shy
L _ _ _ ____________ --- -- ----_~____J
[nAn]
--------
38
I I
------------------~----I I 11 I I
II1
flt~
I
IJ
L
i
______________________
[sAk]
f
~~ ~--r
1 shy
~~-
-- shy[sAn]
I r 1I I I
t
t
I l I
I I I
I i
I
[sAt)] [sAp]
39
~]
I
I I
[rArl][bAk]
I
-shy ---==-_____lshy___
[lAp ]
40
~----------------------------~-------------~
1 bull -l----1-shy
~middot-~-~t-=-- -
~r-shy -shy t~ III M -~ ~~---shy~t-= ~r=_ _shy
C z---=-
L______________________----- [dAs]
[dAr]
l _
41
v 1
I I
i
I
I -tc - bull ~ 1t iCSi4 _ -
-~~-r~middot- 1 ____ ~~~~ ~ ~ I
1 I ~=~j3~middot7-__ ~~
[kArl
---------------------~------
[dAin]l
I I
-I
I
42
I gt1 tmiddot
I
[bAm]
bull
~ I 1 I
gt1
-- - ___ _ N ____ ~--shy---- shy
[bAn]
43
[lAh]
==III
I Imiddot
__~_--_middotfI_~__ ~ ennee ~ S
LL-
[JAk]
--------- ---------
44
---------
I i Ir I
I I j
i
I i
~ --_ -- ~
~~fb-~~~~~~ ----- shycshy7FiIf Elii=s FUP WRmiddot 75t3~ n JIilIeia
~------------
[JAs]
-II
I J
[dAnl
45
~ I 1shy
I
iI shyi t
- - - Imiddot--- ~p -~--~= roc - I
I II i
I I I
~ middot1 I
------J
j I
I I i
i I
1_____ --- I ---------------~
[kAs]
I
I I
I t
I I i
j poundiampl d
rshyl
I i
I
1
I I I
I Il
[bAl]
I~
[bAl)]
I
47
L---------------------- --------------~
[kAp] shy
t
I-- I ~ I i
I
ji I
I -I
I 1 I 1
i
)
~~
~L~--~~---~ - ~ ~
~ -shyY- r i
I
-
1
I I
)
----~ -shy- -- _ ~ ----shy
1 I i i I I
1 I
L ~~~~-~~-~-~~~-~~-gt-= rn~ J ___fi ~ 7 7TZ r~ 5UZs=j -~ l ____-------- _____ __ _ ___________ ________ I
[kAk]
i
I t r ~
--~~ -shy
~~~c~_=--_u ce4 we
I r bull
[gAr)]
~-~ shy
- -~ -~~
~P ~-~~
I ~~
-- bull ~ I - ~~-~~
~-~~~--~ shymiddotT _i
48
-----------------------------l
I I
I I
[rAk]
~_
~ ~--- ~~~-~
j ~~ ~ ~ ~7
~ bull~~middote ri~-is~~~l-IIII-middotlIIIIn---I~-- 41~~~~~ ~
1--=-_---- - - -===--------shy
[sAil]
I
49
_- I I
I -- ----------------shy
~2~~~ ~~
i i I I ~~~~~~~~b ~-
middot_- _ ~~------
j
i ~ at -== l - -- ~-~~it I ax I C1 bullbull~~- shy
I
I i
I I
I 1 I II r I I
-r- --shy
~~-~-~- -~-
-1 l I
I I
[bAs] [PAs]
r-------------------~------------___
[pAl]
I
50
The distribution for the sounds which the informant
produced and recognized as the phoneme 0 ranged on the
vowel ~ha~t from 400-525 hz for formant 1 and from 700~1000
hz for formant 2
CHART V
0
III
t5
lot
S
6
Ie
to
Z7 Zit 9 I 1 I a I z I a 6 6
I
I ~ I
I i II I
j i bull I I
I I I i I
I ~ t
~ ~I I
f I
I ~ f A I I I
j [- V I 1 I I I II ~ I 1 I I
At I
I t I I
V V
V 7
i I Vi( FORMANT I 1 I 1 CHARTI I
I V 3 C41iotc4 ill lUjn~ 01 eycpr ~0It4
i I f I IV
I ) I V IO 6 centltcrs 1 octcv1 I I I 5miU~ -Istmi-toneI
I I VII 2 I ltQshy t 116 IV
FOlUlUfT CRBT
Placing a single point Oll this chart is ampn assertion that formants have been observed at two frequencies (me iormant at the frequency nametl ~ong the right or left edge the other tonnant at the frequency named along the top or bottom edge
Ishy
51
r--- -_-__ - --------shy
-- ~--- --shy~ -
--f -~-
[tOll][pOn]
~ ---- -11lt1 ~
~-- - -~ P---~Amiddot_
t _ __ _
1 r I
--1 i I
I
I ~~~J L____ _ 1 rshy
[dOs] [b0s]
i Imiddot
52
---------------------~---
i I r -------- --------shy
r~~middot-~ [
I V I ~~
I - shy
~~~middottdmiddot~~-~-middot~-
S~~i~~-~ ~- bmiddotmiddotmiddotL _____middot_ ~_
[bOr] [rOk]
I
1 I
i i
j
I
[dOpJ[pOl]
53
Ii --~ --~--- -~~~~--=- I r
~ ~- ~ - ~ - shyI - -~ ~~ -~~ I
-1bullbull - h ~~~
~~~ ~ ~~~~----- ~~-~~~-~- ~--~~~~L- ~bullbull
I middot~-~middotdf r scr ~~~~~
~-laquo~~-==~~~-~~--~~~~ ~~
I
[lOs]
I
I
r I
i 1
i 1
I I J_____~ __ _-_M___J
[bOn]
54
i -~----
I I I r r
~-~ -shy
[bOn][sOp]
jI ----II I J
i
I I I
I I I i
I~~~==it shy
[jOk][tQr)]
55
1 I
I
II I I I
I c ~~~~~~~~ ~~OOWJI~~=U
[lOh]
i I
I
I ~~~-
I ~- -- shyl - _- ~ shy
I ~n=~~-~middot ~FlR T =Iti 1amp11 dill_
__-J
[pOt]
__J pOs]
1
- =xu
[bOk]
I
56
The distribution for the sounds which the informant
produced and recognized as the phoneme lUI range~ on the
vowel
hz for foimant
chart in an
1
almost square-like pattern from
and from 700-1000 hz for formant
250-350
2
CHART VI
lui fIG
3
t
ts
~
la
Il
IT zt 20 IS
I I
I I
i j
I
I j
I I
I
I I I
I t I I I1
I J I I I
~ i I LJ J I~
I
I
I
la -I
10
I
I I I 1
t I I i
I
I
I I
I
I I I
I ~ 1 v I)
V V
qV
FOlUfANT atRT lt
8 6
I t lt
~
I
l --~ I--- ~I I
i
I I
I I I i ltiI I
I i ~
I t
V
V V l( FORMANT I V CHART V
V Caiote4 iramp 1umb_ ef cycipampf on4
6 CelItlmctcrs bull octclv SmiUitoctamprs -I a~i-tonl
PlaciDg a single point on this chart is an assertion that formants have been observed at two frequencies one formant at the frequency named along ~he right or eft ede the other fonnant at the frequency named along the top or bottom edge
I
57
I
I
I -I
I
j _-
~~ -
-
bull I -
[dUp]
t I ~
~
I middot1
f
IshyIj II
I i
-------=shyI ~~-- -
L ~~-=-r--~~-III--=---
58
i middot1 I
I
i j I Imiddot
I~1 middotU~ _ s
I ~~~~~_-_-~--~ --_ I
L~ __________~_____________~ [CUll]
I
I
[dUr]
I
I J
I
I I
II
1
-yen ~ L___________ ~__ ~=~
I [kUs][pUn]
59
I
I
i L ~ -----------~-
____---shy______---2
~~~ -~ _
j ~---
I~~~-~-~ ~~ ~~
[nUn] [lUp]
I 1
~-=-~ ~~ -
[rlhn]
I
60
l
- _ ~~-----
~~~~~ JlCIIPrl fue rm ad I II
L ~ [gUI)] [kUk]
e_
__ ~ e-
~-d~~~~
[lUs] [jUs]
61
shy
I
Iii lEI and A Compa~ed
In comparing the distributions of the vowels III lEI
and IA( cf Chart VII on p 62 it is evident from the plots
that the front-back tongue position is for all practical
purposes identical ie the core distribution for all
three phonemes ranges between 1600-2000 hz This demonshy
strates conclusively that the significant phonetic differshy
ence is tongue h~igth ie t~e position of formant 1
The fact of phonemi~overlap is illustrated by the
crosshatching on Chart VII The cross-hatched area represhy
sents a r~nge of phonetic quality that is identified in one
instance as an III and in another instance as an IE or in
one instance as an lEI and in another instance as an IA
bullbullbull the sounds which follow one another in a changing sequence constitute the signals of speech and these sounds are produced by movements of the vocal apparashytus i e by movements of the lips tongue throat lungs and so on It is therefore important to understand that these vocal movements caused by the various muscles involved tend to slur into one anothshyer Since each variation of movement gives a varishyation in sound the slurring of movements produces a slurring of sounds Furthermore since specific sound will have different slurs of moveme~t depend~ ing upon the movement which it precedes or folloItJs each sound type resul tant from the productive moveshyments will vary somewhat according to the sounds which it precedes or follows (Pike 1947)
In line with this the next logical step would be to
look for environmental influences which would enable a listshy
ener to determine which phoneme was represented when phones
were recorded in the overlap area
62
CHART VII
lIlt lEI and A Compared
~ 2[7
t5
lot
5
ft
fA
Ie
Zit I zp 16 I a la 8 6
t I
~
II V I I I I +
r l~ ~ ~ I
I I ~ ~ V I I 1shy fZ I I t s
) I I j I I I
i ~ I 1 1 I I _lgt
V ~R R-r--~ I V
ItV l(
I I---I-
V~ j shy ~
I I I I FORMANTI I
I I VV CHARTI II I V S CaliL-tcd I Uut
I I I l of fIelc F- 0114
I I I I I j i I 10 ecentImeters 1oct4v
I
I ~ V Smillimctus Iumrton_ j VII
2f1 2~ 16 ltv
FOlUlANT ClIABl
Placing single point on this chart is an assertion that io-rnants have been observed at wo frequencies one formant at the frequency named ~ong the right or left edge the other formant at the frequency named along the top or bottom edge
63
A fairly thorough study of the positions of various
vowel sounds in specific environments did not indicate any
consistent variations of a particular type For example
the vowel in dim is in the lower range for the vowelIII
but the EI in dem is in the upper range -of the vowel lEI
Thus it seems probable that those sounds in the overlap area
are qualities for which minimal contrasts do not exist For
example the II in sih is in the overlap area but appar-middot
ently is clearly recognizable by a native sp~aker because
there is no seh at least no such word was known to the
informaht nor could one be found in the dictionary (Echols
and Shadily 1968)
IU and 0 Compared
In contrast with the front vowels III IE and IAI
the back vowels Iu and 0 have aconsiderable gap plusmn50
hz between the1r two distributions cf Chart VIII on
p 64 The distributions appear directly above one another
on the chart In comparing the two ranges it is appa~ent
that the front-ba~k position formant 1 is identical ie
the core distribution for the phoneme ranges from 700-1000
hz This demonstrates that ~he position of formant 1 ie
tongue height is the significant phonetic difference
64
CHART VI I I
U and 0 Compared
I I
i
5
~
5
6
til
~
2[1
I
Zit zp 15 IZ la a 6
~ I -~
1 ~ ~ ~
~
I V 1
V
I V ~
JIll ~
I I 1 6
1 middotV V l(
vI( FORMANT CHART
9 CalLOt-ctc4 ift 1awuutb of cyc14 p ICCOftI
I~ I V 6 eentllMtcrs 1 octo
I V 5mmi~ - ampImitenI VII
214 I 210 16 IV FOlUfANT CE1ART
PJaciDc a single point on this chart is an assertion that formants have been observed at two frequencies one form3nt at the frequency named along the right or left edge the other formant at the frequency named along the top or bottom edge
middotr I
65
II lEI IAI lUI and 101 Compared
In comparing all three phonemes in their respective
poJition on the vowel chart cf Chart IX an p 66 there I
se~ms to be no problem identifying between front and back
vowels There is a gap of approximately 400 hz between
th$ two back vowels and the three front vowels in terms of I
fotment 2 Also it would appear that there would be no
pr~blem in identifying specific vowel qualities so far as
fOfmant position is concerned for vowels in stressed position
with the exception of the phonemic overlapping discussed in
a preceding section ie III-lEI and IE-A
I
I
Imiddot I
CHART IX
I 1 E IA U and 0 Compared I
iM zr Ztt ap J 6 I Z 10 S 6
I I f ts I
~
tj1- ~
rL ~ ~
J 4- 1 ~ ~ i~ ~ V
Ii ~W~ V I ~~ ~ J
V I ~ ~
IS I ~ V 5 1 t
~
s ~ I I f
V R ~ r-~ I V
if~ V ~ ~
-- V 7
~ -~ [a ti I l( FORMANT
V CHART
V 0 cyclu on4 S CaULntte4 ilt hWldr_
I
Kl I jmiddotV I j V 10 6 centlrMtcll1 oct4v
V 5llIil(lCtampn ~ hl4Imiton
Vii 2~ zkgt 116 I IIyen
I
Forw~ CllABT I
Placing a single point on this chart is an assertion that formants have been observed I at two frequencies one formant at the frequency named along the rignt or left edgeI
the other formant at the frequency named along the top or bottom edge
~ ~ bull -
66
I
I I j
Cbull
I I
i
CHAPTER V I SUMMARY AND CONCLUSIONI
I As is shown on Chart IX on p 66 there appears to I I
bela very discernable distribution for each of the vowel I
Phtnemes of Bahasa Indonesia This does not mean that the
ci cumscriptions of each of the various sounds indicate I
detinite border lines for each vowel Rather it shows i
th~ position o~ each vowel in relation to the other vowel
phbnemes The vowel charts show the position of the phonemes
i asl produceq by one native speaker of the language Thus
nJ conclusions can and should ~e made regarding the definite
oJter boundaries of the ranges of middotp~onemes As is implied I
b~ the term ranges the phonemes have no defined boundarshy
I i~s
i Bahasa Indonesia does not appear to have two front I
v~wels two back vowels and one central vowel as is implied
i+I
the traditional symbolization Rather it has three i
ftont vowels with a three-way contrast between high mid I
i a~d low and a two-way contrast of high vs mid in the back
a1ea of~he articulation chart If a traditional symbolshy
i~ation of the vowel phonemes of the language were now to
b~ dawn it would look like the following chart I I I
68
front central back
high
mid
low
I
U
E 0
A
Thus as has been demonstrated the impressionistic
sion of the vowel system was in error with regards to
central phoneme of the language investigated There
a ears to be no low-central phoneme in the language
r it is a low-front one Although the spectrograph
c nnot establish a phonemic system of a language on its
o n it can provide a yes or no answer about the phoneshy
t c qualities of the phonemes in question After a phoneshy
m c system has been established the spectrograph can proshy
v de phonetic data which distinguishes one phoneme from
a other
BIBLIOGRAPHY
Sources Cited
Almiddotsjahbana Takdir The Indonesian Language - By-product of Nationalism Pacific Affairs XXII (1949)388-92
Am rican University Area Handbook for Indonesia Washingshyton DC ~S Government Printing Office 1970
Blch B and G Trager Outline of Linguistic Analysis Baltimore Waverly Press 1942
Du n H K Calculation of vowel resonances Journal of the Acoustic Society of America XXII (1950) 740-53
ols John M and Hassan Shadily An Indonesian-Enqlish Dictionary Ithaca Cornell University Press 1963
ner C Reserches sur la structure des voyelles orashyles Archives Neerlander Phonetic Experiments XX (1947) 40-77
obson Roman C Gunnar Fant and Morris Halle Prelimshyinaries of Speech Analysis Cambridge MIT Press shy1961
J s Martin Acoustic Phonetics Baltimore Linguistic Society of America 1948
L defoged Peter Three Areas of Experimental Phonetics London Oxford University Press 1967
P Mario Glossary of Linguistic Terminology New York Columbia University Press 1966
Perce Joe E The Spectrographic Study ~f Vocalic Nuclei Language Learning XII (1963) 241-247
- --- Phonemic Theory and the Analysis of English Syllashybic Nuclei Linguistics XVII (1965) 36-57
P ke Kenneth L Phonemics Ann Arbor University of Michigan Press 1947
70
Pi e t Kenneth L Phonetics Ann Arbor University of Michigan Press t 1943
Pu gram Ernst Introduction to the Spectrography of Speech New York Dover Publications 1966
ir Edward Language An Introduction to the Study of Speech New York Harcourt Brace amp Co 1921
enbeck E M Indonesia and Malaysia 1I Current Trends in Linguistics IIX (1967) 55-111
dman Dorothy The Republic of Indonesia New York N Y Philosophical LibrarYt Inc 1955
Sources Consulted
r e j e v N D bull Some ProbIem s 0 f Baha s a In don e s i a Ph a nshyology Studia Linguistica XI (~1957) 44-46
lingmiddotC L Linguistic Units The Hague~ Mouton amp Co 1960
J obson t R Hague
and M Halle Mouton amp Co
Fundamentals 1956
of Language The
K nedy Raymond Bibliography of Indonesian Peoples and Cultures New Haven Yale University Press 1962
Perce Joe E Spectrographic Study of English Vowels Under Primary Stress Linguistics LXXXIV (1-972) 41-84
P ttert Ralph K George A Kopp and Harriet C Green Visible Speech New York Dover Publications t 1966
T euw A Critical Survey of Studies on Malay and Bahasa Indonesia The Hague Martinus Nyhoff 1961
-basin
-head of an area
-form of address
-ball bag
-bell
ba --bank I
bUr --you I
bi --beer
bomiddot--drill I
ba--bliJss
bi --bus i
I t
bo I
--bunch bun~le i I
ba--crossbeam
--bomb
--tire
--son of
--ration coupon bond
--garbage dump
--checkered design
--inch
--and plus
APPENDIX A
LIST OF WORDS
den~-abbrev of the title raden
dar--olace location
dur--pearl
das--a shot
dos--small box
dek--deck
dik--younger sibling
dep--to b~ shelved
dop--hubcap
dup-~to be baptized
djak--jug
djok--seat
djas--coat
djus--part of the Koran
gang--paBsageway hall
gung--gong
kak--form of address for elder
kik--handloom
kuk--collar harness
kar--map
kir--jo test
kas ~money supply i
kus -to hiss spit I
lahi-alreadY
loh-writing tablet
lapi -towel I
lup -magnifving glass or
last -IrJeld i oint
lesl -lessonI
lOs -shed I
I I
-to iron
-which who
nu -yonder
po
pa --pole
pa --to fit
pe --plague I
po --mail I
pel --cap
pOI --pot
--pound
--also
r --shelf
--shirt
g-o-rank position
g--ring
--brake
rum--cream
sah--valid legal
sih--an enclitic usedmiddotto soften what follows
san--form of address far sargeant
sen--cent
sang--superior
seng--zinc
sap--line row
sep--chief boss
sop--soup
sjak--suspicion doubt
sjok--attractive
tang--tongs pincer~
ting--sweet meat
tong--barrel vatmiddot
teh--tea
toh--yet nevertheless
tjeng--molasses
tjung--young boy
III 1
APPENDIX E
LINGUISTIC SYMBOLIZATION USED
IAI~high-front-openIi
II
~ r
E~-mid-front-~pen
III
AA-low-front-op~n t1
o1-mid-back-open
Uf-high~baCk-close III
I III
~~~vd bilabial stop
[dj~vd alveolar stop l
I I
[kt-Vl velar stop I
[g I-vd bull velar stop
[1 -lateral I
(n-vd alveolar nasal 1
(m~-vd bilabial nasal
~I-Vd velar nasal
I
III ~IJ
I
q
dl
I
Iil~
I
Vowels
Consonants
[p]-vl bilabial stop shy
[t]-vl alveolar stop
[rJ-vd alveolar flap
[jJ-vd palatal affricate
[CJ-vl palatal affricate
[S]~vl bull alveolar affricatmiddote
[s]-vl alveolar middotfricative
h]- vI velar aspirant

2
tic spectrograph was utilized This instrument analyzes
a complex human speech wave and produces a visual image
of the frequencies in the wave which are not filtered out
by the articulators The data consisted of recordings of
eighty-eight words as produced by a native speaker Every
phoneme was contrasted with every other middotvowel phoneme in
identical environments Spectrograms were then made of
every phoneme in every environment that it occurred The
information derived from these spectrograms was then charted
These charts show the approximate range of sound quality
which native speakers recognize as a particular phoneme in
the specified environment
The results of the study show that Bahasa Indonesia
has three front vowels contrasting high mid and low tongue
positions and two back vowels contrasting high and mid
tongue positions The three front vowels have slightly overshy
lapping distributions this may partially be due to the fact
that the words in which the phonemes were found had no conshy
trasting word containing a neighboring phoneme This differs
markedly with the back vowels where the distributions are
sharply separated
The aforementioned charts of vowels have a distinct
resemblance to the traditional vowel charts Thus after
all the evidence was gathered and analyzed a traditional
vowel diagram was drawn for thes~ particular vowels of
Bahasa Indonesia
TO THE OFFICE OF GRADUATE STUDIES AND RESEARCH
The members of the Committee approve the thesis of
Ingrid T Hanna presented May 13 1974
e E Pierce Chairman
Studies
of Anthropology
May 13 1974
A SPECTROGRAPHIC ANALYSIS
OF
BAHASA INDONESIA VOWEL PHONEMES
UNDER PRIMARY STRESS IN eve WORDS
by
INGRID T HANNA
A thesis submitted in partialfulfillment of the requirements for th~ degree of
MASTER OF ARTS in
ANTHROPOLOGY
Portland State University 1974
ACKNOWLEDGEMENTS
I would like to thank the faculty members on my
thesis committee for their help and contributions
am especially grateful to Prof Joe E Pierce for his
continual advise and mor~l support
Mostly I would like to thank my husband withoutmiddot
whose understanding constant encouragement and proshy
fessional advise I could not have survived the entire
effort
I
TABLE OF CONTENTS
PAGE
ACKNOWLEDGEMENTS iii
CHAPTERi r I INTRODUCTION 1
Language Justification for Study Statement of the Problem Delimitations of the Study
II THEORETICAL BACKGROUND 7
PhoneticsPhonemics Acoustic Theory FundamentalsHarmonics Acoustics vs Articulation Spectrograph
I I I METHODOLOGY bull bull bull bull bull bull bull bull bull bull bull bull bull bull bull bull bull bull bull bull bull bull bull bull bull bull bull bull bull 1 5 I
Phoneme Identification Spectrograms
IV FINDINGS I 24
V SUMMARY AND CONCLUSIONS bullbullbullbullbullbullbullbullbullbullbullbullbullbullbullbullbullbull 67
EIBLIOGRAPHY ~ bullbull _bullbull _ __ bull __ 690 __ bull _
Sources Sources
Cited Consulted
APPENDIX A 71
List of Words
APPENDIX B bull --- bull bull - bull bull bull bull bull bull I bull bull bull Linguistic Symbolization Used
73
CHAPTER I
INTRODUCTION
Language
Bahasa Indonesia the official name applied to the
Indonesian language is a member of the Malayo-Polyrresian
language family The term Bahasa Indonesia is often used
synonymously with modern Malay or Malay dialect (Uhlenbeck
1967) References to a similar form of this Malay based
language are found as early as the 16th cent~ry by traders
such as th~ Chinese the Hindu and the Arabs (Woodman 1955)
Words were added to the language known as Melaju Pasar or
Bazaar Malay as trade with foreigners increased (Woodman
1955) These foreign elements in Melaju Pasar formed the
essential differences between it and the Malay spoken on the
Ma~ay Peninsula (Woodman 1955) Bahasa Indonesia differs
little from the standard dialect of the Malay Peninsula and
daes so mainly in its relatively large and growing vocabulashy
ry borrowed from European and indigenous languages (Amerishy
can University 1970) Bahasa Indonesia is then an adaptashy
tion of Malay inasmuch as it has been changed by the origishy
nal regional languages and modern European languages (Alisshy
jahbana 1949)
2
Today Bahasa Indonesia is the official language of the
Republic of Indonesia It has been estimated that over 200I
region~l languages are spoken in this country of wide cul-
I tural diversity (Wo~dman 1955) When Indonesia beganto
I strive for independence from Dutch colonialists a common
language seemed eSsential in an effort to unify the nationI Indonesian political leaders desirous of revitalizing r th people br9ught (to bare) the most effective means of
organizing them in the greatest numbers (Alisjahbana 1949)
Attention was focused upon the Malay language which was the
lingua Franca for most of Southeast Asia Javanese was
rejected although it possessed a thousand-year-old literary
tradition and was the language of the largest ethnic group
in the islands (American University 1970) The Javanese
language has a fairly ~igid system of vo~abulary differshy
ences based on social class Thus Malay became the basis
of the national language At the 1928 conference of the
pertemuan Muda (Meeting of Youth) Malay was chosen to be
the basis of the national language (American University
1970) By 1930 then the term Malay Language was officshy
ially changed to the Indonesian language (Uhlenbeck 1967)
It became the language for scholarly endeavors and the langshy
uage of leaders and officials During the Japanese occupashy
tion in 1942 the language made further gains In an effort
to combat Dutch cultural influence it was made the compulshy
3
sory language uied in schools from elementary and up
Bahasa Indonesia became the official national language
when the Republic of Indonesia was farmed in 1945
Justification For Study
Phonemic descriptions of Bahasa Indonesia are almost
non-existent and very limited f from a linguistic point of
view Most descriptions of the sounds of Indonesian are
of a comparative nature i e Bahasa Indonesian sounds are
likened to sounds of modern Indo-European languages Echols
and Shadilys An Indonesian-English Dictionary describes
Indonesian sounds in relation to the similar sounds in
English For instance they argue that the e in the Indoshy
nesian word sen is like the e in the English word make n
only shorter Statements such as the aforementionedmay
be practical for most purposes but are not necessarily
linguistically sound and almost certainly inaccurate
Another deficiency which seems to be present in phonshy
emic analyses not only in Indonesian is the impressionistic
nature of these analyses When dealing with a lang~ag8
the linguist must attempt to remove all linguistic biases
and comparisons because phonetic details may escape the
ear of the analyst f especially in a foreign language upon
which he is likely to impose depending upon the degree of
his skill any of the few prejudices of his native phonemic
scale (Pulgram 1965) Even when the investigator does nat
4
I
rely on comparative methods of description he cannot compshy
letely remove all the sounds in his linguistic memory when
describing a new language He will invariably hear sounds
that are very similar to those he knows and may not be able
to discern certain minor although perhaps crucial differshy
ences Phonemic descriptions are most often of this impresshy
sionistic variety
Spectrographic analyses of the sounds of a language
provide an objective measure of the quality of the sounds
of a language Spectrographs record precise sound qualities
produced by a speaker particuiarly vowels This mode of
description will delete the impressions of the investigator
and will map precise quality for sounds in question what
shows on a spectrogram is an acous~ic reality whether the
analyst hears it or not (Pulgram 1965) It is these
precise sound qualities of Bahasa Iridonesian vowel phonemes
that this investigation will attempt to ascertain Instrushy
mentaltesting of hypotheses has been a part of scientific
study for many years but very little has been done to
date in linguistics (Pierce 1963) The acoustic specshy
trograph can provide definite answers as to the phonetic
quality of vowels
The science of phonemics developed out of the realizashy
tion that some phoneti6 features of a language differentiate
one word from another while others do not Edward Sapir
(1921) argues
5
Back of the purely objective system of sounds that is peculiar to a language and which can be arrived at only by a painstaking phonetic analysis there is -a more restricted inner or ideal system which perhaps equally unconscious as a system to the naive speaker can far more readily than the other be brought to his consciousness as a finished pattern a psychological mechanism The inner sound system overlaid though it may be by the mechanical or the irrelevant is a real important principle in the life of a language
Once it was accepted that language had a definite phonologshy
ical structure a method was devised to describe this undershy
lying system This method became the science of phonemics
The phonemic structure of a language represents the minimal
number of sound signals which make transmission of informashy
tion possible Spectrographic analyses of t~ese minimal
sound signals provide objective and empirical measurements
of the quality of these minimal sound features
Statement of the Problem
This investigation will determine the range of free
variation of Bahasa Indonesian vowel phonemes in a given
phonemic environment and types of conditioned variation
from one environment to another The nature and ra~ge of
the vowel quality for each phoneme will be determined by
spectrographic measurements
Delimitations of the Study
This study will only deal with Bahasa Indonesian
vowels sounds produced with vibration of the vocal cords
6
by unobstructed passage of air through the oral cavity
and not constricted enough to cause audible friction
Pei 1966) They will be the vowels found in monoshy
syllabic Indonesian wo~ds under primary stress and in a
consonant~vowel-cDnsonant pattern Each word will also
be part of a minimal pair ie every word must be conshy
trasted with another word in which only the medial vowel
is different andto which a different semantic meaning is
attached
CHAPTER II
THEORETICAL BACKGROUND
PhoneticsPhonemics
Phonetics is the branch of linguistics which deals
with the actual speech sounds of a language When dealing
with the phonetic level of linguistic analysis one describes
the sounds of a language in terms of articulation or acoustic
features In articulatory phonetics one describes sounds
in middotterms 9f manner of articulation ie whether it is a
stop fricat~ve etc point of articulation ie) bilabial
(be~ween the lips) dental etc or vowel quality ie
high-front-close (the highest part of the tongue-is very
high in the front of the mouth for producing this particular
sound) etc In acoustic phonetics sounds are described in
terms of the distributions of frequencies characteristic of
the sounds of a language The relationship generally acshy
cepted as existing between artic~latory and ~coustic phonetshy
ics is that certain articulations produce certain distinctive
patterns of frequency distributions It must be emphasized
at this point that both of the aforementioned types of deshy
scriptians deal with all human speech sounds not necessarily
those which perform a signalling function in a particular I
aspect of the language
I I
f
8
Distinctlve features are used to denote signalling
functions The label distinctive feature is used in the
literature to mean two quite different things Bloomfield
describes the categorization with examples which imply
that distinctive sound feature means any feature of the vocal
sound which when changed changes the meaning of a given
word eg pill and bill sin and sing etcri (Pierce 1965)
There Bloomfi~ld labels p as a distinctive sound feature
and b as a different sound feature Later Roman Jakobson
Gunnar M Fant and Morris Halle in their Preliminaries of
sectpeech Analysis take the phonemes of a language and break
them down into their component phonetic features some of
which are distinctive eg voicing in English b vs p
while others are not eg aspiration in English p~ in pin
as opposed to p in spin Anyone language code has a
finite set of distinctive features bullbullbull (Jakobson Fant and
Halle 1961) In English the feature of voicing in the b
of bill as opposed to the absence of voicing for the p
in pill is the phonetic feature which distinguishes these
two sounds A similar presence vs absence of aspiration
does not alter the meaning of any English utterance in fact
it is difficult to make English speakers aware of the fact
that aspiration is or is not present Implicit in this
theoretical approach is the concept that the variation in
human speech for the most part re~resents presence vs
9
1
absence of non-distinctive features of sound
One theoretical approach to linguistic structures
views the phoneme as concurrent bundles of distinctive
features (Jakobson Fant and Halle 1961) Each language
has a finite set of rules for grouping them (distinctive
features) into phQnemes (Jakobson Fant and Halle 1961)
Every phoneme in the language then is composed of a unique
set of distinctive features such that it is different from
any other phoneme by at least one of such distinctive feashy
tures This manner of linguistic signalling has important
implicat~ons toward phonemic analysis of sound systems As
previously mentioned a phoneme is a bundle of distinctive
features which when altered changes meaning In order
to verify whether a sound is a phoneme or not one must
show a word in which the replacement of at least one disti~c-
tive feature makes another word ie a minimal pair difshy
ferentiated by only a single distinctive feature and having
two distinct grammatical or semantical meanings
Phonemics the study of phonem~s is the level of lingushy
istic analysis which answers the question of how language
utilizes sound matter selecting certain of its elements and
adapting them for various ends The prima~y functions of
sound in a language is to distinguish one utterance from anshy
other in normal conversation Phonemic analysis as an opshy
eration examines a~ailable data in order to discover an unshy
derlying structure bullbullbull not an operation which forces a mass
1 0
of data into a structure (Pulgram 19~5) The nature of
each feature is of the essence Thus the composition of
each phoneme becomes of primary importance in a language
The phoneme can only be defined in reference to the larger
frame whi~h is the language of which it is a structured
feature (Pulgram 1965) It is the shortest stretch of
sound which serves a signalling function
Acoustic Theory
I Distinctive feature theory as previously describedI I seems to handle such phonemes s stops fricatives and
I nasals quite well eg the airflow out of the mouth is I
either stopped or it is allowed to escape On the other
1 hand vowels seem to be ranges of phonetic quality whichI
are extremely difficult if not impossible to distinguish
in terms of presence vs ab~~nce of distinctive features
Since this study will not be concerned with consonants but
only w~th vowels it is only necessary to discuss the acousshy
tic nature of vowel qualities from this point on
FundamentalsHarmonics
Vowel quality is determined by a combination of a fundashy
mental and its harmonics A vowel quality displayed on an
oscilloscope shows a very complex single wave form This
wave form is in reality the mathematical sum of a number
of simple wave forms or at least for theoretical purposes
1 1
can be treated as such These wave forms are generated
in the oral tract by the opening and closing of the glotshy
tis The fundamental wave is a sine wave with a frequency
equal to the number of times the glottis opens and closes
each second and an amplitude which is directly pro~ortion-
al to air pressure in the lungs Because of the nature
of sound waves a harmonic is generated at every multiple
of this fundamental eg if the fundamental is 100 cycles
per second then a harmonic is generated at 200 300
400 bullbullbull CO As soon as the complex wave leaves the vocal
chords harmoni6s are filtered out by the nature of the
tissue surrounding the oral tract as well as the cavities
in and adj o 1ning the oral tract The complex wave emerging
from the mouth is the mathematical sum of fundamental and
the harmonics which have not been filtered out by the oral
tract cf Martin Joos Acoustic Phonetics (1 948) chapshy
ters 1 and 2 for a fuller explanation of this process
Acoustics vs Articulation
In the last century far too much energy has b~en exshy
pended in attempts to relate acoustic features to specific
articulatory movements Bloch (1942) illustrates this by
stating qualities are identified by ear but in linguisshy
tic works they are traditionally defined in terms of their
assumed production by the vocal organs This type ofmiddotstudy
is misdirected because the only things that impinge on the
I I
- I
12
human ear are the harmonics which were not filtered out
The articulatory movements which cause the filtration ie
movement of the tongue from front to back creating a series
of filters each of which removes different harmonics
from the complex waves are irrelevant Pike (1943) argues
one should analyze and describe the sounds (or sound waves)
themselves rather than the movements ~roducing them
It has long been noted by acousticians that a variety
of articulatory movements remove the same harmonics and
r~sult in the production of very similar sounds Pierce
(1962) illustrates this by saying
As long as the formants are in their praper positions ie the proper frequencies are passed through the speech mechanism it does not matter whether the unwanted frequencies are filtered out by rounding the lips or moving the tongue to the back ThuQ when Holbrook and Carmody give one front-back position for the tongue for a given English vowel and IPA (International Pho~etic Alphabet) gives another it is quite probable that both are completely correct and that the formant shift is made by compensating for the lack of tongue movement in the speech of some speakers by additional lip rounding bullbullbullbull
Since the hearer of a stream of speech can hear 9nly those harmonics which emerge from the mouth as componshyents of the final complex wave the placement of the formant is of primary importance not the articulation which produced the sound
Therefore a study of the phonetic quality of vowels
demands an instrument which is capable of making an accurate
record of the presence or absence of all the harmonics
having sufficient amplitude to significantly alter the final
wave form The acoustic spectrograph is such an instrument
13
it was the first instrument to make large scale acoustic
a n a ly s e sapr act i c a I po s sibiIi t Y n ( Lad e fog ed 1 967 ) bull
Spectrograph
The acoustic spectrograph is a device ~hich records a
stream of speech 2~4 seconds or less in length This
recording is then fed into the analyzing part of the specshy
trograph where at each successive playing ne frequency
or rather one frequency band is lifted outof the total by
the variable filter (Pulgram 1965) A black ma~king is
made on a piece ofmiddot electro-sensitive paper each time there
is a harmonic present within the frequency band being anashy
lyzed Since the articulators are constantly moving and
changing the filtration characteristics of thevocal tract
the black markings ma~e by a stylus reflect the movements
of the articula~ors in a very broad sense More important
however it makes a precise record of the stimulus ie
the harmonics which reach the ear of the listener Dunn
(1950) says the vowels have asso~iated with them different
frequency regions in which the sound is more intense than
elsewhere in the spectrum The name formant has been apshy
plied to these regions
The next problem then is to relate the concentrations
of power mentioned above ie the formants to human pershy
ception of speech sounds The most widely utilized techshy
nique in this area is one devised by Martin Joos (1948)
~______________________________________~S___________________________________________________shy1
14
generally referred to as his 2 Formant Theory This techshy
nique represents the plotting of formant 1 and formant 2
in a specific wayan a particular chart cf Chart 1 on
p~ 23 This technique is clearly described by Ladefoged
(1967)
The relations between the formant structures of the vowels in a number of words can be conveniently represented by means of formant charts which show the frequency of the firs~ formant at a time in the word when the formant structure is changing at a minimum rate plotted against the frequency of the second formant at the same time
When making these kinds of plots a charting is derived of
vowels for any language which is remarkably like the tradishy
tional impressionistic vowel charts of the 19th century
Esner (1947) illustrated that if the frequency of the first
formant was plotted against the frequency of the second
formant it seemed to equal the relation between formant
frequency and the traditional vowel diagram
Basically this study will reproduce such vowel charts
for a number of examples of each sound in Bahasa Indonesia
Formant 1 will be platted against formant 2 for each vowel
phoneme in a variety of phonemic environments -The purpose
of this will be to determine the range of variation for
every vowel in each e~vironment as produced by a single native
speaker
CHAPTER III
METHODOLOGY
Phoneme Identification
In order to assess the phonetic quality of vowel phoshy
nemes one must first ascertain the number and relationshy
ship of sound contrasts in a language ie the phonemes
The visual representation of the actualization of the phoshy
neme ie the spectrogram can only be made on the basis
of a preceding decision of the linguist on the types and
number of phonemes in the l~nguage to be anaiyzed (Pulgram
1965)~ Phonemic analysis cannot be made with phonetic
data alone it must be made with phonetic data plus a sershy
ies of phonemic premises and procedures (Pike 1947) A
spectrogram conveys phonetic information which aids the
linguist in determining which phonetic features are consisshy
tently present in order to reach the most accurate phonetic
description
There are a variety of premises and procedures which
the investigator may utilize in order to discover the phoshy
nemic structure of a language Pike (1947) argues that the
investigator must have at hand observable native reaction
to native sounds andor know structural facts pertaining to
the phonetic nature of the sounds and their distribution
As stated before a phoneme is a bundle of sound f~atures
1
j
16
which when substituted for another bundle creates a difshy
ference in meaning Since the creation of a different morshy
pheme is the result of the substitution of a different sound
feature these sound features are said to be phonemes
A pair of words in which the first word is the same as the second except for the fact that one segment is replaced by a different but phonetic~lly similar segment in the second word constitutes proof that the two similar segments are phonemically distinct~ bullbullbull Word pairs of this type are said to be MINIMALshyLY DIFFERENJ because no smaller difference in the language can make a differ~nce in meahing in words (Pike 1947)
Hence minimal pairs of words were used to find phonemes
Minimal~y different word pairs prove to be the beginners
single most important tool for the analysis of phonemic difshy
ferences (Pike 1947)
Thus Echols and Shadilys An Indonesian-English Dicshy
tionarv (1968) was ut~lized to find three-phoneme words
containing two consonant sounds with a vowel in medial poshy
sition The process was simply to go through all the words
beginning with consonants and find minimally different t~ree
phoneme words This was done on a purely anthr~poscopic
basis on the part of the investigator If a different letshy
ter was employed to distinguish a different meaning it was
assumed to be a different phoneme The following ~ord pairs
and their meanings are examples of the words found in the
dictionary
ban--tire bin--son of
das-- a shot dos--small box carton
I
1 7
pal--pole pel--field
rang--rank position ring--ring
teh--tea toh--yet nevertheless
After having obtained the words from the dictionary
a native informant was called upon to verify ~he differshy
ance in meaning in the minimal pairs and to pronounce
them so that ~hey could be phonetically transcribed in
al1 impressionistic manner The informant employed was Kok
Djen Su a student at Portland State University from Yogshy
jakartai Indonesia He has been a student in the United
States for approximately two years and speaks broken al shy
though very understandable English Mr Su was horn to Mr
and Mrs Su Hendry Su who both speak Bahasa Indonesia Jashy
vanese and a small amount of Chinese Since his birth the
informant was exposed to a mixture of Javanese and Bahasa
Indonesia but has employed the national language of Indoshy
nesia since the age of three at school His bilingual upshy
bringing it seems to the author does not craate a subshy
stantial difference in the competence of Mr Su in Bahasa
Indonesia In fact he was able to distinguish the proshy
nunciation Qf words in both Javanese and in Bahasa Indoshy
nesia The utilization of one informant deletes any reshy
gional variation or individual variation between informshy
ants Since here we are attempting to ascertain the relashy
tive range of phonetic quality of vowel phonemes in Bahashy
sa Indonesia the informants bilingualism ahould cause
none or very few phonetic distortions
After-having verified the difference in meaning of
the word pairs Kok Djen ~u pronounced the word The
following impressionistic version of the Ihdonesian voshy
wel system was described
front central back
high
mid 1 I
I I low j
i I I
I
u-
E 0
A
1 Spectrograms
The phonemic entities symbolized in the preceding
section represent range-units of phonetic quality The
symbols and their position on the chart are based on the
aural perceptions of the investigator The purpose of the
spectrographic analysis of this data is to determine as
accurately as possible the actual phonetic range represenshy
ted by each of thephonemic symbols
I
i
1 9
In order to make spectrograms from which meani~gful
conclusions can be drawn one must have a native informant
of the language to be studied Spectrograms were made of
the speech of Mr Su the informant described earlier
In order to conserve the time of the informant a
sample of three-phoneme words were recorded The three-
phoneme words begin and end with consonants ahd contain a
vowel in medial position The list appears in Appendix A
The list of words was specifically selec~ed to eliminate
in so far as possible all variatiqn other than that which
is specifically caused by the preceding and following consoshy
nants This is true because by utilizing a single informant
the influence of dialects both regional and social are eshy
liminated and by utilizing one sy~lable words under primary
1stress sequential influences such as the Markov Process
are eliminated since there is no sequence beyond one phoshy
neme preceding and following the vowel This being the case
one should be able to derive from a series of spectrograms
of those vowels both the range of free variation and the
specific influence of each particular consonant on the voshy
weI quality of each medial phoneme
The n~xt st~p in the procedure was to play the tape-
recordings into the spectrograph two or three wo~ds at a
1The Markoy Process is a mechanical way of handling enshytropy in sequential operations IQ linguistics this is stashyted in terms ofthe probability of the occurrence of a parshyticular phoneme morpheme etc in a precise sequence
20
time The machine can handle 24 seconds of speech on one
spectrogram thus two or three words could be analyzed at
the same time as one with no loss in quality or precision
Unfortunately the recordings had to be played into a
microphone which picks up some background noise but by
placing the microp~one of the spectrograph very close to
the loudspeaker of the tape recorder and turning the volume
up slightly this background was eliminated for all pracshy
tical purposes middotIt would have been better to have had a
direct connection between the recordar and the spectrograph
but unfortunately no such devce was available Background
noise shows up as very small specks scattered more or less
at random and unless the volume of such noise is exceedshy
ingly strong does not interfere with the reading of the
spectrograms
Once the machine had completed the analys~s and produced
the graphic record of the list of words a frequency measur~
ing device was produced by the machine cf example below
1 11amp II~ill c=
- n- HE to
11r -shy
bull b mmiddot 1 bull bull L
-
gIl F Jamp u
n _ If
bull III
21
This measuring device is in reality a spectrogram with horishy
zontal markings The first line on the chart represents a
frequency of 0 hertz (hz) Each line above the first repshy
resents a multiple of 500 hz The device is used to locate
th~ center of formants 1 and 2 Since it is graduated in
500 hz it is necessary to interpolate when the center ofmiddot
power for a particular formant falls between two of these
lines This is done by dividing the area between the two
lines in half then dividing one of the halves in half which
gives a range of 125 hz within which the measurement falls
and an estimate is made of the precise measurement within
the 125 hz range This should give formant positions with
an accuraci of greater than plusmn25 hz
When visual location of the formant centers becprnes
difficult a section of the formant can be made cf exshy
ample below Such difficulties with visual location usually
arise when two weak formants overlap Such overlapping
produc~s what appears to the naked eye to be a band of modeshy
rately dark grey bands The sectioner is a built in mech-
IshyfL__---
tete we tt
~
I
1 I
22
anism capable of handling such problems In the preceding
I example the amplitude of each harmonic is proportional
to the length of the line representing that harmonic I
This makes it possible to locate formant centers when vi-
I sual location is difficult
The measurements were then transferred to formant
charts cf Chart 1 on the following page
6
23
CHART I
~
t
1+
t5
1amp
Ie
z~ 2t 2p 16 12 la 8 Iii
I ~
~
I S
l I
I I
~
V V
V T
l( FORMANT V CHART
Vi ~ CcdiOrate4 ift luutdnM I V ~ cycle ~ concf
V 10 eeentl~rsI~ V
V U 5millimctcrs - I $milton
2 zk2 lis ty
I
FOlWAlfT CHART
Placing a single point on this cha-t is an assertion that formants have been observed at two frequencies one fOrrUlt at the frequency named along the right or left edge the other formant atmiddotthe frequency named along the top or bottom edge
ex Martin Joos~ Acoustic Phonetics (1948)
CHAPTER IV
FINDINGS
The data provided by the preceding methodology conshy
sisted of a series of scatter patterns on the vowel charts
Each of the dots within the pattern represented one occurshy
rence of a particular vowel To determine the range ofmiddot each
phoneme f the most divergent points in each pattern were con-
nected by a line These lines then circumscribe an area
which included the range of all the vowels in the sample
recognized ~y the informantmiddotas a particular phoneme
Verbal descriptions the actual charts of the phonemes
and the spectrograms utilized willbe found on the followshy
ing pages
25
The distribution for the sounds which the informant
produced and recognized as the phoneme 1 range~ on the
vowel chart in a broad scattering from 300-500 hz for forshy
mant 1 and 1500-2100 hz for formant 2
CHART II
1
lid
13
bull
~
It
iA
Ml
ztr Zit zp 1 S lIZ middot1 I a r 8 6
I
f
I I
Ii 3
[7l I I V 1 I
) ~I I i I bull
V I I i bull r J
I V t I I I I I
i tt I
Kl7 I I I iI ~
I I I I I I I I I i I
I I I i I f I ltII
I I l7 I VI
I [7 1
1 I I I Va FORMANTc7 CHART
I
I I I I 173 CaEiIw-atd icw~[7 rf ltfer C0ItdI I I
j I I I i 7 10 e centlCMta1 oct4v
I V 5miU~ bull itonI
r I f 711 t14 j I I I Ik IV
FoiUlAhT CHRT
Placing asinge point on this chart is an assertion that fortcants have been observed at two frequencies one formant at tn(l frequerlcy nameu Slong the right or eft cdampe the other formant at the frequency named along the top or bottom edge
26
l 1I I - -~
I I iI I
I
[bIs] [bIn]
lt-- -_- -1I
lt i
1 ~ i1_ -shy Ir ~ tmiddotmiddot lt
-- - - ---~--- - - - ----- --
-i -_~ ~ shyI 1
i I I
I I bullbullq_-
I ~~~-~--shyr ~~~~~ -~- I------------------------shy
-----I
[dIm] [sIh]
27
I -[blr]
i1 1 I I
i Ii I
I i I I
ii ___ -J
rmiddot I i
I 1 j
-~ ~~~ ~-~IIlIr~~~
I
1 ____~~l_~~--=~ _ ~--~~~~~~~~~- -
51 hI$ PiiB PD~ii~i
-~ - -- -- ----- ~------- - --- _-- - _ - shy [rIll) [klr]
28
1 I I I
---~S~ -~~~fi~ ~~~~~-~
~l_ middot~ ___
[klk]
I I I
r [dlk]
29
-------- --
-~- shy~--I~~
[tIll]
30
The distribution for the sounds which the informant
produced and recognized as the phoneme lEI ranged on the
vowel chart in a thin oval shaped distribution from 400-625
hz for formant 1 and from 1400-2000 hz for formant 2
CHART III
lEI
i
I
1 I
1
1middot
II~~ 5 I~ I lOa I ~--~~~I-+--+-4-+--+---+--++-+-+-+-+--r--t-t--r--t--r--1
I
I I I I
t I
4
I I 1 I ~ I I I I
I t I ~
I I ~
-r--- r--- I V~~~-r~+-+-~~~+-+-~~~~~~~--T-~-r~-r~-r~-T---T--r~
V~~~++4-~~~-4-+-+~~~~~+-~-T-rV~7
~iA~~~~~I+-~~~~~I--~~~-r~~~~~8 FORMANT HHHH~~r+~~-r~+-~+-~I~-I~~rl7V CHART
I II 11I I V9 CaZiLrww 1ft huncirccLJ
-+-f-+-II-f-+-+-+-+--+-+--+--+----+-+--+-1--t-+-1---t---t--7 rtf eye 04 ~ I 11 V pq-+-+-I~-+--i--+I-t-t--+~i-I---t--+--tr -t--t-Tj-ri~middotltJ ecentimeters 1octGy
I V 5miU~ - aemiton ~~~~I~~+-~~l~-~-T~I~~~r~
t i lt~ I I IS I I liV
FolUlAn C1LBT
Placing a single point on this chart is an assertion T hat rormants have been observed at two frequencies one formant at the frequency namfu along the right or left edge the other formant at the frequency named along the top or bottom edge
31
I I
I ~_ f __
~~~ - - ---~ _-shy
I -- shyI - _v-- _ l
i _~~E~~~~middotmiddotmiddot ~---~--~~-it--_ ~_~ 1gt_ bullbull bull -_gt-~~~ ~ bullI
P~J r_i~=~~~ ~-~~~- - -1 I -----~ -~-~ _ ---_
~~Wa~~Ji~~L ____ __ _____ _
[PEs]
I __ shy
-- --shy
~~ ~ -Qt-shy
-~=-=----
~~~7=~~ L___ __ __ ____ _ ______~
[rFm]
32
[PEt]
bull - -IIot-__
- ---~~--
[dEk]
---
33
f ~
I
) I I
I
I I
I 1 I
I I
I
1
__ -~_~i~~-yen-=-- ~~-~= --
------------------------
[dEn] [sEn]
i
~ ----shybull __ ~
[cEr)]
34
1J i i
~
--~~ ~-
~~
-~- ~ -~ ~~ ~gt-- ~- ~~
I ~IJItt- F ~ 111 i~-~_~--- ~--- - _ =-- 4e -~~~-~_-_~-- _~
bull vf middotmiddot~~tmiddotmiddotl____________________~____ j
[sEp] [bEk]
[bEl]
~ shy~~--_o-
J -~~~
~~t~-~~J~ r~~7~ _
I middot---=i---=-~_4~ __ ~~~~~___I _ _~
~g_i$fj bull - ~-~~~z~ir~~ ~~~ leal -~I_ iiIB
L_________ __~________ _____~
[lEs]
I f
I
35
- --- ---- - ---- ----------
~-------- shy
bull
j
i
[tEll][dan]
[dEp]
36
The distribution for the sounds which the informant
produced and recognized as the phoneme A range~ on the
vowel chart from 600-750 hz for formant 1 and from 1600-2300
hz for formant 2
CHART IV
A
i6
i I I
I I
I I
I I
1 0
I
I I I
I I
I I
s
It
i j I Ii i I
I I
6
~ I 1 I I I I ~
I I I V~ FORMANT ~~~~~I~1~4-+-~~~--~1-+~~I~-~-r17 CHART
~~~~~~l~~~~I~i~~~~I~+I~~lr_I~I~~~$ ~U~~~h~~ ~ I I I I I ~ 7 J eye ptI -cony
1f4-i--~--+---I----t--I-4--~1--+---+--+---+---1-~i7-to e cVltJte1 oct4v
i I I I 1 5miU~ - bull iton ~~~~~~~~~middot~~~~4-~I~I--~+~middoti i
2~ I I
F01UlANT CiLlT
Placing a single point on this chart is an assertion tnlt rorreints have bE-en obsered at two frequencies one formant at the frlquerJcy nSleU aiong he right 01 eft edge the other formant nt the frequency named along the top or bottom edge
37
I I i
-shy
I
I
I
~1iI
p~~~~==~~~~i~~~~
I I
[lAs]
_7 -~
-- -shy
L _ _ _ ____________ --- -- ----_~____J
[nAn]
--------
38
I I
------------------~----I I 11 I I
II1
flt~
I
IJ
L
i
______________________
[sAk]
f
~~ ~--r
1 shy
~~-
-- shy[sAn]
I r 1I I I
t
t
I l I
I I I
I i
I
[sAt)] [sAp]
39
~]
I
I I
[rArl][bAk]
I
-shy ---==-_____lshy___
[lAp ]
40
~----------------------------~-------------~
1 bull -l----1-shy
~middot-~-~t-=-- -
~r-shy -shy t~ III M -~ ~~---shy~t-= ~r=_ _shy
C z---=-
L______________________----- [dAs]
[dAr]
l _
41
v 1
I I
i
I
I -tc - bull ~ 1t iCSi4 _ -
-~~-r~middot- 1 ____ ~~~~ ~ ~ I
1 I ~=~j3~middot7-__ ~~
[kArl
---------------------~------
[dAin]l
I I
-I
I
42
I gt1 tmiddot
I
[bAm]
bull
~ I 1 I
gt1
-- - ___ _ N ____ ~--shy---- shy
[bAn]
43
[lAh]
==III
I Imiddot
__~_--_middotfI_~__ ~ ennee ~ S
LL-
[JAk]
--------- ---------
44
---------
I i Ir I
I I j
i
I i
~ --_ -- ~
~~fb-~~~~~~ ----- shycshy7FiIf Elii=s FUP WRmiddot 75t3~ n JIilIeia
~------------
[JAs]
-II
I J
[dAnl
45
~ I 1shy
I
iI shyi t
- - - Imiddot--- ~p -~--~= roc - I
I II i
I I I
~ middot1 I
------J
j I
I I i
i I
1_____ --- I ---------------~
[kAs]
I
I I
I t
I I i
j poundiampl d
rshyl
I i
I
1
I I I
I Il
[bAl]
I~
[bAl)]
I
47
L---------------------- --------------~
[kAp] shy
t
I-- I ~ I i
I
ji I
I -I
I 1 I 1
i
)
~~
~L~--~~---~ - ~ ~
~ -shyY- r i
I
-
1
I I
)
----~ -shy- -- _ ~ ----shy
1 I i i I I
1 I
L ~~~~-~~-~-~~~-~~-gt-= rn~ J ___fi ~ 7 7TZ r~ 5UZs=j -~ l ____-------- _____ __ _ ___________ ________ I
[kAk]
i
I t r ~
--~~ -shy
~~~c~_=--_u ce4 we
I r bull
[gAr)]
~-~ shy
- -~ -~~
~P ~-~~
I ~~
-- bull ~ I - ~~-~~
~-~~~--~ shymiddotT _i
48
-----------------------------l
I I
I I
[rAk]
~_
~ ~--- ~~~-~
j ~~ ~ ~ ~7
~ bull~~middote ri~-is~~~l-IIII-middotlIIIIn---I~-- 41~~~~~ ~
1--=-_---- - - -===--------shy
[sAil]
I
49
_- I I
I -- ----------------shy
~2~~~ ~~
i i I I ~~~~~~~~b ~-
middot_- _ ~~------
j
i ~ at -== l - -- ~-~~it I ax I C1 bullbull~~- shy
I
I i
I I
I 1 I II r I I
-r- --shy
~~-~-~- -~-
-1 l I
I I
[bAs] [PAs]
r-------------------~------------___
[pAl]
I
50
The distribution for the sounds which the informant
produced and recognized as the phoneme 0 ranged on the
vowel ~ha~t from 400-525 hz for formant 1 and from 700~1000
hz for formant 2
CHART V
0
III
t5
lot
S
6
Ie
to
Z7 Zit 9 I 1 I a I z I a 6 6
I
I ~ I
I i II I
j i bull I I
I I I i I
I ~ t
~ ~I I
f I
I ~ f A I I I
j [- V I 1 I I I II ~ I 1 I I
At I
I t I I
V V
V 7
i I Vi( FORMANT I 1 I 1 CHARTI I
I V 3 C41iotc4 ill lUjn~ 01 eycpr ~0It4
i I f I IV
I ) I V IO 6 centltcrs 1 octcv1 I I I 5miU~ -Istmi-toneI
I I VII 2 I ltQshy t 116 IV
FOlUlUfT CRBT
Placing a single point Oll this chart is ampn assertion that formants have been observed at two frequencies (me iormant at the frequency nametl ~ong the right or left edge the other tonnant at the frequency named along the top or bottom edge
Ishy
51
r--- -_-__ - --------shy
-- ~--- --shy~ -
--f -~-
[tOll][pOn]
~ ---- -11lt1 ~
~-- - -~ P---~Amiddot_
t _ __ _
1 r I
--1 i I
I
I ~~~J L____ _ 1 rshy
[dOs] [b0s]
i Imiddot
52
---------------------~---
i I r -------- --------shy
r~~middot-~ [
I V I ~~
I - shy
~~~middottdmiddot~~-~-middot~-
S~~i~~-~ ~- bmiddotmiddotmiddotL _____middot_ ~_
[bOr] [rOk]
I
1 I
i i
j
I
[dOpJ[pOl]
53
Ii --~ --~--- -~~~~--=- I r
~ ~- ~ - ~ - shyI - -~ ~~ -~~ I
-1bullbull - h ~~~
~~~ ~ ~~~~----- ~~-~~~-~- ~--~~~~L- ~bullbull
I middot~-~middotdf r scr ~~~~~
~-laquo~~-==~~~-~~--~~~~ ~~
I
[lOs]
I
I
r I
i 1
i 1
I I J_____~ __ _-_M___J
[bOn]
54
i -~----
I I I r r
~-~ -shy
[bOn][sOp]
jI ----II I J
i
I I I
I I I i
I~~~==it shy
[jOk][tQr)]
55
1 I
I
II I I I
I c ~~~~~~~~ ~~OOWJI~~=U
[lOh]
i I
I
I ~~~-
I ~- -- shyl - _- ~ shy
I ~n=~~-~middot ~FlR T =Iti 1amp11 dill_
__-J
[pOt]
__J pOs]
1
- =xu
[bOk]
I
56
The distribution for the sounds which the informant
produced and recognized as the phoneme lUI range~ on the
vowel
hz for foimant
chart in an
1
almost square-like pattern from
and from 700-1000 hz for formant
250-350
2
CHART VI
lui fIG
3
t
ts
~
la
Il
IT zt 20 IS
I I
I I
i j
I
I j
I I
I
I I I
I t I I I1
I J I I I
~ i I LJ J I~
I
I
I
la -I
10
I
I I I 1
t I I i
I
I
I I
I
I I I
I ~ 1 v I)
V V
qV
FOlUfANT atRT lt
8 6
I t lt
~
I
l --~ I--- ~I I
i
I I
I I I i ltiI I
I i ~
I t
V
V V l( FORMANT I V CHART V
V Caiote4 iramp 1umb_ ef cycipampf on4
6 CelItlmctcrs bull octclv SmiUitoctamprs -I a~i-tonl
PlaciDg a single point on this chart is an assertion that formants have been observed at two frequencies one formant at the frequency named along ~he right or eft ede the other fonnant at the frequency named along the top or bottom edge
I
57
I
I
I -I
I
j _-
~~ -
-
bull I -
[dUp]
t I ~
~
I middot1
f
IshyIj II
I i
-------=shyI ~~-- -
L ~~-=-r--~~-III--=---
58
i middot1 I
I
i j I Imiddot
I~1 middotU~ _ s
I ~~~~~_-_-~--~ --_ I
L~ __________~_____________~ [CUll]
I
I
[dUr]
I
I J
I
I I
II
1
-yen ~ L___________ ~__ ~=~
I [kUs][pUn]
59
I
I
i L ~ -----------~-
____---shy______---2
~~~ -~ _
j ~---
I~~~-~-~ ~~ ~~
[nUn] [lUp]
I 1
~-=-~ ~~ -
[rlhn]
I
60
l
- _ ~~-----
~~~~~ JlCIIPrl fue rm ad I II
L ~ [gUI)] [kUk]
e_
__ ~ e-
~-d~~~~
[lUs] [jUs]
61
shy
I
Iii lEI and A Compa~ed
In comparing the distributions of the vowels III lEI
and IA( cf Chart VII on p 62 it is evident from the plots
that the front-back tongue position is for all practical
purposes identical ie the core distribution for all
three phonemes ranges between 1600-2000 hz This demonshy
strates conclusively that the significant phonetic differshy
ence is tongue h~igth ie t~e position of formant 1
The fact of phonemi~overlap is illustrated by the
crosshatching on Chart VII The cross-hatched area represhy
sents a r~nge of phonetic quality that is identified in one
instance as an III and in another instance as an IE or in
one instance as an lEI and in another instance as an IA
bullbullbull the sounds which follow one another in a changing sequence constitute the signals of speech and these sounds are produced by movements of the vocal apparashytus i e by movements of the lips tongue throat lungs and so on It is therefore important to understand that these vocal movements caused by the various muscles involved tend to slur into one anothshyer Since each variation of movement gives a varishyation in sound the slurring of movements produces a slurring of sounds Furthermore since specific sound will have different slurs of moveme~t depend~ ing upon the movement which it precedes or folloItJs each sound type resul tant from the productive moveshyments will vary somewhat according to the sounds which it precedes or follows (Pike 1947)
In line with this the next logical step would be to
look for environmental influences which would enable a listshy
ener to determine which phoneme was represented when phones
were recorded in the overlap area
62
CHART VII
lIlt lEI and A Compared
~ 2[7
t5
lot
5
ft
fA
Ie
Zit I zp 16 I a la 8 6
t I
~
II V I I I I +
r l~ ~ ~ I
I I ~ ~ V I I 1shy fZ I I t s
) I I j I I I
i ~ I 1 1 I I _lgt
V ~R R-r--~ I V
ItV l(
I I---I-
V~ j shy ~
I I I I FORMANTI I
I I VV CHARTI II I V S CaliL-tcd I Uut
I I I l of fIelc F- 0114
I I I I I j i I 10 ecentImeters 1oct4v
I
I ~ V Smillimctus Iumrton_ j VII
2f1 2~ 16 ltv
FOlUlANT ClIABl
Placing single point on this chart is an assertion that io-rnants have been observed at wo frequencies one formant at the frequency named ~ong the right or left edge the other formant at the frequency named along the top or bottom edge
63
A fairly thorough study of the positions of various
vowel sounds in specific environments did not indicate any
consistent variations of a particular type For example
the vowel in dim is in the lower range for the vowelIII
but the EI in dem is in the upper range -of the vowel lEI
Thus it seems probable that those sounds in the overlap area
are qualities for which minimal contrasts do not exist For
example the II in sih is in the overlap area but appar-middot
ently is clearly recognizable by a native sp~aker because
there is no seh at least no such word was known to the
informaht nor could one be found in the dictionary (Echols
and Shadily 1968)
IU and 0 Compared
In contrast with the front vowels III IE and IAI
the back vowels Iu and 0 have aconsiderable gap plusmn50
hz between the1r two distributions cf Chart VIII on
p 64 The distributions appear directly above one another
on the chart In comparing the two ranges it is appa~ent
that the front-ba~k position formant 1 is identical ie
the core distribution for the phoneme ranges from 700-1000
hz This demonstrates that ~he position of formant 1 ie
tongue height is the significant phonetic difference
64
CHART VI I I
U and 0 Compared
I I
i
5
~
5
6
til
~
2[1
I
Zit zp 15 IZ la a 6
~ I -~
1 ~ ~ ~
~
I V 1
V
I V ~
JIll ~
I I 1 6
1 middotV V l(
vI( FORMANT CHART
9 CalLOt-ctc4 ift 1awuutb of cyc14 p ICCOftI
I~ I V 6 eentllMtcrs 1 octo
I V 5mmi~ - ampImitenI VII
214 I 210 16 IV FOlUfANT CE1ART
PJaciDc a single point on this chart is an assertion that formants have been observed at two frequencies one form3nt at the frequency named along the right or left edge the other formant at the frequency named along the top or bottom edge
middotr I
65
II lEI IAI lUI and 101 Compared
In comparing all three phonemes in their respective
poJition on the vowel chart cf Chart IX an p 66 there I
se~ms to be no problem identifying between front and back
vowels There is a gap of approximately 400 hz between
th$ two back vowels and the three front vowels in terms of I
fotment 2 Also it would appear that there would be no
pr~blem in identifying specific vowel qualities so far as
fOfmant position is concerned for vowels in stressed position
with the exception of the phonemic overlapping discussed in
a preceding section ie III-lEI and IE-A
I
I
Imiddot I
CHART IX
I 1 E IA U and 0 Compared I
iM zr Ztt ap J 6 I Z 10 S 6
I I f ts I
~
tj1- ~
rL ~ ~
J 4- 1 ~ ~ i~ ~ V
Ii ~W~ V I ~~ ~ J
V I ~ ~
IS I ~ V 5 1 t
~
s ~ I I f
V R ~ r-~ I V
if~ V ~ ~
-- V 7
~ -~ [a ti I l( FORMANT
V CHART
V 0 cyclu on4 S CaULntte4 ilt hWldr_
I
Kl I jmiddotV I j V 10 6 centlrMtcll1 oct4v
V 5llIil(lCtampn ~ hl4Imiton
Vii 2~ zkgt 116 I IIyen
I
Forw~ CllABT I
Placing a single point on this chart is an assertion that formants have been observed I at two frequencies one formant at the frequency named along the rignt or left edgeI
the other formant at the frequency named along the top or bottom edge
~ ~ bull -
66
I
I I j
Cbull
I I
i
CHAPTER V I SUMMARY AND CONCLUSIONI
I As is shown on Chart IX on p 66 there appears to I I
bela very discernable distribution for each of the vowel I
Phtnemes of Bahasa Indonesia This does not mean that the
ci cumscriptions of each of the various sounds indicate I
detinite border lines for each vowel Rather it shows i
th~ position o~ each vowel in relation to the other vowel
phbnemes The vowel charts show the position of the phonemes
i asl produceq by one native speaker of the language Thus
nJ conclusions can and should ~e made regarding the definite
oJter boundaries of the ranges of middotp~onemes As is implied I
b~ the term ranges the phonemes have no defined boundarshy
I i~s
i Bahasa Indonesia does not appear to have two front I
v~wels two back vowels and one central vowel as is implied
i+I
the traditional symbolization Rather it has three i
ftont vowels with a three-way contrast between high mid I
i a~d low and a two-way contrast of high vs mid in the back
a1ea of~he articulation chart If a traditional symbolshy
i~ation of the vowel phonemes of the language were now to
b~ dawn it would look like the following chart I I I
68
front central back
high
mid
low
I
U
E 0
A
Thus as has been demonstrated the impressionistic
sion of the vowel system was in error with regards to
central phoneme of the language investigated There
a ears to be no low-central phoneme in the language
r it is a low-front one Although the spectrograph
c nnot establish a phonemic system of a language on its
o n it can provide a yes or no answer about the phoneshy
t c qualities of the phonemes in question After a phoneshy
m c system has been established the spectrograph can proshy
v de phonetic data which distinguishes one phoneme from
a other
BIBLIOGRAPHY
Sources Cited
Almiddotsjahbana Takdir The Indonesian Language - By-product of Nationalism Pacific Affairs XXII (1949)388-92
Am rican University Area Handbook for Indonesia Washingshyton DC ~S Government Printing Office 1970
Blch B and G Trager Outline of Linguistic Analysis Baltimore Waverly Press 1942
Du n H K Calculation of vowel resonances Journal of the Acoustic Society of America XXII (1950) 740-53
ols John M and Hassan Shadily An Indonesian-Enqlish Dictionary Ithaca Cornell University Press 1963
ner C Reserches sur la structure des voyelles orashyles Archives Neerlander Phonetic Experiments XX (1947) 40-77
obson Roman C Gunnar Fant and Morris Halle Prelimshyinaries of Speech Analysis Cambridge MIT Press shy1961
J s Martin Acoustic Phonetics Baltimore Linguistic Society of America 1948
L defoged Peter Three Areas of Experimental Phonetics London Oxford University Press 1967
P Mario Glossary of Linguistic Terminology New York Columbia University Press 1966
Perce Joe E The Spectrographic Study ~f Vocalic Nuclei Language Learning XII (1963) 241-247
- --- Phonemic Theory and the Analysis of English Syllashybic Nuclei Linguistics XVII (1965) 36-57
P ke Kenneth L Phonemics Ann Arbor University of Michigan Press 1947
70
Pi e t Kenneth L Phonetics Ann Arbor University of Michigan Press t 1943
Pu gram Ernst Introduction to the Spectrography of Speech New York Dover Publications 1966
ir Edward Language An Introduction to the Study of Speech New York Harcourt Brace amp Co 1921
enbeck E M Indonesia and Malaysia 1I Current Trends in Linguistics IIX (1967) 55-111
dman Dorothy The Republic of Indonesia New York N Y Philosophical LibrarYt Inc 1955
Sources Consulted
r e j e v N D bull Some ProbIem s 0 f Baha s a In don e s i a Ph a nshyology Studia Linguistica XI (~1957) 44-46
lingmiddotC L Linguistic Units The Hague~ Mouton amp Co 1960
J obson t R Hague
and M Halle Mouton amp Co
Fundamentals 1956
of Language The
K nedy Raymond Bibliography of Indonesian Peoples and Cultures New Haven Yale University Press 1962
Perce Joe E Spectrographic Study of English Vowels Under Primary Stress Linguistics LXXXIV (1-972) 41-84
P ttert Ralph K George A Kopp and Harriet C Green Visible Speech New York Dover Publications t 1966
T euw A Critical Survey of Studies on Malay and Bahasa Indonesia The Hague Martinus Nyhoff 1961
-basin
-head of an area
-form of address
-ball bag
-bell
ba --bank I
bUr --you I
bi --beer
bomiddot--drill I
ba--bliJss
bi --bus i
I t
bo I
--bunch bun~le i I
ba--crossbeam
--bomb
--tire
--son of
--ration coupon bond
--garbage dump
--checkered design
--inch
--and plus
APPENDIX A
LIST OF WORDS
den~-abbrev of the title raden
dar--olace location
dur--pearl
das--a shot
dos--small box
dek--deck
dik--younger sibling
dep--to b~ shelved
dop--hubcap
dup-~to be baptized
djak--jug
djok--seat
djas--coat
djus--part of the Koran
gang--paBsageway hall
gung--gong
kak--form of address for elder
kik--handloom
kuk--collar harness
kar--map
kir--jo test
kas ~money supply i
kus -to hiss spit I
lahi-alreadY
loh-writing tablet
lapi -towel I
lup -magnifving glass or
last -IrJeld i oint
lesl -lessonI
lOs -shed I
I I
-to iron
-which who
nu -yonder
po
pa --pole
pa --to fit
pe --plague I
po --mail I
pel --cap
pOI --pot
--pound
--also
r --shelf
--shirt
g-o-rank position
g--ring
--brake
rum--cream
sah--valid legal
sih--an enclitic usedmiddotto soften what follows
san--form of address far sargeant
sen--cent
sang--superior
seng--zinc
sap--line row
sep--chief boss
sop--soup
sjak--suspicion doubt
sjok--attractive
tang--tongs pincer~
ting--sweet meat
tong--barrel vatmiddot
teh--tea
toh--yet nevertheless
tjeng--molasses
tjung--young boy
III 1
APPENDIX E
LINGUISTIC SYMBOLIZATION USED
IAI~high-front-openIi
II
~ r
E~-mid-front-~pen
III
AA-low-front-op~n t1
o1-mid-back-open
Uf-high~baCk-close III
I III
~~~vd bilabial stop
[dj~vd alveolar stop l
I I
[kt-Vl velar stop I
[g I-vd bull velar stop
[1 -lateral I
(n-vd alveolar nasal 1
(m~-vd bilabial nasal
~I-Vd velar nasal
I
III ~IJ
I
q
dl
I
Iil~
I
Vowels
Consonants
[p]-vl bilabial stop shy
[t]-vl alveolar stop
[rJ-vd alveolar flap
[jJ-vd palatal affricate
[CJ-vl palatal affricate
[S]~vl bull alveolar affricatmiddote
[s]-vl alveolar middotfricative
h]- vI velar aspirant
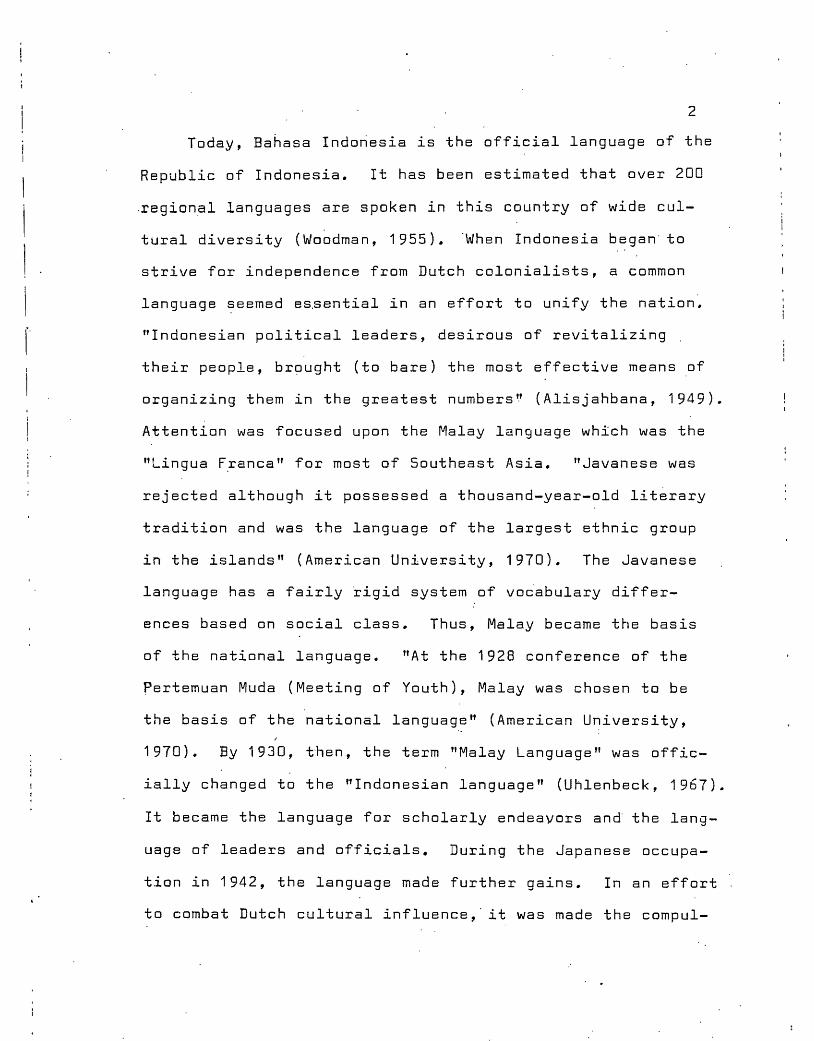
2
Today Bahasa Indonesia is the official language of the
Republic of Indonesia It has been estimated that over 200I
region~l languages are spoken in this country of wide cul-
I tural diversity (Wo~dman 1955) When Indonesia beganto
I strive for independence from Dutch colonialists a common
language seemed eSsential in an effort to unify the nationI Indonesian political leaders desirous of revitalizing r th people br9ught (to bare) the most effective means of
organizing them in the greatest numbers (Alisjahbana 1949)
Attention was focused upon the Malay language which was the
lingua Franca for most of Southeast Asia Javanese was
rejected although it possessed a thousand-year-old literary
tradition and was the language of the largest ethnic group
in the islands (American University 1970) The Javanese
language has a fairly ~igid system of vo~abulary differshy
ences based on social class Thus Malay became the basis
of the national language At the 1928 conference of the
pertemuan Muda (Meeting of Youth) Malay was chosen to be
the basis of the national language (American University
1970) By 1930 then the term Malay Language was officshy
ially changed to the Indonesian language (Uhlenbeck 1967)
It became the language for scholarly endeavors and the langshy
uage of leaders and officials During the Japanese occupashy
tion in 1942 the language made further gains In an effort
to combat Dutch cultural influence it was made the compulshy
3
sory language uied in schools from elementary and up
Bahasa Indonesia became the official national language
when the Republic of Indonesia was farmed in 1945
Justification For Study
Phonemic descriptions of Bahasa Indonesia are almost
non-existent and very limited f from a linguistic point of
view Most descriptions of the sounds of Indonesian are
of a comparative nature i e Bahasa Indonesian sounds are
likened to sounds of modern Indo-European languages Echols
and Shadilys An Indonesian-English Dictionary describes
Indonesian sounds in relation to the similar sounds in
English For instance they argue that the e in the Indoshy
nesian word sen is like the e in the English word make n
only shorter Statements such as the aforementionedmay
be practical for most purposes but are not necessarily
linguistically sound and almost certainly inaccurate
Another deficiency which seems to be present in phonshy
emic analyses not only in Indonesian is the impressionistic
nature of these analyses When dealing with a lang~ag8
the linguist must attempt to remove all linguistic biases
and comparisons because phonetic details may escape the
ear of the analyst f especially in a foreign language upon
which he is likely to impose depending upon the degree of
his skill any of the few prejudices of his native phonemic
scale (Pulgram 1965) Even when the investigator does nat
4
I
rely on comparative methods of description he cannot compshy
letely remove all the sounds in his linguistic memory when
describing a new language He will invariably hear sounds
that are very similar to those he knows and may not be able
to discern certain minor although perhaps crucial differshy
ences Phonemic descriptions are most often of this impresshy
sionistic variety
Spectrographic analyses of the sounds of a language
provide an objective measure of the quality of the sounds
of a language Spectrographs record precise sound qualities
produced by a speaker particuiarly vowels This mode of
description will delete the impressions of the investigator
and will map precise quality for sounds in question what
shows on a spectrogram is an acous~ic reality whether the
analyst hears it or not (Pulgram 1965) It is these
precise sound qualities of Bahasa Iridonesian vowel phonemes
that this investigation will attempt to ascertain Instrushy
mentaltesting of hypotheses has been a part of scientific
study for many years but very little has been done to
date in linguistics (Pierce 1963) The acoustic specshy
trograph can provide definite answers as to the phonetic
quality of vowels
The science of phonemics developed out of the realizashy
tion that some phoneti6 features of a language differentiate
one word from another while others do not Edward Sapir
(1921) argues
5
Back of the purely objective system of sounds that is peculiar to a language and which can be arrived at only by a painstaking phonetic analysis there is -a more restricted inner or ideal system which perhaps equally unconscious as a system to the naive speaker can far more readily than the other be brought to his consciousness as a finished pattern a psychological mechanism The inner sound system overlaid though it may be by the mechanical or the irrelevant is a real important principle in the life of a language
Once it was accepted that language had a definite phonologshy
ical structure a method was devised to describe this undershy
lying system This method became the science of phonemics
The phonemic structure of a language represents the minimal
number of sound signals which make transmission of informashy
tion possible Spectrographic analyses of t~ese minimal
sound signals provide objective and empirical measurements
of the quality of these minimal sound features
Statement of the Problem
This investigation will determine the range of free
variation of Bahasa Indonesian vowel phonemes in a given
phonemic environment and types of conditioned variation
from one environment to another The nature and ra~ge of
the vowel quality for each phoneme will be determined by
spectrographic measurements
Delimitations of the Study
This study will only deal with Bahasa Indonesian
vowels sounds produced with vibration of the vocal cords
6
by unobstructed passage of air through the oral cavity
and not constricted enough to cause audible friction
Pei 1966) They will be the vowels found in monoshy
syllabic Indonesian wo~ds under primary stress and in a
consonant~vowel-cDnsonant pattern Each word will also
be part of a minimal pair ie every word must be conshy
trasted with another word in which only the medial vowel
is different andto which a different semantic meaning is
attached
CHAPTER II
THEORETICAL BACKGROUND
PhoneticsPhonemics
Phonetics is the branch of linguistics which deals
with the actual speech sounds of a language When dealing
with the phonetic level of linguistic analysis one describes
the sounds of a language in terms of articulation or acoustic
features In articulatory phonetics one describes sounds
in middotterms 9f manner of articulation ie whether it is a
stop fricat~ve etc point of articulation ie) bilabial
(be~ween the lips) dental etc or vowel quality ie
high-front-close (the highest part of the tongue-is very
high in the front of the mouth for producing this particular
sound) etc In acoustic phonetics sounds are described in
terms of the distributions of frequencies characteristic of
the sounds of a language The relationship generally acshy
cepted as existing between artic~latory and ~coustic phonetshy
ics is that certain articulations produce certain distinctive
patterns of frequency distributions It must be emphasized
at this point that both of the aforementioned types of deshy
scriptians deal with all human speech sounds not necessarily
those which perform a signalling function in a particular I
aspect of the language
I I
f
8
Distinctlve features are used to denote signalling
functions The label distinctive feature is used in the
literature to mean two quite different things Bloomfield
describes the categorization with examples which imply
that distinctive sound feature means any feature of the vocal
sound which when changed changes the meaning of a given
word eg pill and bill sin and sing etcri (Pierce 1965)
There Bloomfi~ld labels p as a distinctive sound feature
and b as a different sound feature Later Roman Jakobson
Gunnar M Fant and Morris Halle in their Preliminaries of
sectpeech Analysis take the phonemes of a language and break
them down into their component phonetic features some of
which are distinctive eg voicing in English b vs p
while others are not eg aspiration in English p~ in pin
as opposed to p in spin Anyone language code has a
finite set of distinctive features bullbullbull (Jakobson Fant and
Halle 1961) In English the feature of voicing in the b
of bill as opposed to the absence of voicing for the p
in pill is the phonetic feature which distinguishes these
two sounds A similar presence vs absence of aspiration
does not alter the meaning of any English utterance in fact
it is difficult to make English speakers aware of the fact
that aspiration is or is not present Implicit in this
theoretical approach is the concept that the variation in
human speech for the most part re~resents presence vs
9
1
absence of non-distinctive features of sound
One theoretical approach to linguistic structures
views the phoneme as concurrent bundles of distinctive
features (Jakobson Fant and Halle 1961) Each language
has a finite set of rules for grouping them (distinctive
features) into phQnemes (Jakobson Fant and Halle 1961)
Every phoneme in the language then is composed of a unique
set of distinctive features such that it is different from
any other phoneme by at least one of such distinctive feashy
tures This manner of linguistic signalling has important
implicat~ons toward phonemic analysis of sound systems As
previously mentioned a phoneme is a bundle of distinctive
features which when altered changes meaning In order
to verify whether a sound is a phoneme or not one must
show a word in which the replacement of at least one disti~c-
tive feature makes another word ie a minimal pair difshy
ferentiated by only a single distinctive feature and having
two distinct grammatical or semantical meanings
Phonemics the study of phonem~s is the level of lingushy
istic analysis which answers the question of how language
utilizes sound matter selecting certain of its elements and
adapting them for various ends The prima~y functions of
sound in a language is to distinguish one utterance from anshy
other in normal conversation Phonemic analysis as an opshy
eration examines a~ailable data in order to discover an unshy
derlying structure bullbullbull not an operation which forces a mass
1 0
of data into a structure (Pulgram 19~5) The nature of
each feature is of the essence Thus the composition of
each phoneme becomes of primary importance in a language
The phoneme can only be defined in reference to the larger
frame whi~h is the language of which it is a structured
feature (Pulgram 1965) It is the shortest stretch of
sound which serves a signalling function
Acoustic Theory
I Distinctive feature theory as previously describedI I seems to handle such phonemes s stops fricatives and
I nasals quite well eg the airflow out of the mouth is I
either stopped or it is allowed to escape On the other
1 hand vowels seem to be ranges of phonetic quality whichI
are extremely difficult if not impossible to distinguish
in terms of presence vs ab~~nce of distinctive features
Since this study will not be concerned with consonants but
only w~th vowels it is only necessary to discuss the acousshy
tic nature of vowel qualities from this point on
FundamentalsHarmonics
Vowel quality is determined by a combination of a fundashy
mental and its harmonics A vowel quality displayed on an
oscilloscope shows a very complex single wave form This
wave form is in reality the mathematical sum of a number
of simple wave forms or at least for theoretical purposes
1 1
can be treated as such These wave forms are generated
in the oral tract by the opening and closing of the glotshy
tis The fundamental wave is a sine wave with a frequency
equal to the number of times the glottis opens and closes
each second and an amplitude which is directly pro~ortion-
al to air pressure in the lungs Because of the nature
of sound waves a harmonic is generated at every multiple
of this fundamental eg if the fundamental is 100 cycles
per second then a harmonic is generated at 200 300
400 bullbullbull CO As soon as the complex wave leaves the vocal
chords harmoni6s are filtered out by the nature of the
tissue surrounding the oral tract as well as the cavities
in and adj o 1ning the oral tract The complex wave emerging
from the mouth is the mathematical sum of fundamental and
the harmonics which have not been filtered out by the oral
tract cf Martin Joos Acoustic Phonetics (1 948) chapshy
ters 1 and 2 for a fuller explanation of this process
Acoustics vs Articulation
In the last century far too much energy has b~en exshy
pended in attempts to relate acoustic features to specific
articulatory movements Bloch (1942) illustrates this by
stating qualities are identified by ear but in linguisshy
tic works they are traditionally defined in terms of their
assumed production by the vocal organs This type ofmiddotstudy
is misdirected because the only things that impinge on the
I I
- I
12
human ear are the harmonics which were not filtered out
The articulatory movements which cause the filtration ie
movement of the tongue from front to back creating a series
of filters each of which removes different harmonics
from the complex waves are irrelevant Pike (1943) argues
one should analyze and describe the sounds (or sound waves)
themselves rather than the movements ~roducing them
It has long been noted by acousticians that a variety
of articulatory movements remove the same harmonics and
r~sult in the production of very similar sounds Pierce
(1962) illustrates this by saying
As long as the formants are in their praper positions ie the proper frequencies are passed through the speech mechanism it does not matter whether the unwanted frequencies are filtered out by rounding the lips or moving the tongue to the back ThuQ when Holbrook and Carmody give one front-back position for the tongue for a given English vowel and IPA (International Pho~etic Alphabet) gives another it is quite probable that both are completely correct and that the formant shift is made by compensating for the lack of tongue movement in the speech of some speakers by additional lip rounding bullbullbullbull
Since the hearer of a stream of speech can hear 9nly those harmonics which emerge from the mouth as componshyents of the final complex wave the placement of the formant is of primary importance not the articulation which produced the sound
Therefore a study of the phonetic quality of vowels
demands an instrument which is capable of making an accurate
record of the presence or absence of all the harmonics
having sufficient amplitude to significantly alter the final
wave form The acoustic spectrograph is such an instrument
13
it was the first instrument to make large scale acoustic
a n a ly s e sapr act i c a I po s sibiIi t Y n ( Lad e fog ed 1 967 ) bull
Spectrograph
The acoustic spectrograph is a device ~hich records a
stream of speech 2~4 seconds or less in length This
recording is then fed into the analyzing part of the specshy
trograph where at each successive playing ne frequency
or rather one frequency band is lifted outof the total by
the variable filter (Pulgram 1965) A black ma~king is
made on a piece ofmiddot electro-sensitive paper each time there
is a harmonic present within the frequency band being anashy
lyzed Since the articulators are constantly moving and
changing the filtration characteristics of thevocal tract
the black markings ma~e by a stylus reflect the movements
of the articula~ors in a very broad sense More important
however it makes a precise record of the stimulus ie
the harmonics which reach the ear of the listener Dunn
(1950) says the vowels have asso~iated with them different
frequency regions in which the sound is more intense than
elsewhere in the spectrum The name formant has been apshy
plied to these regions
The next problem then is to relate the concentrations
of power mentioned above ie the formants to human pershy
ception of speech sounds The most widely utilized techshy
nique in this area is one devised by Martin Joos (1948)
~______________________________________~S___________________________________________________shy1
14
generally referred to as his 2 Formant Theory This techshy
nique represents the plotting of formant 1 and formant 2
in a specific wayan a particular chart cf Chart 1 on
p~ 23 This technique is clearly described by Ladefoged
(1967)
The relations between the formant structures of the vowels in a number of words can be conveniently represented by means of formant charts which show the frequency of the firs~ formant at a time in the word when the formant structure is changing at a minimum rate plotted against the frequency of the second formant at the same time
When making these kinds of plots a charting is derived of
vowels for any language which is remarkably like the tradishy
tional impressionistic vowel charts of the 19th century
Esner (1947) illustrated that if the frequency of the first
formant was plotted against the frequency of the second
formant it seemed to equal the relation between formant
frequency and the traditional vowel diagram
Basically this study will reproduce such vowel charts
for a number of examples of each sound in Bahasa Indonesia
Formant 1 will be platted against formant 2 for each vowel
phoneme in a variety of phonemic environments -The purpose
of this will be to determine the range of variation for
every vowel in each e~vironment as produced by a single native
speaker
CHAPTER III
METHODOLOGY
Phoneme Identification
In order to assess the phonetic quality of vowel phoshy
nemes one must first ascertain the number and relationshy
ship of sound contrasts in a language ie the phonemes
The visual representation of the actualization of the phoshy
neme ie the spectrogram can only be made on the basis
of a preceding decision of the linguist on the types and
number of phonemes in the l~nguage to be anaiyzed (Pulgram
1965)~ Phonemic analysis cannot be made with phonetic
data alone it must be made with phonetic data plus a sershy
ies of phonemic premises and procedures (Pike 1947) A
spectrogram conveys phonetic information which aids the
linguist in determining which phonetic features are consisshy
tently present in order to reach the most accurate phonetic
description
There are a variety of premises and procedures which
the investigator may utilize in order to discover the phoshy
nemic structure of a language Pike (1947) argues that the
investigator must have at hand observable native reaction
to native sounds andor know structural facts pertaining to
the phonetic nature of the sounds and their distribution
As stated before a phoneme is a bundle of sound f~atures
1
j
16
which when substituted for another bundle creates a difshy
ference in meaning Since the creation of a different morshy
pheme is the result of the substitution of a different sound
feature these sound features are said to be phonemes
A pair of words in which the first word is the same as the second except for the fact that one segment is replaced by a different but phonetic~lly similar segment in the second word constitutes proof that the two similar segments are phonemically distinct~ bullbullbull Word pairs of this type are said to be MINIMALshyLY DIFFERENJ because no smaller difference in the language can make a differ~nce in meahing in words (Pike 1947)
Hence minimal pairs of words were used to find phonemes
Minimal~y different word pairs prove to be the beginners
single most important tool for the analysis of phonemic difshy
ferences (Pike 1947)
Thus Echols and Shadilys An Indonesian-English Dicshy
tionarv (1968) was ut~lized to find three-phoneme words
containing two consonant sounds with a vowel in medial poshy
sition The process was simply to go through all the words
beginning with consonants and find minimally different t~ree
phoneme words This was done on a purely anthr~poscopic
basis on the part of the investigator If a different letshy
ter was employed to distinguish a different meaning it was
assumed to be a different phoneme The following ~ord pairs
and their meanings are examples of the words found in the
dictionary
ban--tire bin--son of
das-- a shot dos--small box carton
I
1 7
pal--pole pel--field
rang--rank position ring--ring
teh--tea toh--yet nevertheless
After having obtained the words from the dictionary
a native informant was called upon to verify ~he differshy
ance in meaning in the minimal pairs and to pronounce
them so that ~hey could be phonetically transcribed in
al1 impressionistic manner The informant employed was Kok
Djen Su a student at Portland State University from Yogshy
jakartai Indonesia He has been a student in the United
States for approximately two years and speaks broken al shy
though very understandable English Mr Su was horn to Mr
and Mrs Su Hendry Su who both speak Bahasa Indonesia Jashy
vanese and a small amount of Chinese Since his birth the
informant was exposed to a mixture of Javanese and Bahasa
Indonesia but has employed the national language of Indoshy
nesia since the age of three at school His bilingual upshy
bringing it seems to the author does not craate a subshy
stantial difference in the competence of Mr Su in Bahasa
Indonesia In fact he was able to distinguish the proshy
nunciation Qf words in both Javanese and in Bahasa Indoshy
nesia The utilization of one informant deletes any reshy
gional variation or individual variation between informshy
ants Since here we are attempting to ascertain the relashy
tive range of phonetic quality of vowel phonemes in Bahashy
sa Indonesia the informants bilingualism ahould cause
none or very few phonetic distortions
After-having verified the difference in meaning of
the word pairs Kok Djen ~u pronounced the word The
following impressionistic version of the Ihdonesian voshy
wel system was described
front central back
high
mid 1 I
I I low j
i I I
I
u-
E 0
A
1 Spectrograms
The phonemic entities symbolized in the preceding
section represent range-units of phonetic quality The
symbols and their position on the chart are based on the
aural perceptions of the investigator The purpose of the
spectrographic analysis of this data is to determine as
accurately as possible the actual phonetic range represenshy
ted by each of thephonemic symbols
I
i
1 9
In order to make spectrograms from which meani~gful
conclusions can be drawn one must have a native informant
of the language to be studied Spectrograms were made of
the speech of Mr Su the informant described earlier
In order to conserve the time of the informant a
sample of three-phoneme words were recorded The three-
phoneme words begin and end with consonants ahd contain a
vowel in medial position The list appears in Appendix A
The list of words was specifically selec~ed to eliminate
in so far as possible all variatiqn other than that which
is specifically caused by the preceding and following consoshy
nants This is true because by utilizing a single informant
the influence of dialects both regional and social are eshy
liminated and by utilizing one sy~lable words under primary
1stress sequential influences such as the Markov Process
are eliminated since there is no sequence beyond one phoshy
neme preceding and following the vowel This being the case
one should be able to derive from a series of spectrograms
of those vowels both the range of free variation and the
specific influence of each particular consonant on the voshy
weI quality of each medial phoneme
The n~xt st~p in the procedure was to play the tape-
recordings into the spectrograph two or three wo~ds at a
1The Markoy Process is a mechanical way of handling enshytropy in sequential operations IQ linguistics this is stashyted in terms ofthe probability of the occurrence of a parshyticular phoneme morpheme etc in a precise sequence
20
time The machine can handle 24 seconds of speech on one
spectrogram thus two or three words could be analyzed at
the same time as one with no loss in quality or precision
Unfortunately the recordings had to be played into a
microphone which picks up some background noise but by
placing the microp~one of the spectrograph very close to
the loudspeaker of the tape recorder and turning the volume
up slightly this background was eliminated for all pracshy
tical purposes middotIt would have been better to have had a
direct connection between the recordar and the spectrograph
but unfortunately no such devce was available Background
noise shows up as very small specks scattered more or less
at random and unless the volume of such noise is exceedshy
ingly strong does not interfere with the reading of the
spectrograms
Once the machine had completed the analys~s and produced
the graphic record of the list of words a frequency measur~
ing device was produced by the machine cf example below
1 11amp II~ill c=
- n- HE to
11r -shy
bull b mmiddot 1 bull bull L
-
gIl F Jamp u
n _ If
bull III
21
This measuring device is in reality a spectrogram with horishy
zontal markings The first line on the chart represents a
frequency of 0 hertz (hz) Each line above the first repshy
resents a multiple of 500 hz The device is used to locate
th~ center of formants 1 and 2 Since it is graduated in
500 hz it is necessary to interpolate when the center ofmiddot
power for a particular formant falls between two of these
lines This is done by dividing the area between the two
lines in half then dividing one of the halves in half which
gives a range of 125 hz within which the measurement falls
and an estimate is made of the precise measurement within
the 125 hz range This should give formant positions with
an accuraci of greater than plusmn25 hz
When visual location of the formant centers becprnes
difficult a section of the formant can be made cf exshy
ample below Such difficulties with visual location usually
arise when two weak formants overlap Such overlapping
produc~s what appears to the naked eye to be a band of modeshy
rately dark grey bands The sectioner is a built in mech-
IshyfL__---
tete we tt
~
I
1 I
22
anism capable of handling such problems In the preceding
I example the amplitude of each harmonic is proportional
to the length of the line representing that harmonic I
This makes it possible to locate formant centers when vi-
I sual location is difficult
The measurements were then transferred to formant
charts cf Chart 1 on the following page
6
23
CHART I
~
t
1+
t5
1amp
Ie
z~ 2t 2p 16 12 la 8 Iii
I ~
~
I S
l I
I I
~
V V
V T
l( FORMANT V CHART
Vi ~ CcdiOrate4 ift luutdnM I V ~ cycle ~ concf
V 10 eeentl~rsI~ V
V U 5millimctcrs - I $milton
2 zk2 lis ty
I
FOlWAlfT CHART
Placing a single point on this cha-t is an assertion that formants have been observed at two frequencies one fOrrUlt at the frequency named along the right or left edge the other formant atmiddotthe frequency named along the top or bottom edge
ex Martin Joos~ Acoustic Phonetics (1948)
CHAPTER IV
FINDINGS
The data provided by the preceding methodology conshy
sisted of a series of scatter patterns on the vowel charts
Each of the dots within the pattern represented one occurshy
rence of a particular vowel To determine the range ofmiddot each
phoneme f the most divergent points in each pattern were con-
nected by a line These lines then circumscribe an area
which included the range of all the vowels in the sample
recognized ~y the informantmiddotas a particular phoneme
Verbal descriptions the actual charts of the phonemes
and the spectrograms utilized willbe found on the followshy
ing pages
25
The distribution for the sounds which the informant
produced and recognized as the phoneme 1 range~ on the
vowel chart in a broad scattering from 300-500 hz for forshy
mant 1 and 1500-2100 hz for formant 2
CHART II
1
lid
13
bull
~
It
iA
Ml
ztr Zit zp 1 S lIZ middot1 I a r 8 6
I
f
I I
Ii 3
[7l I I V 1 I
) ~I I i I bull
V I I i bull r J
I V t I I I I I
i tt I
Kl7 I I I iI ~
I I I I I I I I I i I
I I I i I f I ltII
I I l7 I VI
I [7 1
1 I I I Va FORMANTc7 CHART
I
I I I I 173 CaEiIw-atd icw~[7 rf ltfer C0ItdI I I
j I I I i 7 10 e centlCMta1 oct4v
I V 5miU~ bull itonI
r I f 711 t14 j I I I Ik IV
FoiUlAhT CHRT
Placing asinge point on this chart is an assertion that fortcants have been observed at two frequencies one formant at tn(l frequerlcy nameu Slong the right or eft cdampe the other formant at the frequency named along the top or bottom edge
26
l 1I I - -~
I I iI I
I
[bIs] [bIn]
lt-- -_- -1I
lt i
1 ~ i1_ -shy Ir ~ tmiddotmiddot lt
-- - - ---~--- - - - ----- --
-i -_~ ~ shyI 1
i I I
I I bullbullq_-
I ~~~-~--shyr ~~~~~ -~- I------------------------shy
-----I
[dIm] [sIh]
27
I -[blr]
i1 1 I I
i Ii I
I i I I
ii ___ -J
rmiddot I i
I 1 j
-~ ~~~ ~-~IIlIr~~~
I
1 ____~~l_~~--=~ _ ~--~~~~~~~~~- -
51 hI$ PiiB PD~ii~i
-~ - -- -- ----- ~------- - --- _-- - _ - shy [rIll) [klr]
28
1 I I I
---~S~ -~~~fi~ ~~~~~-~
~l_ middot~ ___
[klk]
I I I
r [dlk]
29
-------- --
-~- shy~--I~~
[tIll]
30
The distribution for the sounds which the informant
produced and recognized as the phoneme lEI ranged on the
vowel chart in a thin oval shaped distribution from 400-625
hz for formant 1 and from 1400-2000 hz for formant 2
CHART III
lEI
i
I
1 I
1
1middot
II~~ 5 I~ I lOa I ~--~~~I-+--+-4-+--+---+--++-+-+-+-+--r--t-t--r--t--r--1
I
I I I I
t I
4
I I 1 I ~ I I I I
I t I ~
I I ~
-r--- r--- I V~~~-r~+-+-~~~+-+-~~~~~~~--T-~-r~-r~-r~-T---T--r~
V~~~++4-~~~-4-+-+~~~~~+-~-T-rV~7
~iA~~~~~I+-~~~~~I--~~~-r~~~~~8 FORMANT HHHH~~r+~~-r~+-~+-~I~-I~~rl7V CHART
I II 11I I V9 CaZiLrww 1ft huncirccLJ
-+-f-+-II-f-+-+-+-+--+-+--+--+----+-+--+-1--t-+-1---t---t--7 rtf eye 04 ~ I 11 V pq-+-+-I~-+--i--+I-t-t--+~i-I---t--+--tr -t--t-Tj-ri~middotltJ ecentimeters 1octGy
I V 5miU~ - aemiton ~~~~I~~+-~~l~-~-T~I~~~r~
t i lt~ I I IS I I liV
FolUlAn C1LBT
Placing a single point on this chart is an assertion T hat rormants have been observed at two frequencies one formant at the frequency namfu along the right or left edge the other formant at the frequency named along the top or bottom edge
31
I I
I ~_ f __
~~~ - - ---~ _-shy
I -- shyI - _v-- _ l
i _~~E~~~~middotmiddotmiddot ~---~--~~-it--_ ~_~ 1gt_ bullbull bull -_gt-~~~ ~ bullI
P~J r_i~=~~~ ~-~~~- - -1 I -----~ -~-~ _ ---_
~~Wa~~Ji~~L ____ __ _____ _
[PEs]
I __ shy
-- --shy
~~ ~ -Qt-shy
-~=-=----
~~~7=~~ L___ __ __ ____ _ ______~
[rFm]
32
[PEt]
bull - -IIot-__
- ---~~--
[dEk]
---
33
f ~
I
) I I
I
I I
I 1 I
I I
I
1
__ -~_~i~~-yen-=-- ~~-~= --
------------------------
[dEn] [sEn]
i
~ ----shybull __ ~
[cEr)]
34
1J i i
~
--~~ ~-
~~
-~- ~ -~ ~~ ~gt-- ~- ~~
I ~IJItt- F ~ 111 i~-~_~--- ~--- - _ =-- 4e -~~~-~_-_~-- _~
bull vf middotmiddot~~tmiddotmiddotl____________________~____ j
[sEp] [bEk]
[bEl]
~ shy~~--_o-
J -~~~
~~t~-~~J~ r~~7~ _
I middot---=i---=-~_4~ __ ~~~~~___I _ _~
~g_i$fj bull - ~-~~~z~ir~~ ~~~ leal -~I_ iiIB
L_________ __~________ _____~
[lEs]
I f
I
35
- --- ---- - ---- ----------
~-------- shy
bull
j
i
[tEll][dan]
[dEp]
36
The distribution for the sounds which the informant
produced and recognized as the phoneme A range~ on the
vowel chart from 600-750 hz for formant 1 and from 1600-2300
hz for formant 2
CHART IV
A
i6
i I I
I I
I I
I I
1 0
I
I I I
I I
I I
s
It
i j I Ii i I
I I
6
~ I 1 I I I I ~
I I I V~ FORMANT ~~~~~I~1~4-+-~~~--~1-+~~I~-~-r17 CHART
~~~~~~l~~~~I~i~~~~I~+I~~lr_I~I~~~$ ~U~~~h~~ ~ I I I I I ~ 7 J eye ptI -cony
1f4-i--~--+---I----t--I-4--~1--+---+--+---+---1-~i7-to e cVltJte1 oct4v
i I I I 1 5miU~ - bull iton ~~~~~~~~~middot~~~~4-~I~I--~+~middoti i
2~ I I
F01UlANT CiLlT
Placing a single point on this chart is an assertion tnlt rorreints have bE-en obsered at two frequencies one formant at the frlquerJcy nSleU aiong he right 01 eft edge the other formant nt the frequency named along the top or bottom edge
37
I I i
-shy
I
I
I
~1iI
p~~~~==~~~~i~~~~
I I
[lAs]
_7 -~
-- -shy
L _ _ _ ____________ --- -- ----_~____J
[nAn]
--------
38
I I
------------------~----I I 11 I I
II1
flt~
I
IJ
L
i
______________________
[sAk]
f
~~ ~--r
1 shy
~~-
-- shy[sAn]
I r 1I I I
t
t
I l I
I I I
I i
I
[sAt)] [sAp]
39
~]
I
I I
[rArl][bAk]
I
-shy ---==-_____lshy___
[lAp ]
40
~----------------------------~-------------~
1 bull -l----1-shy
~middot-~-~t-=-- -
~r-shy -shy t~ III M -~ ~~---shy~t-= ~r=_ _shy
C z---=-
L______________________----- [dAs]
[dAr]
l _
41
v 1
I I
i
I
I -tc - bull ~ 1t iCSi4 _ -
-~~-r~middot- 1 ____ ~~~~ ~ ~ I
1 I ~=~j3~middot7-__ ~~
[kArl
---------------------~------
[dAin]l
I I
-I
I
42
I gt1 tmiddot
I
[bAm]
bull
~ I 1 I
gt1
-- - ___ _ N ____ ~--shy---- shy
[bAn]
43
[lAh]
==III
I Imiddot
__~_--_middotfI_~__ ~ ennee ~ S
LL-
[JAk]
--------- ---------
44
---------
I i Ir I
I I j
i
I i
~ --_ -- ~
~~fb-~~~~~~ ----- shycshy7FiIf Elii=s FUP WRmiddot 75t3~ n JIilIeia
~------------
[JAs]
-II
I J
[dAnl
45
~ I 1shy
I
iI shyi t
- - - Imiddot--- ~p -~--~= roc - I
I II i
I I I
~ middot1 I
------J
j I
I I i
i I
1_____ --- I ---------------~
[kAs]
I
I I
I t
I I i
j poundiampl d
rshyl
I i
I
1
I I I
I Il
[bAl]
I~
[bAl)]
I
47
L---------------------- --------------~
[kAp] shy
t
I-- I ~ I i
I
ji I
I -I
I 1 I 1
i
)
~~
~L~--~~---~ - ~ ~
~ -shyY- r i
I
-
1
I I
)
----~ -shy- -- _ ~ ----shy
1 I i i I I
1 I
L ~~~~-~~-~-~~~-~~-gt-= rn~ J ___fi ~ 7 7TZ r~ 5UZs=j -~ l ____-------- _____ __ _ ___________ ________ I
[kAk]
i
I t r ~
--~~ -shy
~~~c~_=--_u ce4 we
I r bull
[gAr)]
~-~ shy
- -~ -~~
~P ~-~~
I ~~
-- bull ~ I - ~~-~~
~-~~~--~ shymiddotT _i
48
-----------------------------l
I I
I I
[rAk]
~_
~ ~--- ~~~-~
j ~~ ~ ~ ~7
~ bull~~middote ri~-is~~~l-IIII-middotlIIIIn---I~-- 41~~~~~ ~
1--=-_---- - - -===--------shy
[sAil]
I
49
_- I I
I -- ----------------shy
~2~~~ ~~
i i I I ~~~~~~~~b ~-
middot_- _ ~~------
j
i ~ at -== l - -- ~-~~it I ax I C1 bullbull~~- shy
I
I i
I I
I 1 I II r I I
-r- --shy
~~-~-~- -~-
-1 l I
I I
[bAs] [PAs]
r-------------------~------------___
[pAl]
I
50
The distribution for the sounds which the informant
produced and recognized as the phoneme 0 ranged on the
vowel ~ha~t from 400-525 hz for formant 1 and from 700~1000
hz for formant 2
CHART V
0
III
t5
lot
S
6
Ie
to
Z7 Zit 9 I 1 I a I z I a 6 6
I
I ~ I
I i II I
j i bull I I
I I I i I
I ~ t
~ ~I I
f I
I ~ f A I I I
j [- V I 1 I I I II ~ I 1 I I
At I
I t I I
V V
V 7
i I Vi( FORMANT I 1 I 1 CHARTI I
I V 3 C41iotc4 ill lUjn~ 01 eycpr ~0It4
i I f I IV
I ) I V IO 6 centltcrs 1 octcv1 I I I 5miU~ -Istmi-toneI
I I VII 2 I ltQshy t 116 IV
FOlUlUfT CRBT
Placing a single point Oll this chart is ampn assertion that formants have been observed at two frequencies (me iormant at the frequency nametl ~ong the right or left edge the other tonnant at the frequency named along the top or bottom edge
Ishy
51
r--- -_-__ - --------shy
-- ~--- --shy~ -
--f -~-
[tOll][pOn]
~ ---- -11lt1 ~
~-- - -~ P---~Amiddot_
t _ __ _
1 r I
--1 i I
I
I ~~~J L____ _ 1 rshy
[dOs] [b0s]
i Imiddot
52
---------------------~---
i I r -------- --------shy
r~~middot-~ [
I V I ~~
I - shy
~~~middottdmiddot~~-~-middot~-
S~~i~~-~ ~- bmiddotmiddotmiddotL _____middot_ ~_
[bOr] [rOk]
I
1 I
i i
j
I
[dOpJ[pOl]
53
Ii --~ --~--- -~~~~--=- I r
~ ~- ~ - ~ - shyI - -~ ~~ -~~ I
-1bullbull - h ~~~
~~~ ~ ~~~~----- ~~-~~~-~- ~--~~~~L- ~bullbull
I middot~-~middotdf r scr ~~~~~
~-laquo~~-==~~~-~~--~~~~ ~~
I
[lOs]
I
I
r I
i 1
i 1
I I J_____~ __ _-_M___J
[bOn]
54
i -~----
I I I r r
~-~ -shy
[bOn][sOp]
jI ----II I J
i
I I I
I I I i
I~~~==it shy
[jOk][tQr)]
55
1 I
I
II I I I
I c ~~~~~~~~ ~~OOWJI~~=U
[lOh]
i I
I
I ~~~-
I ~- -- shyl - _- ~ shy
I ~n=~~-~middot ~FlR T =Iti 1amp11 dill_
__-J
[pOt]
__J pOs]
1
- =xu
[bOk]
I
56
The distribution for the sounds which the informant
produced and recognized as the phoneme lUI range~ on the
vowel
hz for foimant
chart in an
1
almost square-like pattern from
and from 700-1000 hz for formant
250-350
2
CHART VI
lui fIG
3
t
ts
~
la
Il
IT zt 20 IS
I I
I I
i j
I
I j
I I
I
I I I
I t I I I1
I J I I I
~ i I LJ J I~
I
I
I
la -I
10
I
I I I 1
t I I i
I
I
I I
I
I I I
I ~ 1 v I)
V V
qV
FOlUfANT atRT lt
8 6
I t lt
~
I
l --~ I--- ~I I
i
I I
I I I i ltiI I
I i ~
I t
V
V V l( FORMANT I V CHART V
V Caiote4 iramp 1umb_ ef cycipampf on4
6 CelItlmctcrs bull octclv SmiUitoctamprs -I a~i-tonl
PlaciDg a single point on this chart is an assertion that formants have been observed at two frequencies one formant at the frequency named along ~he right or eft ede the other fonnant at the frequency named along the top or bottom edge
I
57
I
I
I -I
I
j _-
~~ -
-
bull I -
[dUp]
t I ~
~
I middot1
f
IshyIj II
I i
-------=shyI ~~-- -
L ~~-=-r--~~-III--=---
58
i middot1 I
I
i j I Imiddot
I~1 middotU~ _ s
I ~~~~~_-_-~--~ --_ I
L~ __________~_____________~ [CUll]
I
I
[dUr]
I
I J
I
I I
II
1
-yen ~ L___________ ~__ ~=~
I [kUs][pUn]
59
I
I
i L ~ -----------~-
____---shy______---2
~~~ -~ _
j ~---
I~~~-~-~ ~~ ~~
[nUn] [lUp]
I 1
~-=-~ ~~ -
[rlhn]
I
60
l
- _ ~~-----
~~~~~ JlCIIPrl fue rm ad I II
L ~ [gUI)] [kUk]
e_
__ ~ e-
~-d~~~~
[lUs] [jUs]
61
shy
I
Iii lEI and A Compa~ed
In comparing the distributions of the vowels III lEI
and IA( cf Chart VII on p 62 it is evident from the plots
that the front-back tongue position is for all practical
purposes identical ie the core distribution for all
three phonemes ranges between 1600-2000 hz This demonshy
strates conclusively that the significant phonetic differshy
ence is tongue h~igth ie t~e position of formant 1
The fact of phonemi~overlap is illustrated by the
crosshatching on Chart VII The cross-hatched area represhy
sents a r~nge of phonetic quality that is identified in one
instance as an III and in another instance as an IE or in
one instance as an lEI and in another instance as an IA
bullbullbull the sounds which follow one another in a changing sequence constitute the signals of speech and these sounds are produced by movements of the vocal apparashytus i e by movements of the lips tongue throat lungs and so on It is therefore important to understand that these vocal movements caused by the various muscles involved tend to slur into one anothshyer Since each variation of movement gives a varishyation in sound the slurring of movements produces a slurring of sounds Furthermore since specific sound will have different slurs of moveme~t depend~ ing upon the movement which it precedes or folloItJs each sound type resul tant from the productive moveshyments will vary somewhat according to the sounds which it precedes or follows (Pike 1947)
In line with this the next logical step would be to
look for environmental influences which would enable a listshy
ener to determine which phoneme was represented when phones
were recorded in the overlap area
62
CHART VII
lIlt lEI and A Compared
~ 2[7
t5
lot
5
ft
fA
Ie
Zit I zp 16 I a la 8 6
t I
~
II V I I I I +
r l~ ~ ~ I
I I ~ ~ V I I 1shy fZ I I t s
) I I j I I I
i ~ I 1 1 I I _lgt
V ~R R-r--~ I V
ItV l(
I I---I-
V~ j shy ~
I I I I FORMANTI I
I I VV CHARTI II I V S CaliL-tcd I Uut
I I I l of fIelc F- 0114
I I I I I j i I 10 ecentImeters 1oct4v
I
I ~ V Smillimctus Iumrton_ j VII
2f1 2~ 16 ltv
FOlUlANT ClIABl
Placing single point on this chart is an assertion that io-rnants have been observed at wo frequencies one formant at the frequency named ~ong the right or left edge the other formant at the frequency named along the top or bottom edge
63
A fairly thorough study of the positions of various
vowel sounds in specific environments did not indicate any
consistent variations of a particular type For example
the vowel in dim is in the lower range for the vowelIII
but the EI in dem is in the upper range -of the vowel lEI
Thus it seems probable that those sounds in the overlap area
are qualities for which minimal contrasts do not exist For
example the II in sih is in the overlap area but appar-middot
ently is clearly recognizable by a native sp~aker because
there is no seh at least no such word was known to the
informaht nor could one be found in the dictionary (Echols
and Shadily 1968)
IU and 0 Compared
In contrast with the front vowels III IE and IAI
the back vowels Iu and 0 have aconsiderable gap plusmn50
hz between the1r two distributions cf Chart VIII on
p 64 The distributions appear directly above one another
on the chart In comparing the two ranges it is appa~ent
that the front-ba~k position formant 1 is identical ie
the core distribution for the phoneme ranges from 700-1000
hz This demonstrates that ~he position of formant 1 ie
tongue height is the significant phonetic difference
64
CHART VI I I
U and 0 Compared
I I
i
5
~
5
6
til
~
2[1
I
Zit zp 15 IZ la a 6
~ I -~
1 ~ ~ ~
~
I V 1
V
I V ~
JIll ~
I I 1 6
1 middotV V l(
vI( FORMANT CHART
9 CalLOt-ctc4 ift 1awuutb of cyc14 p ICCOftI
I~ I V 6 eentllMtcrs 1 octo
I V 5mmi~ - ampImitenI VII
214 I 210 16 IV FOlUfANT CE1ART
PJaciDc a single point on this chart is an assertion that formants have been observed at two frequencies one form3nt at the frequency named along the right or left edge the other formant at the frequency named along the top or bottom edge
middotr I
65
II lEI IAI lUI and 101 Compared
In comparing all three phonemes in their respective
poJition on the vowel chart cf Chart IX an p 66 there I
se~ms to be no problem identifying between front and back
vowels There is a gap of approximately 400 hz between
th$ two back vowels and the three front vowels in terms of I
fotment 2 Also it would appear that there would be no
pr~blem in identifying specific vowel qualities so far as
fOfmant position is concerned for vowels in stressed position
with the exception of the phonemic overlapping discussed in
a preceding section ie III-lEI and IE-A
I
I
Imiddot I
CHART IX
I 1 E IA U and 0 Compared I
iM zr Ztt ap J 6 I Z 10 S 6
I I f ts I
~
tj1- ~
rL ~ ~
J 4- 1 ~ ~ i~ ~ V
Ii ~W~ V I ~~ ~ J
V I ~ ~
IS I ~ V 5 1 t
~
s ~ I I f
V R ~ r-~ I V
if~ V ~ ~
-- V 7
~ -~ [a ti I l( FORMANT
V CHART
V 0 cyclu on4 S CaULntte4 ilt hWldr_
I
Kl I jmiddotV I j V 10 6 centlrMtcll1 oct4v
V 5llIil(lCtampn ~ hl4Imiton
Vii 2~ zkgt 116 I IIyen
I
Forw~ CllABT I
Placing a single point on this chart is an assertion that formants have been observed I at two frequencies one formant at the frequency named along the rignt or left edgeI
the other formant at the frequency named along the top or bottom edge
~ ~ bull -
66
I
I I j
Cbull
I I
i
CHAPTER V I SUMMARY AND CONCLUSIONI
I As is shown on Chart IX on p 66 there appears to I I
bela very discernable distribution for each of the vowel I
Phtnemes of Bahasa Indonesia This does not mean that the
ci cumscriptions of each of the various sounds indicate I
detinite border lines for each vowel Rather it shows i
th~ position o~ each vowel in relation to the other vowel
phbnemes The vowel charts show the position of the phonemes
i asl produceq by one native speaker of the language Thus
nJ conclusions can and should ~e made regarding the definite
oJter boundaries of the ranges of middotp~onemes As is implied I
b~ the term ranges the phonemes have no defined boundarshy
I i~s
i Bahasa Indonesia does not appear to have two front I
v~wels two back vowels and one central vowel as is implied
i+I
the traditional symbolization Rather it has three i
ftont vowels with a three-way contrast between high mid I
i a~d low and a two-way contrast of high vs mid in the back
a1ea of~he articulation chart If a traditional symbolshy
i~ation of the vowel phonemes of the language were now to
b~ dawn it would look like the following chart I I I
68
front central back
high
mid
low
I
U
E 0
A
Thus as has been demonstrated the impressionistic
sion of the vowel system was in error with regards to
central phoneme of the language investigated There
a ears to be no low-central phoneme in the language
r it is a low-front one Although the spectrograph
c nnot establish a phonemic system of a language on its
o n it can provide a yes or no answer about the phoneshy
t c qualities of the phonemes in question After a phoneshy
m c system has been established the spectrograph can proshy
v de phonetic data which distinguishes one phoneme from
a other
BIBLIOGRAPHY
Sources Cited
Almiddotsjahbana Takdir The Indonesian Language - By-product of Nationalism Pacific Affairs XXII (1949)388-92
Am rican University Area Handbook for Indonesia Washingshyton DC ~S Government Printing Office 1970
Blch B and G Trager Outline of Linguistic Analysis Baltimore Waverly Press 1942
Du n H K Calculation of vowel resonances Journal of the Acoustic Society of America XXII (1950) 740-53
ols John M and Hassan Shadily An Indonesian-Enqlish Dictionary Ithaca Cornell University Press 1963
ner C Reserches sur la structure des voyelles orashyles Archives Neerlander Phonetic Experiments XX (1947) 40-77
obson Roman C Gunnar Fant and Morris Halle Prelimshyinaries of Speech Analysis Cambridge MIT Press shy1961
J s Martin Acoustic Phonetics Baltimore Linguistic Society of America 1948
L defoged Peter Three Areas of Experimental Phonetics London Oxford University Press 1967
P Mario Glossary of Linguistic Terminology New York Columbia University Press 1966
Perce Joe E The Spectrographic Study ~f Vocalic Nuclei Language Learning XII (1963) 241-247
- --- Phonemic Theory and the Analysis of English Syllashybic Nuclei Linguistics XVII (1965) 36-57
P ke Kenneth L Phonemics Ann Arbor University of Michigan Press 1947
70
Pi e t Kenneth L Phonetics Ann Arbor University of Michigan Press t 1943
Pu gram Ernst Introduction to the Spectrography of Speech New York Dover Publications 1966
ir Edward Language An Introduction to the Study of Speech New York Harcourt Brace amp Co 1921
enbeck E M Indonesia and Malaysia 1I Current Trends in Linguistics IIX (1967) 55-111
dman Dorothy The Republic of Indonesia New York N Y Philosophical LibrarYt Inc 1955
Sources Consulted
r e j e v N D bull Some ProbIem s 0 f Baha s a In don e s i a Ph a nshyology Studia Linguistica XI (~1957) 44-46
lingmiddotC L Linguistic Units The Hague~ Mouton amp Co 1960
J obson t R Hague
and M Halle Mouton amp Co
Fundamentals 1956
of Language The
K nedy Raymond Bibliography of Indonesian Peoples and Cultures New Haven Yale University Press 1962
Perce Joe E Spectrographic Study of English Vowels Under Primary Stress Linguistics LXXXIV (1-972) 41-84
P ttert Ralph K George A Kopp and Harriet C Green Visible Speech New York Dover Publications t 1966
T euw A Critical Survey of Studies on Malay and Bahasa Indonesia The Hague Martinus Nyhoff 1961
-basin
-head of an area
-form of address
-ball bag
-bell
ba --bank I
bUr --you I
bi --beer
bomiddot--drill I
ba--bliJss
bi --bus i
I t
bo I
--bunch bun~le i I
ba--crossbeam
--bomb
--tire
--son of
--ration coupon bond
--garbage dump
--checkered design
--inch
--and plus
APPENDIX A
LIST OF WORDS
den~-abbrev of the title raden
dar--olace location
dur--pearl
das--a shot
dos--small box
dek--deck
dik--younger sibling
dep--to b~ shelved
dop--hubcap
dup-~to be baptized
djak--jug
djok--seat
djas--coat
djus--part of the Koran
gang--paBsageway hall
gung--gong
kak--form of address for elder
kik--handloom
kuk--collar harness
kar--map
kir--jo test
kas ~money supply i
kus -to hiss spit I
lahi-alreadY
loh-writing tablet
lapi -towel I
lup -magnifving glass or
last -IrJeld i oint
lesl -lessonI
lOs -shed I
I I
-to iron
-which who
nu -yonder
po
pa --pole
pa --to fit
pe --plague I
po --mail I
pel --cap
pOI --pot
--pound
--also
r --shelf
--shirt
g-o-rank position
g--ring
--brake
rum--cream
sah--valid legal
sih--an enclitic usedmiddotto soften what follows
san--form of address far sargeant
sen--cent
sang--superior
seng--zinc
sap--line row
sep--chief boss
sop--soup
sjak--suspicion doubt
sjok--attractive
tang--tongs pincer~
ting--sweet meat
tong--barrel vatmiddot
teh--tea
toh--yet nevertheless
tjeng--molasses
tjung--young boy
III 1
APPENDIX E
LINGUISTIC SYMBOLIZATION USED
IAI~high-front-openIi
II
~ r
E~-mid-front-~pen
III
AA-low-front-op~n t1
o1-mid-back-open
Uf-high~baCk-close III
I III
~~~vd bilabial stop
[dj~vd alveolar stop l
I I
[kt-Vl velar stop I
[g I-vd bull velar stop
[1 -lateral I
(n-vd alveolar nasal 1
(m~-vd bilabial nasal
~I-Vd velar nasal
I
III ~IJ
I
q
dl
I
Iil~
I
Vowels
Consonants
[p]-vl bilabial stop shy
[t]-vl alveolar stop
[rJ-vd alveolar flap
[jJ-vd palatal affricate
[CJ-vl palatal affricate
[S]~vl bull alveolar affricatmiddote
[s]-vl alveolar middotfricative
h]- vI velar aspirant
3
sory language uied in schools from elementary and up
Bahasa Indonesia became the official national language
when the Republic of Indonesia was farmed in 1945
Justification For Study
Phonemic descriptions of Bahasa Indonesia are almost
non-existent and very limited f from a linguistic point of
view Most descriptions of the sounds of Indonesian are
of a comparative nature i e Bahasa Indonesian sounds are
likened to sounds of modern Indo-European languages Echols
and Shadilys An Indonesian-English Dictionary describes
Indonesian sounds in relation to the similar sounds in
English For instance they argue that the e in the Indoshy
nesian word sen is like the e in the English word make n
only shorter Statements such as the aforementionedmay
be practical for most purposes but are not necessarily
linguistically sound and almost certainly inaccurate
Another deficiency which seems to be present in phonshy
emic analyses not only in Indonesian is the impressionistic
nature of these analyses When dealing with a lang~ag8
the linguist must attempt to remove all linguistic biases
and comparisons because phonetic details may escape the
ear of the analyst f especially in a foreign language upon
which he is likely to impose depending upon the degree of
his skill any of the few prejudices of his native phonemic
scale (Pulgram 1965) Even when the investigator does nat
4
I
rely on comparative methods of description he cannot compshy
letely remove all the sounds in his linguistic memory when
describing a new language He will invariably hear sounds
that are very similar to those he knows and may not be able
to discern certain minor although perhaps crucial differshy
ences Phonemic descriptions are most often of this impresshy
sionistic variety
Spectrographic analyses of the sounds of a language
provide an objective measure of the quality of the sounds
of a language Spectrographs record precise sound qualities
produced by a speaker particuiarly vowels This mode of
description will delete the impressions of the investigator
and will map precise quality for sounds in question what
shows on a spectrogram is an acous~ic reality whether the
analyst hears it or not (Pulgram 1965) It is these
precise sound qualities of Bahasa Iridonesian vowel phonemes
that this investigation will attempt to ascertain Instrushy
mentaltesting of hypotheses has been a part of scientific
study for many years but very little has been done to
date in linguistics (Pierce 1963) The acoustic specshy
trograph can provide definite answers as to the phonetic
quality of vowels
The science of phonemics developed out of the realizashy
tion that some phoneti6 features of a language differentiate
one word from another while others do not Edward Sapir
(1921) argues
5
Back of the purely objective system of sounds that is peculiar to a language and which can be arrived at only by a painstaking phonetic analysis there is -a more restricted inner or ideal system which perhaps equally unconscious as a system to the naive speaker can far more readily than the other be brought to his consciousness as a finished pattern a psychological mechanism The inner sound system overlaid though it may be by the mechanical or the irrelevant is a real important principle in the life of a language
Once it was accepted that language had a definite phonologshy
ical structure a method was devised to describe this undershy
lying system This method became the science of phonemics
The phonemic structure of a language represents the minimal
number of sound signals which make transmission of informashy
tion possible Spectrographic analyses of t~ese minimal
sound signals provide objective and empirical measurements
of the quality of these minimal sound features
Statement of the Problem
This investigation will determine the range of free
variation of Bahasa Indonesian vowel phonemes in a given
phonemic environment and types of conditioned variation
from one environment to another The nature and ra~ge of
the vowel quality for each phoneme will be determined by
spectrographic measurements
Delimitations of the Study
This study will only deal with Bahasa Indonesian
vowels sounds produced with vibration of the vocal cords
6
by unobstructed passage of air through the oral cavity
and not constricted enough to cause audible friction
Pei 1966) They will be the vowels found in monoshy
syllabic Indonesian wo~ds under primary stress and in a
consonant~vowel-cDnsonant pattern Each word will also
be part of a minimal pair ie every word must be conshy
trasted with another word in which only the medial vowel
is different andto which a different semantic meaning is
attached
CHAPTER II
THEORETICAL BACKGROUND
PhoneticsPhonemics
Phonetics is the branch of linguistics which deals
with the actual speech sounds of a language When dealing
with the phonetic level of linguistic analysis one describes
the sounds of a language in terms of articulation or acoustic
features In articulatory phonetics one describes sounds
in middotterms 9f manner of articulation ie whether it is a
stop fricat~ve etc point of articulation ie) bilabial
(be~ween the lips) dental etc or vowel quality ie
high-front-close (the highest part of the tongue-is very
high in the front of the mouth for producing this particular
sound) etc In acoustic phonetics sounds are described in
terms of the distributions of frequencies characteristic of
the sounds of a language The relationship generally acshy
cepted as existing between artic~latory and ~coustic phonetshy
ics is that certain articulations produce certain distinctive
patterns of frequency distributions It must be emphasized
at this point that both of the aforementioned types of deshy
scriptians deal with all human speech sounds not necessarily
those which perform a signalling function in a particular I
aspect of the language
I I
f
8
Distinctlve features are used to denote signalling
functions The label distinctive feature is used in the
literature to mean two quite different things Bloomfield
describes the categorization with examples which imply
that distinctive sound feature means any feature of the vocal
sound which when changed changes the meaning of a given
word eg pill and bill sin and sing etcri (Pierce 1965)
There Bloomfi~ld labels p as a distinctive sound feature
and b as a different sound feature Later Roman Jakobson
Gunnar M Fant and Morris Halle in their Preliminaries of
sectpeech Analysis take the phonemes of a language and break
them down into their component phonetic features some of
which are distinctive eg voicing in English b vs p
while others are not eg aspiration in English p~ in pin
as opposed to p in spin Anyone language code has a
finite set of distinctive features bullbullbull (Jakobson Fant and
Halle 1961) In English the feature of voicing in the b
of bill as opposed to the absence of voicing for the p
in pill is the phonetic feature which distinguishes these
two sounds A similar presence vs absence of aspiration
does not alter the meaning of any English utterance in fact
it is difficult to make English speakers aware of the fact
that aspiration is or is not present Implicit in this
theoretical approach is the concept that the variation in
human speech for the most part re~resents presence vs
9
1
absence of non-distinctive features of sound
One theoretical approach to linguistic structures
views the phoneme as concurrent bundles of distinctive
features (Jakobson Fant and Halle 1961) Each language
has a finite set of rules for grouping them (distinctive
features) into phQnemes (Jakobson Fant and Halle 1961)
Every phoneme in the language then is composed of a unique
set of distinctive features such that it is different from
any other phoneme by at least one of such distinctive feashy
tures This manner of linguistic signalling has important
implicat~ons toward phonemic analysis of sound systems As
previously mentioned a phoneme is a bundle of distinctive
features which when altered changes meaning In order
to verify whether a sound is a phoneme or not one must
show a word in which the replacement of at least one disti~c-
tive feature makes another word ie a minimal pair difshy
ferentiated by only a single distinctive feature and having
two distinct grammatical or semantical meanings
Phonemics the study of phonem~s is the level of lingushy
istic analysis which answers the question of how language
utilizes sound matter selecting certain of its elements and
adapting them for various ends The prima~y functions of
sound in a language is to distinguish one utterance from anshy
other in normal conversation Phonemic analysis as an opshy
eration examines a~ailable data in order to discover an unshy
derlying structure bullbullbull not an operation which forces a mass
1 0
of data into a structure (Pulgram 19~5) The nature of
each feature is of the essence Thus the composition of
each phoneme becomes of primary importance in a language
The phoneme can only be defined in reference to the larger
frame whi~h is the language of which it is a structured
feature (Pulgram 1965) It is the shortest stretch of
sound which serves a signalling function
Acoustic Theory
I Distinctive feature theory as previously describedI I seems to handle such phonemes s stops fricatives and
I nasals quite well eg the airflow out of the mouth is I
either stopped or it is allowed to escape On the other
1 hand vowels seem to be ranges of phonetic quality whichI
are extremely difficult if not impossible to distinguish
in terms of presence vs ab~~nce of distinctive features
Since this study will not be concerned with consonants but
only w~th vowels it is only necessary to discuss the acousshy
tic nature of vowel qualities from this point on
FundamentalsHarmonics
Vowel quality is determined by a combination of a fundashy
mental and its harmonics A vowel quality displayed on an
oscilloscope shows a very complex single wave form This
wave form is in reality the mathematical sum of a number
of simple wave forms or at least for theoretical purposes
1 1
can be treated as such These wave forms are generated
in the oral tract by the opening and closing of the glotshy
tis The fundamental wave is a sine wave with a frequency
equal to the number of times the glottis opens and closes
each second and an amplitude which is directly pro~ortion-
al to air pressure in the lungs Because of the nature
of sound waves a harmonic is generated at every multiple
of this fundamental eg if the fundamental is 100 cycles
per second then a harmonic is generated at 200 300
400 bullbullbull CO As soon as the complex wave leaves the vocal
chords harmoni6s are filtered out by the nature of the
tissue surrounding the oral tract as well as the cavities
in and adj o 1ning the oral tract The complex wave emerging
from the mouth is the mathematical sum of fundamental and
the harmonics which have not been filtered out by the oral
tract cf Martin Joos Acoustic Phonetics (1 948) chapshy
ters 1 and 2 for a fuller explanation of this process
Acoustics vs Articulation
In the last century far too much energy has b~en exshy
pended in attempts to relate acoustic features to specific
articulatory movements Bloch (1942) illustrates this by
stating qualities are identified by ear but in linguisshy
tic works they are traditionally defined in terms of their
assumed production by the vocal organs This type ofmiddotstudy
is misdirected because the only things that impinge on the
I I
- I
12
human ear are the harmonics which were not filtered out
The articulatory movements which cause the filtration ie
movement of the tongue from front to back creating a series
of filters each of which removes different harmonics
from the complex waves are irrelevant Pike (1943) argues
one should analyze and describe the sounds (or sound waves)
themselves rather than the movements ~roducing them
It has long been noted by acousticians that a variety
of articulatory movements remove the same harmonics and
r~sult in the production of very similar sounds Pierce
(1962) illustrates this by saying
As long as the formants are in their praper positions ie the proper frequencies are passed through the speech mechanism it does not matter whether the unwanted frequencies are filtered out by rounding the lips or moving the tongue to the back ThuQ when Holbrook and Carmody give one front-back position for the tongue for a given English vowel and IPA (International Pho~etic Alphabet) gives another it is quite probable that both are completely correct and that the formant shift is made by compensating for the lack of tongue movement in the speech of some speakers by additional lip rounding bullbullbullbull
Since the hearer of a stream of speech can hear 9nly those harmonics which emerge from the mouth as componshyents of the final complex wave the placement of the formant is of primary importance not the articulation which produced the sound
Therefore a study of the phonetic quality of vowels
demands an instrument which is capable of making an accurate
record of the presence or absence of all the harmonics
having sufficient amplitude to significantly alter the final
wave form The acoustic spectrograph is such an instrument
13
it was the first instrument to make large scale acoustic
a n a ly s e sapr act i c a I po s sibiIi t Y n ( Lad e fog ed 1 967 ) bull
Spectrograph
The acoustic spectrograph is a device ~hich records a
stream of speech 2~4 seconds or less in length This
recording is then fed into the analyzing part of the specshy
trograph where at each successive playing ne frequency
or rather one frequency band is lifted outof the total by
the variable filter (Pulgram 1965) A black ma~king is
made on a piece ofmiddot electro-sensitive paper each time there
is a harmonic present within the frequency band being anashy
lyzed Since the articulators are constantly moving and
changing the filtration characteristics of thevocal tract
the black markings ma~e by a stylus reflect the movements
of the articula~ors in a very broad sense More important
however it makes a precise record of the stimulus ie
the harmonics which reach the ear of the listener Dunn
(1950) says the vowels have asso~iated with them different
frequency regions in which the sound is more intense than
elsewhere in the spectrum The name formant has been apshy
plied to these regions
The next problem then is to relate the concentrations
of power mentioned above ie the formants to human pershy
ception of speech sounds The most widely utilized techshy
nique in this area is one devised by Martin Joos (1948)
~______________________________________~S___________________________________________________shy1
14
generally referred to as his 2 Formant Theory This techshy
nique represents the plotting of formant 1 and formant 2
in a specific wayan a particular chart cf Chart 1 on
p~ 23 This technique is clearly described by Ladefoged
(1967)
The relations between the formant structures of the vowels in a number of words can be conveniently represented by means of formant charts which show the frequency of the firs~ formant at a time in the word when the formant structure is changing at a minimum rate plotted against the frequency of the second formant at the same time
When making these kinds of plots a charting is derived of
vowels for any language which is remarkably like the tradishy
tional impressionistic vowel charts of the 19th century
Esner (1947) illustrated that if the frequency of the first
formant was plotted against the frequency of the second
formant it seemed to equal the relation between formant
frequency and the traditional vowel diagram
Basically this study will reproduce such vowel charts
for a number of examples of each sound in Bahasa Indonesia
Formant 1 will be platted against formant 2 for each vowel
phoneme in a variety of phonemic environments -The purpose
of this will be to determine the range of variation for
every vowel in each e~vironment as produced by a single native
speaker
CHAPTER III
METHODOLOGY
Phoneme Identification
In order to assess the phonetic quality of vowel phoshy
nemes one must first ascertain the number and relationshy
ship of sound contrasts in a language ie the phonemes
The visual representation of the actualization of the phoshy
neme ie the spectrogram can only be made on the basis
of a preceding decision of the linguist on the types and
number of phonemes in the l~nguage to be anaiyzed (Pulgram
1965)~ Phonemic analysis cannot be made with phonetic
data alone it must be made with phonetic data plus a sershy
ies of phonemic premises and procedures (Pike 1947) A
spectrogram conveys phonetic information which aids the
linguist in determining which phonetic features are consisshy
tently present in order to reach the most accurate phonetic
description
There are a variety of premises and procedures which
the investigator may utilize in order to discover the phoshy
nemic structure of a language Pike (1947) argues that the
investigator must have at hand observable native reaction
to native sounds andor know structural facts pertaining to
the phonetic nature of the sounds and their distribution
As stated before a phoneme is a bundle of sound f~atures
1
j
16
which when substituted for another bundle creates a difshy
ference in meaning Since the creation of a different morshy
pheme is the result of the substitution of a different sound
feature these sound features are said to be phonemes
A pair of words in which the first word is the same as the second except for the fact that one segment is replaced by a different but phonetic~lly similar segment in the second word constitutes proof that the two similar segments are phonemically distinct~ bullbullbull Word pairs of this type are said to be MINIMALshyLY DIFFERENJ because no smaller difference in the language can make a differ~nce in meahing in words (Pike 1947)
Hence minimal pairs of words were used to find phonemes
Minimal~y different word pairs prove to be the beginners
single most important tool for the analysis of phonemic difshy
ferences (Pike 1947)
Thus Echols and Shadilys An Indonesian-English Dicshy
tionarv (1968) was ut~lized to find three-phoneme words
containing two consonant sounds with a vowel in medial poshy
sition The process was simply to go through all the words
beginning with consonants and find minimally different t~ree
phoneme words This was done on a purely anthr~poscopic
basis on the part of the investigator If a different letshy
ter was employed to distinguish a different meaning it was
assumed to be a different phoneme The following ~ord pairs
and their meanings are examples of the words found in the
dictionary
ban--tire bin--son of
das-- a shot dos--small box carton
I
1 7
pal--pole pel--field
rang--rank position ring--ring
teh--tea toh--yet nevertheless
After having obtained the words from the dictionary
a native informant was called upon to verify ~he differshy
ance in meaning in the minimal pairs and to pronounce
them so that ~hey could be phonetically transcribed in
al1 impressionistic manner The informant employed was Kok
Djen Su a student at Portland State University from Yogshy
jakartai Indonesia He has been a student in the United
States for approximately two years and speaks broken al shy
though very understandable English Mr Su was horn to Mr
and Mrs Su Hendry Su who both speak Bahasa Indonesia Jashy
vanese and a small amount of Chinese Since his birth the
informant was exposed to a mixture of Javanese and Bahasa
Indonesia but has employed the national language of Indoshy
nesia since the age of three at school His bilingual upshy
bringing it seems to the author does not craate a subshy
stantial difference in the competence of Mr Su in Bahasa
Indonesia In fact he was able to distinguish the proshy
nunciation Qf words in both Javanese and in Bahasa Indoshy
nesia The utilization of one informant deletes any reshy
gional variation or individual variation between informshy
ants Since here we are attempting to ascertain the relashy
tive range of phonetic quality of vowel phonemes in Bahashy
sa Indonesia the informants bilingualism ahould cause
none or very few phonetic distortions
After-having verified the difference in meaning of
the word pairs Kok Djen ~u pronounced the word The
following impressionistic version of the Ihdonesian voshy
wel system was described
front central back
high
mid 1 I
I I low j
i I I
I
u-
E 0
A
1 Spectrograms
The phonemic entities symbolized in the preceding
section represent range-units of phonetic quality The
symbols and their position on the chart are based on the
aural perceptions of the investigator The purpose of the
spectrographic analysis of this data is to determine as
accurately as possible the actual phonetic range represenshy
ted by each of thephonemic symbols
I
i
1 9
In order to make spectrograms from which meani~gful
conclusions can be drawn one must have a native informant
of the language to be studied Spectrograms were made of
the speech of Mr Su the informant described earlier
In order to conserve the time of the informant a
sample of three-phoneme words were recorded The three-
phoneme words begin and end with consonants ahd contain a
vowel in medial position The list appears in Appendix A
The list of words was specifically selec~ed to eliminate
in so far as possible all variatiqn other than that which
is specifically caused by the preceding and following consoshy
nants This is true because by utilizing a single informant
the influence of dialects both regional and social are eshy
liminated and by utilizing one sy~lable words under primary
1stress sequential influences such as the Markov Process
are eliminated since there is no sequence beyond one phoshy
neme preceding and following the vowel This being the case
one should be able to derive from a series of spectrograms
of those vowels both the range of free variation and the
specific influence of each particular consonant on the voshy
weI quality of each medial phoneme
The n~xt st~p in the procedure was to play the tape-
recordings into the spectrograph two or three wo~ds at a
1The Markoy Process is a mechanical way of handling enshytropy in sequential operations IQ linguistics this is stashyted in terms ofthe probability of the occurrence of a parshyticular phoneme morpheme etc in a precise sequence
20
time The machine can handle 24 seconds of speech on one
spectrogram thus two or three words could be analyzed at
the same time as one with no loss in quality or precision
Unfortunately the recordings had to be played into a
microphone which picks up some background noise but by
placing the microp~one of the spectrograph very close to
the loudspeaker of the tape recorder and turning the volume
up slightly this background was eliminated for all pracshy
tical purposes middotIt would have been better to have had a
direct connection between the recordar and the spectrograph
but unfortunately no such devce was available Background
noise shows up as very small specks scattered more or less
at random and unless the volume of such noise is exceedshy
ingly strong does not interfere with the reading of the
spectrograms
Once the machine had completed the analys~s and produced
the graphic record of the list of words a frequency measur~
ing device was produced by the machine cf example below
1 11amp II~ill c=
- n- HE to
11r -shy
bull b mmiddot 1 bull bull L
-
gIl F Jamp u
n _ If
bull III
21
This measuring device is in reality a spectrogram with horishy
zontal markings The first line on the chart represents a
frequency of 0 hertz (hz) Each line above the first repshy
resents a multiple of 500 hz The device is used to locate
th~ center of formants 1 and 2 Since it is graduated in
500 hz it is necessary to interpolate when the center ofmiddot
power for a particular formant falls between two of these
lines This is done by dividing the area between the two
lines in half then dividing one of the halves in half which
gives a range of 125 hz within which the measurement falls
and an estimate is made of the precise measurement within
the 125 hz range This should give formant positions with
an accuraci of greater than plusmn25 hz
When visual location of the formant centers becprnes
difficult a section of the formant can be made cf exshy
ample below Such difficulties with visual location usually
arise when two weak formants overlap Such overlapping
produc~s what appears to the naked eye to be a band of modeshy
rately dark grey bands The sectioner is a built in mech-
IshyfL__---
tete we tt
~
I
1 I
22
anism capable of handling such problems In the preceding
I example the amplitude of each harmonic is proportional
to the length of the line representing that harmonic I
This makes it possible to locate formant centers when vi-
I sual location is difficult
The measurements were then transferred to formant
charts cf Chart 1 on the following page
6
23
CHART I
~
t
1+
t5
1amp
Ie
z~ 2t 2p 16 12 la 8 Iii
I ~
~
I S
l I
I I
~
V V
V T
l( FORMANT V CHART
Vi ~ CcdiOrate4 ift luutdnM I V ~ cycle ~ concf
V 10 eeentl~rsI~ V
V U 5millimctcrs - I $milton
2 zk2 lis ty
I
FOlWAlfT CHART
Placing a single point on this cha-t is an assertion that formants have been observed at two frequencies one fOrrUlt at the frequency named along the right or left edge the other formant atmiddotthe frequency named along the top or bottom edge
ex Martin Joos~ Acoustic Phonetics (1948)
CHAPTER IV
FINDINGS
The data provided by the preceding methodology conshy
sisted of a series of scatter patterns on the vowel charts
Each of the dots within the pattern represented one occurshy
rence of a particular vowel To determine the range ofmiddot each
phoneme f the most divergent points in each pattern were con-
nected by a line These lines then circumscribe an area
which included the range of all the vowels in the sample
recognized ~y the informantmiddotas a particular phoneme
Verbal descriptions the actual charts of the phonemes
and the spectrograms utilized willbe found on the followshy
ing pages
25
The distribution for the sounds which the informant
produced and recognized as the phoneme 1 range~ on the
vowel chart in a broad scattering from 300-500 hz for forshy
mant 1 and 1500-2100 hz for formant 2
CHART II
1
lid
13
bull
~
It
iA
Ml
ztr Zit zp 1 S lIZ middot1 I a r 8 6
I
f
I I
Ii 3
[7l I I V 1 I
) ~I I i I bull
V I I i bull r J
I V t I I I I I
i tt I
Kl7 I I I iI ~
I I I I I I I I I i I
I I I i I f I ltII
I I l7 I VI
I [7 1
1 I I I Va FORMANTc7 CHART
I
I I I I 173 CaEiIw-atd icw~[7 rf ltfer C0ItdI I I
j I I I i 7 10 e centlCMta1 oct4v
I V 5miU~ bull itonI
r I f 711 t14 j I I I Ik IV
FoiUlAhT CHRT
Placing asinge point on this chart is an assertion that fortcants have been observed at two frequencies one formant at tn(l frequerlcy nameu Slong the right or eft cdampe the other formant at the frequency named along the top or bottom edge
26
l 1I I - -~
I I iI I
I
[bIs] [bIn]
lt-- -_- -1I
lt i
1 ~ i1_ -shy Ir ~ tmiddotmiddot lt
-- - - ---~--- - - - ----- --
-i -_~ ~ shyI 1
i I I
I I bullbullq_-
I ~~~-~--shyr ~~~~~ -~- I------------------------shy
-----I
[dIm] [sIh]
27
I -[blr]
i1 1 I I
i Ii I
I i I I
ii ___ -J
rmiddot I i
I 1 j
-~ ~~~ ~-~IIlIr~~~
I
1 ____~~l_~~--=~ _ ~--~~~~~~~~~- -
51 hI$ PiiB PD~ii~i
-~ - -- -- ----- ~------- - --- _-- - _ - shy [rIll) [klr]
28
1 I I I
---~S~ -~~~fi~ ~~~~~-~
~l_ middot~ ___
[klk]
I I I
r [dlk]
29
-------- --
-~- shy~--I~~
[tIll]
30
The distribution for the sounds which the informant
produced and recognized as the phoneme lEI ranged on the
vowel chart in a thin oval shaped distribution from 400-625
hz for formant 1 and from 1400-2000 hz for formant 2
CHART III
lEI
i
I
1 I
1
1middot
II~~ 5 I~ I lOa I ~--~~~I-+--+-4-+--+---+--++-+-+-+-+--r--t-t--r--t--r--1
I
I I I I
t I
4
I I 1 I ~ I I I I
I t I ~
I I ~
-r--- r--- I V~~~-r~+-+-~~~+-+-~~~~~~~--T-~-r~-r~-r~-T---T--r~
V~~~++4-~~~-4-+-+~~~~~+-~-T-rV~7
~iA~~~~~I+-~~~~~I--~~~-r~~~~~8 FORMANT HHHH~~r+~~-r~+-~+-~I~-I~~rl7V CHART
I II 11I I V9 CaZiLrww 1ft huncirccLJ
-+-f-+-II-f-+-+-+-+--+-+--+--+----+-+--+-1--t-+-1---t---t--7 rtf eye 04 ~ I 11 V pq-+-+-I~-+--i--+I-t-t--+~i-I---t--+--tr -t--t-Tj-ri~middotltJ ecentimeters 1octGy
I V 5miU~ - aemiton ~~~~I~~+-~~l~-~-T~I~~~r~
t i lt~ I I IS I I liV
FolUlAn C1LBT
Placing a single point on this chart is an assertion T hat rormants have been observed at two frequencies one formant at the frequency namfu along the right or left edge the other formant at the frequency named along the top or bottom edge
31
I I
I ~_ f __
~~~ - - ---~ _-shy
I -- shyI - _v-- _ l
i _~~E~~~~middotmiddotmiddot ~---~--~~-it--_ ~_~ 1gt_ bullbull bull -_gt-~~~ ~ bullI
P~J r_i~=~~~ ~-~~~- - -1 I -----~ -~-~ _ ---_
~~Wa~~Ji~~L ____ __ _____ _
[PEs]
I __ shy
-- --shy
~~ ~ -Qt-shy
-~=-=----
~~~7=~~ L___ __ __ ____ _ ______~
[rFm]
32
[PEt]
bull - -IIot-__
- ---~~--
[dEk]
---
33
f ~
I
) I I
I
I I
I 1 I
I I
I
1
__ -~_~i~~-yen-=-- ~~-~= --
------------------------
[dEn] [sEn]
i
~ ----shybull __ ~
[cEr)]
34
1J i i
~
--~~ ~-
~~
-~- ~ -~ ~~ ~gt-- ~- ~~
I ~IJItt- F ~ 111 i~-~_~--- ~--- - _ =-- 4e -~~~-~_-_~-- _~
bull vf middotmiddot~~tmiddotmiddotl____________________~____ j
[sEp] [bEk]
[bEl]
~ shy~~--_o-
J -~~~
~~t~-~~J~ r~~7~ _
I middot---=i---=-~_4~ __ ~~~~~___I _ _~
~g_i$fj bull - ~-~~~z~ir~~ ~~~ leal -~I_ iiIB
L_________ __~________ _____~
[lEs]
I f
I
35
- --- ---- - ---- ----------
~-------- shy
bull
j
i
[tEll][dan]
[dEp]
36
The distribution for the sounds which the informant
produced and recognized as the phoneme A range~ on the
vowel chart from 600-750 hz for formant 1 and from 1600-2300
hz for formant 2
CHART IV
A
i6
i I I
I I
I I
I I
1 0
I
I I I
I I
I I
s
It
i j I Ii i I
I I
6
~ I 1 I I I I ~
I I I V~ FORMANT ~~~~~I~1~4-+-~~~--~1-+~~I~-~-r17 CHART
~~~~~~l~~~~I~i~~~~I~+I~~lr_I~I~~~$ ~U~~~h~~ ~ I I I I I ~ 7 J eye ptI -cony
1f4-i--~--+---I----t--I-4--~1--+---+--+---+---1-~i7-to e cVltJte1 oct4v
i I I I 1 5miU~ - bull iton ~~~~~~~~~middot~~~~4-~I~I--~+~middoti i
2~ I I
F01UlANT CiLlT
Placing a single point on this chart is an assertion tnlt rorreints have bE-en obsered at two frequencies one formant at the frlquerJcy nSleU aiong he right 01 eft edge the other formant nt the frequency named along the top or bottom edge
37
I I i
-shy
I
I
I
~1iI
p~~~~==~~~~i~~~~
I I
[lAs]
_7 -~
-- -shy
L _ _ _ ____________ --- -- ----_~____J
[nAn]
--------
38
I I
------------------~----I I 11 I I
II1
flt~
I
IJ
L
i
______________________
[sAk]
f
~~ ~--r
1 shy
~~-
-- shy[sAn]
I r 1I I I
t
t
I l I
I I I
I i
I
[sAt)] [sAp]
39
~]
I
I I
[rArl][bAk]
I
-shy ---==-_____lshy___
[lAp ]
40
~----------------------------~-------------~
1 bull -l----1-shy
~middot-~-~t-=-- -
~r-shy -shy t~ III M -~ ~~---shy~t-= ~r=_ _shy
C z---=-
L______________________----- [dAs]
[dAr]
l _
41
v 1
I I
i
I
I -tc - bull ~ 1t iCSi4 _ -
-~~-r~middot- 1 ____ ~~~~ ~ ~ I
1 I ~=~j3~middot7-__ ~~
[kArl
---------------------~------
[dAin]l
I I
-I
I
42
I gt1 tmiddot
I
[bAm]
bull
~ I 1 I
gt1
-- - ___ _ N ____ ~--shy---- shy
[bAn]
43
[lAh]
==III
I Imiddot
__~_--_middotfI_~__ ~ ennee ~ S
LL-
[JAk]
--------- ---------
44
---------
I i Ir I
I I j
i
I i
~ --_ -- ~
~~fb-~~~~~~ ----- shycshy7FiIf Elii=s FUP WRmiddot 75t3~ n JIilIeia
~------------
[JAs]
-II
I J
[dAnl
45
~ I 1shy
I
iI shyi t
- - - Imiddot--- ~p -~--~= roc - I
I II i
I I I
~ middot1 I
------J
j I
I I i
i I
1_____ --- I ---------------~
[kAs]
I
I I
I t
I I i
j poundiampl d
rshyl
I i
I
1
I I I
I Il
[bAl]
I~
[bAl)]
I
47
L---------------------- --------------~
[kAp] shy
t
I-- I ~ I i
I
ji I
I -I
I 1 I 1
i
)
~~
~L~--~~---~ - ~ ~
~ -shyY- r i
I
-
1
I I
)
----~ -shy- -- _ ~ ----shy
1 I i i I I
1 I
L ~~~~-~~-~-~~~-~~-gt-= rn~ J ___fi ~ 7 7TZ r~ 5UZs=j -~ l ____-------- _____ __ _ ___________ ________ I
[kAk]
i
I t r ~
--~~ -shy
~~~c~_=--_u ce4 we
I r bull
[gAr)]
~-~ shy
- -~ -~~
~P ~-~~
I ~~
-- bull ~ I - ~~-~~
~-~~~--~ shymiddotT _i
48
-----------------------------l
I I
I I
[rAk]
~_
~ ~--- ~~~-~
j ~~ ~ ~ ~7
~ bull~~middote ri~-is~~~l-IIII-middotlIIIIn---I~-- 41~~~~~ ~
1--=-_---- - - -===--------shy
[sAil]
I
49
_- I I
I -- ----------------shy
~2~~~ ~~
i i I I ~~~~~~~~b ~-
middot_- _ ~~------
j
i ~ at -== l - -- ~-~~it I ax I C1 bullbull~~- shy
I
I i
I I
I 1 I II r I I
-r- --shy
~~-~-~- -~-
-1 l I
I I
[bAs] [PAs]
r-------------------~------------___
[pAl]
I
50
The distribution for the sounds which the informant
produced and recognized as the phoneme 0 ranged on the
vowel ~ha~t from 400-525 hz for formant 1 and from 700~1000
hz for formant 2
CHART V
0
III
t5
lot
S
6
Ie
to
Z7 Zit 9 I 1 I a I z I a 6 6
I
I ~ I
I i II I
j i bull I I
I I I i I
I ~ t
~ ~I I
f I
I ~ f A I I I
j [- V I 1 I I I II ~ I 1 I I
At I
I t I I
V V
V 7
i I Vi( FORMANT I 1 I 1 CHARTI I
I V 3 C41iotc4 ill lUjn~ 01 eycpr ~0It4
i I f I IV
I ) I V IO 6 centltcrs 1 octcv1 I I I 5miU~ -Istmi-toneI
I I VII 2 I ltQshy t 116 IV
FOlUlUfT CRBT
Placing a single point Oll this chart is ampn assertion that formants have been observed at two frequencies (me iormant at the frequency nametl ~ong the right or left edge the other tonnant at the frequency named along the top or bottom edge
Ishy
51
r--- -_-__ - --------shy
-- ~--- --shy~ -
--f -~-
[tOll][pOn]
~ ---- -11lt1 ~
~-- - -~ P---~Amiddot_
t _ __ _
1 r I
--1 i I
I
I ~~~J L____ _ 1 rshy
[dOs] [b0s]
i Imiddot
52
---------------------~---
i I r -------- --------shy
r~~middot-~ [
I V I ~~
I - shy
~~~middottdmiddot~~-~-middot~-
S~~i~~-~ ~- bmiddotmiddotmiddotL _____middot_ ~_
[bOr] [rOk]
I
1 I
i i
j
I
[dOpJ[pOl]
53
Ii --~ --~--- -~~~~--=- I r
~ ~- ~ - ~ - shyI - -~ ~~ -~~ I
-1bullbull - h ~~~
~~~ ~ ~~~~----- ~~-~~~-~- ~--~~~~L- ~bullbull
I middot~-~middotdf r scr ~~~~~
~-laquo~~-==~~~-~~--~~~~ ~~
I
[lOs]
I
I
r I
i 1
i 1
I I J_____~ __ _-_M___J
[bOn]
54
i -~----
I I I r r
~-~ -shy
[bOn][sOp]
jI ----II I J
i
I I I
I I I i
I~~~==it shy
[jOk][tQr)]
55
1 I
I
II I I I
I c ~~~~~~~~ ~~OOWJI~~=U
[lOh]
i I
I
I ~~~-
I ~- -- shyl - _- ~ shy
I ~n=~~-~middot ~FlR T =Iti 1amp11 dill_
__-J
[pOt]
__J pOs]
1
- =xu
[bOk]
I
56
The distribution for the sounds which the informant
produced and recognized as the phoneme lUI range~ on the
vowel
hz for foimant
chart in an
1
almost square-like pattern from
and from 700-1000 hz for formant
250-350
2
CHART VI
lui fIG
3
t
ts
~
la
Il
IT zt 20 IS
I I
I I
i j
I
I j
I I
I
I I I
I t I I I1
I J I I I
~ i I LJ J I~
I
I
I
la -I
10
I
I I I 1
t I I i
I
I
I I
I
I I I
I ~ 1 v I)
V V
qV
FOlUfANT atRT lt
8 6
I t lt
~
I
l --~ I--- ~I I
i
I I
I I I i ltiI I
I i ~
I t
V
V V l( FORMANT I V CHART V
V Caiote4 iramp 1umb_ ef cycipampf on4
6 CelItlmctcrs bull octclv SmiUitoctamprs -I a~i-tonl
PlaciDg a single point on this chart is an assertion that formants have been observed at two frequencies one formant at the frequency named along ~he right or eft ede the other fonnant at the frequency named along the top or bottom edge
I
57
I
I
I -I
I
j _-
~~ -
-
bull I -
[dUp]
t I ~
~
I middot1
f
IshyIj II
I i
-------=shyI ~~-- -
L ~~-=-r--~~-III--=---
58
i middot1 I
I
i j I Imiddot
I~1 middotU~ _ s
I ~~~~~_-_-~--~ --_ I
L~ __________~_____________~ [CUll]
I
I
[dUr]
I
I J
I
I I
II
1
-yen ~ L___________ ~__ ~=~
I [kUs][pUn]
59
I
I
i L ~ -----------~-
____---shy______---2
~~~ -~ _
j ~---
I~~~-~-~ ~~ ~~
[nUn] [lUp]
I 1
~-=-~ ~~ -
[rlhn]
I
60
l
- _ ~~-----
~~~~~ JlCIIPrl fue rm ad I II
L ~ [gUI)] [kUk]
e_
__ ~ e-
~-d~~~~
[lUs] [jUs]
61
shy
I
Iii lEI and A Compa~ed
In comparing the distributions of the vowels III lEI
and IA( cf Chart VII on p 62 it is evident from the plots
that the front-back tongue position is for all practical
purposes identical ie the core distribution for all
three phonemes ranges between 1600-2000 hz This demonshy
strates conclusively that the significant phonetic differshy
ence is tongue h~igth ie t~e position of formant 1
The fact of phonemi~overlap is illustrated by the
crosshatching on Chart VII The cross-hatched area represhy
sents a r~nge of phonetic quality that is identified in one
instance as an III and in another instance as an IE or in
one instance as an lEI and in another instance as an IA
bullbullbull the sounds which follow one another in a changing sequence constitute the signals of speech and these sounds are produced by movements of the vocal apparashytus i e by movements of the lips tongue throat lungs and so on It is therefore important to understand that these vocal movements caused by the various muscles involved tend to slur into one anothshyer Since each variation of movement gives a varishyation in sound the slurring of movements produces a slurring of sounds Furthermore since specific sound will have different slurs of moveme~t depend~ ing upon the movement which it precedes or folloItJs each sound type resul tant from the productive moveshyments will vary somewhat according to the sounds which it precedes or follows (Pike 1947)
In line with this the next logical step would be to
look for environmental influences which would enable a listshy
ener to determine which phoneme was represented when phones
were recorded in the overlap area
62
CHART VII
lIlt lEI and A Compared
~ 2[7
t5
lot
5
ft
fA
Ie
Zit I zp 16 I a la 8 6
t I
~
II V I I I I +
r l~ ~ ~ I
I I ~ ~ V I I 1shy fZ I I t s
) I I j I I I
i ~ I 1 1 I I _lgt
V ~R R-r--~ I V
ItV l(
I I---I-
V~ j shy ~
I I I I FORMANTI I
I I VV CHARTI II I V S CaliL-tcd I Uut
I I I l of fIelc F- 0114
I I I I I j i I 10 ecentImeters 1oct4v
I
I ~ V Smillimctus Iumrton_ j VII
2f1 2~ 16 ltv
FOlUlANT ClIABl
Placing single point on this chart is an assertion that io-rnants have been observed at wo frequencies one formant at the frequency named ~ong the right or left edge the other formant at the frequency named along the top or bottom edge
63
A fairly thorough study of the positions of various
vowel sounds in specific environments did not indicate any
consistent variations of a particular type For example
the vowel in dim is in the lower range for the vowelIII
but the EI in dem is in the upper range -of the vowel lEI
Thus it seems probable that those sounds in the overlap area
are qualities for which minimal contrasts do not exist For
example the II in sih is in the overlap area but appar-middot
ently is clearly recognizable by a native sp~aker because
there is no seh at least no such word was known to the
informaht nor could one be found in the dictionary (Echols
and Shadily 1968)
IU and 0 Compared
In contrast with the front vowels III IE and IAI
the back vowels Iu and 0 have aconsiderable gap plusmn50
hz between the1r two distributions cf Chart VIII on
p 64 The distributions appear directly above one another
on the chart In comparing the two ranges it is appa~ent
that the front-ba~k position formant 1 is identical ie
the core distribution for the phoneme ranges from 700-1000
hz This demonstrates that ~he position of formant 1 ie
tongue height is the significant phonetic difference
64
CHART VI I I
U and 0 Compared
I I
i
5
~
5
6
til
~
2[1
I
Zit zp 15 IZ la a 6
~ I -~
1 ~ ~ ~
~
I V 1
V
I V ~
JIll ~
I I 1 6
1 middotV V l(
vI( FORMANT CHART
9 CalLOt-ctc4 ift 1awuutb of cyc14 p ICCOftI
I~ I V 6 eentllMtcrs 1 octo
I V 5mmi~ - ampImitenI VII
214 I 210 16 IV FOlUfANT CE1ART
PJaciDc a single point on this chart is an assertion that formants have been observed at two frequencies one form3nt at the frequency named along the right or left edge the other formant at the frequency named along the top or bottom edge
middotr I
65
II lEI IAI lUI and 101 Compared
In comparing all three phonemes in their respective
poJition on the vowel chart cf Chart IX an p 66 there I
se~ms to be no problem identifying between front and back
vowels There is a gap of approximately 400 hz between
th$ two back vowels and the three front vowels in terms of I
fotment 2 Also it would appear that there would be no
pr~blem in identifying specific vowel qualities so far as
fOfmant position is concerned for vowels in stressed position
with the exception of the phonemic overlapping discussed in
a preceding section ie III-lEI and IE-A
I
I
Imiddot I
CHART IX
I 1 E IA U and 0 Compared I
iM zr Ztt ap J 6 I Z 10 S 6
I I f ts I
~
tj1- ~
rL ~ ~
J 4- 1 ~ ~ i~ ~ V
Ii ~W~ V I ~~ ~ J
V I ~ ~
IS I ~ V 5 1 t
~
s ~ I I f
V R ~ r-~ I V
if~ V ~ ~
-- V 7
~ -~ [a ti I l( FORMANT
V CHART
V 0 cyclu on4 S CaULntte4 ilt hWldr_
I
Kl I jmiddotV I j V 10 6 centlrMtcll1 oct4v
V 5llIil(lCtampn ~ hl4Imiton
Vii 2~ zkgt 116 I IIyen
I
Forw~ CllABT I
Placing a single point on this chart is an assertion that formants have been observed I at two frequencies one formant at the frequency named along the rignt or left edgeI
the other formant at the frequency named along the top or bottom edge
~ ~ bull -
66
I
I I j
Cbull
I I
i
CHAPTER V I SUMMARY AND CONCLUSIONI
I As is shown on Chart IX on p 66 there appears to I I
bela very discernable distribution for each of the vowel I
Phtnemes of Bahasa Indonesia This does not mean that the
ci cumscriptions of each of the various sounds indicate I
detinite border lines for each vowel Rather it shows i
th~ position o~ each vowel in relation to the other vowel
phbnemes The vowel charts show the position of the phonemes
i asl produceq by one native speaker of the language Thus
nJ conclusions can and should ~e made regarding the definite
oJter boundaries of the ranges of middotp~onemes As is implied I
b~ the term ranges the phonemes have no defined boundarshy
I i~s
i Bahasa Indonesia does not appear to have two front I
v~wels two back vowels and one central vowel as is implied
i+I
the traditional symbolization Rather it has three i
ftont vowels with a three-way contrast between high mid I
i a~d low and a two-way contrast of high vs mid in the back
a1ea of~he articulation chart If a traditional symbolshy
i~ation of the vowel phonemes of the language were now to
b~ dawn it would look like the following chart I I I
68
front central back
high
mid
low
I
U
E 0
A
Thus as has been demonstrated the impressionistic
sion of the vowel system was in error with regards to
central phoneme of the language investigated There
a ears to be no low-central phoneme in the language
r it is a low-front one Although the spectrograph
c nnot establish a phonemic system of a language on its
o n it can provide a yes or no answer about the phoneshy
t c qualities of the phonemes in question After a phoneshy
m c system has been established the spectrograph can proshy
v de phonetic data which distinguishes one phoneme from
a other
BIBLIOGRAPHY
Sources Cited
Almiddotsjahbana Takdir The Indonesian Language - By-product of Nationalism Pacific Affairs XXII (1949)388-92
Am rican University Area Handbook for Indonesia Washingshyton DC ~S Government Printing Office 1970
Blch B and G Trager Outline of Linguistic Analysis Baltimore Waverly Press 1942
Du n H K Calculation of vowel resonances Journal of the Acoustic Society of America XXII (1950) 740-53
ols John M and Hassan Shadily An Indonesian-Enqlish Dictionary Ithaca Cornell University Press 1963
ner C Reserches sur la structure des voyelles orashyles Archives Neerlander Phonetic Experiments XX (1947) 40-77
obson Roman C Gunnar Fant and Morris Halle Prelimshyinaries of Speech Analysis Cambridge MIT Press shy1961
J s Martin Acoustic Phonetics Baltimore Linguistic Society of America 1948
L defoged Peter Three Areas of Experimental Phonetics London Oxford University Press 1967
P Mario Glossary of Linguistic Terminology New York Columbia University Press 1966
Perce Joe E The Spectrographic Study ~f Vocalic Nuclei Language Learning XII (1963) 241-247
- --- Phonemic Theory and the Analysis of English Syllashybic Nuclei Linguistics XVII (1965) 36-57
P ke Kenneth L Phonemics Ann Arbor University of Michigan Press 1947
70
Pi e t Kenneth L Phonetics Ann Arbor University of Michigan Press t 1943
Pu gram Ernst Introduction to the Spectrography of Speech New York Dover Publications 1966
ir Edward Language An Introduction to the Study of Speech New York Harcourt Brace amp Co 1921
enbeck E M Indonesia and Malaysia 1I Current Trends in Linguistics IIX (1967) 55-111
dman Dorothy The Republic of Indonesia New York N Y Philosophical LibrarYt Inc 1955
Sources Consulted
r e j e v N D bull Some ProbIem s 0 f Baha s a In don e s i a Ph a nshyology Studia Linguistica XI (~1957) 44-46
lingmiddotC L Linguistic Units The Hague~ Mouton amp Co 1960
J obson t R Hague
and M Halle Mouton amp Co
Fundamentals 1956
of Language The
K nedy Raymond Bibliography of Indonesian Peoples and Cultures New Haven Yale University Press 1962
Perce Joe E Spectrographic Study of English Vowels Under Primary Stress Linguistics LXXXIV (1-972) 41-84
P ttert Ralph K George A Kopp and Harriet C Green Visible Speech New York Dover Publications t 1966
T euw A Critical Survey of Studies on Malay and Bahasa Indonesia The Hague Martinus Nyhoff 1961
-basin
-head of an area
-form of address
-ball bag
-bell
ba --bank I
bUr --you I
bi --beer
bomiddot--drill I
ba--bliJss
bi --bus i
I t
bo I
--bunch bun~le i I
ba--crossbeam
--bomb
--tire
--son of
--ration coupon bond
--garbage dump
--checkered design
--inch
--and plus
APPENDIX A
LIST OF WORDS
den~-abbrev of the title raden
dar--olace location
dur--pearl
das--a shot
dos--small box
dek--deck
dik--younger sibling
dep--to b~ shelved
dop--hubcap
dup-~to be baptized
djak--jug
djok--seat
djas--coat
djus--part of the Koran
gang--paBsageway hall
gung--gong
kak--form of address for elder
kik--handloom
kuk--collar harness
kar--map
kir--jo test
kas ~money supply i
kus -to hiss spit I
lahi-alreadY
loh-writing tablet
lapi -towel I
lup -magnifving glass or
last -IrJeld i oint
lesl -lessonI
lOs -shed I
I I
-to iron
-which who
nu -yonder
po
pa --pole
pa --to fit
pe --plague I
po --mail I
pel --cap
pOI --pot
--pound
--also
r --shelf
--shirt
g-o-rank position
g--ring
--brake
rum--cream
sah--valid legal
sih--an enclitic usedmiddotto soften what follows
san--form of address far sargeant
sen--cent
sang--superior
seng--zinc
sap--line row
sep--chief boss
sop--soup
sjak--suspicion doubt
sjok--attractive
tang--tongs pincer~
ting--sweet meat
tong--barrel vatmiddot
teh--tea
toh--yet nevertheless
tjeng--molasses
tjung--young boy
III 1
APPENDIX E
LINGUISTIC SYMBOLIZATION USED
IAI~high-front-openIi
II
~ r
E~-mid-front-~pen
III
AA-low-front-op~n t1
o1-mid-back-open
Uf-high~baCk-close III
I III
~~~vd bilabial stop
[dj~vd alveolar stop l
I I
[kt-Vl velar stop I
[g I-vd bull velar stop
[1 -lateral I
(n-vd alveolar nasal 1
(m~-vd bilabial nasal
~I-Vd velar nasal
I
III ~IJ
I
q
dl
I
Iil~
I
Vowels
Consonants
[p]-vl bilabial stop shy
[t]-vl alveolar stop
[rJ-vd alveolar flap
[jJ-vd palatal affricate
[CJ-vl palatal affricate
[S]~vl bull alveolar affricatmiddote
[s]-vl alveolar middotfricative
h]- vI velar aspirant
4
I
rely on comparative methods of description he cannot compshy
letely remove all the sounds in his linguistic memory when
describing a new language He will invariably hear sounds
that are very similar to those he knows and may not be able
to discern certain minor although perhaps crucial differshy
ences Phonemic descriptions are most often of this impresshy
sionistic variety
Spectrographic analyses of the sounds of a language
provide an objective measure of the quality of the sounds
of a language Spectrographs record precise sound qualities
produced by a speaker particuiarly vowels This mode of
description will delete the impressions of the investigator
and will map precise quality for sounds in question what
shows on a spectrogram is an acous~ic reality whether the
analyst hears it or not (Pulgram 1965) It is these
precise sound qualities of Bahasa Iridonesian vowel phonemes
that this investigation will attempt to ascertain Instrushy
mentaltesting of hypotheses has been a part of scientific
study for many years but very little has been done to
date in linguistics (Pierce 1963) The acoustic specshy
trograph can provide definite answers as to the phonetic
quality of vowels
The science of phonemics developed out of the realizashy
tion that some phoneti6 features of a language differentiate
one word from another while others do not Edward Sapir
(1921) argues
5
Back of the purely objective system of sounds that is peculiar to a language and which can be arrived at only by a painstaking phonetic analysis there is -a more restricted inner or ideal system which perhaps equally unconscious as a system to the naive speaker can far more readily than the other be brought to his consciousness as a finished pattern a psychological mechanism The inner sound system overlaid though it may be by the mechanical or the irrelevant is a real important principle in the life of a language
Once it was accepted that language had a definite phonologshy
ical structure a method was devised to describe this undershy
lying system This method became the science of phonemics
The phonemic structure of a language represents the minimal
number of sound signals which make transmission of informashy
tion possible Spectrographic analyses of t~ese minimal
sound signals provide objective and empirical measurements
of the quality of these minimal sound features
Statement of the Problem
This investigation will determine the range of free
variation of Bahasa Indonesian vowel phonemes in a given
phonemic environment and types of conditioned variation
from one environment to another The nature and ra~ge of
the vowel quality for each phoneme will be determined by
spectrographic measurements
Delimitations of the Study
This study will only deal with Bahasa Indonesian
vowels sounds produced with vibration of the vocal cords
6
by unobstructed passage of air through the oral cavity
and not constricted enough to cause audible friction
Pei 1966) They will be the vowels found in monoshy
syllabic Indonesian wo~ds under primary stress and in a
consonant~vowel-cDnsonant pattern Each word will also
be part of a minimal pair ie every word must be conshy
trasted with another word in which only the medial vowel
is different andto which a different semantic meaning is
attached
CHAPTER II
THEORETICAL BACKGROUND
PhoneticsPhonemics
Phonetics is the branch of linguistics which deals
with the actual speech sounds of a language When dealing
with the phonetic level of linguistic analysis one describes
the sounds of a language in terms of articulation or acoustic
features In articulatory phonetics one describes sounds
in middotterms 9f manner of articulation ie whether it is a
stop fricat~ve etc point of articulation ie) bilabial
(be~ween the lips) dental etc or vowel quality ie
high-front-close (the highest part of the tongue-is very
high in the front of the mouth for producing this particular
sound) etc In acoustic phonetics sounds are described in
terms of the distributions of frequencies characteristic of
the sounds of a language The relationship generally acshy
cepted as existing between artic~latory and ~coustic phonetshy
ics is that certain articulations produce certain distinctive
patterns of frequency distributions It must be emphasized
at this point that both of the aforementioned types of deshy
scriptians deal with all human speech sounds not necessarily
those which perform a signalling function in a particular I
aspect of the language
I I
f
8
Distinctlve features are used to denote signalling
functions The label distinctive feature is used in the
literature to mean two quite different things Bloomfield
describes the categorization with examples which imply
that distinctive sound feature means any feature of the vocal
sound which when changed changes the meaning of a given
word eg pill and bill sin and sing etcri (Pierce 1965)
There Bloomfi~ld labels p as a distinctive sound feature
and b as a different sound feature Later Roman Jakobson
Gunnar M Fant and Morris Halle in their Preliminaries of
sectpeech Analysis take the phonemes of a language and break
them down into their component phonetic features some of
which are distinctive eg voicing in English b vs p
while others are not eg aspiration in English p~ in pin
as opposed to p in spin Anyone language code has a
finite set of distinctive features bullbullbull (Jakobson Fant and
Halle 1961) In English the feature of voicing in the b
of bill as opposed to the absence of voicing for the p
in pill is the phonetic feature which distinguishes these
two sounds A similar presence vs absence of aspiration
does not alter the meaning of any English utterance in fact
it is difficult to make English speakers aware of the fact
that aspiration is or is not present Implicit in this
theoretical approach is the concept that the variation in
human speech for the most part re~resents presence vs
9
1
absence of non-distinctive features of sound
One theoretical approach to linguistic structures
views the phoneme as concurrent bundles of distinctive
features (Jakobson Fant and Halle 1961) Each language
has a finite set of rules for grouping them (distinctive
features) into phQnemes (Jakobson Fant and Halle 1961)
Every phoneme in the language then is composed of a unique
set of distinctive features such that it is different from
any other phoneme by at least one of such distinctive feashy
tures This manner of linguistic signalling has important
implicat~ons toward phonemic analysis of sound systems As
previously mentioned a phoneme is a bundle of distinctive
features which when altered changes meaning In order
to verify whether a sound is a phoneme or not one must
show a word in which the replacement of at least one disti~c-
tive feature makes another word ie a minimal pair difshy
ferentiated by only a single distinctive feature and having
two distinct grammatical or semantical meanings
Phonemics the study of phonem~s is the level of lingushy
istic analysis which answers the question of how language
utilizes sound matter selecting certain of its elements and
adapting them for various ends The prima~y functions of
sound in a language is to distinguish one utterance from anshy
other in normal conversation Phonemic analysis as an opshy
eration examines a~ailable data in order to discover an unshy
derlying structure bullbullbull not an operation which forces a mass
1 0
of data into a structure (Pulgram 19~5) The nature of
each feature is of the essence Thus the composition of
each phoneme becomes of primary importance in a language
The phoneme can only be defined in reference to the larger
frame whi~h is the language of which it is a structured
feature (Pulgram 1965) It is the shortest stretch of
sound which serves a signalling function
Acoustic Theory
I Distinctive feature theory as previously describedI I seems to handle such phonemes s stops fricatives and
I nasals quite well eg the airflow out of the mouth is I
either stopped or it is allowed to escape On the other
1 hand vowels seem to be ranges of phonetic quality whichI
are extremely difficult if not impossible to distinguish
in terms of presence vs ab~~nce of distinctive features
Since this study will not be concerned with consonants but
only w~th vowels it is only necessary to discuss the acousshy
tic nature of vowel qualities from this point on
FundamentalsHarmonics
Vowel quality is determined by a combination of a fundashy
mental and its harmonics A vowel quality displayed on an
oscilloscope shows a very complex single wave form This
wave form is in reality the mathematical sum of a number
of simple wave forms or at least for theoretical purposes
1 1
can be treated as such These wave forms are generated
in the oral tract by the opening and closing of the glotshy
tis The fundamental wave is a sine wave with a frequency
equal to the number of times the glottis opens and closes
each second and an amplitude which is directly pro~ortion-
al to air pressure in the lungs Because of the nature
of sound waves a harmonic is generated at every multiple
of this fundamental eg if the fundamental is 100 cycles
per second then a harmonic is generated at 200 300
400 bullbullbull CO As soon as the complex wave leaves the vocal
chords harmoni6s are filtered out by the nature of the
tissue surrounding the oral tract as well as the cavities
in and adj o 1ning the oral tract The complex wave emerging
from the mouth is the mathematical sum of fundamental and
the harmonics which have not been filtered out by the oral
tract cf Martin Joos Acoustic Phonetics (1 948) chapshy
ters 1 and 2 for a fuller explanation of this process
Acoustics vs Articulation
In the last century far too much energy has b~en exshy
pended in attempts to relate acoustic features to specific
articulatory movements Bloch (1942) illustrates this by
stating qualities are identified by ear but in linguisshy
tic works they are traditionally defined in terms of their
assumed production by the vocal organs This type ofmiddotstudy
is misdirected because the only things that impinge on the
I I
- I
12
human ear are the harmonics which were not filtered out
The articulatory movements which cause the filtration ie
movement of the tongue from front to back creating a series
of filters each of which removes different harmonics
from the complex waves are irrelevant Pike (1943) argues
one should analyze and describe the sounds (or sound waves)
themselves rather than the movements ~roducing them
It has long been noted by acousticians that a variety
of articulatory movements remove the same harmonics and
r~sult in the production of very similar sounds Pierce
(1962) illustrates this by saying
As long as the formants are in their praper positions ie the proper frequencies are passed through the speech mechanism it does not matter whether the unwanted frequencies are filtered out by rounding the lips or moving the tongue to the back ThuQ when Holbrook and Carmody give one front-back position for the tongue for a given English vowel and IPA (International Pho~etic Alphabet) gives another it is quite probable that both are completely correct and that the formant shift is made by compensating for the lack of tongue movement in the speech of some speakers by additional lip rounding bullbullbullbull
Since the hearer of a stream of speech can hear 9nly those harmonics which emerge from the mouth as componshyents of the final complex wave the placement of the formant is of primary importance not the articulation which produced the sound
Therefore a study of the phonetic quality of vowels
demands an instrument which is capable of making an accurate
record of the presence or absence of all the harmonics
having sufficient amplitude to significantly alter the final
wave form The acoustic spectrograph is such an instrument
13
it was the first instrument to make large scale acoustic
a n a ly s e sapr act i c a I po s sibiIi t Y n ( Lad e fog ed 1 967 ) bull
Spectrograph
The acoustic spectrograph is a device ~hich records a
stream of speech 2~4 seconds or less in length This
recording is then fed into the analyzing part of the specshy
trograph where at each successive playing ne frequency
or rather one frequency band is lifted outof the total by
the variable filter (Pulgram 1965) A black ma~king is
made on a piece ofmiddot electro-sensitive paper each time there
is a harmonic present within the frequency band being anashy
lyzed Since the articulators are constantly moving and
changing the filtration characteristics of thevocal tract
the black markings ma~e by a stylus reflect the movements
of the articula~ors in a very broad sense More important
however it makes a precise record of the stimulus ie
the harmonics which reach the ear of the listener Dunn
(1950) says the vowels have asso~iated with them different
frequency regions in which the sound is more intense than
elsewhere in the spectrum The name formant has been apshy
plied to these regions
The next problem then is to relate the concentrations
of power mentioned above ie the formants to human pershy
ception of speech sounds The most widely utilized techshy
nique in this area is one devised by Martin Joos (1948)
~______________________________________~S___________________________________________________shy1
14
generally referred to as his 2 Formant Theory This techshy
nique represents the plotting of formant 1 and formant 2
in a specific wayan a particular chart cf Chart 1 on
p~ 23 This technique is clearly described by Ladefoged
(1967)
The relations between the formant structures of the vowels in a number of words can be conveniently represented by means of formant charts which show the frequency of the firs~ formant at a time in the word when the formant structure is changing at a minimum rate plotted against the frequency of the second formant at the same time
When making these kinds of plots a charting is derived of
vowels for any language which is remarkably like the tradishy
tional impressionistic vowel charts of the 19th century
Esner (1947) illustrated that if the frequency of the first
formant was plotted against the frequency of the second
formant it seemed to equal the relation between formant
frequency and the traditional vowel diagram
Basically this study will reproduce such vowel charts
for a number of examples of each sound in Bahasa Indonesia
Formant 1 will be platted against formant 2 for each vowel
phoneme in a variety of phonemic environments -The purpose
of this will be to determine the range of variation for
every vowel in each e~vironment as produced by a single native
speaker
CHAPTER III
METHODOLOGY
Phoneme Identification
In order to assess the phonetic quality of vowel phoshy
nemes one must first ascertain the number and relationshy
ship of sound contrasts in a language ie the phonemes
The visual representation of the actualization of the phoshy
neme ie the spectrogram can only be made on the basis
of a preceding decision of the linguist on the types and
number of phonemes in the l~nguage to be anaiyzed (Pulgram
1965)~ Phonemic analysis cannot be made with phonetic
data alone it must be made with phonetic data plus a sershy
ies of phonemic premises and procedures (Pike 1947) A
spectrogram conveys phonetic information which aids the
linguist in determining which phonetic features are consisshy
tently present in order to reach the most accurate phonetic
description
There are a variety of premises and procedures which
the investigator may utilize in order to discover the phoshy
nemic structure of a language Pike (1947) argues that the
investigator must have at hand observable native reaction
to native sounds andor know structural facts pertaining to
the phonetic nature of the sounds and their distribution
As stated before a phoneme is a bundle of sound f~atures
1
j
16
which when substituted for another bundle creates a difshy
ference in meaning Since the creation of a different morshy
pheme is the result of the substitution of a different sound
feature these sound features are said to be phonemes
A pair of words in which the first word is the same as the second except for the fact that one segment is replaced by a different but phonetic~lly similar segment in the second word constitutes proof that the two similar segments are phonemically distinct~ bullbullbull Word pairs of this type are said to be MINIMALshyLY DIFFERENJ because no smaller difference in the language can make a differ~nce in meahing in words (Pike 1947)
Hence minimal pairs of words were used to find phonemes
Minimal~y different word pairs prove to be the beginners
single most important tool for the analysis of phonemic difshy
ferences (Pike 1947)
Thus Echols and Shadilys An Indonesian-English Dicshy
tionarv (1968) was ut~lized to find three-phoneme words
containing two consonant sounds with a vowel in medial poshy
sition The process was simply to go through all the words
beginning with consonants and find minimally different t~ree
phoneme words This was done on a purely anthr~poscopic
basis on the part of the investigator If a different letshy
ter was employed to distinguish a different meaning it was
assumed to be a different phoneme The following ~ord pairs
and their meanings are examples of the words found in the
dictionary
ban--tire bin--son of
das-- a shot dos--small box carton
I
1 7
pal--pole pel--field
rang--rank position ring--ring
teh--tea toh--yet nevertheless
After having obtained the words from the dictionary
a native informant was called upon to verify ~he differshy
ance in meaning in the minimal pairs and to pronounce
them so that ~hey could be phonetically transcribed in
al1 impressionistic manner The informant employed was Kok
Djen Su a student at Portland State University from Yogshy
jakartai Indonesia He has been a student in the United
States for approximately two years and speaks broken al shy
though very understandable English Mr Su was horn to Mr
and Mrs Su Hendry Su who both speak Bahasa Indonesia Jashy
vanese and a small amount of Chinese Since his birth the
informant was exposed to a mixture of Javanese and Bahasa
Indonesia but has employed the national language of Indoshy
nesia since the age of three at school His bilingual upshy
bringing it seems to the author does not craate a subshy
stantial difference in the competence of Mr Su in Bahasa
Indonesia In fact he was able to distinguish the proshy
nunciation Qf words in both Javanese and in Bahasa Indoshy
nesia The utilization of one informant deletes any reshy
gional variation or individual variation between informshy
ants Since here we are attempting to ascertain the relashy
tive range of phonetic quality of vowel phonemes in Bahashy
sa Indonesia the informants bilingualism ahould cause
none or very few phonetic distortions
After-having verified the difference in meaning of
the word pairs Kok Djen ~u pronounced the word The
following impressionistic version of the Ihdonesian voshy
wel system was described
front central back
high
mid 1 I
I I low j
i I I
I
u-
E 0
A
1 Spectrograms
The phonemic entities symbolized in the preceding
section represent range-units of phonetic quality The
symbols and their position on the chart are based on the
aural perceptions of the investigator The purpose of the
spectrographic analysis of this data is to determine as
accurately as possible the actual phonetic range represenshy
ted by each of thephonemic symbols
I
i
1 9
In order to make spectrograms from which meani~gful
conclusions can be drawn one must have a native informant
of the language to be studied Spectrograms were made of
the speech of Mr Su the informant described earlier
In order to conserve the time of the informant a
sample of three-phoneme words were recorded The three-
phoneme words begin and end with consonants ahd contain a
vowel in medial position The list appears in Appendix A
The list of words was specifically selec~ed to eliminate
in so far as possible all variatiqn other than that which
is specifically caused by the preceding and following consoshy
nants This is true because by utilizing a single informant
the influence of dialects both regional and social are eshy
liminated and by utilizing one sy~lable words under primary
1stress sequential influences such as the Markov Process
are eliminated since there is no sequence beyond one phoshy
neme preceding and following the vowel This being the case
one should be able to derive from a series of spectrograms
of those vowels both the range of free variation and the
specific influence of each particular consonant on the voshy
weI quality of each medial phoneme
The n~xt st~p in the procedure was to play the tape-
recordings into the spectrograph two or three wo~ds at a
1The Markoy Process is a mechanical way of handling enshytropy in sequential operations IQ linguistics this is stashyted in terms ofthe probability of the occurrence of a parshyticular phoneme morpheme etc in a precise sequence
20
time The machine can handle 24 seconds of speech on one
spectrogram thus two or three words could be analyzed at
the same time as one with no loss in quality or precision
Unfortunately the recordings had to be played into a
microphone which picks up some background noise but by
placing the microp~one of the spectrograph very close to
the loudspeaker of the tape recorder and turning the volume
up slightly this background was eliminated for all pracshy
tical purposes middotIt would have been better to have had a
direct connection between the recordar and the spectrograph
but unfortunately no such devce was available Background
noise shows up as very small specks scattered more or less
at random and unless the volume of such noise is exceedshy
ingly strong does not interfere with the reading of the
spectrograms
Once the machine had completed the analys~s and produced
the graphic record of the list of words a frequency measur~
ing device was produced by the machine cf example below
1 11amp II~ill c=
- n- HE to
11r -shy
bull b mmiddot 1 bull bull L
-
gIl F Jamp u
n _ If
bull III
21
This measuring device is in reality a spectrogram with horishy
zontal markings The first line on the chart represents a
frequency of 0 hertz (hz) Each line above the first repshy
resents a multiple of 500 hz The device is used to locate
th~ center of formants 1 and 2 Since it is graduated in
500 hz it is necessary to interpolate when the center ofmiddot
power for a particular formant falls between two of these
lines This is done by dividing the area between the two
lines in half then dividing one of the halves in half which
gives a range of 125 hz within which the measurement falls
and an estimate is made of the precise measurement within
the 125 hz range This should give formant positions with
an accuraci of greater than plusmn25 hz
When visual location of the formant centers becprnes
difficult a section of the formant can be made cf exshy
ample below Such difficulties with visual location usually
arise when two weak formants overlap Such overlapping
produc~s what appears to the naked eye to be a band of modeshy
rately dark grey bands The sectioner is a built in mech-
IshyfL__---
tete we tt
~
I
1 I
22
anism capable of handling such problems In the preceding
I example the amplitude of each harmonic is proportional
to the length of the line representing that harmonic I
This makes it possible to locate formant centers when vi-
I sual location is difficult
The measurements were then transferred to formant
charts cf Chart 1 on the following page
6
23
CHART I
~
t
1+
t5
1amp
Ie
z~ 2t 2p 16 12 la 8 Iii
I ~
~
I S
l I
I I
~
V V
V T
l( FORMANT V CHART
Vi ~ CcdiOrate4 ift luutdnM I V ~ cycle ~ concf
V 10 eeentl~rsI~ V
V U 5millimctcrs - I $milton
2 zk2 lis ty
I
FOlWAlfT CHART
Placing a single point on this cha-t is an assertion that formants have been observed at two frequencies one fOrrUlt at the frequency named along the right or left edge the other formant atmiddotthe frequency named along the top or bottom edge
ex Martin Joos~ Acoustic Phonetics (1948)
CHAPTER IV
FINDINGS
The data provided by the preceding methodology conshy
sisted of a series of scatter patterns on the vowel charts
Each of the dots within the pattern represented one occurshy
rence of a particular vowel To determine the range ofmiddot each
phoneme f the most divergent points in each pattern were con-
nected by a line These lines then circumscribe an area
which included the range of all the vowels in the sample
recognized ~y the informantmiddotas a particular phoneme
Verbal descriptions the actual charts of the phonemes
and the spectrograms utilized willbe found on the followshy
ing pages
25
The distribution for the sounds which the informant
produced and recognized as the phoneme 1 range~ on the
vowel chart in a broad scattering from 300-500 hz for forshy
mant 1 and 1500-2100 hz for formant 2
CHART II
1
lid
13
bull
~
It
iA
Ml
ztr Zit zp 1 S lIZ middot1 I a r 8 6
I
f
I I
Ii 3
[7l I I V 1 I
) ~I I i I bull
V I I i bull r J
I V t I I I I I
i tt I
Kl7 I I I iI ~
I I I I I I I I I i I
I I I i I f I ltII
I I l7 I VI
I [7 1
1 I I I Va FORMANTc7 CHART
I
I I I I 173 CaEiIw-atd icw~[7 rf ltfer C0ItdI I I
j I I I i 7 10 e centlCMta1 oct4v
I V 5miU~ bull itonI
r I f 711 t14 j I I I Ik IV
FoiUlAhT CHRT
Placing asinge point on this chart is an assertion that fortcants have been observed at two frequencies one formant at tn(l frequerlcy nameu Slong the right or eft cdampe the other formant at the frequency named along the top or bottom edge
26
l 1I I - -~
I I iI I
I
[bIs] [bIn]
lt-- -_- -1I
lt i
1 ~ i1_ -shy Ir ~ tmiddotmiddot lt
-- - - ---~--- - - - ----- --
-i -_~ ~ shyI 1
i I I
I I bullbullq_-
I ~~~-~--shyr ~~~~~ -~- I------------------------shy
-----I
[dIm] [sIh]
27
I -[blr]
i1 1 I I
i Ii I
I i I I
ii ___ -J
rmiddot I i
I 1 j
-~ ~~~ ~-~IIlIr~~~
I
1 ____~~l_~~--=~ _ ~--~~~~~~~~~- -
51 hI$ PiiB PD~ii~i
-~ - -- -- ----- ~------- - --- _-- - _ - shy [rIll) [klr]
28
1 I I I
---~S~ -~~~fi~ ~~~~~-~
~l_ middot~ ___
[klk]
I I I
r [dlk]
29
-------- --
-~- shy~--I~~
[tIll]
30
The distribution for the sounds which the informant
produced and recognized as the phoneme lEI ranged on the
vowel chart in a thin oval shaped distribution from 400-625
hz for formant 1 and from 1400-2000 hz for formant 2
CHART III
lEI
i
I
1 I
1
1middot
II~~ 5 I~ I lOa I ~--~~~I-+--+-4-+--+---+--++-+-+-+-+--r--t-t--r--t--r--1
I
I I I I
t I
4
I I 1 I ~ I I I I
I t I ~
I I ~
-r--- r--- I V~~~-r~+-+-~~~+-+-~~~~~~~--T-~-r~-r~-r~-T---T--r~
V~~~++4-~~~-4-+-+~~~~~+-~-T-rV~7
~iA~~~~~I+-~~~~~I--~~~-r~~~~~8 FORMANT HHHH~~r+~~-r~+-~+-~I~-I~~rl7V CHART
I II 11I I V9 CaZiLrww 1ft huncirccLJ
-+-f-+-II-f-+-+-+-+--+-+--+--+----+-+--+-1--t-+-1---t---t--7 rtf eye 04 ~ I 11 V pq-+-+-I~-+--i--+I-t-t--+~i-I---t--+--tr -t--t-Tj-ri~middotltJ ecentimeters 1octGy
I V 5miU~ - aemiton ~~~~I~~+-~~l~-~-T~I~~~r~
t i lt~ I I IS I I liV
FolUlAn C1LBT
Placing a single point on this chart is an assertion T hat rormants have been observed at two frequencies one formant at the frequency namfu along the right or left edge the other formant at the frequency named along the top or bottom edge
31
I I
I ~_ f __
~~~ - - ---~ _-shy
I -- shyI - _v-- _ l
i _~~E~~~~middotmiddotmiddot ~---~--~~-it--_ ~_~ 1gt_ bullbull bull -_gt-~~~ ~ bullI
P~J r_i~=~~~ ~-~~~- - -1 I -----~ -~-~ _ ---_
~~Wa~~Ji~~L ____ __ _____ _
[PEs]
I __ shy
-- --shy
~~ ~ -Qt-shy
-~=-=----
~~~7=~~ L___ __ __ ____ _ ______~
[rFm]
32
[PEt]
bull - -IIot-__
- ---~~--
[dEk]
---
33
f ~
I
) I I
I
I I
I 1 I
I I
I
1
__ -~_~i~~-yen-=-- ~~-~= --
------------------------
[dEn] [sEn]
i
~ ----shybull __ ~
[cEr)]
34
1J i i
~
--~~ ~-
~~
-~- ~ -~ ~~ ~gt-- ~- ~~
I ~IJItt- F ~ 111 i~-~_~--- ~--- - _ =-- 4e -~~~-~_-_~-- _~
bull vf middotmiddot~~tmiddotmiddotl____________________~____ j
[sEp] [bEk]
[bEl]
~ shy~~--_o-
J -~~~
~~t~-~~J~ r~~7~ _
I middot---=i---=-~_4~ __ ~~~~~___I _ _~
~g_i$fj bull - ~-~~~z~ir~~ ~~~ leal -~I_ iiIB
L_________ __~________ _____~
[lEs]
I f
I
35
- --- ---- - ---- ----------
~-------- shy
bull
j
i
[tEll][dan]
[dEp]
36
The distribution for the sounds which the informant
produced and recognized as the phoneme A range~ on the
vowel chart from 600-750 hz for formant 1 and from 1600-2300
hz for formant 2
CHART IV
A
i6
i I I
I I
I I
I I
1 0
I
I I I
I I
I I
s
It
i j I Ii i I
I I
6
~ I 1 I I I I ~
I I I V~ FORMANT ~~~~~I~1~4-+-~~~--~1-+~~I~-~-r17 CHART
~~~~~~l~~~~I~i~~~~I~+I~~lr_I~I~~~$ ~U~~~h~~ ~ I I I I I ~ 7 J eye ptI -cony
1f4-i--~--+---I----t--I-4--~1--+---+--+---+---1-~i7-to e cVltJte1 oct4v
i I I I 1 5miU~ - bull iton ~~~~~~~~~middot~~~~4-~I~I--~+~middoti i
2~ I I
F01UlANT CiLlT
Placing a single point on this chart is an assertion tnlt rorreints have bE-en obsered at two frequencies one formant at the frlquerJcy nSleU aiong he right 01 eft edge the other formant nt the frequency named along the top or bottom edge
37
I I i
-shy
I
I
I
~1iI
p~~~~==~~~~i~~~~
I I
[lAs]
_7 -~
-- -shy
L _ _ _ ____________ --- -- ----_~____J
[nAn]
--------
38
I I
------------------~----I I 11 I I
II1
flt~
I
IJ
L
i
______________________
[sAk]
f
~~ ~--r
1 shy
~~-
-- shy[sAn]
I r 1I I I
t
t
I l I
I I I
I i
I
[sAt)] [sAp]
39
~]
I
I I
[rArl][bAk]
I
-shy ---==-_____lshy___
[lAp ]
40
~----------------------------~-------------~
1 bull -l----1-shy
~middot-~-~t-=-- -
~r-shy -shy t~ III M -~ ~~---shy~t-= ~r=_ _shy
C z---=-
L______________________----- [dAs]
[dAr]
l _
41
v 1
I I
i
I
I -tc - bull ~ 1t iCSi4 _ -
-~~-r~middot- 1 ____ ~~~~ ~ ~ I
1 I ~=~j3~middot7-__ ~~
[kArl
---------------------~------
[dAin]l
I I
-I
I
42
I gt1 tmiddot
I
[bAm]
bull
~ I 1 I
gt1
-- - ___ _ N ____ ~--shy---- shy
[bAn]
43
[lAh]
==III
I Imiddot
__~_--_middotfI_~__ ~ ennee ~ S
LL-
[JAk]
--------- ---------
44
---------
I i Ir I
I I j
i
I i
~ --_ -- ~
~~fb-~~~~~~ ----- shycshy7FiIf Elii=s FUP WRmiddot 75t3~ n JIilIeia
~------------
[JAs]
-II
I J
[dAnl
45
~ I 1shy
I
iI shyi t
- - - Imiddot--- ~p -~--~= roc - I
I II i
I I I
~ middot1 I
------J
j I
I I i
i I
1_____ --- I ---------------~
[kAs]
I
I I
I t
I I i
j poundiampl d
rshyl
I i
I
1
I I I
I Il
[bAl]
I~
[bAl)]
I
47
L---------------------- --------------~
[kAp] shy
t
I-- I ~ I i
I
ji I
I -I
I 1 I 1
i
)
~~
~L~--~~---~ - ~ ~
~ -shyY- r i
I
-
1
I I
)
----~ -shy- -- _ ~ ----shy
1 I i i I I
1 I
L ~~~~-~~-~-~~~-~~-gt-= rn~ J ___fi ~ 7 7TZ r~ 5UZs=j -~ l ____-------- _____ __ _ ___________ ________ I
[kAk]
i
I t r ~
--~~ -shy
~~~c~_=--_u ce4 we
I r bull
[gAr)]
~-~ shy
- -~ -~~
~P ~-~~
I ~~
-- bull ~ I - ~~-~~
~-~~~--~ shymiddotT _i
48
-----------------------------l
I I
I I
[rAk]
~_
~ ~--- ~~~-~
j ~~ ~ ~ ~7
~ bull~~middote ri~-is~~~l-IIII-middotlIIIIn---I~-- 41~~~~~ ~
1--=-_---- - - -===--------shy
[sAil]
I
49
_- I I
I -- ----------------shy
~2~~~ ~~
i i I I ~~~~~~~~b ~-
middot_- _ ~~------
j
i ~ at -== l - -- ~-~~it I ax I C1 bullbull~~- shy
I
I i
I I
I 1 I II r I I
-r- --shy
~~-~-~- -~-
-1 l I
I I
[bAs] [PAs]
r-------------------~------------___
[pAl]
I
50
The distribution for the sounds which the informant
produced and recognized as the phoneme 0 ranged on the
vowel ~ha~t from 400-525 hz for formant 1 and from 700~1000
hz for formant 2
CHART V
0
III
t5
lot
S
6
Ie
to
Z7 Zit 9 I 1 I a I z I a 6 6
I
I ~ I
I i II I
j i bull I I
I I I i I
I ~ t
~ ~I I
f I
I ~ f A I I I
j [- V I 1 I I I II ~ I 1 I I
At I
I t I I
V V
V 7
i I Vi( FORMANT I 1 I 1 CHARTI I
I V 3 C41iotc4 ill lUjn~ 01 eycpr ~0It4
i I f I IV
I ) I V IO 6 centltcrs 1 octcv1 I I I 5miU~ -Istmi-toneI
I I VII 2 I ltQshy t 116 IV
FOlUlUfT CRBT
Placing a single point Oll this chart is ampn assertion that formants have been observed at two frequencies (me iormant at the frequency nametl ~ong the right or left edge the other tonnant at the frequency named along the top or bottom edge
Ishy
51
r--- -_-__ - --------shy
-- ~--- --shy~ -
--f -~-
[tOll][pOn]
~ ---- -11lt1 ~
~-- - -~ P---~Amiddot_
t _ __ _
1 r I
--1 i I
I
I ~~~J L____ _ 1 rshy
[dOs] [b0s]
i Imiddot
52
---------------------~---
i I r -------- --------shy
r~~middot-~ [
I V I ~~
I - shy
~~~middottdmiddot~~-~-middot~-
S~~i~~-~ ~- bmiddotmiddotmiddotL _____middot_ ~_
[bOr] [rOk]
I
1 I
i i
j
I
[dOpJ[pOl]
53
Ii --~ --~--- -~~~~--=- I r
~ ~- ~ - ~ - shyI - -~ ~~ -~~ I
-1bullbull - h ~~~
~~~ ~ ~~~~----- ~~-~~~-~- ~--~~~~L- ~bullbull
I middot~-~middotdf r scr ~~~~~
~-laquo~~-==~~~-~~--~~~~ ~~
I
[lOs]
I
I
r I
i 1
i 1
I I J_____~ __ _-_M___J
[bOn]
54
i -~----
I I I r r
~-~ -shy
[bOn][sOp]
jI ----II I J
i
I I I
I I I i
I~~~==it shy
[jOk][tQr)]
55
1 I
I
II I I I
I c ~~~~~~~~ ~~OOWJI~~=U
[lOh]
i I
I
I ~~~-
I ~- -- shyl - _- ~ shy
I ~n=~~-~middot ~FlR T =Iti 1amp11 dill_
__-J
[pOt]
__J pOs]
1
- =xu
[bOk]
I
56
The distribution for the sounds which the informant
produced and recognized as the phoneme lUI range~ on the
vowel
hz for foimant
chart in an
1
almost square-like pattern from
and from 700-1000 hz for formant
250-350
2
CHART VI
lui fIG
3
t
ts
~
la
Il
IT zt 20 IS
I I
I I
i j
I
I j
I I
I
I I I
I t I I I1
I J I I I
~ i I LJ J I~
I
I
I
la -I
10
I
I I I 1
t I I i
I
I
I I
I
I I I
I ~ 1 v I)
V V
qV
FOlUfANT atRT lt
8 6
I t lt
~
I
l --~ I--- ~I I
i
I I
I I I i ltiI I
I i ~
I t
V
V V l( FORMANT I V CHART V
V Caiote4 iramp 1umb_ ef cycipampf on4
6 CelItlmctcrs bull octclv SmiUitoctamprs -I a~i-tonl
PlaciDg a single point on this chart is an assertion that formants have been observed at two frequencies one formant at the frequency named along ~he right or eft ede the other fonnant at the frequency named along the top or bottom edge
I
57
I
I
I -I
I
j _-
~~ -
-
bull I -
[dUp]
t I ~
~
I middot1
f
IshyIj II
I i
-------=shyI ~~-- -
L ~~-=-r--~~-III--=---
58
i middot1 I
I
i j I Imiddot
I~1 middotU~ _ s
I ~~~~~_-_-~--~ --_ I
L~ __________~_____________~ [CUll]
I
I
[dUr]
I
I J
I
I I
II
1
-yen ~ L___________ ~__ ~=~
I [kUs][pUn]
59
I
I
i L ~ -----------~-
____---shy______---2
~~~ -~ _
j ~---
I~~~-~-~ ~~ ~~
[nUn] [lUp]
I 1
~-=-~ ~~ -
[rlhn]
I
60
l
- _ ~~-----
~~~~~ JlCIIPrl fue rm ad I II
L ~ [gUI)] [kUk]
e_
__ ~ e-
~-d~~~~
[lUs] [jUs]
61
shy
I
Iii lEI and A Compa~ed
In comparing the distributions of the vowels III lEI
and IA( cf Chart VII on p 62 it is evident from the plots
that the front-back tongue position is for all practical
purposes identical ie the core distribution for all
three phonemes ranges between 1600-2000 hz This demonshy
strates conclusively that the significant phonetic differshy
ence is tongue h~igth ie t~e position of formant 1
The fact of phonemi~overlap is illustrated by the
crosshatching on Chart VII The cross-hatched area represhy
sents a r~nge of phonetic quality that is identified in one
instance as an III and in another instance as an IE or in
one instance as an lEI and in another instance as an IA
bullbullbull the sounds which follow one another in a changing sequence constitute the signals of speech and these sounds are produced by movements of the vocal apparashytus i e by movements of the lips tongue throat lungs and so on It is therefore important to understand that these vocal movements caused by the various muscles involved tend to slur into one anothshyer Since each variation of movement gives a varishyation in sound the slurring of movements produces a slurring of sounds Furthermore since specific sound will have different slurs of moveme~t depend~ ing upon the movement which it precedes or folloItJs each sound type resul tant from the productive moveshyments will vary somewhat according to the sounds which it precedes or follows (Pike 1947)
In line with this the next logical step would be to
look for environmental influences which would enable a listshy
ener to determine which phoneme was represented when phones
were recorded in the overlap area
62
CHART VII
lIlt lEI and A Compared
~ 2[7
t5
lot
5
ft
fA
Ie
Zit I zp 16 I a la 8 6
t I
~
II V I I I I +
r l~ ~ ~ I
I I ~ ~ V I I 1shy fZ I I t s
) I I j I I I
i ~ I 1 1 I I _lgt
V ~R R-r--~ I V
ItV l(
I I---I-
V~ j shy ~
I I I I FORMANTI I
I I VV CHARTI II I V S CaliL-tcd I Uut
I I I l of fIelc F- 0114
I I I I I j i I 10 ecentImeters 1oct4v
I
I ~ V Smillimctus Iumrton_ j VII
2f1 2~ 16 ltv
FOlUlANT ClIABl
Placing single point on this chart is an assertion that io-rnants have been observed at wo frequencies one formant at the frequency named ~ong the right or left edge the other formant at the frequency named along the top or bottom edge
63
A fairly thorough study of the positions of various
vowel sounds in specific environments did not indicate any
consistent variations of a particular type For example
the vowel in dim is in the lower range for the vowelIII
but the EI in dem is in the upper range -of the vowel lEI
Thus it seems probable that those sounds in the overlap area
are qualities for which minimal contrasts do not exist For
example the II in sih is in the overlap area but appar-middot
ently is clearly recognizable by a native sp~aker because
there is no seh at least no such word was known to the
informaht nor could one be found in the dictionary (Echols
and Shadily 1968)
IU and 0 Compared
In contrast with the front vowels III IE and IAI
the back vowels Iu and 0 have aconsiderable gap plusmn50
hz between the1r two distributions cf Chart VIII on
p 64 The distributions appear directly above one another
on the chart In comparing the two ranges it is appa~ent
that the front-ba~k position formant 1 is identical ie
the core distribution for the phoneme ranges from 700-1000
hz This demonstrates that ~he position of formant 1 ie
tongue height is the significant phonetic difference
64
CHART VI I I
U and 0 Compared
I I
i
5
~
5
6
til
~
2[1
I
Zit zp 15 IZ la a 6
~ I -~
1 ~ ~ ~
~
I V 1
V
I V ~
JIll ~
I I 1 6
1 middotV V l(
vI( FORMANT CHART
9 CalLOt-ctc4 ift 1awuutb of cyc14 p ICCOftI
I~ I V 6 eentllMtcrs 1 octo
I V 5mmi~ - ampImitenI VII
214 I 210 16 IV FOlUfANT CE1ART
PJaciDc a single point on this chart is an assertion that formants have been observed at two frequencies one form3nt at the frequency named along the right or left edge the other formant at the frequency named along the top or bottom edge
middotr I
65
II lEI IAI lUI and 101 Compared
In comparing all three phonemes in their respective
poJition on the vowel chart cf Chart IX an p 66 there I
se~ms to be no problem identifying between front and back
vowels There is a gap of approximately 400 hz between
th$ two back vowels and the three front vowels in terms of I
fotment 2 Also it would appear that there would be no
pr~blem in identifying specific vowel qualities so far as
fOfmant position is concerned for vowels in stressed position
with the exception of the phonemic overlapping discussed in
a preceding section ie III-lEI and IE-A
I
I
Imiddot I
CHART IX
I 1 E IA U and 0 Compared I
iM zr Ztt ap J 6 I Z 10 S 6
I I f ts I
~
tj1- ~
rL ~ ~
J 4- 1 ~ ~ i~ ~ V
Ii ~W~ V I ~~ ~ J
V I ~ ~
IS I ~ V 5 1 t
~
s ~ I I f
V R ~ r-~ I V
if~ V ~ ~
-- V 7
~ -~ [a ti I l( FORMANT
V CHART
V 0 cyclu on4 S CaULntte4 ilt hWldr_
I
Kl I jmiddotV I j V 10 6 centlrMtcll1 oct4v
V 5llIil(lCtampn ~ hl4Imiton
Vii 2~ zkgt 116 I IIyen
I
Forw~ CllABT I
Placing a single point on this chart is an assertion that formants have been observed I at two frequencies one formant at the frequency named along the rignt or left edgeI
the other formant at the frequency named along the top or bottom edge
~ ~ bull -
66
I
I I j
Cbull
I I
i
CHAPTER V I SUMMARY AND CONCLUSIONI
I As is shown on Chart IX on p 66 there appears to I I
bela very discernable distribution for each of the vowel I
Phtnemes of Bahasa Indonesia This does not mean that the
ci cumscriptions of each of the various sounds indicate I
detinite border lines for each vowel Rather it shows i
th~ position o~ each vowel in relation to the other vowel
phbnemes The vowel charts show the position of the phonemes
i asl produceq by one native speaker of the language Thus
nJ conclusions can and should ~e made regarding the definite
oJter boundaries of the ranges of middotp~onemes As is implied I
b~ the term ranges the phonemes have no defined boundarshy
I i~s
i Bahasa Indonesia does not appear to have two front I
v~wels two back vowels and one central vowel as is implied
i+I
the traditional symbolization Rather it has three i
ftont vowels with a three-way contrast between high mid I
i a~d low and a two-way contrast of high vs mid in the back
a1ea of~he articulation chart If a traditional symbolshy
i~ation of the vowel phonemes of the language were now to
b~ dawn it would look like the following chart I I I
68
front central back
high
mid
low
I
U
E 0
A
Thus as has been demonstrated the impressionistic
sion of the vowel system was in error with regards to
central phoneme of the language investigated There
a ears to be no low-central phoneme in the language
r it is a low-front one Although the spectrograph
c nnot establish a phonemic system of a language on its
o n it can provide a yes or no answer about the phoneshy
t c qualities of the phonemes in question After a phoneshy
m c system has been established the spectrograph can proshy
v de phonetic data which distinguishes one phoneme from
a other
BIBLIOGRAPHY
Sources Cited
Almiddotsjahbana Takdir The Indonesian Language - By-product of Nationalism Pacific Affairs XXII (1949)388-92
Am rican University Area Handbook for Indonesia Washingshyton DC ~S Government Printing Office 1970
Blch B and G Trager Outline of Linguistic Analysis Baltimore Waverly Press 1942
Du n H K Calculation of vowel resonances Journal of the Acoustic Society of America XXII (1950) 740-53
ols John M and Hassan Shadily An Indonesian-Enqlish Dictionary Ithaca Cornell University Press 1963
ner C Reserches sur la structure des voyelles orashyles Archives Neerlander Phonetic Experiments XX (1947) 40-77
obson Roman C Gunnar Fant and Morris Halle Prelimshyinaries of Speech Analysis Cambridge MIT Press shy1961
J s Martin Acoustic Phonetics Baltimore Linguistic Society of America 1948
L defoged Peter Three Areas of Experimental Phonetics London Oxford University Press 1967
P Mario Glossary of Linguistic Terminology New York Columbia University Press 1966
Perce Joe E The Spectrographic Study ~f Vocalic Nuclei Language Learning XII (1963) 241-247
- --- Phonemic Theory and the Analysis of English Syllashybic Nuclei Linguistics XVII (1965) 36-57
P ke Kenneth L Phonemics Ann Arbor University of Michigan Press 1947
70
Pi e t Kenneth L Phonetics Ann Arbor University of Michigan Press t 1943
Pu gram Ernst Introduction to the Spectrography of Speech New York Dover Publications 1966
ir Edward Language An Introduction to the Study of Speech New York Harcourt Brace amp Co 1921
enbeck E M Indonesia and Malaysia 1I Current Trends in Linguistics IIX (1967) 55-111
dman Dorothy The Republic of Indonesia New York N Y Philosophical LibrarYt Inc 1955
Sources Consulted
r e j e v N D bull Some ProbIem s 0 f Baha s a In don e s i a Ph a nshyology Studia Linguistica XI (~1957) 44-46
lingmiddotC L Linguistic Units The Hague~ Mouton amp Co 1960
J obson t R Hague
and M Halle Mouton amp Co
Fundamentals 1956
of Language The
K nedy Raymond Bibliography of Indonesian Peoples and Cultures New Haven Yale University Press 1962
Perce Joe E Spectrographic Study of English Vowels Under Primary Stress Linguistics LXXXIV (1-972) 41-84
P ttert Ralph K George A Kopp and Harriet C Green Visible Speech New York Dover Publications t 1966
T euw A Critical Survey of Studies on Malay and Bahasa Indonesia The Hague Martinus Nyhoff 1961
-basin
-head of an area
-form of address
-ball bag
-bell
ba --bank I
bUr --you I
bi --beer
bomiddot--drill I
ba--bliJss
bi --bus i
I t
bo I
--bunch bun~le i I
ba--crossbeam
--bomb
--tire
--son of
--ration coupon bond
--garbage dump
--checkered design
--inch
--and plus
APPENDIX A
LIST OF WORDS
den~-abbrev of the title raden
dar--olace location
dur--pearl
das--a shot
dos--small box
dek--deck
dik--younger sibling
dep--to b~ shelved
dop--hubcap
dup-~to be baptized
djak--jug
djok--seat
djas--coat
djus--part of the Koran
gang--paBsageway hall
gung--gong
kak--form of address for elder
kik--handloom
kuk--collar harness
kar--map
kir--jo test
kas ~money supply i
kus -to hiss spit I
lahi-alreadY
loh-writing tablet
lapi -towel I
lup -magnifving glass or
last -IrJeld i oint
lesl -lessonI
lOs -shed I
I I
-to iron
-which who
nu -yonder
po
pa --pole
pa --to fit
pe --plague I
po --mail I
pel --cap
pOI --pot
--pound
--also
r --shelf
--shirt
g-o-rank position
g--ring
--brake
rum--cream
sah--valid legal
sih--an enclitic usedmiddotto soften what follows
san--form of address far sargeant
sen--cent
sang--superior
seng--zinc
sap--line row
sep--chief boss
sop--soup
sjak--suspicion doubt
sjok--attractive
tang--tongs pincer~
ting--sweet meat
tong--barrel vatmiddot
teh--tea
toh--yet nevertheless
tjeng--molasses
tjung--young boy
III 1
APPENDIX E
LINGUISTIC SYMBOLIZATION USED
IAI~high-front-openIi
II
~ r
E~-mid-front-~pen
III
AA-low-front-op~n t1
o1-mid-back-open
Uf-high~baCk-close III
I III
~~~vd bilabial stop
[dj~vd alveolar stop l
I I
[kt-Vl velar stop I
[g I-vd bull velar stop
[1 -lateral I
(n-vd alveolar nasal 1
(m~-vd bilabial nasal
~I-Vd velar nasal
I
III ~IJ
I
q
dl
I
Iil~
I
Vowels
Consonants
[p]-vl bilabial stop shy
[t]-vl alveolar stop
[rJ-vd alveolar flap
[jJ-vd palatal affricate
[CJ-vl palatal affricate
[S]~vl bull alveolar affricatmiddote
[s]-vl alveolar middotfricative
h]- vI velar aspirant
5
Back of the purely objective system of sounds that is peculiar to a language and which can be arrived at only by a painstaking phonetic analysis there is -a more restricted inner or ideal system which perhaps equally unconscious as a system to the naive speaker can far more readily than the other be brought to his consciousness as a finished pattern a psychological mechanism The inner sound system overlaid though it may be by the mechanical or the irrelevant is a real important principle in the life of a language
Once it was accepted that language had a definite phonologshy
ical structure a method was devised to describe this undershy
lying system This method became the science of phonemics
The phonemic structure of a language represents the minimal
number of sound signals which make transmission of informashy
tion possible Spectrographic analyses of t~ese minimal
sound signals provide objective and empirical measurements
of the quality of these minimal sound features
Statement of the Problem
This investigation will determine the range of free
variation of Bahasa Indonesian vowel phonemes in a given
phonemic environment and types of conditioned variation
from one environment to another The nature and ra~ge of
the vowel quality for each phoneme will be determined by
spectrographic measurements
Delimitations of the Study
This study will only deal with Bahasa Indonesian
vowels sounds produced with vibration of the vocal cords
6
by unobstructed passage of air through the oral cavity
and not constricted enough to cause audible friction
Pei 1966) They will be the vowels found in monoshy
syllabic Indonesian wo~ds under primary stress and in a
consonant~vowel-cDnsonant pattern Each word will also
be part of a minimal pair ie every word must be conshy
trasted with another word in which only the medial vowel
is different andto which a different semantic meaning is
attached
CHAPTER II
THEORETICAL BACKGROUND
PhoneticsPhonemics
Phonetics is the branch of linguistics which deals
with the actual speech sounds of a language When dealing
with the phonetic level of linguistic analysis one describes
the sounds of a language in terms of articulation or acoustic
features In articulatory phonetics one describes sounds
in middotterms 9f manner of articulation ie whether it is a
stop fricat~ve etc point of articulation ie) bilabial
(be~ween the lips) dental etc or vowel quality ie
high-front-close (the highest part of the tongue-is very
high in the front of the mouth for producing this particular
sound) etc In acoustic phonetics sounds are described in
terms of the distributions of frequencies characteristic of
the sounds of a language The relationship generally acshy
cepted as existing between artic~latory and ~coustic phonetshy
ics is that certain articulations produce certain distinctive
patterns of frequency distributions It must be emphasized
at this point that both of the aforementioned types of deshy
scriptians deal with all human speech sounds not necessarily
those which perform a signalling function in a particular I
aspect of the language
I I
f
8
Distinctlve features are used to denote signalling
functions The label distinctive feature is used in the
literature to mean two quite different things Bloomfield
describes the categorization with examples which imply
that distinctive sound feature means any feature of the vocal
sound which when changed changes the meaning of a given
word eg pill and bill sin and sing etcri (Pierce 1965)
There Bloomfi~ld labels p as a distinctive sound feature
and b as a different sound feature Later Roman Jakobson
Gunnar M Fant and Morris Halle in their Preliminaries of
sectpeech Analysis take the phonemes of a language and break
them down into their component phonetic features some of
which are distinctive eg voicing in English b vs p
while others are not eg aspiration in English p~ in pin
as opposed to p in spin Anyone language code has a
finite set of distinctive features bullbullbull (Jakobson Fant and
Halle 1961) In English the feature of voicing in the b
of bill as opposed to the absence of voicing for the p
in pill is the phonetic feature which distinguishes these
two sounds A similar presence vs absence of aspiration
does not alter the meaning of any English utterance in fact
it is difficult to make English speakers aware of the fact
that aspiration is or is not present Implicit in this
theoretical approach is the concept that the variation in
human speech for the most part re~resents presence vs
9
1
absence of non-distinctive features of sound
One theoretical approach to linguistic structures
views the phoneme as concurrent bundles of distinctive
features (Jakobson Fant and Halle 1961) Each language
has a finite set of rules for grouping them (distinctive
features) into phQnemes (Jakobson Fant and Halle 1961)
Every phoneme in the language then is composed of a unique
set of distinctive features such that it is different from
any other phoneme by at least one of such distinctive feashy
tures This manner of linguistic signalling has important
implicat~ons toward phonemic analysis of sound systems As
previously mentioned a phoneme is a bundle of distinctive
features which when altered changes meaning In order
to verify whether a sound is a phoneme or not one must
show a word in which the replacement of at least one disti~c-
tive feature makes another word ie a minimal pair difshy
ferentiated by only a single distinctive feature and having
two distinct grammatical or semantical meanings
Phonemics the study of phonem~s is the level of lingushy
istic analysis which answers the question of how language
utilizes sound matter selecting certain of its elements and
adapting them for various ends The prima~y functions of
sound in a language is to distinguish one utterance from anshy
other in normal conversation Phonemic analysis as an opshy
eration examines a~ailable data in order to discover an unshy
derlying structure bullbullbull not an operation which forces a mass
1 0
of data into a structure (Pulgram 19~5) The nature of
each feature is of the essence Thus the composition of
each phoneme becomes of primary importance in a language
The phoneme can only be defined in reference to the larger
frame whi~h is the language of which it is a structured
feature (Pulgram 1965) It is the shortest stretch of
sound which serves a signalling function
Acoustic Theory
I Distinctive feature theory as previously describedI I seems to handle such phonemes s stops fricatives and
I nasals quite well eg the airflow out of the mouth is I
either stopped or it is allowed to escape On the other
1 hand vowels seem to be ranges of phonetic quality whichI
are extremely difficult if not impossible to distinguish
in terms of presence vs ab~~nce of distinctive features
Since this study will not be concerned with consonants but
only w~th vowels it is only necessary to discuss the acousshy
tic nature of vowel qualities from this point on
FundamentalsHarmonics
Vowel quality is determined by a combination of a fundashy
mental and its harmonics A vowel quality displayed on an
oscilloscope shows a very complex single wave form This
wave form is in reality the mathematical sum of a number
of simple wave forms or at least for theoretical purposes
1 1
can be treated as such These wave forms are generated
in the oral tract by the opening and closing of the glotshy
tis The fundamental wave is a sine wave with a frequency
equal to the number of times the glottis opens and closes
each second and an amplitude which is directly pro~ortion-
al to air pressure in the lungs Because of the nature
of sound waves a harmonic is generated at every multiple
of this fundamental eg if the fundamental is 100 cycles
per second then a harmonic is generated at 200 300
400 bullbullbull CO As soon as the complex wave leaves the vocal
chords harmoni6s are filtered out by the nature of the
tissue surrounding the oral tract as well as the cavities
in and adj o 1ning the oral tract The complex wave emerging
from the mouth is the mathematical sum of fundamental and
the harmonics which have not been filtered out by the oral
tract cf Martin Joos Acoustic Phonetics (1 948) chapshy
ters 1 and 2 for a fuller explanation of this process
Acoustics vs Articulation
In the last century far too much energy has b~en exshy
pended in attempts to relate acoustic features to specific
articulatory movements Bloch (1942) illustrates this by
stating qualities are identified by ear but in linguisshy
tic works they are traditionally defined in terms of their
assumed production by the vocal organs This type ofmiddotstudy
is misdirected because the only things that impinge on the
I I
- I
12
human ear are the harmonics which were not filtered out
The articulatory movements which cause the filtration ie
movement of the tongue from front to back creating a series
of filters each of which removes different harmonics
from the complex waves are irrelevant Pike (1943) argues
one should analyze and describe the sounds (or sound waves)
themselves rather than the movements ~roducing them
It has long been noted by acousticians that a variety
of articulatory movements remove the same harmonics and
r~sult in the production of very similar sounds Pierce
(1962) illustrates this by saying
As long as the formants are in their praper positions ie the proper frequencies are passed through the speech mechanism it does not matter whether the unwanted frequencies are filtered out by rounding the lips or moving the tongue to the back ThuQ when Holbrook and Carmody give one front-back position for the tongue for a given English vowel and IPA (International Pho~etic Alphabet) gives another it is quite probable that both are completely correct and that the formant shift is made by compensating for the lack of tongue movement in the speech of some speakers by additional lip rounding bullbullbullbull
Since the hearer of a stream of speech can hear 9nly those harmonics which emerge from the mouth as componshyents of the final complex wave the placement of the formant is of primary importance not the articulation which produced the sound
Therefore a study of the phonetic quality of vowels
demands an instrument which is capable of making an accurate
record of the presence or absence of all the harmonics
having sufficient amplitude to significantly alter the final
wave form The acoustic spectrograph is such an instrument
13
it was the first instrument to make large scale acoustic
a n a ly s e sapr act i c a I po s sibiIi t Y n ( Lad e fog ed 1 967 ) bull
Spectrograph
The acoustic spectrograph is a device ~hich records a
stream of speech 2~4 seconds or less in length This
recording is then fed into the analyzing part of the specshy
trograph where at each successive playing ne frequency
or rather one frequency band is lifted outof the total by
the variable filter (Pulgram 1965) A black ma~king is
made on a piece ofmiddot electro-sensitive paper each time there
is a harmonic present within the frequency band being anashy
lyzed Since the articulators are constantly moving and
changing the filtration characteristics of thevocal tract
the black markings ma~e by a stylus reflect the movements
of the articula~ors in a very broad sense More important
however it makes a precise record of the stimulus ie
the harmonics which reach the ear of the listener Dunn
(1950) says the vowels have asso~iated with them different
frequency regions in which the sound is more intense than
elsewhere in the spectrum The name formant has been apshy
plied to these regions
The next problem then is to relate the concentrations
of power mentioned above ie the formants to human pershy
ception of speech sounds The most widely utilized techshy
nique in this area is one devised by Martin Joos (1948)
~______________________________________~S___________________________________________________shy1
14
generally referred to as his 2 Formant Theory This techshy
nique represents the plotting of formant 1 and formant 2
in a specific wayan a particular chart cf Chart 1 on
p~ 23 This technique is clearly described by Ladefoged
(1967)
The relations between the formant structures of the vowels in a number of words can be conveniently represented by means of formant charts which show the frequency of the firs~ formant at a time in the word when the formant structure is changing at a minimum rate plotted against the frequency of the second formant at the same time
When making these kinds of plots a charting is derived of
vowels for any language which is remarkably like the tradishy
tional impressionistic vowel charts of the 19th century
Esner (1947) illustrated that if the frequency of the first
formant was plotted against the frequency of the second
formant it seemed to equal the relation between formant
frequency and the traditional vowel diagram
Basically this study will reproduce such vowel charts
for a number of examples of each sound in Bahasa Indonesia
Formant 1 will be platted against formant 2 for each vowel
phoneme in a variety of phonemic environments -The purpose
of this will be to determine the range of variation for
every vowel in each e~vironment as produced by a single native
speaker
CHAPTER III
METHODOLOGY
Phoneme Identification
In order to assess the phonetic quality of vowel phoshy
nemes one must first ascertain the number and relationshy
ship of sound contrasts in a language ie the phonemes
The visual representation of the actualization of the phoshy
neme ie the spectrogram can only be made on the basis
of a preceding decision of the linguist on the types and
number of phonemes in the l~nguage to be anaiyzed (Pulgram
1965)~ Phonemic analysis cannot be made with phonetic
data alone it must be made with phonetic data plus a sershy
ies of phonemic premises and procedures (Pike 1947) A
spectrogram conveys phonetic information which aids the
linguist in determining which phonetic features are consisshy
tently present in order to reach the most accurate phonetic
description
There are a variety of premises and procedures which
the investigator may utilize in order to discover the phoshy
nemic structure of a language Pike (1947) argues that the
investigator must have at hand observable native reaction
to native sounds andor know structural facts pertaining to
the phonetic nature of the sounds and their distribution
As stated before a phoneme is a bundle of sound f~atures
1
j
16
which when substituted for another bundle creates a difshy
ference in meaning Since the creation of a different morshy
pheme is the result of the substitution of a different sound
feature these sound features are said to be phonemes
A pair of words in which the first word is the same as the second except for the fact that one segment is replaced by a different but phonetic~lly similar segment in the second word constitutes proof that the two similar segments are phonemically distinct~ bullbullbull Word pairs of this type are said to be MINIMALshyLY DIFFERENJ because no smaller difference in the language can make a differ~nce in meahing in words (Pike 1947)
Hence minimal pairs of words were used to find phonemes
Minimal~y different word pairs prove to be the beginners
single most important tool for the analysis of phonemic difshy
ferences (Pike 1947)
Thus Echols and Shadilys An Indonesian-English Dicshy
tionarv (1968) was ut~lized to find three-phoneme words
containing two consonant sounds with a vowel in medial poshy
sition The process was simply to go through all the words
beginning with consonants and find minimally different t~ree
phoneme words This was done on a purely anthr~poscopic
basis on the part of the investigator If a different letshy
ter was employed to distinguish a different meaning it was
assumed to be a different phoneme The following ~ord pairs
and their meanings are examples of the words found in the
dictionary
ban--tire bin--son of
das-- a shot dos--small box carton
I
1 7
pal--pole pel--field
rang--rank position ring--ring
teh--tea toh--yet nevertheless
After having obtained the words from the dictionary
a native informant was called upon to verify ~he differshy
ance in meaning in the minimal pairs and to pronounce
them so that ~hey could be phonetically transcribed in
al1 impressionistic manner The informant employed was Kok
Djen Su a student at Portland State University from Yogshy
jakartai Indonesia He has been a student in the United
States for approximately two years and speaks broken al shy
though very understandable English Mr Su was horn to Mr
and Mrs Su Hendry Su who both speak Bahasa Indonesia Jashy
vanese and a small amount of Chinese Since his birth the
informant was exposed to a mixture of Javanese and Bahasa
Indonesia but has employed the national language of Indoshy
nesia since the age of three at school His bilingual upshy
bringing it seems to the author does not craate a subshy
stantial difference in the competence of Mr Su in Bahasa
Indonesia In fact he was able to distinguish the proshy
nunciation Qf words in both Javanese and in Bahasa Indoshy
nesia The utilization of one informant deletes any reshy
gional variation or individual variation between informshy
ants Since here we are attempting to ascertain the relashy
tive range of phonetic quality of vowel phonemes in Bahashy
sa Indonesia the informants bilingualism ahould cause
none or very few phonetic distortions
After-having verified the difference in meaning of
the word pairs Kok Djen ~u pronounced the word The
following impressionistic version of the Ihdonesian voshy
wel system was described
front central back
high
mid 1 I
I I low j
i I I
I
u-
E 0
A
1 Spectrograms
The phonemic entities symbolized in the preceding
section represent range-units of phonetic quality The
symbols and their position on the chart are based on the
aural perceptions of the investigator The purpose of the
spectrographic analysis of this data is to determine as
accurately as possible the actual phonetic range represenshy
ted by each of thephonemic symbols
I
i
1 9
In order to make spectrograms from which meani~gful
conclusions can be drawn one must have a native informant
of the language to be studied Spectrograms were made of
the speech of Mr Su the informant described earlier
In order to conserve the time of the informant a
sample of three-phoneme words were recorded The three-
phoneme words begin and end with consonants ahd contain a
vowel in medial position The list appears in Appendix A
The list of words was specifically selec~ed to eliminate
in so far as possible all variatiqn other than that which
is specifically caused by the preceding and following consoshy
nants This is true because by utilizing a single informant
the influence of dialects both regional and social are eshy
liminated and by utilizing one sy~lable words under primary
1stress sequential influences such as the Markov Process
are eliminated since there is no sequence beyond one phoshy
neme preceding and following the vowel This being the case
one should be able to derive from a series of spectrograms
of those vowels both the range of free variation and the
specific influence of each particular consonant on the voshy
weI quality of each medial phoneme
The n~xt st~p in the procedure was to play the tape-
recordings into the spectrograph two or three wo~ds at a
1The Markoy Process is a mechanical way of handling enshytropy in sequential operations IQ linguistics this is stashyted in terms ofthe probability of the occurrence of a parshyticular phoneme morpheme etc in a precise sequence
20
time The machine can handle 24 seconds of speech on one
spectrogram thus two or three words could be analyzed at
the same time as one with no loss in quality or precision
Unfortunately the recordings had to be played into a
microphone which picks up some background noise but by
placing the microp~one of the spectrograph very close to
the loudspeaker of the tape recorder and turning the volume
up slightly this background was eliminated for all pracshy
tical purposes middotIt would have been better to have had a
direct connection between the recordar and the spectrograph
but unfortunately no such devce was available Background
noise shows up as very small specks scattered more or less
at random and unless the volume of such noise is exceedshy
ingly strong does not interfere with the reading of the
spectrograms
Once the machine had completed the analys~s and produced
the graphic record of the list of words a frequency measur~
ing device was produced by the machine cf example below
1 11amp II~ill c=
- n- HE to
11r -shy
bull b mmiddot 1 bull bull L
-
gIl F Jamp u
n _ If
bull III
21
This measuring device is in reality a spectrogram with horishy
zontal markings The first line on the chart represents a
frequency of 0 hertz (hz) Each line above the first repshy
resents a multiple of 500 hz The device is used to locate
th~ center of formants 1 and 2 Since it is graduated in
500 hz it is necessary to interpolate when the center ofmiddot
power for a particular formant falls between two of these
lines This is done by dividing the area between the two
lines in half then dividing one of the halves in half which
gives a range of 125 hz within which the measurement falls
and an estimate is made of the precise measurement within
the 125 hz range This should give formant positions with
an accuraci of greater than plusmn25 hz
When visual location of the formant centers becprnes
difficult a section of the formant can be made cf exshy
ample below Such difficulties with visual location usually
arise when two weak formants overlap Such overlapping
produc~s what appears to the naked eye to be a band of modeshy
rately dark grey bands The sectioner is a built in mech-
IshyfL__---
tete we tt
~
I
1 I
22
anism capable of handling such problems In the preceding
I example the amplitude of each harmonic is proportional
to the length of the line representing that harmonic I
This makes it possible to locate formant centers when vi-
I sual location is difficult
The measurements were then transferred to formant
charts cf Chart 1 on the following page
6
23
CHART I
~
t
1+
t5
1amp
Ie
z~ 2t 2p 16 12 la 8 Iii
I ~
~
I S
l I
I I
~
V V
V T
l( FORMANT V CHART
Vi ~ CcdiOrate4 ift luutdnM I V ~ cycle ~ concf
V 10 eeentl~rsI~ V
V U 5millimctcrs - I $milton
2 zk2 lis ty
I
FOlWAlfT CHART
Placing a single point on this cha-t is an assertion that formants have been observed at two frequencies one fOrrUlt at the frequency named along the right or left edge the other formant atmiddotthe frequency named along the top or bottom edge
ex Martin Joos~ Acoustic Phonetics (1948)
CHAPTER IV
FINDINGS
The data provided by the preceding methodology conshy
sisted of a series of scatter patterns on the vowel charts
Each of the dots within the pattern represented one occurshy
rence of a particular vowel To determine the range ofmiddot each
phoneme f the most divergent points in each pattern were con-
nected by a line These lines then circumscribe an area
which included the range of all the vowels in the sample
recognized ~y the informantmiddotas a particular phoneme
Verbal descriptions the actual charts of the phonemes
and the spectrograms utilized willbe found on the followshy
ing pages
25
The distribution for the sounds which the informant
produced and recognized as the phoneme 1 range~ on the
vowel chart in a broad scattering from 300-500 hz for forshy
mant 1 and 1500-2100 hz for formant 2
CHART II
1
lid
13
bull
~
It
iA
Ml
ztr Zit zp 1 S lIZ middot1 I a r 8 6
I
f
I I
Ii 3
[7l I I V 1 I
) ~I I i I bull
V I I i bull r J
I V t I I I I I
i tt I
Kl7 I I I iI ~
I I I I I I I I I i I
I I I i I f I ltII
I I l7 I VI
I [7 1
1 I I I Va FORMANTc7 CHART
I
I I I I 173 CaEiIw-atd icw~[7 rf ltfer C0ItdI I I
j I I I i 7 10 e centlCMta1 oct4v
I V 5miU~ bull itonI
r I f 711 t14 j I I I Ik IV
FoiUlAhT CHRT
Placing asinge point on this chart is an assertion that fortcants have been observed at two frequencies one formant at tn(l frequerlcy nameu Slong the right or eft cdampe the other formant at the frequency named along the top or bottom edge
26
l 1I I - -~
I I iI I
I
[bIs] [bIn]
lt-- -_- -1I
lt i
1 ~ i1_ -shy Ir ~ tmiddotmiddot lt
-- - - ---~--- - - - ----- --
-i -_~ ~ shyI 1
i I I
I I bullbullq_-
I ~~~-~--shyr ~~~~~ -~- I------------------------shy
-----I
[dIm] [sIh]
27
I -[blr]
i1 1 I I
i Ii I
I i I I
ii ___ -J
rmiddot I i
I 1 j
-~ ~~~ ~-~IIlIr~~~
I
1 ____~~l_~~--=~ _ ~--~~~~~~~~~- -
51 hI$ PiiB PD~ii~i
-~ - -- -- ----- ~------- - --- _-- - _ - shy [rIll) [klr]
28
1 I I I
---~S~ -~~~fi~ ~~~~~-~
~l_ middot~ ___
[klk]
I I I
r [dlk]
29
-------- --
-~- shy~--I~~
[tIll]
30
The distribution for the sounds which the informant
produced and recognized as the phoneme lEI ranged on the
vowel chart in a thin oval shaped distribution from 400-625
hz for formant 1 and from 1400-2000 hz for formant 2
CHART III
lEI
i
I
1 I
1
1middot
II~~ 5 I~ I lOa I ~--~~~I-+--+-4-+--+---+--++-+-+-+-+--r--t-t--r--t--r--1
I
I I I I
t I
4
I I 1 I ~ I I I I
I t I ~
I I ~
-r--- r--- I V~~~-r~+-+-~~~+-+-~~~~~~~--T-~-r~-r~-r~-T---T--r~
V~~~++4-~~~-4-+-+~~~~~+-~-T-rV~7
~iA~~~~~I+-~~~~~I--~~~-r~~~~~8 FORMANT HHHH~~r+~~-r~+-~+-~I~-I~~rl7V CHART
I II 11I I V9 CaZiLrww 1ft huncirccLJ
-+-f-+-II-f-+-+-+-+--+-+--+--+----+-+--+-1--t-+-1---t---t--7 rtf eye 04 ~ I 11 V pq-+-+-I~-+--i--+I-t-t--+~i-I---t--+--tr -t--t-Tj-ri~middotltJ ecentimeters 1octGy
I V 5miU~ - aemiton ~~~~I~~+-~~l~-~-T~I~~~r~
t i lt~ I I IS I I liV
FolUlAn C1LBT
Placing a single point on this chart is an assertion T hat rormants have been observed at two frequencies one formant at the frequency namfu along the right or left edge the other formant at the frequency named along the top or bottom edge
31
I I
I ~_ f __
~~~ - - ---~ _-shy
I -- shyI - _v-- _ l
i _~~E~~~~middotmiddotmiddot ~---~--~~-it--_ ~_~ 1gt_ bullbull bull -_gt-~~~ ~ bullI
P~J r_i~=~~~ ~-~~~- - -1 I -----~ -~-~ _ ---_
~~Wa~~Ji~~L ____ __ _____ _
[PEs]
I __ shy
-- --shy
~~ ~ -Qt-shy
-~=-=----
~~~7=~~ L___ __ __ ____ _ ______~
[rFm]
32
[PEt]
bull - -IIot-__
- ---~~--
[dEk]
---
33
f ~
I
) I I
I
I I
I 1 I
I I
I
1
__ -~_~i~~-yen-=-- ~~-~= --
------------------------
[dEn] [sEn]
i
~ ----shybull __ ~
[cEr)]
34
1J i i
~
--~~ ~-
~~
-~- ~ -~ ~~ ~gt-- ~- ~~
I ~IJItt- F ~ 111 i~-~_~--- ~--- - _ =-- 4e -~~~-~_-_~-- _~
bull vf middotmiddot~~tmiddotmiddotl____________________~____ j
[sEp] [bEk]
[bEl]
~ shy~~--_o-
J -~~~
~~t~-~~J~ r~~7~ _
I middot---=i---=-~_4~ __ ~~~~~___I _ _~
~g_i$fj bull - ~-~~~z~ir~~ ~~~ leal -~I_ iiIB
L_________ __~________ _____~
[lEs]
I f
I
35
- --- ---- - ---- ----------
~-------- shy
bull
j
i
[tEll][dan]
[dEp]
36
The distribution for the sounds which the informant
produced and recognized as the phoneme A range~ on the
vowel chart from 600-750 hz for formant 1 and from 1600-2300
hz for formant 2
CHART IV
A
i6
i I I
I I
I I
I I
1 0
I
I I I
I I
I I
s
It
i j I Ii i I
I I
6
~ I 1 I I I I ~
I I I V~ FORMANT ~~~~~I~1~4-+-~~~--~1-+~~I~-~-r17 CHART
~~~~~~l~~~~I~i~~~~I~+I~~lr_I~I~~~$ ~U~~~h~~ ~ I I I I I ~ 7 J eye ptI -cony
1f4-i--~--+---I----t--I-4--~1--+---+--+---+---1-~i7-to e cVltJte1 oct4v
i I I I 1 5miU~ - bull iton ~~~~~~~~~middot~~~~4-~I~I--~+~middoti i
2~ I I
F01UlANT CiLlT
Placing a single point on this chart is an assertion tnlt rorreints have bE-en obsered at two frequencies one formant at the frlquerJcy nSleU aiong he right 01 eft edge the other formant nt the frequency named along the top or bottom edge
37
I I i
-shy
I
I
I
~1iI
p~~~~==~~~~i~~~~
I I
[lAs]
_7 -~
-- -shy
L _ _ _ ____________ --- -- ----_~____J
[nAn]
--------
38
I I
------------------~----I I 11 I I
II1
flt~
I
IJ
L
i
______________________
[sAk]
f
~~ ~--r
1 shy
~~-
-- shy[sAn]
I r 1I I I
t
t
I l I
I I I
I i
I
[sAt)] [sAp]
39
~]
I
I I
[rArl][bAk]
I
-shy ---==-_____lshy___
[lAp ]
40
~----------------------------~-------------~
1 bull -l----1-shy
~middot-~-~t-=-- -
~r-shy -shy t~ III M -~ ~~---shy~t-= ~r=_ _shy
C z---=-
L______________________----- [dAs]
[dAr]
l _
41
v 1
I I
i
I
I -tc - bull ~ 1t iCSi4 _ -
-~~-r~middot- 1 ____ ~~~~ ~ ~ I
1 I ~=~j3~middot7-__ ~~
[kArl
---------------------~------
[dAin]l
I I
-I
I
42
I gt1 tmiddot
I
[bAm]
bull
~ I 1 I
gt1
-- - ___ _ N ____ ~--shy---- shy
[bAn]
43
[lAh]
==III
I Imiddot
__~_--_middotfI_~__ ~ ennee ~ S
LL-
[JAk]
--------- ---------
44
---------
I i Ir I
I I j
i
I i
~ --_ -- ~
~~fb-~~~~~~ ----- shycshy7FiIf Elii=s FUP WRmiddot 75t3~ n JIilIeia
~------------
[JAs]
-II
I J
[dAnl
45
~ I 1shy
I
iI shyi t
- - - Imiddot--- ~p -~--~= roc - I
I II i
I I I
~ middot1 I
------J
j I
I I i
i I
1_____ --- I ---------------~
[kAs]
I
I I
I t
I I i
j poundiampl d
rshyl
I i
I
1
I I I
I Il
[bAl]
I~
[bAl)]
I
47
L---------------------- --------------~
[kAp] shy
t
I-- I ~ I i
I
ji I
I -I
I 1 I 1
i
)
~~
~L~--~~---~ - ~ ~
~ -shyY- r i
I
-
1
I I
)
----~ -shy- -- _ ~ ----shy
1 I i i I I
1 I
L ~~~~-~~-~-~~~-~~-gt-= rn~ J ___fi ~ 7 7TZ r~ 5UZs=j -~ l ____-------- _____ __ _ ___________ ________ I
[kAk]
i
I t r ~
--~~ -shy
~~~c~_=--_u ce4 we
I r bull
[gAr)]
~-~ shy
- -~ -~~
~P ~-~~
I ~~
-- bull ~ I - ~~-~~
~-~~~--~ shymiddotT _i
48
-----------------------------l
I I
I I
[rAk]
~_
~ ~--- ~~~-~
j ~~ ~ ~ ~7
~ bull~~middote ri~-is~~~l-IIII-middotlIIIIn---I~-- 41~~~~~ ~
1--=-_---- - - -===--------shy
[sAil]
I
49
_- I I
I -- ----------------shy
~2~~~ ~~
i i I I ~~~~~~~~b ~-
middot_- _ ~~------
j
i ~ at -== l - -- ~-~~it I ax I C1 bullbull~~- shy
I
I i
I I
I 1 I II r I I
-r- --shy
~~-~-~- -~-
-1 l I
I I
[bAs] [PAs]
r-------------------~------------___
[pAl]
I
50
The distribution for the sounds which the informant
produced and recognized as the phoneme 0 ranged on the
vowel ~ha~t from 400-525 hz for formant 1 and from 700~1000
hz for formant 2
CHART V
0
III
t5
lot
S
6
Ie
to
Z7 Zit 9 I 1 I a I z I a 6 6
I
I ~ I
I i II I
j i bull I I
I I I i I
I ~ t
~ ~I I
f I
I ~ f A I I I
j [- V I 1 I I I II ~ I 1 I I
At I
I t I I
V V
V 7
i I Vi( FORMANT I 1 I 1 CHARTI I
I V 3 C41iotc4 ill lUjn~ 01 eycpr ~0It4
i I f I IV
I ) I V IO 6 centltcrs 1 octcv1 I I I 5miU~ -Istmi-toneI
I I VII 2 I ltQshy t 116 IV
FOlUlUfT CRBT
Placing a single point Oll this chart is ampn assertion that formants have been observed at two frequencies (me iormant at the frequency nametl ~ong the right or left edge the other tonnant at the frequency named along the top or bottom edge
Ishy
51
r--- -_-__ - --------shy
-- ~--- --shy~ -
--f -~-
[tOll][pOn]
~ ---- -11lt1 ~
~-- - -~ P---~Amiddot_
t _ __ _
1 r I
--1 i I
I
I ~~~J L____ _ 1 rshy
[dOs] [b0s]
i Imiddot
52
---------------------~---
i I r -------- --------shy
r~~middot-~ [
I V I ~~
I - shy
~~~middottdmiddot~~-~-middot~-
S~~i~~-~ ~- bmiddotmiddotmiddotL _____middot_ ~_
[bOr] [rOk]
I
1 I
i i
j
I
[dOpJ[pOl]
53
Ii --~ --~--- -~~~~--=- I r
~ ~- ~ - ~ - shyI - -~ ~~ -~~ I
-1bullbull - h ~~~
~~~ ~ ~~~~----- ~~-~~~-~- ~--~~~~L- ~bullbull
I middot~-~middotdf r scr ~~~~~
~-laquo~~-==~~~-~~--~~~~ ~~
I
[lOs]
I
I
r I
i 1
i 1
I I J_____~ __ _-_M___J
[bOn]
54
i -~----
I I I r r
~-~ -shy
[bOn][sOp]
jI ----II I J
i
I I I
I I I i
I~~~==it shy
[jOk][tQr)]
55
1 I
I
II I I I
I c ~~~~~~~~ ~~OOWJI~~=U
[lOh]
i I
I
I ~~~-
I ~- -- shyl - _- ~ shy
I ~n=~~-~middot ~FlR T =Iti 1amp11 dill_
__-J
[pOt]
__J pOs]
1
- =xu
[bOk]
I
56
The distribution for the sounds which the informant
produced and recognized as the phoneme lUI range~ on the
vowel
hz for foimant
chart in an
1
almost square-like pattern from
and from 700-1000 hz for formant
250-350
2
CHART VI
lui fIG
3
t
ts
~
la
Il
IT zt 20 IS
I I
I I
i j
I
I j
I I
I
I I I
I t I I I1
I J I I I
~ i I LJ J I~
I
I
I
la -I
10
I
I I I 1
t I I i
I
I
I I
I
I I I
I ~ 1 v I)
V V
qV
FOlUfANT atRT lt
8 6
I t lt
~
I
l --~ I--- ~I I
i
I I
I I I i ltiI I
I i ~
I t
V
V V l( FORMANT I V CHART V
V Caiote4 iramp 1umb_ ef cycipampf on4
6 CelItlmctcrs bull octclv SmiUitoctamprs -I a~i-tonl
PlaciDg a single point on this chart is an assertion that formants have been observed at two frequencies one formant at the frequency named along ~he right or eft ede the other fonnant at the frequency named along the top or bottom edge
I
57
I
I
I -I
I
j _-
~~ -
-
bull I -
[dUp]
t I ~
~
I middot1
f
IshyIj II
I i
-------=shyI ~~-- -
L ~~-=-r--~~-III--=---
58
i middot1 I
I
i j I Imiddot
I~1 middotU~ _ s
I ~~~~~_-_-~--~ --_ I
L~ __________~_____________~ [CUll]
I
I
[dUr]
I
I J
I
I I
II
1
-yen ~ L___________ ~__ ~=~
I [kUs][pUn]
59
I
I
i L ~ -----------~-
____---shy______---2
~~~ -~ _
j ~---
I~~~-~-~ ~~ ~~
[nUn] [lUp]
I 1
~-=-~ ~~ -
[rlhn]
I
60
l
- _ ~~-----
~~~~~ JlCIIPrl fue rm ad I II
L ~ [gUI)] [kUk]
e_
__ ~ e-
~-d~~~~
[lUs] [jUs]
61
shy
I
Iii lEI and A Compa~ed
In comparing the distributions of the vowels III lEI
and IA( cf Chart VII on p 62 it is evident from the plots
that the front-back tongue position is for all practical
purposes identical ie the core distribution for all
three phonemes ranges between 1600-2000 hz This demonshy
strates conclusively that the significant phonetic differshy
ence is tongue h~igth ie t~e position of formant 1
The fact of phonemi~overlap is illustrated by the
crosshatching on Chart VII The cross-hatched area represhy
sents a r~nge of phonetic quality that is identified in one
instance as an III and in another instance as an IE or in
one instance as an lEI and in another instance as an IA
bullbullbull the sounds which follow one another in a changing sequence constitute the signals of speech and these sounds are produced by movements of the vocal apparashytus i e by movements of the lips tongue throat lungs and so on It is therefore important to understand that these vocal movements caused by the various muscles involved tend to slur into one anothshyer Since each variation of movement gives a varishyation in sound the slurring of movements produces a slurring of sounds Furthermore since specific sound will have different slurs of moveme~t depend~ ing upon the movement which it precedes or folloItJs each sound type resul tant from the productive moveshyments will vary somewhat according to the sounds which it precedes or follows (Pike 1947)
In line with this the next logical step would be to
look for environmental influences which would enable a listshy
ener to determine which phoneme was represented when phones
were recorded in the overlap area
62
CHART VII
lIlt lEI and A Compared
~ 2[7
t5
lot
5
ft
fA
Ie
Zit I zp 16 I a la 8 6
t I
~
II V I I I I +
r l~ ~ ~ I
I I ~ ~ V I I 1shy fZ I I t s
) I I j I I I
i ~ I 1 1 I I _lgt
V ~R R-r--~ I V
ItV l(
I I---I-
V~ j shy ~
I I I I FORMANTI I
I I VV CHARTI II I V S CaliL-tcd I Uut
I I I l of fIelc F- 0114
I I I I I j i I 10 ecentImeters 1oct4v
I
I ~ V Smillimctus Iumrton_ j VII
2f1 2~ 16 ltv
FOlUlANT ClIABl
Placing single point on this chart is an assertion that io-rnants have been observed at wo frequencies one formant at the frequency named ~ong the right or left edge the other formant at the frequency named along the top or bottom edge
63
A fairly thorough study of the positions of various
vowel sounds in specific environments did not indicate any
consistent variations of a particular type For example
the vowel in dim is in the lower range for the vowelIII
but the EI in dem is in the upper range -of the vowel lEI
Thus it seems probable that those sounds in the overlap area
are qualities for which minimal contrasts do not exist For
example the II in sih is in the overlap area but appar-middot
ently is clearly recognizable by a native sp~aker because
there is no seh at least no such word was known to the
informaht nor could one be found in the dictionary (Echols
and Shadily 1968)
IU and 0 Compared
In contrast with the front vowels III IE and IAI
the back vowels Iu and 0 have aconsiderable gap plusmn50
hz between the1r two distributions cf Chart VIII on
p 64 The distributions appear directly above one another
on the chart In comparing the two ranges it is appa~ent
that the front-ba~k position formant 1 is identical ie
the core distribution for the phoneme ranges from 700-1000
hz This demonstrates that ~he position of formant 1 ie
tongue height is the significant phonetic difference
64
CHART VI I I
U and 0 Compared
I I
i
5
~
5
6
til
~
2[1
I
Zit zp 15 IZ la a 6
~ I -~
1 ~ ~ ~
~
I V 1
V
I V ~
JIll ~
I I 1 6
1 middotV V l(
vI( FORMANT CHART
9 CalLOt-ctc4 ift 1awuutb of cyc14 p ICCOftI
I~ I V 6 eentllMtcrs 1 octo
I V 5mmi~ - ampImitenI VII
214 I 210 16 IV FOlUfANT CE1ART
PJaciDc a single point on this chart is an assertion that formants have been observed at two frequencies one form3nt at the frequency named along the right or left edge the other formant at the frequency named along the top or bottom edge
middotr I
65
II lEI IAI lUI and 101 Compared
In comparing all three phonemes in their respective
poJition on the vowel chart cf Chart IX an p 66 there I
se~ms to be no problem identifying between front and back
vowels There is a gap of approximately 400 hz between
th$ two back vowels and the three front vowels in terms of I
fotment 2 Also it would appear that there would be no
pr~blem in identifying specific vowel qualities so far as
fOfmant position is concerned for vowels in stressed position
with the exception of the phonemic overlapping discussed in
a preceding section ie III-lEI and IE-A
I
I
Imiddot I
CHART IX
I 1 E IA U and 0 Compared I
iM zr Ztt ap J 6 I Z 10 S 6
I I f ts I
~
tj1- ~
rL ~ ~
J 4- 1 ~ ~ i~ ~ V
Ii ~W~ V I ~~ ~ J
V I ~ ~
IS I ~ V 5 1 t
~
s ~ I I f
V R ~ r-~ I V
if~ V ~ ~
-- V 7
~ -~ [a ti I l( FORMANT
V CHART
V 0 cyclu on4 S CaULntte4 ilt hWldr_
I
Kl I jmiddotV I j V 10 6 centlrMtcll1 oct4v
V 5llIil(lCtampn ~ hl4Imiton
Vii 2~ zkgt 116 I IIyen
I
Forw~ CllABT I
Placing a single point on this chart is an assertion that formants have been observed I at two frequencies one formant at the frequency named along the rignt or left edgeI
the other formant at the frequency named along the top or bottom edge
~ ~ bull -
66
I
I I j
Cbull
I I
i
CHAPTER V I SUMMARY AND CONCLUSIONI
I As is shown on Chart IX on p 66 there appears to I I
bela very discernable distribution for each of the vowel I
Phtnemes of Bahasa Indonesia This does not mean that the
ci cumscriptions of each of the various sounds indicate I
detinite border lines for each vowel Rather it shows i
th~ position o~ each vowel in relation to the other vowel
phbnemes The vowel charts show the position of the phonemes
i asl produceq by one native speaker of the language Thus
nJ conclusions can and should ~e made regarding the definite
oJter boundaries of the ranges of middotp~onemes As is implied I
b~ the term ranges the phonemes have no defined boundarshy
I i~s
i Bahasa Indonesia does not appear to have two front I
v~wels two back vowels and one central vowel as is implied
i+I
the traditional symbolization Rather it has three i
ftont vowels with a three-way contrast between high mid I
i a~d low and a two-way contrast of high vs mid in the back
a1ea of~he articulation chart If a traditional symbolshy
i~ation of the vowel phonemes of the language were now to
b~ dawn it would look like the following chart I I I
68
front central back
high
mid
low
I
U
E 0
A
Thus as has been demonstrated the impressionistic
sion of the vowel system was in error with regards to
central phoneme of the language investigated There
a ears to be no low-central phoneme in the language
r it is a low-front one Although the spectrograph
c nnot establish a phonemic system of a language on its
o n it can provide a yes or no answer about the phoneshy
t c qualities of the phonemes in question After a phoneshy
m c system has been established the spectrograph can proshy
v de phonetic data which distinguishes one phoneme from
a other
BIBLIOGRAPHY
Sources Cited
Almiddotsjahbana Takdir The Indonesian Language - By-product of Nationalism Pacific Affairs XXII (1949)388-92
Am rican University Area Handbook for Indonesia Washingshyton DC ~S Government Printing Office 1970
Blch B and G Trager Outline of Linguistic Analysis Baltimore Waverly Press 1942
Du n H K Calculation of vowel resonances Journal of the Acoustic Society of America XXII (1950) 740-53
ols John M and Hassan Shadily An Indonesian-Enqlish Dictionary Ithaca Cornell University Press 1963
ner C Reserches sur la structure des voyelles orashyles Archives Neerlander Phonetic Experiments XX (1947) 40-77
obson Roman C Gunnar Fant and Morris Halle Prelimshyinaries of Speech Analysis Cambridge MIT Press shy1961
J s Martin Acoustic Phonetics Baltimore Linguistic Society of America 1948
L defoged Peter Three Areas of Experimental Phonetics London Oxford University Press 1967
P Mario Glossary of Linguistic Terminology New York Columbia University Press 1966
Perce Joe E The Spectrographic Study ~f Vocalic Nuclei Language Learning XII (1963) 241-247
- --- Phonemic Theory and the Analysis of English Syllashybic Nuclei Linguistics XVII (1965) 36-57
P ke Kenneth L Phonemics Ann Arbor University of Michigan Press 1947
70
Pi e t Kenneth L Phonetics Ann Arbor University of Michigan Press t 1943
Pu gram Ernst Introduction to the Spectrography of Speech New York Dover Publications 1966
ir Edward Language An Introduction to the Study of Speech New York Harcourt Brace amp Co 1921
enbeck E M Indonesia and Malaysia 1I Current Trends in Linguistics IIX (1967) 55-111
dman Dorothy The Republic of Indonesia New York N Y Philosophical LibrarYt Inc 1955
Sources Consulted
r e j e v N D bull Some ProbIem s 0 f Baha s a In don e s i a Ph a nshyology Studia Linguistica XI (~1957) 44-46
lingmiddotC L Linguistic Units The Hague~ Mouton amp Co 1960
J obson t R Hague
and M Halle Mouton amp Co
Fundamentals 1956
of Language The
K nedy Raymond Bibliography of Indonesian Peoples and Cultures New Haven Yale University Press 1962
Perce Joe E Spectrographic Study of English Vowels Under Primary Stress Linguistics LXXXIV (1-972) 41-84
P ttert Ralph K George A Kopp and Harriet C Green Visible Speech New York Dover Publications t 1966
T euw A Critical Survey of Studies on Malay and Bahasa Indonesia The Hague Martinus Nyhoff 1961
-basin
-head of an area
-form of address
-ball bag
-bell
ba --bank I
bUr --you I
bi --beer
bomiddot--drill I
ba--bliJss
bi --bus i
I t
bo I
--bunch bun~le i I
ba--crossbeam
--bomb
--tire
--son of
--ration coupon bond
--garbage dump
--checkered design
--inch
--and plus
APPENDIX A
LIST OF WORDS
den~-abbrev of the title raden
dar--olace location
dur--pearl
das--a shot
dos--small box
dek--deck
dik--younger sibling
dep--to b~ shelved
dop--hubcap
dup-~to be baptized
djak--jug
djok--seat
djas--coat
djus--part of the Koran
gang--paBsageway hall
gung--gong
kak--form of address for elder
kik--handloom
kuk--collar harness
kar--map
kir--jo test
kas ~money supply i
kus -to hiss spit I
lahi-alreadY
loh-writing tablet
lapi -towel I
lup -magnifving glass or
last -IrJeld i oint
lesl -lessonI
lOs -shed I
I I
-to iron
-which who
nu -yonder
po
pa --pole
pa --to fit
pe --plague I
po --mail I
pel --cap
pOI --pot
--pound
--also
r --shelf
--shirt
g-o-rank position
g--ring
--brake
rum--cream
sah--valid legal
sih--an enclitic usedmiddotto soften what follows
san--form of address far sargeant
sen--cent
sang--superior
seng--zinc
sap--line row
sep--chief boss
sop--soup
sjak--suspicion doubt
sjok--attractive
tang--tongs pincer~
ting--sweet meat
tong--barrel vatmiddot
teh--tea
toh--yet nevertheless
tjeng--molasses
tjung--young boy
III 1
APPENDIX E
LINGUISTIC SYMBOLIZATION USED
IAI~high-front-openIi
II
~ r
E~-mid-front-~pen
III
AA-low-front-op~n t1
o1-mid-back-open
Uf-high~baCk-close III
I III
~~~vd bilabial stop
[dj~vd alveolar stop l
I I
[kt-Vl velar stop I
[g I-vd bull velar stop
[1 -lateral I
(n-vd alveolar nasal 1
(m~-vd bilabial nasal
~I-Vd velar nasal
I
III ~IJ
I
q
dl
I
Iil~
I
Vowels
Consonants
[p]-vl bilabial stop shy
[t]-vl alveolar stop
[rJ-vd alveolar flap
[jJ-vd palatal affricate
[CJ-vl palatal affricate
[S]~vl bull alveolar affricatmiddote
[s]-vl alveolar middotfricative
h]- vI velar aspirant

6
by unobstructed passage of air through the oral cavity
and not constricted enough to cause audible friction
Pei 1966) They will be the vowels found in monoshy
syllabic Indonesian wo~ds under primary stress and in a
consonant~vowel-cDnsonant pattern Each word will also
be part of a minimal pair ie every word must be conshy
trasted with another word in which only the medial vowel
is different andto which a different semantic meaning is
attached
CHAPTER II
THEORETICAL BACKGROUND
PhoneticsPhonemics
Phonetics is the branch of linguistics which deals
with the actual speech sounds of a language When dealing
with the phonetic level of linguistic analysis one describes
the sounds of a language in terms of articulation or acoustic
features In articulatory phonetics one describes sounds
in middotterms 9f manner of articulation ie whether it is a
stop fricat~ve etc point of articulation ie) bilabial
(be~ween the lips) dental etc or vowel quality ie
high-front-close (the highest part of the tongue-is very
high in the front of the mouth for producing this particular
sound) etc In acoustic phonetics sounds are described in
terms of the distributions of frequencies characteristic of
the sounds of a language The relationship generally acshy
cepted as existing between artic~latory and ~coustic phonetshy
ics is that certain articulations produce certain distinctive
patterns of frequency distributions It must be emphasized
at this point that both of the aforementioned types of deshy
scriptians deal with all human speech sounds not necessarily
those which perform a signalling function in a particular I
aspect of the language
I I
f
8
Distinctlve features are used to denote signalling
functions The label distinctive feature is used in the
literature to mean two quite different things Bloomfield
describes the categorization with examples which imply
that distinctive sound feature means any feature of the vocal
sound which when changed changes the meaning of a given
word eg pill and bill sin and sing etcri (Pierce 1965)
There Bloomfi~ld labels p as a distinctive sound feature
and b as a different sound feature Later Roman Jakobson
Gunnar M Fant and Morris Halle in their Preliminaries of
sectpeech Analysis take the phonemes of a language and break
them down into their component phonetic features some of
which are distinctive eg voicing in English b vs p
while others are not eg aspiration in English p~ in pin
as opposed to p in spin Anyone language code has a
finite set of distinctive features bullbullbull (Jakobson Fant and
Halle 1961) In English the feature of voicing in the b
of bill as opposed to the absence of voicing for the p
in pill is the phonetic feature which distinguishes these
two sounds A similar presence vs absence of aspiration
does not alter the meaning of any English utterance in fact
it is difficult to make English speakers aware of the fact
that aspiration is or is not present Implicit in this
theoretical approach is the concept that the variation in
human speech for the most part re~resents presence vs
9
1
absence of non-distinctive features of sound
One theoretical approach to linguistic structures
views the phoneme as concurrent bundles of distinctive
features (Jakobson Fant and Halle 1961) Each language
has a finite set of rules for grouping them (distinctive
features) into phQnemes (Jakobson Fant and Halle 1961)
Every phoneme in the language then is composed of a unique
set of distinctive features such that it is different from
any other phoneme by at least one of such distinctive feashy
tures This manner of linguistic signalling has important
implicat~ons toward phonemic analysis of sound systems As
previously mentioned a phoneme is a bundle of distinctive
features which when altered changes meaning In order
to verify whether a sound is a phoneme or not one must
show a word in which the replacement of at least one disti~c-
tive feature makes another word ie a minimal pair difshy
ferentiated by only a single distinctive feature and having
two distinct grammatical or semantical meanings
Phonemics the study of phonem~s is the level of lingushy
istic analysis which answers the question of how language
utilizes sound matter selecting certain of its elements and
adapting them for various ends The prima~y functions of
sound in a language is to distinguish one utterance from anshy
other in normal conversation Phonemic analysis as an opshy
eration examines a~ailable data in order to discover an unshy
derlying structure bullbullbull not an operation which forces a mass
1 0
of data into a structure (Pulgram 19~5) The nature of
each feature is of the essence Thus the composition of
each phoneme becomes of primary importance in a language
The phoneme can only be defined in reference to the larger
frame whi~h is the language of which it is a structured
feature (Pulgram 1965) It is the shortest stretch of
sound which serves a signalling function
Acoustic Theory
I Distinctive feature theory as previously describedI I seems to handle such phonemes s stops fricatives and
I nasals quite well eg the airflow out of the mouth is I
either stopped or it is allowed to escape On the other
1 hand vowels seem to be ranges of phonetic quality whichI
are extremely difficult if not impossible to distinguish
in terms of presence vs ab~~nce of distinctive features
Since this study will not be concerned with consonants but
only w~th vowels it is only necessary to discuss the acousshy
tic nature of vowel qualities from this point on
FundamentalsHarmonics
Vowel quality is determined by a combination of a fundashy
mental and its harmonics A vowel quality displayed on an
oscilloscope shows a very complex single wave form This
wave form is in reality the mathematical sum of a number
of simple wave forms or at least for theoretical purposes
1 1
can be treated as such These wave forms are generated
in the oral tract by the opening and closing of the glotshy
tis The fundamental wave is a sine wave with a frequency
equal to the number of times the glottis opens and closes
each second and an amplitude which is directly pro~ortion-
al to air pressure in the lungs Because of the nature
of sound waves a harmonic is generated at every multiple
of this fundamental eg if the fundamental is 100 cycles
per second then a harmonic is generated at 200 300
400 bullbullbull CO As soon as the complex wave leaves the vocal
chords harmoni6s are filtered out by the nature of the
tissue surrounding the oral tract as well as the cavities
in and adj o 1ning the oral tract The complex wave emerging
from the mouth is the mathematical sum of fundamental and
the harmonics which have not been filtered out by the oral
tract cf Martin Joos Acoustic Phonetics (1 948) chapshy
ters 1 and 2 for a fuller explanation of this process
Acoustics vs Articulation
In the last century far too much energy has b~en exshy
pended in attempts to relate acoustic features to specific
articulatory movements Bloch (1942) illustrates this by
stating qualities are identified by ear but in linguisshy
tic works they are traditionally defined in terms of their
assumed production by the vocal organs This type ofmiddotstudy
is misdirected because the only things that impinge on the
I I
- I
12
human ear are the harmonics which were not filtered out
The articulatory movements which cause the filtration ie
movement of the tongue from front to back creating a series
of filters each of which removes different harmonics
from the complex waves are irrelevant Pike (1943) argues
one should analyze and describe the sounds (or sound waves)
themselves rather than the movements ~roducing them
It has long been noted by acousticians that a variety
of articulatory movements remove the same harmonics and
r~sult in the production of very similar sounds Pierce
(1962) illustrates this by saying
As long as the formants are in their praper positions ie the proper frequencies are passed through the speech mechanism it does not matter whether the unwanted frequencies are filtered out by rounding the lips or moving the tongue to the back ThuQ when Holbrook and Carmody give one front-back position for the tongue for a given English vowel and IPA (International Pho~etic Alphabet) gives another it is quite probable that both are completely correct and that the formant shift is made by compensating for the lack of tongue movement in the speech of some speakers by additional lip rounding bullbullbullbull
Since the hearer of a stream of speech can hear 9nly those harmonics which emerge from the mouth as componshyents of the final complex wave the placement of the formant is of primary importance not the articulation which produced the sound
Therefore a study of the phonetic quality of vowels
demands an instrument which is capable of making an accurate
record of the presence or absence of all the harmonics
having sufficient amplitude to significantly alter the final
wave form The acoustic spectrograph is such an instrument
13
it was the first instrument to make large scale acoustic
a n a ly s e sapr act i c a I po s sibiIi t Y n ( Lad e fog ed 1 967 ) bull
Spectrograph
The acoustic spectrograph is a device ~hich records a
stream of speech 2~4 seconds or less in length This
recording is then fed into the analyzing part of the specshy
trograph where at each successive playing ne frequency
or rather one frequency band is lifted outof the total by
the variable filter (Pulgram 1965) A black ma~king is
made on a piece ofmiddot electro-sensitive paper each time there
is a harmonic present within the frequency band being anashy
lyzed Since the articulators are constantly moving and
changing the filtration characteristics of thevocal tract
the black markings ma~e by a stylus reflect the movements
of the articula~ors in a very broad sense More important
however it makes a precise record of the stimulus ie
the harmonics which reach the ear of the listener Dunn
(1950) says the vowels have asso~iated with them different
frequency regions in which the sound is more intense than
elsewhere in the spectrum The name formant has been apshy
plied to these regions
The next problem then is to relate the concentrations
of power mentioned above ie the formants to human pershy
ception of speech sounds The most widely utilized techshy
nique in this area is one devised by Martin Joos (1948)
~______________________________________~S___________________________________________________shy1
14
generally referred to as his 2 Formant Theory This techshy
nique represents the plotting of formant 1 and formant 2
in a specific wayan a particular chart cf Chart 1 on
p~ 23 This technique is clearly described by Ladefoged
(1967)
The relations between the formant structures of the vowels in a number of words can be conveniently represented by means of formant charts which show the frequency of the firs~ formant at a time in the word when the formant structure is changing at a minimum rate plotted against the frequency of the second formant at the same time
When making these kinds of plots a charting is derived of
vowels for any language which is remarkably like the tradishy
tional impressionistic vowel charts of the 19th century
Esner (1947) illustrated that if the frequency of the first
formant was plotted against the frequency of the second
formant it seemed to equal the relation between formant
frequency and the traditional vowel diagram
Basically this study will reproduce such vowel charts
for a number of examples of each sound in Bahasa Indonesia
Formant 1 will be platted against formant 2 for each vowel
phoneme in a variety of phonemic environments -The purpose
of this will be to determine the range of variation for
every vowel in each e~vironment as produced by a single native
speaker
CHAPTER III
METHODOLOGY
Phoneme Identification
In order to assess the phonetic quality of vowel phoshy
nemes one must first ascertain the number and relationshy
ship of sound contrasts in a language ie the phonemes
The visual representation of the actualization of the phoshy
neme ie the spectrogram can only be made on the basis
of a preceding decision of the linguist on the types and
number of phonemes in the l~nguage to be anaiyzed (Pulgram
1965)~ Phonemic analysis cannot be made with phonetic
data alone it must be made with phonetic data plus a sershy
ies of phonemic premises and procedures (Pike 1947) A
spectrogram conveys phonetic information which aids the
linguist in determining which phonetic features are consisshy
tently present in order to reach the most accurate phonetic
description
There are a variety of premises and procedures which
the investigator may utilize in order to discover the phoshy
nemic structure of a language Pike (1947) argues that the
investigator must have at hand observable native reaction
to native sounds andor know structural facts pertaining to
the phonetic nature of the sounds and their distribution
As stated before a phoneme is a bundle of sound f~atures
1
j
16
which when substituted for another bundle creates a difshy
ference in meaning Since the creation of a different morshy
pheme is the result of the substitution of a different sound
feature these sound features are said to be phonemes
A pair of words in which the first word is the same as the second except for the fact that one segment is replaced by a different but phonetic~lly similar segment in the second word constitutes proof that the two similar segments are phonemically distinct~ bullbullbull Word pairs of this type are said to be MINIMALshyLY DIFFERENJ because no smaller difference in the language can make a differ~nce in meahing in words (Pike 1947)
Hence minimal pairs of words were used to find phonemes
Minimal~y different word pairs prove to be the beginners
single most important tool for the analysis of phonemic difshy
ferences (Pike 1947)
Thus Echols and Shadilys An Indonesian-English Dicshy
tionarv (1968) was ut~lized to find three-phoneme words
containing two consonant sounds with a vowel in medial poshy
sition The process was simply to go through all the words
beginning with consonants and find minimally different t~ree
phoneme words This was done on a purely anthr~poscopic
basis on the part of the investigator If a different letshy
ter was employed to distinguish a different meaning it was
assumed to be a different phoneme The following ~ord pairs
and their meanings are examples of the words found in the
dictionary
ban--tire bin--son of
das-- a shot dos--small box carton
I
1 7
pal--pole pel--field
rang--rank position ring--ring
teh--tea toh--yet nevertheless
After having obtained the words from the dictionary
a native informant was called upon to verify ~he differshy
ance in meaning in the minimal pairs and to pronounce
them so that ~hey could be phonetically transcribed in
al1 impressionistic manner The informant employed was Kok
Djen Su a student at Portland State University from Yogshy
jakartai Indonesia He has been a student in the United
States for approximately two years and speaks broken al shy
though very understandable English Mr Su was horn to Mr
and Mrs Su Hendry Su who both speak Bahasa Indonesia Jashy
vanese and a small amount of Chinese Since his birth the
informant was exposed to a mixture of Javanese and Bahasa
Indonesia but has employed the national language of Indoshy
nesia since the age of three at school His bilingual upshy
bringing it seems to the author does not craate a subshy
stantial difference in the competence of Mr Su in Bahasa
Indonesia In fact he was able to distinguish the proshy
nunciation Qf words in both Javanese and in Bahasa Indoshy
nesia The utilization of one informant deletes any reshy
gional variation or individual variation between informshy
ants Since here we are attempting to ascertain the relashy
tive range of phonetic quality of vowel phonemes in Bahashy
sa Indonesia the informants bilingualism ahould cause
none or very few phonetic distortions
After-having verified the difference in meaning of
the word pairs Kok Djen ~u pronounced the word The
following impressionistic version of the Ihdonesian voshy
wel system was described
front central back
high
mid 1 I
I I low j
i I I
I
u-
E 0
A
1 Spectrograms
The phonemic entities symbolized in the preceding
section represent range-units of phonetic quality The
symbols and their position on the chart are based on the
aural perceptions of the investigator The purpose of the
spectrographic analysis of this data is to determine as
accurately as possible the actual phonetic range represenshy
ted by each of thephonemic symbols
I
i
1 9
In order to make spectrograms from which meani~gful
conclusions can be drawn one must have a native informant
of the language to be studied Spectrograms were made of
the speech of Mr Su the informant described earlier
In order to conserve the time of the informant a
sample of three-phoneme words were recorded The three-
phoneme words begin and end with consonants ahd contain a
vowel in medial position The list appears in Appendix A
The list of words was specifically selec~ed to eliminate
in so far as possible all variatiqn other than that which
is specifically caused by the preceding and following consoshy
nants This is true because by utilizing a single informant
the influence of dialects both regional and social are eshy
liminated and by utilizing one sy~lable words under primary
1stress sequential influences such as the Markov Process
are eliminated since there is no sequence beyond one phoshy
neme preceding and following the vowel This being the case
one should be able to derive from a series of spectrograms
of those vowels both the range of free variation and the
specific influence of each particular consonant on the voshy
weI quality of each medial phoneme
The n~xt st~p in the procedure was to play the tape-
recordings into the spectrograph two or three wo~ds at a
1The Markoy Process is a mechanical way of handling enshytropy in sequential operations IQ linguistics this is stashyted in terms ofthe probability of the occurrence of a parshyticular phoneme morpheme etc in a precise sequence
20
time The machine can handle 24 seconds of speech on one
spectrogram thus two or three words could be analyzed at
the same time as one with no loss in quality or precision
Unfortunately the recordings had to be played into a
microphone which picks up some background noise but by
placing the microp~one of the spectrograph very close to
the loudspeaker of the tape recorder and turning the volume
up slightly this background was eliminated for all pracshy
tical purposes middotIt would have been better to have had a
direct connection between the recordar and the spectrograph
but unfortunately no such devce was available Background
noise shows up as very small specks scattered more or less
at random and unless the volume of such noise is exceedshy
ingly strong does not interfere with the reading of the
spectrograms
Once the machine had completed the analys~s and produced
the graphic record of the list of words a frequency measur~
ing device was produced by the machine cf example below
1 11amp II~ill c=
- n- HE to
11r -shy
bull b mmiddot 1 bull bull L
-
gIl F Jamp u
n _ If
bull III
21
This measuring device is in reality a spectrogram with horishy
zontal markings The first line on the chart represents a
frequency of 0 hertz (hz) Each line above the first repshy
resents a multiple of 500 hz The device is used to locate
th~ center of formants 1 and 2 Since it is graduated in
500 hz it is necessary to interpolate when the center ofmiddot
power for a particular formant falls between two of these
lines This is done by dividing the area between the two
lines in half then dividing one of the halves in half which
gives a range of 125 hz within which the measurement falls
and an estimate is made of the precise measurement within
the 125 hz range This should give formant positions with
an accuraci of greater than plusmn25 hz
When visual location of the formant centers becprnes
difficult a section of the formant can be made cf exshy
ample below Such difficulties with visual location usually
arise when two weak formants overlap Such overlapping
produc~s what appears to the naked eye to be a band of modeshy
rately dark grey bands The sectioner is a built in mech-
IshyfL__---
tete we tt
~
I
1 I
22
anism capable of handling such problems In the preceding
I example the amplitude of each harmonic is proportional
to the length of the line representing that harmonic I
This makes it possible to locate formant centers when vi-
I sual location is difficult
The measurements were then transferred to formant
charts cf Chart 1 on the following page
6
23
CHART I
~
t
1+
t5
1amp
Ie
z~ 2t 2p 16 12 la 8 Iii
I ~
~
I S
l I
I I
~
V V
V T
l( FORMANT V CHART
Vi ~ CcdiOrate4 ift luutdnM I V ~ cycle ~ concf
V 10 eeentl~rsI~ V
V U 5millimctcrs - I $milton
2 zk2 lis ty
I
FOlWAlfT CHART
Placing a single point on this cha-t is an assertion that formants have been observed at two frequencies one fOrrUlt at the frequency named along the right or left edge the other formant atmiddotthe frequency named along the top or bottom edge
ex Martin Joos~ Acoustic Phonetics (1948)
CHAPTER IV
FINDINGS
The data provided by the preceding methodology conshy
sisted of a series of scatter patterns on the vowel charts
Each of the dots within the pattern represented one occurshy
rence of a particular vowel To determine the range ofmiddot each
phoneme f the most divergent points in each pattern were con-
nected by a line These lines then circumscribe an area
which included the range of all the vowels in the sample
recognized ~y the informantmiddotas a particular phoneme
Verbal descriptions the actual charts of the phonemes
and the spectrograms utilized willbe found on the followshy
ing pages
25
The distribution for the sounds which the informant
produced and recognized as the phoneme 1 range~ on the
vowel chart in a broad scattering from 300-500 hz for forshy
mant 1 and 1500-2100 hz for formant 2
CHART II
1
lid
13
bull
~
It
iA
Ml
ztr Zit zp 1 S lIZ middot1 I a r 8 6
I
f
I I
Ii 3
[7l I I V 1 I
) ~I I i I bull
V I I i bull r J
I V t I I I I I
i tt I
Kl7 I I I iI ~
I I I I I I I I I i I
I I I i I f I ltII
I I l7 I VI
I [7 1
1 I I I Va FORMANTc7 CHART
I
I I I I 173 CaEiIw-atd icw~[7 rf ltfer C0ItdI I I
j I I I i 7 10 e centlCMta1 oct4v
I V 5miU~ bull itonI
r I f 711 t14 j I I I Ik IV
FoiUlAhT CHRT
Placing asinge point on this chart is an assertion that fortcants have been observed at two frequencies one formant at tn(l frequerlcy nameu Slong the right or eft cdampe the other formant at the frequency named along the top or bottom edge
26
l 1I I - -~
I I iI I
I
[bIs] [bIn]
lt-- -_- -1I
lt i
1 ~ i1_ -shy Ir ~ tmiddotmiddot lt
-- - - ---~--- - - - ----- --
-i -_~ ~ shyI 1
i I I
I I bullbullq_-
I ~~~-~--shyr ~~~~~ -~- I------------------------shy
-----I
[dIm] [sIh]
27
I -[blr]
i1 1 I I
i Ii I
I i I I
ii ___ -J
rmiddot I i
I 1 j
-~ ~~~ ~-~IIlIr~~~
I
1 ____~~l_~~--=~ _ ~--~~~~~~~~~- -
51 hI$ PiiB PD~ii~i
-~ - -- -- ----- ~------- - --- _-- - _ - shy [rIll) [klr]
28
1 I I I
---~S~ -~~~fi~ ~~~~~-~
~l_ middot~ ___
[klk]
I I I
r [dlk]
29
-------- --
-~- shy~--I~~
[tIll]
30
The distribution for the sounds which the informant
produced and recognized as the phoneme lEI ranged on the
vowel chart in a thin oval shaped distribution from 400-625
hz for formant 1 and from 1400-2000 hz for formant 2
CHART III
lEI
i
I
1 I
1
1middot
II~~ 5 I~ I lOa I ~--~~~I-+--+-4-+--+---+--++-+-+-+-+--r--t-t--r--t--r--1
I
I I I I
t I
4
I I 1 I ~ I I I I
I t I ~
I I ~
-r--- r--- I V~~~-r~+-+-~~~+-+-~~~~~~~--T-~-r~-r~-r~-T---T--r~
V~~~++4-~~~-4-+-+~~~~~+-~-T-rV~7
~iA~~~~~I+-~~~~~I--~~~-r~~~~~8 FORMANT HHHH~~r+~~-r~+-~+-~I~-I~~rl7V CHART
I II 11I I V9 CaZiLrww 1ft huncirccLJ
-+-f-+-II-f-+-+-+-+--+-+--+--+----+-+--+-1--t-+-1---t---t--7 rtf eye 04 ~ I 11 V pq-+-+-I~-+--i--+I-t-t--+~i-I---t--+--tr -t--t-Tj-ri~middotltJ ecentimeters 1octGy
I V 5miU~ - aemiton ~~~~I~~+-~~l~-~-T~I~~~r~
t i lt~ I I IS I I liV
FolUlAn C1LBT
Placing a single point on this chart is an assertion T hat rormants have been observed at two frequencies one formant at the frequency namfu along the right or left edge the other formant at the frequency named along the top or bottom edge
31
I I
I ~_ f __
~~~ - - ---~ _-shy
I -- shyI - _v-- _ l
i _~~E~~~~middotmiddotmiddot ~---~--~~-it--_ ~_~ 1gt_ bullbull bull -_gt-~~~ ~ bullI
P~J r_i~=~~~ ~-~~~- - -1 I -----~ -~-~ _ ---_
~~Wa~~Ji~~L ____ __ _____ _
[PEs]
I __ shy
-- --shy
~~ ~ -Qt-shy
-~=-=----
~~~7=~~ L___ __ __ ____ _ ______~
[rFm]
32
[PEt]
bull - -IIot-__
- ---~~--
[dEk]
---
33
f ~
I
) I I
I
I I
I 1 I
I I
I
1
__ -~_~i~~-yen-=-- ~~-~= --
------------------------
[dEn] [sEn]
i
~ ----shybull __ ~
[cEr)]
34
1J i i
~
--~~ ~-
~~
-~- ~ -~ ~~ ~gt-- ~- ~~
I ~IJItt- F ~ 111 i~-~_~--- ~--- - _ =-- 4e -~~~-~_-_~-- _~
bull vf middotmiddot~~tmiddotmiddotl____________________~____ j
[sEp] [bEk]
[bEl]
~ shy~~--_o-
J -~~~
~~t~-~~J~ r~~7~ _
I middot---=i---=-~_4~ __ ~~~~~___I _ _~
~g_i$fj bull - ~-~~~z~ir~~ ~~~ leal -~I_ iiIB
L_________ __~________ _____~
[lEs]
I f
I
35
- --- ---- - ---- ----------
~-------- shy
bull
j
i
[tEll][dan]
[dEp]
36
The distribution for the sounds which the informant
produced and recognized as the phoneme A range~ on the
vowel chart from 600-750 hz for formant 1 and from 1600-2300
hz for formant 2
CHART IV
A
i6
i I I
I I
I I
I I
1 0
I
I I I
I I
I I
s
It
i j I Ii i I
I I
6
~ I 1 I I I I ~
I I I V~ FORMANT ~~~~~I~1~4-+-~~~--~1-+~~I~-~-r17 CHART
~~~~~~l~~~~I~i~~~~I~+I~~lr_I~I~~~$ ~U~~~h~~ ~ I I I I I ~ 7 J eye ptI -cony
1f4-i--~--+---I----t--I-4--~1--+---+--+---+---1-~i7-to e cVltJte1 oct4v
i I I I 1 5miU~ - bull iton ~~~~~~~~~middot~~~~4-~I~I--~+~middoti i
2~ I I
F01UlANT CiLlT
Placing a single point on this chart is an assertion tnlt rorreints have bE-en obsered at two frequencies one formant at the frlquerJcy nSleU aiong he right 01 eft edge the other formant nt the frequency named along the top or bottom edge
37
I I i
-shy
I
I
I
~1iI
p~~~~==~~~~i~~~~
I I
[lAs]
_7 -~
-- -shy
L _ _ _ ____________ --- -- ----_~____J
[nAn]
--------
38
I I
------------------~----I I 11 I I
II1
flt~
I
IJ
L
i
______________________
[sAk]
f
~~ ~--r
1 shy
~~-
-- shy[sAn]
I r 1I I I
t
t
I l I
I I I
I i
I
[sAt)] [sAp]
39
~]
I
I I
[rArl][bAk]
I
-shy ---==-_____lshy___
[lAp ]
40
~----------------------------~-------------~
1 bull -l----1-shy
~middot-~-~t-=-- -
~r-shy -shy t~ III M -~ ~~---shy~t-= ~r=_ _shy
C z---=-
L______________________----- [dAs]
[dAr]
l _
41
v 1
I I
i
I
I -tc - bull ~ 1t iCSi4 _ -
-~~-r~middot- 1 ____ ~~~~ ~ ~ I
1 I ~=~j3~middot7-__ ~~
[kArl
---------------------~------
[dAin]l
I I
-I
I
42
I gt1 tmiddot
I
[bAm]
bull
~ I 1 I
gt1
-- - ___ _ N ____ ~--shy---- shy
[bAn]
43
[lAh]
==III
I Imiddot
__~_--_middotfI_~__ ~ ennee ~ S
LL-
[JAk]
--------- ---------
44
---------
I i Ir I
I I j
i
I i
~ --_ -- ~
~~fb-~~~~~~ ----- shycshy7FiIf Elii=s FUP WRmiddot 75t3~ n JIilIeia
~------------
[JAs]
-II
I J
[dAnl
45
~ I 1shy
I
iI shyi t
- - - Imiddot--- ~p -~--~= roc - I
I II i
I I I
~ middot1 I
------J
j I
I I i
i I
1_____ --- I ---------------~
[kAs]
I
I I
I t
I I i
j poundiampl d
rshyl
I i
I
1
I I I
I Il
[bAl]
I~
[bAl)]
I
47
L---------------------- --------------~
[kAp] shy
t
I-- I ~ I i
I
ji I
I -I
I 1 I 1
i
)
~~
~L~--~~---~ - ~ ~
~ -shyY- r i
I
-
1
I I
)
----~ -shy- -- _ ~ ----shy
1 I i i I I
1 I
L ~~~~-~~-~-~~~-~~-gt-= rn~ J ___fi ~ 7 7TZ r~ 5UZs=j -~ l ____-------- _____ __ _ ___________ ________ I
[kAk]
i
I t r ~
--~~ -shy
~~~c~_=--_u ce4 we
I r bull
[gAr)]
~-~ shy
- -~ -~~
~P ~-~~
I ~~
-- bull ~ I - ~~-~~
~-~~~--~ shymiddotT _i
48
-----------------------------l
I I
I I
[rAk]
~_
~ ~--- ~~~-~
j ~~ ~ ~ ~7
~ bull~~middote ri~-is~~~l-IIII-middotlIIIIn---I~-- 41~~~~~ ~
1--=-_---- - - -===--------shy
[sAil]
I
49
_- I I
I -- ----------------shy
~2~~~ ~~
i i I I ~~~~~~~~b ~-
middot_- _ ~~------
j
i ~ at -== l - -- ~-~~it I ax I C1 bullbull~~- shy
I
I i
I I
I 1 I II r I I
-r- --shy
~~-~-~- -~-
-1 l I
I I
[bAs] [PAs]
r-------------------~------------___
[pAl]
I
50
The distribution for the sounds which the informant
produced and recognized as the phoneme 0 ranged on the
vowel ~ha~t from 400-525 hz for formant 1 and from 700~1000
hz for formant 2
CHART V
0
III
t5
lot
S
6
Ie
to
Z7 Zit 9 I 1 I a I z I a 6 6
I
I ~ I
I i II I
j i bull I I
I I I i I
I ~ t
~ ~I I
f I
I ~ f A I I I
j [- V I 1 I I I II ~ I 1 I I
At I
I t I I
V V
V 7
i I Vi( FORMANT I 1 I 1 CHARTI I
I V 3 C41iotc4 ill lUjn~ 01 eycpr ~0It4
i I f I IV
I ) I V IO 6 centltcrs 1 octcv1 I I I 5miU~ -Istmi-toneI
I I VII 2 I ltQshy t 116 IV
FOlUlUfT CRBT
Placing a single point Oll this chart is ampn assertion that formants have been observed at two frequencies (me iormant at the frequency nametl ~ong the right or left edge the other tonnant at the frequency named along the top or bottom edge
Ishy
51
r--- -_-__ - --------shy
-- ~--- --shy~ -
--f -~-
[tOll][pOn]
~ ---- -11lt1 ~
~-- - -~ P---~Amiddot_
t _ __ _
1 r I
--1 i I
I
I ~~~J L____ _ 1 rshy
[dOs] [b0s]
i Imiddot
52
---------------------~---
i I r -------- --------shy
r~~middot-~ [
I V I ~~
I - shy
~~~middottdmiddot~~-~-middot~-
S~~i~~-~ ~- bmiddotmiddotmiddotL _____middot_ ~_
[bOr] [rOk]
I
1 I
i i
j
I
[dOpJ[pOl]
53
Ii --~ --~--- -~~~~--=- I r
~ ~- ~ - ~ - shyI - -~ ~~ -~~ I
-1bullbull - h ~~~
~~~ ~ ~~~~----- ~~-~~~-~- ~--~~~~L- ~bullbull
I middot~-~middotdf r scr ~~~~~
~-laquo~~-==~~~-~~--~~~~ ~~
I
[lOs]
I
I
r I
i 1
i 1
I I J_____~ __ _-_M___J
[bOn]
54
i -~----
I I I r r
~-~ -shy
[bOn][sOp]
jI ----II I J
i
I I I
I I I i
I~~~==it shy
[jOk][tQr)]
55
1 I
I
II I I I
I c ~~~~~~~~ ~~OOWJI~~=U
[lOh]
i I
I
I ~~~-
I ~- -- shyl - _- ~ shy
I ~n=~~-~middot ~FlR T =Iti 1amp11 dill_
__-J
[pOt]
__J pOs]
1
- =xu
[bOk]
I
56
The distribution for the sounds which the informant
produced and recognized as the phoneme lUI range~ on the
vowel
hz for foimant
chart in an
1
almost square-like pattern from
and from 700-1000 hz for formant
250-350
2
CHART VI
lui fIG
3
t
ts
~
la
Il
IT zt 20 IS
I I
I I
i j
I
I j
I I
I
I I I
I t I I I1
I J I I I
~ i I LJ J I~
I
I
I
la -I
10
I
I I I 1
t I I i
I
I
I I
I
I I I
I ~ 1 v I)
V V
qV
FOlUfANT atRT lt
8 6
I t lt
~
I
l --~ I--- ~I I
i
I I
I I I i ltiI I
I i ~
I t
V
V V l( FORMANT I V CHART V
V Caiote4 iramp 1umb_ ef cycipampf on4
6 CelItlmctcrs bull octclv SmiUitoctamprs -I a~i-tonl
PlaciDg a single point on this chart is an assertion that formants have been observed at two frequencies one formant at the frequency named along ~he right or eft ede the other fonnant at the frequency named along the top or bottom edge
I
57
I
I
I -I
I
j _-
~~ -
-
bull I -
[dUp]
t I ~
~
I middot1
f
IshyIj II
I i
-------=shyI ~~-- -
L ~~-=-r--~~-III--=---
58
i middot1 I
I
i j I Imiddot
I~1 middotU~ _ s
I ~~~~~_-_-~--~ --_ I
L~ __________~_____________~ [CUll]
I
I
[dUr]
I
I J
I
I I
II
1
-yen ~ L___________ ~__ ~=~
I [kUs][pUn]
59
I
I
i L ~ -----------~-
____---shy______---2
~~~ -~ _
j ~---
I~~~-~-~ ~~ ~~
[nUn] [lUp]
I 1
~-=-~ ~~ -
[rlhn]
I
60
l
- _ ~~-----
~~~~~ JlCIIPrl fue rm ad I II
L ~ [gUI)] [kUk]
e_
__ ~ e-
~-d~~~~
[lUs] [jUs]
61
shy
I
Iii lEI and A Compa~ed
In comparing the distributions of the vowels III lEI
and IA( cf Chart VII on p 62 it is evident from the plots
that the front-back tongue position is for all practical
purposes identical ie the core distribution for all
three phonemes ranges between 1600-2000 hz This demonshy
strates conclusively that the significant phonetic differshy
ence is tongue h~igth ie t~e position of formant 1
The fact of phonemi~overlap is illustrated by the
crosshatching on Chart VII The cross-hatched area represhy
sents a r~nge of phonetic quality that is identified in one
instance as an III and in another instance as an IE or in
one instance as an lEI and in another instance as an IA
bullbullbull the sounds which follow one another in a changing sequence constitute the signals of speech and these sounds are produced by movements of the vocal apparashytus i e by movements of the lips tongue throat lungs and so on It is therefore important to understand that these vocal movements caused by the various muscles involved tend to slur into one anothshyer Since each variation of movement gives a varishyation in sound the slurring of movements produces a slurring of sounds Furthermore since specific sound will have different slurs of moveme~t depend~ ing upon the movement which it precedes or folloItJs each sound type resul tant from the productive moveshyments will vary somewhat according to the sounds which it precedes or follows (Pike 1947)
In line with this the next logical step would be to
look for environmental influences which would enable a listshy
ener to determine which phoneme was represented when phones
were recorded in the overlap area
62
CHART VII
lIlt lEI and A Compared
~ 2[7
t5
lot
5
ft
fA
Ie
Zit I zp 16 I a la 8 6
t I
~
II V I I I I +
r l~ ~ ~ I
I I ~ ~ V I I 1shy fZ I I t s
) I I j I I I
i ~ I 1 1 I I _lgt
V ~R R-r--~ I V
ItV l(
I I---I-
V~ j shy ~
I I I I FORMANTI I
I I VV CHARTI II I V S CaliL-tcd I Uut
I I I l of fIelc F- 0114
I I I I I j i I 10 ecentImeters 1oct4v
I
I ~ V Smillimctus Iumrton_ j VII
2f1 2~ 16 ltv
FOlUlANT ClIABl
Placing single point on this chart is an assertion that io-rnants have been observed at wo frequencies one formant at the frequency named ~ong the right or left edge the other formant at the frequency named along the top or bottom edge
63
A fairly thorough study of the positions of various
vowel sounds in specific environments did not indicate any
consistent variations of a particular type For example
the vowel in dim is in the lower range for the vowelIII
but the EI in dem is in the upper range -of the vowel lEI
Thus it seems probable that those sounds in the overlap area
are qualities for which minimal contrasts do not exist For
example the II in sih is in the overlap area but appar-middot
ently is clearly recognizable by a native sp~aker because
there is no seh at least no such word was known to the
informaht nor could one be found in the dictionary (Echols
and Shadily 1968)
IU and 0 Compared
In contrast with the front vowels III IE and IAI
the back vowels Iu and 0 have aconsiderable gap plusmn50
hz between the1r two distributions cf Chart VIII on
p 64 The distributions appear directly above one another
on the chart In comparing the two ranges it is appa~ent
that the front-ba~k position formant 1 is identical ie
the core distribution for the phoneme ranges from 700-1000
hz This demonstrates that ~he position of formant 1 ie
tongue height is the significant phonetic difference
64
CHART VI I I
U and 0 Compared
I I
i
5
~
5
6
til
~
2[1
I
Zit zp 15 IZ la a 6
~ I -~
1 ~ ~ ~
~
I V 1
V
I V ~
JIll ~
I I 1 6
1 middotV V l(
vI( FORMANT CHART
9 CalLOt-ctc4 ift 1awuutb of cyc14 p ICCOftI
I~ I V 6 eentllMtcrs 1 octo
I V 5mmi~ - ampImitenI VII
214 I 210 16 IV FOlUfANT CE1ART
PJaciDc a single point on this chart is an assertion that formants have been observed at two frequencies one form3nt at the frequency named along the right or left edge the other formant at the frequency named along the top or bottom edge
middotr I
65
II lEI IAI lUI and 101 Compared
In comparing all three phonemes in their respective
poJition on the vowel chart cf Chart IX an p 66 there I
se~ms to be no problem identifying between front and back
vowels There is a gap of approximately 400 hz between
th$ two back vowels and the three front vowels in terms of I
fotment 2 Also it would appear that there would be no
pr~blem in identifying specific vowel qualities so far as
fOfmant position is concerned for vowels in stressed position
with the exception of the phonemic overlapping discussed in
a preceding section ie III-lEI and IE-A
I
I
Imiddot I
CHART IX
I 1 E IA U and 0 Compared I
iM zr Ztt ap J 6 I Z 10 S 6
I I f ts I
~
tj1- ~
rL ~ ~
J 4- 1 ~ ~ i~ ~ V
Ii ~W~ V I ~~ ~ J
V I ~ ~
IS I ~ V 5 1 t
~
s ~ I I f
V R ~ r-~ I V
if~ V ~ ~
-- V 7
~ -~ [a ti I l( FORMANT
V CHART
V 0 cyclu on4 S CaULntte4 ilt hWldr_
I
Kl I jmiddotV I j V 10 6 centlrMtcll1 oct4v
V 5llIil(lCtampn ~ hl4Imiton
Vii 2~ zkgt 116 I IIyen
I
Forw~ CllABT I
Placing a single point on this chart is an assertion that formants have been observed I at two frequencies one formant at the frequency named along the rignt or left edgeI
the other formant at the frequency named along the top or bottom edge
~ ~ bull -
66
I
I I j
Cbull
I I
i
CHAPTER V I SUMMARY AND CONCLUSIONI
I As is shown on Chart IX on p 66 there appears to I I
bela very discernable distribution for each of the vowel I
Phtnemes of Bahasa Indonesia This does not mean that the
ci cumscriptions of each of the various sounds indicate I
detinite border lines for each vowel Rather it shows i
th~ position o~ each vowel in relation to the other vowel
phbnemes The vowel charts show the position of the phonemes
i asl produceq by one native speaker of the language Thus
nJ conclusions can and should ~e made regarding the definite
oJter boundaries of the ranges of middotp~onemes As is implied I
b~ the term ranges the phonemes have no defined boundarshy
I i~s
i Bahasa Indonesia does not appear to have two front I
v~wels two back vowels and one central vowel as is implied
i+I
the traditional symbolization Rather it has three i
ftont vowels with a three-way contrast between high mid I
i a~d low and a two-way contrast of high vs mid in the back
a1ea of~he articulation chart If a traditional symbolshy
i~ation of the vowel phonemes of the language were now to
b~ dawn it would look like the following chart I I I
68
front central back
high
mid
low
I
U
E 0
A
Thus as has been demonstrated the impressionistic
sion of the vowel system was in error with regards to
central phoneme of the language investigated There
a ears to be no low-central phoneme in the language
r it is a low-front one Although the spectrograph
c nnot establish a phonemic system of a language on its
o n it can provide a yes or no answer about the phoneshy
t c qualities of the phonemes in question After a phoneshy
m c system has been established the spectrograph can proshy
v de phonetic data which distinguishes one phoneme from
a other
BIBLIOGRAPHY
Sources Cited
Almiddotsjahbana Takdir The Indonesian Language - By-product of Nationalism Pacific Affairs XXII (1949)388-92
Am rican University Area Handbook for Indonesia Washingshyton DC ~S Government Printing Office 1970
Blch B and G Trager Outline of Linguistic Analysis Baltimore Waverly Press 1942
Du n H K Calculation of vowel resonances Journal of the Acoustic Society of America XXII (1950) 740-53
ols John M and Hassan Shadily An Indonesian-Enqlish Dictionary Ithaca Cornell University Press 1963
ner C Reserches sur la structure des voyelles orashyles Archives Neerlander Phonetic Experiments XX (1947) 40-77
obson Roman C Gunnar Fant and Morris Halle Prelimshyinaries of Speech Analysis Cambridge MIT Press shy1961
J s Martin Acoustic Phonetics Baltimore Linguistic Society of America 1948
L defoged Peter Three Areas of Experimental Phonetics London Oxford University Press 1967
P Mario Glossary of Linguistic Terminology New York Columbia University Press 1966
Perce Joe E The Spectrographic Study ~f Vocalic Nuclei Language Learning XII (1963) 241-247
- --- Phonemic Theory and the Analysis of English Syllashybic Nuclei Linguistics XVII (1965) 36-57
P ke Kenneth L Phonemics Ann Arbor University of Michigan Press 1947
70
Pi e t Kenneth L Phonetics Ann Arbor University of Michigan Press t 1943
Pu gram Ernst Introduction to the Spectrography of Speech New York Dover Publications 1966
ir Edward Language An Introduction to the Study of Speech New York Harcourt Brace amp Co 1921
enbeck E M Indonesia and Malaysia 1I Current Trends in Linguistics IIX (1967) 55-111
dman Dorothy The Republic of Indonesia New York N Y Philosophical LibrarYt Inc 1955
Sources Consulted
r e j e v N D bull Some ProbIem s 0 f Baha s a In don e s i a Ph a nshyology Studia Linguistica XI (~1957) 44-46
lingmiddotC L Linguistic Units The Hague~ Mouton amp Co 1960
J obson t R Hague
and M Halle Mouton amp Co
Fundamentals 1956
of Language The
K nedy Raymond Bibliography of Indonesian Peoples and Cultures New Haven Yale University Press 1962
Perce Joe E Spectrographic Study of English Vowels Under Primary Stress Linguistics LXXXIV (1-972) 41-84
P ttert Ralph K George A Kopp and Harriet C Green Visible Speech New York Dover Publications t 1966
T euw A Critical Survey of Studies on Malay and Bahasa Indonesia The Hague Martinus Nyhoff 1961
-basin
-head of an area
-form of address
-ball bag
-bell
ba --bank I
bUr --you I
bi --beer
bomiddot--drill I
ba--bliJss
bi --bus i
I t
bo I
--bunch bun~le i I
ba--crossbeam
--bomb
--tire
--son of
--ration coupon bond
--garbage dump
--checkered design
--inch
--and plus
APPENDIX A
LIST OF WORDS
den~-abbrev of the title raden
dar--olace location
dur--pearl
das--a shot
dos--small box
dek--deck
dik--younger sibling
dep--to b~ shelved
dop--hubcap
dup-~to be baptized
djak--jug
djok--seat
djas--coat
djus--part of the Koran
gang--paBsageway hall
gung--gong
kak--form of address for elder
kik--handloom
kuk--collar harness
kar--map
kir--jo test
kas ~money supply i
kus -to hiss spit I
lahi-alreadY
loh-writing tablet
lapi -towel I
lup -magnifving glass or
last -IrJeld i oint
lesl -lessonI
lOs -shed I
I I
-to iron
-which who
nu -yonder
po
pa --pole
pa --to fit
pe --plague I
po --mail I
pel --cap
pOI --pot
--pound
--also
r --shelf
--shirt
g-o-rank position
g--ring
--brake
rum--cream
sah--valid legal
sih--an enclitic usedmiddotto soften what follows
san--form of address far sargeant
sen--cent
sang--superior
seng--zinc
sap--line row
sep--chief boss
sop--soup
sjak--suspicion doubt
sjok--attractive
tang--tongs pincer~
ting--sweet meat
tong--barrel vatmiddot
teh--tea
toh--yet nevertheless
tjeng--molasses
tjung--young boy
III 1
APPENDIX E
LINGUISTIC SYMBOLIZATION USED
IAI~high-front-openIi
II
~ r
E~-mid-front-~pen
III
AA-low-front-op~n t1
o1-mid-back-open
Uf-high~baCk-close III
I III
~~~vd bilabial stop
[dj~vd alveolar stop l
I I
[kt-Vl velar stop I
[g I-vd bull velar stop
[1 -lateral I
(n-vd alveolar nasal 1
(m~-vd bilabial nasal
~I-Vd velar nasal
I
III ~IJ
I
q
dl
I
Iil~
I
Vowels
Consonants
[p]-vl bilabial stop shy
[t]-vl alveolar stop
[rJ-vd alveolar flap
[jJ-vd palatal affricate
[CJ-vl palatal affricate
[S]~vl bull alveolar affricatmiddote
[s]-vl alveolar middotfricative
h]- vI velar aspirant

I I
f
8
Distinctlve features are used to denote signalling
functions The label distinctive feature is used in the
literature to mean two quite different things Bloomfield
describes the categorization with examples which imply
that distinctive sound feature means any feature of the vocal
sound which when changed changes the meaning of a given
word eg pill and bill sin and sing etcri (Pierce 1965)
There Bloomfi~ld labels p as a distinctive sound feature
and b as a different sound feature Later Roman Jakobson
Gunnar M Fant and Morris Halle in their Preliminaries of
sectpeech Analysis take the phonemes of a language and break
them down into their component phonetic features some of
which are distinctive eg voicing in English b vs p
while others are not eg aspiration in English p~ in pin
as opposed to p in spin Anyone language code has a
finite set of distinctive features bullbullbull (Jakobson Fant and
Halle 1961) In English the feature of voicing in the b
of bill as opposed to the absence of voicing for the p
in pill is the phonetic feature which distinguishes these
two sounds A similar presence vs absence of aspiration
does not alter the meaning of any English utterance in fact
it is difficult to make English speakers aware of the fact
that aspiration is or is not present Implicit in this
theoretical approach is the concept that the variation in
human speech for the most part re~resents presence vs
9
1
absence of non-distinctive features of sound
One theoretical approach to linguistic structures
views the phoneme as concurrent bundles of distinctive
features (Jakobson Fant and Halle 1961) Each language
has a finite set of rules for grouping them (distinctive
features) into phQnemes (Jakobson Fant and Halle 1961)
Every phoneme in the language then is composed of a unique
set of distinctive features such that it is different from
any other phoneme by at least one of such distinctive feashy
tures This manner of linguistic signalling has important
implicat~ons toward phonemic analysis of sound systems As
previously mentioned a phoneme is a bundle of distinctive
features which when altered changes meaning In order
to verify whether a sound is a phoneme or not one must
show a word in which the replacement of at least one disti~c-
tive feature makes another word ie a minimal pair difshy
ferentiated by only a single distinctive feature and having
two distinct grammatical or semantical meanings
Phonemics the study of phonem~s is the level of lingushy
istic analysis which answers the question of how language
utilizes sound matter selecting certain of its elements and
adapting them for various ends The prima~y functions of
sound in a language is to distinguish one utterance from anshy
other in normal conversation Phonemic analysis as an opshy
eration examines a~ailable data in order to discover an unshy
derlying structure bullbullbull not an operation which forces a mass
1 0
of data into a structure (Pulgram 19~5) The nature of
each feature is of the essence Thus the composition of
each phoneme becomes of primary importance in a language
The phoneme can only be defined in reference to the larger
frame whi~h is the language of which it is a structured
feature (Pulgram 1965) It is the shortest stretch of
sound which serves a signalling function
Acoustic Theory
I Distinctive feature theory as previously describedI I seems to handle such phonemes s stops fricatives and
I nasals quite well eg the airflow out of the mouth is I
either stopped or it is allowed to escape On the other
1 hand vowels seem to be ranges of phonetic quality whichI
are extremely difficult if not impossible to distinguish
in terms of presence vs ab~~nce of distinctive features
Since this study will not be concerned with consonants but
only w~th vowels it is only necessary to discuss the acousshy
tic nature of vowel qualities from this point on
FundamentalsHarmonics
Vowel quality is determined by a combination of a fundashy
mental and its harmonics A vowel quality displayed on an
oscilloscope shows a very complex single wave form This
wave form is in reality the mathematical sum of a number
of simple wave forms or at least for theoretical purposes
1 1
can be treated as such These wave forms are generated
in the oral tract by the opening and closing of the glotshy
tis The fundamental wave is a sine wave with a frequency
equal to the number of times the glottis opens and closes
each second and an amplitude which is directly pro~ortion-
al to air pressure in the lungs Because of the nature
of sound waves a harmonic is generated at every multiple
of this fundamental eg if the fundamental is 100 cycles
per second then a harmonic is generated at 200 300
400 bullbullbull CO As soon as the complex wave leaves the vocal
chords harmoni6s are filtered out by the nature of the
tissue surrounding the oral tract as well as the cavities
in and adj o 1ning the oral tract The complex wave emerging
from the mouth is the mathematical sum of fundamental and
the harmonics which have not been filtered out by the oral
tract cf Martin Joos Acoustic Phonetics (1 948) chapshy
ters 1 and 2 for a fuller explanation of this process
Acoustics vs Articulation
In the last century far too much energy has b~en exshy
pended in attempts to relate acoustic features to specific
articulatory movements Bloch (1942) illustrates this by
stating qualities are identified by ear but in linguisshy
tic works they are traditionally defined in terms of their
assumed production by the vocal organs This type ofmiddotstudy
is misdirected because the only things that impinge on the
I I
- I
12
human ear are the harmonics which were not filtered out
The articulatory movements which cause the filtration ie
movement of the tongue from front to back creating a series
of filters each of which removes different harmonics
from the complex waves are irrelevant Pike (1943) argues
one should analyze and describe the sounds (or sound waves)
themselves rather than the movements ~roducing them
It has long been noted by acousticians that a variety
of articulatory movements remove the same harmonics and
r~sult in the production of very similar sounds Pierce
(1962) illustrates this by saying
As long as the formants are in their praper positions ie the proper frequencies are passed through the speech mechanism it does not matter whether the unwanted frequencies are filtered out by rounding the lips or moving the tongue to the back ThuQ when Holbrook and Carmody give one front-back position for the tongue for a given English vowel and IPA (International Pho~etic Alphabet) gives another it is quite probable that both are completely correct and that the formant shift is made by compensating for the lack of tongue movement in the speech of some speakers by additional lip rounding bullbullbullbull
Since the hearer of a stream of speech can hear 9nly those harmonics which emerge from the mouth as componshyents of the final complex wave the placement of the formant is of primary importance not the articulation which produced the sound
Therefore a study of the phonetic quality of vowels
demands an instrument which is capable of making an accurate
record of the presence or absence of all the harmonics
having sufficient amplitude to significantly alter the final
wave form The acoustic spectrograph is such an instrument
13
it was the first instrument to make large scale acoustic
a n a ly s e sapr act i c a I po s sibiIi t Y n ( Lad e fog ed 1 967 ) bull
Spectrograph
The acoustic spectrograph is a device ~hich records a
stream of speech 2~4 seconds or less in length This
recording is then fed into the analyzing part of the specshy
trograph where at each successive playing ne frequency
or rather one frequency band is lifted outof the total by
the variable filter (Pulgram 1965) A black ma~king is
made on a piece ofmiddot electro-sensitive paper each time there
is a harmonic present within the frequency band being anashy
lyzed Since the articulators are constantly moving and
changing the filtration characteristics of thevocal tract
the black markings ma~e by a stylus reflect the movements
of the articula~ors in a very broad sense More important
however it makes a precise record of the stimulus ie
the harmonics which reach the ear of the listener Dunn
(1950) says the vowels have asso~iated with them different
frequency regions in which the sound is more intense than
elsewhere in the spectrum The name formant has been apshy
plied to these regions
The next problem then is to relate the concentrations
of power mentioned above ie the formants to human pershy
ception of speech sounds The most widely utilized techshy
nique in this area is one devised by Martin Joos (1948)
~______________________________________~S___________________________________________________shy1
14
generally referred to as his 2 Formant Theory This techshy
nique represents the plotting of formant 1 and formant 2
in a specific wayan a particular chart cf Chart 1 on
p~ 23 This technique is clearly described by Ladefoged
(1967)
The relations between the formant structures of the vowels in a number of words can be conveniently represented by means of formant charts which show the frequency of the firs~ formant at a time in the word when the formant structure is changing at a minimum rate plotted against the frequency of the second formant at the same time
When making these kinds of plots a charting is derived of
vowels for any language which is remarkably like the tradishy
tional impressionistic vowel charts of the 19th century
Esner (1947) illustrated that if the frequency of the first
formant was plotted against the frequency of the second
formant it seemed to equal the relation between formant
frequency and the traditional vowel diagram
Basically this study will reproduce such vowel charts
for a number of examples of each sound in Bahasa Indonesia
Formant 1 will be platted against formant 2 for each vowel
phoneme in a variety of phonemic environments -The purpose
of this will be to determine the range of variation for
every vowel in each e~vironment as produced by a single native
speaker
CHAPTER III
METHODOLOGY
Phoneme Identification
In order to assess the phonetic quality of vowel phoshy
nemes one must first ascertain the number and relationshy
ship of sound contrasts in a language ie the phonemes
The visual representation of the actualization of the phoshy
neme ie the spectrogram can only be made on the basis
of a preceding decision of the linguist on the types and
number of phonemes in the l~nguage to be anaiyzed (Pulgram
1965)~ Phonemic analysis cannot be made with phonetic
data alone it must be made with phonetic data plus a sershy
ies of phonemic premises and procedures (Pike 1947) A
spectrogram conveys phonetic information which aids the
linguist in determining which phonetic features are consisshy
tently present in order to reach the most accurate phonetic
description
There are a variety of premises and procedures which
the investigator may utilize in order to discover the phoshy
nemic structure of a language Pike (1947) argues that the
investigator must have at hand observable native reaction
to native sounds andor know structural facts pertaining to
the phonetic nature of the sounds and their distribution
As stated before a phoneme is a bundle of sound f~atures
1
j
16
which when substituted for another bundle creates a difshy
ference in meaning Since the creation of a different morshy
pheme is the result of the substitution of a different sound
feature these sound features are said to be phonemes
A pair of words in which the first word is the same as the second except for the fact that one segment is replaced by a different but phonetic~lly similar segment in the second word constitutes proof that the two similar segments are phonemically distinct~ bullbullbull Word pairs of this type are said to be MINIMALshyLY DIFFERENJ because no smaller difference in the language can make a differ~nce in meahing in words (Pike 1947)
Hence minimal pairs of words were used to find phonemes
Minimal~y different word pairs prove to be the beginners
single most important tool for the analysis of phonemic difshy
ferences (Pike 1947)
Thus Echols and Shadilys An Indonesian-English Dicshy
tionarv (1968) was ut~lized to find three-phoneme words
containing two consonant sounds with a vowel in medial poshy
sition The process was simply to go through all the words
beginning with consonants and find minimally different t~ree
phoneme words This was done on a purely anthr~poscopic
basis on the part of the investigator If a different letshy
ter was employed to distinguish a different meaning it was
assumed to be a different phoneme The following ~ord pairs
and their meanings are examples of the words found in the
dictionary
ban--tire bin--son of
das-- a shot dos--small box carton
I
1 7
pal--pole pel--field
rang--rank position ring--ring
teh--tea toh--yet nevertheless
After having obtained the words from the dictionary
a native informant was called upon to verify ~he differshy
ance in meaning in the minimal pairs and to pronounce
them so that ~hey could be phonetically transcribed in
al1 impressionistic manner The informant employed was Kok
Djen Su a student at Portland State University from Yogshy
jakartai Indonesia He has been a student in the United
States for approximately two years and speaks broken al shy
though very understandable English Mr Su was horn to Mr
and Mrs Su Hendry Su who both speak Bahasa Indonesia Jashy
vanese and a small amount of Chinese Since his birth the
informant was exposed to a mixture of Javanese and Bahasa
Indonesia but has employed the national language of Indoshy
nesia since the age of three at school His bilingual upshy
bringing it seems to the author does not craate a subshy
stantial difference in the competence of Mr Su in Bahasa
Indonesia In fact he was able to distinguish the proshy
nunciation Qf words in both Javanese and in Bahasa Indoshy
nesia The utilization of one informant deletes any reshy
gional variation or individual variation between informshy
ants Since here we are attempting to ascertain the relashy
tive range of phonetic quality of vowel phonemes in Bahashy
sa Indonesia the informants bilingualism ahould cause
none or very few phonetic distortions
After-having verified the difference in meaning of
the word pairs Kok Djen ~u pronounced the word The
following impressionistic version of the Ihdonesian voshy
wel system was described
front central back
high
mid 1 I
I I low j
i I I
I
u-
E 0
A
1 Spectrograms
The phonemic entities symbolized in the preceding
section represent range-units of phonetic quality The
symbols and their position on the chart are based on the
aural perceptions of the investigator The purpose of the
spectrographic analysis of this data is to determine as
accurately as possible the actual phonetic range represenshy
ted by each of thephonemic symbols
I
i
1 9
In order to make spectrograms from which meani~gful
conclusions can be drawn one must have a native informant
of the language to be studied Spectrograms were made of
the speech of Mr Su the informant described earlier
In order to conserve the time of the informant a
sample of three-phoneme words were recorded The three-
phoneme words begin and end with consonants ahd contain a
vowel in medial position The list appears in Appendix A
The list of words was specifically selec~ed to eliminate
in so far as possible all variatiqn other than that which
is specifically caused by the preceding and following consoshy
nants This is true because by utilizing a single informant
the influence of dialects both regional and social are eshy
liminated and by utilizing one sy~lable words under primary
1stress sequential influences such as the Markov Process
are eliminated since there is no sequence beyond one phoshy
neme preceding and following the vowel This being the case
one should be able to derive from a series of spectrograms
of those vowels both the range of free variation and the
specific influence of each particular consonant on the voshy
weI quality of each medial phoneme
The n~xt st~p in the procedure was to play the tape-
recordings into the spectrograph two or three wo~ds at a
1The Markoy Process is a mechanical way of handling enshytropy in sequential operations IQ linguistics this is stashyted in terms ofthe probability of the occurrence of a parshyticular phoneme morpheme etc in a precise sequence
20
time The machine can handle 24 seconds of speech on one
spectrogram thus two or three words could be analyzed at
the same time as one with no loss in quality or precision
Unfortunately the recordings had to be played into a
microphone which picks up some background noise but by
placing the microp~one of the spectrograph very close to
the loudspeaker of the tape recorder and turning the volume
up slightly this background was eliminated for all pracshy
tical purposes middotIt would have been better to have had a
direct connection between the recordar and the spectrograph
but unfortunately no such devce was available Background
noise shows up as very small specks scattered more or less
at random and unless the volume of such noise is exceedshy
ingly strong does not interfere with the reading of the
spectrograms
Once the machine had completed the analys~s and produced
the graphic record of the list of words a frequency measur~
ing device was produced by the machine cf example below
1 11amp II~ill c=
- n- HE to
11r -shy
bull b mmiddot 1 bull bull L
-
gIl F Jamp u
n _ If
bull III
21
This measuring device is in reality a spectrogram with horishy
zontal markings The first line on the chart represents a
frequency of 0 hertz (hz) Each line above the first repshy
resents a multiple of 500 hz The device is used to locate
th~ center of formants 1 and 2 Since it is graduated in
500 hz it is necessary to interpolate when the center ofmiddot
power for a particular formant falls between two of these
lines This is done by dividing the area between the two
lines in half then dividing one of the halves in half which
gives a range of 125 hz within which the measurement falls
and an estimate is made of the precise measurement within
the 125 hz range This should give formant positions with
an accuraci of greater than plusmn25 hz
When visual location of the formant centers becprnes
difficult a section of the formant can be made cf exshy
ample below Such difficulties with visual location usually
arise when two weak formants overlap Such overlapping
produc~s what appears to the naked eye to be a band of modeshy
rately dark grey bands The sectioner is a built in mech-
IshyfL__---
tete we tt
~
I
1 I
22
anism capable of handling such problems In the preceding
I example the amplitude of each harmonic is proportional
to the length of the line representing that harmonic I
This makes it possible to locate formant centers when vi-
I sual location is difficult
The measurements were then transferred to formant
charts cf Chart 1 on the following page
6
23
CHART I
~
t
1+
t5
1amp
Ie
z~ 2t 2p 16 12 la 8 Iii
I ~
~
I S
l I
I I
~
V V
V T
l( FORMANT V CHART
Vi ~ CcdiOrate4 ift luutdnM I V ~ cycle ~ concf
V 10 eeentl~rsI~ V
V U 5millimctcrs - I $milton
2 zk2 lis ty
I
FOlWAlfT CHART
Placing a single point on this cha-t is an assertion that formants have been observed at two frequencies one fOrrUlt at the frequency named along the right or left edge the other formant atmiddotthe frequency named along the top or bottom edge
ex Martin Joos~ Acoustic Phonetics (1948)
CHAPTER IV
FINDINGS
The data provided by the preceding methodology conshy
sisted of a series of scatter patterns on the vowel charts
Each of the dots within the pattern represented one occurshy
rence of a particular vowel To determine the range ofmiddot each
phoneme f the most divergent points in each pattern were con-
nected by a line These lines then circumscribe an area
which included the range of all the vowels in the sample
recognized ~y the informantmiddotas a particular phoneme
Verbal descriptions the actual charts of the phonemes
and the spectrograms utilized willbe found on the followshy
ing pages
25
The distribution for the sounds which the informant
produced and recognized as the phoneme 1 range~ on the
vowel chart in a broad scattering from 300-500 hz for forshy
mant 1 and 1500-2100 hz for formant 2
CHART II
1
lid
13
bull
~
It
iA
Ml
ztr Zit zp 1 S lIZ middot1 I a r 8 6
I
f
I I
Ii 3
[7l I I V 1 I
) ~I I i I bull
V I I i bull r J
I V t I I I I I
i tt I
Kl7 I I I iI ~
I I I I I I I I I i I
I I I i I f I ltII
I I l7 I VI
I [7 1
1 I I I Va FORMANTc7 CHART
I
I I I I 173 CaEiIw-atd icw~[7 rf ltfer C0ItdI I I
j I I I i 7 10 e centlCMta1 oct4v
I V 5miU~ bull itonI
r I f 711 t14 j I I I Ik IV
FoiUlAhT CHRT
Placing asinge point on this chart is an assertion that fortcants have been observed at two frequencies one formant at tn(l frequerlcy nameu Slong the right or eft cdampe the other formant at the frequency named along the top or bottom edge
26
l 1I I - -~
I I iI I
I
[bIs] [bIn]
lt-- -_- -1I
lt i
1 ~ i1_ -shy Ir ~ tmiddotmiddot lt
-- - - ---~--- - - - ----- --
-i -_~ ~ shyI 1
i I I
I I bullbullq_-
I ~~~-~--shyr ~~~~~ -~- I------------------------shy
-----I
[dIm] [sIh]
27
I -[blr]
i1 1 I I
i Ii I
I i I I
ii ___ -J
rmiddot I i
I 1 j
-~ ~~~ ~-~IIlIr~~~
I
1 ____~~l_~~--=~ _ ~--~~~~~~~~~- -
51 hI$ PiiB PD~ii~i
-~ - -- -- ----- ~------- - --- _-- - _ - shy [rIll) [klr]
28
1 I I I
---~S~ -~~~fi~ ~~~~~-~
~l_ middot~ ___
[klk]
I I I
r [dlk]
29
-------- --
-~- shy~--I~~
[tIll]
30
The distribution for the sounds which the informant
produced and recognized as the phoneme lEI ranged on the
vowel chart in a thin oval shaped distribution from 400-625
hz for formant 1 and from 1400-2000 hz for formant 2
CHART III
lEI
i
I
1 I
1
1middot
II~~ 5 I~ I lOa I ~--~~~I-+--+-4-+--+---+--++-+-+-+-+--r--t-t--r--t--r--1
I
I I I I
t I
4
I I 1 I ~ I I I I
I t I ~
I I ~
-r--- r--- I V~~~-r~+-+-~~~+-+-~~~~~~~--T-~-r~-r~-r~-T---T--r~
V~~~++4-~~~-4-+-+~~~~~+-~-T-rV~7
~iA~~~~~I+-~~~~~I--~~~-r~~~~~8 FORMANT HHHH~~r+~~-r~+-~+-~I~-I~~rl7V CHART
I II 11I I V9 CaZiLrww 1ft huncirccLJ
-+-f-+-II-f-+-+-+-+--+-+--+--+----+-+--+-1--t-+-1---t---t--7 rtf eye 04 ~ I 11 V pq-+-+-I~-+--i--+I-t-t--+~i-I---t--+--tr -t--t-Tj-ri~middotltJ ecentimeters 1octGy
I V 5miU~ - aemiton ~~~~I~~+-~~l~-~-T~I~~~r~
t i lt~ I I IS I I liV
FolUlAn C1LBT
Placing a single point on this chart is an assertion T hat rormants have been observed at two frequencies one formant at the frequency namfu along the right or left edge the other formant at the frequency named along the top or bottom edge
31
I I
I ~_ f __
~~~ - - ---~ _-shy
I -- shyI - _v-- _ l
i _~~E~~~~middotmiddotmiddot ~---~--~~-it--_ ~_~ 1gt_ bullbull bull -_gt-~~~ ~ bullI
P~J r_i~=~~~ ~-~~~- - -1 I -----~ -~-~ _ ---_
~~Wa~~Ji~~L ____ __ _____ _
[PEs]
I __ shy
-- --shy
~~ ~ -Qt-shy
-~=-=----
~~~7=~~ L___ __ __ ____ _ ______~
[rFm]
32
[PEt]
bull - -IIot-__
- ---~~--
[dEk]
---
33
f ~
I
) I I
I
I I
I 1 I
I I
I
1
__ -~_~i~~-yen-=-- ~~-~= --
------------------------
[dEn] [sEn]
i
~ ----shybull __ ~
[cEr)]
34
1J i i
~
--~~ ~-
~~
-~- ~ -~ ~~ ~gt-- ~- ~~
I ~IJItt- F ~ 111 i~-~_~--- ~--- - _ =-- 4e -~~~-~_-_~-- _~
bull vf middotmiddot~~tmiddotmiddotl____________________~____ j
[sEp] [bEk]
[bEl]
~ shy~~--_o-
J -~~~
~~t~-~~J~ r~~7~ _
I middot---=i---=-~_4~ __ ~~~~~___I _ _~
~g_i$fj bull - ~-~~~z~ir~~ ~~~ leal -~I_ iiIB
L_________ __~________ _____~
[lEs]
I f
I
35
- --- ---- - ---- ----------
~-------- shy
bull
j
i
[tEll][dan]
[dEp]
36
The distribution for the sounds which the informant
produced and recognized as the phoneme A range~ on the
vowel chart from 600-750 hz for formant 1 and from 1600-2300
hz for formant 2
CHART IV
A
i6
i I I
I I
I I
I I
1 0
I
I I I
I I
I I
s
It
i j I Ii i I
I I
6
~ I 1 I I I I ~
I I I V~ FORMANT ~~~~~I~1~4-+-~~~--~1-+~~I~-~-r17 CHART
~~~~~~l~~~~I~i~~~~I~+I~~lr_I~I~~~$ ~U~~~h~~ ~ I I I I I ~ 7 J eye ptI -cony
1f4-i--~--+---I----t--I-4--~1--+---+--+---+---1-~i7-to e cVltJte1 oct4v
i I I I 1 5miU~ - bull iton ~~~~~~~~~middot~~~~4-~I~I--~+~middoti i
2~ I I
F01UlANT CiLlT
Placing a single point on this chart is an assertion tnlt rorreints have bE-en obsered at two frequencies one formant at the frlquerJcy nSleU aiong he right 01 eft edge the other formant nt the frequency named along the top or bottom edge
37
I I i
-shy
I
I
I
~1iI
p~~~~==~~~~i~~~~
I I
[lAs]
_7 -~
-- -shy
L _ _ _ ____________ --- -- ----_~____J
[nAn]
--------
38
I I
------------------~----I I 11 I I
II1
flt~
I
IJ
L
i
______________________
[sAk]
f
~~ ~--r
1 shy
~~-
-- shy[sAn]
I r 1I I I
t
t
I l I
I I I
I i
I
[sAt)] [sAp]
39
~]
I
I I
[rArl][bAk]
I
-shy ---==-_____lshy___
[lAp ]
40
~----------------------------~-------------~
1 bull -l----1-shy
~middot-~-~t-=-- -
~r-shy -shy t~ III M -~ ~~---shy~t-= ~r=_ _shy
C z---=-
L______________________----- [dAs]
[dAr]
l _
41
v 1
I I
i
I
I -tc - bull ~ 1t iCSi4 _ -
-~~-r~middot- 1 ____ ~~~~ ~ ~ I
1 I ~=~j3~middot7-__ ~~
[kArl
---------------------~------
[dAin]l
I I
-I
I
42
I gt1 tmiddot
I
[bAm]
bull
~ I 1 I
gt1
-- - ___ _ N ____ ~--shy---- shy
[bAn]
43
[lAh]
==III
I Imiddot
__~_--_middotfI_~__ ~ ennee ~ S
LL-
[JAk]
--------- ---------
44
---------
I i Ir I
I I j
i
I i
~ --_ -- ~
~~fb-~~~~~~ ----- shycshy7FiIf Elii=s FUP WRmiddot 75t3~ n JIilIeia
~------------
[JAs]
-II
I J
[dAnl
45
~ I 1shy
I
iI shyi t
- - - Imiddot--- ~p -~--~= roc - I
I II i
I I I
~ middot1 I
------J
j I
I I i
i I
1_____ --- I ---------------~
[kAs]
I
I I
I t
I I i
j poundiampl d
rshyl
I i
I
1
I I I
I Il
[bAl]
I~
[bAl)]
I
47
L---------------------- --------------~
[kAp] shy
t
I-- I ~ I i
I
ji I
I -I
I 1 I 1
i
)
~~
~L~--~~---~ - ~ ~
~ -shyY- r i
I
-
1
I I
)
----~ -shy- -- _ ~ ----shy
1 I i i I I
1 I
L ~~~~-~~-~-~~~-~~-gt-= rn~ J ___fi ~ 7 7TZ r~ 5UZs=j -~ l ____-------- _____ __ _ ___________ ________ I
[kAk]
i
I t r ~
--~~ -shy
~~~c~_=--_u ce4 we
I r bull
[gAr)]
~-~ shy
- -~ -~~
~P ~-~~
I ~~
-- bull ~ I - ~~-~~
~-~~~--~ shymiddotT _i
48
-----------------------------l
I I
I I
[rAk]
~_
~ ~--- ~~~-~
j ~~ ~ ~ ~7
~ bull~~middote ri~-is~~~l-IIII-middotlIIIIn---I~-- 41~~~~~ ~
1--=-_---- - - -===--------shy
[sAil]
I
49
_- I I
I -- ----------------shy
~2~~~ ~~
i i I I ~~~~~~~~b ~-
middot_- _ ~~------
j
i ~ at -== l - -- ~-~~it I ax I C1 bullbull~~- shy
I
I i
I I
I 1 I II r I I
-r- --shy
~~-~-~- -~-
-1 l I
I I
[bAs] [PAs]
r-------------------~------------___
[pAl]
I
50
The distribution for the sounds which the informant
produced and recognized as the phoneme 0 ranged on the
vowel ~ha~t from 400-525 hz for formant 1 and from 700~1000
hz for formant 2
CHART V
0
III
t5
lot
S
6
Ie
to
Z7 Zit 9 I 1 I a I z I a 6 6
I
I ~ I
I i II I
j i bull I I
I I I i I
I ~ t
~ ~I I
f I
I ~ f A I I I
j [- V I 1 I I I II ~ I 1 I I
At I
I t I I
V V
V 7
i I Vi( FORMANT I 1 I 1 CHARTI I
I V 3 C41iotc4 ill lUjn~ 01 eycpr ~0It4
i I f I IV
I ) I V IO 6 centltcrs 1 octcv1 I I I 5miU~ -Istmi-toneI
I I VII 2 I ltQshy t 116 IV
FOlUlUfT CRBT
Placing a single point Oll this chart is ampn assertion that formants have been observed at two frequencies (me iormant at the frequency nametl ~ong the right or left edge the other tonnant at the frequency named along the top or bottom edge
Ishy
51
r--- -_-__ - --------shy
-- ~--- --shy~ -
--f -~-
[tOll][pOn]
~ ---- -11lt1 ~
~-- - -~ P---~Amiddot_
t _ __ _
1 r I
--1 i I
I
I ~~~J L____ _ 1 rshy
[dOs] [b0s]
i Imiddot
52
---------------------~---
i I r -------- --------shy
r~~middot-~ [
I V I ~~
I - shy
~~~middottdmiddot~~-~-middot~-
S~~i~~-~ ~- bmiddotmiddotmiddotL _____middot_ ~_
[bOr] [rOk]
I
1 I
i i
j
I
[dOpJ[pOl]
53
Ii --~ --~--- -~~~~--=- I r
~ ~- ~ - ~ - shyI - -~ ~~ -~~ I
-1bullbull - h ~~~
~~~ ~ ~~~~----- ~~-~~~-~- ~--~~~~L- ~bullbull
I middot~-~middotdf r scr ~~~~~
~-laquo~~-==~~~-~~--~~~~ ~~
I
[lOs]
I
I
r I
i 1
i 1
I I J_____~ __ _-_M___J
[bOn]
54
i -~----
I I I r r
~-~ -shy
[bOn][sOp]
jI ----II I J
i
I I I
I I I i
I~~~==it shy
[jOk][tQr)]
55
1 I
I
II I I I
I c ~~~~~~~~ ~~OOWJI~~=U
[lOh]
i I
I
I ~~~-
I ~- -- shyl - _- ~ shy
I ~n=~~-~middot ~FlR T =Iti 1amp11 dill_
__-J
[pOt]
__J pOs]
1
- =xu
[bOk]
I
56
The distribution for the sounds which the informant
produced and recognized as the phoneme lUI range~ on the
vowel
hz for foimant
chart in an
1
almost square-like pattern from
and from 700-1000 hz for formant
250-350
2
CHART VI
lui fIG
3
t
ts
~
la
Il
IT zt 20 IS
I I
I I
i j
I
I j
I I
I
I I I
I t I I I1
I J I I I
~ i I LJ J I~
I
I
I
la -I
10
I
I I I 1
t I I i
I
I
I I
I
I I I
I ~ 1 v I)
V V
qV
FOlUfANT atRT lt
8 6
I t lt
~
I
l --~ I--- ~I I
i
I I
I I I i ltiI I
I i ~
I t
V
V V l( FORMANT I V CHART V
V Caiote4 iramp 1umb_ ef cycipampf on4
6 CelItlmctcrs bull octclv SmiUitoctamprs -I a~i-tonl
PlaciDg a single point on this chart is an assertion that formants have been observed at two frequencies one formant at the frequency named along ~he right or eft ede the other fonnant at the frequency named along the top or bottom edge
I
57
I
I
I -I
I
j _-
~~ -
-
bull I -
[dUp]
t I ~
~
I middot1
f
IshyIj II
I i
-------=shyI ~~-- -
L ~~-=-r--~~-III--=---
58
i middot1 I
I
i j I Imiddot
I~1 middotU~ _ s
I ~~~~~_-_-~--~ --_ I
L~ __________~_____________~ [CUll]
I
I
[dUr]
I
I J
I
I I
II
1
-yen ~ L___________ ~__ ~=~
I [kUs][pUn]
59
I
I
i L ~ -----------~-
____---shy______---2
~~~ -~ _
j ~---
I~~~-~-~ ~~ ~~
[nUn] [lUp]
I 1
~-=-~ ~~ -
[rlhn]
I
60
l
- _ ~~-----
~~~~~ JlCIIPrl fue rm ad I II
L ~ [gUI)] [kUk]
e_
__ ~ e-
~-d~~~~
[lUs] [jUs]
61
shy
I
Iii lEI and A Compa~ed
In comparing the distributions of the vowels III lEI
and IA( cf Chart VII on p 62 it is evident from the plots
that the front-back tongue position is for all practical
purposes identical ie the core distribution for all
three phonemes ranges between 1600-2000 hz This demonshy
strates conclusively that the significant phonetic differshy
ence is tongue h~igth ie t~e position of formant 1
The fact of phonemi~overlap is illustrated by the
crosshatching on Chart VII The cross-hatched area represhy
sents a r~nge of phonetic quality that is identified in one
instance as an III and in another instance as an IE or in
one instance as an lEI and in another instance as an IA
bullbullbull the sounds which follow one another in a changing sequence constitute the signals of speech and these sounds are produced by movements of the vocal apparashytus i e by movements of the lips tongue throat lungs and so on It is therefore important to understand that these vocal movements caused by the various muscles involved tend to slur into one anothshyer Since each variation of movement gives a varishyation in sound the slurring of movements produces a slurring of sounds Furthermore since specific sound will have different slurs of moveme~t depend~ ing upon the movement which it precedes or folloItJs each sound type resul tant from the productive moveshyments will vary somewhat according to the sounds which it precedes or follows (Pike 1947)
In line with this the next logical step would be to
look for environmental influences which would enable a listshy
ener to determine which phoneme was represented when phones
were recorded in the overlap area
62
CHART VII
lIlt lEI and A Compared
~ 2[7
t5
lot
5
ft
fA
Ie
Zit I zp 16 I a la 8 6
t I
~
II V I I I I +
r l~ ~ ~ I
I I ~ ~ V I I 1shy fZ I I t s
) I I j I I I
i ~ I 1 1 I I _lgt
V ~R R-r--~ I V
ItV l(
I I---I-
V~ j shy ~
I I I I FORMANTI I
I I VV CHARTI II I V S CaliL-tcd I Uut
I I I l of fIelc F- 0114
I I I I I j i I 10 ecentImeters 1oct4v
I
I ~ V Smillimctus Iumrton_ j VII
2f1 2~ 16 ltv
FOlUlANT ClIABl
Placing single point on this chart is an assertion that io-rnants have been observed at wo frequencies one formant at the frequency named ~ong the right or left edge the other formant at the frequency named along the top or bottom edge
63
A fairly thorough study of the positions of various
vowel sounds in specific environments did not indicate any
consistent variations of a particular type For example
the vowel in dim is in the lower range for the vowelIII
but the EI in dem is in the upper range -of the vowel lEI
Thus it seems probable that those sounds in the overlap area
are qualities for which minimal contrasts do not exist For
example the II in sih is in the overlap area but appar-middot
ently is clearly recognizable by a native sp~aker because
there is no seh at least no such word was known to the
informaht nor could one be found in the dictionary (Echols
and Shadily 1968)
IU and 0 Compared
In contrast with the front vowels III IE and IAI
the back vowels Iu and 0 have aconsiderable gap plusmn50
hz between the1r two distributions cf Chart VIII on
p 64 The distributions appear directly above one another
on the chart In comparing the two ranges it is appa~ent
that the front-ba~k position formant 1 is identical ie
the core distribution for the phoneme ranges from 700-1000
hz This demonstrates that ~he position of formant 1 ie
tongue height is the significant phonetic difference
64
CHART VI I I
U and 0 Compared
I I
i
5
~
5
6
til
~
2[1
I
Zit zp 15 IZ la a 6
~ I -~
1 ~ ~ ~
~
I V 1
V
I V ~
JIll ~
I I 1 6
1 middotV V l(
vI( FORMANT CHART
9 CalLOt-ctc4 ift 1awuutb of cyc14 p ICCOftI
I~ I V 6 eentllMtcrs 1 octo
I V 5mmi~ - ampImitenI VII
214 I 210 16 IV FOlUfANT CE1ART
PJaciDc a single point on this chart is an assertion that formants have been observed at two frequencies one form3nt at the frequency named along the right or left edge the other formant at the frequency named along the top or bottom edge
middotr I
65
II lEI IAI lUI and 101 Compared
In comparing all three phonemes in their respective
poJition on the vowel chart cf Chart IX an p 66 there I
se~ms to be no problem identifying between front and back
vowels There is a gap of approximately 400 hz between
th$ two back vowels and the three front vowels in terms of I
fotment 2 Also it would appear that there would be no
pr~blem in identifying specific vowel qualities so far as
fOfmant position is concerned for vowels in stressed position
with the exception of the phonemic overlapping discussed in
a preceding section ie III-lEI and IE-A
I
I
Imiddot I
CHART IX
I 1 E IA U and 0 Compared I
iM zr Ztt ap J 6 I Z 10 S 6
I I f ts I
~
tj1- ~
rL ~ ~
J 4- 1 ~ ~ i~ ~ V
Ii ~W~ V I ~~ ~ J
V I ~ ~
IS I ~ V 5 1 t
~
s ~ I I f
V R ~ r-~ I V
if~ V ~ ~
-- V 7
~ -~ [a ti I l( FORMANT
V CHART
V 0 cyclu on4 S CaULntte4 ilt hWldr_
I
Kl I jmiddotV I j V 10 6 centlrMtcll1 oct4v
V 5llIil(lCtampn ~ hl4Imiton
Vii 2~ zkgt 116 I IIyen
I
Forw~ CllABT I
Placing a single point on this chart is an assertion that formants have been observed I at two frequencies one formant at the frequency named along the rignt or left edgeI
the other formant at the frequency named along the top or bottom edge
~ ~ bull -
66
I
I I j
Cbull
I I
i
CHAPTER V I SUMMARY AND CONCLUSIONI
I As is shown on Chart IX on p 66 there appears to I I
bela very discernable distribution for each of the vowel I
Phtnemes of Bahasa Indonesia This does not mean that the
ci cumscriptions of each of the various sounds indicate I
detinite border lines for each vowel Rather it shows i
th~ position o~ each vowel in relation to the other vowel
phbnemes The vowel charts show the position of the phonemes
i asl produceq by one native speaker of the language Thus
nJ conclusions can and should ~e made regarding the definite
oJter boundaries of the ranges of middotp~onemes As is implied I
b~ the term ranges the phonemes have no defined boundarshy
I i~s
i Bahasa Indonesia does not appear to have two front I
v~wels two back vowels and one central vowel as is implied
i+I
the traditional symbolization Rather it has three i
ftont vowels with a three-way contrast between high mid I
i a~d low and a two-way contrast of high vs mid in the back
a1ea of~he articulation chart If a traditional symbolshy
i~ation of the vowel phonemes of the language were now to
b~ dawn it would look like the following chart I I I
68
front central back
high
mid
low
I
U
E 0
A
Thus as has been demonstrated the impressionistic
sion of the vowel system was in error with regards to
central phoneme of the language investigated There
a ears to be no low-central phoneme in the language
r it is a low-front one Although the spectrograph
c nnot establish a phonemic system of a language on its
o n it can provide a yes or no answer about the phoneshy
t c qualities of the phonemes in question After a phoneshy
m c system has been established the spectrograph can proshy
v de phonetic data which distinguishes one phoneme from
a other
BIBLIOGRAPHY
Sources Cited
Almiddotsjahbana Takdir The Indonesian Language - By-product of Nationalism Pacific Affairs XXII (1949)388-92
Am rican University Area Handbook for Indonesia Washingshyton DC ~S Government Printing Office 1970
Blch B and G Trager Outline of Linguistic Analysis Baltimore Waverly Press 1942
Du n H K Calculation of vowel resonances Journal of the Acoustic Society of America XXII (1950) 740-53
ols John M and Hassan Shadily An Indonesian-Enqlish Dictionary Ithaca Cornell University Press 1963
ner C Reserches sur la structure des voyelles orashyles Archives Neerlander Phonetic Experiments XX (1947) 40-77
obson Roman C Gunnar Fant and Morris Halle Prelimshyinaries of Speech Analysis Cambridge MIT Press shy1961
J s Martin Acoustic Phonetics Baltimore Linguistic Society of America 1948
L defoged Peter Three Areas of Experimental Phonetics London Oxford University Press 1967
P Mario Glossary of Linguistic Terminology New York Columbia University Press 1966
Perce Joe E The Spectrographic Study ~f Vocalic Nuclei Language Learning XII (1963) 241-247
- --- Phonemic Theory and the Analysis of English Syllashybic Nuclei Linguistics XVII (1965) 36-57
P ke Kenneth L Phonemics Ann Arbor University of Michigan Press 1947
70
Pi e t Kenneth L Phonetics Ann Arbor University of Michigan Press t 1943
Pu gram Ernst Introduction to the Spectrography of Speech New York Dover Publications 1966
ir Edward Language An Introduction to the Study of Speech New York Harcourt Brace amp Co 1921
enbeck E M Indonesia and Malaysia 1I Current Trends in Linguistics IIX (1967) 55-111
dman Dorothy The Republic of Indonesia New York N Y Philosophical LibrarYt Inc 1955
Sources Consulted
r e j e v N D bull Some ProbIem s 0 f Baha s a In don e s i a Ph a nshyology Studia Linguistica XI (~1957) 44-46
lingmiddotC L Linguistic Units The Hague~ Mouton amp Co 1960
J obson t R Hague
and M Halle Mouton amp Co
Fundamentals 1956
of Language The
K nedy Raymond Bibliography of Indonesian Peoples and Cultures New Haven Yale University Press 1962
Perce Joe E Spectrographic Study of English Vowels Under Primary Stress Linguistics LXXXIV (1-972) 41-84
P ttert Ralph K George A Kopp and Harriet C Green Visible Speech New York Dover Publications t 1966
T euw A Critical Survey of Studies on Malay and Bahasa Indonesia The Hague Martinus Nyhoff 1961
-basin
-head of an area
-form of address
-ball bag
-bell
ba --bank I
bUr --you I
bi --beer
bomiddot--drill I
ba--bliJss
bi --bus i
I t
bo I
--bunch bun~le i I
ba--crossbeam
--bomb
--tire
--son of
--ration coupon bond
--garbage dump
--checkered design
--inch
--and plus
APPENDIX A
LIST OF WORDS
den~-abbrev of the title raden
dar--olace location
dur--pearl
das--a shot
dos--small box
dek--deck
dik--younger sibling
dep--to b~ shelved
dop--hubcap
dup-~to be baptized
djak--jug
djok--seat
djas--coat
djus--part of the Koran
gang--paBsageway hall
gung--gong
kak--form of address for elder
kik--handloom
kuk--collar harness
kar--map
kir--jo test
kas ~money supply i
kus -to hiss spit I
lahi-alreadY
loh-writing tablet
lapi -towel I
lup -magnifving glass or
last -IrJeld i oint
lesl -lessonI
lOs -shed I
I I
-to iron
-which who
nu -yonder
po
pa --pole
pa --to fit
pe --plague I
po --mail I
pel --cap
pOI --pot
--pound
--also
r --shelf
--shirt
g-o-rank position
g--ring
--brake
rum--cream
sah--valid legal
sih--an enclitic usedmiddotto soften what follows
san--form of address far sargeant
sen--cent
sang--superior
seng--zinc
sap--line row
sep--chief boss
sop--soup
sjak--suspicion doubt
sjok--attractive
tang--tongs pincer~
ting--sweet meat
tong--barrel vatmiddot
teh--tea
toh--yet nevertheless
tjeng--molasses
tjung--young boy
III 1
APPENDIX E
LINGUISTIC SYMBOLIZATION USED
IAI~high-front-openIi
II
~ r
E~-mid-front-~pen
III
AA-low-front-op~n t1
o1-mid-back-open
Uf-high~baCk-close III
I III
~~~vd bilabial stop
[dj~vd alveolar stop l
I I
[kt-Vl velar stop I
[g I-vd bull velar stop
[1 -lateral I
(n-vd alveolar nasal 1
(m~-vd bilabial nasal
~I-Vd velar nasal
I
III ~IJ
I
q
dl
I
Iil~
I
Vowels
Consonants
[p]-vl bilabial stop shy
[t]-vl alveolar stop
[rJ-vd alveolar flap
[jJ-vd palatal affricate
[CJ-vl palatal affricate
[S]~vl bull alveolar affricatmiddote
[s]-vl alveolar middotfricative
h]- vI velar aspirant
1 0
of data into a structure (Pulgram 19~5) The nature of
each feature is of the essence Thus the composition of
each phoneme becomes of primary importance in a language
The phoneme can only be defined in reference to the larger
frame whi~h is the language of which it is a structured
feature (Pulgram 1965) It is the shortest stretch of
sound which serves a signalling function
Acoustic Theory
I Distinctive feature theory as previously describedI I seems to handle such phonemes s stops fricatives and
I nasals quite well eg the airflow out of the mouth is I
either stopped or it is allowed to escape On the other
1 hand vowels seem to be ranges of phonetic quality whichI
are extremely difficult if not impossible to distinguish
in terms of presence vs ab~~nce of distinctive features
Since this study will not be concerned with consonants but
only w~th vowels it is only necessary to discuss the acousshy
tic nature of vowel qualities from this point on
FundamentalsHarmonics
Vowel quality is determined by a combination of a fundashy
mental and its harmonics A vowel quality displayed on an
oscilloscope shows a very complex single wave form This
wave form is in reality the mathematical sum of a number
of simple wave forms or at least for theoretical purposes
1 1
can be treated as such These wave forms are generated
in the oral tract by the opening and closing of the glotshy
tis The fundamental wave is a sine wave with a frequency
equal to the number of times the glottis opens and closes
each second and an amplitude which is directly pro~ortion-
al to air pressure in the lungs Because of the nature
of sound waves a harmonic is generated at every multiple
of this fundamental eg if the fundamental is 100 cycles
per second then a harmonic is generated at 200 300
400 bullbullbull CO As soon as the complex wave leaves the vocal
chords harmoni6s are filtered out by the nature of the
tissue surrounding the oral tract as well as the cavities
in and adj o 1ning the oral tract The complex wave emerging
from the mouth is the mathematical sum of fundamental and
the harmonics which have not been filtered out by the oral
tract cf Martin Joos Acoustic Phonetics (1 948) chapshy
ters 1 and 2 for a fuller explanation of this process
Acoustics vs Articulation
In the last century far too much energy has b~en exshy
pended in attempts to relate acoustic features to specific
articulatory movements Bloch (1942) illustrates this by
stating qualities are identified by ear but in linguisshy
tic works they are traditionally defined in terms of their
assumed production by the vocal organs This type ofmiddotstudy
is misdirected because the only things that impinge on the
I I
- I
12
human ear are the harmonics which were not filtered out
The articulatory movements which cause the filtration ie
movement of the tongue from front to back creating a series
of filters each of which removes different harmonics
from the complex waves are irrelevant Pike (1943) argues
one should analyze and describe the sounds (or sound waves)
themselves rather than the movements ~roducing them
It has long been noted by acousticians that a variety
of articulatory movements remove the same harmonics and
r~sult in the production of very similar sounds Pierce
(1962) illustrates this by saying
As long as the formants are in their praper positions ie the proper frequencies are passed through the speech mechanism it does not matter whether the unwanted frequencies are filtered out by rounding the lips or moving the tongue to the back ThuQ when Holbrook and Carmody give one front-back position for the tongue for a given English vowel and IPA (International Pho~etic Alphabet) gives another it is quite probable that both are completely correct and that the formant shift is made by compensating for the lack of tongue movement in the speech of some speakers by additional lip rounding bullbullbullbull
Since the hearer of a stream of speech can hear 9nly those harmonics which emerge from the mouth as componshyents of the final complex wave the placement of the formant is of primary importance not the articulation which produced the sound
Therefore a study of the phonetic quality of vowels
demands an instrument which is capable of making an accurate
record of the presence or absence of all the harmonics
having sufficient amplitude to significantly alter the final
wave form The acoustic spectrograph is such an instrument
13
it was the first instrument to make large scale acoustic
a n a ly s e sapr act i c a I po s sibiIi t Y n ( Lad e fog ed 1 967 ) bull
Spectrograph
The acoustic spectrograph is a device ~hich records a
stream of speech 2~4 seconds or less in length This
recording is then fed into the analyzing part of the specshy
trograph where at each successive playing ne frequency
or rather one frequency band is lifted outof the total by
the variable filter (Pulgram 1965) A black ma~king is
made on a piece ofmiddot electro-sensitive paper each time there
is a harmonic present within the frequency band being anashy
lyzed Since the articulators are constantly moving and
changing the filtration characteristics of thevocal tract
the black markings ma~e by a stylus reflect the movements
of the articula~ors in a very broad sense More important
however it makes a precise record of the stimulus ie
the harmonics which reach the ear of the listener Dunn
(1950) says the vowels have asso~iated with them different
frequency regions in which the sound is more intense than
elsewhere in the spectrum The name formant has been apshy
plied to these regions
The next problem then is to relate the concentrations
of power mentioned above ie the formants to human pershy
ception of speech sounds The most widely utilized techshy
nique in this area is one devised by Martin Joos (1948)
~______________________________________~S___________________________________________________shy1
14
generally referred to as his 2 Formant Theory This techshy
nique represents the plotting of formant 1 and formant 2
in a specific wayan a particular chart cf Chart 1 on
p~ 23 This technique is clearly described by Ladefoged
(1967)
The relations between the formant structures of the vowels in a number of words can be conveniently represented by means of formant charts which show the frequency of the firs~ formant at a time in the word when the formant structure is changing at a minimum rate plotted against the frequency of the second formant at the same time
When making these kinds of plots a charting is derived of
vowels for any language which is remarkably like the tradishy
tional impressionistic vowel charts of the 19th century
Esner (1947) illustrated that if the frequency of the first
formant was plotted against the frequency of the second
formant it seemed to equal the relation between formant
frequency and the traditional vowel diagram
Basically this study will reproduce such vowel charts
for a number of examples of each sound in Bahasa Indonesia
Formant 1 will be platted against formant 2 for each vowel
phoneme in a variety of phonemic environments -The purpose
of this will be to determine the range of variation for
every vowel in each e~vironment as produced by a single native
speaker
CHAPTER III
METHODOLOGY
Phoneme Identification
In order to assess the phonetic quality of vowel phoshy
nemes one must first ascertain the number and relationshy
ship of sound contrasts in a language ie the phonemes
The visual representation of the actualization of the phoshy
neme ie the spectrogram can only be made on the basis
of a preceding decision of the linguist on the types and
number of phonemes in the l~nguage to be anaiyzed (Pulgram
1965)~ Phonemic analysis cannot be made with phonetic
data alone it must be made with phonetic data plus a sershy
ies of phonemic premises and procedures (Pike 1947) A
spectrogram conveys phonetic information which aids the
linguist in determining which phonetic features are consisshy
tently present in order to reach the most accurate phonetic
description
There are a variety of premises and procedures which
the investigator may utilize in order to discover the phoshy
nemic structure of a language Pike (1947) argues that the
investigator must have at hand observable native reaction
to native sounds andor know structural facts pertaining to
the phonetic nature of the sounds and their distribution
As stated before a phoneme is a bundle of sound f~atures
1
j
16
which when substituted for another bundle creates a difshy
ference in meaning Since the creation of a different morshy
pheme is the result of the substitution of a different sound
feature these sound features are said to be phonemes
A pair of words in which the first word is the same as the second except for the fact that one segment is replaced by a different but phonetic~lly similar segment in the second word constitutes proof that the two similar segments are phonemically distinct~ bullbullbull Word pairs of this type are said to be MINIMALshyLY DIFFERENJ because no smaller difference in the language can make a differ~nce in meahing in words (Pike 1947)
Hence minimal pairs of words were used to find phonemes
Minimal~y different word pairs prove to be the beginners
single most important tool for the analysis of phonemic difshy
ferences (Pike 1947)
Thus Echols and Shadilys An Indonesian-English Dicshy
tionarv (1968) was ut~lized to find three-phoneme words
containing two consonant sounds with a vowel in medial poshy
sition The process was simply to go through all the words
beginning with consonants and find minimally different t~ree
phoneme words This was done on a purely anthr~poscopic
basis on the part of the investigator If a different letshy
ter was employed to distinguish a different meaning it was
assumed to be a different phoneme The following ~ord pairs
and their meanings are examples of the words found in the
dictionary
ban--tire bin--son of
das-- a shot dos--small box carton
I
1 7
pal--pole pel--field
rang--rank position ring--ring
teh--tea toh--yet nevertheless
After having obtained the words from the dictionary
a native informant was called upon to verify ~he differshy
ance in meaning in the minimal pairs and to pronounce
them so that ~hey could be phonetically transcribed in
al1 impressionistic manner The informant employed was Kok
Djen Su a student at Portland State University from Yogshy
jakartai Indonesia He has been a student in the United
States for approximately two years and speaks broken al shy
though very understandable English Mr Su was horn to Mr
and Mrs Su Hendry Su who both speak Bahasa Indonesia Jashy
vanese and a small amount of Chinese Since his birth the
informant was exposed to a mixture of Javanese and Bahasa
Indonesia but has employed the national language of Indoshy
nesia since the age of three at school His bilingual upshy
bringing it seems to the author does not craate a subshy
stantial difference in the competence of Mr Su in Bahasa
Indonesia In fact he was able to distinguish the proshy
nunciation Qf words in both Javanese and in Bahasa Indoshy
nesia The utilization of one informant deletes any reshy
gional variation or individual variation between informshy
ants Since here we are attempting to ascertain the relashy
tive range of phonetic quality of vowel phonemes in Bahashy
sa Indonesia the informants bilingualism ahould cause
none or very few phonetic distortions
After-having verified the difference in meaning of
the word pairs Kok Djen ~u pronounced the word The
following impressionistic version of the Ihdonesian voshy
wel system was described
front central back
high
mid 1 I
I I low j
i I I
I
u-
E 0
A
1 Spectrograms
The phonemic entities symbolized in the preceding
section represent range-units of phonetic quality The
symbols and their position on the chart are based on the
aural perceptions of the investigator The purpose of the
spectrographic analysis of this data is to determine as
accurately as possible the actual phonetic range represenshy
ted by each of thephonemic symbols
I
i
1 9
In order to make spectrograms from which meani~gful
conclusions can be drawn one must have a native informant
of the language to be studied Spectrograms were made of
the speech of Mr Su the informant described earlier
In order to conserve the time of the informant a
sample of three-phoneme words were recorded The three-
phoneme words begin and end with consonants ahd contain a
vowel in medial position The list appears in Appendix A
The list of words was specifically selec~ed to eliminate
in so far as possible all variatiqn other than that which
is specifically caused by the preceding and following consoshy
nants This is true because by utilizing a single informant
the influence of dialects both regional and social are eshy
liminated and by utilizing one sy~lable words under primary
1stress sequential influences such as the Markov Process
are eliminated since there is no sequence beyond one phoshy
neme preceding and following the vowel This being the case
one should be able to derive from a series of spectrograms
of those vowels both the range of free variation and the
specific influence of each particular consonant on the voshy
weI quality of each medial phoneme
The n~xt st~p in the procedure was to play the tape-
recordings into the spectrograph two or three wo~ds at a
1The Markoy Process is a mechanical way of handling enshytropy in sequential operations IQ linguistics this is stashyted in terms ofthe probability of the occurrence of a parshyticular phoneme morpheme etc in a precise sequence
20
time The machine can handle 24 seconds of speech on one
spectrogram thus two or three words could be analyzed at
the same time as one with no loss in quality or precision
Unfortunately the recordings had to be played into a
microphone which picks up some background noise but by
placing the microp~one of the spectrograph very close to
the loudspeaker of the tape recorder and turning the volume
up slightly this background was eliminated for all pracshy
tical purposes middotIt would have been better to have had a
direct connection between the recordar and the spectrograph
but unfortunately no such devce was available Background
noise shows up as very small specks scattered more or less
at random and unless the volume of such noise is exceedshy
ingly strong does not interfere with the reading of the
spectrograms
Once the machine had completed the analys~s and produced
the graphic record of the list of words a frequency measur~
ing device was produced by the machine cf example below
1 11amp II~ill c=
- n- HE to
11r -shy
bull b mmiddot 1 bull bull L
-
gIl F Jamp u
n _ If
bull III
21
This measuring device is in reality a spectrogram with horishy
zontal markings The first line on the chart represents a
frequency of 0 hertz (hz) Each line above the first repshy
resents a multiple of 500 hz The device is used to locate
th~ center of formants 1 and 2 Since it is graduated in
500 hz it is necessary to interpolate when the center ofmiddot
power for a particular formant falls between two of these
lines This is done by dividing the area between the two
lines in half then dividing one of the halves in half which
gives a range of 125 hz within which the measurement falls
and an estimate is made of the precise measurement within
the 125 hz range This should give formant positions with
an accuraci of greater than plusmn25 hz
When visual location of the formant centers becprnes
difficult a section of the formant can be made cf exshy
ample below Such difficulties with visual location usually
arise when two weak formants overlap Such overlapping
produc~s what appears to the naked eye to be a band of modeshy
rately dark grey bands The sectioner is a built in mech-
IshyfL__---
tete we tt
~
I
1 I
22
anism capable of handling such problems In the preceding
I example the amplitude of each harmonic is proportional
to the length of the line representing that harmonic I
This makes it possible to locate formant centers when vi-
I sual location is difficult
The measurements were then transferred to formant
charts cf Chart 1 on the following page
6
23
CHART I
~
t
1+
t5
1amp
Ie
z~ 2t 2p 16 12 la 8 Iii
I ~
~
I S
l I
I I
~
V V
V T
l( FORMANT V CHART
Vi ~ CcdiOrate4 ift luutdnM I V ~ cycle ~ concf
V 10 eeentl~rsI~ V
V U 5millimctcrs - I $milton
2 zk2 lis ty
I
FOlWAlfT CHART
Placing a single point on this cha-t is an assertion that formants have been observed at two frequencies one fOrrUlt at the frequency named along the right or left edge the other formant atmiddotthe frequency named along the top or bottom edge
ex Martin Joos~ Acoustic Phonetics (1948)
CHAPTER IV
FINDINGS
The data provided by the preceding methodology conshy
sisted of a series of scatter patterns on the vowel charts
Each of the dots within the pattern represented one occurshy
rence of a particular vowel To determine the range ofmiddot each
phoneme f the most divergent points in each pattern were con-
nected by a line These lines then circumscribe an area
which included the range of all the vowels in the sample
recognized ~y the informantmiddotas a particular phoneme
Verbal descriptions the actual charts of the phonemes
and the spectrograms utilized willbe found on the followshy
ing pages
25
The distribution for the sounds which the informant
produced and recognized as the phoneme 1 range~ on the
vowel chart in a broad scattering from 300-500 hz for forshy
mant 1 and 1500-2100 hz for formant 2
CHART II
1
lid
13
bull
~
It
iA
Ml
ztr Zit zp 1 S lIZ middot1 I a r 8 6
I
f
I I
Ii 3
[7l I I V 1 I
) ~I I i I bull
V I I i bull r J
I V t I I I I I
i tt I
Kl7 I I I iI ~
I I I I I I I I I i I
I I I i I f I ltII
I I l7 I VI
I [7 1
1 I I I Va FORMANTc7 CHART
I
I I I I 173 CaEiIw-atd icw~[7 rf ltfer C0ItdI I I
j I I I i 7 10 e centlCMta1 oct4v
I V 5miU~ bull itonI
r I f 711 t14 j I I I Ik IV
FoiUlAhT CHRT
Placing asinge point on this chart is an assertion that fortcants have been observed at two frequencies one formant at tn(l frequerlcy nameu Slong the right or eft cdampe the other formant at the frequency named along the top or bottom edge
26
l 1I I - -~
I I iI I
I
[bIs] [bIn]
lt-- -_- -1I
lt i
1 ~ i1_ -shy Ir ~ tmiddotmiddot lt
-- - - ---~--- - - - ----- --
-i -_~ ~ shyI 1
i I I
I I bullbullq_-
I ~~~-~--shyr ~~~~~ -~- I------------------------shy
-----I
[dIm] [sIh]
27
I -[blr]
i1 1 I I
i Ii I
I i I I
ii ___ -J
rmiddot I i
I 1 j
-~ ~~~ ~-~IIlIr~~~
I
1 ____~~l_~~--=~ _ ~--~~~~~~~~~- -
51 hI$ PiiB PD~ii~i
-~ - -- -- ----- ~------- - --- _-- - _ - shy [rIll) [klr]
28
1 I I I
---~S~ -~~~fi~ ~~~~~-~
~l_ middot~ ___
[klk]
I I I
r [dlk]
29
-------- --
-~- shy~--I~~
[tIll]
30
The distribution for the sounds which the informant
produced and recognized as the phoneme lEI ranged on the
vowel chart in a thin oval shaped distribution from 400-625
hz for formant 1 and from 1400-2000 hz for formant 2
CHART III
lEI
i
I
1 I
1
1middot
II~~ 5 I~ I lOa I ~--~~~I-+--+-4-+--+---+--++-+-+-+-+--r--t-t--r--t--r--1
I
I I I I
t I
4
I I 1 I ~ I I I I
I t I ~
I I ~
-r--- r--- I V~~~-r~+-+-~~~+-+-~~~~~~~--T-~-r~-r~-r~-T---T--r~
V~~~++4-~~~-4-+-+~~~~~+-~-T-rV~7
~iA~~~~~I+-~~~~~I--~~~-r~~~~~8 FORMANT HHHH~~r+~~-r~+-~+-~I~-I~~rl7V CHART
I II 11I I V9 CaZiLrww 1ft huncirccLJ
-+-f-+-II-f-+-+-+-+--+-+--+--+----+-+--+-1--t-+-1---t---t--7 rtf eye 04 ~ I 11 V pq-+-+-I~-+--i--+I-t-t--+~i-I---t--+--tr -t--t-Tj-ri~middotltJ ecentimeters 1octGy
I V 5miU~ - aemiton ~~~~I~~+-~~l~-~-T~I~~~r~
t i lt~ I I IS I I liV
FolUlAn C1LBT
Placing a single point on this chart is an assertion T hat rormants have been observed at two frequencies one formant at the frequency namfu along the right or left edge the other formant at the frequency named along the top or bottom edge
31
I I
I ~_ f __
~~~ - - ---~ _-shy
I -- shyI - _v-- _ l
i _~~E~~~~middotmiddotmiddot ~---~--~~-it--_ ~_~ 1gt_ bullbull bull -_gt-~~~ ~ bullI
P~J r_i~=~~~ ~-~~~- - -1 I -----~ -~-~ _ ---_
~~Wa~~Ji~~L ____ __ _____ _
[PEs]
I __ shy
-- --shy
~~ ~ -Qt-shy
-~=-=----
~~~7=~~ L___ __ __ ____ _ ______~
[rFm]
32
[PEt]
bull - -IIot-__
- ---~~--
[dEk]
---
33
f ~
I
) I I
I
I I
I 1 I
I I
I
1
__ -~_~i~~-yen-=-- ~~-~= --
------------------------
[dEn] [sEn]
i
~ ----shybull __ ~
[cEr)]
34
1J i i
~
--~~ ~-
~~
-~- ~ -~ ~~ ~gt-- ~- ~~
I ~IJItt- F ~ 111 i~-~_~--- ~--- - _ =-- 4e -~~~-~_-_~-- _~
bull vf middotmiddot~~tmiddotmiddotl____________________~____ j
[sEp] [bEk]
[bEl]
~ shy~~--_o-
J -~~~
~~t~-~~J~ r~~7~ _
I middot---=i---=-~_4~ __ ~~~~~___I _ _~
~g_i$fj bull - ~-~~~z~ir~~ ~~~ leal -~I_ iiIB
L_________ __~________ _____~
[lEs]
I f
I
35
- --- ---- - ---- ----------
~-------- shy
bull
j
i
[tEll][dan]
[dEp]
36
The distribution for the sounds which the informant
produced and recognized as the phoneme A range~ on the
vowel chart from 600-750 hz for formant 1 and from 1600-2300
hz for formant 2
CHART IV
A
i6
i I I
I I
I I
I I
1 0
I
I I I
I I
I I
s
It
i j I Ii i I
I I
6
~ I 1 I I I I ~
I I I V~ FORMANT ~~~~~I~1~4-+-~~~--~1-+~~I~-~-r17 CHART
~~~~~~l~~~~I~i~~~~I~+I~~lr_I~I~~~$ ~U~~~h~~ ~ I I I I I ~ 7 J eye ptI -cony
1f4-i--~--+---I----t--I-4--~1--+---+--+---+---1-~i7-to e cVltJte1 oct4v
i I I I 1 5miU~ - bull iton ~~~~~~~~~middot~~~~4-~I~I--~+~middoti i
2~ I I
F01UlANT CiLlT
Placing a single point on this chart is an assertion tnlt rorreints have bE-en obsered at two frequencies one formant at the frlquerJcy nSleU aiong he right 01 eft edge the other formant nt the frequency named along the top or bottom edge
37
I I i
-shy
I
I
I
~1iI
p~~~~==~~~~i~~~~
I I
[lAs]
_7 -~
-- -shy
L _ _ _ ____________ --- -- ----_~____J
[nAn]
--------
38
I I
------------------~----I I 11 I I
II1
flt~
I
IJ
L
i
______________________
[sAk]
f
~~ ~--r
1 shy
~~-
-- shy[sAn]
I r 1I I I
t
t
I l I
I I I
I i
I
[sAt)] [sAp]
39
~]
I
I I
[rArl][bAk]
I
-shy ---==-_____lshy___
[lAp ]
40
~----------------------------~-------------~
1 bull -l----1-shy
~middot-~-~t-=-- -
~r-shy -shy t~ III M -~ ~~---shy~t-= ~r=_ _shy
C z---=-
L______________________----- [dAs]
[dAr]
l _
41
v 1
I I
i
I
I -tc - bull ~ 1t iCSi4 _ -
-~~-r~middot- 1 ____ ~~~~ ~ ~ I
1 I ~=~j3~middot7-__ ~~
[kArl
---------------------~------
[dAin]l
I I
-I
I
42
I gt1 tmiddot
I
[bAm]
bull
~ I 1 I
gt1
-- - ___ _ N ____ ~--shy---- shy
[bAn]
43
[lAh]
==III
I Imiddot
__~_--_middotfI_~__ ~ ennee ~ S
LL-
[JAk]
--------- ---------
44
---------
I i Ir I
I I j
i
I i
~ --_ -- ~
~~fb-~~~~~~ ----- shycshy7FiIf Elii=s FUP WRmiddot 75t3~ n JIilIeia
~------------
[JAs]
-II
I J
[dAnl
45
~ I 1shy
I
iI shyi t
- - - Imiddot--- ~p -~--~= roc - I
I II i
I I I
~ middot1 I
------J
j I
I I i
i I
1_____ --- I ---------------~
[kAs]
I
I I
I t
I I i
j poundiampl d
rshyl
I i
I
1
I I I
I Il
[bAl]
I~
[bAl)]
I
47
L---------------------- --------------~
[kAp] shy
t
I-- I ~ I i
I
ji I
I -I
I 1 I 1
i
)
~~
~L~--~~---~ - ~ ~
~ -shyY- r i
I
-
1
I I
)
----~ -shy- -- _ ~ ----shy
1 I i i I I
1 I
L ~~~~-~~-~-~~~-~~-gt-= rn~ J ___fi ~ 7 7TZ r~ 5UZs=j -~ l ____-------- _____ __ _ ___________ ________ I
[kAk]
i
I t r ~
--~~ -shy
~~~c~_=--_u ce4 we
I r bull
[gAr)]
~-~ shy
- -~ -~~
~P ~-~~
I ~~
-- bull ~ I - ~~-~~
~-~~~--~ shymiddotT _i
48
-----------------------------l
I I
I I
[rAk]
~_
~ ~--- ~~~-~
j ~~ ~ ~ ~7
~ bull~~middote ri~-is~~~l-IIII-middotlIIIIn---I~-- 41~~~~~ ~
1--=-_---- - - -===--------shy
[sAil]
I
49
_- I I
I -- ----------------shy
~2~~~ ~~
i i I I ~~~~~~~~b ~-
middot_- _ ~~------
j
i ~ at -== l - -- ~-~~it I ax I C1 bullbull~~- shy
I
I i
I I
I 1 I II r I I
-r- --shy
~~-~-~- -~-
-1 l I
I I
[bAs] [PAs]
r-------------------~------------___
[pAl]
I
50
The distribution for the sounds which the informant
produced and recognized as the phoneme 0 ranged on the
vowel ~ha~t from 400-525 hz for formant 1 and from 700~1000
hz for formant 2
CHART V
0
III
t5
lot
S
6
Ie
to
Z7 Zit 9 I 1 I a I z I a 6 6
I
I ~ I
I i II I
j i bull I I
I I I i I
I ~ t
~ ~I I
f I
I ~ f A I I I
j [- V I 1 I I I II ~ I 1 I I
At I
I t I I
V V
V 7
i I Vi( FORMANT I 1 I 1 CHARTI I
I V 3 C41iotc4 ill lUjn~ 01 eycpr ~0It4
i I f I IV
I ) I V IO 6 centltcrs 1 octcv1 I I I 5miU~ -Istmi-toneI
I I VII 2 I ltQshy t 116 IV
FOlUlUfT CRBT
Placing a single point Oll this chart is ampn assertion that formants have been observed at two frequencies (me iormant at the frequency nametl ~ong the right or left edge the other tonnant at the frequency named along the top or bottom edge
Ishy
51
r--- -_-__ - --------shy
-- ~--- --shy~ -
--f -~-
[tOll][pOn]
~ ---- -11lt1 ~
~-- - -~ P---~Amiddot_
t _ __ _
1 r I
--1 i I
I
I ~~~J L____ _ 1 rshy
[dOs] [b0s]
i Imiddot
52
---------------------~---
i I r -------- --------shy
r~~middot-~ [
I V I ~~
I - shy
~~~middottdmiddot~~-~-middot~-
S~~i~~-~ ~- bmiddotmiddotmiddotL _____middot_ ~_
[bOr] [rOk]
I
1 I
i i
j
I
[dOpJ[pOl]
53
Ii --~ --~--- -~~~~--=- I r
~ ~- ~ - ~ - shyI - -~ ~~ -~~ I
-1bullbull - h ~~~
~~~ ~ ~~~~----- ~~-~~~-~- ~--~~~~L- ~bullbull
I middot~-~middotdf r scr ~~~~~
~-laquo~~-==~~~-~~--~~~~ ~~
I
[lOs]
I
I
r I
i 1
i 1
I I J_____~ __ _-_M___J
[bOn]
54
i -~----
I I I r r
~-~ -shy
[bOn][sOp]
jI ----II I J
i
I I I
I I I i
I~~~==it shy
[jOk][tQr)]
55
1 I
I
II I I I
I c ~~~~~~~~ ~~OOWJI~~=U
[lOh]
i I
I
I ~~~-
I ~- -- shyl - _- ~ shy
I ~n=~~-~middot ~FlR T =Iti 1amp11 dill_
__-J
[pOt]
__J pOs]
1
- =xu
[bOk]
I
56
The distribution for the sounds which the informant
produced and recognized as the phoneme lUI range~ on the
vowel
hz for foimant
chart in an
1
almost square-like pattern from
and from 700-1000 hz for formant
250-350
2
CHART VI
lui fIG
3
t
ts
~
la
Il
IT zt 20 IS
I I
I I
i j
I
I j
I I
I
I I I
I t I I I1
I J I I I
~ i I LJ J I~
I
I
I
la -I
10
I
I I I 1
t I I i
I
I
I I
I
I I I
I ~ 1 v I)
V V
qV
FOlUfANT atRT lt
8 6
I t lt
~
I
l --~ I--- ~I I
i
I I
I I I i ltiI I
I i ~
I t
V
V V l( FORMANT I V CHART V
V Caiote4 iramp 1umb_ ef cycipampf on4
6 CelItlmctcrs bull octclv SmiUitoctamprs -I a~i-tonl
PlaciDg a single point on this chart is an assertion that formants have been observed at two frequencies one formant at the frequency named along ~he right or eft ede the other fonnant at the frequency named along the top or bottom edge
I
57
I
I
I -I
I
j _-
~~ -
-
bull I -
[dUp]
t I ~
~
I middot1
f
IshyIj II
I i
-------=shyI ~~-- -
L ~~-=-r--~~-III--=---
58
i middot1 I
I
i j I Imiddot
I~1 middotU~ _ s
I ~~~~~_-_-~--~ --_ I
L~ __________~_____________~ [CUll]
I
I
[dUr]
I
I J
I
I I
II
1
-yen ~ L___________ ~__ ~=~
I [kUs][pUn]
59
I
I
i L ~ -----------~-
____---shy______---2
~~~ -~ _
j ~---
I~~~-~-~ ~~ ~~
[nUn] [lUp]
I 1
~-=-~ ~~ -
[rlhn]
I
60
l
- _ ~~-----
~~~~~ JlCIIPrl fue rm ad I II
L ~ [gUI)] [kUk]
e_
__ ~ e-
~-d~~~~
[lUs] [jUs]
61
shy
I
Iii lEI and A Compa~ed
In comparing the distributions of the vowels III lEI
and IA( cf Chart VII on p 62 it is evident from the plots
that the front-back tongue position is for all practical
purposes identical ie the core distribution for all
three phonemes ranges between 1600-2000 hz This demonshy
strates conclusively that the significant phonetic differshy
ence is tongue h~igth ie t~e position of formant 1
The fact of phonemi~overlap is illustrated by the
crosshatching on Chart VII The cross-hatched area represhy
sents a r~nge of phonetic quality that is identified in one
instance as an III and in another instance as an IE or in
one instance as an lEI and in another instance as an IA
bullbullbull the sounds which follow one another in a changing sequence constitute the signals of speech and these sounds are produced by movements of the vocal apparashytus i e by movements of the lips tongue throat lungs and so on It is therefore important to understand that these vocal movements caused by the various muscles involved tend to slur into one anothshyer Since each variation of movement gives a varishyation in sound the slurring of movements produces a slurring of sounds Furthermore since specific sound will have different slurs of moveme~t depend~ ing upon the movement which it precedes or folloItJs each sound type resul tant from the productive moveshyments will vary somewhat according to the sounds which it precedes or follows (Pike 1947)
In line with this the next logical step would be to
look for environmental influences which would enable a listshy
ener to determine which phoneme was represented when phones
were recorded in the overlap area
62
CHART VII
lIlt lEI and A Compared
~ 2[7
t5
lot
5
ft
fA
Ie
Zit I zp 16 I a la 8 6
t I
~
II V I I I I +
r l~ ~ ~ I
I I ~ ~ V I I 1shy fZ I I t s
) I I j I I I
i ~ I 1 1 I I _lgt
V ~R R-r--~ I V
ItV l(
I I---I-
V~ j shy ~
I I I I FORMANTI I
I I VV CHARTI II I V S CaliL-tcd I Uut
I I I l of fIelc F- 0114
I I I I I j i I 10 ecentImeters 1oct4v
I
I ~ V Smillimctus Iumrton_ j VII
2f1 2~ 16 ltv
FOlUlANT ClIABl
Placing single point on this chart is an assertion that io-rnants have been observed at wo frequencies one formant at the frequency named ~ong the right or left edge the other formant at the frequency named along the top or bottom edge
63
A fairly thorough study of the positions of various
vowel sounds in specific environments did not indicate any
consistent variations of a particular type For example
the vowel in dim is in the lower range for the vowelIII
but the EI in dem is in the upper range -of the vowel lEI
Thus it seems probable that those sounds in the overlap area
are qualities for which minimal contrasts do not exist For
example the II in sih is in the overlap area but appar-middot
ently is clearly recognizable by a native sp~aker because
there is no seh at least no such word was known to the
informaht nor could one be found in the dictionary (Echols
and Shadily 1968)
IU and 0 Compared
In contrast with the front vowels III IE and IAI
the back vowels Iu and 0 have aconsiderable gap plusmn50
hz between the1r two distributions cf Chart VIII on
p 64 The distributions appear directly above one another
on the chart In comparing the two ranges it is appa~ent
that the front-ba~k position formant 1 is identical ie
the core distribution for the phoneme ranges from 700-1000
hz This demonstrates that ~he position of formant 1 ie
tongue height is the significant phonetic difference
64
CHART VI I I
U and 0 Compared
I I
i
5
~
5
6
til
~
2[1
I
Zit zp 15 IZ la a 6
~ I -~
1 ~ ~ ~
~
I V 1
V
I V ~
JIll ~
I I 1 6
1 middotV V l(
vI( FORMANT CHART
9 CalLOt-ctc4 ift 1awuutb of cyc14 p ICCOftI
I~ I V 6 eentllMtcrs 1 octo
I V 5mmi~ - ampImitenI VII
214 I 210 16 IV FOlUfANT CE1ART
PJaciDc a single point on this chart is an assertion that formants have been observed at two frequencies one form3nt at the frequency named along the right or left edge the other formant at the frequency named along the top or bottom edge
middotr I
65
II lEI IAI lUI and 101 Compared
In comparing all three phonemes in their respective
poJition on the vowel chart cf Chart IX an p 66 there I
se~ms to be no problem identifying between front and back
vowels There is a gap of approximately 400 hz between
th$ two back vowels and the three front vowels in terms of I
fotment 2 Also it would appear that there would be no
pr~blem in identifying specific vowel qualities so far as
fOfmant position is concerned for vowels in stressed position
with the exception of the phonemic overlapping discussed in
a preceding section ie III-lEI and IE-A
I
I
Imiddot I
CHART IX
I 1 E IA U and 0 Compared I
iM zr Ztt ap J 6 I Z 10 S 6
I I f ts I
~
tj1- ~
rL ~ ~
J 4- 1 ~ ~ i~ ~ V
Ii ~W~ V I ~~ ~ J
V I ~ ~
IS I ~ V 5 1 t
~
s ~ I I f
V R ~ r-~ I V
if~ V ~ ~
-- V 7
~ -~ [a ti I l( FORMANT
V CHART
V 0 cyclu on4 S CaULntte4 ilt hWldr_
I
Kl I jmiddotV I j V 10 6 centlrMtcll1 oct4v
V 5llIil(lCtampn ~ hl4Imiton
Vii 2~ zkgt 116 I IIyen
I
Forw~ CllABT I
Placing a single point on this chart is an assertion that formants have been observed I at two frequencies one formant at the frequency named along the rignt or left edgeI
the other formant at the frequency named along the top or bottom edge
~ ~ bull -
66
I
I I j
Cbull
I I
i
CHAPTER V I SUMMARY AND CONCLUSIONI
I As is shown on Chart IX on p 66 there appears to I I
bela very discernable distribution for each of the vowel I
Phtnemes of Bahasa Indonesia This does not mean that the
ci cumscriptions of each of the various sounds indicate I
detinite border lines for each vowel Rather it shows i
th~ position o~ each vowel in relation to the other vowel
phbnemes The vowel charts show the position of the phonemes
i asl produceq by one native speaker of the language Thus
nJ conclusions can and should ~e made regarding the definite
oJter boundaries of the ranges of middotp~onemes As is implied I
b~ the term ranges the phonemes have no defined boundarshy
I i~s
i Bahasa Indonesia does not appear to have two front I
v~wels two back vowels and one central vowel as is implied
i+I
the traditional symbolization Rather it has three i
ftont vowels with a three-way contrast between high mid I
i a~d low and a two-way contrast of high vs mid in the back
a1ea of~he articulation chart If a traditional symbolshy
i~ation of the vowel phonemes of the language were now to
b~ dawn it would look like the following chart I I I
68
front central back
high
mid
low
I
U
E 0
A
Thus as has been demonstrated the impressionistic
sion of the vowel system was in error with regards to
central phoneme of the language investigated There
a ears to be no low-central phoneme in the language
r it is a low-front one Although the spectrograph
c nnot establish a phonemic system of a language on its
o n it can provide a yes or no answer about the phoneshy
t c qualities of the phonemes in question After a phoneshy
m c system has been established the spectrograph can proshy
v de phonetic data which distinguishes one phoneme from
a other
BIBLIOGRAPHY
Sources Cited
Almiddotsjahbana Takdir The Indonesian Language - By-product of Nationalism Pacific Affairs XXII (1949)388-92
Am rican University Area Handbook for Indonesia Washingshyton DC ~S Government Printing Office 1970
Blch B and G Trager Outline of Linguistic Analysis Baltimore Waverly Press 1942
Du n H K Calculation of vowel resonances Journal of the Acoustic Society of America XXII (1950) 740-53
ols John M and Hassan Shadily An Indonesian-Enqlish Dictionary Ithaca Cornell University Press 1963
ner C Reserches sur la structure des voyelles orashyles Archives Neerlander Phonetic Experiments XX (1947) 40-77
obson Roman C Gunnar Fant and Morris Halle Prelimshyinaries of Speech Analysis Cambridge MIT Press shy1961
J s Martin Acoustic Phonetics Baltimore Linguistic Society of America 1948
L defoged Peter Three Areas of Experimental Phonetics London Oxford University Press 1967
P Mario Glossary of Linguistic Terminology New York Columbia University Press 1966
Perce Joe E The Spectrographic Study ~f Vocalic Nuclei Language Learning XII (1963) 241-247
- --- Phonemic Theory and the Analysis of English Syllashybic Nuclei Linguistics XVII (1965) 36-57
P ke Kenneth L Phonemics Ann Arbor University of Michigan Press 1947
70
Pi e t Kenneth L Phonetics Ann Arbor University of Michigan Press t 1943
Pu gram Ernst Introduction to the Spectrography of Speech New York Dover Publications 1966
ir Edward Language An Introduction to the Study of Speech New York Harcourt Brace amp Co 1921
enbeck E M Indonesia and Malaysia 1I Current Trends in Linguistics IIX (1967) 55-111
dman Dorothy The Republic of Indonesia New York N Y Philosophical LibrarYt Inc 1955
Sources Consulted
r e j e v N D bull Some ProbIem s 0 f Baha s a In don e s i a Ph a nshyology Studia Linguistica XI (~1957) 44-46
lingmiddotC L Linguistic Units The Hague~ Mouton amp Co 1960
J obson t R Hague
and M Halle Mouton amp Co
Fundamentals 1956
of Language The
K nedy Raymond Bibliography of Indonesian Peoples and Cultures New Haven Yale University Press 1962
Perce Joe E Spectrographic Study of English Vowels Under Primary Stress Linguistics LXXXIV (1-972) 41-84
P ttert Ralph K George A Kopp and Harriet C Green Visible Speech New York Dover Publications t 1966
T euw A Critical Survey of Studies on Malay and Bahasa Indonesia The Hague Martinus Nyhoff 1961
-basin
-head of an area
-form of address
-ball bag
-bell
ba --bank I
bUr --you I
bi --beer
bomiddot--drill I
ba--bliJss
bi --bus i
I t
bo I
--bunch bun~le i I
ba--crossbeam
--bomb
--tire
--son of
--ration coupon bond
--garbage dump
--checkered design
--inch
--and plus
APPENDIX A
LIST OF WORDS
den~-abbrev of the title raden
dar--olace location
dur--pearl
das--a shot
dos--small box
dek--deck
dik--younger sibling
dep--to b~ shelved
dop--hubcap
dup-~to be baptized
djak--jug
djok--seat
djas--coat
djus--part of the Koran
gang--paBsageway hall
gung--gong
kak--form of address for elder
kik--handloom
kuk--collar harness
kar--map
kir--jo test
kas ~money supply i
kus -to hiss spit I
lahi-alreadY
loh-writing tablet
lapi -towel I
lup -magnifving glass or
last -IrJeld i oint
lesl -lessonI
lOs -shed I
I I
-to iron
-which who
nu -yonder
po
pa --pole
pa --to fit
pe --plague I
po --mail I
pel --cap
pOI --pot
--pound
--also
r --shelf
--shirt
g-o-rank position
g--ring
--brake
rum--cream
sah--valid legal
sih--an enclitic usedmiddotto soften what follows
san--form of address far sargeant
sen--cent
sang--superior
seng--zinc
sap--line row
sep--chief boss
sop--soup
sjak--suspicion doubt
sjok--attractive
tang--tongs pincer~
ting--sweet meat
tong--barrel vatmiddot
teh--tea
toh--yet nevertheless
tjeng--molasses
tjung--young boy
III 1
APPENDIX E
LINGUISTIC SYMBOLIZATION USED
IAI~high-front-openIi
II
~ r
E~-mid-front-~pen
III
AA-low-front-op~n t1
o1-mid-back-open
Uf-high~baCk-close III
I III
~~~vd bilabial stop
[dj~vd alveolar stop l
I I
[kt-Vl velar stop I
[g I-vd bull velar stop
[1 -lateral I
(n-vd alveolar nasal 1
(m~-vd bilabial nasal
~I-Vd velar nasal
I
III ~IJ
I
q
dl
I
Iil~
I
Vowels
Consonants
[p]-vl bilabial stop shy
[t]-vl alveolar stop
[rJ-vd alveolar flap
[jJ-vd palatal affricate
[CJ-vl palatal affricate
[S]~vl bull alveolar affricatmiddote
[s]-vl alveolar middotfricative
h]- vI velar aspirant
13
it was the first instrument to make large scale acoustic
a n a ly s e sapr act i c a I po s sibiIi t Y n ( Lad e fog ed 1 967 ) bull
Spectrograph
The acoustic spectrograph is a device ~hich records a
stream of speech 2~4 seconds or less in length This
recording is then fed into the analyzing part of the specshy
trograph where at each successive playing ne frequency
or rather one frequency band is lifted outof the total by
the variable filter (Pulgram 1965) A black ma~king is
made on a piece ofmiddot electro-sensitive paper each time there
is a harmonic present within the frequency band being anashy
lyzed Since the articulators are constantly moving and
changing the filtration characteristics of thevocal tract
the black markings ma~e by a stylus reflect the movements
of the articula~ors in a very broad sense More important
however it makes a precise record of the stimulus ie
the harmonics which reach the ear of the listener Dunn
(1950) says the vowels have asso~iated with them different
frequency regions in which the sound is more intense than
elsewhere in the spectrum The name formant has been apshy
plied to these regions
The next problem then is to relate the concentrations
of power mentioned above ie the formants to human pershy
ception of speech sounds The most widely utilized techshy
nique in this area is one devised by Martin Joos (1948)
~______________________________________~S___________________________________________________shy1
14
generally referred to as his 2 Formant Theory This techshy
nique represents the plotting of formant 1 and formant 2
in a specific wayan a particular chart cf Chart 1 on
p~ 23 This technique is clearly described by Ladefoged
(1967)
The relations between the formant structures of the vowels in a number of words can be conveniently represented by means of formant charts which show the frequency of the firs~ formant at a time in the word when the formant structure is changing at a minimum rate plotted against the frequency of the second formant at the same time
When making these kinds of plots a charting is derived of
vowels for any language which is remarkably like the tradishy
tional impressionistic vowel charts of the 19th century
Esner (1947) illustrated that if the frequency of the first
formant was plotted against the frequency of the second
formant it seemed to equal the relation between formant
frequency and the traditional vowel diagram
Basically this study will reproduce such vowel charts
for a number of examples of each sound in Bahasa Indonesia
Formant 1 will be platted against formant 2 for each vowel
phoneme in a variety of phonemic environments -The purpose
of this will be to determine the range of variation for
every vowel in each e~vironment as produced by a single native
speaker
CHAPTER III
METHODOLOGY
Phoneme Identification
In order to assess the phonetic quality of vowel phoshy
nemes one must first ascertain the number and relationshy
ship of sound contrasts in a language ie the phonemes
The visual representation of the actualization of the phoshy
neme ie the spectrogram can only be made on the basis
of a preceding decision of the linguist on the types and
number of phonemes in the l~nguage to be anaiyzed (Pulgram
1965)~ Phonemic analysis cannot be made with phonetic
data alone it must be made with phonetic data plus a sershy
ies of phonemic premises and procedures (Pike 1947) A
spectrogram conveys phonetic information which aids the
linguist in determining which phonetic features are consisshy
tently present in order to reach the most accurate phonetic
description
There are a variety of premises and procedures which
the investigator may utilize in order to discover the phoshy
nemic structure of a language Pike (1947) argues that the
investigator must have at hand observable native reaction
to native sounds andor know structural facts pertaining to
the phonetic nature of the sounds and their distribution
As stated before a phoneme is a bundle of sound f~atures
1
j
16
which when substituted for another bundle creates a difshy
ference in meaning Since the creation of a different morshy
pheme is the result of the substitution of a different sound
feature these sound features are said to be phonemes
A pair of words in which the first word is the same as the second except for the fact that one segment is replaced by a different but phonetic~lly similar segment in the second word constitutes proof that the two similar segments are phonemically distinct~ bullbullbull Word pairs of this type are said to be MINIMALshyLY DIFFERENJ because no smaller difference in the language can make a differ~nce in meahing in words (Pike 1947)
Hence minimal pairs of words were used to find phonemes
Minimal~y different word pairs prove to be the beginners
single most important tool for the analysis of phonemic difshy
ferences (Pike 1947)
Thus Echols and Shadilys An Indonesian-English Dicshy
tionarv (1968) was ut~lized to find three-phoneme words
containing two consonant sounds with a vowel in medial poshy
sition The process was simply to go through all the words
beginning with consonants and find minimally different t~ree
phoneme words This was done on a purely anthr~poscopic
basis on the part of the investigator If a different letshy
ter was employed to distinguish a different meaning it was
assumed to be a different phoneme The following ~ord pairs
and their meanings are examples of the words found in the
dictionary
ban--tire bin--son of
das-- a shot dos--small box carton
I
1 7
pal--pole pel--field
rang--rank position ring--ring
teh--tea toh--yet nevertheless
After having obtained the words from the dictionary
a native informant was called upon to verify ~he differshy
ance in meaning in the minimal pairs and to pronounce
them so that ~hey could be phonetically transcribed in
al1 impressionistic manner The informant employed was Kok
Djen Su a student at Portland State University from Yogshy
jakartai Indonesia He has been a student in the United
States for approximately two years and speaks broken al shy
though very understandable English Mr Su was horn to Mr
and Mrs Su Hendry Su who both speak Bahasa Indonesia Jashy
vanese and a small amount of Chinese Since his birth the
informant was exposed to a mixture of Javanese and Bahasa
Indonesia but has employed the national language of Indoshy
nesia since the age of three at school His bilingual upshy
bringing it seems to the author does not craate a subshy
stantial difference in the competence of Mr Su in Bahasa
Indonesia In fact he was able to distinguish the proshy
nunciation Qf words in both Javanese and in Bahasa Indoshy
nesia The utilization of one informant deletes any reshy
gional variation or individual variation between informshy
ants Since here we are attempting to ascertain the relashy
tive range of phonetic quality of vowel phonemes in Bahashy
sa Indonesia the informants bilingualism ahould cause
none or very few phonetic distortions
After-having verified the difference in meaning of
the word pairs Kok Djen ~u pronounced the word The
following impressionistic version of the Ihdonesian voshy
wel system was described
front central back
high
mid 1 I
I I low j
i I I
I
u-
E 0
A
1 Spectrograms
The phonemic entities symbolized in the preceding
section represent range-units of phonetic quality The
symbols and their position on the chart are based on the
aural perceptions of the investigator The purpose of the
spectrographic analysis of this data is to determine as
accurately as possible the actual phonetic range represenshy
ted by each of thephonemic symbols
I
i
1 9
In order to make spectrograms from which meani~gful
conclusions can be drawn one must have a native informant
of the language to be studied Spectrograms were made of
the speech of Mr Su the informant described earlier
In order to conserve the time of the informant a
sample of three-phoneme words were recorded The three-
phoneme words begin and end with consonants ahd contain a
vowel in medial position The list appears in Appendix A
The list of words was specifically selec~ed to eliminate
in so far as possible all variatiqn other than that which
is specifically caused by the preceding and following consoshy
nants This is true because by utilizing a single informant
the influence of dialects both regional and social are eshy
liminated and by utilizing one sy~lable words under primary
1stress sequential influences such as the Markov Process
are eliminated since there is no sequence beyond one phoshy
neme preceding and following the vowel This being the case
one should be able to derive from a series of spectrograms
of those vowels both the range of free variation and the
specific influence of each particular consonant on the voshy
weI quality of each medial phoneme
The n~xt st~p in the procedure was to play the tape-
recordings into the spectrograph two or three wo~ds at a
1The Markoy Process is a mechanical way of handling enshytropy in sequential operations IQ linguistics this is stashyted in terms ofthe probability of the occurrence of a parshyticular phoneme morpheme etc in a precise sequence
20
time The machine can handle 24 seconds of speech on one
spectrogram thus two or three words could be analyzed at
the same time as one with no loss in quality or precision
Unfortunately the recordings had to be played into a
microphone which picks up some background noise but by
placing the microp~one of the spectrograph very close to
the loudspeaker of the tape recorder and turning the volume
up slightly this background was eliminated for all pracshy
tical purposes middotIt would have been better to have had a
direct connection between the recordar and the spectrograph
but unfortunately no such devce was available Background
noise shows up as very small specks scattered more or less
at random and unless the volume of such noise is exceedshy
ingly strong does not interfere with the reading of the
spectrograms
Once the machine had completed the analys~s and produced
the graphic record of the list of words a frequency measur~
ing device was produced by the machine cf example below
1 11amp II~ill c=
- n- HE to
11r -shy
bull b mmiddot 1 bull bull L
-
gIl F Jamp u
n _ If
bull III
21
This measuring device is in reality a spectrogram with horishy
zontal markings The first line on the chart represents a
frequency of 0 hertz (hz) Each line above the first repshy
resents a multiple of 500 hz The device is used to locate
th~ center of formants 1 and 2 Since it is graduated in
500 hz it is necessary to interpolate when the center ofmiddot
power for a particular formant falls between two of these
lines This is done by dividing the area between the two
lines in half then dividing one of the halves in half which
gives a range of 125 hz within which the measurement falls
and an estimate is made of the precise measurement within
the 125 hz range This should give formant positions with
an accuraci of greater than plusmn25 hz
When visual location of the formant centers becprnes
difficult a section of the formant can be made cf exshy
ample below Such difficulties with visual location usually
arise when two weak formants overlap Such overlapping
produc~s what appears to the naked eye to be a band of modeshy
rately dark grey bands The sectioner is a built in mech-
IshyfL__---
tete we tt
~
I
1 I
22
anism capable of handling such problems In the preceding
I example the amplitude of each harmonic is proportional
to the length of the line representing that harmonic I
This makes it possible to locate formant centers when vi-
I sual location is difficult
The measurements were then transferred to formant
charts cf Chart 1 on the following page
6
23
CHART I
~
t
1+
t5
1amp
Ie
z~ 2t 2p 16 12 la 8 Iii
I ~
~
I S
l I
I I
~
V V
V T
l( FORMANT V CHART
Vi ~ CcdiOrate4 ift luutdnM I V ~ cycle ~ concf
V 10 eeentl~rsI~ V
V U 5millimctcrs - I $milton
2 zk2 lis ty
I
FOlWAlfT CHART
Placing a single point on this cha-t is an assertion that formants have been observed at two frequencies one fOrrUlt at the frequency named along the right or left edge the other formant atmiddotthe frequency named along the top or bottom edge
ex Martin Joos~ Acoustic Phonetics (1948)
CHAPTER IV
FINDINGS
The data provided by the preceding methodology conshy
sisted of a series of scatter patterns on the vowel charts
Each of the dots within the pattern represented one occurshy
rence of a particular vowel To determine the range ofmiddot each
phoneme f the most divergent points in each pattern were con-
nected by a line These lines then circumscribe an area
which included the range of all the vowels in the sample
recognized ~y the informantmiddotas a particular phoneme
Verbal descriptions the actual charts of the phonemes
and the spectrograms utilized willbe found on the followshy
ing pages
25
The distribution for the sounds which the informant
produced and recognized as the phoneme 1 range~ on the
vowel chart in a broad scattering from 300-500 hz for forshy
mant 1 and 1500-2100 hz for formant 2
CHART II
1
lid
13
bull
~
It
iA
Ml
ztr Zit zp 1 S lIZ middot1 I a r 8 6
I
f
I I
Ii 3
[7l I I V 1 I
) ~I I i I bull
V I I i bull r J
I V t I I I I I
i tt I
Kl7 I I I iI ~
I I I I I I I I I i I
I I I i I f I ltII
I I l7 I VI
I [7 1
1 I I I Va FORMANTc7 CHART
I
I I I I 173 CaEiIw-atd icw~[7 rf ltfer C0ItdI I I
j I I I i 7 10 e centlCMta1 oct4v
I V 5miU~ bull itonI
r I f 711 t14 j I I I Ik IV
FoiUlAhT CHRT
Placing asinge point on this chart is an assertion that fortcants have been observed at two frequencies one formant at tn(l frequerlcy nameu Slong the right or eft cdampe the other formant at the frequency named along the top or bottom edge
26
l 1I I - -~
I I iI I
I
[bIs] [bIn]
lt-- -_- -1I
lt i
1 ~ i1_ -shy Ir ~ tmiddotmiddot lt
-- - - ---~--- - - - ----- --
-i -_~ ~ shyI 1
i I I
I I bullbullq_-
I ~~~-~--shyr ~~~~~ -~- I------------------------shy
-----I
[dIm] [sIh]
27
I -[blr]
i1 1 I I
i Ii I
I i I I
ii ___ -J
rmiddot I i
I 1 j
-~ ~~~ ~-~IIlIr~~~
I
1 ____~~l_~~--=~ _ ~--~~~~~~~~~- -
51 hI$ PiiB PD~ii~i
-~ - -- -- ----- ~------- - --- _-- - _ - shy [rIll) [klr]
28
1 I I I
---~S~ -~~~fi~ ~~~~~-~
~l_ middot~ ___
[klk]
I I I
r [dlk]
29
-------- --
-~- shy~--I~~
[tIll]
30
The distribution for the sounds which the informant
produced and recognized as the phoneme lEI ranged on the
vowel chart in a thin oval shaped distribution from 400-625
hz for formant 1 and from 1400-2000 hz for formant 2
CHART III
lEI
i
I
1 I
1
1middot
II~~ 5 I~ I lOa I ~--~~~I-+--+-4-+--+---+--++-+-+-+-+--r--t-t--r--t--r--1
I
I I I I
t I
4
I I 1 I ~ I I I I
I t I ~
I I ~
-r--- r--- I V~~~-r~+-+-~~~+-+-~~~~~~~--T-~-r~-r~-r~-T---T--r~
V~~~++4-~~~-4-+-+~~~~~+-~-T-rV~7
~iA~~~~~I+-~~~~~I--~~~-r~~~~~8 FORMANT HHHH~~r+~~-r~+-~+-~I~-I~~rl7V CHART
I II 11I I V9 CaZiLrww 1ft huncirccLJ
-+-f-+-II-f-+-+-+-+--+-+--+--+----+-+--+-1--t-+-1---t---t--7 rtf eye 04 ~ I 11 V pq-+-+-I~-+--i--+I-t-t--+~i-I---t--+--tr -t--t-Tj-ri~middotltJ ecentimeters 1octGy
I V 5miU~ - aemiton ~~~~I~~+-~~l~-~-T~I~~~r~
t i lt~ I I IS I I liV
FolUlAn C1LBT
Placing a single point on this chart is an assertion T hat rormants have been observed at two frequencies one formant at the frequency namfu along the right or left edge the other formant at the frequency named along the top or bottom edge
31
I I
I ~_ f __
~~~ - - ---~ _-shy
I -- shyI - _v-- _ l
i _~~E~~~~middotmiddotmiddot ~---~--~~-it--_ ~_~ 1gt_ bullbull bull -_gt-~~~ ~ bullI
P~J r_i~=~~~ ~-~~~- - -1 I -----~ -~-~ _ ---_
~~Wa~~Ji~~L ____ __ _____ _
[PEs]
I __ shy
-- --shy
~~ ~ -Qt-shy
-~=-=----
~~~7=~~ L___ __ __ ____ _ ______~
[rFm]
32
[PEt]
bull - -IIot-__
- ---~~--
[dEk]
---
33
f ~
I
) I I
I
I I
I 1 I
I I
I
1
__ -~_~i~~-yen-=-- ~~-~= --
------------------------
[dEn] [sEn]
i
~ ----shybull __ ~
[cEr)]
34
1J i i
~
--~~ ~-
~~
-~- ~ -~ ~~ ~gt-- ~- ~~
I ~IJItt- F ~ 111 i~-~_~--- ~--- - _ =-- 4e -~~~-~_-_~-- _~
bull vf middotmiddot~~tmiddotmiddotl____________________~____ j
[sEp] [bEk]
[bEl]
~ shy~~--_o-
J -~~~
~~t~-~~J~ r~~7~ _
I middot---=i---=-~_4~ __ ~~~~~___I _ _~
~g_i$fj bull - ~-~~~z~ir~~ ~~~ leal -~I_ iiIB
L_________ __~________ _____~
[lEs]
I f
I
35
- --- ---- - ---- ----------
~-------- shy
bull
j
i
[tEll][dan]
[dEp]
36
The distribution for the sounds which the informant
produced and recognized as the phoneme A range~ on the
vowel chart from 600-750 hz for formant 1 and from 1600-2300
hz for formant 2
CHART IV
A
i6
i I I
I I
I I
I I
1 0
I
I I I
I I
I I
s
It
i j I Ii i I
I I
6
~ I 1 I I I I ~
I I I V~ FORMANT ~~~~~I~1~4-+-~~~--~1-+~~I~-~-r17 CHART
~~~~~~l~~~~I~i~~~~I~+I~~lr_I~I~~~$ ~U~~~h~~ ~ I I I I I ~ 7 J eye ptI -cony
1f4-i--~--+---I----t--I-4--~1--+---+--+---+---1-~i7-to e cVltJte1 oct4v
i I I I 1 5miU~ - bull iton ~~~~~~~~~middot~~~~4-~I~I--~+~middoti i
2~ I I
F01UlANT CiLlT
Placing a single point on this chart is an assertion tnlt rorreints have bE-en obsered at two frequencies one formant at the frlquerJcy nSleU aiong he right 01 eft edge the other formant nt the frequency named along the top or bottom edge
37
I I i
-shy
I
I
I
~1iI
p~~~~==~~~~i~~~~
I I
[lAs]
_7 -~
-- -shy
L _ _ _ ____________ --- -- ----_~____J
[nAn]
--------
38
I I
------------------~----I I 11 I I
II1
flt~
I
IJ
L
i
______________________
[sAk]
f
~~ ~--r
1 shy
~~-
-- shy[sAn]
I r 1I I I
t
t
I l I
I I I
I i
I
[sAt)] [sAp]
39
~]
I
I I
[rArl][bAk]
I
-shy ---==-_____lshy___
[lAp ]
40
~----------------------------~-------------~
1 bull -l----1-shy
~middot-~-~t-=-- -
~r-shy -shy t~ III M -~ ~~---shy~t-= ~r=_ _shy
C z---=-
L______________________----- [dAs]
[dAr]
l _
41
v 1
I I
i
I
I -tc - bull ~ 1t iCSi4 _ -
-~~-r~middot- 1 ____ ~~~~ ~ ~ I
1 I ~=~j3~middot7-__ ~~
[kArl
---------------------~------
[dAin]l
I I
-I
I
42
I gt1 tmiddot
I
[bAm]
bull
~ I 1 I
gt1
-- - ___ _ N ____ ~--shy---- shy
[bAn]
43
[lAh]
==III
I Imiddot
__~_--_middotfI_~__ ~ ennee ~ S
LL-
[JAk]
--------- ---------
44
---------
I i Ir I
I I j
i
I i
~ --_ -- ~
~~fb-~~~~~~ ----- shycshy7FiIf Elii=s FUP WRmiddot 75t3~ n JIilIeia
~------------
[JAs]
-II
I J
[dAnl
45
~ I 1shy
I
iI shyi t
- - - Imiddot--- ~p -~--~= roc - I
I II i
I I I
~ middot1 I
------J
j I
I I i
i I
1_____ --- I ---------------~
[kAs]
I
I I
I t
I I i
j poundiampl d
rshyl
I i
I
1
I I I
I Il
[bAl]
I~
[bAl)]
I
47
L---------------------- --------------~
[kAp] shy
t
I-- I ~ I i
I
ji I
I -I
I 1 I 1
i
)
~~
~L~--~~---~ - ~ ~
~ -shyY- r i
I
-
1
I I
)
----~ -shy- -- _ ~ ----shy
1 I i i I I
1 I
L ~~~~-~~-~-~~~-~~-gt-= rn~ J ___fi ~ 7 7TZ r~ 5UZs=j -~ l ____-------- _____ __ _ ___________ ________ I
[kAk]
i
I t r ~
--~~ -shy
~~~c~_=--_u ce4 we
I r bull
[gAr)]
~-~ shy
- -~ -~~
~P ~-~~
I ~~
-- bull ~ I - ~~-~~
~-~~~--~ shymiddotT _i
48
-----------------------------l
I I
I I
[rAk]
~_
~ ~--- ~~~-~
j ~~ ~ ~ ~7
~ bull~~middote ri~-is~~~l-IIII-middotlIIIIn---I~-- 41~~~~~ ~
1--=-_---- - - -===--------shy
[sAil]
I
49
_- I I
I -- ----------------shy
~2~~~ ~~
i i I I ~~~~~~~~b ~-
middot_- _ ~~------
j
i ~ at -== l - -- ~-~~it I ax I C1 bullbull~~- shy
I
I i
I I
I 1 I II r I I
-r- --shy
~~-~-~- -~-
-1 l I
I I
[bAs] [PAs]
r-------------------~------------___
[pAl]
I
50
The distribution for the sounds which the informant
produced and recognized as the phoneme 0 ranged on the
vowel ~ha~t from 400-525 hz for formant 1 and from 700~1000
hz for formant 2
CHART V
0
III
t5
lot
S
6
Ie
to
Z7 Zit 9 I 1 I a I z I a 6 6
I
I ~ I
I i II I
j i bull I I
I I I i I
I ~ t
~ ~I I
f I
I ~ f A I I I
j [- V I 1 I I I II ~ I 1 I I
At I
I t I I
V V
V 7
i I Vi( FORMANT I 1 I 1 CHARTI I
I V 3 C41iotc4 ill lUjn~ 01 eycpr ~0It4
i I f I IV
I ) I V IO 6 centltcrs 1 octcv1 I I I 5miU~ -Istmi-toneI
I I VII 2 I ltQshy t 116 IV
FOlUlUfT CRBT
Placing a single point Oll this chart is ampn assertion that formants have been observed at two frequencies (me iormant at the frequency nametl ~ong the right or left edge the other tonnant at the frequency named along the top or bottom edge
Ishy
51
r--- -_-__ - --------shy
-- ~--- --shy~ -
--f -~-
[tOll][pOn]
~ ---- -11lt1 ~
~-- - -~ P---~Amiddot_
t _ __ _
1 r I
--1 i I
I
I ~~~J L____ _ 1 rshy
[dOs] [b0s]
i Imiddot
52
---------------------~---
i I r -------- --------shy
r~~middot-~ [
I V I ~~
I - shy
~~~middottdmiddot~~-~-middot~-
S~~i~~-~ ~- bmiddotmiddotmiddotL _____middot_ ~_
[bOr] [rOk]
I
1 I
i i
j
I
[dOpJ[pOl]
53
Ii --~ --~--- -~~~~--=- I r
~ ~- ~ - ~ - shyI - -~ ~~ -~~ I
-1bullbull - h ~~~
~~~ ~ ~~~~----- ~~-~~~-~- ~--~~~~L- ~bullbull
I middot~-~middotdf r scr ~~~~~
~-laquo~~-==~~~-~~--~~~~ ~~
I
[lOs]
I
I
r I
i 1
i 1
I I J_____~ __ _-_M___J
[bOn]
54
i -~----
I I I r r
~-~ -shy
[bOn][sOp]
jI ----II I J
i
I I I
I I I i
I~~~==it shy
[jOk][tQr)]
55
1 I
I
II I I I
I c ~~~~~~~~ ~~OOWJI~~=U
[lOh]
i I
I
I ~~~-
I ~- -- shyl - _- ~ shy
I ~n=~~-~middot ~FlR T =Iti 1amp11 dill_
__-J
[pOt]
__J pOs]
1
- =xu
[bOk]
I
56
The distribution for the sounds which the informant
produced and recognized as the phoneme lUI range~ on the
vowel
hz for foimant
chart in an
1
almost square-like pattern from
and from 700-1000 hz for formant
250-350
2
CHART VI
lui fIG
3
t
ts
~
la
Il
IT zt 20 IS
I I
I I
i j
I
I j
I I
I
I I I
I t I I I1
I J I I I
~ i I LJ J I~
I
I
I
la -I
10
I
I I I 1
t I I i
I
I
I I
I
I I I
I ~ 1 v I)
V V
qV
FOlUfANT atRT lt
8 6
I t lt
~
I
l --~ I--- ~I I
i
I I
I I I i ltiI I
I i ~
I t
V
V V l( FORMANT I V CHART V
V Caiote4 iramp 1umb_ ef cycipampf on4
6 CelItlmctcrs bull octclv SmiUitoctamprs -I a~i-tonl
PlaciDg a single point on this chart is an assertion that formants have been observed at two frequencies one formant at the frequency named along ~he right or eft ede the other fonnant at the frequency named along the top or bottom edge
I
57
I
I
I -I
I
j _-
~~ -
-
bull I -
[dUp]
t I ~
~
I middot1
f
IshyIj II
I i
-------=shyI ~~-- -
L ~~-=-r--~~-III--=---
58
i middot1 I
I
i j I Imiddot
I~1 middotU~ _ s
I ~~~~~_-_-~--~ --_ I
L~ __________~_____________~ [CUll]
I
I
[dUr]
I
I J
I
I I
II
1
-yen ~ L___________ ~__ ~=~
I [kUs][pUn]
59
I
I
i L ~ -----------~-
____---shy______---2
~~~ -~ _
j ~---
I~~~-~-~ ~~ ~~
[nUn] [lUp]
I 1
~-=-~ ~~ -
[rlhn]
I
60
l
- _ ~~-----
~~~~~ JlCIIPrl fue rm ad I II
L ~ [gUI)] [kUk]
e_
__ ~ e-
~-d~~~~
[lUs] [jUs]
61
shy
I
Iii lEI and A Compa~ed
In comparing the distributions of the vowels III lEI
and IA( cf Chart VII on p 62 it is evident from the plots
that the front-back tongue position is for all practical
purposes identical ie the core distribution for all
three phonemes ranges between 1600-2000 hz This demonshy
strates conclusively that the significant phonetic differshy
ence is tongue h~igth ie t~e position of formant 1
The fact of phonemi~overlap is illustrated by the
crosshatching on Chart VII The cross-hatched area represhy
sents a r~nge of phonetic quality that is identified in one
instance as an III and in another instance as an IE or in
one instance as an lEI and in another instance as an IA
bullbullbull the sounds which follow one another in a changing sequence constitute the signals of speech and these sounds are produced by movements of the vocal apparashytus i e by movements of the lips tongue throat lungs and so on It is therefore important to understand that these vocal movements caused by the various muscles involved tend to slur into one anothshyer Since each variation of movement gives a varishyation in sound the slurring of movements produces a slurring of sounds Furthermore since specific sound will have different slurs of moveme~t depend~ ing upon the movement which it precedes or folloItJs each sound type resul tant from the productive moveshyments will vary somewhat according to the sounds which it precedes or follows (Pike 1947)
In line with this the next logical step would be to
look for environmental influences which would enable a listshy
ener to determine which phoneme was represented when phones
were recorded in the overlap area
62
CHART VII
lIlt lEI and A Compared
~ 2[7
t5
lot
5
ft
fA
Ie
Zit I zp 16 I a la 8 6
t I
~
II V I I I I +
r l~ ~ ~ I
I I ~ ~ V I I 1shy fZ I I t s
) I I j I I I
i ~ I 1 1 I I _lgt
V ~R R-r--~ I V
ItV l(
I I---I-
V~ j shy ~
I I I I FORMANTI I
I I VV CHARTI II I V S CaliL-tcd I Uut
I I I l of fIelc F- 0114
I I I I I j i I 10 ecentImeters 1oct4v
I
I ~ V Smillimctus Iumrton_ j VII
2f1 2~ 16 ltv
FOlUlANT ClIABl
Placing single point on this chart is an assertion that io-rnants have been observed at wo frequencies one formant at the frequency named ~ong the right or left edge the other formant at the frequency named along the top or bottom edge
63
A fairly thorough study of the positions of various
vowel sounds in specific environments did not indicate any
consistent variations of a particular type For example
the vowel in dim is in the lower range for the vowelIII
but the EI in dem is in the upper range -of the vowel lEI
Thus it seems probable that those sounds in the overlap area
are qualities for which minimal contrasts do not exist For
example the II in sih is in the overlap area but appar-middot
ently is clearly recognizable by a native sp~aker because
there is no seh at least no such word was known to the
informaht nor could one be found in the dictionary (Echols
and Shadily 1968)
IU and 0 Compared
In contrast with the front vowels III IE and IAI
the back vowels Iu and 0 have aconsiderable gap plusmn50
hz between the1r two distributions cf Chart VIII on
p 64 The distributions appear directly above one another
on the chart In comparing the two ranges it is appa~ent
that the front-ba~k position formant 1 is identical ie
the core distribution for the phoneme ranges from 700-1000
hz This demonstrates that ~he position of formant 1 ie
tongue height is the significant phonetic difference
64
CHART VI I I
U and 0 Compared
I I
i
5
~
5
6
til
~
2[1
I
Zit zp 15 IZ la a 6
~ I -~
1 ~ ~ ~
~
I V 1
V
I V ~
JIll ~
I I 1 6
1 middotV V l(
vI( FORMANT CHART
9 CalLOt-ctc4 ift 1awuutb of cyc14 p ICCOftI
I~ I V 6 eentllMtcrs 1 octo
I V 5mmi~ - ampImitenI VII
214 I 210 16 IV FOlUfANT CE1ART
PJaciDc a single point on this chart is an assertion that formants have been observed at two frequencies one form3nt at the frequency named along the right or left edge the other formant at the frequency named along the top or bottom edge
middotr I
65
II lEI IAI lUI and 101 Compared
In comparing all three phonemes in their respective
poJition on the vowel chart cf Chart IX an p 66 there I
se~ms to be no problem identifying between front and back
vowels There is a gap of approximately 400 hz between
th$ two back vowels and the three front vowels in terms of I
fotment 2 Also it would appear that there would be no
pr~blem in identifying specific vowel qualities so far as
fOfmant position is concerned for vowels in stressed position
with the exception of the phonemic overlapping discussed in
a preceding section ie III-lEI and IE-A
I
I
Imiddot I
CHART IX
I 1 E IA U and 0 Compared I
iM zr Ztt ap J 6 I Z 10 S 6
I I f ts I
~
tj1- ~
rL ~ ~
J 4- 1 ~ ~ i~ ~ V
Ii ~W~ V I ~~ ~ J
V I ~ ~
IS I ~ V 5 1 t
~
s ~ I I f
V R ~ r-~ I V
if~ V ~ ~
-- V 7
~ -~ [a ti I l( FORMANT
V CHART
V 0 cyclu on4 S CaULntte4 ilt hWldr_
I
Kl I jmiddotV I j V 10 6 centlrMtcll1 oct4v
V 5llIil(lCtampn ~ hl4Imiton
Vii 2~ zkgt 116 I IIyen
I
Forw~ CllABT I
Placing a single point on this chart is an assertion that formants have been observed I at two frequencies one formant at the frequency named along the rignt or left edgeI
the other formant at the frequency named along the top or bottom edge
~ ~ bull -
66
I
I I j
Cbull
I I
i
CHAPTER V I SUMMARY AND CONCLUSIONI
I As is shown on Chart IX on p 66 there appears to I I
bela very discernable distribution for each of the vowel I
Phtnemes of Bahasa Indonesia This does not mean that the
ci cumscriptions of each of the various sounds indicate I
detinite border lines for each vowel Rather it shows i
th~ position o~ each vowel in relation to the other vowel
phbnemes The vowel charts show the position of the phonemes
i asl produceq by one native speaker of the language Thus
nJ conclusions can and should ~e made regarding the definite
oJter boundaries of the ranges of middotp~onemes As is implied I
b~ the term ranges the phonemes have no defined boundarshy
I i~s
i Bahasa Indonesia does not appear to have two front I
v~wels two back vowels and one central vowel as is implied
i+I
the traditional symbolization Rather it has three i
ftont vowels with a three-way contrast between high mid I
i a~d low and a two-way contrast of high vs mid in the back
a1ea of~he articulation chart If a traditional symbolshy
i~ation of the vowel phonemes of the language were now to
b~ dawn it would look like the following chart I I I
68
front central back
high
mid
low
I
U
E 0
A
Thus as has been demonstrated the impressionistic
sion of the vowel system was in error with regards to
central phoneme of the language investigated There
a ears to be no low-central phoneme in the language
r it is a low-front one Although the spectrograph
c nnot establish a phonemic system of a language on its
o n it can provide a yes or no answer about the phoneshy
t c qualities of the phonemes in question After a phoneshy
m c system has been established the spectrograph can proshy
v de phonetic data which distinguishes one phoneme from
a other
BIBLIOGRAPHY
Sources Cited
Almiddotsjahbana Takdir The Indonesian Language - By-product of Nationalism Pacific Affairs XXII (1949)388-92
Am rican University Area Handbook for Indonesia Washingshyton DC ~S Government Printing Office 1970
Blch B and G Trager Outline of Linguistic Analysis Baltimore Waverly Press 1942
Du n H K Calculation of vowel resonances Journal of the Acoustic Society of America XXII (1950) 740-53
ols John M and Hassan Shadily An Indonesian-Enqlish Dictionary Ithaca Cornell University Press 1963
ner C Reserches sur la structure des voyelles orashyles Archives Neerlander Phonetic Experiments XX (1947) 40-77
obson Roman C Gunnar Fant and Morris Halle Prelimshyinaries of Speech Analysis Cambridge MIT Press shy1961
J s Martin Acoustic Phonetics Baltimore Linguistic Society of America 1948
L defoged Peter Three Areas of Experimental Phonetics London Oxford University Press 1967
P Mario Glossary of Linguistic Terminology New York Columbia University Press 1966
Perce Joe E The Spectrographic Study ~f Vocalic Nuclei Language Learning XII (1963) 241-247
- --- Phonemic Theory and the Analysis of English Syllashybic Nuclei Linguistics XVII (1965) 36-57
P ke Kenneth L Phonemics Ann Arbor University of Michigan Press 1947
70
Pi e t Kenneth L Phonetics Ann Arbor University of Michigan Press t 1943
Pu gram Ernst Introduction to the Spectrography of Speech New York Dover Publications 1966
ir Edward Language An Introduction to the Study of Speech New York Harcourt Brace amp Co 1921
enbeck E M Indonesia and Malaysia 1I Current Trends in Linguistics IIX (1967) 55-111
dman Dorothy The Republic of Indonesia New York N Y Philosophical LibrarYt Inc 1955
Sources Consulted
r e j e v N D bull Some ProbIem s 0 f Baha s a In don e s i a Ph a nshyology Studia Linguistica XI (~1957) 44-46
lingmiddotC L Linguistic Units The Hague~ Mouton amp Co 1960
J obson t R Hague
and M Halle Mouton amp Co
Fundamentals 1956
of Language The
K nedy Raymond Bibliography of Indonesian Peoples and Cultures New Haven Yale University Press 1962
Perce Joe E Spectrographic Study of English Vowels Under Primary Stress Linguistics LXXXIV (1-972) 41-84
P ttert Ralph K George A Kopp and Harriet C Green Visible Speech New York Dover Publications t 1966
T euw A Critical Survey of Studies on Malay and Bahasa Indonesia The Hague Martinus Nyhoff 1961
-basin
-head of an area
-form of address
-ball bag
-bell
ba --bank I
bUr --you I
bi --beer
bomiddot--drill I
ba--bliJss
bi --bus i
I t
bo I
--bunch bun~le i I
ba--crossbeam
--bomb
--tire
--son of
--ration coupon bond
--garbage dump
--checkered design
--inch
--and plus
APPENDIX A
LIST OF WORDS
den~-abbrev of the title raden
dar--olace location
dur--pearl
das--a shot
dos--small box
dek--deck
dik--younger sibling
dep--to b~ shelved
dop--hubcap
dup-~to be baptized
djak--jug
djok--seat
djas--coat
djus--part of the Koran
gang--paBsageway hall
gung--gong
kak--form of address for elder
kik--handloom
kuk--collar harness
kar--map
kir--jo test
kas ~money supply i
kus -to hiss spit I
lahi-alreadY
loh-writing tablet
lapi -towel I
lup -magnifving glass or
last -IrJeld i oint
lesl -lessonI
lOs -shed I
I I
-to iron
-which who
nu -yonder
po
pa --pole
pa --to fit
pe --plague I
po --mail I
pel --cap
pOI --pot
--pound
--also
r --shelf
--shirt
g-o-rank position
g--ring
--brake
rum--cream
sah--valid legal
sih--an enclitic usedmiddotto soften what follows
san--form of address far sargeant
sen--cent
sang--superior
seng--zinc
sap--line row
sep--chief boss
sop--soup
sjak--suspicion doubt
sjok--attractive
tang--tongs pincer~
ting--sweet meat
tong--barrel vatmiddot
teh--tea
toh--yet nevertheless
tjeng--molasses
tjung--young boy
III 1
APPENDIX E
LINGUISTIC SYMBOLIZATION USED
IAI~high-front-openIi
II
~ r
E~-mid-front-~pen
III
AA-low-front-op~n t1
o1-mid-back-open
Uf-high~baCk-close III
I III
~~~vd bilabial stop
[dj~vd alveolar stop l
I I
[kt-Vl velar stop I
[g I-vd bull velar stop
[1 -lateral I
(n-vd alveolar nasal 1
(m~-vd bilabial nasal
~I-Vd velar nasal
I
III ~IJ
I
q
dl
I
Iil~
I
Vowels
Consonants
[p]-vl bilabial stop shy
[t]-vl alveolar stop
[rJ-vd alveolar flap
[jJ-vd palatal affricate
[CJ-vl palatal affricate
[S]~vl bull alveolar affricatmiddote
[s]-vl alveolar middotfricative
h]- vI velar aspirant
j
16
which when substituted for another bundle creates a difshy
ference in meaning Since the creation of a different morshy
pheme is the result of the substitution of a different sound
feature these sound features are said to be phonemes
A pair of words in which the first word is the same as the second except for the fact that one segment is replaced by a different but phonetic~lly similar segment in the second word constitutes proof that the two similar segments are phonemically distinct~ bullbullbull Word pairs of this type are said to be MINIMALshyLY DIFFERENJ because no smaller difference in the language can make a differ~nce in meahing in words (Pike 1947)
Hence minimal pairs of words were used to find phonemes
Minimal~y different word pairs prove to be the beginners
single most important tool for the analysis of phonemic difshy
ferences (Pike 1947)
Thus Echols and Shadilys An Indonesian-English Dicshy
tionarv (1968) was ut~lized to find three-phoneme words
containing two consonant sounds with a vowel in medial poshy
sition The process was simply to go through all the words
beginning with consonants and find minimally different t~ree
phoneme words This was done on a purely anthr~poscopic
basis on the part of the investigator If a different letshy
ter was employed to distinguish a different meaning it was
assumed to be a different phoneme The following ~ord pairs
and their meanings are examples of the words found in the
dictionary
ban--tire bin--son of
das-- a shot dos--small box carton
I
1 7
pal--pole pel--field
rang--rank position ring--ring
teh--tea toh--yet nevertheless
After having obtained the words from the dictionary
a native informant was called upon to verify ~he differshy
ance in meaning in the minimal pairs and to pronounce
them so that ~hey could be phonetically transcribed in
al1 impressionistic manner The informant employed was Kok
Djen Su a student at Portland State University from Yogshy
jakartai Indonesia He has been a student in the United
States for approximately two years and speaks broken al shy
though very understandable English Mr Su was horn to Mr
and Mrs Su Hendry Su who both speak Bahasa Indonesia Jashy
vanese and a small amount of Chinese Since his birth the
informant was exposed to a mixture of Javanese and Bahasa
Indonesia but has employed the national language of Indoshy
nesia since the age of three at school His bilingual upshy
bringing it seems to the author does not craate a subshy
stantial difference in the competence of Mr Su in Bahasa
Indonesia In fact he was able to distinguish the proshy
nunciation Qf words in both Javanese and in Bahasa Indoshy
nesia The utilization of one informant deletes any reshy
gional variation or individual variation between informshy
ants Since here we are attempting to ascertain the relashy
tive range of phonetic quality of vowel phonemes in Bahashy
sa Indonesia the informants bilingualism ahould cause
none or very few phonetic distortions
After-having verified the difference in meaning of
the word pairs Kok Djen ~u pronounced the word The
following impressionistic version of the Ihdonesian voshy
wel system was described
front central back
high
mid 1 I
I I low j
i I I
I
u-
E 0
A
1 Spectrograms
The phonemic entities symbolized in the preceding
section represent range-units of phonetic quality The
symbols and their position on the chart are based on the
aural perceptions of the investigator The purpose of the
spectrographic analysis of this data is to determine as
accurately as possible the actual phonetic range represenshy
ted by each of thephonemic symbols
I
i
1 9
In order to make spectrograms from which meani~gful
conclusions can be drawn one must have a native informant
of the language to be studied Spectrograms were made of
the speech of Mr Su the informant described earlier
In order to conserve the time of the informant a
sample of three-phoneme words were recorded The three-
phoneme words begin and end with consonants ahd contain a
vowel in medial position The list appears in Appendix A
The list of words was specifically selec~ed to eliminate
in so far as possible all variatiqn other than that which
is specifically caused by the preceding and following consoshy
nants This is true because by utilizing a single informant
the influence of dialects both regional and social are eshy
liminated and by utilizing one sy~lable words under primary
1stress sequential influences such as the Markov Process
are eliminated since there is no sequence beyond one phoshy
neme preceding and following the vowel This being the case
one should be able to derive from a series of spectrograms
of those vowels both the range of free variation and the
specific influence of each particular consonant on the voshy
weI quality of each medial phoneme
The n~xt st~p in the procedure was to play the tape-
recordings into the spectrograph two or three wo~ds at a
1The Markoy Process is a mechanical way of handling enshytropy in sequential operations IQ linguistics this is stashyted in terms ofthe probability of the occurrence of a parshyticular phoneme morpheme etc in a precise sequence
20
time The machine can handle 24 seconds of speech on one
spectrogram thus two or three words could be analyzed at
the same time as one with no loss in quality or precision
Unfortunately the recordings had to be played into a
microphone which picks up some background noise but by
placing the microp~one of the spectrograph very close to
the loudspeaker of the tape recorder and turning the volume
up slightly this background was eliminated for all pracshy
tical purposes middotIt would have been better to have had a
direct connection between the recordar and the spectrograph
but unfortunately no such devce was available Background
noise shows up as very small specks scattered more or less
at random and unless the volume of such noise is exceedshy
ingly strong does not interfere with the reading of the
spectrograms
Once the machine had completed the analys~s and produced
the graphic record of the list of words a frequency measur~
ing device was produced by the machine cf example below
1 11amp II~ill c=
- n- HE to
11r -shy
bull b mmiddot 1 bull bull L
-
gIl F Jamp u
n _ If
bull III
21
This measuring device is in reality a spectrogram with horishy
zontal markings The first line on the chart represents a
frequency of 0 hertz (hz) Each line above the first repshy
resents a multiple of 500 hz The device is used to locate
th~ center of formants 1 and 2 Since it is graduated in
500 hz it is necessary to interpolate when the center ofmiddot
power for a particular formant falls between two of these
lines This is done by dividing the area between the two
lines in half then dividing one of the halves in half which
gives a range of 125 hz within which the measurement falls
and an estimate is made of the precise measurement within
the 125 hz range This should give formant positions with
an accuraci of greater than plusmn25 hz
When visual location of the formant centers becprnes
difficult a section of the formant can be made cf exshy
ample below Such difficulties with visual location usually
arise when two weak formants overlap Such overlapping
produc~s what appears to the naked eye to be a band of modeshy
rately dark grey bands The sectioner is a built in mech-
IshyfL__---
tete we tt
~
I
1 I
22
anism capable of handling such problems In the preceding
I example the amplitude of each harmonic is proportional
to the length of the line representing that harmonic I
This makes it possible to locate formant centers when vi-
I sual location is difficult
The measurements were then transferred to formant
charts cf Chart 1 on the following page
6
23
CHART I
~
t
1+
t5
1amp
Ie
z~ 2t 2p 16 12 la 8 Iii
I ~
~
I S
l I
I I
~
V V
V T
l( FORMANT V CHART
Vi ~ CcdiOrate4 ift luutdnM I V ~ cycle ~ concf
V 10 eeentl~rsI~ V
V U 5millimctcrs - I $milton
2 zk2 lis ty
I
FOlWAlfT CHART
Placing a single point on this cha-t is an assertion that formants have been observed at two frequencies one fOrrUlt at the frequency named along the right or left edge the other formant atmiddotthe frequency named along the top or bottom edge
ex Martin Joos~ Acoustic Phonetics (1948)
CHAPTER IV
FINDINGS
The data provided by the preceding methodology conshy
sisted of a series of scatter patterns on the vowel charts
Each of the dots within the pattern represented one occurshy
rence of a particular vowel To determine the range ofmiddot each
phoneme f the most divergent points in each pattern were con-
nected by a line These lines then circumscribe an area
which included the range of all the vowels in the sample
recognized ~y the informantmiddotas a particular phoneme
Verbal descriptions the actual charts of the phonemes
and the spectrograms utilized willbe found on the followshy
ing pages
25
The distribution for the sounds which the informant
produced and recognized as the phoneme 1 range~ on the
vowel chart in a broad scattering from 300-500 hz for forshy
mant 1 and 1500-2100 hz for formant 2
CHART II
1
lid
13
bull
~
It
iA
Ml
ztr Zit zp 1 S lIZ middot1 I a r 8 6
I
f
I I
Ii 3
[7l I I V 1 I
) ~I I i I bull
V I I i bull r J
I V t I I I I I
i tt I
Kl7 I I I iI ~
I I I I I I I I I i I
I I I i I f I ltII
I I l7 I VI
I [7 1
1 I I I Va FORMANTc7 CHART
I
I I I I 173 CaEiIw-atd icw~[7 rf ltfer C0ItdI I I
j I I I i 7 10 e centlCMta1 oct4v
I V 5miU~ bull itonI
r I f 711 t14 j I I I Ik IV
FoiUlAhT CHRT
Placing asinge point on this chart is an assertion that fortcants have been observed at two frequencies one formant at tn(l frequerlcy nameu Slong the right or eft cdampe the other formant at the frequency named along the top or bottom edge
26
l 1I I - -~
I I iI I
I
[bIs] [bIn]
lt-- -_- -1I
lt i
1 ~ i1_ -shy Ir ~ tmiddotmiddot lt
-- - - ---~--- - - - ----- --
-i -_~ ~ shyI 1
i I I
I I bullbullq_-
I ~~~-~--shyr ~~~~~ -~- I------------------------shy
-----I
[dIm] [sIh]
27
I -[blr]
i1 1 I I
i Ii I
I i I I
ii ___ -J
rmiddot I i
I 1 j
-~ ~~~ ~-~IIlIr~~~
I
1 ____~~l_~~--=~ _ ~--~~~~~~~~~- -
51 hI$ PiiB PD~ii~i
-~ - -- -- ----- ~------- - --- _-- - _ - shy [rIll) [klr]
28
1 I I I
---~S~ -~~~fi~ ~~~~~-~
~l_ middot~ ___
[klk]
I I I
r [dlk]
29
-------- --
-~- shy~--I~~
[tIll]
30
The distribution for the sounds which the informant
produced and recognized as the phoneme lEI ranged on the
vowel chart in a thin oval shaped distribution from 400-625
hz for formant 1 and from 1400-2000 hz for formant 2
CHART III
lEI
i
I
1 I
1
1middot
II~~ 5 I~ I lOa I ~--~~~I-+--+-4-+--+---+--++-+-+-+-+--r--t-t--r--t--r--1
I
I I I I
t I
4
I I 1 I ~ I I I I
I t I ~
I I ~
-r--- r--- I V~~~-r~+-+-~~~+-+-~~~~~~~--T-~-r~-r~-r~-T---T--r~
V~~~++4-~~~-4-+-+~~~~~+-~-T-rV~7
~iA~~~~~I+-~~~~~I--~~~-r~~~~~8 FORMANT HHHH~~r+~~-r~+-~+-~I~-I~~rl7V CHART
I II 11I I V9 CaZiLrww 1ft huncirccLJ
-+-f-+-II-f-+-+-+-+--+-+--+--+----+-+--+-1--t-+-1---t---t--7 rtf eye 04 ~ I 11 V pq-+-+-I~-+--i--+I-t-t--+~i-I---t--+--tr -t--t-Tj-ri~middotltJ ecentimeters 1octGy
I V 5miU~ - aemiton ~~~~I~~+-~~l~-~-T~I~~~r~
t i lt~ I I IS I I liV
FolUlAn C1LBT
Placing a single point on this chart is an assertion T hat rormants have been observed at two frequencies one formant at the frequency namfu along the right or left edge the other formant at the frequency named along the top or bottom edge
31
I I
I ~_ f __
~~~ - - ---~ _-shy
I -- shyI - _v-- _ l
i _~~E~~~~middotmiddotmiddot ~---~--~~-it--_ ~_~ 1gt_ bullbull bull -_gt-~~~ ~ bullI
P~J r_i~=~~~ ~-~~~- - -1 I -----~ -~-~ _ ---_
~~Wa~~Ji~~L ____ __ _____ _
[PEs]
I __ shy
-- --shy
~~ ~ -Qt-shy
-~=-=----
~~~7=~~ L___ __ __ ____ _ ______~
[rFm]
32
[PEt]
bull - -IIot-__
- ---~~--
[dEk]
---
33
f ~
I
) I I
I
I I
I 1 I
I I
I
1
__ -~_~i~~-yen-=-- ~~-~= --
------------------------
[dEn] [sEn]
i
~ ----shybull __ ~
[cEr)]
34
1J i i
~
--~~ ~-
~~
-~- ~ -~ ~~ ~gt-- ~- ~~
I ~IJItt- F ~ 111 i~-~_~--- ~--- - _ =-- 4e -~~~-~_-_~-- _~
bull vf middotmiddot~~tmiddotmiddotl____________________~____ j
[sEp] [bEk]
[bEl]
~ shy~~--_o-
J -~~~
~~t~-~~J~ r~~7~ _
I middot---=i---=-~_4~ __ ~~~~~___I _ _~
~g_i$fj bull - ~-~~~z~ir~~ ~~~ leal -~I_ iiIB
L_________ __~________ _____~
[lEs]
I f
I
35
- --- ---- - ---- ----------
~-------- shy
bull
j
i
[tEll][dan]
[dEp]
36
The distribution for the sounds which the informant
produced and recognized as the phoneme A range~ on the
vowel chart from 600-750 hz for formant 1 and from 1600-2300
hz for formant 2
CHART IV
A
i6
i I I
I I
I I
I I
1 0
I
I I I
I I
I I
s
It
i j I Ii i I
I I
6
~ I 1 I I I I ~
I I I V~ FORMANT ~~~~~I~1~4-+-~~~--~1-+~~I~-~-r17 CHART
~~~~~~l~~~~I~i~~~~I~+I~~lr_I~I~~~$ ~U~~~h~~ ~ I I I I I ~ 7 J eye ptI -cony
1f4-i--~--+---I----t--I-4--~1--+---+--+---+---1-~i7-to e cVltJte1 oct4v
i I I I 1 5miU~ - bull iton ~~~~~~~~~middot~~~~4-~I~I--~+~middoti i
2~ I I
F01UlANT CiLlT
Placing a single point on this chart is an assertion tnlt rorreints have bE-en obsered at two frequencies one formant at the frlquerJcy nSleU aiong he right 01 eft edge the other formant nt the frequency named along the top or bottom edge
37
I I i
-shy
I
I
I
~1iI
p~~~~==~~~~i~~~~
I I
[lAs]
_7 -~
-- -shy
L _ _ _ ____________ --- -- ----_~____J
[nAn]
--------
38
I I
------------------~----I I 11 I I
II1
flt~
I
IJ
L
i
______________________
[sAk]
f
~~ ~--r
1 shy
~~-
-- shy[sAn]
I r 1I I I
t
t
I l I
I I I
I i
I
[sAt)] [sAp]
39
~]
I
I I
[rArl][bAk]
I
-shy ---==-_____lshy___
[lAp ]
40
~----------------------------~-------------~
1 bull -l----1-shy
~middot-~-~t-=-- -
~r-shy -shy t~ III M -~ ~~---shy~t-= ~r=_ _shy
C z---=-
L______________________----- [dAs]
[dAr]
l _
41
v 1
I I
i
I
I -tc - bull ~ 1t iCSi4 _ -
-~~-r~middot- 1 ____ ~~~~ ~ ~ I
1 I ~=~j3~middot7-__ ~~
[kArl
---------------------~------
[dAin]l
I I
-I
I
42
I gt1 tmiddot
I
[bAm]
bull
~ I 1 I
gt1
-- - ___ _ N ____ ~--shy---- shy
[bAn]
43
[lAh]
==III
I Imiddot
__~_--_middotfI_~__ ~ ennee ~ S
LL-
[JAk]
--------- ---------
44
---------
I i Ir I
I I j
i
I i
~ --_ -- ~
~~fb-~~~~~~ ----- shycshy7FiIf Elii=s FUP WRmiddot 75t3~ n JIilIeia
~------------
[JAs]
-II
I J
[dAnl
45
~ I 1shy
I
iI shyi t
- - - Imiddot--- ~p -~--~= roc - I
I II i
I I I
~ middot1 I
------J
j I
I I i
i I
1_____ --- I ---------------~
[kAs]
I
I I
I t
I I i
j poundiampl d
rshyl
I i
I
1
I I I
I Il
[bAl]
I~
[bAl)]
I
47
L---------------------- --------------~
[kAp] shy
t
I-- I ~ I i
I
ji I
I -I
I 1 I 1
i
)
~~
~L~--~~---~ - ~ ~
~ -shyY- r i
I
-
1
I I
)
----~ -shy- -- _ ~ ----shy
1 I i i I I
1 I
L ~~~~-~~-~-~~~-~~-gt-= rn~ J ___fi ~ 7 7TZ r~ 5UZs=j -~ l ____-------- _____ __ _ ___________ ________ I
[kAk]
i
I t r ~
--~~ -shy
~~~c~_=--_u ce4 we
I r bull
[gAr)]
~-~ shy
- -~ -~~
~P ~-~~
I ~~
-- bull ~ I - ~~-~~
~-~~~--~ shymiddotT _i
48
-----------------------------l
I I
I I
[rAk]
~_
~ ~--- ~~~-~
j ~~ ~ ~ ~7
~ bull~~middote ri~-is~~~l-IIII-middotlIIIIn---I~-- 41~~~~~ ~
1--=-_---- - - -===--------shy
[sAil]
I
49
_- I I
I -- ----------------shy
~2~~~ ~~
i i I I ~~~~~~~~b ~-
middot_- _ ~~------
j
i ~ at -== l - -- ~-~~it I ax I C1 bullbull~~- shy
I
I i
I I
I 1 I II r I I
-r- --shy
~~-~-~- -~-
-1 l I
I I
[bAs] [PAs]
r-------------------~------------___
[pAl]
I
50
The distribution for the sounds which the informant
produced and recognized as the phoneme 0 ranged on the
vowel ~ha~t from 400-525 hz for formant 1 and from 700~1000
hz for formant 2
CHART V
0
III
t5
lot
S
6
Ie
to
Z7 Zit 9 I 1 I a I z I a 6 6
I
I ~ I
I i II I
j i bull I I
I I I i I
I ~ t
~ ~I I
f I
I ~ f A I I I
j [- V I 1 I I I II ~ I 1 I I
At I
I t I I
V V
V 7
i I Vi( FORMANT I 1 I 1 CHARTI I
I V 3 C41iotc4 ill lUjn~ 01 eycpr ~0It4
i I f I IV
I ) I V IO 6 centltcrs 1 octcv1 I I I 5miU~ -Istmi-toneI
I I VII 2 I ltQshy t 116 IV
FOlUlUfT CRBT
Placing a single point Oll this chart is ampn assertion that formants have been observed at two frequencies (me iormant at the frequency nametl ~ong the right or left edge the other tonnant at the frequency named along the top or bottom edge
Ishy
51
r--- -_-__ - --------shy
-- ~--- --shy~ -
--f -~-
[tOll][pOn]
~ ---- -11lt1 ~
~-- - -~ P---~Amiddot_
t _ __ _
1 r I
--1 i I
I
I ~~~J L____ _ 1 rshy
[dOs] [b0s]
i Imiddot
52
---------------------~---
i I r -------- --------shy
r~~middot-~ [
I V I ~~
I - shy
~~~middottdmiddot~~-~-middot~-
S~~i~~-~ ~- bmiddotmiddotmiddotL _____middot_ ~_
[bOr] [rOk]
I
1 I
i i
j
I
[dOpJ[pOl]
53
Ii --~ --~--- -~~~~--=- I r
~ ~- ~ - ~ - shyI - -~ ~~ -~~ I
-1bullbull - h ~~~
~~~ ~ ~~~~----- ~~-~~~-~- ~--~~~~L- ~bullbull
I middot~-~middotdf r scr ~~~~~
~-laquo~~-==~~~-~~--~~~~ ~~
I
[lOs]
I
I
r I
i 1
i 1
I I J_____~ __ _-_M___J
[bOn]
54
i -~----
I I I r r
~-~ -shy
[bOn][sOp]
jI ----II I J
i
I I I
I I I i
I~~~==it shy
[jOk][tQr)]
55
1 I
I
II I I I
I c ~~~~~~~~ ~~OOWJI~~=U
[lOh]
i I
I
I ~~~-
I ~- -- shyl - _- ~ shy
I ~n=~~-~middot ~FlR T =Iti 1amp11 dill_
__-J
[pOt]
__J pOs]
1
- =xu
[bOk]
I
56
The distribution for the sounds which the informant
produced and recognized as the phoneme lUI range~ on the
vowel
hz for foimant
chart in an
1
almost square-like pattern from
and from 700-1000 hz for formant
250-350
2
CHART VI
lui fIG
3
t
ts
~
la
Il
IT zt 20 IS
I I
I I
i j
I
I j
I I
I
I I I
I t I I I1
I J I I I
~ i I LJ J I~
I
I
I
la -I
10
I
I I I 1
t I I i
I
I
I I
I
I I I
I ~ 1 v I)
V V
qV
FOlUfANT atRT lt
8 6
I t lt
~
I
l --~ I--- ~I I
i
I I
I I I i ltiI I
I i ~
I t
V
V V l( FORMANT I V CHART V
V Caiote4 iramp 1umb_ ef cycipampf on4
6 CelItlmctcrs bull octclv SmiUitoctamprs -I a~i-tonl
PlaciDg a single point on this chart is an assertion that formants have been observed at two frequencies one formant at the frequency named along ~he right or eft ede the other fonnant at the frequency named along the top or bottom edge
I
57
I
I
I -I
I
j _-
~~ -
-
bull I -
[dUp]
t I ~
~
I middot1
f
IshyIj II
I i
-------=shyI ~~-- -
L ~~-=-r--~~-III--=---
58
i middot1 I
I
i j I Imiddot
I~1 middotU~ _ s
I ~~~~~_-_-~--~ --_ I
L~ __________~_____________~ [CUll]
I
I
[dUr]
I
I J
I
I I
II
1
-yen ~ L___________ ~__ ~=~
I [kUs][pUn]
59
I
I
i L ~ -----------~-
____---shy______---2
~~~ -~ _
j ~---
I~~~-~-~ ~~ ~~
[nUn] [lUp]
I 1
~-=-~ ~~ -
[rlhn]
I
60
l
- _ ~~-----
~~~~~ JlCIIPrl fue rm ad I II
L ~ [gUI)] [kUk]
e_
__ ~ e-
~-d~~~~
[lUs] [jUs]
61
shy
I
Iii lEI and A Compa~ed
In comparing the distributions of the vowels III lEI
and IA( cf Chart VII on p 62 it is evident from the plots
that the front-back tongue position is for all practical
purposes identical ie the core distribution for all
three phonemes ranges between 1600-2000 hz This demonshy
strates conclusively that the significant phonetic differshy
ence is tongue h~igth ie t~e position of formant 1
The fact of phonemi~overlap is illustrated by the
crosshatching on Chart VII The cross-hatched area represhy
sents a r~nge of phonetic quality that is identified in one
instance as an III and in another instance as an IE or in
one instance as an lEI and in another instance as an IA
bullbullbull the sounds which follow one another in a changing sequence constitute the signals of speech and these sounds are produced by movements of the vocal apparashytus i e by movements of the lips tongue throat lungs and so on It is therefore important to understand that these vocal movements caused by the various muscles involved tend to slur into one anothshyer Since each variation of movement gives a varishyation in sound the slurring of movements produces a slurring of sounds Furthermore since specific sound will have different slurs of moveme~t depend~ ing upon the movement which it precedes or folloItJs each sound type resul tant from the productive moveshyments will vary somewhat according to the sounds which it precedes or follows (Pike 1947)
In line with this the next logical step would be to
look for environmental influences which would enable a listshy
ener to determine which phoneme was represented when phones
were recorded in the overlap area
62
CHART VII
lIlt lEI and A Compared
~ 2[7
t5
lot
5
ft
fA
Ie
Zit I zp 16 I a la 8 6
t I
~
II V I I I I +
r l~ ~ ~ I
I I ~ ~ V I I 1shy fZ I I t s
) I I j I I I
i ~ I 1 1 I I _lgt
V ~R R-r--~ I V
ItV l(
I I---I-
V~ j shy ~
I I I I FORMANTI I
I I VV CHARTI II I V S CaliL-tcd I Uut
I I I l of fIelc F- 0114
I I I I I j i I 10 ecentImeters 1oct4v
I
I ~ V Smillimctus Iumrton_ j VII
2f1 2~ 16 ltv
FOlUlANT ClIABl
Placing single point on this chart is an assertion that io-rnants have been observed at wo frequencies one formant at the frequency named ~ong the right or left edge the other formant at the frequency named along the top or bottom edge
63
A fairly thorough study of the positions of various
vowel sounds in specific environments did not indicate any
consistent variations of a particular type For example
the vowel in dim is in the lower range for the vowelIII
but the EI in dem is in the upper range -of the vowel lEI
Thus it seems probable that those sounds in the overlap area
are qualities for which minimal contrasts do not exist For
example the II in sih is in the overlap area but appar-middot
ently is clearly recognizable by a native sp~aker because
there is no seh at least no such word was known to the
informaht nor could one be found in the dictionary (Echols
and Shadily 1968)
IU and 0 Compared
In contrast with the front vowels III IE and IAI
the back vowels Iu and 0 have aconsiderable gap plusmn50
hz between the1r two distributions cf Chart VIII on
p 64 The distributions appear directly above one another
on the chart In comparing the two ranges it is appa~ent
that the front-ba~k position formant 1 is identical ie
the core distribution for the phoneme ranges from 700-1000
hz This demonstrates that ~he position of formant 1 ie
tongue height is the significant phonetic difference
64
CHART VI I I
U and 0 Compared
I I
i
5
~
5
6
til
~
2[1
I
Zit zp 15 IZ la a 6
~ I -~
1 ~ ~ ~
~
I V 1
V
I V ~
JIll ~
I I 1 6
1 middotV V l(
vI( FORMANT CHART
9 CalLOt-ctc4 ift 1awuutb of cyc14 p ICCOftI
I~ I V 6 eentllMtcrs 1 octo
I V 5mmi~ - ampImitenI VII
214 I 210 16 IV FOlUfANT CE1ART
PJaciDc a single point on this chart is an assertion that formants have been observed at two frequencies one form3nt at the frequency named along the right or left edge the other formant at the frequency named along the top or bottom edge
middotr I
65
II lEI IAI lUI and 101 Compared
In comparing all three phonemes in their respective
poJition on the vowel chart cf Chart IX an p 66 there I
se~ms to be no problem identifying between front and back
vowels There is a gap of approximately 400 hz between
th$ two back vowels and the three front vowels in terms of I
fotment 2 Also it would appear that there would be no
pr~blem in identifying specific vowel qualities so far as
fOfmant position is concerned for vowels in stressed position
with the exception of the phonemic overlapping discussed in
a preceding section ie III-lEI and IE-A
I
I
Imiddot I
CHART IX
I 1 E IA U and 0 Compared I
iM zr Ztt ap J 6 I Z 10 S 6
I I f ts I
~
tj1- ~
rL ~ ~
J 4- 1 ~ ~ i~ ~ V
Ii ~W~ V I ~~ ~ J
V I ~ ~
IS I ~ V 5 1 t
~
s ~ I I f
V R ~ r-~ I V
if~ V ~ ~
-- V 7
~ -~ [a ti I l( FORMANT
V CHART
V 0 cyclu on4 S CaULntte4 ilt hWldr_
I
Kl I jmiddotV I j V 10 6 centlrMtcll1 oct4v
V 5llIil(lCtampn ~ hl4Imiton
Vii 2~ zkgt 116 I IIyen
I
Forw~ CllABT I
Placing a single point on this chart is an assertion that formants have been observed I at two frequencies one formant at the frequency named along the rignt or left edgeI
the other formant at the frequency named along the top or bottom edge
~ ~ bull -
66
I
I I j
Cbull
I I
i
CHAPTER V I SUMMARY AND CONCLUSIONI
I As is shown on Chart IX on p 66 there appears to I I
bela very discernable distribution for each of the vowel I
Phtnemes of Bahasa Indonesia This does not mean that the
ci cumscriptions of each of the various sounds indicate I
detinite border lines for each vowel Rather it shows i
th~ position o~ each vowel in relation to the other vowel
phbnemes The vowel charts show the position of the phonemes
i asl produceq by one native speaker of the language Thus
nJ conclusions can and should ~e made regarding the definite
oJter boundaries of the ranges of middotp~onemes As is implied I
b~ the term ranges the phonemes have no defined boundarshy
I i~s
i Bahasa Indonesia does not appear to have two front I
v~wels two back vowels and one central vowel as is implied
i+I
the traditional symbolization Rather it has three i
ftont vowels with a three-way contrast between high mid I
i a~d low and a two-way contrast of high vs mid in the back
a1ea of~he articulation chart If a traditional symbolshy
i~ation of the vowel phonemes of the language were now to
b~ dawn it would look like the following chart I I I
68
front central back
high
mid
low
I
U
E 0
A
Thus as has been demonstrated the impressionistic
sion of the vowel system was in error with regards to
central phoneme of the language investigated There
a ears to be no low-central phoneme in the language
r it is a low-front one Although the spectrograph
c nnot establish a phonemic system of a language on its
o n it can provide a yes or no answer about the phoneshy
t c qualities of the phonemes in question After a phoneshy
m c system has been established the spectrograph can proshy
v de phonetic data which distinguishes one phoneme from
a other
BIBLIOGRAPHY
Sources Cited
Almiddotsjahbana Takdir The Indonesian Language - By-product of Nationalism Pacific Affairs XXII (1949)388-92
Am rican University Area Handbook for Indonesia Washingshyton DC ~S Government Printing Office 1970
Blch B and G Trager Outline of Linguistic Analysis Baltimore Waverly Press 1942
Du n H K Calculation of vowel resonances Journal of the Acoustic Society of America XXII (1950) 740-53
ols John M and Hassan Shadily An Indonesian-Enqlish Dictionary Ithaca Cornell University Press 1963
ner C Reserches sur la structure des voyelles orashyles Archives Neerlander Phonetic Experiments XX (1947) 40-77
obson Roman C Gunnar Fant and Morris Halle Prelimshyinaries of Speech Analysis Cambridge MIT Press shy1961
J s Martin Acoustic Phonetics Baltimore Linguistic Society of America 1948
L defoged Peter Three Areas of Experimental Phonetics London Oxford University Press 1967
P Mario Glossary of Linguistic Terminology New York Columbia University Press 1966
Perce Joe E The Spectrographic Study ~f Vocalic Nuclei Language Learning XII (1963) 241-247
- --- Phonemic Theory and the Analysis of English Syllashybic Nuclei Linguistics XVII (1965) 36-57
P ke Kenneth L Phonemics Ann Arbor University of Michigan Press 1947
70
Pi e t Kenneth L Phonetics Ann Arbor University of Michigan Press t 1943
Pu gram Ernst Introduction to the Spectrography of Speech New York Dover Publications 1966
ir Edward Language An Introduction to the Study of Speech New York Harcourt Brace amp Co 1921
enbeck E M Indonesia and Malaysia 1I Current Trends in Linguistics IIX (1967) 55-111
dman Dorothy The Republic of Indonesia New York N Y Philosophical LibrarYt Inc 1955
Sources Consulted
r e j e v N D bull Some ProbIem s 0 f Baha s a In don e s i a Ph a nshyology Studia Linguistica XI (~1957) 44-46
lingmiddotC L Linguistic Units The Hague~ Mouton amp Co 1960
J obson t R Hague
and M Halle Mouton amp Co
Fundamentals 1956
of Language The
K nedy Raymond Bibliography of Indonesian Peoples and Cultures New Haven Yale University Press 1962
Perce Joe E Spectrographic Study of English Vowels Under Primary Stress Linguistics LXXXIV (1-972) 41-84
P ttert Ralph K George A Kopp and Harriet C Green Visible Speech New York Dover Publications t 1966
T euw A Critical Survey of Studies on Malay and Bahasa Indonesia The Hague Martinus Nyhoff 1961
-basin
-head of an area
-form of address
-ball bag
-bell
ba --bank I
bUr --you I
bi --beer
bomiddot--drill I
ba--bliJss
bi --bus i
I t
bo I
--bunch bun~le i I
ba--crossbeam
--bomb
--tire
--son of
--ration coupon bond
--garbage dump
--checkered design
--inch
--and plus
APPENDIX A
LIST OF WORDS
den~-abbrev of the title raden
dar--olace location
dur--pearl
das--a shot
dos--small box
dek--deck
dik--younger sibling
dep--to b~ shelved
dop--hubcap
dup-~to be baptized
djak--jug
djok--seat
djas--coat
djus--part of the Koran
gang--paBsageway hall
gung--gong
kak--form of address for elder
kik--handloom
kuk--collar harness
kar--map
kir--jo test
kas ~money supply i
kus -to hiss spit I
lahi-alreadY
loh-writing tablet
lapi -towel I
lup -magnifving glass or
last -IrJeld i oint
lesl -lessonI
lOs -shed I
I I
-to iron
-which who
nu -yonder
po
pa --pole
pa --to fit
pe --plague I
po --mail I
pel --cap
pOI --pot
--pound
--also
r --shelf
--shirt
g-o-rank position
g--ring
--brake
rum--cream
sah--valid legal
sih--an enclitic usedmiddotto soften what follows
san--form of address far sargeant
sen--cent
sang--superior
seng--zinc
sap--line row
sep--chief boss
sop--soup
sjak--suspicion doubt
sjok--attractive
tang--tongs pincer~
ting--sweet meat
tong--barrel vatmiddot
teh--tea
toh--yet nevertheless
tjeng--molasses
tjung--young boy
III 1
APPENDIX E
LINGUISTIC SYMBOLIZATION USED
IAI~high-front-openIi
II
~ r
E~-mid-front-~pen
III
AA-low-front-op~n t1
o1-mid-back-open
Uf-high~baCk-close III
I III
~~~vd bilabial stop
[dj~vd alveolar stop l
I I
[kt-Vl velar stop I
[g I-vd bull velar stop
[1 -lateral I
(n-vd alveolar nasal 1
(m~-vd bilabial nasal
~I-Vd velar nasal
I
III ~IJ
I
q
dl
I
Iil~
I
Vowels
Consonants
[p]-vl bilabial stop shy
[t]-vl alveolar stop
[rJ-vd alveolar flap
[jJ-vd palatal affricate
[CJ-vl palatal affricate
[S]~vl bull alveolar affricatmiddote
[s]-vl alveolar middotfricative
h]- vI velar aspirant
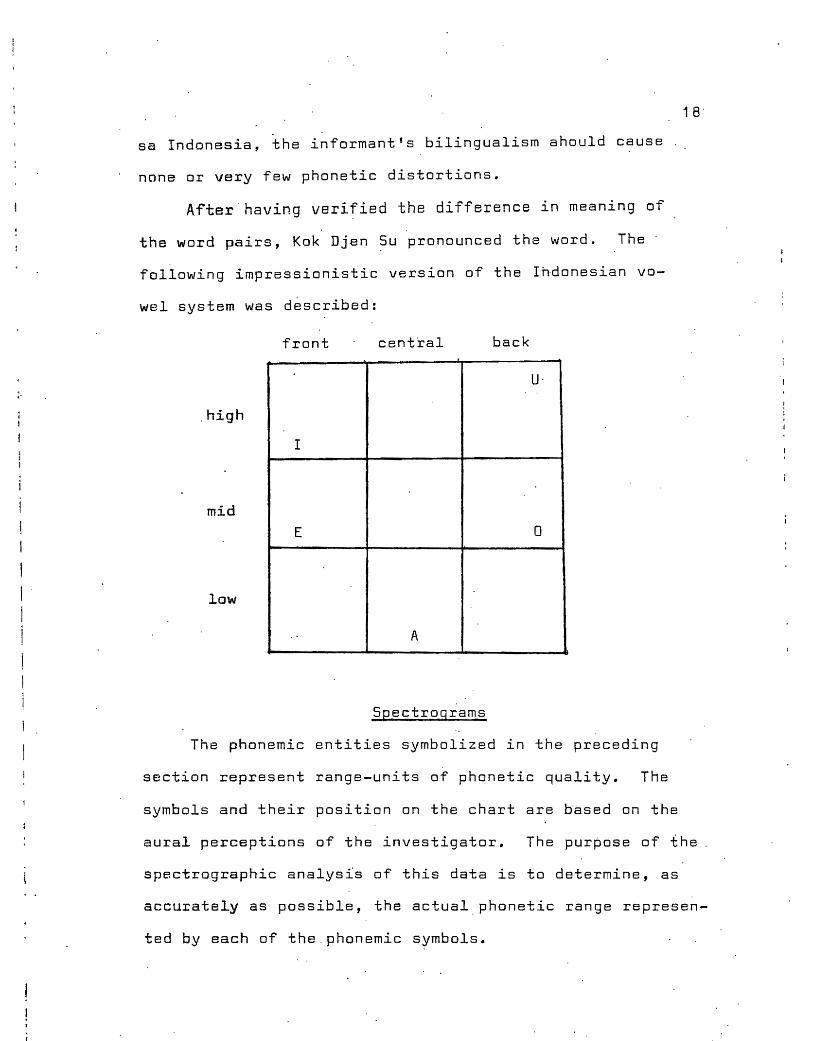
I
i
1 9
In order to make spectrograms from which meani~gful
conclusions can be drawn one must have a native informant
of the language to be studied Spectrograms were made of
the speech of Mr Su the informant described earlier
In order to conserve the time of the informant a
sample of three-phoneme words were recorded The three-
phoneme words begin and end with consonants ahd contain a
vowel in medial position The list appears in Appendix A
The list of words was specifically selec~ed to eliminate
in so far as possible all variatiqn other than that which
is specifically caused by the preceding and following consoshy
nants This is true because by utilizing a single informant
the influence of dialects both regional and social are eshy
liminated and by utilizing one sy~lable words under primary
1stress sequential influences such as the Markov Process
are eliminated since there is no sequence beyond one phoshy
neme preceding and following the vowel This being the case
one should be able to derive from a series of spectrograms
of those vowels both the range of free variation and the
specific influence of each particular consonant on the voshy
weI quality of each medial phoneme
The n~xt st~p in the procedure was to play the tape-
recordings into the spectrograph two or three wo~ds at a
1The Markoy Process is a mechanical way of handling enshytropy in sequential operations IQ linguistics this is stashyted in terms ofthe probability of the occurrence of a parshyticular phoneme morpheme etc in a precise sequence
20
time The machine can handle 24 seconds of speech on one
spectrogram thus two or three words could be analyzed at
the same time as one with no loss in quality or precision
Unfortunately the recordings had to be played into a
microphone which picks up some background noise but by
placing the microp~one of the spectrograph very close to
the loudspeaker of the tape recorder and turning the volume
up slightly this background was eliminated for all pracshy
tical purposes middotIt would have been better to have had a
direct connection between the recordar and the spectrograph
but unfortunately no such devce was available Background
noise shows up as very small specks scattered more or less
at random and unless the volume of such noise is exceedshy
ingly strong does not interfere with the reading of the
spectrograms
Once the machine had completed the analys~s and produced
the graphic record of the list of words a frequency measur~
ing device was produced by the machine cf example below
1 11amp II~ill c=
- n- HE to
11r -shy
bull b mmiddot 1 bull bull L
-
gIl F Jamp u
n _ If
bull III
21
This measuring device is in reality a spectrogram with horishy
zontal markings The first line on the chart represents a
frequency of 0 hertz (hz) Each line above the first repshy
resents a multiple of 500 hz The device is used to locate
th~ center of formants 1 and 2 Since it is graduated in
500 hz it is necessary to interpolate when the center ofmiddot
power for a particular formant falls between two of these
lines This is done by dividing the area between the two
lines in half then dividing one of the halves in half which
gives a range of 125 hz within which the measurement falls
and an estimate is made of the precise measurement within
the 125 hz range This should give formant positions with
an accuraci of greater than plusmn25 hz
When visual location of the formant centers becprnes
difficult a section of the formant can be made cf exshy
ample below Such difficulties with visual location usually
arise when two weak formants overlap Such overlapping
produc~s what appears to the naked eye to be a band of modeshy
rately dark grey bands The sectioner is a built in mech-
IshyfL__---
tete we tt
~
I
1 I
22
anism capable of handling such problems In the preceding
I example the amplitude of each harmonic is proportional
to the length of the line representing that harmonic I
This makes it possible to locate formant centers when vi-
I sual location is difficult
The measurements were then transferred to formant
charts cf Chart 1 on the following page
6
23
CHART I
~
t
1+
t5
1amp
Ie
z~ 2t 2p 16 12 la 8 Iii
I ~
~
I S
l I
I I
~
V V
V T
l( FORMANT V CHART
Vi ~ CcdiOrate4 ift luutdnM I V ~ cycle ~ concf
V 10 eeentl~rsI~ V
V U 5millimctcrs - I $milton
2 zk2 lis ty
I
FOlWAlfT CHART
Placing a single point on this cha-t is an assertion that formants have been observed at two frequencies one fOrrUlt at the frequency named along the right or left edge the other formant atmiddotthe frequency named along the top or bottom edge
ex Martin Joos~ Acoustic Phonetics (1948)
CHAPTER IV
FINDINGS
The data provided by the preceding methodology conshy
sisted of a series of scatter patterns on the vowel charts
Each of the dots within the pattern represented one occurshy
rence of a particular vowel To determine the range ofmiddot each
phoneme f the most divergent points in each pattern were con-
nected by a line These lines then circumscribe an area
which included the range of all the vowels in the sample
recognized ~y the informantmiddotas a particular phoneme
Verbal descriptions the actual charts of the phonemes
and the spectrograms utilized willbe found on the followshy
ing pages
25
The distribution for the sounds which the informant
produced and recognized as the phoneme 1 range~ on the
vowel chart in a broad scattering from 300-500 hz for forshy
mant 1 and 1500-2100 hz for formant 2
CHART II
1
lid
13
bull
~
It
iA
Ml
ztr Zit zp 1 S lIZ middot1 I a r 8 6
I
f
I I
Ii 3
[7l I I V 1 I
) ~I I i I bull
V I I i bull r J
I V t I I I I I
i tt I
Kl7 I I I iI ~
I I I I I I I I I i I
I I I i I f I ltII
I I l7 I VI
I [7 1
1 I I I Va FORMANTc7 CHART
I
I I I I 173 CaEiIw-atd icw~[7 rf ltfer C0ItdI I I
j I I I i 7 10 e centlCMta1 oct4v
I V 5miU~ bull itonI
r I f 711 t14 j I I I Ik IV
FoiUlAhT CHRT
Placing asinge point on this chart is an assertion that fortcants have been observed at two frequencies one formant at tn(l frequerlcy nameu Slong the right or eft cdampe the other formant at the frequency named along the top or bottom edge
26
l 1I I - -~
I I iI I
I
[bIs] [bIn]
lt-- -_- -1I
lt i
1 ~ i1_ -shy Ir ~ tmiddotmiddot lt
-- - - ---~--- - - - ----- --
-i -_~ ~ shyI 1
i I I
I I bullbullq_-
I ~~~-~--shyr ~~~~~ -~- I------------------------shy
-----I
[dIm] [sIh]
27
I -[blr]
i1 1 I I
i Ii I
I i I I
ii ___ -J
rmiddot I i
I 1 j
-~ ~~~ ~-~IIlIr~~~
I
1 ____~~l_~~--=~ _ ~--~~~~~~~~~- -
51 hI$ PiiB PD~ii~i
-~ - -- -- ----- ~------- - --- _-- - _ - shy [rIll) [klr]
28
1 I I I
---~S~ -~~~fi~ ~~~~~-~
~l_ middot~ ___
[klk]
I I I
r [dlk]
29
-------- --
-~- shy~--I~~
[tIll]
30
The distribution for the sounds which the informant
produced and recognized as the phoneme lEI ranged on the
vowel chart in a thin oval shaped distribution from 400-625
hz for formant 1 and from 1400-2000 hz for formant 2
CHART III
lEI
i
I
1 I
1
1middot
II~~ 5 I~ I lOa I ~--~~~I-+--+-4-+--+---+--++-+-+-+-+--r--t-t--r--t--r--1
I
I I I I
t I
4
I I 1 I ~ I I I I
I t I ~
I I ~
-r--- r--- I V~~~-r~+-+-~~~+-+-~~~~~~~--T-~-r~-r~-r~-T---T--r~
V~~~++4-~~~-4-+-+~~~~~+-~-T-rV~7
~iA~~~~~I+-~~~~~I--~~~-r~~~~~8 FORMANT HHHH~~r+~~-r~+-~+-~I~-I~~rl7V CHART
I II 11I I V9 CaZiLrww 1ft huncirccLJ
-+-f-+-II-f-+-+-+-+--+-+--+--+----+-+--+-1--t-+-1---t---t--7 rtf eye 04 ~ I 11 V pq-+-+-I~-+--i--+I-t-t--+~i-I---t--+--tr -t--t-Tj-ri~middotltJ ecentimeters 1octGy
I V 5miU~ - aemiton ~~~~I~~+-~~l~-~-T~I~~~r~
t i lt~ I I IS I I liV
FolUlAn C1LBT
Placing a single point on this chart is an assertion T hat rormants have been observed at two frequencies one formant at the frequency namfu along the right or left edge the other formant at the frequency named along the top or bottom edge
31
I I
I ~_ f __
~~~ - - ---~ _-shy
I -- shyI - _v-- _ l
i _~~E~~~~middotmiddotmiddot ~---~--~~-it--_ ~_~ 1gt_ bullbull bull -_gt-~~~ ~ bullI
P~J r_i~=~~~ ~-~~~- - -1 I -----~ -~-~ _ ---_
~~Wa~~Ji~~L ____ __ _____ _
[PEs]
I __ shy
-- --shy
~~ ~ -Qt-shy
-~=-=----
~~~7=~~ L___ __ __ ____ _ ______~
[rFm]
32
[PEt]
bull - -IIot-__
- ---~~--
[dEk]
---
33
f ~
I
) I I
I
I I
I 1 I
I I
I
1
__ -~_~i~~-yen-=-- ~~-~= --
------------------------
[dEn] [sEn]
i
~ ----shybull __ ~
[cEr)]
34
1J i i
~
--~~ ~-
~~
-~- ~ -~ ~~ ~gt-- ~- ~~
I ~IJItt- F ~ 111 i~-~_~--- ~--- - _ =-- 4e -~~~-~_-_~-- _~
bull vf middotmiddot~~tmiddotmiddotl____________________~____ j
[sEp] [bEk]
[bEl]
~ shy~~--_o-
J -~~~
~~t~-~~J~ r~~7~ _
I middot---=i---=-~_4~ __ ~~~~~___I _ _~
~g_i$fj bull - ~-~~~z~ir~~ ~~~ leal -~I_ iiIB
L_________ __~________ _____~
[lEs]
I f
I
35
- --- ---- - ---- ----------
~-------- shy
bull
j
i
[tEll][dan]
[dEp]
36
The distribution for the sounds which the informant
produced and recognized as the phoneme A range~ on the
vowel chart from 600-750 hz for formant 1 and from 1600-2300
hz for formant 2
CHART IV
A
i6
i I I
I I
I I
I I
1 0
I
I I I
I I
I I
s
It
i j I Ii i I
I I
6
~ I 1 I I I I ~
I I I V~ FORMANT ~~~~~I~1~4-+-~~~--~1-+~~I~-~-r17 CHART
~~~~~~l~~~~I~i~~~~I~+I~~lr_I~I~~~$ ~U~~~h~~ ~ I I I I I ~ 7 J eye ptI -cony
1f4-i--~--+---I----t--I-4--~1--+---+--+---+---1-~i7-to e cVltJte1 oct4v
i I I I 1 5miU~ - bull iton ~~~~~~~~~middot~~~~4-~I~I--~+~middoti i
2~ I I
F01UlANT CiLlT
Placing a single point on this chart is an assertion tnlt rorreints have bE-en obsered at two frequencies one formant at the frlquerJcy nSleU aiong he right 01 eft edge the other formant nt the frequency named along the top or bottom edge
37
I I i
-shy
I
I
I
~1iI
p~~~~==~~~~i~~~~
I I
[lAs]
_7 -~
-- -shy
L _ _ _ ____________ --- -- ----_~____J
[nAn]
--------
38
I I
------------------~----I I 11 I I
II1
flt~
I
IJ
L
i
______________________
[sAk]
f
~~ ~--r
1 shy
~~-
-- shy[sAn]
I r 1I I I
t
t
I l I
I I I
I i
I
[sAt)] [sAp]
39
~]
I
I I
[rArl][bAk]
I
-shy ---==-_____lshy___
[lAp ]
40
~----------------------------~-------------~
1 bull -l----1-shy
~middot-~-~t-=-- -
~r-shy -shy t~ III M -~ ~~---shy~t-= ~r=_ _shy
C z---=-
L______________________----- [dAs]
[dAr]
l _
41
v 1
I I
i
I
I -tc - bull ~ 1t iCSi4 _ -
-~~-r~middot- 1 ____ ~~~~ ~ ~ I
1 I ~=~j3~middot7-__ ~~
[kArl
---------------------~------
[dAin]l
I I
-I
I
42
I gt1 tmiddot
I
[bAm]
bull
~ I 1 I
gt1
-- - ___ _ N ____ ~--shy---- shy
[bAn]
43
[lAh]
==III
I Imiddot
__~_--_middotfI_~__ ~ ennee ~ S
LL-
[JAk]
--------- ---------
44
---------
I i Ir I
I I j
i
I i
~ --_ -- ~
~~fb-~~~~~~ ----- shycshy7FiIf Elii=s FUP WRmiddot 75t3~ n JIilIeia
~------------
[JAs]
-II
I J
[dAnl
45
~ I 1shy
I
iI shyi t
- - - Imiddot--- ~p -~--~= roc - I
I II i
I I I
~ middot1 I
------J
j I
I I i
i I
1_____ --- I ---------------~
[kAs]
I
I I
I t
I I i
j poundiampl d
rshyl
I i
I
1
I I I
I Il
[bAl]
I~
[bAl)]
I
47
L---------------------- --------------~
[kAp] shy
t
I-- I ~ I i
I
ji I
I -I
I 1 I 1
i
)
~~
~L~--~~---~ - ~ ~
~ -shyY- r i
I
-
1
I I
)
----~ -shy- -- _ ~ ----shy
1 I i i I I
1 I
L ~~~~-~~-~-~~~-~~-gt-= rn~ J ___fi ~ 7 7TZ r~ 5UZs=j -~ l ____-------- _____ __ _ ___________ ________ I
[kAk]
i
I t r ~
--~~ -shy
~~~c~_=--_u ce4 we
I r bull
[gAr)]
~-~ shy
- -~ -~~
~P ~-~~
I ~~
-- bull ~ I - ~~-~~
~-~~~--~ shymiddotT _i
48
-----------------------------l
I I
I I
[rAk]
~_
~ ~--- ~~~-~
j ~~ ~ ~ ~7
~ bull~~middote ri~-is~~~l-IIII-middotlIIIIn---I~-- 41~~~~~ ~
1--=-_---- - - -===--------shy
[sAil]
I
49
_- I I
I -- ----------------shy
~2~~~ ~~
i i I I ~~~~~~~~b ~-
middot_- _ ~~------
j
i ~ at -== l - -- ~-~~it I ax I C1 bullbull~~- shy
I
I i
I I
I 1 I II r I I
-r- --shy
~~-~-~- -~-
-1 l I
I I
[bAs] [PAs]
r-------------------~------------___
[pAl]
I
50
The distribution for the sounds which the informant
produced and recognized as the phoneme 0 ranged on the
vowel ~ha~t from 400-525 hz for formant 1 and from 700~1000
hz for formant 2
CHART V
0
III
t5
lot
S
6
Ie
to
Z7 Zit 9 I 1 I a I z I a 6 6
I
I ~ I
I i II I
j i bull I I
I I I i I
I ~ t
~ ~I I
f I
I ~ f A I I I
j [- V I 1 I I I II ~ I 1 I I
At I
I t I I
V V
V 7
i I Vi( FORMANT I 1 I 1 CHARTI I
I V 3 C41iotc4 ill lUjn~ 01 eycpr ~0It4
i I f I IV
I ) I V IO 6 centltcrs 1 octcv1 I I I 5miU~ -Istmi-toneI
I I VII 2 I ltQshy t 116 IV
FOlUlUfT CRBT
Placing a single point Oll this chart is ampn assertion that formants have been observed at two frequencies (me iormant at the frequency nametl ~ong the right or left edge the other tonnant at the frequency named along the top or bottom edge
Ishy
51
r--- -_-__ - --------shy
-- ~--- --shy~ -
--f -~-
[tOll][pOn]
~ ---- -11lt1 ~
~-- - -~ P---~Amiddot_
t _ __ _
1 r I
--1 i I
I
I ~~~J L____ _ 1 rshy
[dOs] [b0s]
i Imiddot
52
---------------------~---
i I r -------- --------shy
r~~middot-~ [
I V I ~~
I - shy
~~~middottdmiddot~~-~-middot~-
S~~i~~-~ ~- bmiddotmiddotmiddotL _____middot_ ~_
[bOr] [rOk]
I
1 I
i i
j
I
[dOpJ[pOl]
53
Ii --~ --~--- -~~~~--=- I r
~ ~- ~ - ~ - shyI - -~ ~~ -~~ I
-1bullbull - h ~~~
~~~ ~ ~~~~----- ~~-~~~-~- ~--~~~~L- ~bullbull
I middot~-~middotdf r scr ~~~~~
~-laquo~~-==~~~-~~--~~~~ ~~
I
[lOs]
I
I
r I
i 1
i 1
I I J_____~ __ _-_M___J
[bOn]
54
i -~----
I I I r r
~-~ -shy
[bOn][sOp]
jI ----II I J
i
I I I
I I I i
I~~~==it shy
[jOk][tQr)]
55
1 I
I
II I I I
I c ~~~~~~~~ ~~OOWJI~~=U
[lOh]
i I
I
I ~~~-
I ~- -- shyl - _- ~ shy
I ~n=~~-~middot ~FlR T =Iti 1amp11 dill_
__-J
[pOt]
__J pOs]
1
- =xu
[bOk]
I
56
The distribution for the sounds which the informant
produced and recognized as the phoneme lUI range~ on the
vowel
hz for foimant
chart in an
1
almost square-like pattern from
and from 700-1000 hz for formant
250-350
2
CHART VI
lui fIG
3
t
ts
~
la
Il
IT zt 20 IS
I I
I I
i j
I
I j
I I
I
I I I
I t I I I1
I J I I I
~ i I LJ J I~
I
I
I
la -I
10
I
I I I 1
t I I i
I
I
I I
I
I I I
I ~ 1 v I)
V V
qV
FOlUfANT atRT lt
8 6
I t lt
~
I
l --~ I--- ~I I
i
I I
I I I i ltiI I
I i ~
I t
V
V V l( FORMANT I V CHART V
V Caiote4 iramp 1umb_ ef cycipampf on4
6 CelItlmctcrs bull octclv SmiUitoctamprs -I a~i-tonl
PlaciDg a single point on this chart is an assertion that formants have been observed at two frequencies one formant at the frequency named along ~he right or eft ede the other fonnant at the frequency named along the top or bottom edge
I
57
I
I
I -I
I
j _-
~~ -
-
bull I -
[dUp]
t I ~
~
I middot1
f
IshyIj II
I i
-------=shyI ~~-- -
L ~~-=-r--~~-III--=---
58
i middot1 I
I
i j I Imiddot
I~1 middotU~ _ s
I ~~~~~_-_-~--~ --_ I
L~ __________~_____________~ [CUll]
I
I
[dUr]
I
I J
I
I I
II
1
-yen ~ L___________ ~__ ~=~
I [kUs][pUn]
59
I
I
i L ~ -----------~-
____---shy______---2
~~~ -~ _
j ~---
I~~~-~-~ ~~ ~~
[nUn] [lUp]
I 1
~-=-~ ~~ -
[rlhn]
I
60
l
- _ ~~-----
~~~~~ JlCIIPrl fue rm ad I II
L ~ [gUI)] [kUk]
e_
__ ~ e-
~-d~~~~
[lUs] [jUs]
61
shy
I
Iii lEI and A Compa~ed
In comparing the distributions of the vowels III lEI
and IA( cf Chart VII on p 62 it is evident from the plots
that the front-back tongue position is for all practical
purposes identical ie the core distribution for all
three phonemes ranges between 1600-2000 hz This demonshy
strates conclusively that the significant phonetic differshy
ence is tongue h~igth ie t~e position of formant 1
The fact of phonemi~overlap is illustrated by the
crosshatching on Chart VII The cross-hatched area represhy
sents a r~nge of phonetic quality that is identified in one
instance as an III and in another instance as an IE or in
one instance as an lEI and in another instance as an IA
bullbullbull the sounds which follow one another in a changing sequence constitute the signals of speech and these sounds are produced by movements of the vocal apparashytus i e by movements of the lips tongue throat lungs and so on It is therefore important to understand that these vocal movements caused by the various muscles involved tend to slur into one anothshyer Since each variation of movement gives a varishyation in sound the slurring of movements produces a slurring of sounds Furthermore since specific sound will have different slurs of moveme~t depend~ ing upon the movement which it precedes or folloItJs each sound type resul tant from the productive moveshyments will vary somewhat according to the sounds which it precedes or follows (Pike 1947)
In line with this the next logical step would be to
look for environmental influences which would enable a listshy
ener to determine which phoneme was represented when phones
were recorded in the overlap area
62
CHART VII
lIlt lEI and A Compared
~ 2[7
t5
lot
5
ft
fA
Ie
Zit I zp 16 I a la 8 6
t I
~
II V I I I I +
r l~ ~ ~ I
I I ~ ~ V I I 1shy fZ I I t s
) I I j I I I
i ~ I 1 1 I I _lgt
V ~R R-r--~ I V
ItV l(
I I---I-
V~ j shy ~
I I I I FORMANTI I
I I VV CHARTI II I V S CaliL-tcd I Uut
I I I l of fIelc F- 0114
I I I I I j i I 10 ecentImeters 1oct4v
I
I ~ V Smillimctus Iumrton_ j VII
2f1 2~ 16 ltv
FOlUlANT ClIABl
Placing single point on this chart is an assertion that io-rnants have been observed at wo frequencies one formant at the frequency named ~ong the right or left edge the other formant at the frequency named along the top or bottom edge
63
A fairly thorough study of the positions of various
vowel sounds in specific environments did not indicate any
consistent variations of a particular type For example
the vowel in dim is in the lower range for the vowelIII
but the EI in dem is in the upper range -of the vowel lEI
Thus it seems probable that those sounds in the overlap area
are qualities for which minimal contrasts do not exist For
example the II in sih is in the overlap area but appar-middot
ently is clearly recognizable by a native sp~aker because
there is no seh at least no such word was known to the
informaht nor could one be found in the dictionary (Echols
and Shadily 1968)
IU and 0 Compared
In contrast with the front vowels III IE and IAI
the back vowels Iu and 0 have aconsiderable gap plusmn50
hz between the1r two distributions cf Chart VIII on
p 64 The distributions appear directly above one another
on the chart In comparing the two ranges it is appa~ent
that the front-ba~k position formant 1 is identical ie
the core distribution for the phoneme ranges from 700-1000
hz This demonstrates that ~he position of formant 1 ie
tongue height is the significant phonetic difference
64
CHART VI I I
U and 0 Compared
I I
i
5
~
5
6
til
~
2[1
I
Zit zp 15 IZ la a 6
~ I -~
1 ~ ~ ~
~
I V 1
V
I V ~
JIll ~
I I 1 6
1 middotV V l(
vI( FORMANT CHART
9 CalLOt-ctc4 ift 1awuutb of cyc14 p ICCOftI
I~ I V 6 eentllMtcrs 1 octo
I V 5mmi~ - ampImitenI VII
214 I 210 16 IV FOlUfANT CE1ART
PJaciDc a single point on this chart is an assertion that formants have been observed at two frequencies one form3nt at the frequency named along the right or left edge the other formant at the frequency named along the top or bottom edge
middotr I
65
II lEI IAI lUI and 101 Compared
In comparing all three phonemes in their respective
poJition on the vowel chart cf Chart IX an p 66 there I
se~ms to be no problem identifying between front and back
vowels There is a gap of approximately 400 hz between
th$ two back vowels and the three front vowels in terms of I
fotment 2 Also it would appear that there would be no
pr~blem in identifying specific vowel qualities so far as
fOfmant position is concerned for vowels in stressed position
with the exception of the phonemic overlapping discussed in
a preceding section ie III-lEI and IE-A
I
I
Imiddot I
CHART IX
I 1 E IA U and 0 Compared I
iM zr Ztt ap J 6 I Z 10 S 6
I I f ts I
~
tj1- ~
rL ~ ~
J 4- 1 ~ ~ i~ ~ V
Ii ~W~ V I ~~ ~ J
V I ~ ~
IS I ~ V 5 1 t
~
s ~ I I f
V R ~ r-~ I V
if~ V ~ ~
-- V 7
~ -~ [a ti I l( FORMANT
V CHART
V 0 cyclu on4 S CaULntte4 ilt hWldr_
I
Kl I jmiddotV I j V 10 6 centlrMtcll1 oct4v
V 5llIil(lCtampn ~ hl4Imiton
Vii 2~ zkgt 116 I IIyen
I
Forw~ CllABT I
Placing a single point on this chart is an assertion that formants have been observed I at two frequencies one formant at the frequency named along the rignt or left edgeI
the other formant at the frequency named along the top or bottom edge
~ ~ bull -
66
I
I I j
Cbull
I I
i
CHAPTER V I SUMMARY AND CONCLUSIONI
I As is shown on Chart IX on p 66 there appears to I I
bela very discernable distribution for each of the vowel I
Phtnemes of Bahasa Indonesia This does not mean that the
ci cumscriptions of each of the various sounds indicate I
detinite border lines for each vowel Rather it shows i
th~ position o~ each vowel in relation to the other vowel
phbnemes The vowel charts show the position of the phonemes
i asl produceq by one native speaker of the language Thus
nJ conclusions can and should ~e made regarding the definite
oJter boundaries of the ranges of middotp~onemes As is implied I
b~ the term ranges the phonemes have no defined boundarshy
I i~s
i Bahasa Indonesia does not appear to have two front I
v~wels two back vowels and one central vowel as is implied
i+I
the traditional symbolization Rather it has three i
ftont vowels with a three-way contrast between high mid I
i a~d low and a two-way contrast of high vs mid in the back
a1ea of~he articulation chart If a traditional symbolshy
i~ation of the vowel phonemes of the language were now to
b~ dawn it would look like the following chart I I I
68
front central back
high
mid
low
I
U
E 0
A
Thus as has been demonstrated the impressionistic
sion of the vowel system was in error with regards to
central phoneme of the language investigated There
a ears to be no low-central phoneme in the language
r it is a low-front one Although the spectrograph
c nnot establish a phonemic system of a language on its
o n it can provide a yes or no answer about the phoneshy
t c qualities of the phonemes in question After a phoneshy
m c system has been established the spectrograph can proshy
v de phonetic data which distinguishes one phoneme from
a other
BIBLIOGRAPHY
Sources Cited
Almiddotsjahbana Takdir The Indonesian Language - By-product of Nationalism Pacific Affairs XXII (1949)388-92
Am rican University Area Handbook for Indonesia Washingshyton DC ~S Government Printing Office 1970
Blch B and G Trager Outline of Linguistic Analysis Baltimore Waverly Press 1942
Du n H K Calculation of vowel resonances Journal of the Acoustic Society of America XXII (1950) 740-53
ols John M and Hassan Shadily An Indonesian-Enqlish Dictionary Ithaca Cornell University Press 1963
ner C Reserches sur la structure des voyelles orashyles Archives Neerlander Phonetic Experiments XX (1947) 40-77
obson Roman C Gunnar Fant and Morris Halle Prelimshyinaries of Speech Analysis Cambridge MIT Press shy1961
J s Martin Acoustic Phonetics Baltimore Linguistic Society of America 1948
L defoged Peter Three Areas of Experimental Phonetics London Oxford University Press 1967
P Mario Glossary of Linguistic Terminology New York Columbia University Press 1966
Perce Joe E The Spectrographic Study ~f Vocalic Nuclei Language Learning XII (1963) 241-247
- --- Phonemic Theory and the Analysis of English Syllashybic Nuclei Linguistics XVII (1965) 36-57
P ke Kenneth L Phonemics Ann Arbor University of Michigan Press 1947
70
Pi e t Kenneth L Phonetics Ann Arbor University of Michigan Press t 1943
Pu gram Ernst Introduction to the Spectrography of Speech New York Dover Publications 1966
ir Edward Language An Introduction to the Study of Speech New York Harcourt Brace amp Co 1921
enbeck E M Indonesia and Malaysia 1I Current Trends in Linguistics IIX (1967) 55-111
dman Dorothy The Republic of Indonesia New York N Y Philosophical LibrarYt Inc 1955
Sources Consulted
r e j e v N D bull Some ProbIem s 0 f Baha s a In don e s i a Ph a nshyology Studia Linguistica XI (~1957) 44-46
lingmiddotC L Linguistic Units The Hague~ Mouton amp Co 1960
J obson t R Hague
and M Halle Mouton amp Co
Fundamentals 1956
of Language The
K nedy Raymond Bibliography of Indonesian Peoples and Cultures New Haven Yale University Press 1962
Perce Joe E Spectrographic Study of English Vowels Under Primary Stress Linguistics LXXXIV (1-972) 41-84
P ttert Ralph K George A Kopp and Harriet C Green Visible Speech New York Dover Publications t 1966
T euw A Critical Survey of Studies on Malay and Bahasa Indonesia The Hague Martinus Nyhoff 1961
-basin
-head of an area
-form of address
-ball bag
-bell
ba --bank I
bUr --you I
bi --beer
bomiddot--drill I
ba--bliJss
bi --bus i
I t
bo I
--bunch bun~le i I
ba--crossbeam
--bomb
--tire
--son of
--ration coupon bond
--garbage dump
--checkered design
--inch
--and plus
APPENDIX A
LIST OF WORDS
den~-abbrev of the title raden
dar--olace location
dur--pearl
das--a shot
dos--small box
dek--deck
dik--younger sibling
dep--to b~ shelved
dop--hubcap
dup-~to be baptized
djak--jug
djok--seat
djas--coat
djus--part of the Koran
gang--paBsageway hall
gung--gong
kak--form of address for elder
kik--handloom
kuk--collar harness
kar--map
kir--jo test
kas ~money supply i
kus -to hiss spit I
lahi-alreadY
loh-writing tablet
lapi -towel I
lup -magnifving glass or
last -IrJeld i oint
lesl -lessonI
lOs -shed I
I I
-to iron
-which who
nu -yonder
po
pa --pole
pa --to fit
pe --plague I
po --mail I
pel --cap
pOI --pot
--pound
--also
r --shelf
--shirt
g-o-rank position
g--ring
--brake
rum--cream
sah--valid legal
sih--an enclitic usedmiddotto soften what follows
san--form of address far sargeant
sen--cent
sang--superior
seng--zinc
sap--line row
sep--chief boss
sop--soup
sjak--suspicion doubt
sjok--attractive
tang--tongs pincer~
ting--sweet meat
tong--barrel vatmiddot
teh--tea
toh--yet nevertheless
tjeng--molasses
tjung--young boy
III 1
APPENDIX E
LINGUISTIC SYMBOLIZATION USED
IAI~high-front-openIi
II
~ r
E~-mid-front-~pen
III
AA-low-front-op~n t1
o1-mid-back-open
Uf-high~baCk-close III
I III
~~~vd bilabial stop
[dj~vd alveolar stop l
I I
[kt-Vl velar stop I
[g I-vd bull velar stop
[1 -lateral I
(n-vd alveolar nasal 1
(m~-vd bilabial nasal
~I-Vd velar nasal
I
III ~IJ
I
q
dl
I
Iil~
I
Vowels
Consonants
[p]-vl bilabial stop shy
[t]-vl alveolar stop
[rJ-vd alveolar flap
[jJ-vd palatal affricate
[CJ-vl palatal affricate
[S]~vl bull alveolar affricatmiddote
[s]-vl alveolar middotfricative
h]- vI velar aspirant
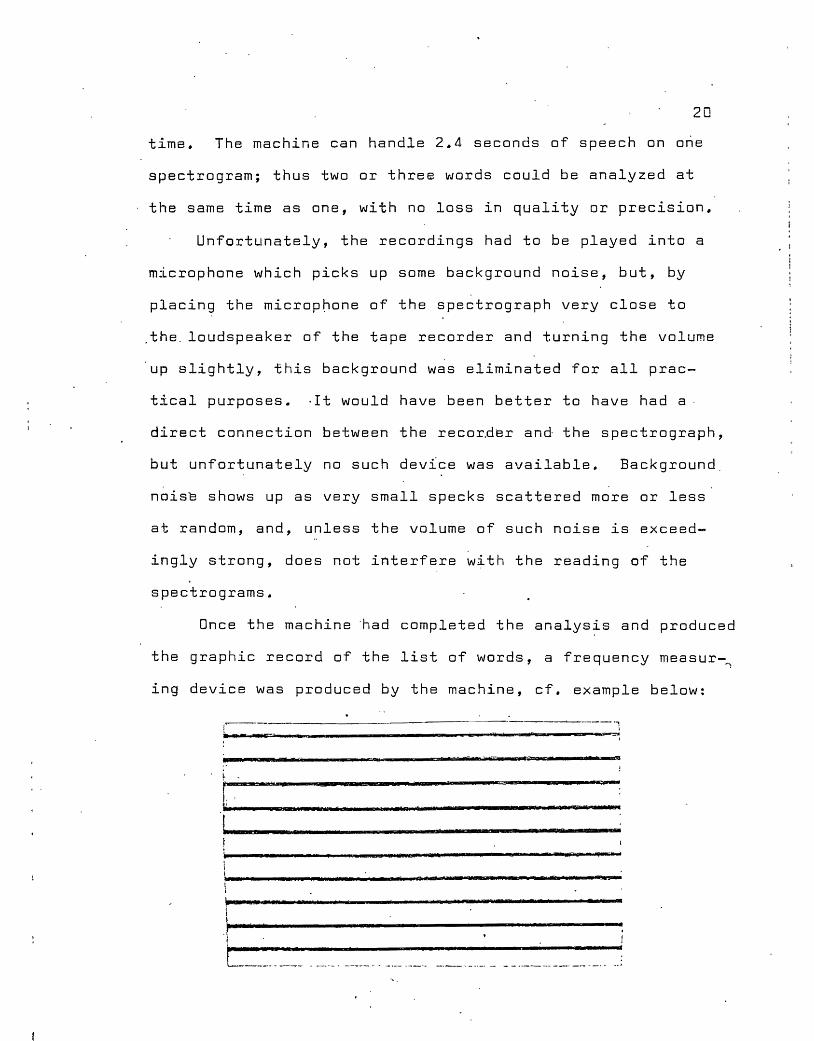
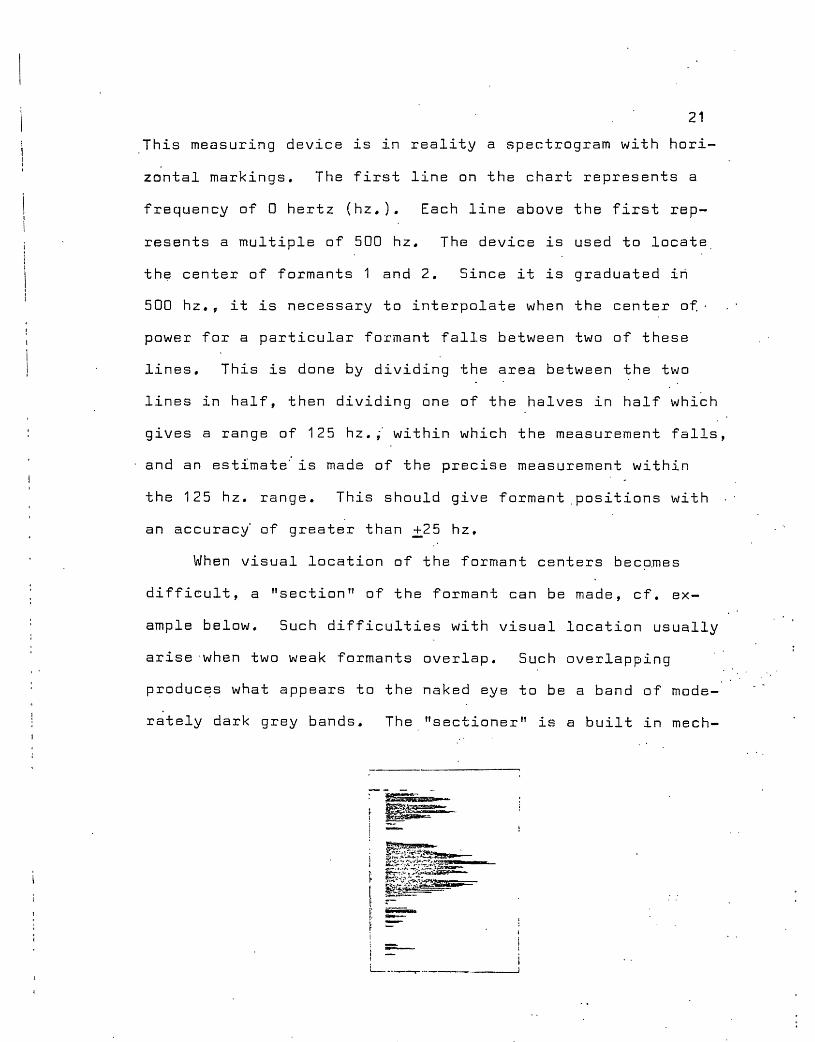
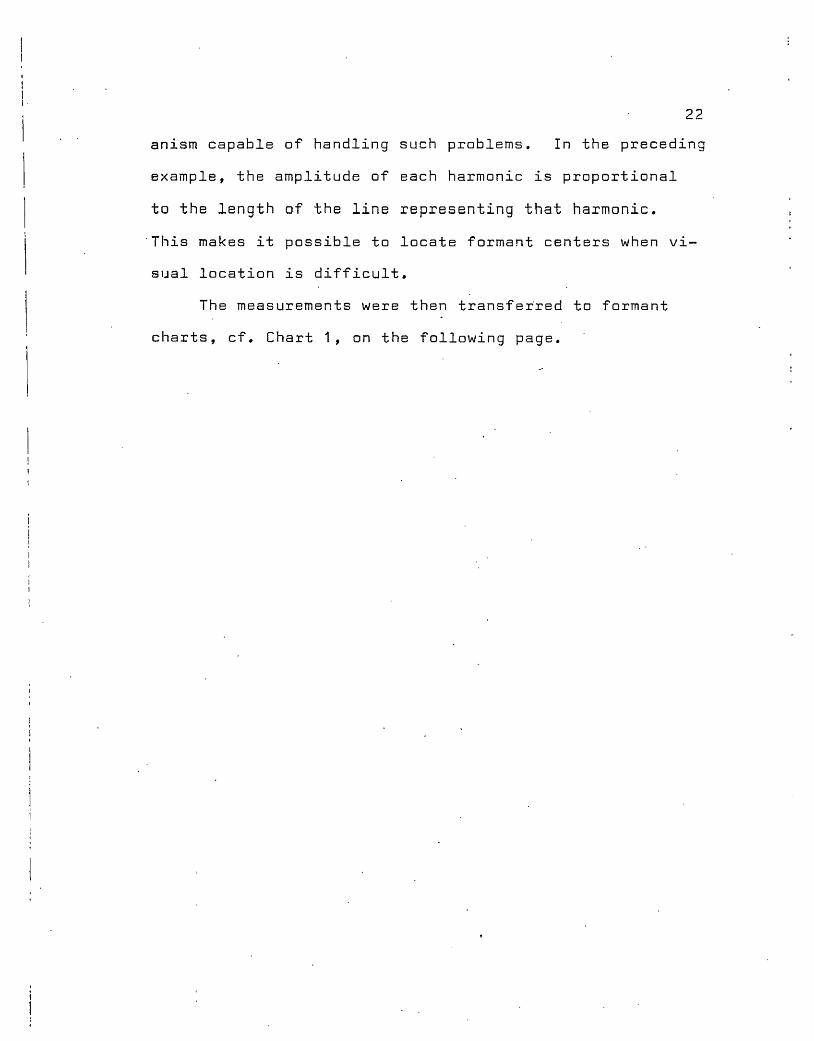
~
I
1 I
22
anism capable of handling such problems In the preceding
I example the amplitude of each harmonic is proportional
to the length of the line representing that harmonic I
This makes it possible to locate formant centers when vi-
I sual location is difficult
The measurements were then transferred to formant
charts cf Chart 1 on the following page
6
23
CHART I
~
t
1+
t5
1amp
Ie
z~ 2t 2p 16 12 la 8 Iii
I ~
~
I S
l I
I I
~
V V
V T
l( FORMANT V CHART
Vi ~ CcdiOrate4 ift luutdnM I V ~ cycle ~ concf
V 10 eeentl~rsI~ V
V U 5millimctcrs - I $milton
2 zk2 lis ty
I
FOlWAlfT CHART
Placing a single point on this cha-t is an assertion that formants have been observed at two frequencies one fOrrUlt at the frequency named along the right or left edge the other formant atmiddotthe frequency named along the top or bottom edge
ex Martin Joos~ Acoustic Phonetics (1948)
CHAPTER IV
FINDINGS
The data provided by the preceding methodology conshy
sisted of a series of scatter patterns on the vowel charts
Each of the dots within the pattern represented one occurshy
rence of a particular vowel To determine the range ofmiddot each
phoneme f the most divergent points in each pattern were con-
nected by a line These lines then circumscribe an area
which included the range of all the vowels in the sample
recognized ~y the informantmiddotas a particular phoneme
Verbal descriptions the actual charts of the phonemes
and the spectrograms utilized willbe found on the followshy
ing pages
25
The distribution for the sounds which the informant
produced and recognized as the phoneme 1 range~ on the
vowel chart in a broad scattering from 300-500 hz for forshy
mant 1 and 1500-2100 hz for formant 2
CHART II
1
lid
13
bull
~
It
iA
Ml
ztr Zit zp 1 S lIZ middot1 I a r 8 6
I
f
I I
Ii 3
[7l I I V 1 I
) ~I I i I bull
V I I i bull r J
I V t I I I I I
i tt I
Kl7 I I I iI ~
I I I I I I I I I i I
I I I i I f I ltII
I I l7 I VI
I [7 1
1 I I I Va FORMANTc7 CHART
I
I I I I 173 CaEiIw-atd icw~[7 rf ltfer C0ItdI I I
j I I I i 7 10 e centlCMta1 oct4v
I V 5miU~ bull itonI
r I f 711 t14 j I I I Ik IV
FoiUlAhT CHRT
Placing asinge point on this chart is an assertion that fortcants have been observed at two frequencies one formant at tn(l frequerlcy nameu Slong the right or eft cdampe the other formant at the frequency named along the top or bottom edge
26
l 1I I - -~
I I iI I
I
[bIs] [bIn]
lt-- -_- -1I
lt i
1 ~ i1_ -shy Ir ~ tmiddotmiddot lt
-- - - ---~--- - - - ----- --
-i -_~ ~ shyI 1
i I I
I I bullbullq_-
I ~~~-~--shyr ~~~~~ -~- I------------------------shy
-----I
[dIm] [sIh]
27
I -[blr]
i1 1 I I
i Ii I
I i I I
ii ___ -J
rmiddot I i
I 1 j
-~ ~~~ ~-~IIlIr~~~
I
1 ____~~l_~~--=~ _ ~--~~~~~~~~~- -
51 hI$ PiiB PD~ii~i
-~ - -- -- ----- ~------- - --- _-- - _ - shy [rIll) [klr]
28
1 I I I
---~S~ -~~~fi~ ~~~~~-~
~l_ middot~ ___
[klk]
I I I
r [dlk]
29
-------- --
-~- shy~--I~~
[tIll]
30
The distribution for the sounds which the informant
produced and recognized as the phoneme lEI ranged on the
vowel chart in a thin oval shaped distribution from 400-625
hz for formant 1 and from 1400-2000 hz for formant 2
CHART III
lEI
i
I
1 I
1
1middot
II~~ 5 I~ I lOa I ~--~~~I-+--+-4-+--+---+--++-+-+-+-+--r--t-t--r--t--r--1
I
I I I I
t I
4
I I 1 I ~ I I I I
I t I ~
I I ~
-r--- r--- I V~~~-r~+-+-~~~+-+-~~~~~~~--T-~-r~-r~-r~-T---T--r~
V~~~++4-~~~-4-+-+~~~~~+-~-T-rV~7
~iA~~~~~I+-~~~~~I--~~~-r~~~~~8 FORMANT HHHH~~r+~~-r~+-~+-~I~-I~~rl7V CHART
I II 11I I V9 CaZiLrww 1ft huncirccLJ
-+-f-+-II-f-+-+-+-+--+-+--+--+----+-+--+-1--t-+-1---t---t--7 rtf eye 04 ~ I 11 V pq-+-+-I~-+--i--+I-t-t--+~i-I---t--+--tr -t--t-Tj-ri~middotltJ ecentimeters 1octGy
I V 5miU~ - aemiton ~~~~I~~+-~~l~-~-T~I~~~r~
t i lt~ I I IS I I liV
FolUlAn C1LBT
Placing a single point on this chart is an assertion T hat rormants have been observed at two frequencies one formant at the frequency namfu along the right or left edge the other formant at the frequency named along the top or bottom edge
31
I I
I ~_ f __
~~~ - - ---~ _-shy
I -- shyI - _v-- _ l
i _~~E~~~~middotmiddotmiddot ~---~--~~-it--_ ~_~ 1gt_ bullbull bull -_gt-~~~ ~ bullI
P~J r_i~=~~~ ~-~~~- - -1 I -----~ -~-~ _ ---_
~~Wa~~Ji~~L ____ __ _____ _
[PEs]
I __ shy
-- --shy
~~ ~ -Qt-shy
-~=-=----
~~~7=~~ L___ __ __ ____ _ ______~
[rFm]
32
[PEt]
bull - -IIot-__
- ---~~--
[dEk]
---
33
f ~
I
) I I
I
I I
I 1 I
I I
I
1
__ -~_~i~~-yen-=-- ~~-~= --
------------------------
[dEn] [sEn]
i
~ ----shybull __ ~
[cEr)]
34
1J i i
~
--~~ ~-
~~
-~- ~ -~ ~~ ~gt-- ~- ~~
I ~IJItt- F ~ 111 i~-~_~--- ~--- - _ =-- 4e -~~~-~_-_~-- _~
bull vf middotmiddot~~tmiddotmiddotl____________________~____ j
[sEp] [bEk]
[bEl]
~ shy~~--_o-
J -~~~
~~t~-~~J~ r~~7~ _
I middot---=i---=-~_4~ __ ~~~~~___I _ _~
~g_i$fj bull - ~-~~~z~ir~~ ~~~ leal -~I_ iiIB
L_________ __~________ _____~
[lEs]
I f
I
35
- --- ---- - ---- ----------
~-------- shy
bull
j
i
[tEll][dan]
[dEp]
36
The distribution for the sounds which the informant
produced and recognized as the phoneme A range~ on the
vowel chart from 600-750 hz for formant 1 and from 1600-2300
hz for formant 2
CHART IV
A
i6
i I I
I I
I I
I I
1 0
I
I I I
I I
I I
s
It
i j I Ii i I
I I
6
~ I 1 I I I I ~
I I I V~ FORMANT ~~~~~I~1~4-+-~~~--~1-+~~I~-~-r17 CHART
~~~~~~l~~~~I~i~~~~I~+I~~lr_I~I~~~$ ~U~~~h~~ ~ I I I I I ~ 7 J eye ptI -cony
1f4-i--~--+---I----t--I-4--~1--+---+--+---+---1-~i7-to e cVltJte1 oct4v
i I I I 1 5miU~ - bull iton ~~~~~~~~~middot~~~~4-~I~I--~+~middoti i
2~ I I
F01UlANT CiLlT
Placing a single point on this chart is an assertion tnlt rorreints have bE-en obsered at two frequencies one formant at the frlquerJcy nSleU aiong he right 01 eft edge the other formant nt the frequency named along the top or bottom edge
37
I I i
-shy
I
I
I
~1iI
p~~~~==~~~~i~~~~
I I
[lAs]
_7 -~
-- -shy
L _ _ _ ____________ --- -- ----_~____J
[nAn]
--------
38
I I
------------------~----I I 11 I I
II1
flt~
I
IJ
L
i
______________________
[sAk]
f
~~ ~--r
1 shy
~~-
-- shy[sAn]
I r 1I I I
t
t
I l I
I I I
I i
I
[sAt)] [sAp]
39
~]
I
I I
[rArl][bAk]
I
-shy ---==-_____lshy___
[lAp ]
40
~----------------------------~-------------~
1 bull -l----1-shy
~middot-~-~t-=-- -
~r-shy -shy t~ III M -~ ~~---shy~t-= ~r=_ _shy
C z---=-
L______________________----- [dAs]
[dAr]
l _
41
v 1
I I
i
I
I -tc - bull ~ 1t iCSi4 _ -
-~~-r~middot- 1 ____ ~~~~ ~ ~ I
1 I ~=~j3~middot7-__ ~~
[kArl
---------------------~------
[dAin]l
I I
-I
I
42
I gt1 tmiddot
I
[bAm]
bull
~ I 1 I
gt1
-- - ___ _ N ____ ~--shy---- shy
[bAn]
43
[lAh]
==III
I Imiddot
__~_--_middotfI_~__ ~ ennee ~ S
LL-
[JAk]
--------- ---------
44
---------
I i Ir I
I I j
i
I i
~ --_ -- ~
~~fb-~~~~~~ ----- shycshy7FiIf Elii=s FUP WRmiddot 75t3~ n JIilIeia
~------------
[JAs]
-II
I J
[dAnl
45
~ I 1shy
I
iI shyi t
- - - Imiddot--- ~p -~--~= roc - I
I II i
I I I
~ middot1 I
------J
j I
I I i
i I
1_____ --- I ---------------~
[kAs]
I
I I
I t
I I i
j poundiampl d
rshyl
I i
I
1
I I I
I Il
[bAl]
I~
[bAl)]
I
47
L---------------------- --------------~
[kAp] shy
t
I-- I ~ I i
I
ji I
I -I
I 1 I 1
i
)
~~
~L~--~~---~ - ~ ~
~ -shyY- r i
I
-
1
I I
)
----~ -shy- -- _ ~ ----shy
1 I i i I I
1 I
L ~~~~-~~-~-~~~-~~-gt-= rn~ J ___fi ~ 7 7TZ r~ 5UZs=j -~ l ____-------- _____ __ _ ___________ ________ I
[kAk]
i
I t r ~
--~~ -shy
~~~c~_=--_u ce4 we
I r bull
[gAr)]
~-~ shy
- -~ -~~
~P ~-~~
I ~~
-- bull ~ I - ~~-~~
~-~~~--~ shymiddotT _i
48
-----------------------------l
I I
I I
[rAk]
~_
~ ~--- ~~~-~
j ~~ ~ ~ ~7
~ bull~~middote ri~-is~~~l-IIII-middotlIIIIn---I~-- 41~~~~~ ~
1--=-_---- - - -===--------shy
[sAil]
I
49
_- I I
I -- ----------------shy
~2~~~ ~~
i i I I ~~~~~~~~b ~-
middot_- _ ~~------
j
i ~ at -== l - -- ~-~~it I ax I C1 bullbull~~- shy
I
I i
I I
I 1 I II r I I
-r- --shy
~~-~-~- -~-
-1 l I
I I
[bAs] [PAs]
r-------------------~------------___
[pAl]
I
50
The distribution for the sounds which the informant
produced and recognized as the phoneme 0 ranged on the
vowel ~ha~t from 400-525 hz for formant 1 and from 700~1000
hz for formant 2
CHART V
0
III
t5
lot
S
6
Ie
to
Z7 Zit 9 I 1 I a I z I a 6 6
I
I ~ I
I i II I
j i bull I I
I I I i I
I ~ t
~ ~I I
f I
I ~ f A I I I
j [- V I 1 I I I II ~ I 1 I I
At I
I t I I
V V
V 7
i I Vi( FORMANT I 1 I 1 CHARTI I
I V 3 C41iotc4 ill lUjn~ 01 eycpr ~0It4
i I f I IV
I ) I V IO 6 centltcrs 1 octcv1 I I I 5miU~ -Istmi-toneI
I I VII 2 I ltQshy t 116 IV
FOlUlUfT CRBT
Placing a single point Oll this chart is ampn assertion that formants have been observed at two frequencies (me iormant at the frequency nametl ~ong the right or left edge the other tonnant at the frequency named along the top or bottom edge
Ishy
51
r--- -_-__ - --------shy
-- ~--- --shy~ -
--f -~-
[tOll][pOn]
~ ---- -11lt1 ~
~-- - -~ P---~Amiddot_
t _ __ _
1 r I
--1 i I
I
I ~~~J L____ _ 1 rshy
[dOs] [b0s]
i Imiddot
52
---------------------~---
i I r -------- --------shy
r~~middot-~ [
I V I ~~
I - shy
~~~middottdmiddot~~-~-middot~-
S~~i~~-~ ~- bmiddotmiddotmiddotL _____middot_ ~_
[bOr] [rOk]
I
1 I
i i
j
I
[dOpJ[pOl]
53
Ii --~ --~--- -~~~~--=- I r
~ ~- ~ - ~ - shyI - -~ ~~ -~~ I
-1bullbull - h ~~~
~~~ ~ ~~~~----- ~~-~~~-~- ~--~~~~L- ~bullbull
I middot~-~middotdf r scr ~~~~~
~-laquo~~-==~~~-~~--~~~~ ~~
I
[lOs]
I
I
r I
i 1
i 1
I I J_____~ __ _-_M___J
[bOn]
54
i -~----
I I I r r
~-~ -shy
[bOn][sOp]
jI ----II I J
i
I I I
I I I i
I~~~==it shy
[jOk][tQr)]
55
1 I
I
II I I I
I c ~~~~~~~~ ~~OOWJI~~=U
[lOh]
i I
I
I ~~~-
I ~- -- shyl - _- ~ shy
I ~n=~~-~middot ~FlR T =Iti 1amp11 dill_
__-J
[pOt]
__J pOs]
1
- =xu
[bOk]
I
56
The distribution for the sounds which the informant
produced and recognized as the phoneme lUI range~ on the
vowel
hz for foimant
chart in an
1
almost square-like pattern from
and from 700-1000 hz for formant
250-350
2
CHART VI
lui fIG
3
t
ts
~
la
Il
IT zt 20 IS
I I
I I
i j
I
I j
I I
I
I I I
I t I I I1
I J I I I
~ i I LJ J I~
I
I
I
la -I
10
I
I I I 1
t I I i
I
I
I I
I
I I I
I ~ 1 v I)
V V
qV
FOlUfANT atRT lt
8 6
I t lt
~
I
l --~ I--- ~I I
i
I I
I I I i ltiI I
I i ~
I t
V
V V l( FORMANT I V CHART V
V Caiote4 iramp 1umb_ ef cycipampf on4
6 CelItlmctcrs bull octclv SmiUitoctamprs -I a~i-tonl
PlaciDg a single point on this chart is an assertion that formants have been observed at two frequencies one formant at the frequency named along ~he right or eft ede the other fonnant at the frequency named along the top or bottom edge
I
57
I
I
I -I
I
j _-
~~ -
-
bull I -
[dUp]
t I ~
~
I middot1
f
IshyIj II
I i
-------=shyI ~~-- -
L ~~-=-r--~~-III--=---
58
i middot1 I
I
i j I Imiddot
I~1 middotU~ _ s
I ~~~~~_-_-~--~ --_ I
L~ __________~_____________~ [CUll]
I
I
[dUr]
I
I J
I
I I
II
1
-yen ~ L___________ ~__ ~=~
I [kUs][pUn]
59
I
I
i L ~ -----------~-
____---shy______---2
~~~ -~ _
j ~---
I~~~-~-~ ~~ ~~
[nUn] [lUp]
I 1
~-=-~ ~~ -
[rlhn]
I
60
l
- _ ~~-----
~~~~~ JlCIIPrl fue rm ad I II
L ~ [gUI)] [kUk]
e_
__ ~ e-
~-d~~~~
[lUs] [jUs]
61
shy
I
Iii lEI and A Compa~ed
In comparing the distributions of the vowels III lEI
and IA( cf Chart VII on p 62 it is evident from the plots
that the front-back tongue position is for all practical
purposes identical ie the core distribution for all
three phonemes ranges between 1600-2000 hz This demonshy
strates conclusively that the significant phonetic differshy
ence is tongue h~igth ie t~e position of formant 1
The fact of phonemi~overlap is illustrated by the
crosshatching on Chart VII The cross-hatched area represhy
sents a r~nge of phonetic quality that is identified in one
instance as an III and in another instance as an IE or in
one instance as an lEI and in another instance as an IA
bullbullbull the sounds which follow one another in a changing sequence constitute the signals of speech and these sounds are produced by movements of the vocal apparashytus i e by movements of the lips tongue throat lungs and so on It is therefore important to understand that these vocal movements caused by the various muscles involved tend to slur into one anothshyer Since each variation of movement gives a varishyation in sound the slurring of movements produces a slurring of sounds Furthermore since specific sound will have different slurs of moveme~t depend~ ing upon the movement which it precedes or folloItJs each sound type resul tant from the productive moveshyments will vary somewhat according to the sounds which it precedes or follows (Pike 1947)
In line with this the next logical step would be to
look for environmental influences which would enable a listshy
ener to determine which phoneme was represented when phones
were recorded in the overlap area
62
CHART VII
lIlt lEI and A Compared
~ 2[7
t5
lot
5
ft
fA
Ie
Zit I zp 16 I a la 8 6
t I
~
II V I I I I +
r l~ ~ ~ I
I I ~ ~ V I I 1shy fZ I I t s
) I I j I I I
i ~ I 1 1 I I _lgt
V ~R R-r--~ I V
ItV l(
I I---I-
V~ j shy ~
I I I I FORMANTI I
I I VV CHARTI II I V S CaliL-tcd I Uut
I I I l of fIelc F- 0114
I I I I I j i I 10 ecentImeters 1oct4v
I
I ~ V Smillimctus Iumrton_ j VII
2f1 2~ 16 ltv
FOlUlANT ClIABl
Placing single point on this chart is an assertion that io-rnants have been observed at wo frequencies one formant at the frequency named ~ong the right or left edge the other formant at the frequency named along the top or bottom edge
63
A fairly thorough study of the positions of various
vowel sounds in specific environments did not indicate any
consistent variations of a particular type For example
the vowel in dim is in the lower range for the vowelIII
but the EI in dem is in the upper range -of the vowel lEI
Thus it seems probable that those sounds in the overlap area
are qualities for which minimal contrasts do not exist For
example the II in sih is in the overlap area but appar-middot
ently is clearly recognizable by a native sp~aker because
there is no seh at least no such word was known to the
informaht nor could one be found in the dictionary (Echols
and Shadily 1968)
IU and 0 Compared
In contrast with the front vowels III IE and IAI
the back vowels Iu and 0 have aconsiderable gap plusmn50
hz between the1r two distributions cf Chart VIII on
p 64 The distributions appear directly above one another
on the chart In comparing the two ranges it is appa~ent
that the front-ba~k position formant 1 is identical ie
the core distribution for the phoneme ranges from 700-1000
hz This demonstrates that ~he position of formant 1 ie
tongue height is the significant phonetic difference
64
CHART VI I I
U and 0 Compared
I I
i
5
~
5
6
til
~
2[1
I
Zit zp 15 IZ la a 6
~ I -~
1 ~ ~ ~
~
I V 1
V
I V ~
JIll ~
I I 1 6
1 middotV V l(
vI( FORMANT CHART
9 CalLOt-ctc4 ift 1awuutb of cyc14 p ICCOftI
I~ I V 6 eentllMtcrs 1 octo
I V 5mmi~ - ampImitenI VII
214 I 210 16 IV FOlUfANT CE1ART
PJaciDc a single point on this chart is an assertion that formants have been observed at two frequencies one form3nt at the frequency named along the right or left edge the other formant at the frequency named along the top or bottom edge
middotr I
65
II lEI IAI lUI and 101 Compared
In comparing all three phonemes in their respective
poJition on the vowel chart cf Chart IX an p 66 there I
se~ms to be no problem identifying between front and back
vowels There is a gap of approximately 400 hz between
th$ two back vowels and the three front vowels in terms of I
fotment 2 Also it would appear that there would be no
pr~blem in identifying specific vowel qualities so far as
fOfmant position is concerned for vowels in stressed position
with the exception of the phonemic overlapping discussed in
a preceding section ie III-lEI and IE-A
I
I
Imiddot I
CHART IX
I 1 E IA U and 0 Compared I
iM zr Ztt ap J 6 I Z 10 S 6
I I f ts I
~
tj1- ~
rL ~ ~
J 4- 1 ~ ~ i~ ~ V
Ii ~W~ V I ~~ ~ J
V I ~ ~
IS I ~ V 5 1 t
~
s ~ I I f
V R ~ r-~ I V
if~ V ~ ~
-- V 7
~ -~ [a ti I l( FORMANT
V CHART
V 0 cyclu on4 S CaULntte4 ilt hWldr_
I
Kl I jmiddotV I j V 10 6 centlrMtcll1 oct4v
V 5llIil(lCtampn ~ hl4Imiton
Vii 2~ zkgt 116 I IIyen
I
Forw~ CllABT I
Placing a single point on this chart is an assertion that formants have been observed I at two frequencies one formant at the frequency named along the rignt or left edgeI
the other formant at the frequency named along the top or bottom edge
~ ~ bull -
66
I
I I j
Cbull
I I
i
CHAPTER V I SUMMARY AND CONCLUSIONI
I As is shown on Chart IX on p 66 there appears to I I
bela very discernable distribution for each of the vowel I
Phtnemes of Bahasa Indonesia This does not mean that the
ci cumscriptions of each of the various sounds indicate I
detinite border lines for each vowel Rather it shows i
th~ position o~ each vowel in relation to the other vowel
phbnemes The vowel charts show the position of the phonemes
i asl produceq by one native speaker of the language Thus
nJ conclusions can and should ~e made regarding the definite
oJter boundaries of the ranges of middotp~onemes As is implied I
b~ the term ranges the phonemes have no defined boundarshy
I i~s
i Bahasa Indonesia does not appear to have two front I
v~wels two back vowels and one central vowel as is implied
i+I
the traditional symbolization Rather it has three i
ftont vowels with a three-way contrast between high mid I
i a~d low and a two-way contrast of high vs mid in the back
a1ea of~he articulation chart If a traditional symbolshy
i~ation of the vowel phonemes of the language were now to
b~ dawn it would look like the following chart I I I
68
front central back
high
mid
low
I
U
E 0
A
Thus as has been demonstrated the impressionistic
sion of the vowel system was in error with regards to
central phoneme of the language investigated There
a ears to be no low-central phoneme in the language
r it is a low-front one Although the spectrograph
c nnot establish a phonemic system of a language on its
o n it can provide a yes or no answer about the phoneshy
t c qualities of the phonemes in question After a phoneshy
m c system has been established the spectrograph can proshy
v de phonetic data which distinguishes one phoneme from
a other
BIBLIOGRAPHY
Sources Cited
Almiddotsjahbana Takdir The Indonesian Language - By-product of Nationalism Pacific Affairs XXII (1949)388-92
Am rican University Area Handbook for Indonesia Washingshyton DC ~S Government Printing Office 1970
Blch B and G Trager Outline of Linguistic Analysis Baltimore Waverly Press 1942
Du n H K Calculation of vowel resonances Journal of the Acoustic Society of America XXII (1950) 740-53
ols John M and Hassan Shadily An Indonesian-Enqlish Dictionary Ithaca Cornell University Press 1963
ner C Reserches sur la structure des voyelles orashyles Archives Neerlander Phonetic Experiments XX (1947) 40-77
obson Roman C Gunnar Fant and Morris Halle Prelimshyinaries of Speech Analysis Cambridge MIT Press shy1961
J s Martin Acoustic Phonetics Baltimore Linguistic Society of America 1948
L defoged Peter Three Areas of Experimental Phonetics London Oxford University Press 1967
P Mario Glossary of Linguistic Terminology New York Columbia University Press 1966
Perce Joe E The Spectrographic Study ~f Vocalic Nuclei Language Learning XII (1963) 241-247
- --- Phonemic Theory and the Analysis of English Syllashybic Nuclei Linguistics XVII (1965) 36-57
P ke Kenneth L Phonemics Ann Arbor University of Michigan Press 1947
70
Pi e t Kenneth L Phonetics Ann Arbor University of Michigan Press t 1943
Pu gram Ernst Introduction to the Spectrography of Speech New York Dover Publications 1966
ir Edward Language An Introduction to the Study of Speech New York Harcourt Brace amp Co 1921
enbeck E M Indonesia and Malaysia 1I Current Trends in Linguistics IIX (1967) 55-111
dman Dorothy The Republic of Indonesia New York N Y Philosophical LibrarYt Inc 1955
Sources Consulted
r e j e v N D bull Some ProbIem s 0 f Baha s a In don e s i a Ph a nshyology Studia Linguistica XI (~1957) 44-46
lingmiddotC L Linguistic Units The Hague~ Mouton amp Co 1960
J obson t R Hague
and M Halle Mouton amp Co
Fundamentals 1956
of Language The
K nedy Raymond Bibliography of Indonesian Peoples and Cultures New Haven Yale University Press 1962
Perce Joe E Spectrographic Study of English Vowels Under Primary Stress Linguistics LXXXIV (1-972) 41-84
P ttert Ralph K George A Kopp and Harriet C Green Visible Speech New York Dover Publications t 1966
T euw A Critical Survey of Studies on Malay and Bahasa Indonesia The Hague Martinus Nyhoff 1961
-basin
-head of an area
-form of address
-ball bag
-bell
ba --bank I
bUr --you I
bi --beer
bomiddot--drill I
ba--bliJss
bi --bus i
I t
bo I
--bunch bun~le i I
ba--crossbeam
--bomb
--tire
--son of
--ration coupon bond
--garbage dump
--checkered design
--inch
--and plus
APPENDIX A
LIST OF WORDS
den~-abbrev of the title raden
dar--olace location
dur--pearl
das--a shot
dos--small box
dek--deck
dik--younger sibling
dep--to b~ shelved
dop--hubcap
dup-~to be baptized
djak--jug
djok--seat
djas--coat
djus--part of the Koran
gang--paBsageway hall
gung--gong
kak--form of address for elder
kik--handloom
kuk--collar harness
kar--map
kir--jo test
kas ~money supply i
kus -to hiss spit I
lahi-alreadY
loh-writing tablet
lapi -towel I
lup -magnifving glass or
last -IrJeld i oint
lesl -lessonI
lOs -shed I
I I
-to iron
-which who
nu -yonder
po
pa --pole
pa --to fit
pe --plague I
po --mail I
pel --cap
pOI --pot
--pound
--also
r --shelf
--shirt
g-o-rank position
g--ring
--brake
rum--cream
sah--valid legal
sih--an enclitic usedmiddotto soften what follows
san--form of address far sargeant
sen--cent
sang--superior
seng--zinc
sap--line row
sep--chief boss
sop--soup
sjak--suspicion doubt
sjok--attractive
tang--tongs pincer~
ting--sweet meat
tong--barrel vatmiddot
teh--tea
toh--yet nevertheless
tjeng--molasses
tjung--young boy
III 1
APPENDIX E
LINGUISTIC SYMBOLIZATION USED
IAI~high-front-openIi
II
~ r
E~-mid-front-~pen
III
AA-low-front-op~n t1
o1-mid-back-open
Uf-high~baCk-close III
I III
~~~vd bilabial stop
[dj~vd alveolar stop l
I I
[kt-Vl velar stop I
[g I-vd bull velar stop
[1 -lateral I
(n-vd alveolar nasal 1
(m~-vd bilabial nasal
~I-Vd velar nasal
I
III ~IJ
I
q
dl
I
Iil~
I
Vowels
Consonants
[p]-vl bilabial stop shy
[t]-vl alveolar stop
[rJ-vd alveolar flap
[jJ-vd palatal affricate
[CJ-vl palatal affricate
[S]~vl bull alveolar affricatmiddote
[s]-vl alveolar middotfricative
h]- vI velar aspirant
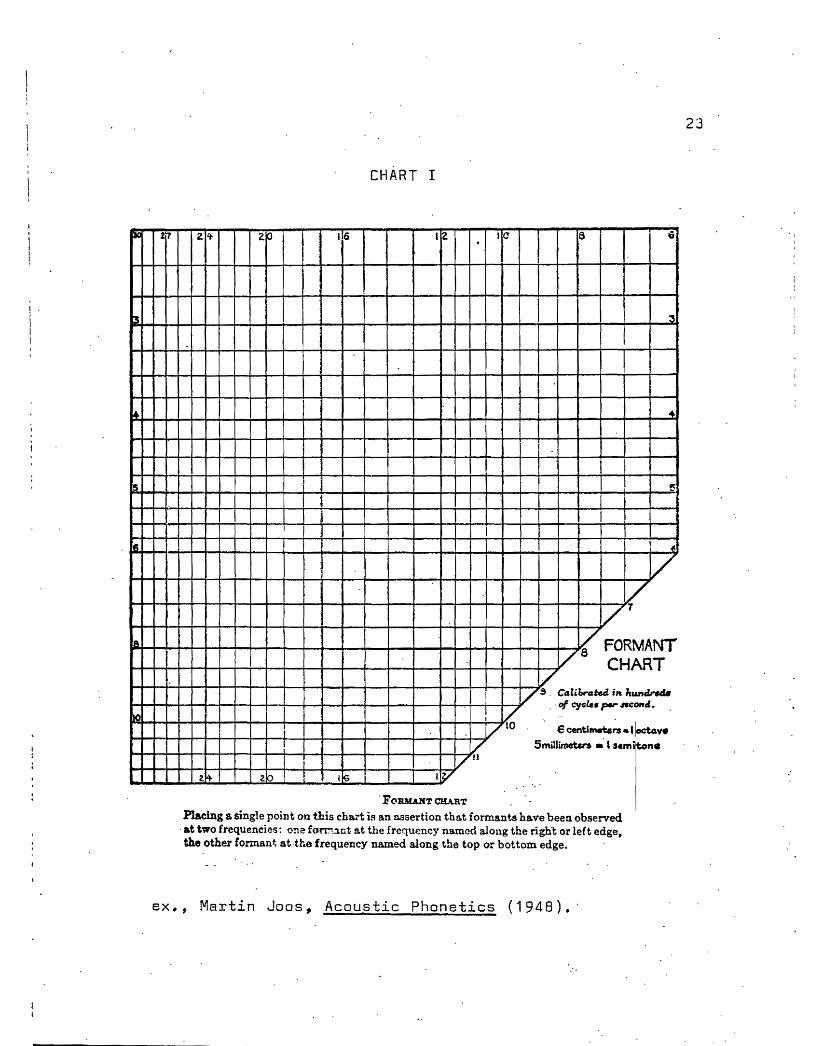
6
23
CHART I
~
t
1+
t5
1amp
Ie
z~ 2t 2p 16 12 la 8 Iii
I ~
~
I S
l I
I I
~
V V
V T
l( FORMANT V CHART
Vi ~ CcdiOrate4 ift luutdnM I V ~ cycle ~ concf
V 10 eeentl~rsI~ V
V U 5millimctcrs - I $milton
2 zk2 lis ty
I
FOlWAlfT CHART
Placing a single point on this cha-t is an assertion that formants have been observed at two frequencies one fOrrUlt at the frequency named along the right or left edge the other formant atmiddotthe frequency named along the top or bottom edge
ex Martin Joos~ Acoustic Phonetics (1948)
CHAPTER IV
FINDINGS
The data provided by the preceding methodology conshy
sisted of a series of scatter patterns on the vowel charts
Each of the dots within the pattern represented one occurshy
rence of a particular vowel To determine the range ofmiddot each
phoneme f the most divergent points in each pattern were con-
nected by a line These lines then circumscribe an area
which included the range of all the vowels in the sample
recognized ~y the informantmiddotas a particular phoneme
Verbal descriptions the actual charts of the phonemes
and the spectrograms utilized willbe found on the followshy
ing pages
25
The distribution for the sounds which the informant
produced and recognized as the phoneme 1 range~ on the
vowel chart in a broad scattering from 300-500 hz for forshy
mant 1 and 1500-2100 hz for formant 2
CHART II
1
lid
13
bull
~
It
iA
Ml
ztr Zit zp 1 S lIZ middot1 I a r 8 6
I
f
I I
Ii 3
[7l I I V 1 I
) ~I I i I bull
V I I i bull r J
I V t I I I I I
i tt I
Kl7 I I I iI ~
I I I I I I I I I i I
I I I i I f I ltII
I I l7 I VI
I [7 1
1 I I I Va FORMANTc7 CHART
I
I I I I 173 CaEiIw-atd icw~[7 rf ltfer C0ItdI I I
j I I I i 7 10 e centlCMta1 oct4v
I V 5miU~ bull itonI
r I f 711 t14 j I I I Ik IV
FoiUlAhT CHRT
Placing asinge point on this chart is an assertion that fortcants have been observed at two frequencies one formant at tn(l frequerlcy nameu Slong the right or eft cdampe the other formant at the frequency named along the top or bottom edge
26
l 1I I - -~
I I iI I
I
[bIs] [bIn]
lt-- -_- -1I
lt i
1 ~ i1_ -shy Ir ~ tmiddotmiddot lt
-- - - ---~--- - - - ----- --
-i -_~ ~ shyI 1
i I I
I I bullbullq_-
I ~~~-~--shyr ~~~~~ -~- I------------------------shy
-----I
[dIm] [sIh]
27
I -[blr]
i1 1 I I
i Ii I
I i I I
ii ___ -J
rmiddot I i
I 1 j
-~ ~~~ ~-~IIlIr~~~
I
1 ____~~l_~~--=~ _ ~--~~~~~~~~~- -
51 hI$ PiiB PD~ii~i
-~ - -- -- ----- ~------- - --- _-- - _ - shy [rIll) [klr]
28
1 I I I
---~S~ -~~~fi~ ~~~~~-~
~l_ middot~ ___
[klk]
I I I
r [dlk]
29
-------- --
-~- shy~--I~~
[tIll]
30
The distribution for the sounds which the informant
produced and recognized as the phoneme lEI ranged on the
vowel chart in a thin oval shaped distribution from 400-625
hz for formant 1 and from 1400-2000 hz for formant 2
CHART III
lEI
i
I
1 I
1
1middot
II~~ 5 I~ I lOa I ~--~~~I-+--+-4-+--+---+--++-+-+-+-+--r--t-t--r--t--r--1
I
I I I I
t I
4
I I 1 I ~ I I I I
I t I ~
I I ~
-r--- r--- I V~~~-r~+-+-~~~+-+-~~~~~~~--T-~-r~-r~-r~-T---T--r~
V~~~++4-~~~-4-+-+~~~~~+-~-T-rV~7
~iA~~~~~I+-~~~~~I--~~~-r~~~~~8 FORMANT HHHH~~r+~~-r~+-~+-~I~-I~~rl7V CHART
I II 11I I V9 CaZiLrww 1ft huncirccLJ
-+-f-+-II-f-+-+-+-+--+-+--+--+----+-+--+-1--t-+-1---t---t--7 rtf eye 04 ~ I 11 V pq-+-+-I~-+--i--+I-t-t--+~i-I---t--+--tr -t--t-Tj-ri~middotltJ ecentimeters 1octGy
I V 5miU~ - aemiton ~~~~I~~+-~~l~-~-T~I~~~r~
t i lt~ I I IS I I liV
FolUlAn C1LBT
Placing a single point on this chart is an assertion T hat rormants have been observed at two frequencies one formant at the frequency namfu along the right or left edge the other formant at the frequency named along the top or bottom edge
31
I I
I ~_ f __
~~~ - - ---~ _-shy
I -- shyI - _v-- _ l
i _~~E~~~~middotmiddotmiddot ~---~--~~-it--_ ~_~ 1gt_ bullbull bull -_gt-~~~ ~ bullI
P~J r_i~=~~~ ~-~~~- - -1 I -----~ -~-~ _ ---_
~~Wa~~Ji~~L ____ __ _____ _
[PEs]
I __ shy
-- --shy
~~ ~ -Qt-shy
-~=-=----
~~~7=~~ L___ __ __ ____ _ ______~
[rFm]
32
[PEt]
bull - -IIot-__
- ---~~--
[dEk]
---
33
f ~
I
) I I
I
I I
I 1 I
I I
I
1
__ -~_~i~~-yen-=-- ~~-~= --
------------------------
[dEn] [sEn]
i
~ ----shybull __ ~
[cEr)]
34
1J i i
~
--~~ ~-
~~
-~- ~ -~ ~~ ~gt-- ~- ~~
I ~IJItt- F ~ 111 i~-~_~--- ~--- - _ =-- 4e -~~~-~_-_~-- _~
bull vf middotmiddot~~tmiddotmiddotl____________________~____ j
[sEp] [bEk]
[bEl]
~ shy~~--_o-
J -~~~
~~t~-~~J~ r~~7~ _
I middot---=i---=-~_4~ __ ~~~~~___I _ _~
~g_i$fj bull - ~-~~~z~ir~~ ~~~ leal -~I_ iiIB
L_________ __~________ _____~
[lEs]
I f
I
35
- --- ---- - ---- ----------
~-------- shy
bull
j
i
[tEll][dan]
[dEp]
36
The distribution for the sounds which the informant
produced and recognized as the phoneme A range~ on the
vowel chart from 600-750 hz for formant 1 and from 1600-2300
hz for formant 2
CHART IV
A
i6
i I I
I I
I I
I I
1 0
I
I I I
I I
I I
s
It
i j I Ii i I
I I
6
~ I 1 I I I I ~
I I I V~ FORMANT ~~~~~I~1~4-+-~~~--~1-+~~I~-~-r17 CHART
~~~~~~l~~~~I~i~~~~I~+I~~lr_I~I~~~$ ~U~~~h~~ ~ I I I I I ~ 7 J eye ptI -cony
1f4-i--~--+---I----t--I-4--~1--+---+--+---+---1-~i7-to e cVltJte1 oct4v
i I I I 1 5miU~ - bull iton ~~~~~~~~~middot~~~~4-~I~I--~+~middoti i
2~ I I
F01UlANT CiLlT
Placing a single point on this chart is an assertion tnlt rorreints have bE-en obsered at two frequencies one formant at the frlquerJcy nSleU aiong he right 01 eft edge the other formant nt the frequency named along the top or bottom edge
37
I I i
-shy
I
I
I
~1iI
p~~~~==~~~~i~~~~
I I
[lAs]
_7 -~
-- -shy
L _ _ _ ____________ --- -- ----_~____J
[nAn]
--------
38
I I
------------------~----I I 11 I I
II1
flt~
I
IJ
L
i
______________________
[sAk]
f
~~ ~--r
1 shy
~~-
-- shy[sAn]
I r 1I I I
t
t
I l I
I I I
I i
I
[sAt)] [sAp]
39
~]
I
I I
[rArl][bAk]
I
-shy ---==-_____lshy___
[lAp ]
40
~----------------------------~-------------~
1 bull -l----1-shy
~middot-~-~t-=-- -
~r-shy -shy t~ III M -~ ~~---shy~t-= ~r=_ _shy
C z---=-
L______________________----- [dAs]
[dAr]
l _
41
v 1
I I
i
I
I -tc - bull ~ 1t iCSi4 _ -
-~~-r~middot- 1 ____ ~~~~ ~ ~ I
1 I ~=~j3~middot7-__ ~~
[kArl
---------------------~------
[dAin]l
I I
-I
I
42
I gt1 tmiddot
I
[bAm]
bull
~ I 1 I
gt1
-- - ___ _ N ____ ~--shy---- shy
[bAn]
43
[lAh]
==III
I Imiddot
__~_--_middotfI_~__ ~ ennee ~ S
LL-
[JAk]
--------- ---------
44
---------
I i Ir I
I I j
i
I i
~ --_ -- ~
~~fb-~~~~~~ ----- shycshy7FiIf Elii=s FUP WRmiddot 75t3~ n JIilIeia
~------------
[JAs]
-II
I J
[dAnl
45
~ I 1shy
I
iI shyi t
- - - Imiddot--- ~p -~--~= roc - I
I II i
I I I
~ middot1 I
------J
j I
I I i
i I
1_____ --- I ---------------~
[kAs]
I
I I
I t
I I i
j poundiampl d
rshyl
I i
I
1
I I I
I Il
[bAl]
I~
[bAl)]
I
47
L---------------------- --------------~
[kAp] shy
t
I-- I ~ I i
I
ji I
I -I
I 1 I 1
i
)
~~
~L~--~~---~ - ~ ~
~ -shyY- r i
I
-
1
I I
)
----~ -shy- -- _ ~ ----shy
1 I i i I I
1 I
L ~~~~-~~-~-~~~-~~-gt-= rn~ J ___fi ~ 7 7TZ r~ 5UZs=j -~ l ____-------- _____ __ _ ___________ ________ I
[kAk]
i
I t r ~
--~~ -shy
~~~c~_=--_u ce4 we
I r bull
[gAr)]
~-~ shy
- -~ -~~
~P ~-~~
I ~~
-- bull ~ I - ~~-~~
~-~~~--~ shymiddotT _i
48
-----------------------------l
I I
I I
[rAk]
~_
~ ~--- ~~~-~
j ~~ ~ ~ ~7
~ bull~~middote ri~-is~~~l-IIII-middotlIIIIn---I~-- 41~~~~~ ~
1--=-_---- - - -===--------shy
[sAil]
I
49
_- I I
I -- ----------------shy
~2~~~ ~~
i i I I ~~~~~~~~b ~-
middot_- _ ~~------
j
i ~ at -== l - -- ~-~~it I ax I C1 bullbull~~- shy
I
I i
I I
I 1 I II r I I
-r- --shy
~~-~-~- -~-
-1 l I
I I
[bAs] [PAs]
r-------------------~------------___
[pAl]
I
50
The distribution for the sounds which the informant
produced and recognized as the phoneme 0 ranged on the
vowel ~ha~t from 400-525 hz for formant 1 and from 700~1000
hz for formant 2
CHART V
0
III
t5
lot
S
6
Ie
to
Z7 Zit 9 I 1 I a I z I a 6 6
I
I ~ I
I i II I
j i bull I I
I I I i I
I ~ t
~ ~I I
f I
I ~ f A I I I
j [- V I 1 I I I II ~ I 1 I I
At I
I t I I
V V
V 7
i I Vi( FORMANT I 1 I 1 CHARTI I
I V 3 C41iotc4 ill lUjn~ 01 eycpr ~0It4
i I f I IV
I ) I V IO 6 centltcrs 1 octcv1 I I I 5miU~ -Istmi-toneI
I I VII 2 I ltQshy t 116 IV
FOlUlUfT CRBT
Placing a single point Oll this chart is ampn assertion that formants have been observed at two frequencies (me iormant at the frequency nametl ~ong the right or left edge the other tonnant at the frequency named along the top or bottom edge
Ishy
51
r--- -_-__ - --------shy
-- ~--- --shy~ -
--f -~-
[tOll][pOn]
~ ---- -11lt1 ~
~-- - -~ P---~Amiddot_
t _ __ _
1 r I
--1 i I
I
I ~~~J L____ _ 1 rshy
[dOs] [b0s]
i Imiddot
52
---------------------~---
i I r -------- --------shy
r~~middot-~ [
I V I ~~
I - shy
~~~middottdmiddot~~-~-middot~-
S~~i~~-~ ~- bmiddotmiddotmiddotL _____middot_ ~_
[bOr] [rOk]
I
1 I
i i
j
I
[dOpJ[pOl]
53
Ii --~ --~--- -~~~~--=- I r
~ ~- ~ - ~ - shyI - -~ ~~ -~~ I
-1bullbull - h ~~~
~~~ ~ ~~~~----- ~~-~~~-~- ~--~~~~L- ~bullbull
I middot~-~middotdf r scr ~~~~~
~-laquo~~-==~~~-~~--~~~~ ~~
I
[lOs]
I
I
r I
i 1
i 1
I I J_____~ __ _-_M___J
[bOn]
54
i -~----
I I I r r
~-~ -shy
[bOn][sOp]
jI ----II I J
i
I I I
I I I i
I~~~==it shy
[jOk][tQr)]
55
1 I
I
II I I I
I c ~~~~~~~~ ~~OOWJI~~=U
[lOh]
i I
I
I ~~~-
I ~- -- shyl - _- ~ shy
I ~n=~~-~middot ~FlR T =Iti 1amp11 dill_
__-J
[pOt]
__J pOs]
1
- =xu
[bOk]
I
56
The distribution for the sounds which the informant
produced and recognized as the phoneme lUI range~ on the
vowel
hz for foimant
chart in an
1
almost square-like pattern from
and from 700-1000 hz for formant
250-350
2
CHART VI
lui fIG
3
t
ts
~
la
Il
IT zt 20 IS
I I
I I
i j
I
I j
I I
I
I I I
I t I I I1
I J I I I
~ i I LJ J I~
I
I
I
la -I
10
I
I I I 1
t I I i
I
I
I I
I
I I I
I ~ 1 v I)
V V
qV
FOlUfANT atRT lt
8 6
I t lt
~
I
l --~ I--- ~I I
i
I I
I I I i ltiI I
I i ~
I t
V
V V l( FORMANT I V CHART V
V Caiote4 iramp 1umb_ ef cycipampf on4
6 CelItlmctcrs bull octclv SmiUitoctamprs -I a~i-tonl
PlaciDg a single point on this chart is an assertion that formants have been observed at two frequencies one formant at the frequency named along ~he right or eft ede the other fonnant at the frequency named along the top or bottom edge
I
57
I
I
I -I
I
j _-
~~ -
-
bull I -
[dUp]
t I ~
~
I middot1
f
IshyIj II
I i
-------=shyI ~~-- -
L ~~-=-r--~~-III--=---
58
i middot1 I
I
i j I Imiddot
I~1 middotU~ _ s
I ~~~~~_-_-~--~ --_ I
L~ __________~_____________~ [CUll]
I
I
[dUr]
I
I J
I
I I
II
1
-yen ~ L___________ ~__ ~=~
I [kUs][pUn]
59
I
I
i L ~ -----------~-
____---shy______---2
~~~ -~ _
j ~---
I~~~-~-~ ~~ ~~
[nUn] [lUp]
I 1
~-=-~ ~~ -
[rlhn]
I
60
l
- _ ~~-----
~~~~~ JlCIIPrl fue rm ad I II
L ~ [gUI)] [kUk]
e_
__ ~ e-
~-d~~~~
[lUs] [jUs]
61
shy
I
Iii lEI and A Compa~ed
In comparing the distributions of the vowels III lEI
and IA( cf Chart VII on p 62 it is evident from the plots
that the front-back tongue position is for all practical
purposes identical ie the core distribution for all
three phonemes ranges between 1600-2000 hz This demonshy
strates conclusively that the significant phonetic differshy
ence is tongue h~igth ie t~e position of formant 1
The fact of phonemi~overlap is illustrated by the
crosshatching on Chart VII The cross-hatched area represhy
sents a r~nge of phonetic quality that is identified in one
instance as an III and in another instance as an IE or in
one instance as an lEI and in another instance as an IA
bullbullbull the sounds which follow one another in a changing sequence constitute the signals of speech and these sounds are produced by movements of the vocal apparashytus i e by movements of the lips tongue throat lungs and so on It is therefore important to understand that these vocal movements caused by the various muscles involved tend to slur into one anothshyer Since each variation of movement gives a varishyation in sound the slurring of movements produces a slurring of sounds Furthermore since specific sound will have different slurs of moveme~t depend~ ing upon the movement which it precedes or folloItJs each sound type resul tant from the productive moveshyments will vary somewhat according to the sounds which it precedes or follows (Pike 1947)
In line with this the next logical step would be to
look for environmental influences which would enable a listshy
ener to determine which phoneme was represented when phones
were recorded in the overlap area
62
CHART VII
lIlt lEI and A Compared
~ 2[7
t5
lot
5
ft
fA
Ie
Zit I zp 16 I a la 8 6
t I
~
II V I I I I +
r l~ ~ ~ I
I I ~ ~ V I I 1shy fZ I I t s
) I I j I I I
i ~ I 1 1 I I _lgt
V ~R R-r--~ I V
ItV l(
I I---I-
V~ j shy ~
I I I I FORMANTI I
I I VV CHARTI II I V S CaliL-tcd I Uut
I I I l of fIelc F- 0114
I I I I I j i I 10 ecentImeters 1oct4v
I
I ~ V Smillimctus Iumrton_ j VII
2f1 2~ 16 ltv
FOlUlANT ClIABl
Placing single point on this chart is an assertion that io-rnants have been observed at wo frequencies one formant at the frequency named ~ong the right or left edge the other formant at the frequency named along the top or bottom edge
63
A fairly thorough study of the positions of various
vowel sounds in specific environments did not indicate any
consistent variations of a particular type For example
the vowel in dim is in the lower range for the vowelIII
but the EI in dem is in the upper range -of the vowel lEI
Thus it seems probable that those sounds in the overlap area
are qualities for which minimal contrasts do not exist For
example the II in sih is in the overlap area but appar-middot
ently is clearly recognizable by a native sp~aker because
there is no seh at least no such word was known to the
informaht nor could one be found in the dictionary (Echols
and Shadily 1968)
IU and 0 Compared
In contrast with the front vowels III IE and IAI
the back vowels Iu and 0 have aconsiderable gap plusmn50
hz between the1r two distributions cf Chart VIII on
p 64 The distributions appear directly above one another
on the chart In comparing the two ranges it is appa~ent
that the front-ba~k position formant 1 is identical ie
the core distribution for the phoneme ranges from 700-1000
hz This demonstrates that ~he position of formant 1 ie
tongue height is the significant phonetic difference
64
CHART VI I I
U and 0 Compared
I I
i
5
~
5
6
til
~
2[1
I
Zit zp 15 IZ la a 6
~ I -~
1 ~ ~ ~
~
I V 1
V
I V ~
JIll ~
I I 1 6
1 middotV V l(
vI( FORMANT CHART
9 CalLOt-ctc4 ift 1awuutb of cyc14 p ICCOftI
I~ I V 6 eentllMtcrs 1 octo
I V 5mmi~ - ampImitenI VII
214 I 210 16 IV FOlUfANT CE1ART
PJaciDc a single point on this chart is an assertion that formants have been observed at two frequencies one form3nt at the frequency named along the right or left edge the other formant at the frequency named along the top or bottom edge
middotr I
65
II lEI IAI lUI and 101 Compared
In comparing all three phonemes in their respective
poJition on the vowel chart cf Chart IX an p 66 there I
se~ms to be no problem identifying between front and back
vowels There is a gap of approximately 400 hz between
th$ two back vowels and the three front vowels in terms of I
fotment 2 Also it would appear that there would be no
pr~blem in identifying specific vowel qualities so far as
fOfmant position is concerned for vowels in stressed position
with the exception of the phonemic overlapping discussed in
a preceding section ie III-lEI and IE-A
I
I
Imiddot I
CHART IX
I 1 E IA U and 0 Compared I
iM zr Ztt ap J 6 I Z 10 S 6
I I f ts I
~
tj1- ~
rL ~ ~
J 4- 1 ~ ~ i~ ~ V
Ii ~W~ V I ~~ ~ J
V I ~ ~
IS I ~ V 5 1 t
~
s ~ I I f
V R ~ r-~ I V
if~ V ~ ~
-- V 7
~ -~ [a ti I l( FORMANT
V CHART
V 0 cyclu on4 S CaULntte4 ilt hWldr_
I
Kl I jmiddotV I j V 10 6 centlrMtcll1 oct4v
V 5llIil(lCtampn ~ hl4Imiton
Vii 2~ zkgt 116 I IIyen
I
Forw~ CllABT I
Placing a single point on this chart is an assertion that formants have been observed I at two frequencies one formant at the frequency named along the rignt or left edgeI
the other formant at the frequency named along the top or bottom edge
~ ~ bull -
66
I
I I j
Cbull
I I
i
CHAPTER V I SUMMARY AND CONCLUSIONI
I As is shown on Chart IX on p 66 there appears to I I
bela very discernable distribution for each of the vowel I
Phtnemes of Bahasa Indonesia This does not mean that the
ci cumscriptions of each of the various sounds indicate I
detinite border lines for each vowel Rather it shows i
th~ position o~ each vowel in relation to the other vowel
phbnemes The vowel charts show the position of the phonemes
i asl produceq by one native speaker of the language Thus
nJ conclusions can and should ~e made regarding the definite
oJter boundaries of the ranges of middotp~onemes As is implied I
b~ the term ranges the phonemes have no defined boundarshy
I i~s
i Bahasa Indonesia does not appear to have two front I
v~wels two back vowels and one central vowel as is implied
i+I
the traditional symbolization Rather it has three i
ftont vowels with a three-way contrast between high mid I
i a~d low and a two-way contrast of high vs mid in the back
a1ea of~he articulation chart If a traditional symbolshy
i~ation of the vowel phonemes of the language were now to
b~ dawn it would look like the following chart I I I
68
front central back
high
mid
low
I
U
E 0
A
Thus as has been demonstrated the impressionistic
sion of the vowel system was in error with regards to
central phoneme of the language investigated There
a ears to be no low-central phoneme in the language
r it is a low-front one Although the spectrograph
c nnot establish a phonemic system of a language on its
o n it can provide a yes or no answer about the phoneshy
t c qualities of the phonemes in question After a phoneshy
m c system has been established the spectrograph can proshy
v de phonetic data which distinguishes one phoneme from
a other
BIBLIOGRAPHY
Sources Cited
Almiddotsjahbana Takdir The Indonesian Language - By-product of Nationalism Pacific Affairs XXII (1949)388-92
Am rican University Area Handbook for Indonesia Washingshyton DC ~S Government Printing Office 1970
Blch B and G Trager Outline of Linguistic Analysis Baltimore Waverly Press 1942
Du n H K Calculation of vowel resonances Journal of the Acoustic Society of America XXII (1950) 740-53
ols John M and Hassan Shadily An Indonesian-Enqlish Dictionary Ithaca Cornell University Press 1963
ner C Reserches sur la structure des voyelles orashyles Archives Neerlander Phonetic Experiments XX (1947) 40-77
obson Roman C Gunnar Fant and Morris Halle Prelimshyinaries of Speech Analysis Cambridge MIT Press shy1961
J s Martin Acoustic Phonetics Baltimore Linguistic Society of America 1948
L defoged Peter Three Areas of Experimental Phonetics London Oxford University Press 1967
P Mario Glossary of Linguistic Terminology New York Columbia University Press 1966
Perce Joe E The Spectrographic Study ~f Vocalic Nuclei Language Learning XII (1963) 241-247
- --- Phonemic Theory and the Analysis of English Syllashybic Nuclei Linguistics XVII (1965) 36-57
P ke Kenneth L Phonemics Ann Arbor University of Michigan Press 1947
70
Pi e t Kenneth L Phonetics Ann Arbor University of Michigan Press t 1943
Pu gram Ernst Introduction to the Spectrography of Speech New York Dover Publications 1966
ir Edward Language An Introduction to the Study of Speech New York Harcourt Brace amp Co 1921
enbeck E M Indonesia and Malaysia 1I Current Trends in Linguistics IIX (1967) 55-111
dman Dorothy The Republic of Indonesia New York N Y Philosophical LibrarYt Inc 1955
Sources Consulted
r e j e v N D bull Some ProbIem s 0 f Baha s a In don e s i a Ph a nshyology Studia Linguistica XI (~1957) 44-46
lingmiddotC L Linguistic Units The Hague~ Mouton amp Co 1960
J obson t R Hague
and M Halle Mouton amp Co
Fundamentals 1956
of Language The
K nedy Raymond Bibliography of Indonesian Peoples and Cultures New Haven Yale University Press 1962
Perce Joe E Spectrographic Study of English Vowels Under Primary Stress Linguistics LXXXIV (1-972) 41-84
P ttert Ralph K George A Kopp and Harriet C Green Visible Speech New York Dover Publications t 1966
T euw A Critical Survey of Studies on Malay and Bahasa Indonesia The Hague Martinus Nyhoff 1961
-basin
-head of an area
-form of address
-ball bag
-bell
ba --bank I
bUr --you I
bi --beer
bomiddot--drill I
ba--bliJss
bi --bus i
I t
bo I
--bunch bun~le i I
ba--crossbeam
--bomb
--tire
--son of
--ration coupon bond
--garbage dump
--checkered design
--inch
--and plus
APPENDIX A
LIST OF WORDS
den~-abbrev of the title raden
dar--olace location
dur--pearl
das--a shot
dos--small box
dek--deck
dik--younger sibling
dep--to b~ shelved
dop--hubcap
dup-~to be baptized
djak--jug
djok--seat
djas--coat
djus--part of the Koran
gang--paBsageway hall
gung--gong
kak--form of address for elder
kik--handloom
kuk--collar harness
kar--map
kir--jo test
kas ~money supply i
kus -to hiss spit I
lahi-alreadY
loh-writing tablet
lapi -towel I
lup -magnifving glass or
last -IrJeld i oint
lesl -lessonI
lOs -shed I
I I
-to iron
-which who
nu -yonder
po
pa --pole
pa --to fit
pe --plague I
po --mail I
pel --cap
pOI --pot
--pound
--also
r --shelf
--shirt
g-o-rank position
g--ring
--brake
rum--cream
sah--valid legal
sih--an enclitic usedmiddotto soften what follows
san--form of address far sargeant
sen--cent
sang--superior
seng--zinc
sap--line row
sep--chief boss
sop--soup
sjak--suspicion doubt
sjok--attractive
tang--tongs pincer~
ting--sweet meat
tong--barrel vatmiddot
teh--tea
toh--yet nevertheless
tjeng--molasses
tjung--young boy
III 1
APPENDIX E
LINGUISTIC SYMBOLIZATION USED
IAI~high-front-openIi
II
~ r
E~-mid-front-~pen
III
AA-low-front-op~n t1
o1-mid-back-open
Uf-high~baCk-close III
I III
~~~vd bilabial stop
[dj~vd alveolar stop l
I I
[kt-Vl velar stop I
[g I-vd bull velar stop
[1 -lateral I
(n-vd alveolar nasal 1
(m~-vd bilabial nasal
~I-Vd velar nasal
I
III ~IJ
I
q
dl
I
Iil~
I
Vowels
Consonants
[p]-vl bilabial stop shy
[t]-vl alveolar stop
[rJ-vd alveolar flap
[jJ-vd palatal affricate
[CJ-vl palatal affricate
[S]~vl bull alveolar affricatmiddote
[s]-vl alveolar middotfricative
h]- vI velar aspirant
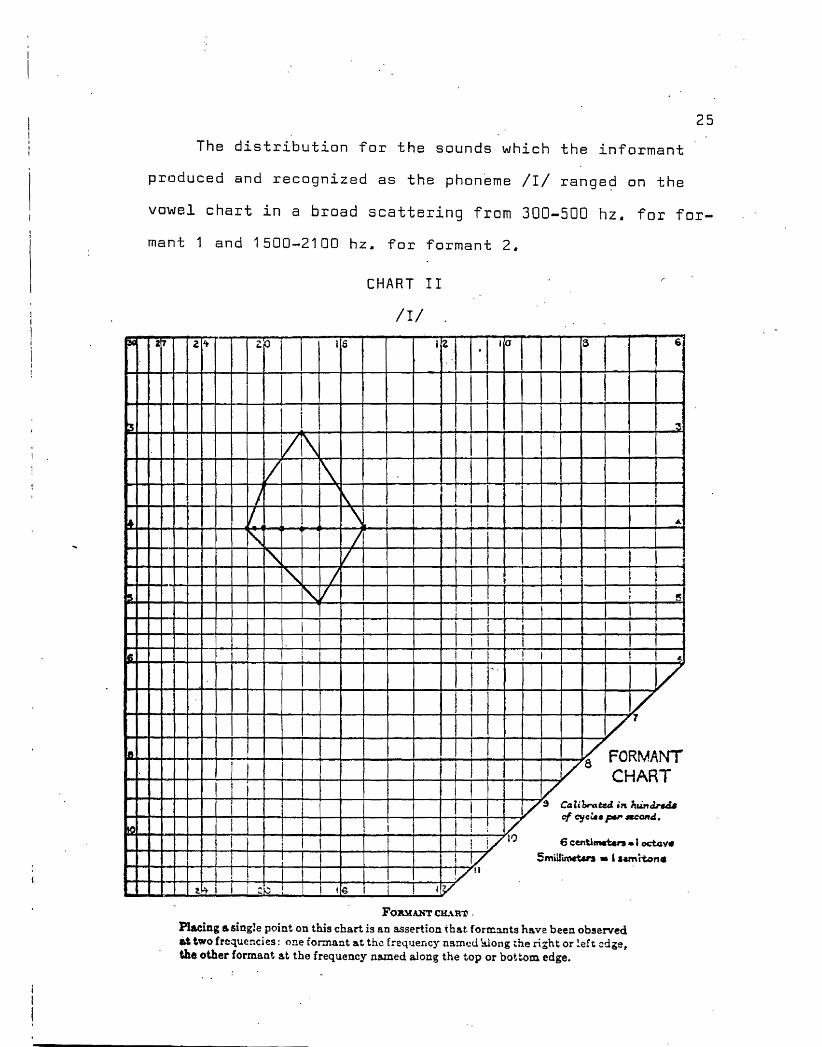
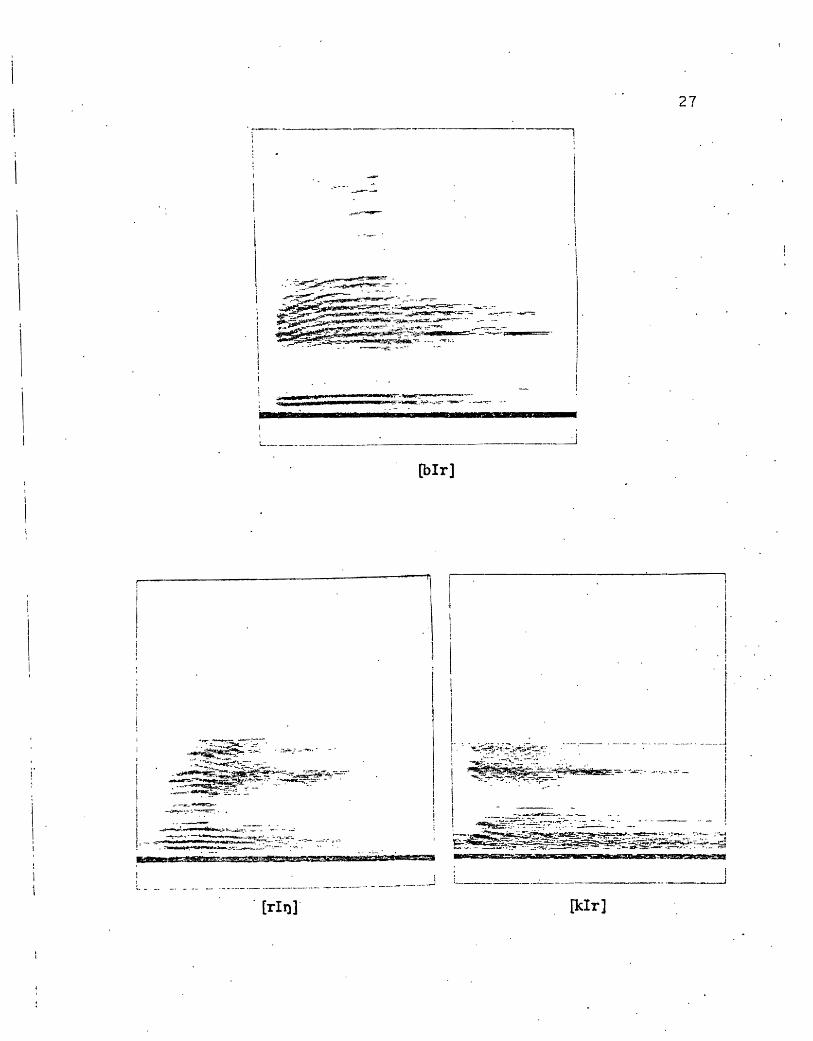
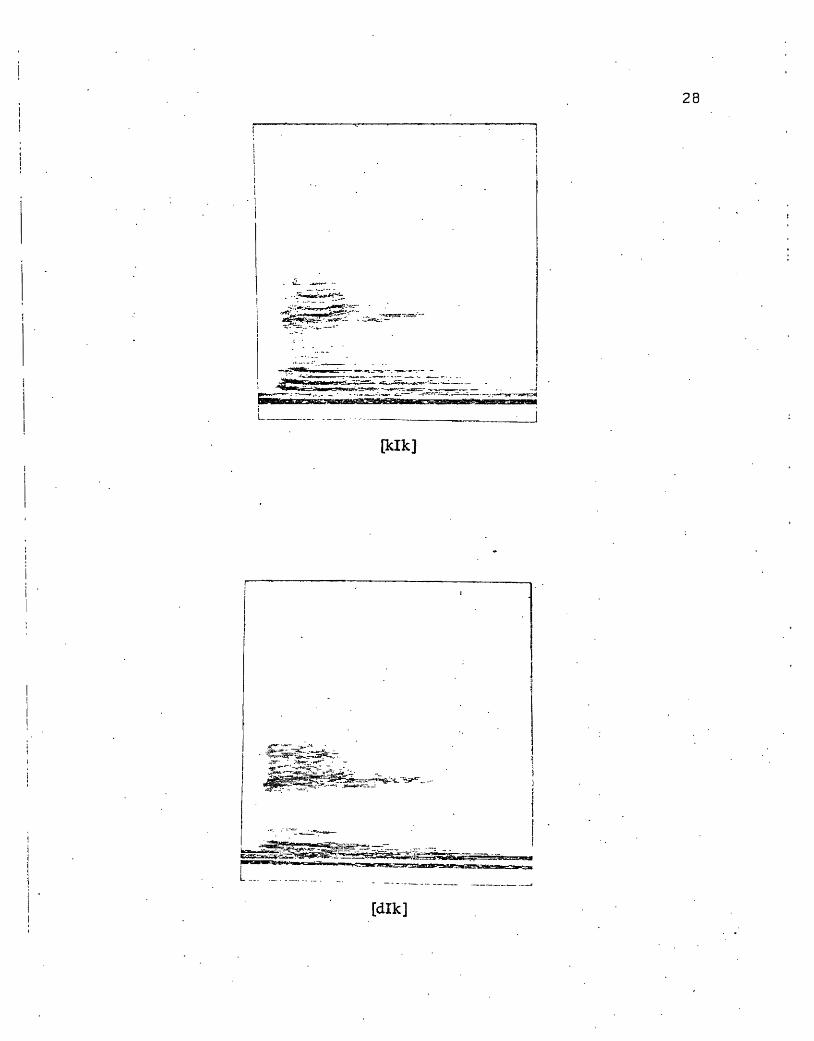
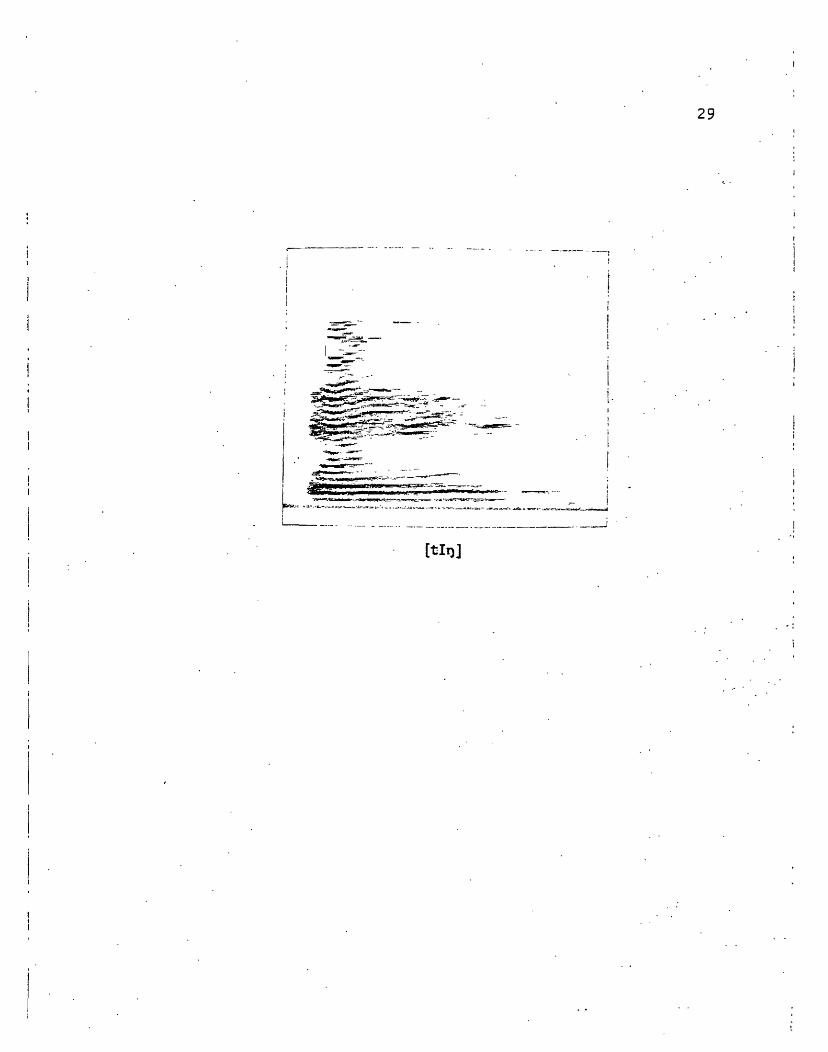
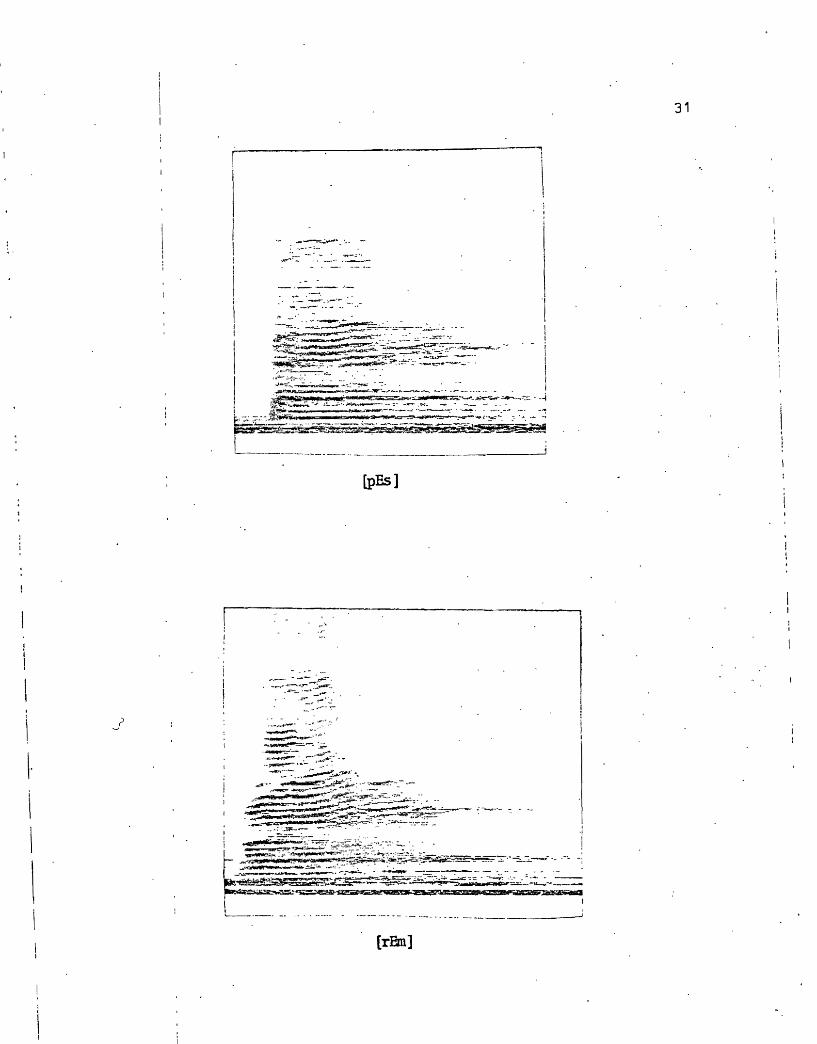
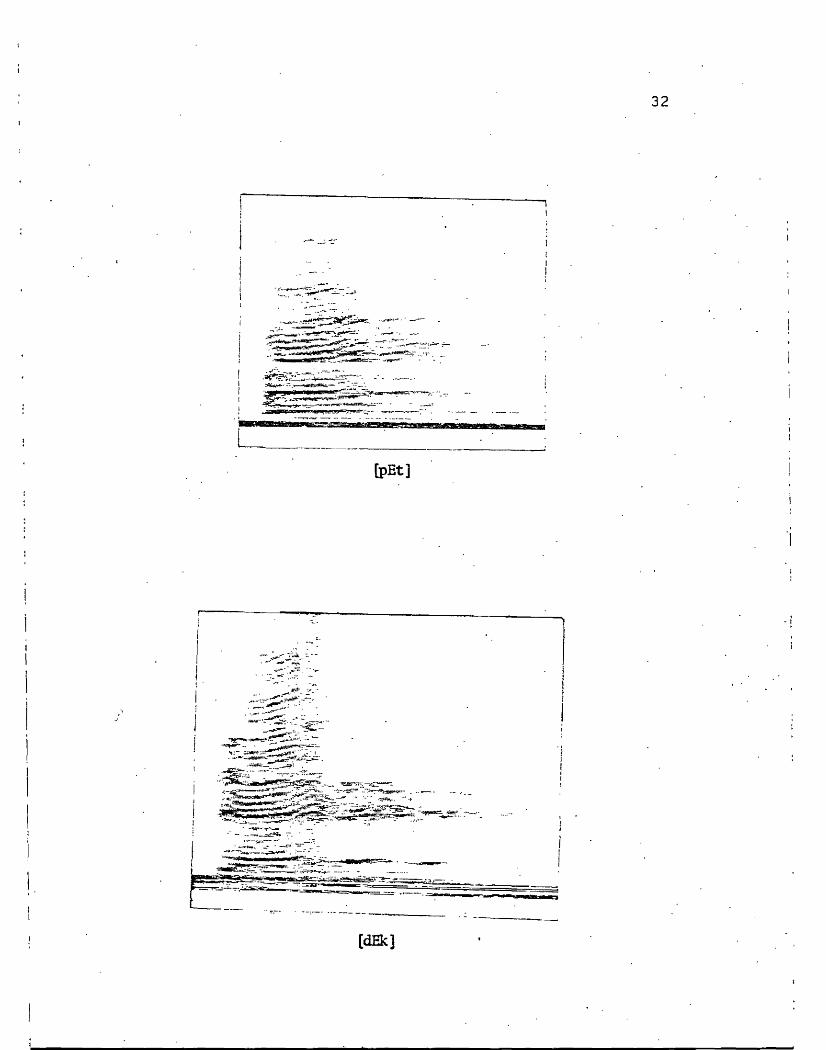
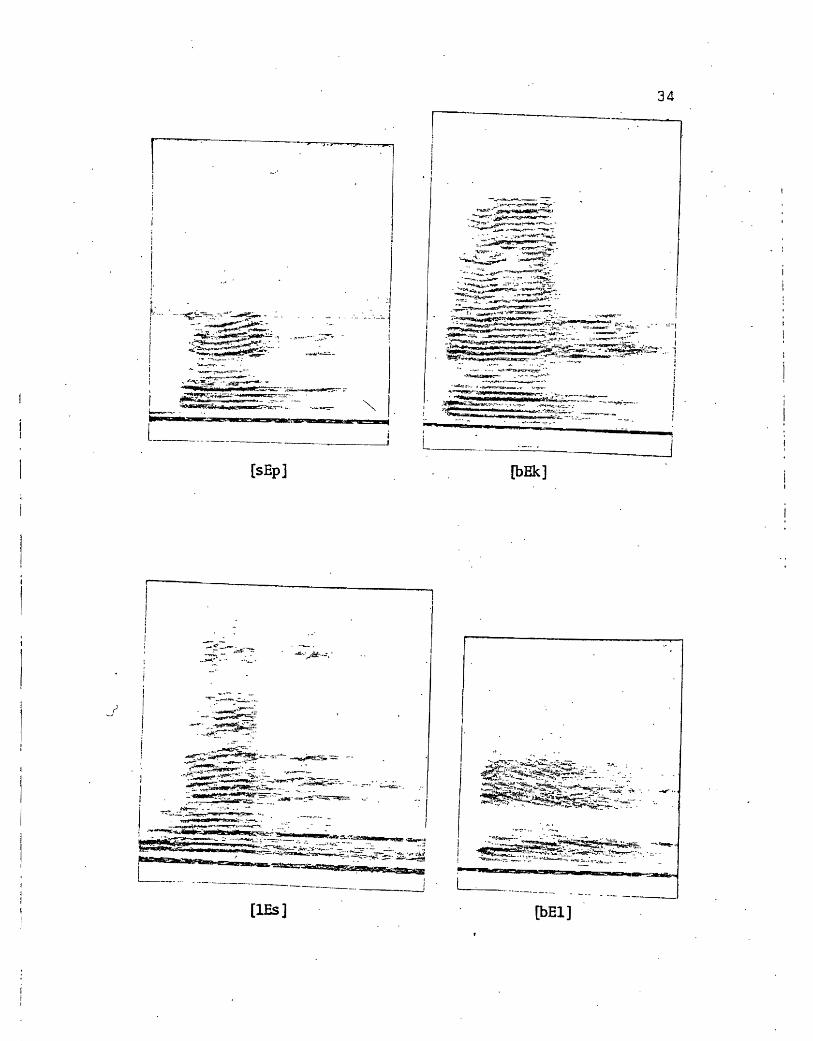
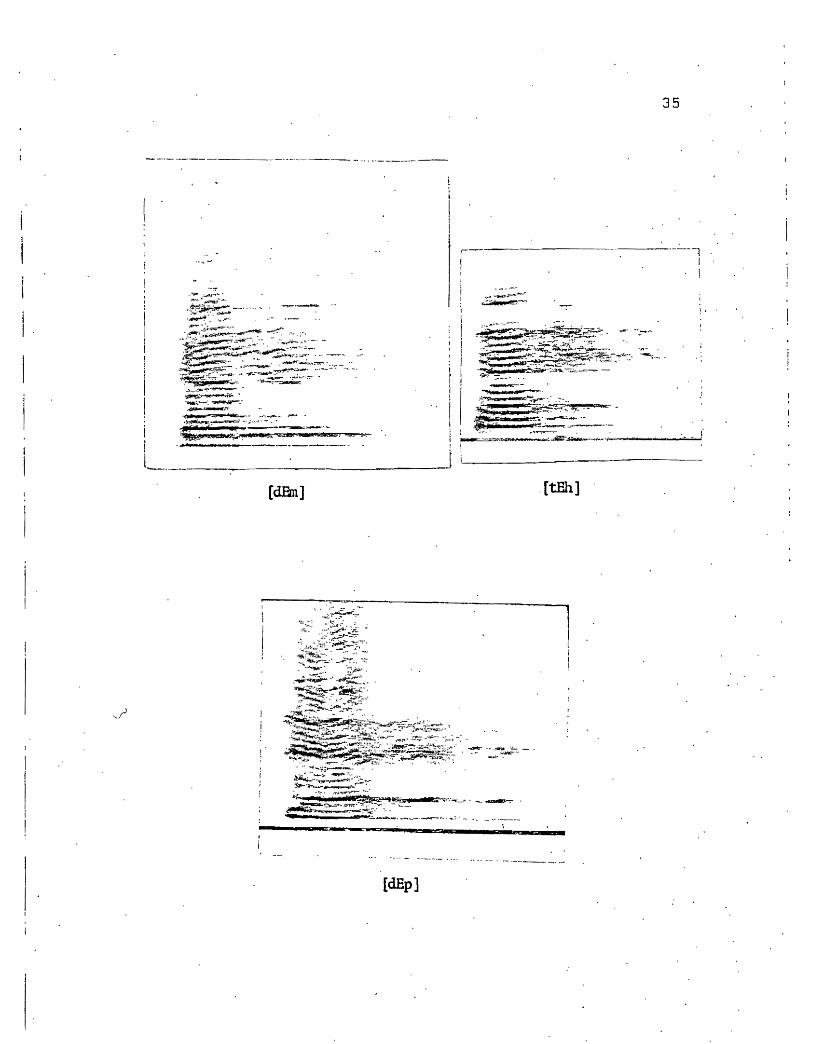
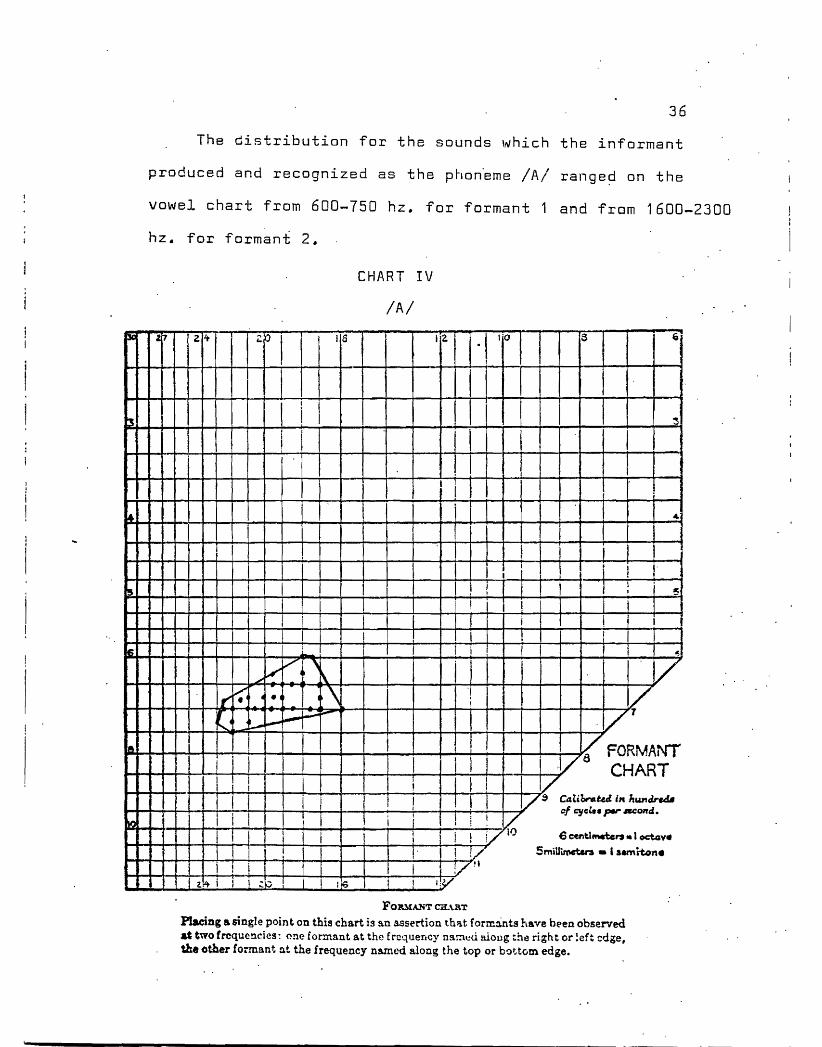
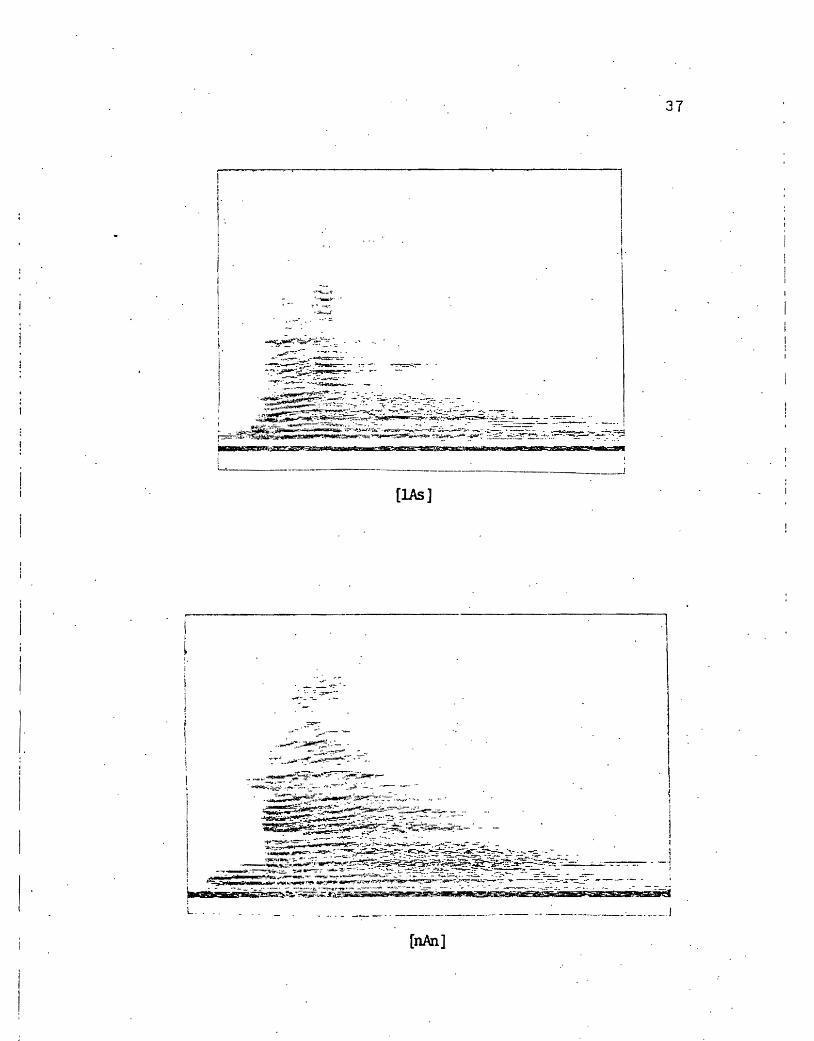
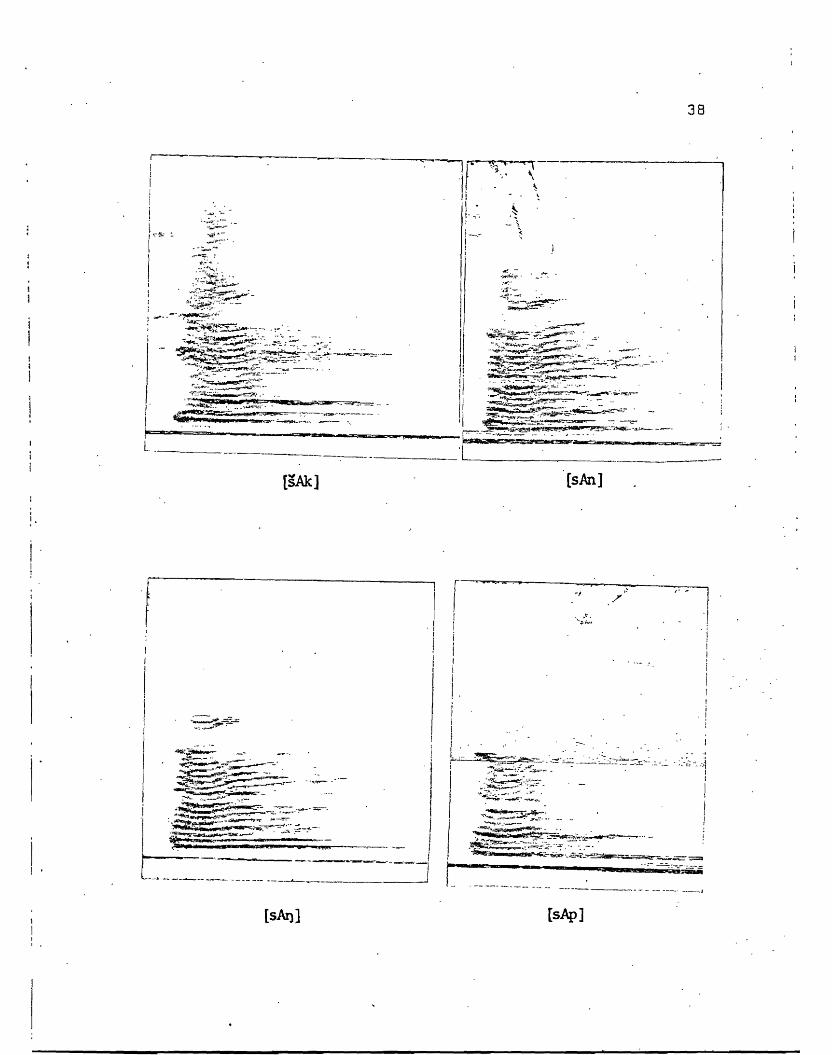
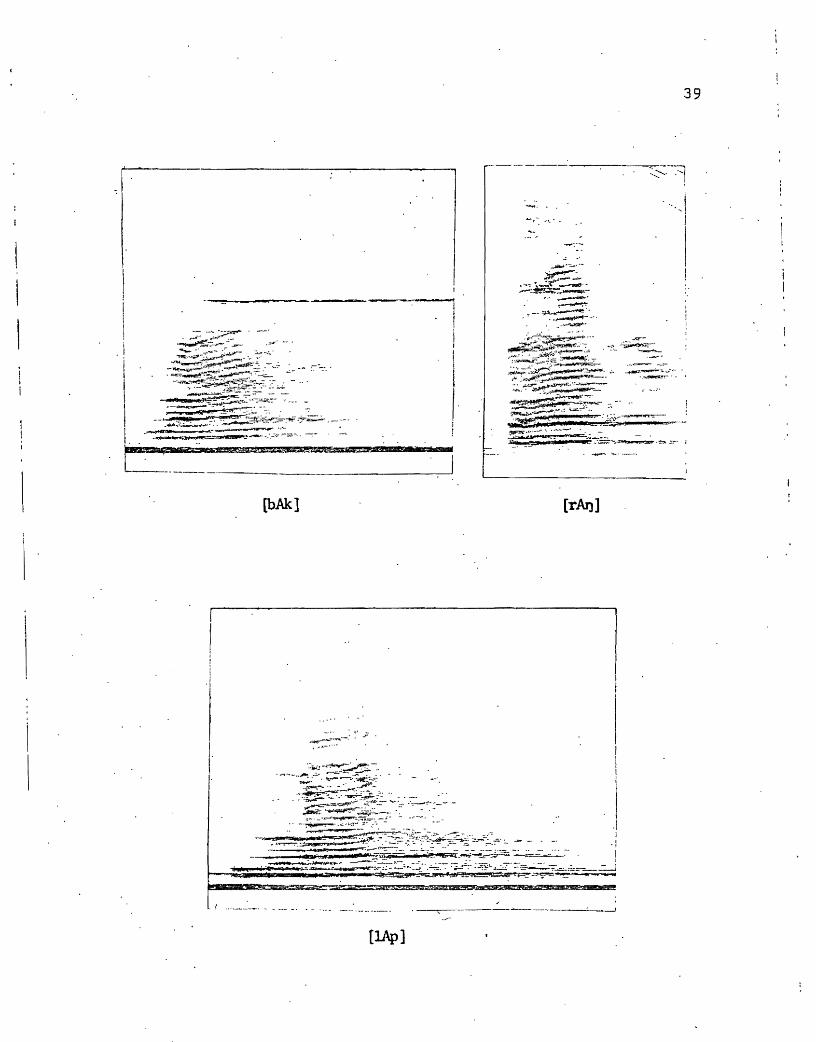
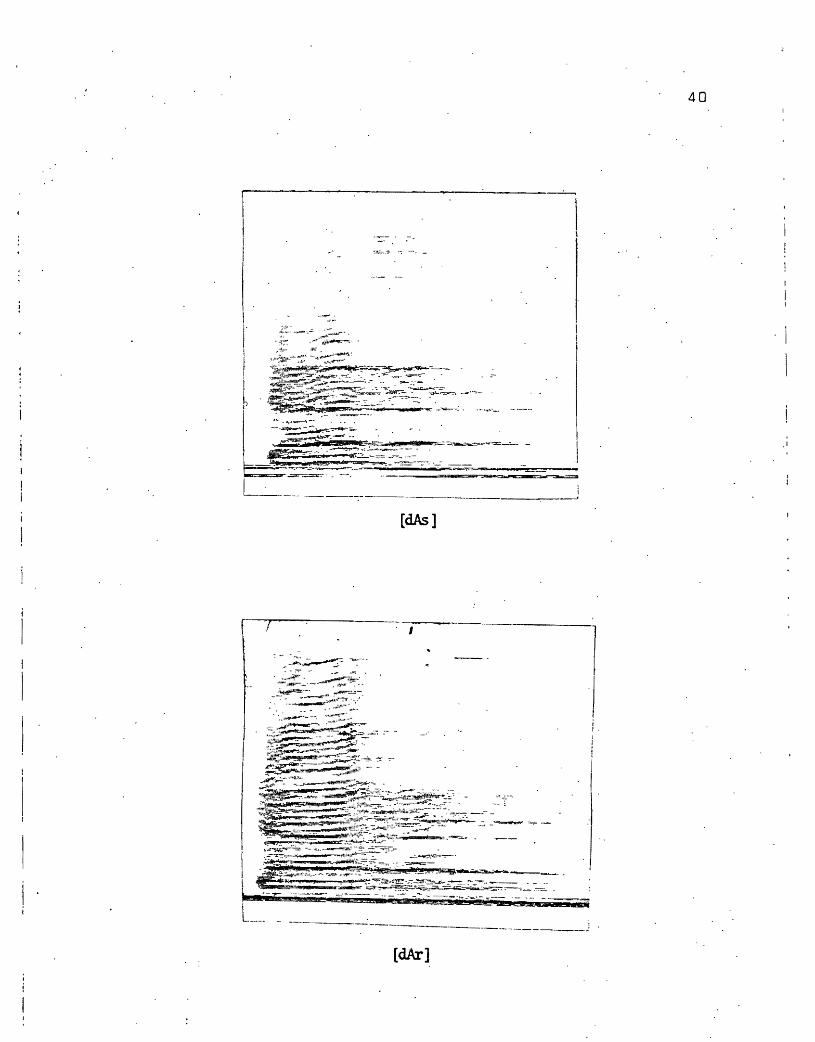
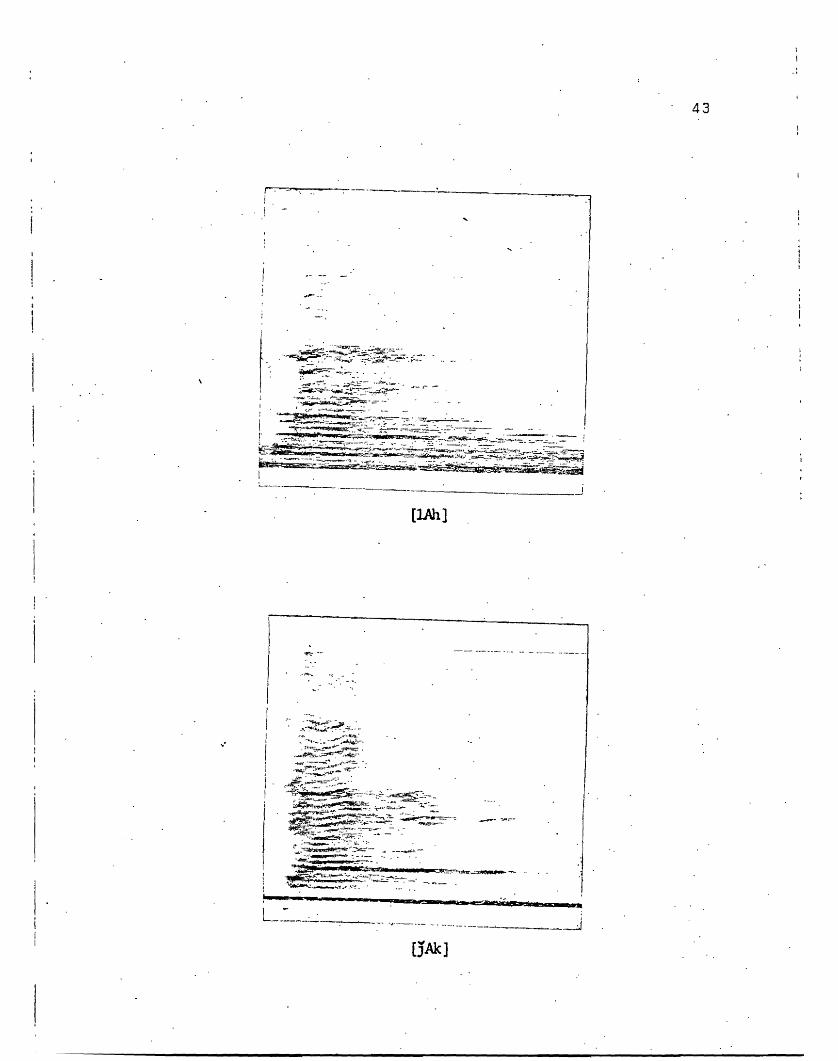
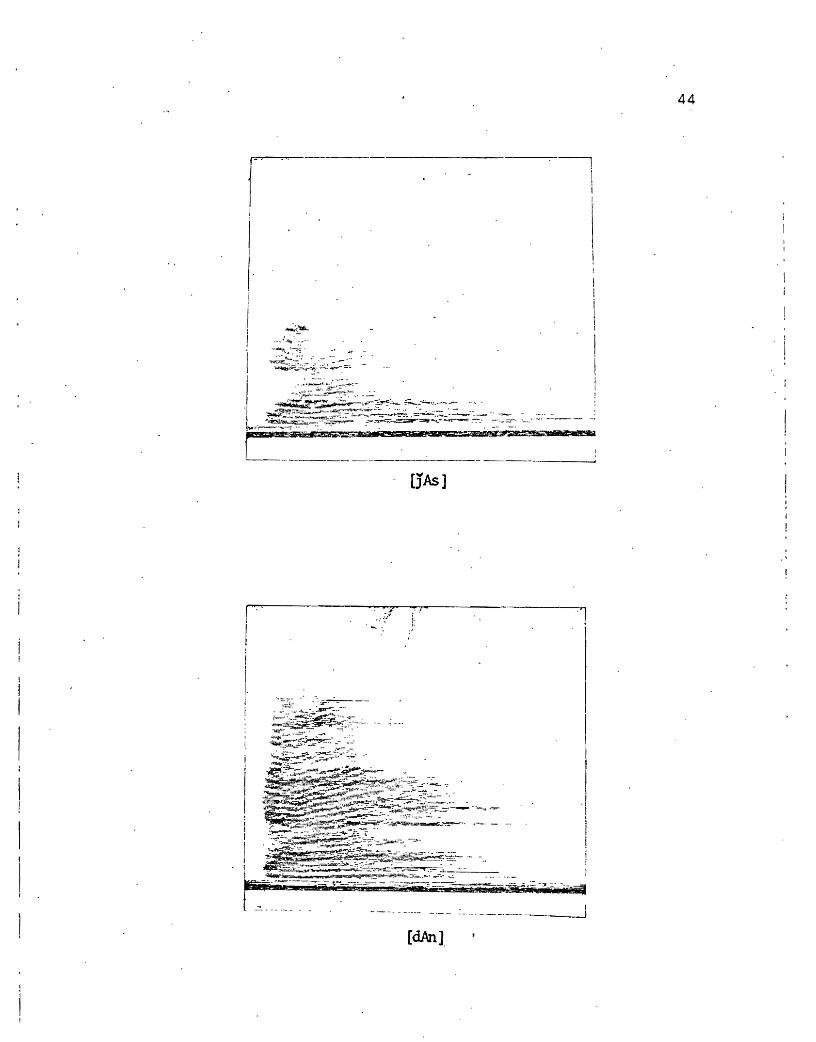
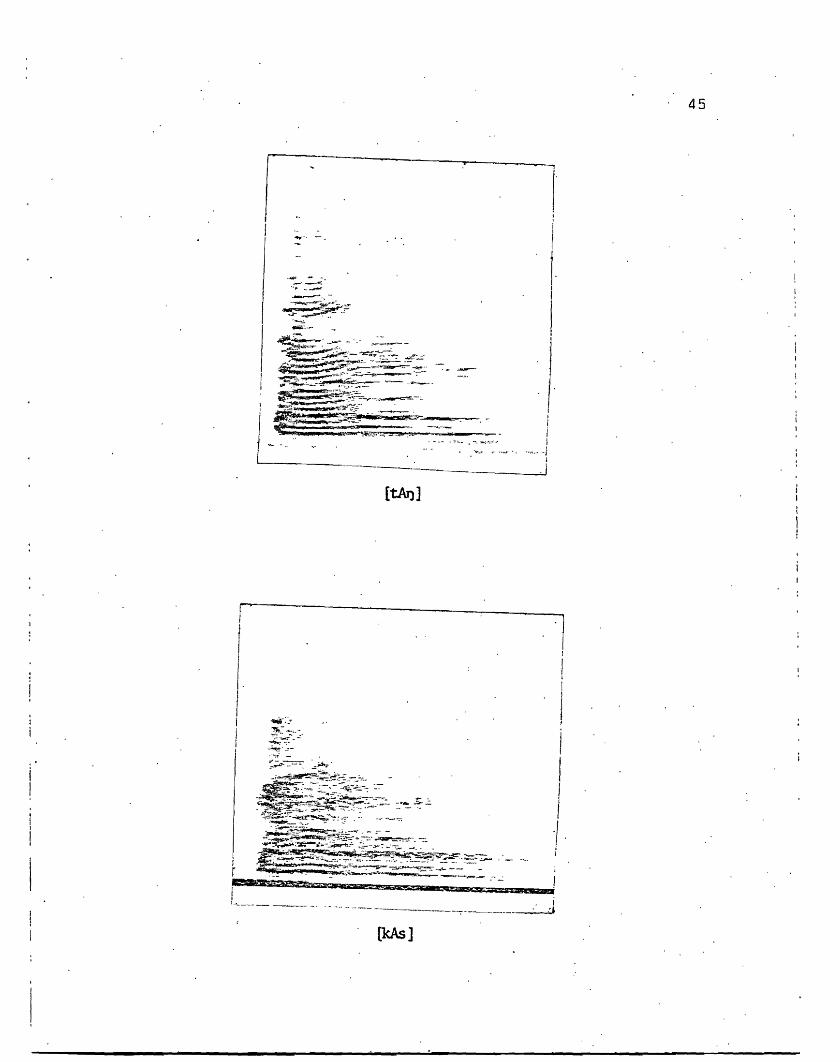
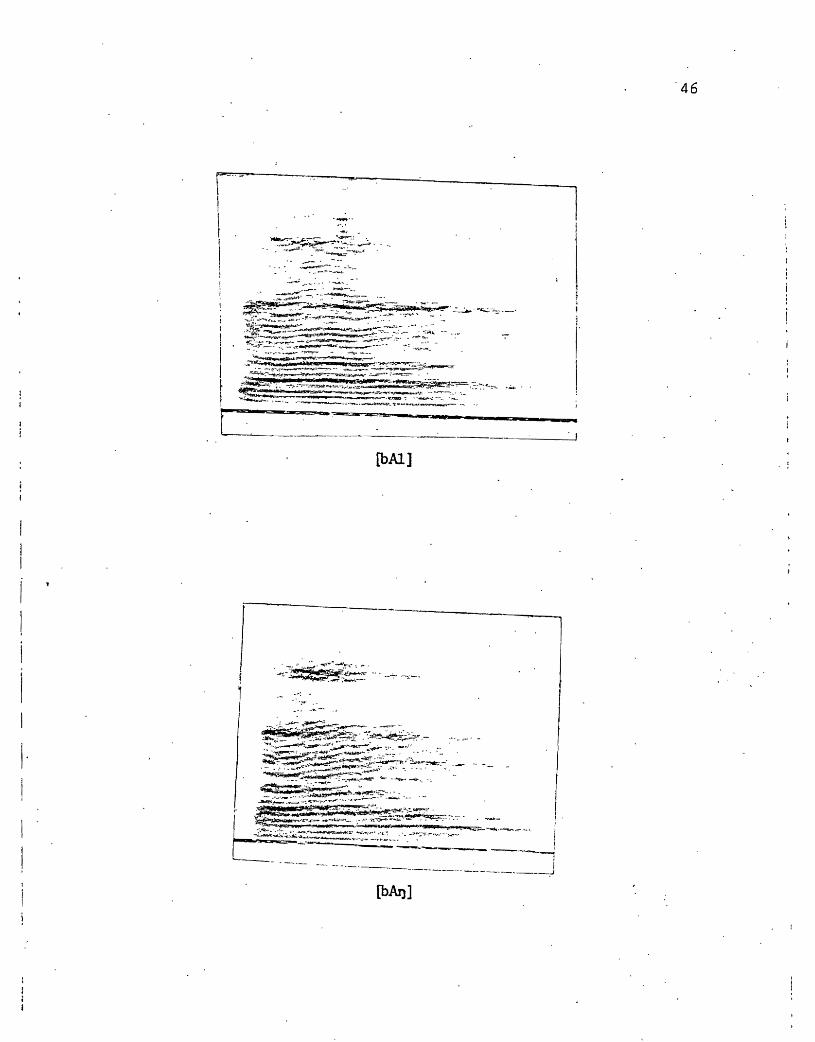


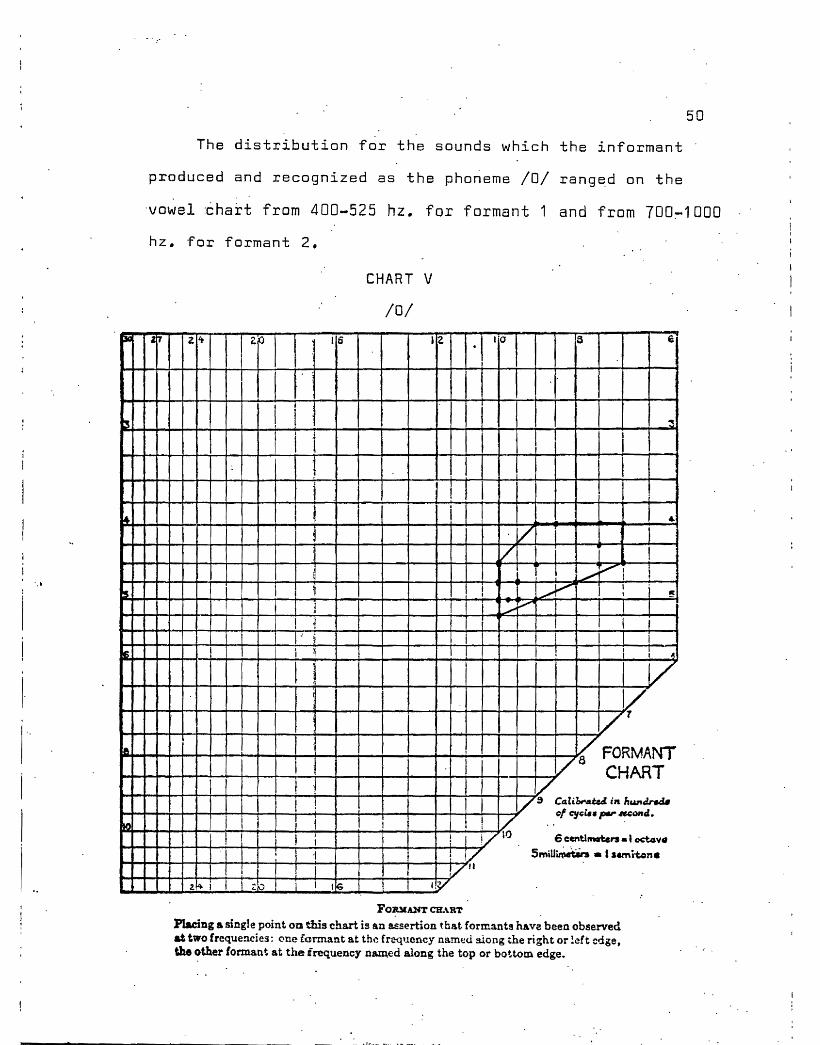

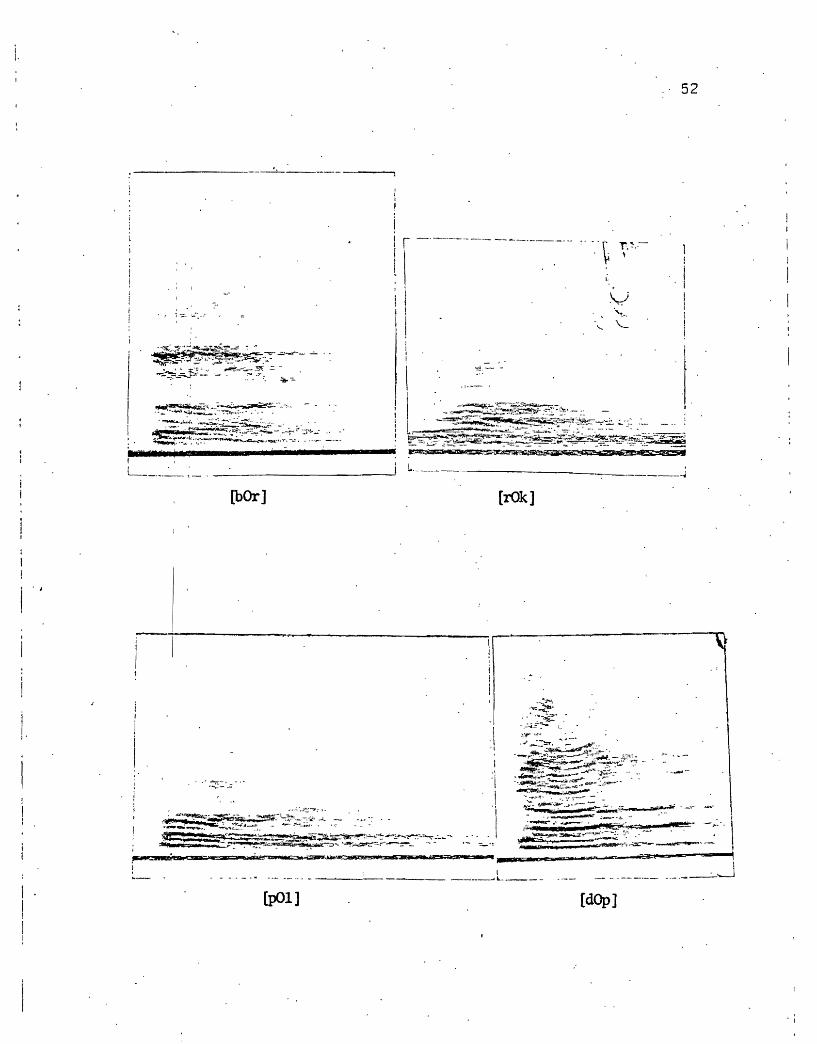
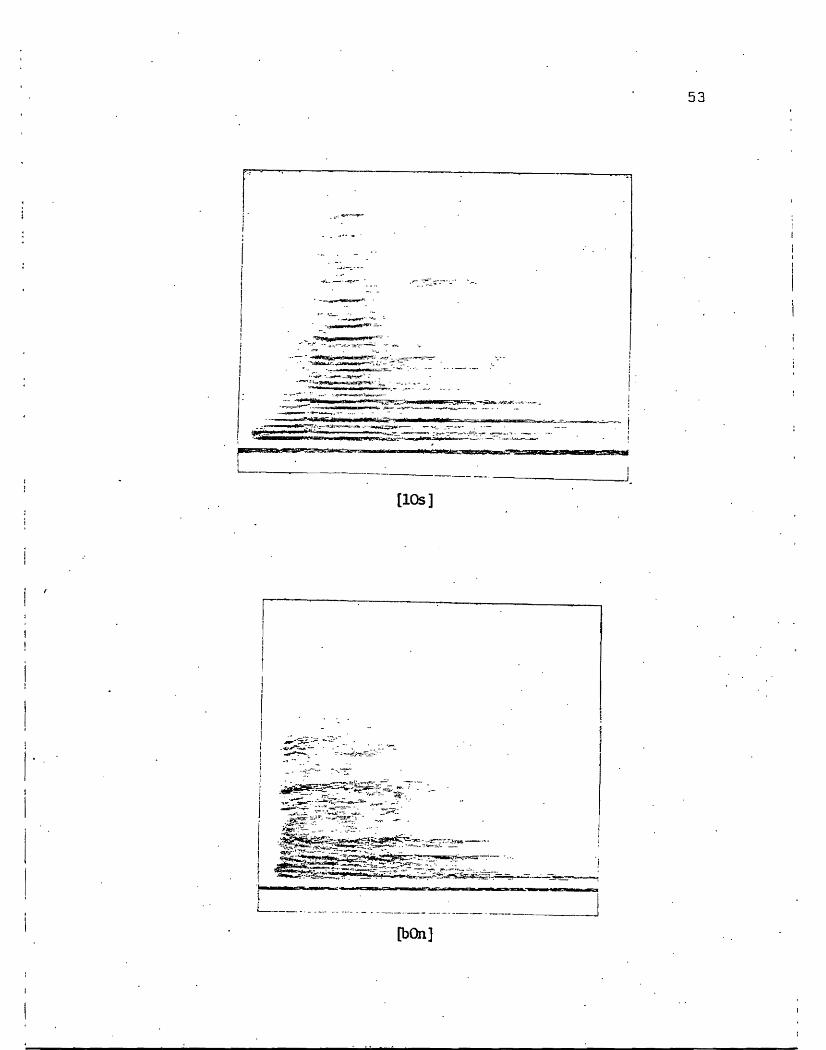

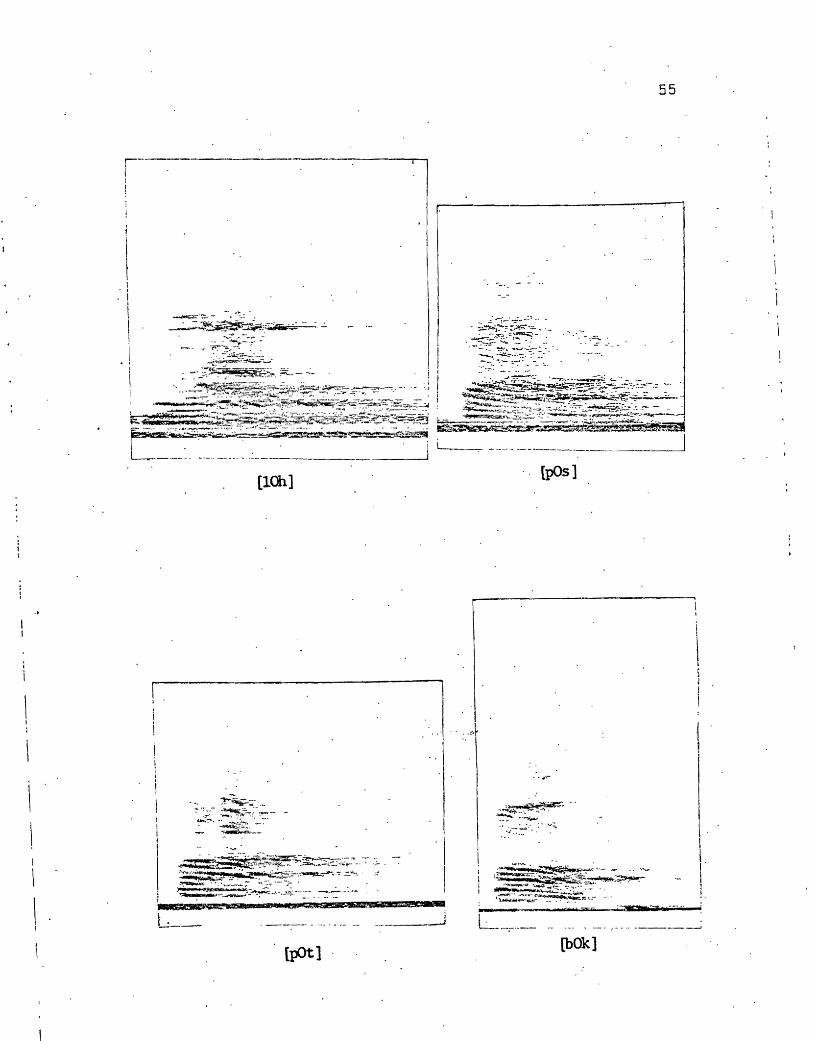
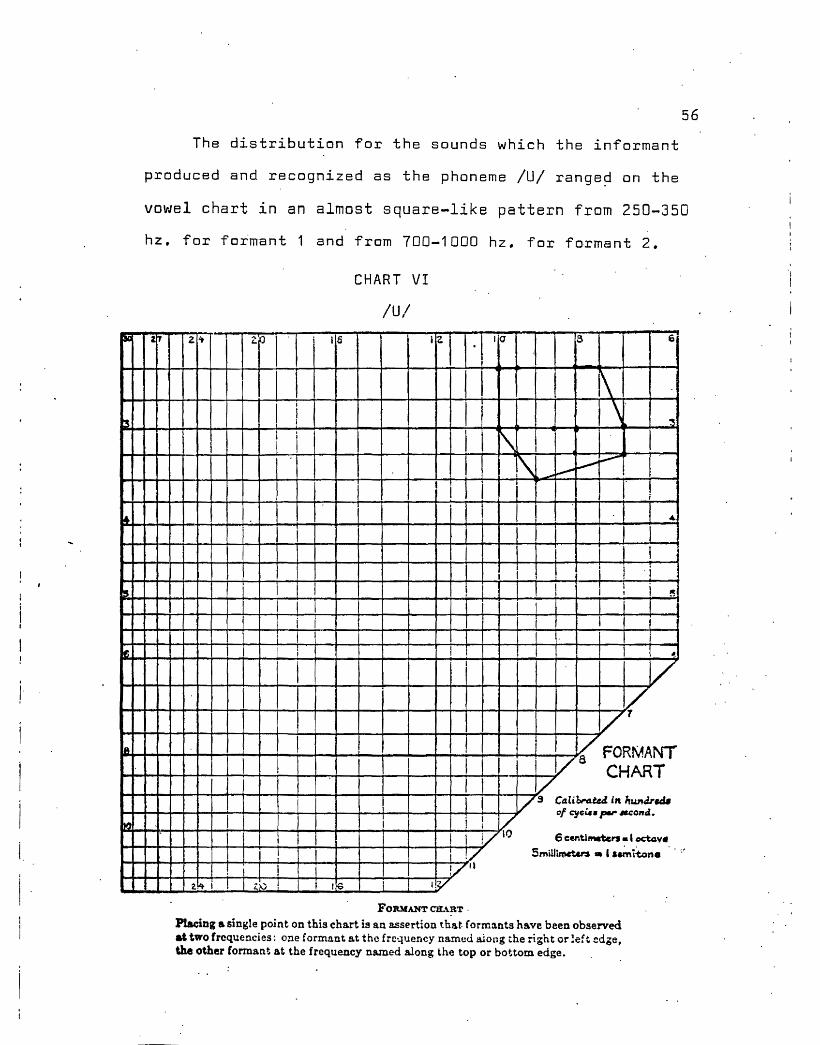
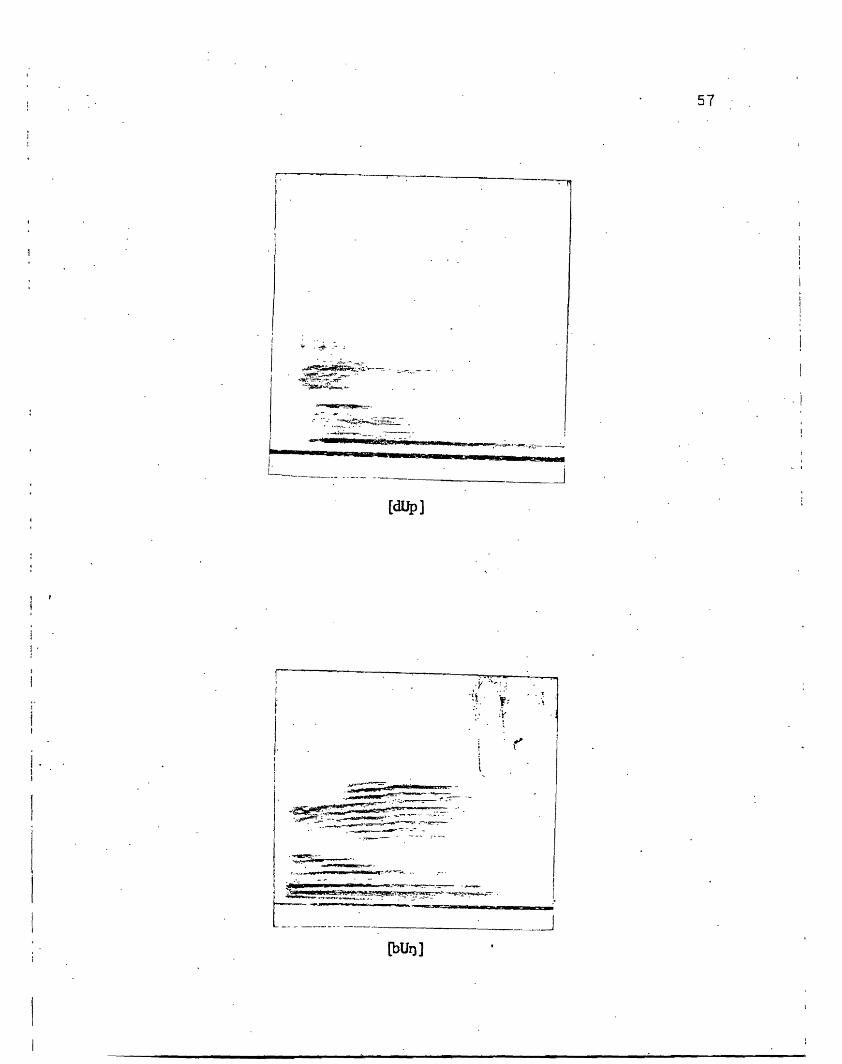

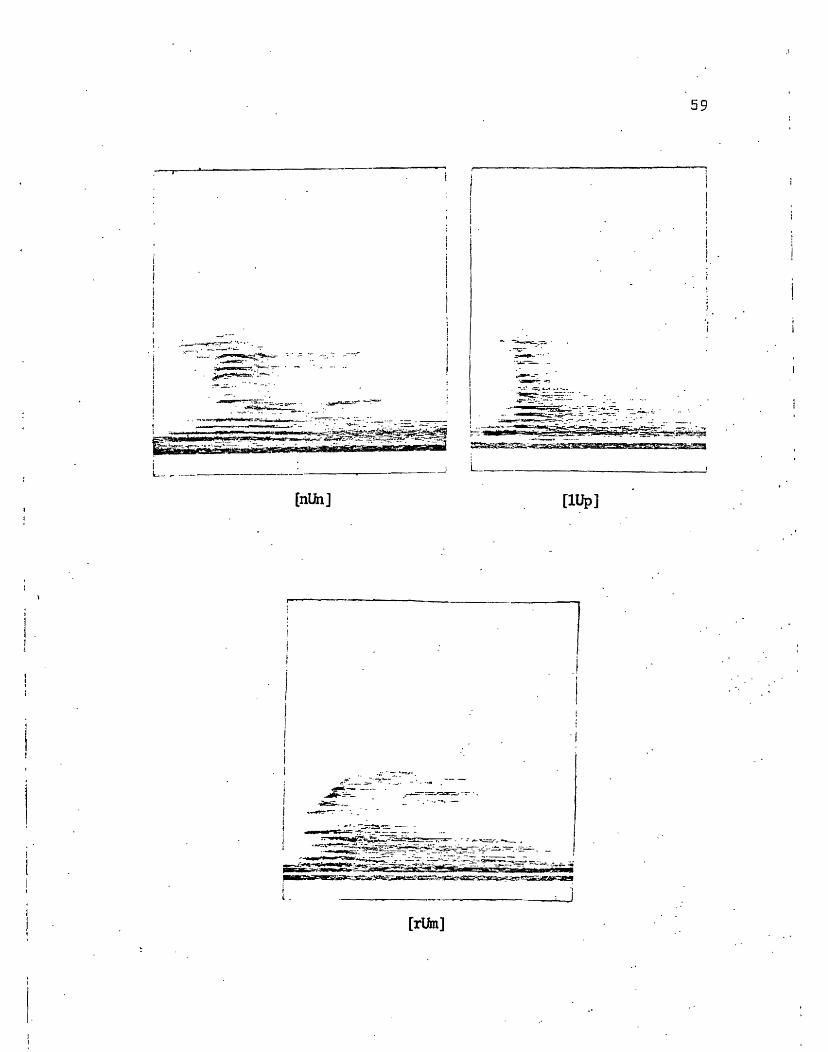
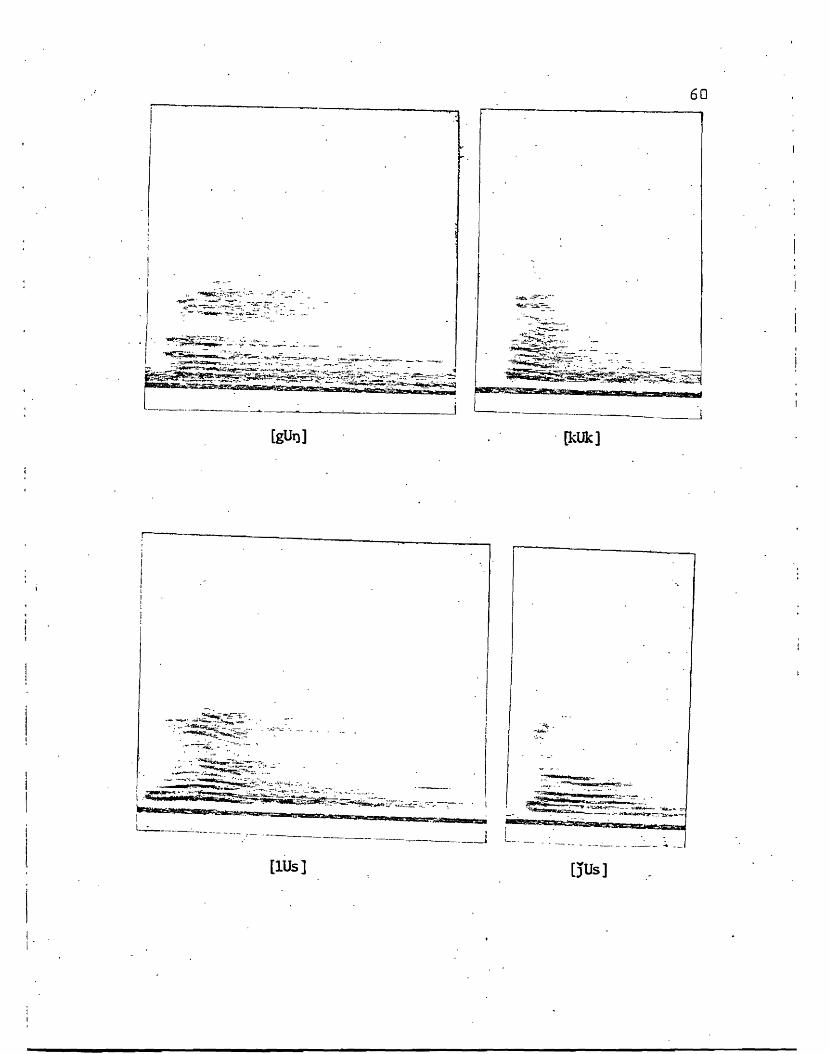

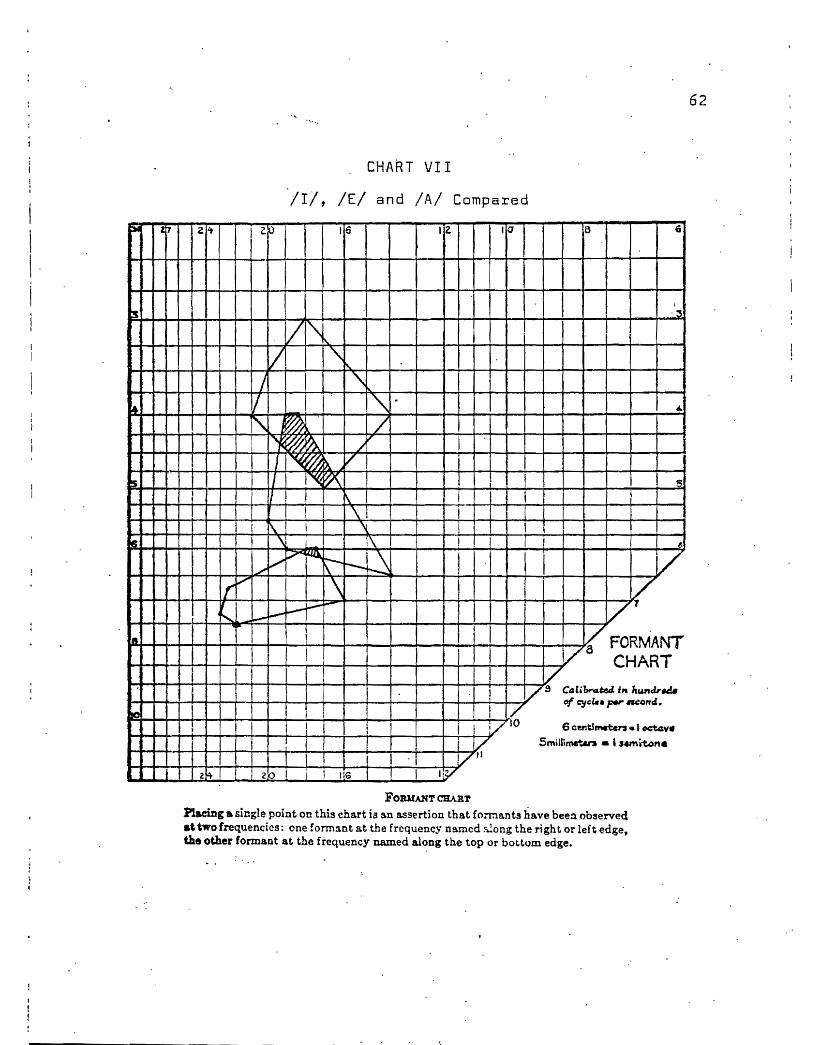


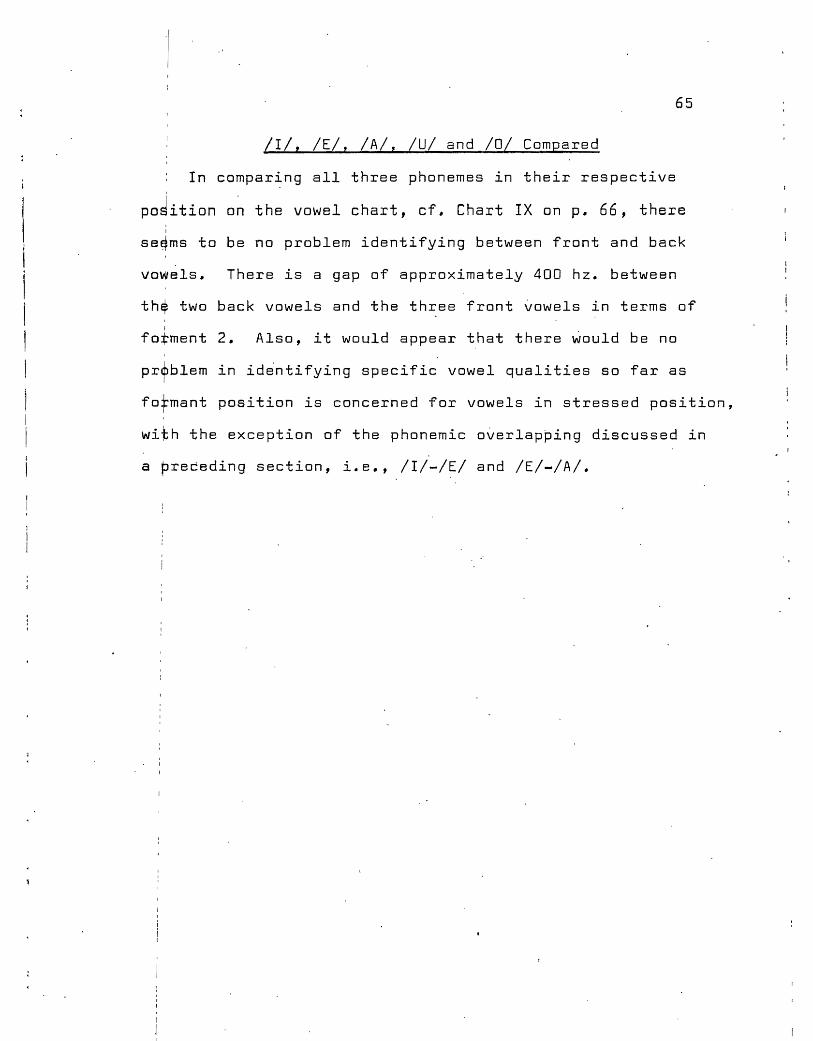

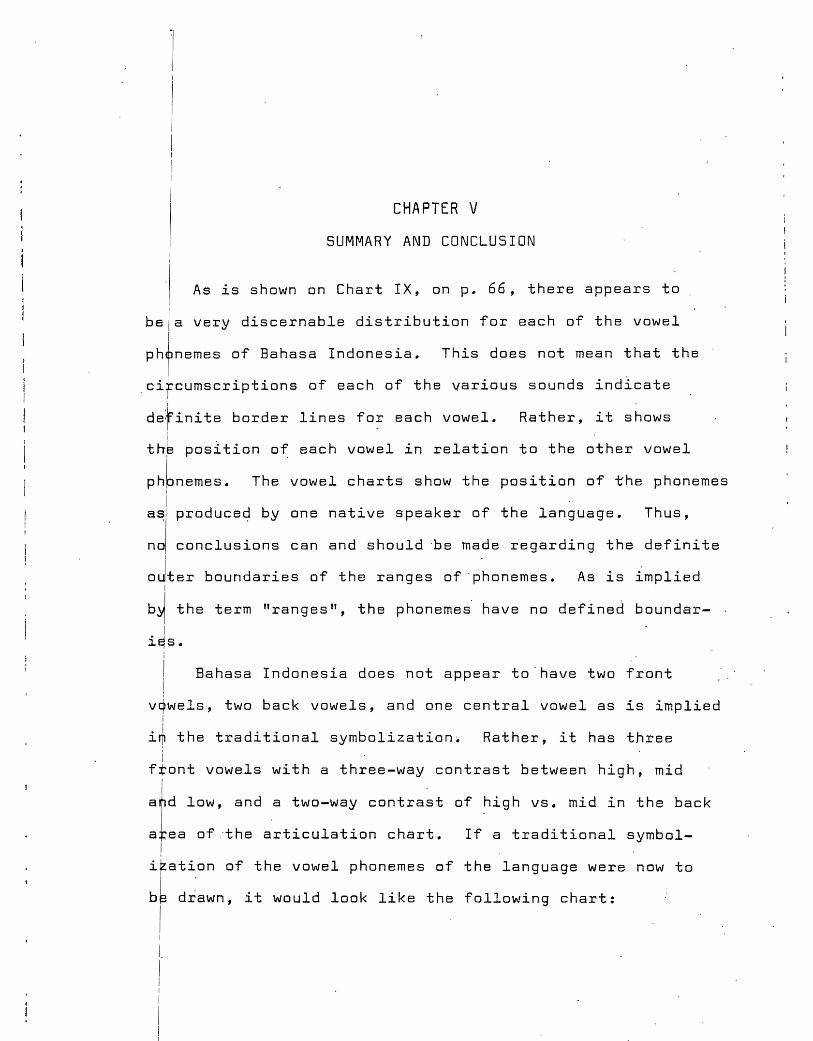


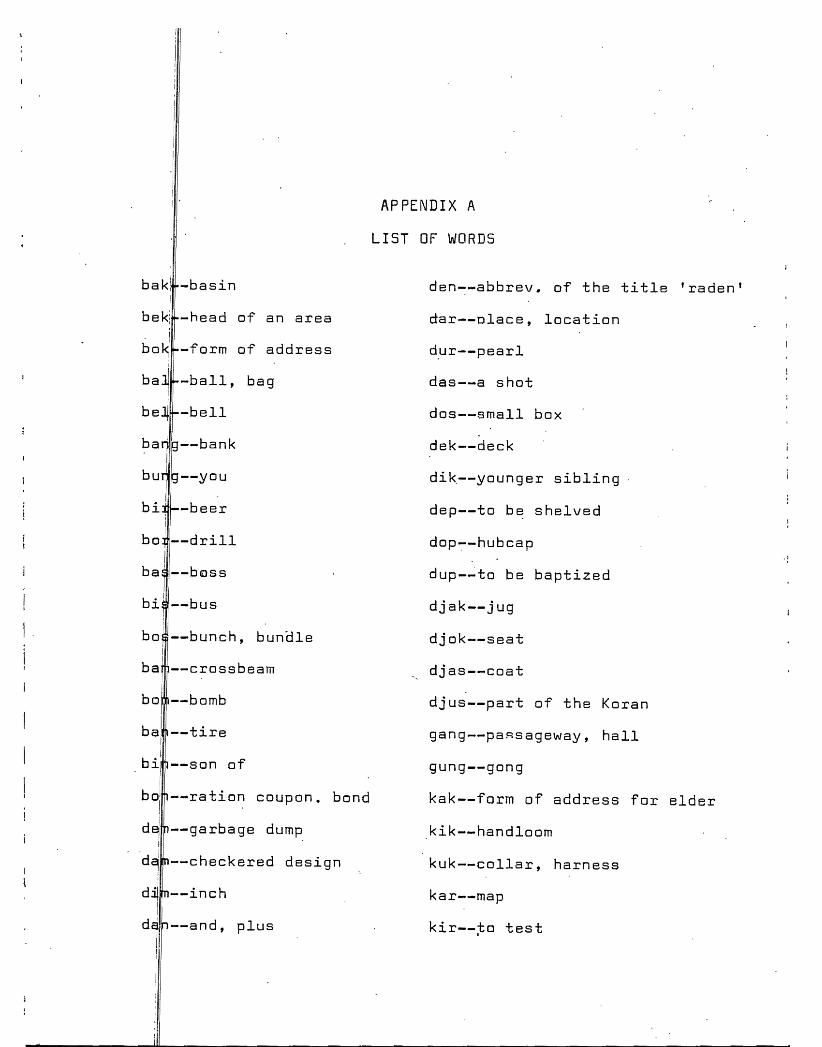
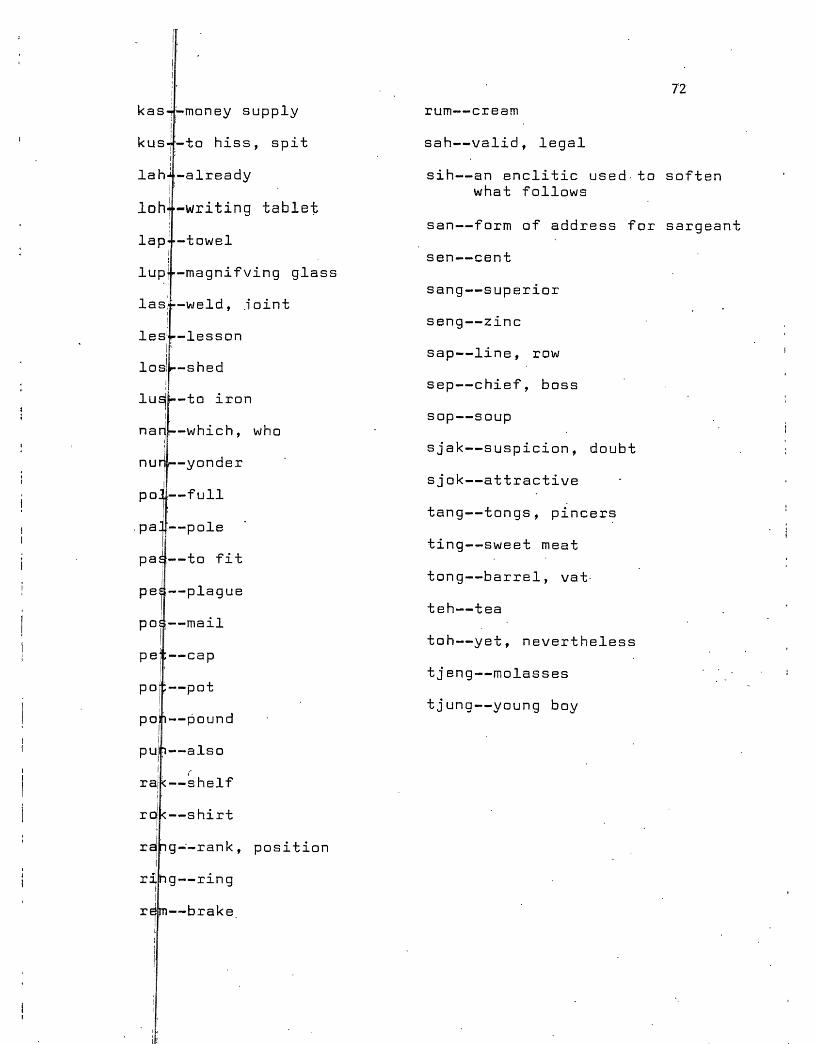
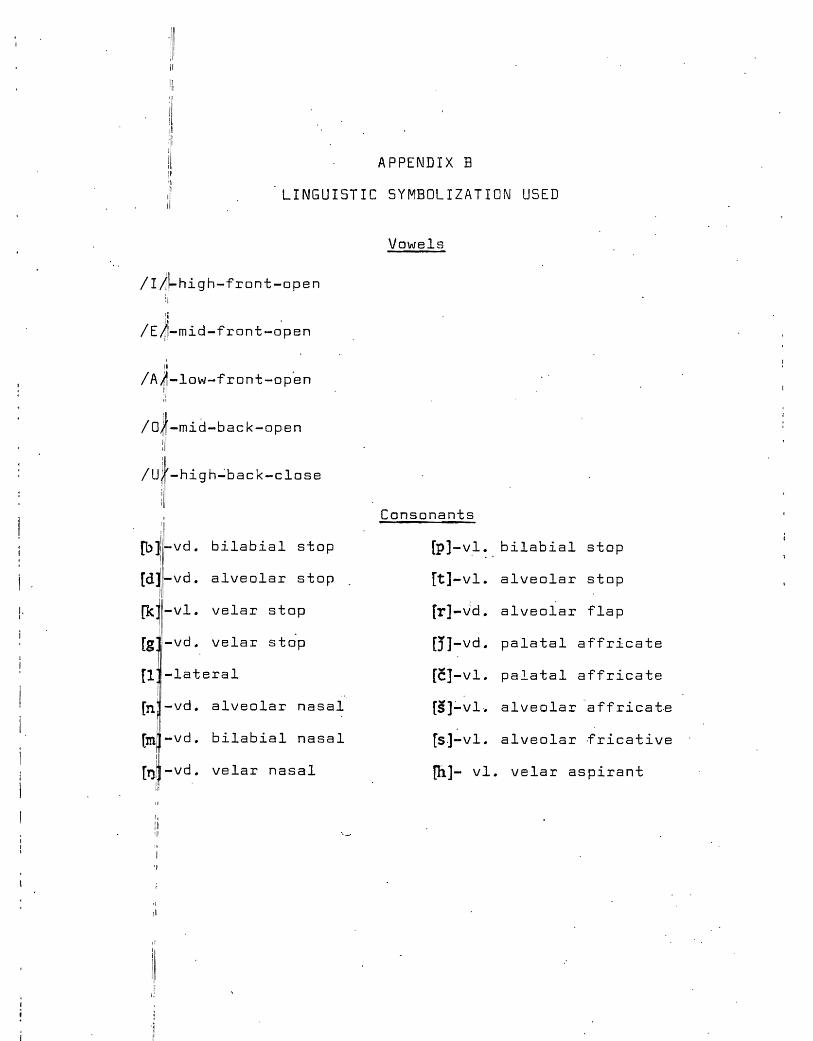

![SSC - prepadda.comprepadda.com/wp-content/uploads/english/ARTICLE IMPORTANT NOTES[].pdf Means to say ( ) Vowel Consonant Consonant Vowel Vowel = Vowel Consonant = Consonant ... I had](https://img.pdfslide.us/doc/110x75/5e4437036ae6ba6d743ded6b/ssc-prepaddacomprepaddacomwp-contentuploadsenglisharticle-important-notes.jpg)