Embed Size (px)
Citation preview
1
A Specific, Accurate and Sensitive Measure of Total Plasma Malondialdehyde by HPLC.
Hamdy F Moselhy1, Raymond G Reid2, Saeed Yousef1 and Susanne P Boyle2**
1Faculty of Medicine and Health Sciences, University of the United Arab Emirates.
2School of Pharmacy and Life Sciences, Robert Gordon University, Schoolhill, Aberdeen, AB10 1FR.
**Corresponding author: Dr Susanne P Boyle, email: [email protected], Tel. + 44 1224 262529,
Fax. +44 1224 262555.
Abbreviations
DAD Diode Array Detection
LC-DAD-MS Liquid chromatography- diode array detector-mass spectrometry
LOD Limit of Detection
LOQ Limit of Quantitation
MDA Malondialdehyde
MS Mass Spectrometer
%RSD % Relative Standard Deviation
Sd Standard deviation
SIM Selected Ion Monitoring
TBA 2 Thiobarbituric acid
TBARS Thiobarbituric Acid Reactive Substances
TEP Tetraethoxypropane
by guest, on Novem
ber 9, 2018w
ww
.jlr.orgD
ownloaded from
2
Abstract
Malondialdehyde is one of the most commonly reported biomarkers of lipid peroxidation in clinical
studies. The reaction of thiobarbituric acid with Malondialdehyde to yield a pink chromogen
attributable to an MDA-TBA2 adduct is a common assay approach with products being quantified by
UV-Vis assay as non specific thiobarbituric acid reactive substances (TBARS) or chromatographically
as Malondialdehyde. The specificity of the TBARS assay was compared to both chromatographic
assays for total plasma MDA. The levels of total plasma MDA were significantly lower than the
plasma TBARS in each of the samples examined and interestingly the inter-individual variation
apparent in the level of plasma MDA was not evident in the plasma TBARS assay. Each of the 4
online chromatographic detectors yielded a precise, sensitive and accurate determination of total
plasma MDA and selected ion monitoring was the most accurate assay (101.3%, n=4). The online
diode array detectors provided good assay specificity (peak purity index of 999), sensitivity, precision
and accuracy. This research demonstrates the inaccuracy that is inherent in plasma TBARS assays
which claim to quantify Malondialdehyde and it is proposed that the TBARS approach may limit the
likelihood of detecting true differences in the level of lipid peroxidation in clinical studies.
Keywords: Plasma Malondialdehyde, TBARS, assay specificity, assay bias, lipid peroxidation.
by guest, on Novem
ber 9, 2018w
ww
.jlr.orgD
ownloaded from

3
Introduction
Lipid peroxidation is one of the most commonly reported indices of oxidative stress and has been
implicated as a contributing factor in a range of degenerative diseases including diabetes1,
cardiovascular disease, Parkinson’s disease, Alzheimer’s disease2 and other psychiatric disorders
including Schizophrenia3.
The process of lipid peroxidation results in a range of intermediates and end products including lipid
hydroperoxides and aldyehydes including malondialdehyde. These aldehydes and lipid
hydroperoxides form DNA adducts with may result in extensive single strand and double strand
breaks4. Various intermediates and end products generated during the lipid peroxidation cascade
have been assayed but the most commonly employed approach continues to be the thiobarbituric
acid (TBA) test5.
Whilst it is widely acknowledged that TBA reacts with a range of oxidised lipids, both saturated and
unsaturated aldehydes6,7 sucrose and urea8 to form various chromogens referred to as TBA reactive
substances (TBARS) it is the reaction of TBA with malondialdehyde to produce a pink pigment9 with
an absorption maximum at 532 nm10 and mass ion at 323 amu11 which is a true indicator of lipid
peroxidation. Historically the TBARS test has been assayed by UV spectrophotometry or fluorescence
assays but the specificity of the TBA test, enabling the selective determination of malondialdehyde,
may be achieved via chromatographic separation of the pink TBA2-MDA adduct12. The adoption of
HPLC techniques improves both assay specificity and sensitivity of MDA determination and we have
previously confirmed the validity of quantifying the TBA2-MDA adduct as a specific measure of lipid
peroxidation in human biological fluids13.
Despite the widely acknowledged limitations of the TBARS test14 and in particular its lack of
specificity it continues to be reported as a true measure of MDA in clinical disease 1,15,16. It is
proposed that the poor assay specificity associated with TBARS assays may lead to an overestimation
of the levels of MDA in human plasma and other biological tissues and fluids and this in turn may
limit the likelihood of detecting true differences in the level of lipid peroxidation in clinical studies.
This research investigated the absolute levels of plasma MDA employing two chromatographic
assays (HPLC-DAD-Fluoro and LC-MS-DAD) and compared this with the level of TBARS determined by
UV spectrophotometry. Within physiological systems malondialdehyde may exist in a free state or
protein bound form and various studies have looked at the relative proportions of malondialdehyde
in human plasma and report that between 83% - 92% of the MDA is protein bound17,18. Hydrolysis of
the protein bound MDA fraction may be achieved by either an alkaline18,19 or acid treatment20 of the
sample prior to the acid catalysed TBA reaction. An approximately two fold increase in plasma MDA
levels determined by HPLC-UV was observed following alkaline hydrolysis of human plasma by Hong
et al., (2000)18 and it was concluded that this additional sample pre-treatment was a useful step
which enhanced assay reliability ensuring a more complete and uniform release of the MDA. In light
of this and similar studies21 which report good assay precision when measuring total plasma MDA a
similar alkaline hydrolysis method was employed herein.
by guest, on Novem
ber 9, 2018w
ww
.jlr.orgD
ownloaded from
4
Methods
Materials
Reagent grade sodium hydroxide, sulphuric acid, trichloroacetic acid and HPLC grade solvents werepurchased from Fisher Scientific. 1,1,3,3 tetraethoxpropane and 2-thiobarbituric acid werepurchased from Sigma Chemical Co. Acetic acid (99.5% pure) was purchased from Arcos Organics.HPLC grade water (H20) was used throughout.
Ethical Approval
Participant recruitment for this collaborative research study was managed by clinicians in theUniversity of the United Arab Emirates and the study protocol was approved by the Research EthicsCommittee, Faculty of Medicine and Health Sciences, United Arab Emirates University. The studywas conducted in accordance with Good Clinical Practice and all participants gave their informedconsent prior to sampling. Blood was collected (10 ml) from each participant by venepuncture intoEDTA vacutainers. The blood was centrifuged at 3500 g for 15 minutes, the plasma fractionated,aliquoted into cryovials and stored at -80oC until required for analysis. Pooled plasma samples wereused for assay validation and then two individual volunteer samples used to test the application ofthe validated assay.
Preparation of MDA Calibration Line and Human Plasma Assay for Total MDA
1,1,3,3 tetraethoxypropane (TEP) was used as the MDA standard and under conditions of acid andheat condensed with 2-thiobarbituric acid to form a stable adduct (TBA2-MDA). An alkalinehydrolysis step was then employed21 enabling a measure of total plasma MDA to be determined byHPLC or LC-MS.
Assays were performed in acid washed pyrex tubes to which was added 100 μl human plasma (or
TEP std or H2O blank) and 25 μl of 3 M NaOH. The tubes were capped, vortexed and placed in a 60oC
water bath for 30 minutes. Post alkaline hydrolysis 1 ml of 0.05 M sulphuric acid and 0.5 ml of 20%
w/v TCA were added, the tubes vortexed and centrifuged (3000 rpm x 10 mins) and 1 ml of
supernatant layer removed to clean tubes to which was added 0.5 ml of 0.355% w/v TBA. The tubes
were vortexed and then heated to 90 oC for 40 minutes. Upon cooling the tubes were centrifuged at
3000 rpm for 10 minutes and an aliquot of the aqueous phase was analysed chromatographically for
MDA or by UV spectrophotometry for determination of TBARS10.
UV Spectrophotometric Determination of TBARS
TBARS determinations were performed using a Hewlett Packard Diode Array spectrophotometerwith spectral scans being collected and absorbances being measured at 532 nm10.
HPLC and LC-MS Analysis
HPLC separation was performed at room temperature using a Shimadzu Prominence liquidchromatography system (LC-20AD) with degasser, a SPD-M20A diode array detector (DAD) and aShimadzu RF-10 AXL fluorescence detector. Analysis was achieved using a 5μm Hyperclone C18column (150 x 4.6mm) and a gradient elution programme as summarised in Table I (Supplementalfiles).
by guest, on Novem
ber 9, 2018w
ww
.jlr.orgD
ownloaded from
5
A constant flow rate of 1 ml/min was employed and the eluent monitored at 532 nm10 by DAD with
spectral scans being collected over the range of 500 to 580 nm. The fluorescence detector used an
excitation wavelength of 515nm and an emission wavelength of 553nm8. An Agilent Technologies
1200 series LC coupled to an Agilent 6130 Quadrupole LC-MS was utilised with a 5 μm Hyperclone
C18 column (150 x 4.6mm) analytical column maintained at 40oC, a flow rate of 1 ml/minute and the
gradient conditions summarised in Table I (Supplemental files). The MS detector was set to measure
in the negative ion mode and scans were collected over a mass range of 200-450amu with single ion
monitoring (SIM) at 323amu. All other settings for the MS were standard for the instrument.
For chromatographic analyses, quantification was primarily by external standard calibration using
TEP as standard. Daily calibration lines were prepared across the range of 0 - 24.3 μM MDA and
regression lines of MDA concentration versus detector response (peak area) constructed.
Determination of total TBARS used the assay conditions described above with calibration curves of
TEP concentration versus UV absorption at 532 nm being constructed.
Validation of the HPLC Assay
Assay linearity and precision were determined in accordance with the ICH Guideline for Validation ofAnalytical Procedures (1994)22. Peak purity was evaluated by diode array detection22 and sensitivityof the chromatographic assays was determined in terms of Limits of Detection (LOD) and Limits ofQuantitation (LOQ) derived from residuals method of Sanagi et al., (2009)23 using the standarddeviation (sd) of the response and the slope. Assay accuracy was determined by a process of spikingof human plasma (n=6 replicates) and evaluated by HPLC and LC-DAD-MS analysis.
Statistical Analyses
Student’s t tests were carried out to test for statistically significant differences between the variouschromatographic detectors.
by guest, on Novem
ber 9, 2018w
ww
.jlr.orgD
ownloaded from
6
Results
Validation of the TBARS and MDA Assays
TBARS analysis of the TEP standards produced a pink chromogen which had a maximal absorption at
532 nm. The linearity of the TBARs assay was demonstrated over the range of 0-30 µM and the
precision of assay response was acceptable with a mean slope of 0.00457 (% RSD = 6.79, n=3). A
similar pink coloured pigment was observed following TBARS analysis of the pooled plasma but in
this matrix the UV Vis spectral analysis showed a maximum absorption at 532 nm and a further
absorption band at 490 nm (see Supplemental Figure I).
Analysis of the MDA standard by HPLC-DAD- Fluorescence and LC-MS-DAD yielded a single HPLC
peak with a mean retention time in the range of 9.46-9.67 minutes and was highly reproducible
(%RSD< 0.25, n=5) for each of the 4 online detectors. Spectral scans indicated a λmax of 532 nm and
the predominant mass ion was at 323 amu; characteristics indicative of the MDA-TBA2 adduct,
(Figure 1A). Similarly, replicate assay of the plasma samples and analysis by HPLC-DAD- Fluoro and
LC-MS-DAD yielded a single HPLC peak with a mean retention time in the range of 9.49-9.70 minutes
and was highly reproducible (%RSD< 0.03, n=10) for each of the 4 online detectors. Spectral scans
indicated a λmax of 532 nm and the predominant mass ion was at 323 amu; characteristics
indicative of the MDA-TBA2 adduct, (Figure 1B).
The linearity of MDA determination across the range of 0 - 24.3 μM was demonstrated on all 4 online
chromatographic detectors as illustrated in Supplemental Table II and the precision of assay
response was good (%RSD ≤ 8%, n=4) on each of the 4 detectors employed.
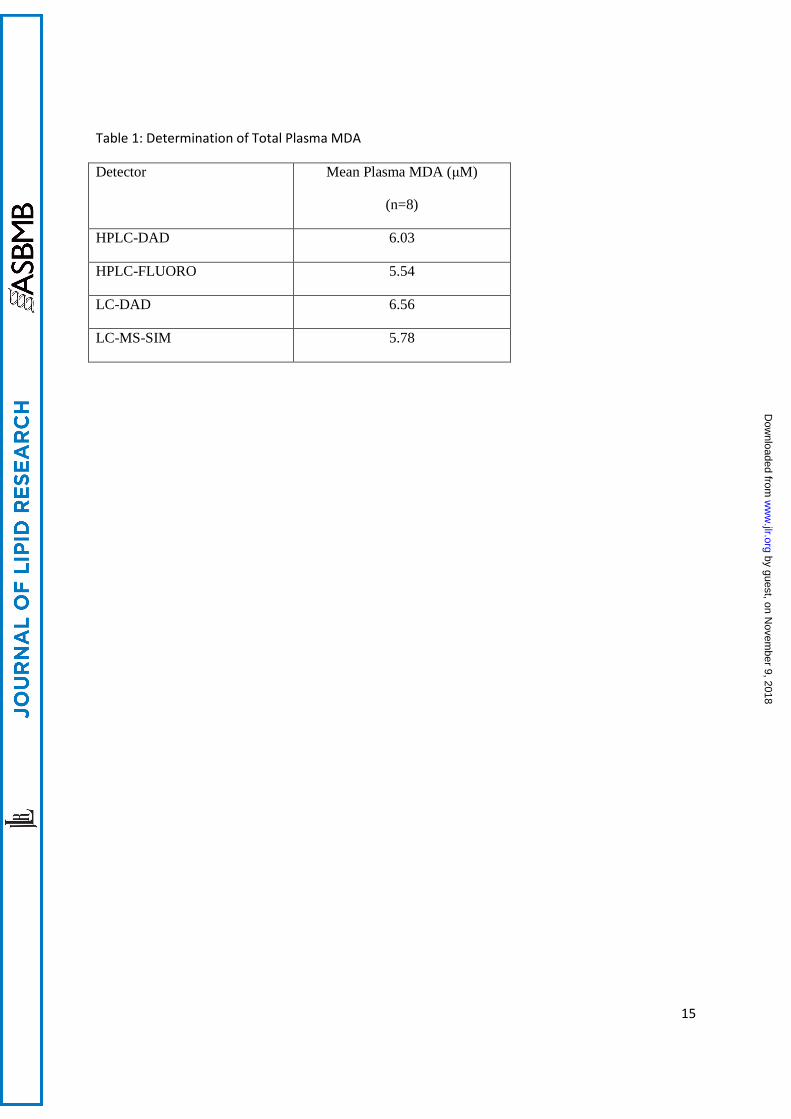
Replicate analysis (n=8) of a pooled plasma sample demonstrated detector equivalence in terms of
determination of total plasma MDA, see Table 1. The assay proved to be quite reproducible with %
RSD typically <8% (n=8) and Student’s t tests indicated no significant difference in the absolute
concentration of MDA determined by each detector.
The sensitivity of the assay was examined in human plasma sample and the LOD was in the range of
0.31 – 0.6 µM for the 2 diode array detectors and an LOQ in the range of 1.02-1.21 µM achieved. An
LOD and LOQ of 0.25 µM and 0.84 µM respectively was achieved by fluorescence detection.
SIM at 323nm produced LOD and LOQs of 0.86 µM and 2.86 µM. The main interference following
LC-MS analysis of the plasma samples was from a mass of 269 amu and less intense signals were
observed for other ions at 251, 431 and 442amu.
The accuracy of the assay was examined by a method of spiking in the human plasma matrix, the
data was reproducible and yielded accuracy values in the range of 82.35 – 101.3% for each of the 4
detectors under investigation with SIM analysis yielding the most accurate results. However the
accuracy data for DAD was acceptable and critically a high peak purity (>999) was demonstrated
following analysis of both the calibration standard and the human plasma samples by HPLC-DAD
indicating assay specificity and accuracy was demonstrable by this approach.
The validated assay was then applied to individual human plasmas to further evaluate assay
performance in terms of precision, specificity and general fitness for purpose. Replicates (n=6) of
by guest, on Novem
ber 9, 2018w
ww
.jlr.orgD
ownloaded from

7
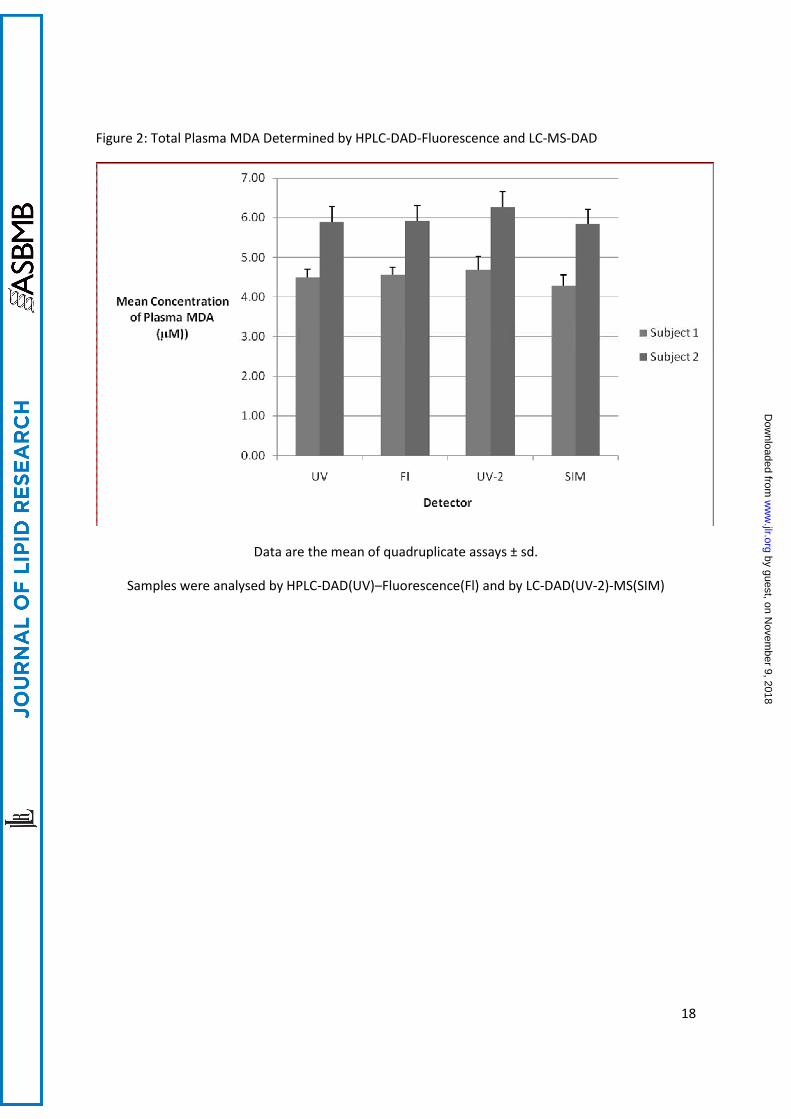
each plasma sample were processed through the total MDA assay and analysed by HPLC-DAD-
fluorescence and LC-MS-DAD. The precision of assay response was good (≤ 8%, n=4) on each of the 4
detectors employed, the mean plasma MDA concentration was 4.50 and 5.98 µm in subjects 1 and 2
respectively (see Figure 2).
Comparison of TBARS and MDA Levels in Human Plasma
The validated assays were then employed to undertake a comparison of the levels of TBARS and
plasma MDA using test plasmas. The test plasmas included two pools of human plasma (pool 1 and
pool 2) plus two further participant plasmas.
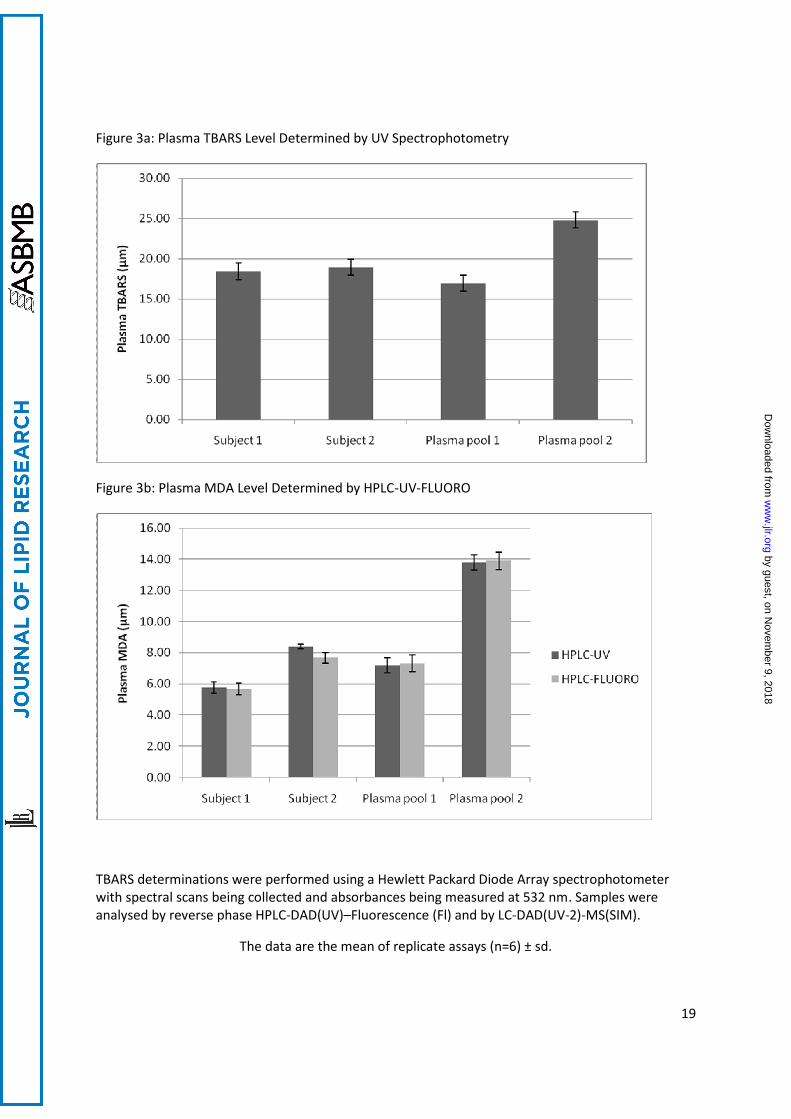
Quantification of “MDA” at 532 nm indicated the mean concentration of TBARS in the pooled plasma
ranged from 16.94 µM (n=6 assays) through to 24.80 µM in pool 2 (n=6 assays). The plasma TBARS
level in subjects 1 and 2 was remarkably similar with a mean of 18.42 and 18.92 µM respectively as
illustrated in Figure 3a.
The same set of plasma samples were simultaneously analysed by HPLC-DAD-Fluorescence and the
level of plasma MDA quantified. The levels of plasma MDA were significantly lower than the plasma
TBARS in all 4 of the test samples. Plasma MDA levels ranged from 13.79 µM in plasma pool 2
through to 5.78 µM in subject 1. Critically there was a 30% difference in the level of plasma MDA
measured in subjects 1 and 2 (see Figure 3b) whereas previously an almost identical level of plamsa
TBARS had been determined (see Figure 3a).
A positive correlation between the plasma MDA and TBARS concentrations was observed r=0.709,
(data not shown) n=24 plasma assays.
by guest, on Novem
ber 9, 2018w
ww
.jlr.orgD
ownloaded from

8
Discussion
It has been reported that acid precipitation of lipoprotein fractions reduces soluble TBARS
components and enables a specific determination of lipid peroxidation without the need for HPLC24
however it is generally acknowledged that the specificity of MDA assay as a true indicator of lipid
peroxidation in biological matrices13 is more consistently achieved when a chromatographic assay is
employed12.
This research investigated the absolute levels of plasma MDA employing two chromatographic
assays (HPLC-DAD-Fluoro and LC-MS-DAD), compared this with the level of TBARS determined by UV
spectrophotometry and systematically examined the equivalence and sensitivity of each of the LC
detectors employed.
A positive correlation between the plasma MDA and TBARS concentration was observed r=0.709,
(data not shown) n=24 plasma assays. A significant difference (up to 3-fold ) in the concentration of
total Malondialdehyde was noted when determined by HPLC or measured as TBA reactive
substances in human plasma.
This observation concurs with that reported by Hong et al., (2000)18 and indicates that TBARS
determination by UV spectrophotometry leads to an over estimation of the levels of plasma “MDA”
and critically in this study the significant inter-individual differences observed in plasma MDA levels
were not apparent in plasma TBARS determinations. This may be due to the poor assay selectivity
of the TBARS assay leading to an assay bias. The source of the bias was evident from the UV-Vis
spectrum analysis which illustrated two absorption bands (532 and 490 nm) indicating that in a
human plasma matrix the TBARS method lacks specificity for MDA determination and essentially a
chromatographic separation of the MDA-TBA2 adduct is required for a true measure of lipid
peroxidation to be achieved.
The interfering TBARs compounds in human plasma may be attributable to the reaction of TBA with
dienals7 and/or the formation of 2:1 barbituric acid adducts with MDA11. Such interferences are likely
to be common in many MDA assays but may be effectively resolved from the adduct of interest by
application of the HPLC mobile phase conditions reported. Additionally, the current HPLC assay
resulted in an improvement on previously reported assays for total MDA in terms of efficiency of
sample preparation with no need for the sample extraction step of Grotto et al. (2007)21. The
concentration of total plasma MDA was comparable to previously published data21.
Comparable concentrations of MDA were demonstrated by all 4 online HPLC detectors and there
was no evidence of signal suppression or enhancement on LC-MS suggesting that the acid
precipitation and alkaline hydrolysis steps efficiently removed the phospholipid fraction. Whilst the
LC-MS-DAD method with single ion monitoring offers a very specific and accurate measure (mean
101.3%, n=4) of the TBA2-MDA adduct it is recognised that the costs of LC-MS equipment may be
prohibitive for some researchers and importantly the HPLC-DAD or HPLC-Fluorescence methods
offer a rapid, selective determination of total plasma MDA which showed acceptable sensitivity
given that the mean plasma MDA concentration was typically in the range of 5.78 through to 13.79
µM (see Figure 3b) and a satisfactory assay accuracy of 87.6% (n=4 replicates).
by guest, on Novem
ber 9, 2018w
ww
.jlr.orgD
ownloaded from
9
Interestingly, a similar observation of bias in the TBARS method has been reported by Tug et al.,
(2008)25 in a study of patients with chronic obstructive pulmonary disease in which they reported a
5-fold increase in levels of free MDA determined by TBARS compared to that determined by HPLC
and similarly by Hong et al (2000)18 who reported an approximate 2-fold increase in total plasma
MDA in a Taiwanese population. Furthermore, the elegant study of Breusing et al., (2010)26 which
investigated inter- and intra-laboratory performance of a range of lipid peroxidation assays in
human plasma included a study of 8 laboratories which measured MDA using a range of
derivatisation methods. It reported within day precisions of between 1- 30% MDA when analysed by
HPLC assay and in that regard the current method compares favourably with a within day precision
of ≤ 8% (n=4) being demonstrated. Whilst the study of Breusing et al., (2010)26 did not examine the
performance of a spectrophotometric TBARs assay it did report on a spectrophotometric assay
employing the 1-methyl-2-phenylindole method of Gerard-Monnier et al., (1998)27. This assay
recorded the highest MDA plasma level and was approximately 2-fold greater than the median MDA
level determined by HPLC suggesting once more an issue of assay bias when colorimetric assays are
employed for plasma or serum MDA quantitation. Consequently a number of research groups18,25,27
have recommended HPLC as the preferred MDA assay for human plasma samples but
notwithstanding these previous recommendations the field continues to support the publication of
research articles reporting TBARS values as a specific measure of Malondialdehyde levels /lipid
peroxidation 12,28,29,30.
In summary, this research demonstrates conclusively the inaccuracy that is inherent in TBARS assays
which claim to quantify Malondialdehyde in biological tissues and fluids and it is proposed that the
continued reporting of such ambiguous data may limit the likelihood of detecting true differences in
the level of lipid peroxidation in clinical studies.
by guest, on Novem
ber 9, 2018w
ww
.jlr.orgD
ownloaded from
10
Acknowledgments
Elements of this research are related to an ongoing study in First Episode Psychosis which is
partially funded by a grant from The Cunningham Trust, St Andrews, Scotland, UK.
by guest, on Novem
ber 9, 2018w
ww
.jlr.orgD
ownloaded from
11
References
1. Pasupathi, P., V. Chandraseker, and U.S Kumar. 2009. Evaluation of oxidative stress,
enzymatic and non enzymatic antioxidants and metabolic thyroid status in patients with
diabetes mellitus. Diabetes & metabolic syndrome. Clinical Research & Reviews 3: 160-165.
2. Adly, A.A.M. 2010. Oxidative Stress and Disease: An Updated Review. Research Journal of
Immunology 3: 129-145.
3. Tsaluchidu, S., M. Cocchi, L.Tonnello, and B.K.Puri. 2008. Fatty Acids and Oxidative Stress in
Psychiatric Disorders. BMC Psychiatry 8 (Suppl 1) S5: 1-3.
4. Depriviya, N., A.R. Sudheer, P. Vishwanathan, and V.P. Menon. 2008. Modulatory potential
of ellagic acid, a natural plant on altered lipid profile and lipid peroxidation status during
alcohol-induced toxicity: a pathohistological study. Journal of Biochemistry and Molecular
Toxicology 22(2): 101-12.
5. Baron C.P., R.Bro, L.H.Skibsted, and H.J. Andersen. 1997. Direct Measurement of Lipid
Oxidation in Oil in Water Emulsions Using Multiwavelength Derivate UV-Spectroscopy. J.
Agric Food Chem. 45: 1741-1745
6. Alessio, H.M. 2000. In: Hanninen, O, Packy, L, Sen C.K. (Eds) Handbook of oxidants and
antioxidants in exercise, Elsevier, Amsterdam, pp 115-128.
7. Kosugi H., and K. Kikugawa. 1985. Thiobarbituric Acid Reaction of Aldehydes and Oxidised
Lipids in Glacial Acetic Acid. Lipids 20: 915-921.
8. Buttkus H., and R.J.Bose. 1972. Amine-malonaldehyde condensation products and their
relative color contribution in the thiobarbituric acid test. J. Am. Oil Chem. Soc. 50: 387-391.
9. Bernheim, F., M.L. Berheim, and K.M.Wilbur. 1948. The reaction between thiobarbituric acid
and the oxidation products of certain lipids. J. Biol. Chem. 174: 257-264.
10. Yagi K., 1976. A Simple Fluorometric Assay for Lipoperoxide in Blood Plasma. Biochem Med.
15(2): 212-6.
11. Jardine D., M. Antoloovich, P.D.Prenzler, and K.Robards, 2002. Liquid chromatography-mass
spectrometry (LCMS) investigation of the Thiobarbituric Acid Reactive Substances (TBARS)
Reaction. J. Agric. Food Chem. 50: 1720-1724.
12. Bird R.P., S.O.S. Hung, M. Hadley, and H.H.Draper. 1983. Determination of malondialdehyde
in biological matrices by high pressure liquid chromatography. Anal. Biochem. 128: 240-244.
13. Boyle, S. P, V. L. Dobson, S.J. Duthie, D. C. Hinselwood, J.A.M. Kyle, and A. R.Collins. 2000.
Bioavailability and efficiency of rutin as an antioxidant: a human supplementation study. Eur.
J. Clin. Nutr. 54, 774 - 782.
by guest, on Novem
ber 9, 2018w
ww
.jlr.orgD
ownloaded from
12
14. Wheatley A.R. 2000. Some recent trends in the analytical chemistry of lipid peroxidation.
TRAC 19, 617-628.
15.Zortea K., B.S. Fernandes, L.R.Guimaraes, L.P. Francesconi, C.Lersch, C.S. Gama, R. Schroeder,
A. Zanotto-Filho, J.C. Moreira, M.I.R.Lobato, P.S. Belmonte-de-Abreu. 2012. Reduced serum
non-enzymatic antioxidant defense and lipid peroxidation in schizophrenic patients on a
hypocaloric diet. Neuroscience Letters 512: 43-47.
16. Karacay O., A. Sepici- Dincel, D. Kacaaltincaba, D. Sahin, S. Yalvac, H. Akyol, O. Kanemir, and
N. Altan. 2010. A quantitative evaluation of total antioxidant status and oxidative stress
markers in pre eclampsia and gestational diabetic patients in 24-36 weeks of gestation.
Diabetes Research and Clin Pract. 89: 231-238.
17. Carbonneau M.A., E. Penchant, D. Sess, P. Caloni, and M. Clerc. 1991.Free and bound
malondialdehyde measured as thiobarbituric acid adduct by HPLC in serum and plasma. Clin.
Chem. 37: 1423-9.
18. Hong, Y-L., S-L. Yeh, C-Y. Chiang, and M.L. Hu. 2000. Total Plasma malondialdehyde levels in
16 Tiawanese College Studenst Determined by Various Thiobarbittiric Acid Tests and an
Improved High Performance Liquid Chromatography-based Method. Clin. Biochem. 33: 619-
625.
19. Mateos, R., E. Lecumberri, S. Ramos, L. Goya, and L. Bravo. 2005).Determination of
malondialdehyde (MDA) by high-performance liquid chromatography in serum and liver as
a biomarker for oxidative stress. Application to a rat model for hypercholesterolemia and
evaluation of the effect of diets rich in phenolic antioxidants from fruits. Journal of
Chromatography B. 827: 76-82.
20. Londero D, and P. Lo Greco. 1996. Automated high-performance liquid chromatographic
separation with spectrofluorimetric detection of a malondialdehyde-thiobarbituric acid
adduct in plasma, Journal of Chromatography A. 729: 207-210.
21. Grotto D., L.D. Santa Maria, S. Boeira, J. Valentini, M.F. Charao, A.M. Moro, P.C. Nascimento,
V.J. Pomblum, S.C. Garcia. 2007. Rapid Quantification of Malondialdehyde in Plasma by High
Performance Liquid Chromatography- Visible Detection. J. Pharm. Biomed. Anal. 43: 619-
624.
22. ICH Harmonised Tripartite Guidelines. Validation of Analytical Procedures: Text and
Methodology Q2A,.1994: 1-17.
http://www.ich.org/fileadmin/Public_Web_Site/ICH_Products/Guidelines/Quality/Q2_R1/St
ep4/Q2_R1__Guideline.pdf, accessed May 20 2012.
23. Sanagi M.M., S.L. Ling, Z. Nasir, D. Hermawan, W.A. Ibrahim, and A. Abu Naim. 2009.
Comparison of signal to noise, blank determination and linear regression methods for the
estimation of detection and quantification limits for organic compounds by gas
chromatography. J.AOAC Int. 92 (6):1833-8.
by guest, on Novem
ber 9, 2018w
ww
.jlr.orgD
ownloaded from
13
24. Armstrong D., and R. Browne. 1994. The Analysis of Free Radicals, Lipid peroxides,
Antioxidant Enzymes and Compounds By Oxidative Stress As Applied to the Clinical
Chemical laboratory. Free Radicals in Diagnostic Medicine 366:43-58.
25. Tug T., F. Karatas, S.M. Terzi, N. Odzemir.2005. Comparison of Serum Malondialdehyde
Levels Determined by Two Different Methods in Patients with COPD: HPLC or TBARS
Methods. LABMEDICINE 36: 41-44.
26.Breusing, N,T. Grune, L.Andrisic, M.Atalay, G. Bartosz, F.Biasi, S. Borovic, L. Bravo, I. Casals, R.
Casillas, A. Dinischiotu, J. Drzewinska, H. Faber, N.H. Fauzi, A. Gak=jewska, J. Gambini, D.
Gradinaru, T. Kokkola, A.Lojek, W. Lucjaz, D. Margina, C. Mscia, R. Mateos, A. Meinitzer, M.T.
Mitjavilia, L. Mrakovocic, M.C. Munteanu, M. Podborska, G. Poli, P. Sicinska, E.
Skryzydlewska, J.Vina, I. Wiswedel, N. Zarkovic, S. Zelzer, C.M.Spickett. 2010. An inter-
laboratory validation of methods of lipid peroxidation measurement in UVA-treated human
plasma samples. Free Radical Research 44(10):1203-1215.
27. Gerard-Monnier, D., I. Erdelmeier, K. Regnard, N. Moze-Henry, J.C. Yadan and J. Chaudiere.
1998. Reactions of 1- methyl-2-phenylindole with malondialdehyde and 4-hydroxyalkenals.
Analytical applications to a colorimetric assay of lipid peroxidation. Chem. Res. Toxicol: 11,
1176-1183.
28. Zhang X.Y., Y.L. Tan, L.Y. Cao, G.Y. Wu, Q. Xu, Y. Shen, and Zhou D.F. 2006. Antioxidant
enzymes and altered lipid peroxidation in different forms of schizophrenia treated with
typical and atypical antipsychotics. Scz Res. 81: 291-300.
29.Othmen L.B., A. Mechri, C. Fendri, M. Bost, G. Chazot, L. Gaha, and A. Kerkeni. 2008. Altered
antioxidant defense system in clinically stable patients with schizophrenia and their affected
siblings. Progress in Neuro-Psychopharmacology and Biological Psychiatry 32: 1677-1681.
30.Kunz M, C.Severino Gama, A.C. Andreazza, M.Salvador, K.M. Cereser, F.A. Golmes, P.S.
Belmonte- de-Abreu, M. Berk, and F. Kapczinski. 2008. Elevated serum SOD and TBARS in
different phases of bipolar disorder and in schizophrenia. Progress in Neuro-
Psychopharmacology and Biological Psychiatry 32: 1677-1681.
by guest, on Novem
ber 9, 2018w
ww
.jlr.orgD
ownloaded from
14
Figures and Tables
by guest, on Novem
ber 9, 2018w
ww
.jlr.orgD
ownloaded from
15
Table 1: Determination of Total Plasma MDA
Detector Mean Plasma MDA (μM)
(n=8)
HPLC-DAD 6.03
HPLC-FLUORO 5.54
LC-DAD 6.56
LC-MS-SIM 5.78
by guest, on Novem
ber 9, 2018w
ww
.jlr.orgD
ownloaded from
16
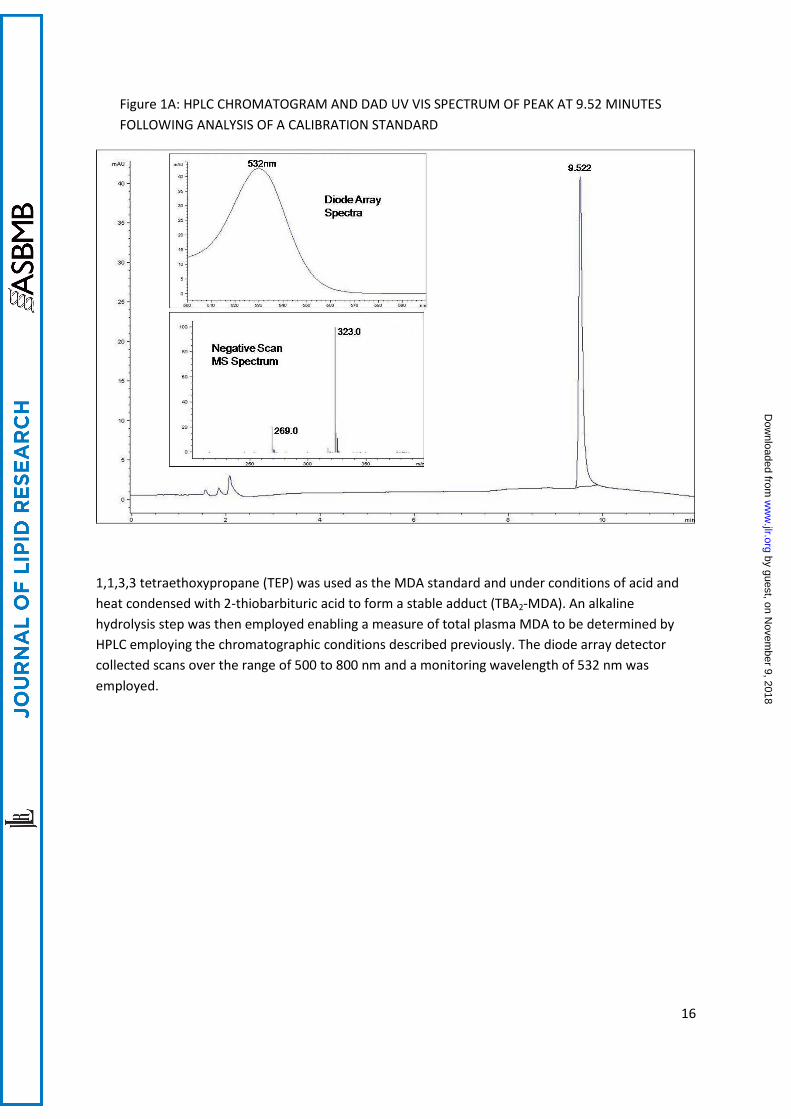
Figure 1A: HPLC CHROMATOGRAM AND DAD UV VIS SPECTRUM OF PEAK AT 9.52 MINUTES
FOLLOWING ANALYSIS OF A CALIBRATION STANDARD
1,1,3,3 tetraethoxypropane (TEP) was used as the MDA standard and under conditions of acid and
heat condensed with 2-thiobarbituric acid to form a stable adduct (TBA2-MDA). An alkaline
hydrolysis step was then employed enabling a measure of total plasma MDA to be determined by
HPLC employing the chromatographic conditions described previously. The diode array detector
collected scans over the range of 500 to 800 nm and a monitoring wavelength of 532 nm was
employed.
by guest, on Novem
ber 9, 2018w
ww
.jlr.orgD
ownloaded from
17
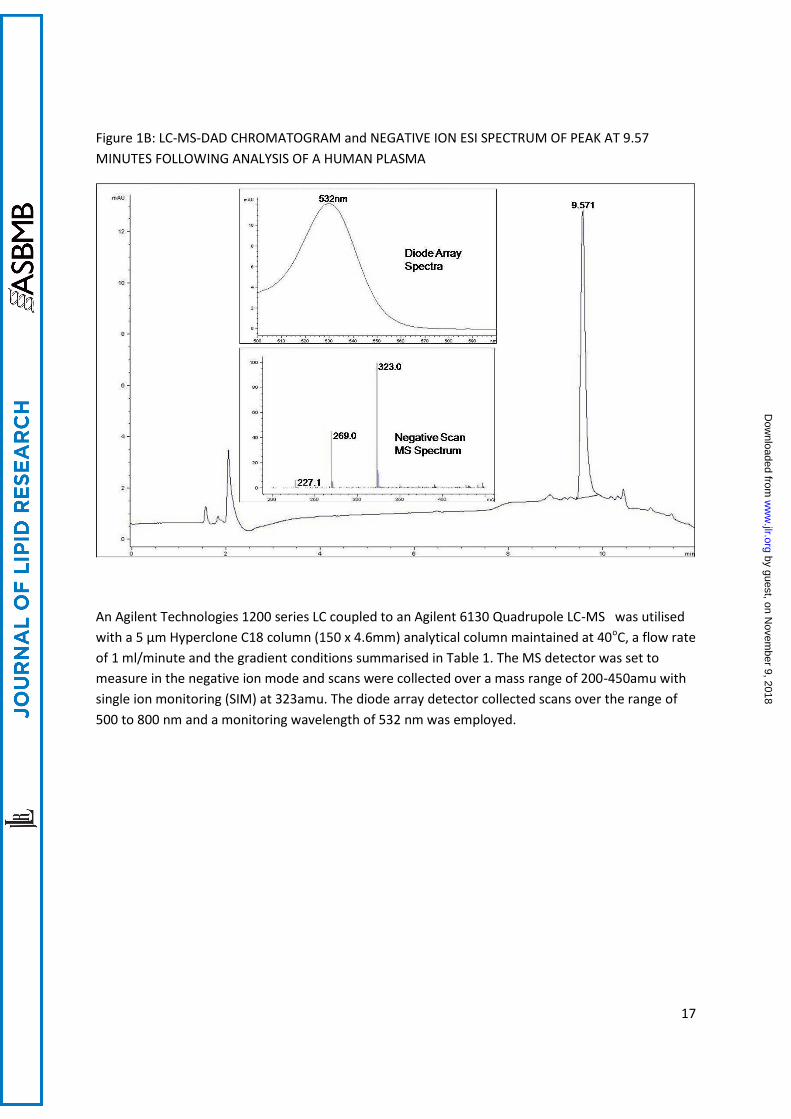
Figure 1B: LC-MS-DAD CHROMATOGRAM and NEGATIVE ION ESI SPECTRUM OF PEAK AT 9.57
MINUTES FOLLOWING ANALYSIS OF A HUMAN PLASMA
An Agilent Technologies 1200 series LC coupled to an Agilent 6130 Quadrupole LC-MS was utilised
with a 5 μm Hyperclone C18 column (150 x 4.6mm) analytical column maintained at 40oC, a flow rate
of 1 ml/minute and the gradient conditions summarised in Table 1. The MS detector was set to
measure in the negative ion mode and scans were collected over a mass range of 200-450amu with
single ion monitoring (SIM) at 323amu. The diode array detector collected scans over the range of
500 to 800 nm and a monitoring wavelength of 532 nm was employed.
by guest, on Novem
ber 9, 2018w
ww
.jlr.orgD
ownloaded from
18
Figure 2: Total Plasma MDA Determined by HPLC-DAD-Fluorescence and LC-MS-DAD
Data are the mean of quadruplicate assays ± sd.
Samples were analysed by HPLC-DAD(UV)–Fluorescence(Fl) and by LC-DAD(UV-2)-MS(SIM)
by guest, on Novem
ber 9, 2018w
ww
.jlr.orgD
ownloaded from
19
Figure 3a: Plasma TBARS Level Determined by UV Spectrophotometry
Figure 3b: Plasma MDA Level Determined by HPLC-UV-FLUORO
TBARS determinations were performed using a Hewlett Packard Diode Array spectrophotometerwith spectral scans being collected and absorbances being measured at 532 nm. Samples wereanalysed by reverse phase HPLC-DAD(UV)–Fluorescence (Fl) and by LC-DAD(UV-2)-MS(SIM).
The data are the mean of replicate assays (n=6) ± sd.
by guest, on Novem
ber 9, 2018w
ww
.jlr.orgD
ownloaded from