Embed Size (px)
Citation preview

1640 IEEE JOURNAL OF SELECTED TOPICS IN APPLIED EARTH OBSERVATIONS AND REMOTE SENSING, VOL. 9, NO. 4, APRIL 2016
A Spatial Fuzzy Clustering Algorithm With KernelMetric Based on Immune Clone for
SAR Image SegmentationRonghua Shang, Member, IEEE, Pingping Tian, Licheng Jiao, Senior Member, IEEE,
Rustam Stolkin, Member, IEEE, Jie Feng, Biao Hou, Member, IEEE, and Xiangrong Zhang, Member, IEEE
Abstract—The fuzzy c-means (FCM) clustering algorithm hasbeen widely used in image segmentation. However, FCM exhibitspoor robustness to noise, often leading to unsatisfactory seg-mentations on noisy images. Additionally, the FCM algorithm issensitive to the choice of initial cluster centers. In order to solvethese problems, this paper proposes clone kernel spatial FCM(CKS_FCM), which improves segmentation performance in sev-eral ways. First, in CKS_FCM, an immune clone algorithm isused to generate the initial cluster centers, which helps prevent thealgorithm from converging on local optima. Second, CKS_FCMimproves the robustness to noise by incorporating spatial informa-tion into the objective function of FCM. Third, CKS_FCM usesa non-Euclidean distance based on a kernels metric, instead ofthe Euclidean distance conventionally used in FCM, to enhancethe segmentation accuracy (SA). We present experimental resultson both real and synthetic SAR images, which suggest that theproposed method can generate higher accuracy, and obtain morerobustness to noise, as compared against six state-of-the-art meth-ods from the literatures.
Index Terms—Fuzzy C-means (FCM) cluster, immune clonealgorithm, kernels metric, spatial information.
I. INTRODUCTION
S YNTHETIC aperture radar (SAR) image segmentation isthe process of partitioning an SAR image into several dif-
ferent spatial regions, such that the pixels within each suchregion share similar characteristics, but are different betweenregions [1]. SAR Image segmentation plays a key role in envi-ronmental monitoring and civil applications [2]. The result ofimage segmentation directly affects the quality of subsequentimage analysis. Methods for quickly and effectively dividingthe target area of interest from a complex background aretherefore of significant interest [3]. SAR image segmentationalgorithms have been researched for several decades, and a
Manuscript received May 16, 2015; revised December 05, 2015; acceptedJanuary 03, 2016. Date of publication February 15, 2016; date of currentversion March 11, 2016. This work was supported in part by the NationalNatural Science Foundation of China, under Grant 61371201, Grant 61501353,and Grant 61271302, in part by the Program for New Century ExcellentTalents in University under Grant NCET-12-0920, in part by the Programfor New Scientific and Technological Star of Shaanxi Province under Grant2014KJXX-45.
R. Shang, P. Tian, L. Jiao, J. Feng, B. Hou and X. Zhang are with the KeyLaboratory of Intelligent Perception and Image Understanding of Ministry ofEducation, Xidian University, Xi’an 710071, China.
R. Stolkin is with the School of Mechanical Engineering,University of Birmingham, Birmingham B15 2TT, U.K. (e-mail:[email protected]).
Color versions of one or more of the figures in this paper are available onlineat http://ieeexplore.ieee.org.
Digital Object Identifier 10.1109/JSTARS.2016.2516014
large number of different image segmentation methods havebeen proposed. These methods include threshold method [4],[5], region split and merge [6]–[8], model [9], [10], level set[11], [12], clustering [13]–[16], and others. Fuzzy theory hasproved to be a useful way of handling image uncertainty andhas, therefore, been widely applied to image segmentation. Oneof the most successful and popular methods in the literature isthe fuzzy c-means (FCM) algorithm. FCM algorithm performsunsupervised clustering without needing human supervision,making it suitable for automatically segmenting images underconditions of fuzziness and uncertainty [17].
FCM is a nonlinear iterative optimization algorithm based onan objective function [18]. The objective function of FCM is aweighted similarity measure for each pixel of the image andthe cluster centers [19]. The algorithm for image segmentationminimizes the objective function by iteration to choose appro-priate cluster centers and membership degree matrix [20]. Afterthe convergence, the segmented image can be obtained by usingthe membership and centers [21]. However, FCM often over-looks the spatial information of the image and uses Euclideandistance, often resulting in low segmentation accuracy (SA) andpoor robustness to noise [13].
Many improved FCM algorithms have been proposed to tryand exploit spatial information from the image. Ahmed et al.[22] proposed FCM_S, which introduced a spatial informationterm into the objective function. In this algorithm, the neigh-borhood term is computed in each iteration step, so the timecomplexity is high. In order to solve this problem of FCM_S,Chen et al. [23] proposed FCM_S1 and FCM_S2. FCM_S1 andFCM_S2 modified the objective function by introducing meanand median filtering terms, respectively, instead of the neigh-borhood term. The time complexity of FCM_S1 and FCM_S2algorithm was reduced because the mean and median filteredimages can be calculated in advance. To improve the speedof the clustering algorithm, Szilayi et al. [24] proposed theEnFCM algorithm, which formed a linear weighted image fromthe original image and the mean filtering image and used thehistogram of the weighted image instead of pixels, therebyreducing computational complexity. Cai et al. [25] proposeda fast FCM (FGFCM) algorithm, which introduced similaritybetween pixels [26] to form a nonlinearly weighted image.
When the noise of the image is large, the neighborhood infor-mation may also contain abnormal features. So the nonlocalinformation is utilized in improved FCM algorithms. LNFCM[27], FCM_NLS [28], and FCA_NLASC [29] incorporate the
1939-1404 © 2016 IEEE. Personal use is permitted, but republication/redistribution requires IEEE permission.See http://www.ieee.org/publications_standards/publications/rights/index.html for more information.
SHANG et al.: SPATIAL FUZZY CLUSTERING ALGORITHM WITH KERNEL METRIC BASED ON IMMUNE CLONE 1641
nonlocal spatial information into FCM, respectively. All ofthese algorithms have been applied to noisy images, but thefiltering degree parameter is hard to choose when the level ofnoise in an image is unclear. Jian et al. proposed NS_FCM[30]. This method improved a nonlocal means, including a newdistance measure and an adaptive filtering degree parameter.NS_FCM also introduced between-cluster variation [31] intothe objective function so that the robustness of the algorithm isincreased.
The above-mentioned algorithms can achieve promisingresults on synthetic images, natural images, and medicalimages. However, when dealing with SAR images, they oftengenerate unsatisfactory results. Furthermore, they may generatepoor segmentation performance for images, which contain alot of noise and some very similar classes. In addition, they aresensitive to the initial choice of cluster centers and prone tolocal optima convergence. Therefore, the automatic segmen-tation of SAR images using clustering algorithms remains achallenging problem. Our motivation is to try to solve theseproblems.
This paper proposes a spatial fuzzy clustering algorithmwith kernel metric based on immune clone (CKS_FCM). Itfirst uses the immune clone to get the initial cluster centers,which can reduce the likelihood of FCM converging on localoptima. Then, we propose the improved nonlocal means fil-ter in which the filter parameter is adjusted according to thenoise. We introduce between-cluster variation and a nonlocalspatial information term into the objective function, which areobtained by the improved nonlocal means filter. By introducingthese two terms, CKS_FCM utilizes nonlocal spatial informa-tion to reduce the effects of the noise and it considers boththe compactness and the separation of the clustering results.So, CKS_FCM can adjust the distance between the clustercenters flexibly. Next, we use a non-Euclidean kernel-baseddistance in CKS_FCM, instead of the conventional Euclideandistance used in FCM. Clustering algorithms based on thenon-Euclidean distance have been shown to be robust to out-liers and noise [32]. Therefore, CKS_FCM is able to generatehigh SA and is more robustness to noise and outliers. Thedifferences between the proposed method and the previouslymethods are summarized as follows. In CKS_FCM, the non-local spatial information term is introduced into FCM. Thedifference between the previously proposed FCM algorithms(e.g., LNFCM, FCM_NLS, and FCA_NLASC) is that the non-local spatial information in the CKS_FCM is obtained by theimproved nonlocal means. The improved nonlocal means isproposed in this paper by using the adjustable filter parame-ter. The improved nonlocal means obtains the filter parameteraccording to the noise of the image and gets more reason-able result. The between-cluster variation term is introducedin CKS_FCM which is inspired by NS_FCM. By introduc-ing the between cluster variation term, CKS_FCM considersboth the compactness and the separation of the clusteringresults.
This paper is organized as follows. Section II introduces theCKS_FCM algorithm in detail. Section III describes empiri-cal experiments on synthetic SAR images, real SAR images.Section IV provides concluding remarks.
II. PROPOSED ALGORITHM
A. Motivation and Notation
In conventional FCM, if the initial cluster centers are close tothe final cluster centers, the number of iteration will be less, theamount of computation will be small and the convergence ofthe algorithm will be fast. Therefore, it is crucial to produce thegood initial cluster centers. Immune clone is an optimizationalgorithm that simulates the biological principle of acquiredimmune clone. It is stable and comparatively reliable for findingoptimal solutions. Immune clone can overcome the weaknessesof FCM, which is sensitive to initial choices of cluster centersand is prone to convergence on local optimal. In view of theseshortcomings, this paper obtains the initial cluster centers fromthe immune clone algorithm, and further optimizes them byusing an improved FCM algorithm. The proposed method notonly takes advantages of the global search ability of immuneclone but also exploits the local search ability of FCM. Hence,the clustering results are more reliable and image segmentationquality is significantly improved.
This paper also introduces a mean filtering term and abetween-cluster separation term into the objective function ofthe FCM algorithm. Nonlocal image information is encodedin the mean filtering image term so that it can reduce theimpact of noise on the original image. The between-clusterseparation term can effectively solve the problem that FCMonly considers compactness within cluster and ignores separa-tion distance between clusters. Using non-Euclidean distancebased on a Gaussian kernel, instead of the Euclidean distanceof the conventional FCM algorithm, the proposed method cansignificantly improve SA and robustness against image noise.
The notation is summarized as follows. In immune clone,ai(t) denotes the antibody, A1(t) denotes the initial antibodygroups, A2(t) denotes the cloning antibody groups, A3(t)denotes the mutation antibody groups, pm denotes the mutationprobability, and NC denotes the number of clones. In improvednonlocal means, r denotes the radius of the nonlocal searchwindow. xi denotes the nonlocal weighted mean. In improvedFCM, N denotes the number of pixels in the image, c is thenumber of clusters and uki is the membership degree of pixelxi belonging to the cluster k. Parameter m is a weighting expo-nent on each fuzzy membership and xi denotes the pixels ofthe original image. Gki is a fuzzy factor, k(xi, Vk) denotes thenon-Euclidean distance.
B. Image Clustering Procedure
The basic framework of CKS_FCM can be divided into threeparts: initialization of cluster centers; image filtering based onimproved nonlocal means; and iteration of CKS_FCM.
1) Initialize Cluster Centers: The initial cluster centersmust be given in FCM. FCM is sensitive to the choice of initialcluster center positions, and is prone to local minima conver-gence. The immune clone algorithm [33] can help overcomethese weaknesses of FCM. The main steps of immune clonealgorithm [34] adapted for CKS_FCM are as follows.
a) Antibody encode: In CKS_FCM, we encode the anti-body based on the clustering center as genes by floating-point.
1642 IEEE JOURNAL OF SELECTED TOPICS IN APPLIED EARTH OBSERVATIONS AND REMOTE SENSING, VOL. 9, NO. 4, APRIL 2016
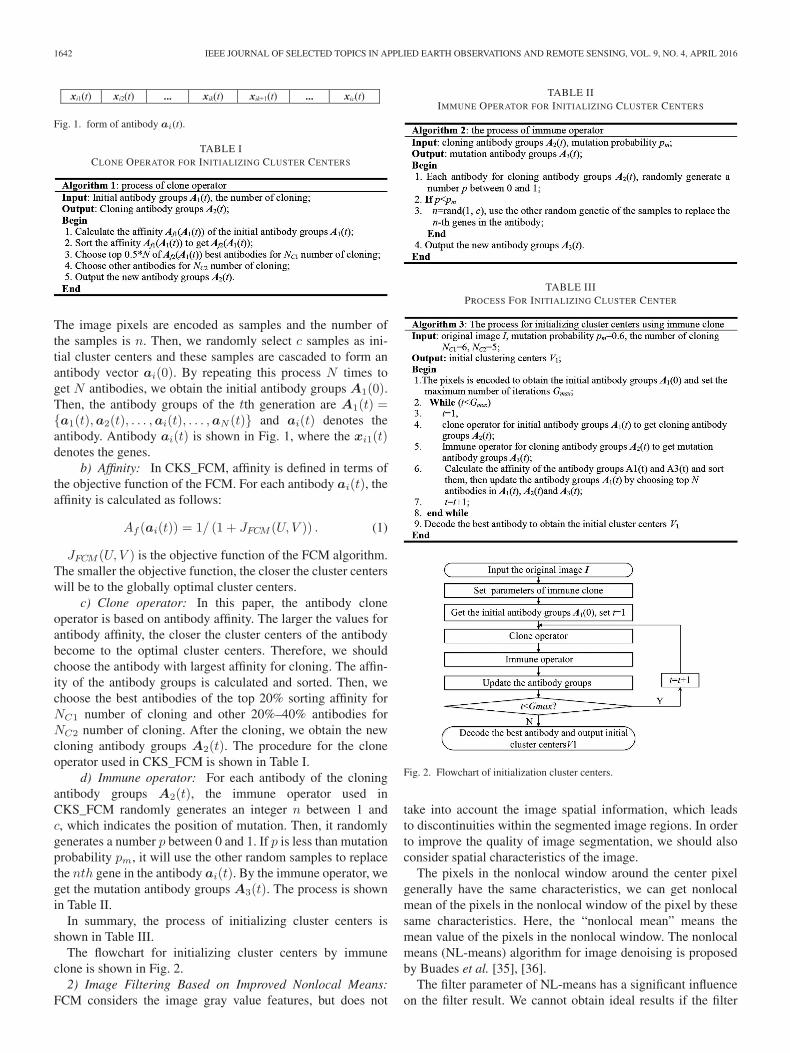
Fig. 1. form of antibody ai(t).
TABLE ICLONE OPERATOR FOR INITIALIZING CLUSTER CENTERS
The image pixels are encoded as samples and the number ofthe samples is n. Then, we randomly select c samples as ini-tial cluster centers and these samples are cascaded to form anantibody vector ai(0). By repeating this process N times toget N antibodies, we obtain the initial antibody groups A1(0).Then, the antibody groups of the tth generation are A1(t) ={a1(t),a2(t), . . . ,ai(t), . . . ,aN (t)} and ai(t) denotes theantibody. Antibody ai(t) is shown in Fig. 1, where the xi1(t)denotes the genes.
b) Affinity: In CKS_FCM, affinity is defined in terms ofthe objective function of the FCM. For each antibody ai(t), theaffinity is calculated as follows:
Af (ai(t)) = 1/ (1 + JFCM (U, V )) . (1)
JFCM (U, V ) is the objective function of the FCM algorithm.The smaller the objective function, the closer the cluster centerswill be to the globally optimal cluster centers.
c) Clone operator: In this paper, the antibody cloneoperator is based on antibody affinity. The larger the values forantibody affinity, the closer the cluster centers of the antibodybecome to the optimal cluster centers. Therefore, we shouldchoose the antibody with largest affinity for cloning. The affin-ity of the antibody groups is calculated and sorted. Then, wechoose the best antibodies of the top 20% sorting affinity forNC1 number of cloning and other 20%–40% antibodies forNC2 number of cloning. After the cloning, we obtain the newcloning antibody groups A2(t). The procedure for the cloneoperator used in CKS_FCM is shown in Table I.
d) Immune operator: For each antibody of the cloningantibody groups A2(t), the immune operator used inCKS_FCM randomly generates an integer n between 1 andc, which indicates the position of mutation. Then, it randomlygenerates a number p between 0 and 1. If p is less than mutationprobability pm, it will use the other random samples to replacethe nth gene in the antibody ai(t). By the immune operator, weget the mutation antibody groups A3(t). The process is shownin Table II.
In summary, the process of initializing cluster centers isshown in Table III.
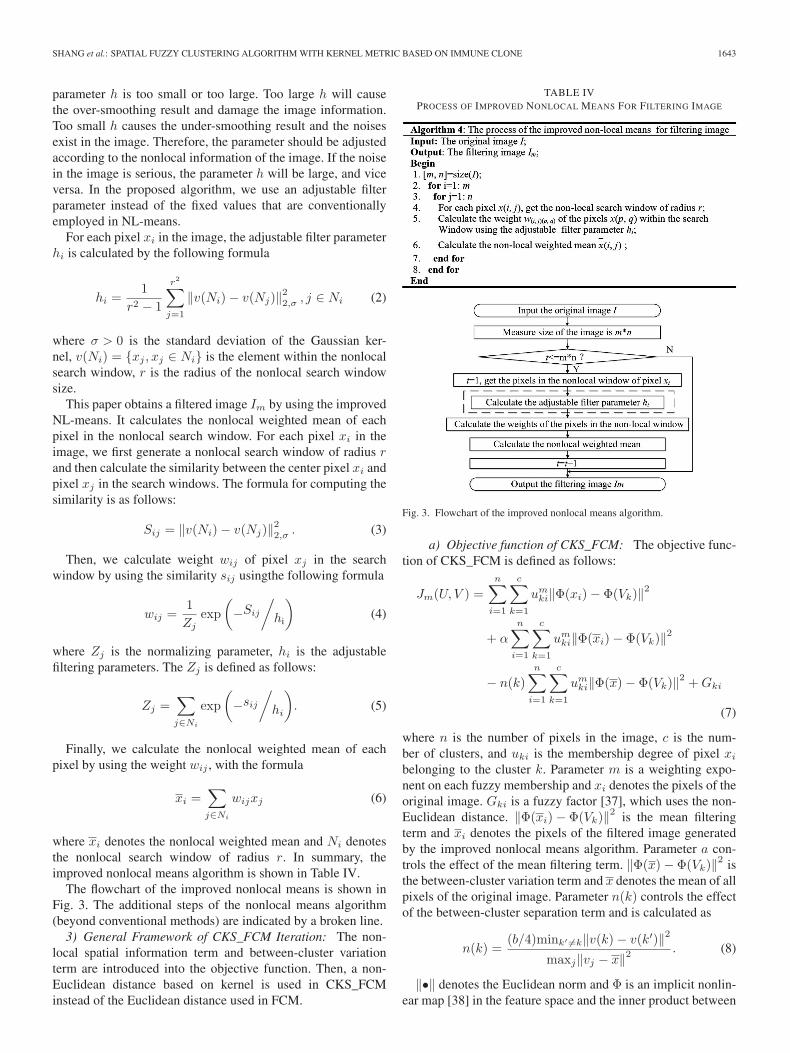
The flowchart for initializing cluster centers by immuneclone is shown in Fig. 2.
2) Image Filtering Based on Improved Nonlocal Means:FCM considers the image gray value features, but does not
TABLE IIIMMUNE OPERATOR FOR INITIALIZING CLUSTER CENTERS
TABLE IIIPROCESS FOR INITIALIZING CLUSTER CENTER
Fig. 2. Flowchart of initialization cluster centers.
take into account the image spatial information, which leadsto discontinuities within the segmented image regions. In orderto improve the quality of image segmentation, we should alsoconsider spatial characteristics of the image.
The pixels in the nonlocal window around the center pixelgenerally have the same characteristics, we can get nonlocalmean of the pixels in the nonlocal window of the pixel by thesesame characteristics. Here, the “nonlocal mean” means themean value of the pixels in the nonlocal window. The nonlocalmeans (NL-means) algorithm for image denoising is proposedby Buades et al. [35], [36].
The filter parameter of NL-means has a significant influenceon the filter result. We cannot obtain ideal results if the filter
SHANG et al.: SPATIAL FUZZY CLUSTERING ALGORITHM WITH KERNEL METRIC BASED ON IMMUNE CLONE 1643
parameter h is too small or too large. Too large h will causethe over-smoothing result and damage the image information.Too small h causes the under-smoothing result and the noisesexist in the image. Therefore, the parameter should be adjustedaccording to the nonlocal information of the image. If the noisein the image is serious, the parameter h will be large, and viceversa. In the proposed algorithm, we use an adjustable filterparameter instead of the fixed values that are conventionallyemployed in NL-means.
For each pixel xi in the image, the adjustable filter parameterhi is calculated by the following formula
hi =1
r2 − 1
r2∑j=1
‖v(Ni)− v(Nj)‖22,σ , j ∈ Ni (2)
where σ > 0 is the standard deviation of the Gaussian ker-nel, v(Ni) = {xj , xj ∈ Ni} is the element within the nonlocalsearch window, r is the radius of the nonlocal search windowsize.
This paper obtains a filtered image Im by using the improvedNL-means. It calculates the nonlocal weighted mean of eachpixel in the nonlocal search window. For each pixel xi in theimage, we first generate a nonlocal search window of radius rand then calculate the similarity between the center pixel xi andpixel xj in the search windows. The formula for computing thesimilarity is as follows:
Sij = ‖v(Ni)− v(Nj)‖22,σ . (3)
Then, we calculate weight wij of pixel xj in the searchwindow by using the similarity sij usingthe following formula
wij =1
Zjexp
(−Sij
/hi
)(4)
where Zj is the normalizing parameter, hi is the adjustablefiltering parameters. The Zj is defined as follows:
Zj =∑j∈Ni
exp
(−sij
/hi
). (5)
Finally, we calculate the nonlocal weighted mean of eachpixel by using the weight wij , with the formula
xi =∑j∈Ni
wijxj (6)
where xi denotes the nonlocal weighted mean and Ni denotesthe nonlocal search window of radius r. In summary, theimproved nonlocal means algorithm is shown in Table IV.
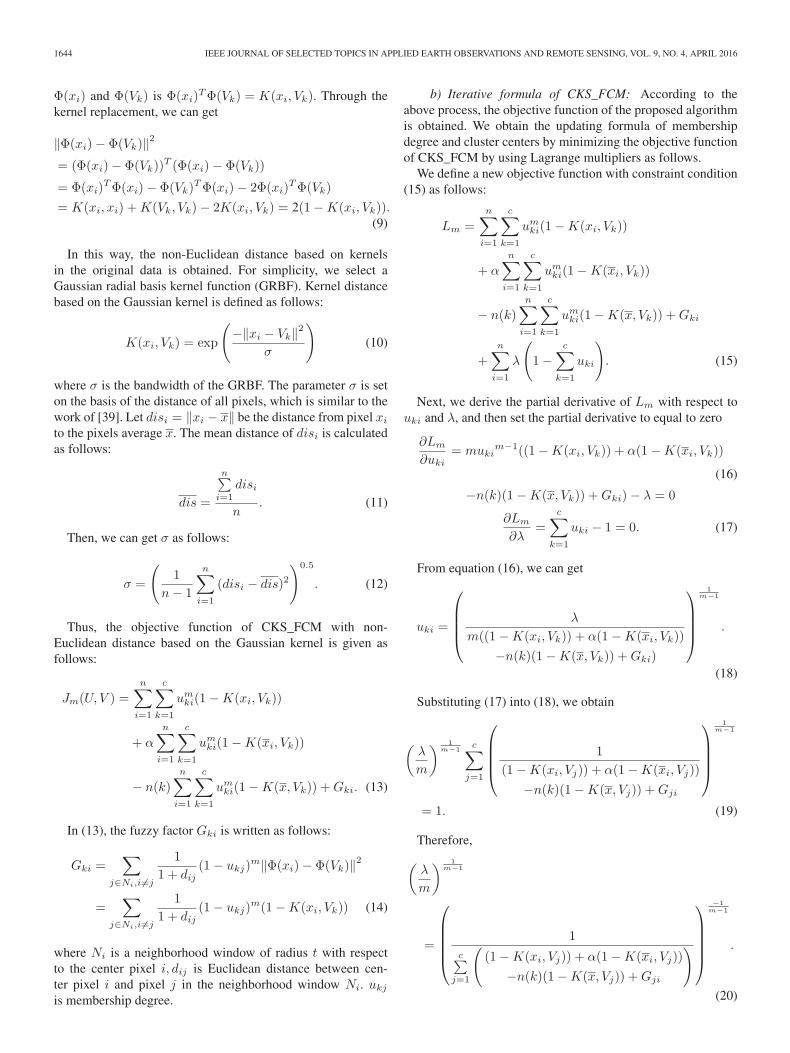
The flowchart of the improved nonlocal means is shown inFig. 3. The additional steps of the nonlocal means algorithm(beyond conventional methods) are indicated by a broken line.
3) General Framework of CKS_FCM Iteration: The non-local spatial information term and between-cluster variationterm are introduced into the objective function. Then, a non-Euclidean distance based on kernel is used in CKS_FCMinstead of the Euclidean distance used in FCM.
TABLE IVPROCESS OF IMPROVED NONLOCAL MEANS FOR FILTERING IMAGE
Fig. 3. Flowchart of the improved nonlocal means algorithm.
a) Objective function of CKS_FCM: The objective func-tion of CKS_FCM is defined as follows:
Jm(U, V ) =
n∑i=1
c∑k=1
umki‖Φ(xi)− Φ(Vk)‖2
+ α
n∑i=1
c∑k=1
umki‖Φ(xi)− Φ(Vk)‖2
− n(k)
n∑i=1
c∑k=1
umki‖Φ(x)− Φ(Vk)‖2 +Gki
(7)
where n is the number of pixels in the image, c is the num-ber of clusters, and uki is the membership degree of pixel xi
belonging to the cluster k. Parameter m is a weighting expo-nent on each fuzzy membership and xi denotes the pixels of theoriginal image. Gki is a fuzzy factor [37], which uses the non-Euclidean distance. ‖Φ(xi)− Φ(Vk)‖2 is the mean filteringterm and xi denotes the pixels of the filtered image generatedby the improved nonlocal means algorithm. Parameter a con-trols the effect of the mean filtering term. ‖Φ(x)− Φ(Vk)‖2 isthe between-cluster variation term and x denotes the mean of allpixels of the original image. Parameter n(k) controls the effectof the between-cluster separation term and is calculated as
n(k) =(b/4)mink′ �=k‖v(k)− v(k′)‖2
maxj‖vj − x‖2 . (8)
‖•‖ denotes the Euclidean norm and Φ is an implicit nonlin-ear map [38] in the feature space and the inner product between
1644 IEEE JOURNAL OF SELECTED TOPICS IN APPLIED EARTH OBSERVATIONS AND REMOTE SENSING, VOL. 9, NO. 4, APRIL 2016
Φ(xi) and Φ(Vk) is Φ(xi)TΦ(Vk) = K(xi, Vk). Through the
kernel replacement, we can get
‖Φ(xi)− Φ(Vk)‖2= (Φ(xi)− Φ(Vk))
T (Φ(xi)− Φ(Vk))
= Φ(xi)TΦ(xi)− Φ(Vk)
TΦ(xi)− 2Φ(xi)TΦ(Vk)
= K(xi, xi) +K(Vk, Vk)− 2K(xi, Vk) = 2(1−K(xi, Vk)).(9)
In this way, the non-Euclidean distance based on kernelsin the original data is obtained. For simplicity, we select aGaussian radial basis kernel function (GRBF). Kernel distancebased on the Gaussian kernel is defined as follows:
K(xi, Vk) = exp
(−‖xi − Vk‖2
σ
)(10)
where σ is the bandwidth of the GRBF. The parameter σ is seton the basis of the distance of all pixels, which is similar to thework of [39]. Let disi = ‖xi − x‖ be the distance from pixel xi
to the pixels average x. The mean distance of disi is calculatedas follows:
dis =
n∑i=1
disi
n. (11)
Then, we can get σ as follows:
σ =
(1
n− 1
n∑i=1
(disi − dis)2
)0.5
. (12)
Thus, the objective function of CKS_FCM with non-Euclidean distance based on the Gaussian kernel is given asfollows:
Jm(U, V ) =
n∑i=1
c∑k=1
umki(1−K(xi, Vk))
+ α
n∑i=1
c∑k=1
umki(1−K(xi, Vk))
− n(k)
n∑i=1
c∑k=1
umki(1−K(x, Vk)) +Gki. (13)
In (13), the fuzzy factor Gki is written as follows:
Gki =∑
j∈Ni,i �=j
1
1 + dij(1− ukj)
m‖Φ(xi)− Φ(Vk)‖2
=∑
j∈Ni,i �=j
1
1 + dij(1− ukj)
m(1−K(xi, Vk)) (14)
where Ni is a neighborhood window of radius t with respectto the center pixel i, dij is Euclidean distance between cen-ter pixel i and pixel j in the neighborhood window Ni. ukj
is membership degree.
b) Iterative formula of CKS_FCM: According to theabove process, the objective function of the proposed algorithmis obtained. We obtain the updating formula of membershipdegree and cluster centers by minimizing the objective functionof CKS_FCM by using Lagrange multipliers as follows.
We define a new objective function with constraint condition(15) as follows:
Lm =n∑
i=1
c∑k=1
umki(1−K(xi, Vk))
+ αn∑
i=1
c∑k=1
umki(1−K(xi, Vk))
− n(k)
n∑i=1
c∑k=1
umki(1−K(x, Vk)) +Gki
+n∑
i=1
λ
(1−
c∑k=1
uki
). (15)
Next, we derive the partial derivative of Lm with respect touki and λ, and then set the partial derivative to equal to zero
∂Lm
∂uki= muki
m−1((1−K(xi, Vk)) + α(1−K(xi, Vk))
(16)
−n(k)(1−K(x, Vk)) +Gki)− λ = 0
∂Lm
∂λ=
c∑k=1
uki − 1 = 0. (17)
From equation (16), we can get
uki =
⎛⎜⎜⎜⎝ λ
m((1−K(xi, Vk)) + α(1−K(xi, Vk))
−n(k)(1−K(x, Vk)) +Gki)
⎞⎟⎟⎟⎠
1m−1
.
(18)
Substituting (17) into (18), we obtain
(λ
m
) 1m−1
c∑j=1
⎛⎜⎜⎜⎝ 1
(1−K(xi, Vj)) + α(1−K(xi, Vj))
−n(k)(1−K(x, Vj)) +Gji
⎞⎟⎟⎟⎠
1m−1
= 1. (19)
Therefore,(λ
m
) 1m−1
=
⎛⎜⎜⎜⎜⎝
1
c∑j=1
((1−K(xi, Vj)) + α(1−K(xi, Vj))
−n(k)(1−K(x, Vj)) +Gji
)⎞⎟⎟⎟⎟⎠
−1m−1
.
(20)
SHANG et al.: SPATIAL FUZZY CLUSTERING ALGORITHM WITH KERNEL METRIC BASED ON IMMUNE CLONE 1645
Finally, substituting (20) into (18), we can get the member-ship degree in (21), shown at the bottom of the page.
Similarly, we obtain the partial derivative of Lm with respectto Vk
∂Lm
∂Vk
=
n∑i=1
ukim
(K(xi, Vk)
2(xi−Vk)σ + αK(xi, Vk)
2(xi−Vk)σ
−n(k)K(x, Vk)2(x−Vk)
σ
)= 0.
(22)
From (22), we haven∑
i=1
ukim (K(xi, Vk)xi + αK(xi, Vk)xi − n(k)K(x, Vk)x)
=
n∑i=1
ukim (K(xi, Vk) + αK(xi, Vk)− n(k)K(x, Vk))Vk.
(23)
Finally, we get the cluster center as follows:
Vk
=
n∑i=1
ukim(K(xi, Vk)xi + αK(xi, Vk)xi − n(k)K(x, Vk)x)
n∑i=1
ukim (K(xi, Vk) + αK(xi, Vk)− n(k)K(x, Vk))
.
(24)
The CKS_FCM algorithm constantly updates its member-ship matrix and cluster centers by using the membership degreeformula (21), shown at the bottom of the page, and cluster cen-ters formula (24). It will not stop until the difference betweenthe new cluster centers and the last cluster centers is less thanthe stop condition. Once the algorithm has converged, we cangenerate the segmented image by using the final membershipdegree and cluster centers.
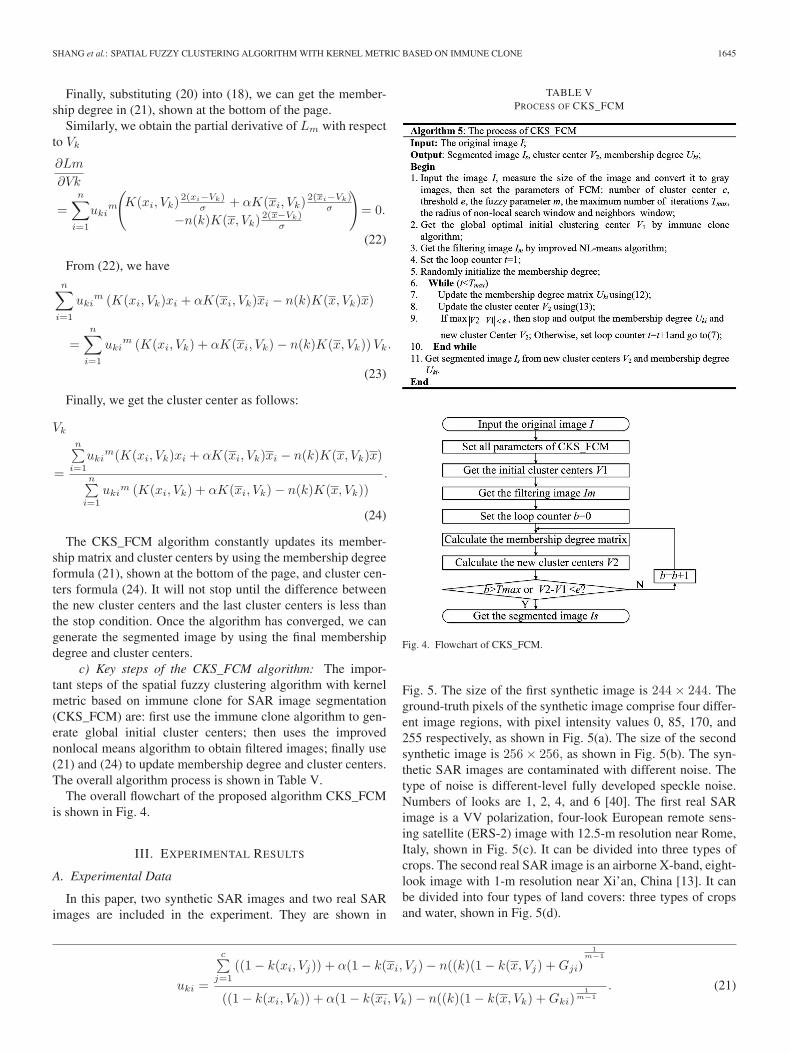
c) Key steps of the CKS_FCM algorithm: The impor-tant steps of the spatial fuzzy clustering algorithm with kernelmetric based on immune clone for SAR image segmentation(CKS_FCM) are: first use the immune clone algorithm to gen-erate global initial cluster centers; then uses the improvednonlocal means algorithm to obtain filtered images; finally use(21) and (24) to update membership degree and cluster centers.The overall algorithm process is shown in Table V.
The overall flowchart of the proposed algorithm CKS_FCMis shown in Fig. 4.
III. EXPERIMENTAL RESULTS
A. Experimental Data
In this paper, two synthetic SAR images and two real SARimages are included in the experiment. They are shown in
uki =
c∑j=1
((1− k(xi, Vj)) + α(1− k(xi, Vj)− n((k)(1− k(x, Vj) +Gji)1
m−1
((1− k(xi, Vk)) + α(1− k(xi, Vk)− n((k)(1− k(x, Vk) +Gki)1
m−1
. (21)
TABLE VPROCESS OF CKS_FCM
Fig. 4. Flowchart of CKS_FCM.
Fig. 5. The size of the first synthetic image is 244× 244. Theground-truth pixels of the synthetic image comprise four differ-ent image regions, with pixel intensity values 0, 85, 170, and255 respectively, as shown in Fig. 5(a). The size of the secondsynthetic image is 256× 256, as shown in Fig. 5(b). The syn-thetic SAR images are contaminated with different noise. Thetype of noise is different-level fully developed speckle noise.Numbers of looks are 1, 2, 4, and 6 [40]. The first real SARimage is a VV polarization, four-look European remote sens-ing satellite (ERS-2) image with 12.5-m resolution near Rome,Italy, shown in Fig. 5(c). It can be divided into three types ofcrops. The second real SAR image is an airborne X-band, eight-look image with 1-m resolution near Xi’an, China [13]. It canbe divided into four types of land covers: three types of cropsand water, shown in Fig. 5(d).

1646 IEEE JOURNAL OF SELECTED TOPICS IN APPLIED EARTH OBSERVATIONS AND REMOTE SENSING, VOL. 9, NO. 4, APRIL 2016
Fig. 5. Experimental data.
B. Evaluation Indexes
In this paper, we use the SA, partition coefficient vpc and par-tition entropy vpe as the evaluation indices. SA is defined as thesum of correctly classified pixels divided by the total number ofpixels [41]
SA =
c∑i=1
Ai ∩ Cic∑
j=1
Cj
(25)
where c is the number of clusters, Ai denotes the pixels belong-ing to the ith class found by algorithm, and Ci denotes thepixels belonging to the ith class in the reference segmentedimage.
Partition coefficient vpc and partition entropy vpe [42] aredefined as
vpc =
∑ni=1
∑ck=1 u
2ki
n(26)
vpe =−∑n
i=1
∑ck=1 (uki log uki)
n(27)
where n is the number of pixels in the image, c is the numberof clusters, and uki is the membership degree.
The best clustering result is achieved when SA approachesto1, vpc approaches to1 and vpe approaches to 0.
C. Performance Comparison of Algorithms and ParameterAnalysis
In order to evaluate the efficiency of CKS_FCM, we use theFCM_S1 [21], FCM_S2 [21], KFCM_S1 [21], KFCM_S2 [21],FLICM [37], and NS_FCM [29] as the compared algorithms.For all algorithms, we set the fuzziness index m = 2, the thresh-old e = 0.01, the maximum iteration number Tmax = 500,respectively. The radius of neighborhood for compared algo-rithms is 3. According to the literature [21], the parameter α isset to 5 for FCM_S1, FCM_S2, KFCM_S1, and KFCM_S2.The parameter α and β for NS_FCM are 5.5. The nonlocalmean search window is 11× 11 for NS_FCM. The parametersuses in this method are analyzed as follows:
Fig. 6. SA values, the partition coefficient vpc, and partition entropy vpe ofCKS_FCM with different size of window.
1) Size of Search Window and the Size of NeighborhoodWindow: The size of the nonlocal search window and the sizeof the neighborhood window are analyzed in this section. Weinvestigate these two parameters on 4-look amplitude syntheticspeckled image, which is shown in Fig. 5(a). The value ofsearch window r changes from 5 to 13 with an interval of 1.The value of neighborhood window t changes from 1 to 5 withan interval of 1. The SA values, the partition coefficient vpc andpartition entropy vpe of CKS_FCM with different radiuses areshown in Fig. 6.
It can be seen from Fig. 6 that the size of the nonlocal searchwindow and the size of the neighborhood window affect theresults. It is shown in Fig. 6(a) that with each r, the SA val-ues are low when the neighborhood window t is 1 and 2. Whent is larger than 3, the SA becomes higher. The curve of parti-tion coefficient vpc rises acutely with the increase of t from1 to3. The curve of partition entropy vpe reduces acutely with theincrease of t from1 to 3. Moreover, with each t, the SA curveand partition coefficient vpc ascend acutely with r from 5 to 11,and changes little with r is more than 11. The partition entropyvpe reduces acutely with r from 5 to 9, and changes little with ris more than 9. So, we choose the size of neighborhood windowt = 3, the size of nonlocal search window r = 11, consideringthe tradeoff between performance and computational cost.
2) Parameters a and b: Two free parameters a and b areanalyzed in this section. Parameter a controls the effect ofthe mean filtering term and b is a part in n(k), ****whichcontrols the effect of the between-cluster separation term. Westudy these two parameters on the synthetic image 1 shownin Fig. 5(a). The 4-look amplitude synthetic speckled image isused for testing. The SA values, the partition coefficient vpc,and partition entropy vpe of CKS_FCM with different values ofα and b are shown in Fig. 7.
It can be seen from Fig. 7(a) that the SA value increasessignificantly with the increase of α and b from 1 to 6. FromFig. 7(b), with the increase of both a and b from 1 to 6, thepartition coefficient vpc value increases. When a is 6 and b is
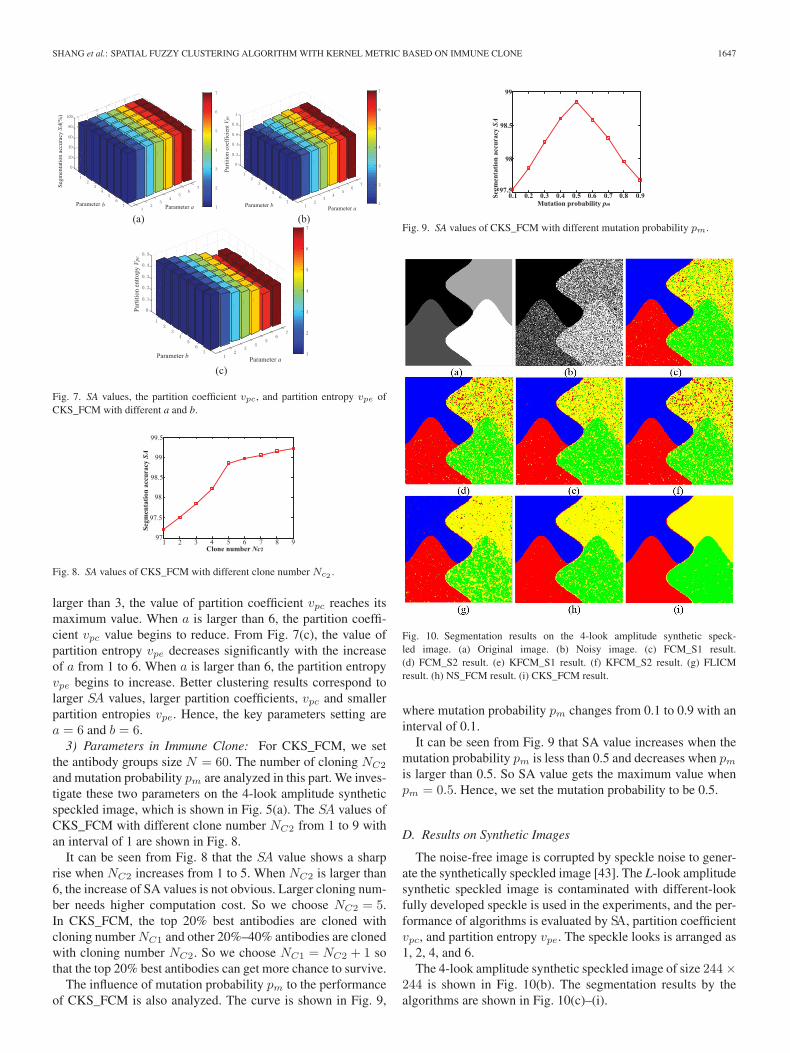
SHANG et al.: SPATIAL FUZZY CLUSTERING ALGORITHM WITH KERNEL METRIC BASED ON IMMUNE CLONE 1647
Fig. 7. SA values, the partition coefficient vpc, and partition entropy vpe ofCKS_FCM with different a and b.
Fig. 8. SA values of CKS_FCM with different clone number Nc2 .
larger than 3, the value of partition coefficient vpc reaches itsmaximum value. When a is larger than 6, the partition coeffi-cient vpc value begins to reduce. From Fig. 7(c), the value ofpartition entropy vpe decreases significantly with the increaseof a from 1 to 6. When a is larger than 6, the partition entropyvpe begins to increase. Better clustering results correspond tolarger SA values, larger partition coefficients, vpc and smallerpartition entropies vpe. Hence, the key parameters setting area = 6 and b = 6.
3) Parameters in Immune Clone: For CKS_FCM, we setthe antibody groups size N = 60. The number of cloning NC2
and mutation probability pm are analyzed in this part. We inves-tigate these two parameters on the 4-look amplitude syntheticspeckled image, which is shown in Fig. 5(a). The SA values ofCKS_FCM with different clone number NC2 from 1 to 9 withan interval of 1 are shown in Fig. 8.
It can be seen from Fig. 8 that the SA value shows a sharprise when NC2 increases from 1 to 5. When NC2 is larger than6, the increase of SA values is not obvious. Larger cloning num-ber needs higher computation cost. So we choose NC2 = 5.In CKS_FCM, the top 20% best antibodies are cloned withcloning number NC1 and other 20%–40% antibodies are clonedwith cloning number NC2. So we choose NC1 = NC2 + 1 sothat the top 20% best antibodies can get more chance to survive.
The influence of mutation probability pm to the performanceof CKS_FCM is also analyzed. The curve is shown in Fig. 9,
Fig. 9. SA values of CKS_FCM with different mutation probability pm.
Fig. 10. Segmentation results on the 4-look amplitude synthetic speck-led image. (a) Original image. (b) Noisy image. (c) FCM_S1 result.(d) FCM_S2 result. (e) KFCM_S1 result. (f) KFCM_S2 result. (g) FLICMresult. (h) NS_FCM result. (i) CKS_FCM result.
where mutation probability pm changes from 0.1 to 0.9 with aninterval of 0.1.
It can be seen from Fig. 9 that SA value increases when themutation probability pm is less than 0.5 and decreases when pmis larger than 0.5. So SA value gets the maximum value whenpm = 0.5. Hence, we set the mutation probability to be 0.5.
D. Results on Synthetic Images
The noise-free image is corrupted by speckle noise to gener-ate the synthetically speckled image [43]. The L-look amplitudesynthetic speckled image is contaminated with different-lookfully developed speckle is used in the experiments, and the per-formance of algorithms is evaluated by SA, partition coefficientvpc, and partition entropy vpe. The speckle looks is arranged as1, 2, 4, and 6.
The 4-look amplitude synthetic speckled image of size 244×244 is shown in Fig. 10(b). The segmentation results by thealgorithms are shown in Fig. 10(c)–(i).
1648 IEEE JOURNAL OF SELECTED TOPICS IN APPLIED EARTH OBSERVATIONS AND REMOTE SENSING, VOL. 9, NO. 4, APRIL 2016
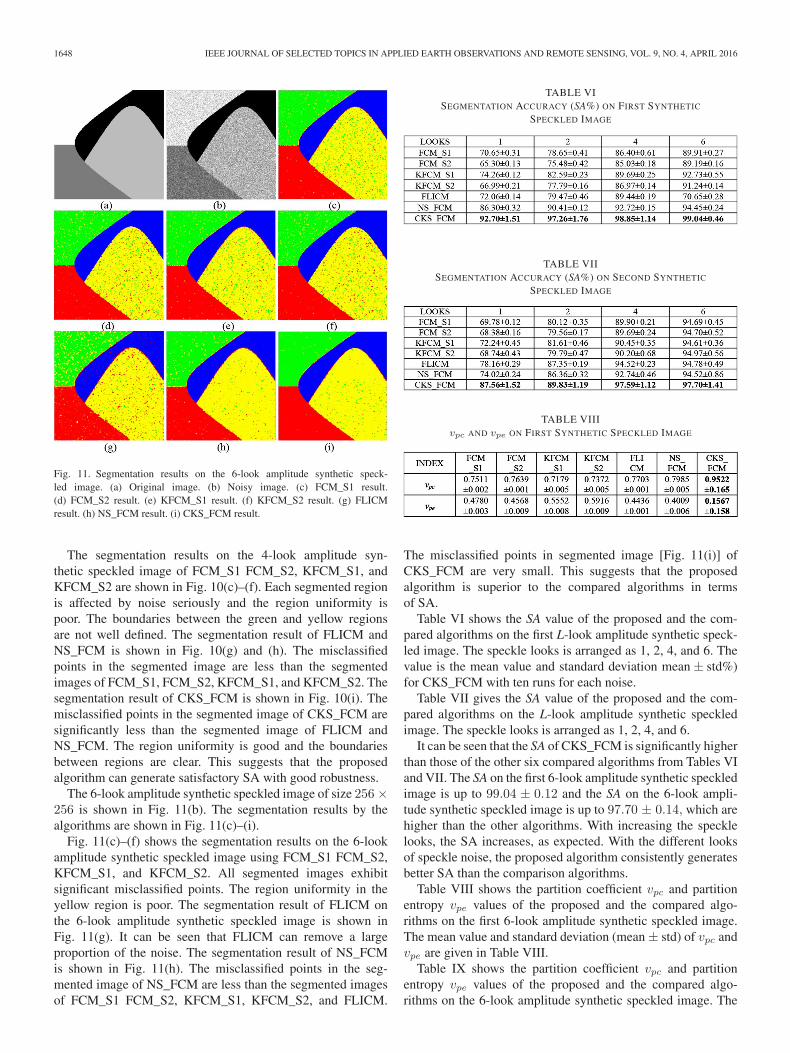
Fig. 11. Segmentation results on the 6-look amplitude synthetic speck-led image. (a) Original image. (b) Noisy image. (c) FCM_S1 result.(d) FCM_S2 result. (e) KFCM_S1 result. (f) KFCM_S2 result. (g) FLICMresult. (h) NS_FCM result. (i) CKS_FCM result.
The segmentation results on the 4-look amplitude syn-thetic speckled image of FCM_S1 FCM_S2, KFCM_S1, andKFCM_S2 are shown in Fig. 10(c)–(f). Each segmented regionis affected by noise seriously and the region uniformity ispoor. The boundaries between the green and yellow regionsare not well defined. The segmentation result of FLICM andNS_FCM is shown in Fig. 10(g) and (h). The misclassifiedpoints in the segmented image are less than the segmentedimages of FCM_S1, FCM_S2, KFCM_S1, and KFCM_S2. Thesegmentation result of CKS_FCM is shown in Fig. 10(i). Themisclassified points in the segmented image of CKS_FCM aresignificantly less than the segmented image of FLICM andNS_FCM. The region uniformity is good and the boundariesbetween regions are clear. This suggests that the proposedalgorithm can generate satisfactory SA with good robustness.
The 6-look amplitude synthetic speckled image of size 256×256 is shown in Fig. 11(b). The segmentation results by thealgorithms are shown in Fig. 11(c)–(i).
Fig. 11(c)–(f) shows the segmentation results on the 6-lookamplitude synthetic speckled image using FCM_S1 FCM_S2,KFCM_S1, and KFCM_S2. All segmented images exhibitsignificant misclassified points. The region uniformity in theyellow region is poor. The segmentation result of FLICM onthe 6-look amplitude synthetic speckled image is shown inFig. 11(g). It can be seen that FLICM can remove a largeproportion of the noise. The segmentation result of NS_FCMis shown in Fig. 11(h). The misclassified points in the seg-mented image of NS_FCM are less than the segmented imagesof FCM_S1 FCM_S2, KFCM_S1, KFCM_S2, and FLICM.
TABLE VISEGMENTATION ACCURACY (SA%) ON FIRST SYNTHETIC
SPECKLED IMAGE
TABLE VIISEGMENTATION ACCURACY (SA%) ON SECOND SYNTHETIC
SPECKLED IMAGE
TABLE VIIIvpc AND vpe ON FIRST SYNTHETIC SPECKLED IMAGE
The misclassified points in segmented image [Fig. 11(i)] ofCKS_FCM are very small. This suggests that the proposedalgorithm is superior to the compared algorithms in termsof SA.
Table VI shows the SA value of the proposed and the com-pared algorithms on the first L-look amplitude synthetic speck-led image. The speckle looks is arranged as 1, 2, 4, and 6. Thevalue is the mean value and standard deviation mean ± std%)for CKS_FCM with ten runs for each noise.
Table VII gives the SA value of the proposed and the com-pared algorithms on the L-look amplitude synthetic speckledimage. The speckle looks is arranged as 1, 2, 4, and 6.
It can be seen that the SA of CKS_FCM is significantly higherthan those of the other six compared algorithms from Tables VIand VII. The SA on the first 6-look amplitude synthetic speckledimage is up to 99.04 ± 0.12 and the SA on the 6-look ampli-tude synthetic speckled image is up to 97.70 ± 0.14, which arehigher than the other algorithms. With increasing the specklelooks, the SA increases, as expected. With the different looksof speckle noise, the proposed algorithm consistently generatesbetter SA than the comparison algorithms.
Table VIII shows the partition coefficient vpc and partitionentropy vpe values of the proposed and the compared algo-rithms on the first 6-look amplitude synthetic speckled image.The mean value and standard deviation (mean ± std) of vpc andvpe are given in Table VIII.
Table IX shows the partition coefficient vpc and partitionentropy vpe values of the proposed and the compared algo-rithms on the 6-look amplitude synthetic speckled image. The
SHANG et al.: SPATIAL FUZZY CLUSTERING ALGORITHM WITH KERNEL METRIC BASED ON IMMUNE CLONE 1649
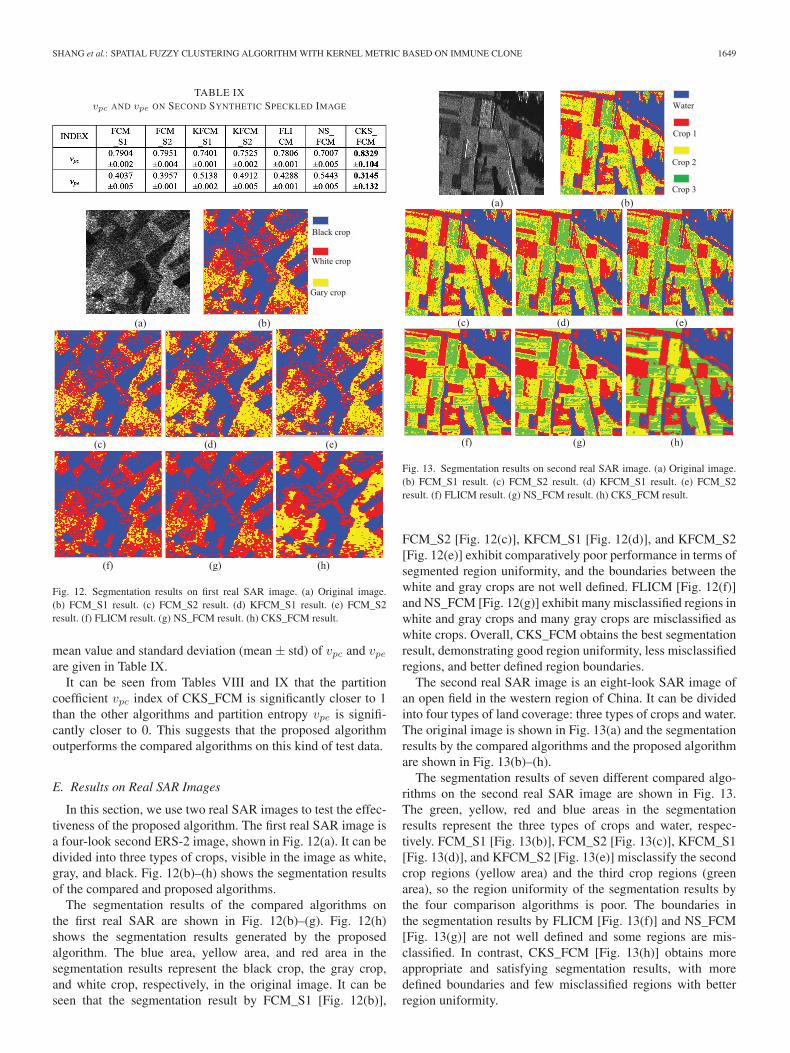
TABLE IXvpc AND vpe ON SECOND SYNTHETIC SPECKLED IMAGE
Fig. 12. Segmentation results on first real SAR image. (a) Original image.(b) FCM_S1 result. (c) FCM_S2 result. (d) KFCM_S1 result. (e) FCM_S2result. (f) FLICM result. (g) NS_FCM result. (h) CKS_FCM result.
mean value and standard deviation (mean ± std) of vpc and vpeare given in Table IX.
It can be seen from Tables VIII and IX that the partitioncoefficient vpc index of CKS_FCM is significantly closer to 1than the other algorithms and partition entropy vpe is signifi-cantly closer to 0. This suggests that the proposed algorithmoutperforms the compared algorithms on this kind of test data.
E. Results on Real SAR Images
In this section, we use two real SAR images to test the effec-tiveness of the proposed algorithm. The first real SAR image isa four-look second ERS-2 image, shown in Fig. 12(a). It can bedivided into three types of crops, visible in the image as white,gray, and black. Fig. 12(b)–(h) shows the segmentation resultsof the compared and proposed algorithms.
The segmentation results of the compared algorithms onthe first real SAR are shown in Fig. 12(b)–(g). Fig. 12(h)shows the segmentation results generated by the proposedalgorithm. The blue area, yellow area, and red area in thesegmentation results represent the black crop, the gray crop,and white crop, respectively, in the original image. It can beseen that the segmentation result by FCM_S1 [Fig. 12(b)],
Fig. 13. Segmentation results on second real SAR image. (a) Original image.(b) FCM_S1 result. (c) FCM_S2 result. (d) KFCM_S1 result. (e) FCM_S2result. (f) FLICM result. (g) NS_FCM result. (h) CKS_FCM result.
FCM_S2 [Fig. 12(c)], KFCM_S1 [Fig. 12(d)], and KFCM_S2[Fig. 12(e)] exhibit comparatively poor performance in terms ofsegmented region uniformity, and the boundaries between thewhite and gray crops are not well defined. FLICM [Fig. 12(f)]and NS_FCM [Fig. 12(g)] exhibit many misclassified regions inwhite and gray crops and many gray crops are misclassified aswhite crops. Overall, CKS_FCM obtains the best segmentationresult, demonstrating good region uniformity, less misclassifiedregions, and better defined region boundaries.
The second real SAR image is an eight-look SAR image ofan open field in the western region of China. It can be dividedinto four types of land coverage: three types of crops and water.The original image is shown in Fig. 13(a) and the segmentationresults by the compared algorithms and the proposed algorithmare shown in Fig. 13(b)–(h).
The segmentation results of seven different compared algo-rithms on the second real SAR image are shown in Fig. 13.The green, yellow, red and blue areas in the segmentationresults represent the three types of crops and water, respec-tively. FCM_S1 [Fig. 13(b)], FCM_S2 [Fig. 13(c)], KFCM_S1[Fig. 13(d)], and KFCM_S2 [Fig. 13(e)] misclassify the secondcrop regions (yellow area) and the third crop regions (greenarea), so the region uniformity of the segmentation results bythe four comparison algorithms is poor. The boundaries inthe segmentation results by FLICM [Fig. 13(f)] and NS_FCM[Fig. 13(g)] are not well defined and some regions are mis-classified. In contrast, CKS_FCM [Fig. 13(h)] obtains moreappropriate and satisfying segmentation results, with moredefined boundaries and few misclassified regions with betterregion uniformity.
1650 IEEE JOURNAL OF SELECTED TOPICS IN APPLIED EARTH OBSERVATIONS AND REMOTE SENSING, VOL. 9, NO. 4, APRIL 2016
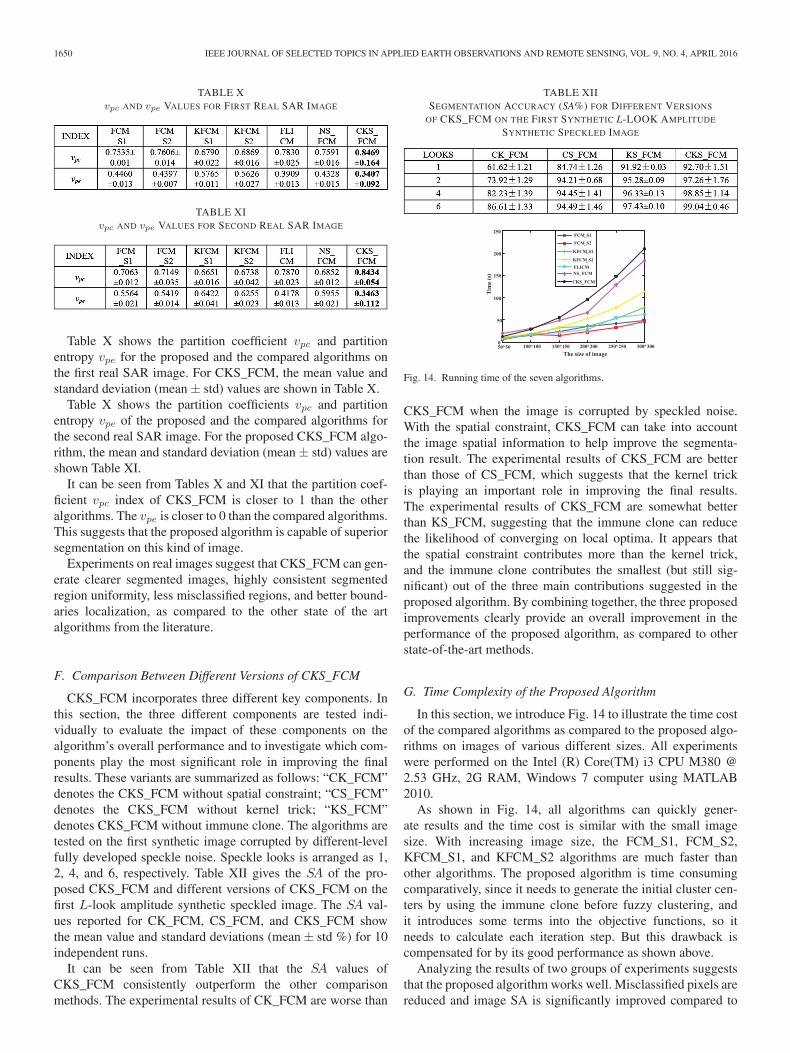
TABLE Xvpc AND vpe VALUES FOR FIRST REAL SAR IMAGE
TABLE XIvpc AND vpe VALUES FOR SECOND REAL SAR IMAGE
Table X shows the partition coefficient vpc and partitionentropy vpe for the proposed and the compared algorithms onthe first real SAR image. For CKS_FCM, the mean value andstandard deviation (mean ± std) values are shown in Table X.
Table X shows the partition coefficients vpc and partitionentropy vpe of the proposed and the compared algorithms forthe second real SAR image. For the proposed CKS_FCM algo-rithm, the mean and standard deviation (mean ± std) values areshown Table XI.
It can be seen from Tables X and XI that the partition coef-ficient vpc index of CKS_FCM is closer to 1 than the otheralgorithms. The vpe is closer to 0 than the compared algorithms.This suggests that the proposed algorithm is capable of superiorsegmentation on this kind of image.
Experiments on real images suggest that CKS_FCM can gen-erate clearer segmented images, highly consistent segmentedregion uniformity, less misclassified regions, and better bound-aries localization, as compared to the other state of the artalgorithms from the literature.
F. Comparison Between Different Versions of CKS_FCM
CKS_FCM incorporates three different key components. Inthis section, the three different components are tested indi-vidually to evaluate the impact of these components on thealgorithm’s overall performance and to investigate which com-ponents play the most significant role in improving the finalresults. These variants are summarized as follows: “CK_FCM”denotes the CKS_FCM without spatial constraint; “CS_FCM”denotes the CKS_FCM without kernel trick; “KS_FCM”denotes CKS_FCM without immune clone. The algorithms aretested on the first synthetic image corrupted by different-levelfully developed speckle noise. Speckle looks is arranged as 1,2, 4, and 6, respectively. Table XII gives the SA of the pro-posed CKS_FCM and different versions of CKS_FCM on thefirst L-look amplitude synthetic speckled image. The SA val-ues reported for CK_FCM, CS_FCM, and CKS_FCM showthe mean value and standard deviations (mean ± std %) for 10independent runs.
It can be seen from Table XII that the SA values ofCKS_FCM consistently outperform the other comparisonmethods. The experimental results of CK_FCM are worse than
TABLE XIISEGMENTATION ACCURACY (SA%) FOR DIFFERENT VERSIONS
OF CKS_FCM ON THE FIRST SYNTHETIC L-LOOK AMPLITUDE
SYNTHETIC SPECKLED IMAGE
Fig. 14. Running time of the seven algorithms.
CKS_FCM when the image is corrupted by speckled noise.With the spatial constraint, CKS_FCM can take into accountthe image spatial information to help improve the segmenta-tion result. The experimental results of CKS_FCM are betterthan those of CS_FCM, which suggests that the kernel trickis playing an important role in improving the final results.The experimental results of CKS_FCM are somewhat betterthan KS_FCM, suggesting that the immune clone can reducethe likelihood of converging on local optima. It appears thatthe spatial constraint contributes more than the kernel trick,and the immune clone contributes the smallest (but still sig-nificant) out of the three main contributions suggested in theproposed algorithm. By combining together, the three proposedimprovements clearly provide an overall improvement in theperformance of the proposed algorithm, as compared to otherstate-of-the-art methods.
G. Time Complexity of the Proposed Algorithm
In this section, we introduce Fig. 14 to illustrate the time costof the compared algorithms as compared to the proposed algo-rithms on images of various different sizes. All experimentswere performed on the Intel (R) Core(TM) i3 CPU M380 @2.53 GHz, 2G RAM, Windows 7 computer using MATLAB2010.
As shown in Fig. 14, all algorithms can quickly gener-ate results and the time cost is similar with the small imagesize. With increasing image size, the FCM_S1, FCM_S2,KFCM_S1, and KFCM_S2 algorithms are much faster thanother algorithms. The proposed algorithm is time consumingcomparatively, since it needs to generate the initial cluster cen-ters by using the immune clone before fuzzy clustering, andit introduces some terms into the objective functions, so itneeds to calculate each iteration step. But this drawback iscompensated for by its good performance as shown above.
Analyzing the results of two groups of experiments suggeststhat the proposed algorithm works well. Misclassified pixels arereduced and image SA is significantly improved compared to

SHANG et al.: SPATIAL FUZZY CLUSTERING ALGORITHM WITH KERNEL METRIC BASED ON IMMUNE CLONE 1651
the other six compared algorithms. The proposed algorithm per-forms well in terms of region uniformity and less misclassifiedregions in real SAR images.
IV. CONCLUSION
FCM algorithms often fail to achieve high SA and typicallyoffer poor robustness against image noise. FCM is sensitive tothe choices of initial cluster centers and easily becomes trappedin local optima. In order to overcome these shortcomings, thispaper has proposed an improved FCM algorithm CKS_FCM.An immune clone algorithm was used to optimize the initialcluster centers, enabling convergence to the global optimum.The spatial information is added in the objective function andCKS_FCM uses a non-Euclidean distance based on kernelfunction to replace the Euclidean distance. This contributes toimprove SA and robustness. Simulation results show that theproposed algorithm has higher SA and better robustness onboth synthetic images and real SAR images. One shortcomingof the proposed work is that the number of clusters must begiven a priori in CKS_FCM. Our ongoing and future work isinvestigating new ways of solving this problem.
ACKNOWLEDGMENT
The authors would like to express our sincere appreciationto the editors and the anonymous reviewers for their insight-ful comments, which have greatly helped us in improving thequality of this paper.
REFERENCES
[1] X. Munoz, J. Freixenet, X. Cufi, and J. Marti, “Strategies for imagesegmentation combining region and boundary information,” PatternRecognit. Lett., vol. 24, no. 1, pp. 375–392, 2003.
[2] J. Feng, L. Jiao, X. Zhang, M. Gong, and T. Sun, “Robust non-local fuzzyc-means algorithm with edge preservation for SAR image segmentation,”Signal Process., vol. 93, no. 2, pp. 487–499, Jun. 2013.
[3] J. Bezdek, L. Hall, and L. Clarke, “Review of MR image segmentationtechniques using pattern recognition,” Med. Phys., vol. 20, pp. 1033–1048, 1993.
[4] X. Gao, R. Fu, X. Li, D. Tao, B. Zhang, and H. Yang, “Aurora imagesegmentation by combining patch and texture thresholding,” Comput. Vis.Image Underst. vol. 115, no. 3, pp. 390–402, 2011.
[5] J. Kim, W. Cai, S. Eberl, and D. Feng, “Real-time volume rendering visu-alization of dual-modality PET/CT images with interactive fuzzy thresh-olding segmentation,” IEEE Trans. Inform. Technol. Biomed., vol. 11,no. 2, pp. 161–169, Mar. 2007.
[6] Y. Cheng and X. Li, “Adaptive image region-growing,” IEEE Trans.Image Process., vol. 3, no. 6, pp. 868–872, Nov. 1994.
[7] K. Strasters and J. Gerbrands, “Three-Dimensional image segmentationusing a split, merge and group approach,” Pattern Recognit. Lett., vol. 12,no. 2 pp. 307–325, 1991.
[8] S. P. Gou, X. Zhuang, H. M. Zhu, and T. T. Yu, “Parallel sparse spectralclustering for SAR image segmentation,” IEEE J Sel. Topics Appl. EarthObserv. Remote Sens., vol. 6, no. 4, pp. 1949–1963, Aug. 2013.
[9] X. Descombes, M. Moctezuma, H. Maitre, and J.-P. Rudant, “Coastlinedetection by a Markovian segmentation on SAR images,” IEEE Trans.Signal Process., vol. 55, no. 1, pp. 123–132, Nov. 1996.
[10] Y. Ding, Y. Li, and W. Yu, “SAR image classification based on CRFs withintegration of local label context and pairwise label compatibility,” IEEEJ. Sel. Topics Appl. Earth Observ. Remote Sens., vol. 7, no. 1, pp. 300–306, Jan. 2014.
[11] Y. Huang and Y. C. Huang, “Segmenting SAR satellite images with themultilayer level set approach,” IEEE J. Sel. Topics Appl. Earth Observ.Remote Sens., vol. 4, no. 3, pp. 632–642, Sep. 2011.
[12] S. Osher and N. Paragios, Geometric Level Set Methods in Imaging,Vision, and Graphics. Berlin, Germany: Springer-Verlag, 2003.
[13] X. Zhang, L. Jiao, F. Liu, L. Bo, and M. Gong, “Spectral clusteringensemble applied to texture features for SAR image segmentation,” IEEETrans. Geosci. Remote Sens., vol. 46, no. 7, pp. 2126–2136, Jul. 2008.
[14] Y. Zhong, S. Zhang, and L. Zhang, “Automatic fuzzy clustering basedon adaptive multi-objective differential dvolution for Remote SensingImagery,” IEEE J. Sel. Topics Appl. Earth Observ. Remote Sens., vol. 6,no. 5, pp. 2390–2301, Oct. 2013.
[15] Y. Zhong, S. Zhang, and L. Zhang, “An adaptive memetic fuzzyClustering algorithm with spatial information for Remote SensingImagery,” IEEE J. Sel. Topics Appl. Earth Observ. Remote Sens., vol. 7,no. 4, pp. 1235–1248, Apr. 2014.
[16] B. Hou, X. Zhang, Q. Ye, and Y. Zheng, “A novel method for hyperspec-tral image classification based on Laplacian Eigenmap pixels distribution-flow,” IEEE J. Sel. Topics Appl. Earth Observ. Remote Sens., vol. 6, no. 3,pp. 1602–1618, Jun. 2013.
[17] D. Pham, “An adaptive fuzzy C-means algorithm for image segmenta-tion in the presence of intensity inhomogeneities,” Pattern Recognit. Lett.,vol. 20, no. 1, pp. 57–68, Jan. 1999.
[18] X. Yin, S. Chen, E. Hu, and D. Zhang, “Semi-supervised clustering withmetric learning: An adaptive kernel method,” Pattern Recognit. Lett.,vol. 43, no. 4, pp. 1320–1333, Apr. 2010.
[19] J. C. Bezdek, Pattern Recognition with Fuzzy Objective FunctionAlgorithms. New York, NY, USA: Plenum, 1981.
[20] J. M. Yih, “FCM algorithm based on normalized Mahalanobis distancesin image clustering,” in Proc. Int. Conf. Mach. Learn. Cybern., 2010,vol. 5, pp. 2724–2729.
[21] R. J. Hathaway, J. C. Bezdek, and Y. Hu, “Generalized fuzzy c-means clustering strategies using norm distances,” IEEE Trans. FuzzySyst.,vol. 8, no. 5, pp. 576–582, Oct. 2000.
[22] M. Ahmed, S. Yamany, N. Mohamed, A. Farag, and T. Moriarty, “A mod-ified fuzzy C-means algorithm for bias field estimation and segmentationof MRI data,” IEEE Trans. Med. Imag., vol. 21, no. 3,pp. 193–199, Mar.2002.
[23] S. Chen and D. Zhang, “Robust image segmentation using FCM withspatial constraints based on new kernel-induced distance measure,”IEEE Trans. Syst. Man Cybern., vol. 34, no. 4, pp. 1907–1916, Aug.2004.
[24] L. Szilagyi, Z. Benyo, S. Szilagyii, and H. Adam, “MR brain imagesegmentation using an enhanced fuzzy C-means algorithm,” in Proc.IEEE 25th Annu. Int. Conf. Eng. Med. Biol. Soc. (EMBS’2013), 2003,pp. 17–21.
[25] W. Cai, S. Chen, and D. Zhang, “Fast and robust fuzzy C-means cluster-ing algorithms incorporating local information for image usegmentation,”Pattern Recognit. Lett., vol. 40, no. 3, pp. 825–838, Mar. 2007.
[26] B. He, Y. Qiu, and Z. Li, “Similarity reasoning and similarity transfor-mations,” in Proc. IEEE Int. Conf. Control Autom., Jun. 2007, pp. 1667–1671.
[27] J. Z. Wang, J. Kong, Y. H. Lu, M. Qi, and B. X. Zhang, “A modifiedFCM algorithm for MRI brain image segmentation using both local andnon-local spatial constrains,” Comput. Med. Imag. Graph., vol. 32, no. 8,pp. 685–698, 2008.
[28] F. Zhao, L. C. Jiao, and H. Q. Liu, “Fuzzy c-means clustering with nonlocal spatial information for noisy image segmentation,” Front. Comput.Sci. China, vol. 5, no. 1, pp. 45–56, Mar. 2011.
[29] F. Zhao, L. C. Jiao, H. Q. Liu, and X. B. Gao, “A novel fuzzy clus-tering algorithm with non local adaptive spatial constraint for imagesegmentation,” Signal Process., vol. 91, no. 4, pp. 988–999, Apr.2011.
[30] J. Ji and K. Wang, “A robust nonlocal fuzzy clustering algorithm withbetween-cluster separation measure for SAR image segmentation,” IEEEJ. Sel. Topics Appl. Earth Observ. Remote Sens., vol. 7, no. 12, pp. 4929–4936, Oct. 2013.
[31] N. R. Pal and J. C. Bezdek, “On cluster validity for fuzzy c-means model,”IEEE Trans. Fuzzy Syst., vol. 3, no. 3, pp. 370–379, Aug. 1995.
[32] K. Wu and M. Yang, “Alternative C-means clustering algorithms,”Pattern Recognit., vol. 35, no. 10, pp. 2267–2278, 2002.
[33] S. Xie, F. Khomh, Y. Zou, and I. Keivanloo, “An empirical study on thefault-proneness of clone migration in clone genealogies,” in Proc. IEEEConf. Software Maint. Reeng. Reverse Eng. (CSMR-WCRE), Feb. 2014,pp. 94–103.
[34] L. Castro and F. Zuben, “Learning and optimization using the clonalselection principle,” IEEE Trans. Evol. Comput., vol. 6, no. 3, pp. 239–251, Jun. 2002.
[35] A. Buades, B. Coll, and J. M. Morel, “On image denoising methods,”Universitat de les Illes Balears, Mallorca, Spain, Tech. Rep. CMLA, 2004.
1652 IEEE JOURNAL OF SELECTED TOPICS IN APPLIED EARTH OBSERVATIONS AND REMOTE SENSING, VOL. 9, NO. 4, APRIL 2016
[36] F. Masulli and A. Schenone, “A fuzzy clustering based segmentationsystem as support to diagnosis in medical imaging,” Artif. Intell. Med.,vol. 16, no. 2, pp. 129–147, 1999.
[37] S. Krinidis and V. Chatzis, “A robust fuzzy local information C-meansclustering algorithm,” IEEE Trans. Image Process., vol. 19, no. 5,pp. 1328–1337, May 2010.
[38] K. R. Muller, S. Mika, G. Rätsch, K. Tsuda, and B. Schölkopf, “An intro-duction to kernel-based learning algorithms,” IEEE Trans. Neural Netw.,vol. 12, no. 2, pp. 181–202, Mar. 2001.
[39] M. G. Gong, Y. Liang, J. Shi, W. Ma, and J. Ma, “Fuzzy C-means clus-tering with local information and kernel metric for image segmentation,”IEEE Trans. Image Process., vol. 22, no. 2, pp. 573–584, Feb. 2013.
[40] J. W. Goodman, “Some fundamental properties of speckle,” J. Opt. Soc.Amer., vol. 66, no. 11, pp. 1145–1150, Nov. 1976.
[41] C. Li, R. Huang, Z. Ding, J. Gatenby, D. Metaxas, and J. Gore, “A levelset method for image segmentation in the presence of intensity inhomo-geneities with application to MRI,” IEEE Trans. Image Process., vol. 20,no. 7, pp. 2007–2016, Jul. 2011.
[42] K. Chuang and H. Tzeng, “Fuzzy c-means clustering with spatial infor-mation for image segmentation,” Comput. Med. Imag. Graph., vol. 30,pp. 9–15, 2006.
[43] B. Hou, X. H. Zhang, X. M. Bu, and H. X. Feng, “SAR image despecklingbased on nonsubsampled shearlet transform,” IEEE J. Sel. Topics Appl.Earth Observ. Remote Sens., vol. 5, no. 3, pp. 809–823, Jun. 2012.
Ronghua Shang (M’09) received the B.S. degree ininformation and computation science and the Ph.D.degree in pattern recognition and intelligent systemsfrom Xidian University, Xi’an, China, in 2003 and2008, respectively.
She is currently an Associate Professor with XidianUniversity. Her research interests include optimiza-tion problems, evolutionary computation, image pro-cessing, and data mining.
Pingping Tian received the B.S. degree in electronicengineering from Xidian University, Xi’an, China.
Her research interests include image processingand data mining.
Licheng Jiao (SM’89) received the B.S. degreein electrical engineering from Shanghai JiaotongUniversity, Shanghai, China, in 1982, the M.S. degreein electrical engineering and Ph.D. degree in signal,circuit and system from Xi’an Jiaotong University,Xi’an, China, in 1984 and 1990, respectively.
From 1990 to 1991, he was a Postdoctoral Fellowwith the National Key Laboratory for Radar SignalProcessing, Xidian University, Xi’an, China. Since1992, he has been a Professor with the School ofElectronic Engineering, Xidian University. Currently,
he is the Director of the Key Laboratory of Intelligent Perception and ImageUnderstanding of Ministry of Education of China, Xidian University. He hascharged of about 40 important scientific research projects, and published morethan 20 monographs and a hundred papers in international journals and con-ferences. His research interests include image processing, natural computation,machine learning, and intelligent information processing.
Dr. Jiao is a member of the IEEE Xi’an Section Execution Committee andthe Chairman of Awards and Recognition Committee, Vice Board Chairpersonof Chinese Association of Artificial Intelligence, Councilor of Chinese Instituteof Electronics, Committee Member of Chinese Committee of Neural Networks,and expert of Academic Degrees Committee of the State Council. He wasselected as a member of the First level of Millions of Talents Project of Chinain 1996. In 2006, he was selected as an Expert with the Special Contribution ofShaanxi Province. He was the recipient of the Youth Science and TechnologyAward and the First Prize of Young Teacher Award of High School by the FokYing Tung Education Foundation, in 1992 and 2006. In 1996, he was grantedby the Cross-century Specialists Fund from the Ministry of Education of China.
Rustam Stolkin (M’12) received the Bachelor’s andMaster’s degrees in engineering science from theUniversity of Oxford, Oxford, U.K., in 1998, andthe Ph.D. degree in robotic vision from UniversityCollege London, London, U.K., in 2004.
He is a Senior Birmingham Fellow with theSchool of Mechanical Engineering, University ofBirmingham, Birmingham, U.K., researching onrobotics and machine intelligence. From 2004 to2008, he was a Research Assistant Professor with theStevens Institute of Technology, Hoboken, NJ, USA,
where he researched on sensor systems for maritime security. His researchinterests include science and engineering outside of robotics, as well as manip-ulation with robotic arms and hands, novel robotic vehicles, computer visionand other kinds of autonomous sensing.
Jie Feng received the B.S. degree from Chang’anUniversity, Xi’an, China, in 2008. She is currentlypursuing the Ph.D. degree in the laboratory of intel-ligent perception and image understanding fromXidian University, Xi’an, China.
Her research interests include remote sensingimage processing, pattern recognition, and evolution-ary computation.
Biao Hou (M’07) received the B.S. and M.S. degreesin mathematics from Northwest University, Xi’an,China, in 1996 and 1999, respectively, and thePh.D. degree in circuits and systems from XidianUniversity, Xi’an, China, in 2003.
Since 2003, he has been with the Key Laboratoryof Intelligent Perception and Image Understanding ofthe Ministry of Education, Xidian University, Xi’an,China, where he is currently a Professor. His researchinterests include multiscale geometric analysis andSynthetic Aperture Radar image processing.
Xiangrong Zhang (M’06) received B.S. and M.S.degrees in computer science and technology fromXidian University, Xi’an, China, in 1999 and 2003,respectively and the Ph.D. degree in pattern recogni-tion and intelligent system from Xidian University, in2006.
She is a Professor in the School of ElectronicEngineering, Xidian University. Her research inter-ests include action recognition and machine learning.