Embed Size (px)
Citation preview
A SPATIAL ANALYSIS OF BOKO HARAM AND AL-SHABAAB REFERENCES INSOCIAL MEDIA IN SUB-SAHARAN AFRICA
by
Richard Michael Rodriguez Jr.A Thesis
Submitted to theGraduate Faculty
ofGeorge Mason Universityin Partial Fulfillment of
The Requirements for the Degreeof
Master of ScienceGeoinformatics and Geospatial Intelligence
Committee:
Dr. Anthony Stefanidis, Thesis Director
Dr. Arie Croitoru, Committee Member
Dr. Andrew Crooks, Committee Member
Dr. Anthony Stefanidis, Department Chair
Dr. Donna M. Fox, Associate Dean, Officeof Student Affairs & Special Programs,College of Science
Dr. Peggy Agouris, Dean, College ofScience
Summer Semester 2014George Mason UniversityFairfax, VA
A Spatial Analysis of Boko Haram and Al-Shabaab References in Social Media in Sub-Saharan Africa
A Thesis submitted in partial fulfillment of the requirements for the degree of Master of Science at George Mason University
by
Richard Michael Rodriguez Jr. Bachelor of Science
Western New Mexico University, 2002
Director: Anthony Stefanidis, Professor Department of Geography and GeoInformation Science
Summer Semester 2014 George Mason University
Fairfax, VA
ii
This work is licensed under a creative commons
attribution-noderivs 3.0 unported license.
iii
DEDICATION
This is dedicated to my loving wife Kristen, and my dog Blake.
iv
ACKNOWLEDGEMENTS
I would like to thank the many friends, relatives, and supporters who have made this happen. My loving Wife, Kristen, assisted me in my research. Dr. Anthony Stefanidis, and the other members of my committee were of invaluable help. Finally, thanks go out to the Fenwick Library for providing a clean, quiet, and well-equipped repository in which to work.
v
TABLE OF CONTENTS
Page List of Tables .................................................................................................................... vii List of Figures .................................................................................................................. viii List of Equations ................................................................ Error! Bookmark not defined. List of Abbreviations or Symbols ....................................................................................... x
Abstract .............................................................................................................................. xi Chapter One Introduction ................................................................................................... 1
Introduction ..................................................................................................................... 1
Chapter Two........................................................................................................................ 4
2.1 Social Media Phenomenon ........................................................................................ 4
2.2 What Social Media Provides ..................................................................................... 4
2.3 Use of Social Media by Terrorist .............................................................................. 7
2.4 Boko Haram and Al-Shabaab .................................................................................... 7
2.5 Analyzing Social Media Geospatially ....................................................................... 9
Chapter Three.................................................................................................................... 13
Objective and Hypothesis .......................................................................................... 13
Chapter four Data and Methods ......................................... Error! Bookmark not defined. 4. Harvesting of Data .................................................................................................... 15
4.1 Process in which data is collected ....................................................................... 15
4.2 Key words that were used for harvesting data ..................................................... 18
4.3 Creating the Feature Class with Our Parameters ................................................. 19
4.4 Dataset for Boko Haram and Al-Shabaab ........................................................... 20
Chapter Five: Results ........................................................................................................ 22
Geospatial Analysis of Boko Haram and Al-Shabaab .................................................. 22
5.1 Boko Haram ......................................................................................................... 22
5.2 Al-Shabaab .......................................................................................................... 33
Chapter Six: Discussion ..................................................... Error! Bookmark not defined.
vi
Conclusion and Outlook .................................................... Error! Bookmark not defined. References ......................................................................................................................... 47
vii
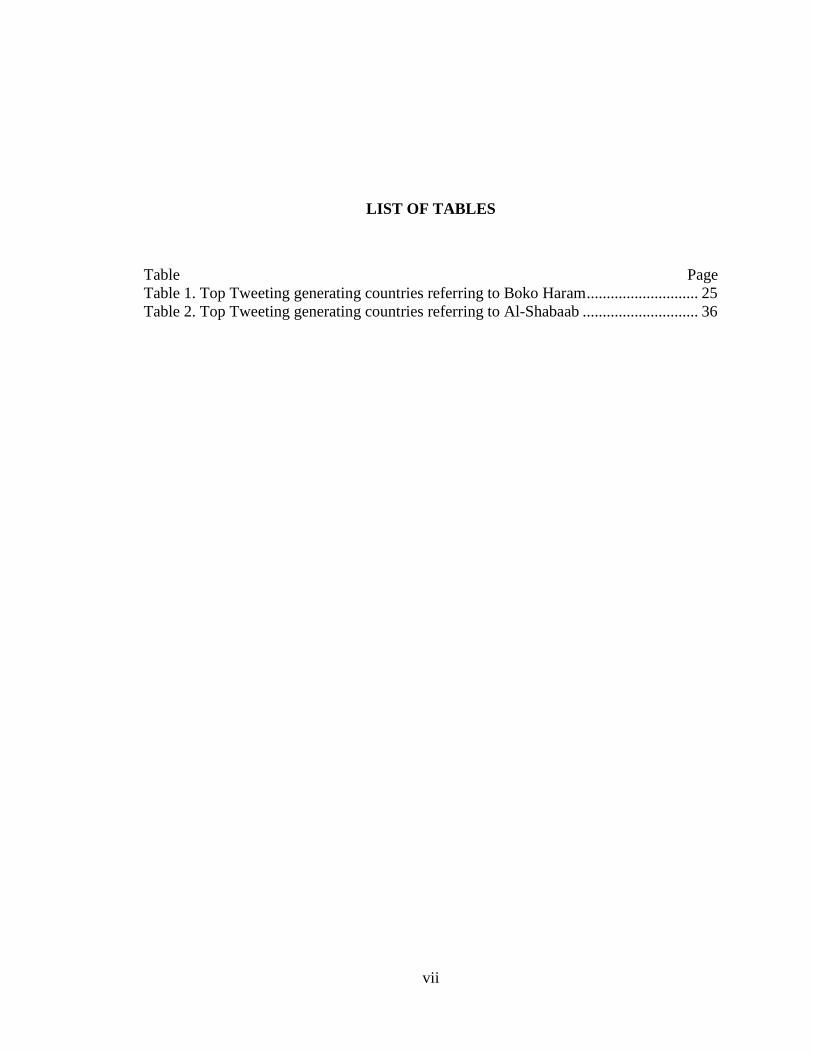
LIST OF TABLES
Table Page Table 1. Top Tweeting generating countries referring to Boko Haram ............................ 25 Table 2. Top Tweeting generating countries referring to Al-Shabaab ............................. 36
viii
LIST OF FIGURES
Figure Page Figure 1. A system how we harvest social media feeds that is driven by Twitter and convert it two usable geospatial information. ................................................................... 17 Figure 2. The location of geolocated tweets referring to Ghana, Nigeria, and Kenya in our dataset (period 01 August – 31 October 2013). The locations are marked by green dots............................................................................................................................................ 18 Figure 3. Process of getting a feature class with parameters. ........................................... 19 Figure 4. The location of geolocated tweets referring to Boko Haram and Al-Shabaab in our dataset (period 01 August – 31 October 2013). The locations are marked by green dots. ................................................................................................................................... 21 Figure 5. A frequency word cloud summarizing Twitter content for our geolocated tweets that referenced either Boko Haram. .................................................................................. 23 Figure 6. A density analysis revealing hotspots in geolocated tweet, generated using ArcGIS 10.1 Spatial Analysis. .......................................................................................... 24 Figure 7. The top 15 countries of Table 2 plotted with their normalized participation index metrics ..................................................................................................................... 26 Figure 8. A representation of Boko Haram's impact using twitter feeds for the time period of 01 August 2013 - 31 October 2013 using population-normalized participation indices............................................................................................................................................ 27 Figure 9. A representation of Boko Haram's impact using twitter feeds for the month of August 2013 using population-normalized participation indices. .................................... 29 Figure 10. A representation of Boko Haram's impact using twitter feeds for the month of September 2013 using population-normalized participation indices. ............................... 30 Figure 11. . A participation of Boko Haram's influecne using twitter feeds for the month of October 2013 using population-Nomalized participation indices. ............................... 31 Figure 12. Top 5 Participating counties displayed over the study period for Boko Haram............................................................................................................................................ 32 Figure 13. A frequency word cloud summarizing Twitter content for our geolocated tweets that referenced either Al-Shabaab. ........................................................................ 34 Figure 14. A density analysis revealing hotspots in geolocated tweet, generated using ArcGIS 10.1 Spatial Analysis. .......................................................................................... 35 Figure 15. The top 15 countries of Table 2 plotted with their normalized participation index metrics. .................................................................................................................... 37 Figure 16. A representation of Al-Shabaab's impact using twitter feeds for the time period of 01 August 2013 - 31 October 2013 using population-normalized participation indices............................................................................................................................................ 38
ix
Figure 17. A representation of Al-Shabaab's impact using twitter feeds for the month of August 2013 using population-normalized participation indices. .................................... 39 Figure 18. A representation of Al-Shabaab's impact using twitter feeds for the month of September 2013 using population-normalized indices. .................................................... 40 Figure 19. A representation of Al-Shabaab’s impact using twitter feeds for the month of October 2013 using population-normalized participation indices. ................................... 41 Figure 20. Top 5 Participating counties displayed over the study period for Al-Shabaab............................................................................................................................................ 42
x
LIST OF ABBREVIATIONS
Volunteered Geographic Information ............................................................................ VGI Sub-Saharan Africa ........................................................................................................ SSA Ambient Geographic Information .................................................................................. AGI Social Media Intelligence ....................................................................................SOCMINT Geospatial Intelligence............................................................................................ GEOINT
xi
ABSTRACT
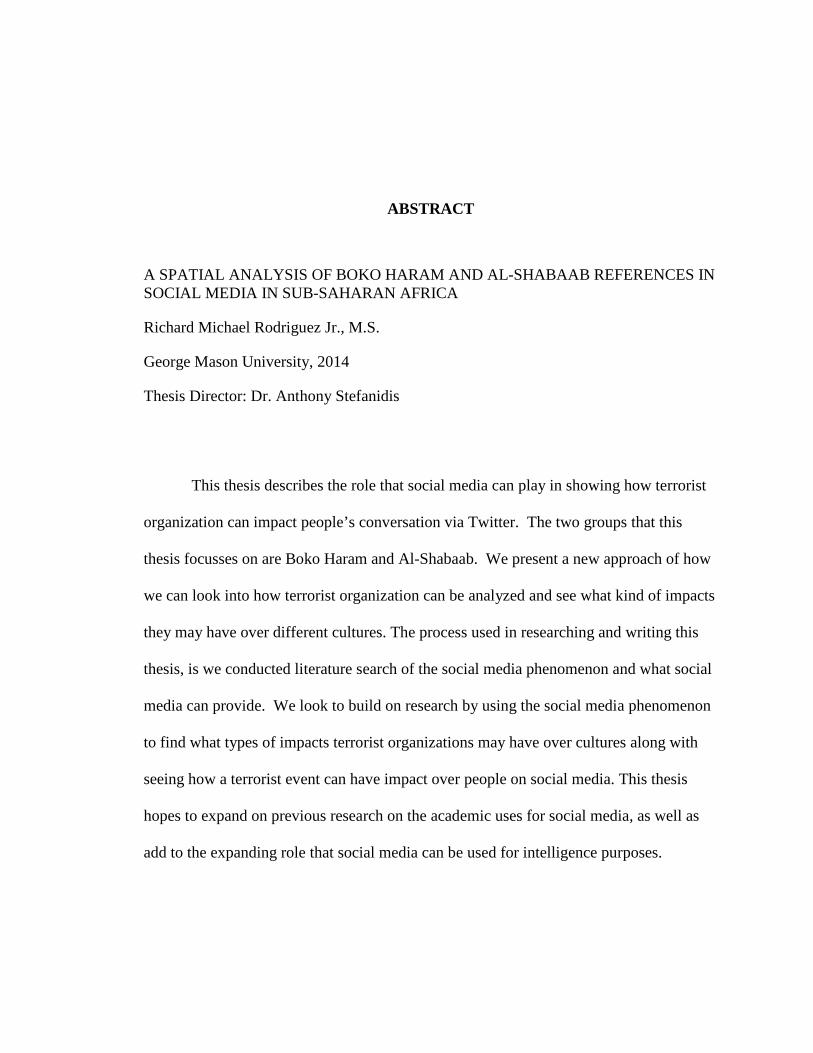
A SPATIAL ANALYSIS OF BOKO HARAM AND AL-SHABAAB REFERENCES IN SOCIAL MEDIA IN SUB-SAHARAN AFRICA
Richard Michael Rodriguez Jr., M.S.
George Mason University, 2014
Thesis Director: Dr. Anthony Stefanidis
This thesis describes the role that social media can play in showing how terrorist
organization can impact people’s conversation via Twitter. The two groups that this
thesis focusses on are Boko Haram and Al-Shabaab. We present a new approach of how
we can look into how terrorist organization can be analyzed and see what kind of impacts
they may have over different cultures. The process used in researching and writing this
thesis, is we conducted literature search of the social media phenomenon and what social
media can provide. We look to build on research by using the social media phenomenon
to find what types of impacts terrorist organizations may have over cultures along with
seeing how a terrorist event can have impact over people on social media. This thesis
hopes to expand on previous research on the academic uses for social media, as well as
add to the expanding role that social media can be used for intelligence purposes.
1
CHAPTER ONE INTRODUCTION
Introduction
While social media may be a mainstay in the western world, too much of the
earth’s population, this phenomenon is still a fairly new medium of self-expression
(Wyche, et al., 2013) that has given the developing world a new way of connecting and
informing beyond traditional borders. Current mapping possibilities have become more
prevalent since the turn of the century and the appearance of the first geospatially
equipped websites (Sui and Goodchild, 2011). Geospatially equipped social media has
opened up a new pool of data for the geoanalyst. Geographic data harvested from social
media could also be referred to as Ambient Geographic Information (AGI), which is a
subcategory of volunteered geographic information (VGI) because it is more crowd
harvesting versus VGI, which is more crowdsourcing (Crooks, et al., 2013).
Information from Social media is a form of communication for people to put
news, propaganda, culture, and indeed any information they feel worth sharing with the
family, friends or the larger public can be analyzed for its geographic information. VGI
can be very useful to a broad spectrum of intelligence analysis with uses in both the
civilian and commercial world and for the military (Goodchild, 2007). The growing
work of GIS and Geography will continue to use VGI to the show social and cultural
contexts, which lie within VGI (Lin, 2013).
2
This allows for virtual polycentric communities to be formed giving a new
perspective on geopolitical boundaries (Stefanidis, et al., 2014). Social media has now
allowed for information to be disseminated at a much larger scale and at a faster rate.
This can be shown through many different works and defining moments in time that can
be correlated to the use of social media to get the message out through non-traditional
channels (Crooks, et al., 2013). Capturing defining moments over different times and
spaces will allow us to see the see geospatial trends through the analysis of geolocated
tweets.
When a tweet is posted, it has geolocation information that is either populated by
the publisher (Twitter) or by the client through which the tweet was submitted (Croitoru,
et. al, 2013). Empowered with the location data allows the analyst to have a geographic
context of where the information is originating from and makes geospatial analysis of
different topics to be correlated to geographic locations. With the ability to correlate the
information in a large number of tweets much deeper types of analysis are now possible.
Geospatial analysis has allowed for the construction of maps based on a sort of cyber-
space representation on how any particular part of the world “feels” about a specific
subject (Zook, et al., 2011). With maps and data driven by a representation of tweets, it
is now possible to observe how different parts of the world may perceive different events.
Viewing the web and flow of social media information through geographic location, in
effect, allows geospatial analyst to analyze how different parts of the earth express
themselves in an unfiltered and unedited way, which would otherwise be limited by the
reach of traditional news outlets.
3
With social media essentially a way of free speech and a way for user to make
themselves heard we see many different types of user joining social media sites. We are
now seeing many terrorist organization joining different types of social media to further
promote their agendas (Naidu, 2013). This is no different with Sub-Saharan African
terrorist organizations. They are utilizing this new type of resource available. With Al-
shabaab and Boko Haram both conducting operations in the last year and utilizing social
media we have chosen to focus our attentions on these two organizations within Sub-
Saharan Africa.
The main focus of this paper will be to contribute a geospatial representation of
the impacts that Boko Haram and Al-Shabaab have on twitter. This will be expressed
through a number of geographic processes to help give a clear picture on what kind
geospatial impact these two groups have on the world.
The Remainder of this thesis is organized as follows. In chapter 2 addresses
previous studies in this research area and how they relate to this study followed by
chapter 3 that will discusses what and how our study can contribute a geospatial analysis
approach to study area. Chapter 4 is the methodologies used to appropriate the data to
which will be used for our test study. In Chapter 5 is where we perform the analysis on
the dataset. We conclude with the outlook in chapter 6.
4
CHAPTER TWO
2.1 Social Media Phenomenon
Webster’s dictionary defines social media as forms of electronic
communication (as Web sites for social networking and microblogging) through which
users create online communities to share information, ideas, personal messages, and other
content (as videos). The social media phenomenon has been felt across the globe. When
people are online they are actively engaged in some form of social media platforms
ranging from social networking sites, blogs, to video and music sharing sites. If people
have an Internet connection they will be engaging in social media (Smith, 2010). Social
media has little to do with traditional types of informational media but rather creates a
venue for an audience to connect, interact and communicate with one another through
different types of social media sites (Correa, et al., 2010). Interaction of people at this
large of scale will allow researchers to discover different types applications with the data
that they are creating inadvertently by participating in the social media phenomenon.
2.2 What Social Media Provides
Social media is made up by a variety of Internet platforms that include
social networking sites, sharing sites, blogs, and wikis (Kietzmann, et al., 2011). These
different types of sites allow for users to have interaction between each other. This
5
allows for a direct engagement of people and companies at low cost and timely manor,
which is more efficient than other forms of traditional interaction such as sending a letter,
advertising, and social engagements (Kaplan and Haenlein, 2010). Social media also
allows for users to participate at their convenience. Social media has been transformed
by Social networking sites (SNS), which have allowed for greater interaction of
individuals (Edosomwan et al., 2011). SNS revolve around people and not just an
interest, where many Internet sites are still based on interests. This allows for the
individuals on SNS to be the center of their networks. SNS create a world of centric
networks oppose to a social group (Boyd and Ellison, 2007). By allowing these
individuals to create their networks they are able to form common interest thus they are
able to dictate the content that is warranted by their network. Many of these networks
create a common interest and have many like-minded people within their networks.
These networks are not restricted to local areas since they are created on virtual domains,
which allows for a diverse group of like-minded people in these networks. This allows
analyst to view how a network may think and possible operate. The large participation of
people on SNS and social media, allows for virtual communities to be formed.
Identifying these communities and mapping them by exploiting the geospatial content of
the social media feeds allows for geographical analysis of these communities that would
otherwise not be present (Stefanidis, et al., 2014). Being able to analyze social media for
its geographical information allows for analysis of different types of online communities
that would not be possible with other forms of media. Omand, et al., (2012) propose the
introduction of a new form of intelligence; social media intelligence (SOCMINT) and
6
using SOCMINT for intelligence purposes and for law enforcement. By incorporating
SOCMINT into geospatial analysis we will be able to further analyze communities and
possible use this for geospatial intelligence purposes. The explosion of social media has
opened up many opportunities for analysis. The addition of geospatial-enabled site has
further opened the door for geospatial analysis of these online communities and the
tracking of how these communities and groups interact with one another.
This thesis will focus on one form of SNS, which is Twitter. Jack Dorsey
developed twitter in 2006. He originally developed it as a form of short messaging
service (SMS)-based communication platform so that friends could keep up with each
other. This is why twitter is only limited to 145 characters because mobile carriers at the
time of development only allowed 145 characters. Twitter has continued to grow and
develop into more of a mainstream social media that allows users to interact with each
other. According to twitters webpage they have 255 million monthly active users and
500 million tweets per day (Twitter, 2014). Twitter also allows for researchers to
download one percent of tweets through their application-programming interface (API).
Twitter was chosen for this thesis because of the rapid and easy communication it
allows it users to have. This is not the only reason, as when you have 255 million curious
users and large part of the actively engaging in their curiosity on a daily basis (Russell, et
al., 2013). Twitter also focuses less on the information about the person giving the users
some anonymity and focusing more on what a person has to say rather than focusing on
the that person (Hughes, et al., 2012). These curious users will create networks by their
interactions with each other thus allowing us to analyze them. Twitter has already played
7
a role in raising global consciousness about terrorist attacks in India (Hanson, ed al.,
2010).
2.3 Use of Social Media by Terrorist
Social media has also allowed terrorist organization to have access to creating
social networks and communicating their agendas and spreading their propaganda to a
large audience. The attacks in Kenya by African Militants Al-Shabaab primarily used
twitter to communicate their goals and claim responsibility for the attacks (Naidu, 2013).
Many terrorist and Jihadist have been using twitter on a regular basis to upload pictures
and videos of them to further promote their agenda and show what they are contributing
to the cause (Prucha and Fisher, 2013). Not only are terrorist using twitter to further
spread their views but regularly monitor twitter so they can have situational awareness.
The Mumbai terrorist regularly monitored the official twitter page thus indirectly aiding
them with situational awareness (Oh, et al., 2011).
2.4 Boko Haram and Al-Shabaab
In this thesis we will focus on primarily on two terrorist organizations (Boko
Haram and Al-Shabaab) to see how they have impact over twitter networks. Both of
these groups operate in Sub-Saharan Africa. Boko Haram operates in most populous
country of Nigeria with intentions of promoting an extreme version of Islam which
forbids them to take part in any kind of western society (Chothia, 2011). Al-Shabaab
operates out of the Somalia but carries out many operations in Kenya (BBC, 2014). Al-
shabaab agenda is to create Somali Caliphate of the Wahhabi Islamic sect in the Somali
8
inhabited regions; they plan to achieve their goals by committing violent operations (Ali,
2008). These organizations have been in the active over the last year for attacks they
have conducted. With Bin Laden deceased the global war on terror is shifting and could
possibly be shifting in the near future to groups to groups in Africa (Bertram and Ellison,
2014). Our focus will be on these organization and the possible networks they create on
social media.
Boko Haram is active on SNS with Facebook and twitter. There twitter account
seems to be closer to the militants but this is not always true. They show graphic
photograph and videos of operations but also would show them performing community
engagements to help gather support (Bertram and Ellison, 2014). With Boko Haram
having a presence on SNS we will be able to further investigate what kind of networks
they may impact.
Al-Shabaab opened its first official twitter account in 2011 and fully embraced the
use that this SNS tool to its fullest by bragging about the accomplishment that they have
achieved (Gettleman, 2011). During the 2013 Westgate mall attack Al-Shabaab released
a tweet laying claim to the attack and describing why they were conducting the attack.
They basically said that they were taking the fight to the Kenyans on their land (Agbiboa,
2014). This is an example of how Al-Shabaab can have an impact though SNS by
reaching people all the way in the western world with only posting a tweet (Allen, 2014).
By Al-Shabaab using twitter to claim this attack we will be able to analyze these date to
see what kind of networks are possibly created and we can further analyze what kind of
impact they may have with different countries.
9
2.5 Analyzing Social Media Geospatially Social media has become a viable way for citizens to express their self in a very
intimate and immediate way. In the past ten years, cell phone access in Sub-Saharan
Africa has increased greatly. Access to cell phones in Sub-Saharan Africa has increased
dramatically over the past decade with 30 mobile phones per 100 people in Sub-Saharan
Africa (Owiny, et al., 2014). The opportunities of a mobile Internet connection open to
the public in Sub-Saharan Africa contrast greatly with struggles traditional media faced in
the late 20th century. Where black journalists were beaten down, arrested or went
missing for reporting on the Soweto protests of 1976 in South Africa, more recently
Kenyans turned heavily to social media during the elections of 2007 (Olorunnisola and
Martin, 2012). While the effect of social media was mixed with radio driven hate speech
and spam text messages contributing to violence, bloggers exposing sham voting
processes did play an important part in advancing citizen journalism through social media
(Odinga 2013). The effect of this new communication tool isn’t limited to times of
crisis. Kassam (2012) looks into how incorporating social media into the schools in
Kenya can play a role in the world and how kids can use this to get a better understanding
of how the world works.
As Africa has leap-frogged its need for a fixed line Internet (Casey and Davies,
2012) and the availability of mobile phones grows, the actual accessibility of a connected
population in Sub-Saharan Africa faces limits. While many in the western world take the
social media juggernaut Facebook for granted as a free service, the costs of obtaining an
Internet connection in Kenya alone, by phone or PC are very real. Poor electrical utility
10
infrastructure leading to frequent blackouts, bandwidth costs or internet cafe charges has
made social media unrealized potential (Wyche, et al., 2013). This form of the digital
divide is ever present in Sub-Saharan Africa because it has been shown that the least
developed African countries have very low Internet access and usage rates (Fuchs and
Horak, 2008).
While social media is a new tool for communication and can bring powerful
advantages for a populace, so too come unintended consequences. The US State
department lists both Boko Haram from Nigeria and Al-Shabaab from Somalia as
terrorist organizations. And much like similar groups around the globe, they quickly
embraced social media. For established journalism outlets, embracing social media has
very real caveats. In the case of the Syrian civil war, verification and authentication of
sources and content has become a real problem (Lynch, et al., 2014).
Social media has become an avenue for citizens to express one’s self and reach a
large audience. The use of micro blogs can be analyzed to connect virtual communities
though their connections to other user (Stefanidis, et al., 2013). Analyzing this type of
data can give a better perception of the atmosphere of communities. With increased use
of social media along with the ever-evolving new computer technologies that allow us to
stay connected virtually anytime these types of virtual communities will continue to grow
as more users get added.
Terrorist organizations are using these types of communities to further their
agenda in a way that has not really been done in the past. Boko Haram, which operates
out of Nigeria, and Al-shabaab, which operates out of Somalia, have both used social
11
media to further their agendas. Evans, 2014 has done network analysis on the micro
blogging of this organization to show the use of social media in strategic communication
and engagement. Social media has opened doors for us to study these communities
online and see what type of impact they have. Another aspect of studying this type of
data is to see how countries and local communities take interest in these different types of
terrorist organizations. In this study we look more into the human factors of how these
organizations impact different communities through social media. By performing
traditional analysis of the twitter data that has been collected we will be able to get and
better understanding of how the world responds to a time of crises. We create a
participation index for each country based of the number of tweets and then normalize it
by the country’s population. These participation indices will allow us to get a better
picture of how each country feels about these terrorist organizations.
Taking this analysis to a global scale to display how countries participate in
expressing themselves about these organizations would allow to better understanding of
how a particular population feels. By not limiting ourselves to any one region we can get
a better global understanding of how different nations react and participate in the flow of
social information circulating from these organizations.
This type of analysis is of interest to a wide variety of countries in addition to
businesses. Social analysis can be of interest to countries looking to find allies for help in
combating a terrorist organization and finding hotspots of support or opposition to issues.
This thesis can contribute to the information used by policy makers in researching the
sentiment of their own population on issues. Analysis of social media can be helpful in a
12
decision if combating or avoiding a conflict will better suit their citizens. Just as a
volatile message may draw a great deal of social attention, a policy maker may find the
general population could have no material support or sustained interest in the these
divisive groups or the countries where they operate.
13
CHAPTER THREE
Objective and Hypothesis The objective of this thesis is to use geospatial analysis techniques and apply
them to geospatially located tweets. In applying these techniques we want to investigate
how social media can be analyzed for its geospatial intelligence (GEOINT) purposes.
GOEINT means the exploitation and analysis of imagery and geospatial information that
describes, assesses, and visually depicts physical features and geographically referenced
activities on the Earth (NGA, 2005). As mentioned earlier the introduction of SOCMINT
could possibly help further using social media for intelligence and law enforcement
purposes. We plan to take this idea of SOCMINT one step further by applying GEOINT
techniques to it. This will allow us to fuse these two types of intelligence to have a
broader more accurate intelligence picture that would otherwise be hard to get.
We are looking to find how Boko Haram and Al-Shabaab can impact different
countries through twitter. This thesis will investigate tweets over a three month period
referencing either Boko Haram or Al-Shabaab. We are looking to find what kind of
geospatial relationships these countries may have about these two groups. This is an
important area of research in social media to help provide information on how different
countries may feel about certain terrorist organizations. Another aspect that we hope to
uncover is how a terrorist event can change the impact of how countries respond though
14
twitter. We want to see if more countries will take an interest in these organization by
having a higher participation during the month of the event or the month after it occurred.
We plan on doing this by performing different types of geospatial analysis
to the dataset. First we will show the where these tweets from the dataset are located and
show where the highest tweeting countries are by performing a density analysis. Next we
plan to analyze the participation of each country and compare them to see what kinds of
impacts these two terrorist organizations have.
15
CHAPTER FOUR: DATA AND METHODS
4. Harvesting of Data
4.1 Process in which data is collected
George Mason University Center for Geospatial Intelligence has come up with a
dynamic process for “Harvesting ambient geospatial information from social media
feeds” (Stefanidis, et al., 2013). This system transforms social media data into geosocial
data. The process has multi-steps that generally require data collection from a set of
social media data providers through their Application Programming Interfaces (APIs),
processing its geolocation content, and storing the data in a dedicated database for further
analysis (Croitoru, et al., 2013). Having a system like this allows for the discovery of
valuable information from social media.
The way the system works for Twitter is there are two different API’s that can be
accessed. The first is a streaming style API that is just a continuous flow which is subject
to the parameters collector sets. The second is a REST API (Twitter, 2014) which allows
for queries to the twitter servers which will return results given the query parameters.
Once the API’s are accessed the data is queried form a JSON stream it is
transferred with all the information into a database system (Croitoru, et al., 2013). This
data can then be sent to analyst in different formats. Collecting data using twitters API
has allowed for a mass collection of different time periods. This system allows for many
different key words and time periods to be collected.
16
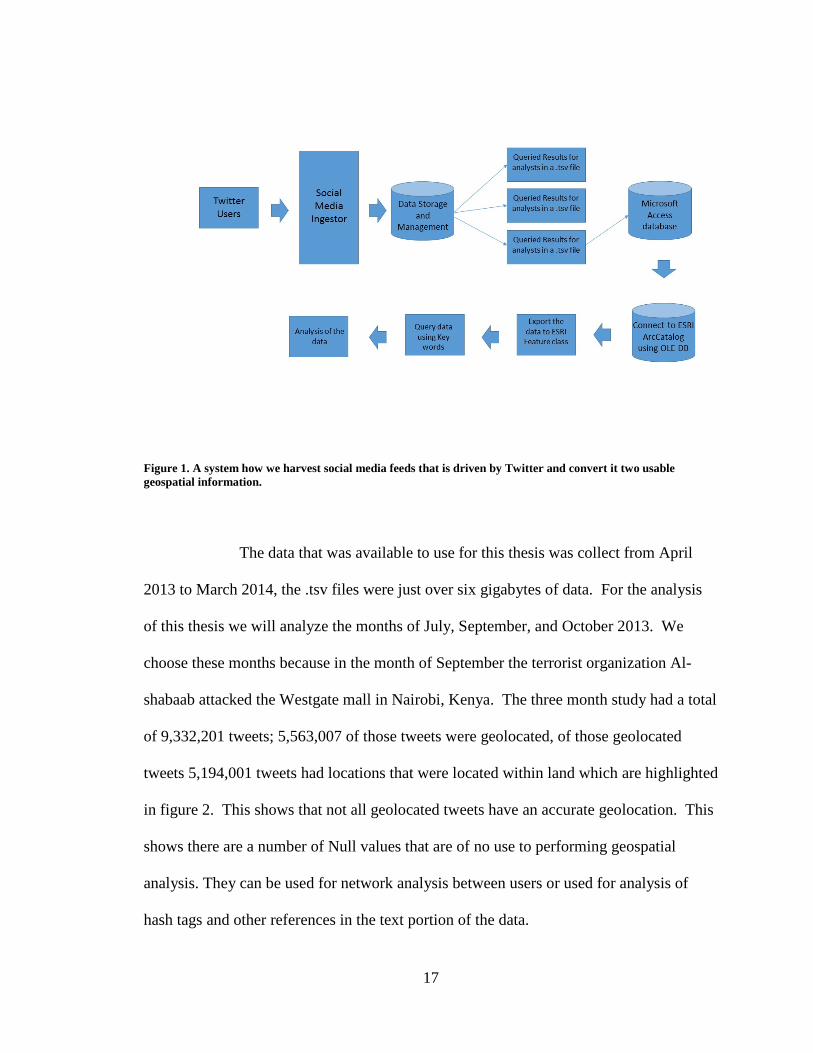
Figure 1 shows the process that was used to convert the data in to a usable dataset
for Environmental Systems Research Institute (ESRI) ArcGIS. People create tweets and
then this information stored by twitter an then it is processed by the system that has been
established by the George Mason University Center for Geospatial Intelligence. This
data is then sent to analysts in the form the tab-separated values (.tsv) file. This file will
be converted to a text file that can be opened and saved Microsoft Access database
(.mdb). Once in a Microsoft Database file the database can be accessed using ESRI
ArcCatalog by Object Linking and Embedding, Database (OLE-DB) connection. With
this connection we can convert this to a table within a file geodatabase. When we have
this table in the file geodatabase we can convert the data it to a usable feature classes in
ArcGIS.
17
Figure 1. A system how we harvest social media feeds that is driven by Twitter and convert it two usable geospatial information.
The data that was available to use for this thesis was collect from April
2013 to March 2014, the .tsv files were just over six gigabytes of data. For the analysis
of this thesis we will analyze the months of July, September, and October 2013. We
choose these months because in the month of September the terrorist organization Al-
shabaab attacked the Westgate mall in Nairobi, Kenya. The three month study had a total
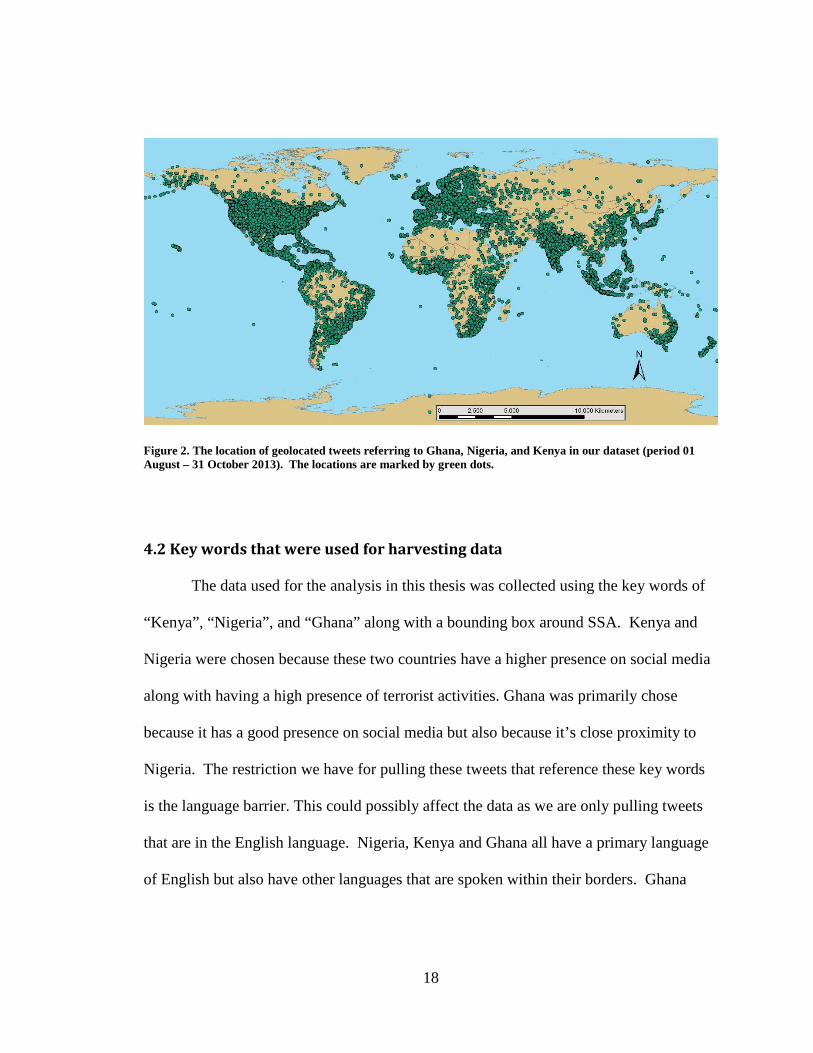
of 9,332,201 tweets; 5,563,007 of those tweets were geolocated, of those geolocated
tweets 5,194,001 tweets had locations that were located within land which are highlighted
in figure 2. This shows that not all geolocated tweets have an accurate geolocation. This
shows there are a number of Null values that are of no use to performing geospatial
analysis. They can be used for network analysis between users or used for analysis of
hash tags and other references in the text portion of the data.
18
Figure 2. The location of geolocated tweets referring to Ghana, Nigeria, and Kenya in our dataset (period 01 August – 31 October 2013). The locations are marked by green dots.
4.2 Key words that were used for harvesting data
The data used for the analysis in this thesis was collected using the key words of
“Kenya”, “Nigeria”, and “Ghana” along with a bounding box around SSA. Kenya and
Nigeria were chosen because these two countries have a higher presence on social media
along with having a high presence of terrorist activities. Ghana was primarily chose
because it has a good presence on social media but also because it’s close proximity to
Nigeria. The restriction we have for pulling these tweets that reference these key words
is the language barrier. This could possibly affect the data as we are only pulling tweets
that are in the English language. Nigeria, Kenya and Ghana all have a primary language
of English but also have other languages that are spoken within their borders. Ghana
19
could have the biggest impact by the language barrier since English accounts for only a
small portion of languages being spoken despite being the official language.
4.3 Creating the Feature Class with Our Parameters
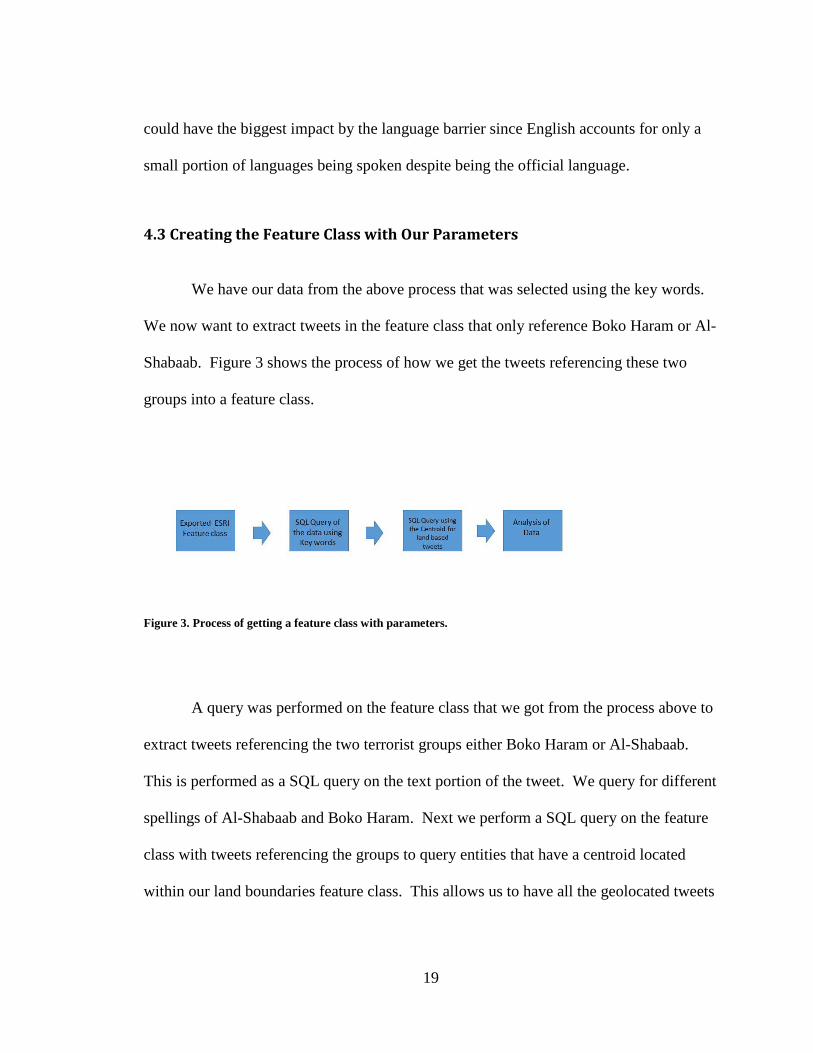
We have our data from the above process that was selected using the key words.
We now want to extract tweets in the feature class that only reference Boko Haram or Al-
Shabaab. Figure 3 shows the process of how we get the tweets referencing these two
groups into a feature class.
Figure 3. Process of getting a feature class with parameters.
A query was performed on the feature class that we got from the process above to
extract tweets referencing the two terrorist groups either Boko Haram or Al-Shabaab.
This is performed as a SQL query on the text portion of the tweet. We query for different
spellings of Al-Shabaab and Boko Haram. Next we perform a SQL query on the feature
class with tweets referencing the groups to query entities that have a centroid located
within our land boundaries feature class. This allows us to have all the geolocated tweets
20
located within a country boundaries. Unfortunately not all geolocated tweets are have an
accurate geolocation. Once all the data is selected we perform an export to new feature
class of the queried entities. This will become our new feature class that has entities that
only reference Boko Haram and Al-Shabaab in tweets and that have a land based
geolocation. The will leaves us with 20,023 tweets from our original dataset.
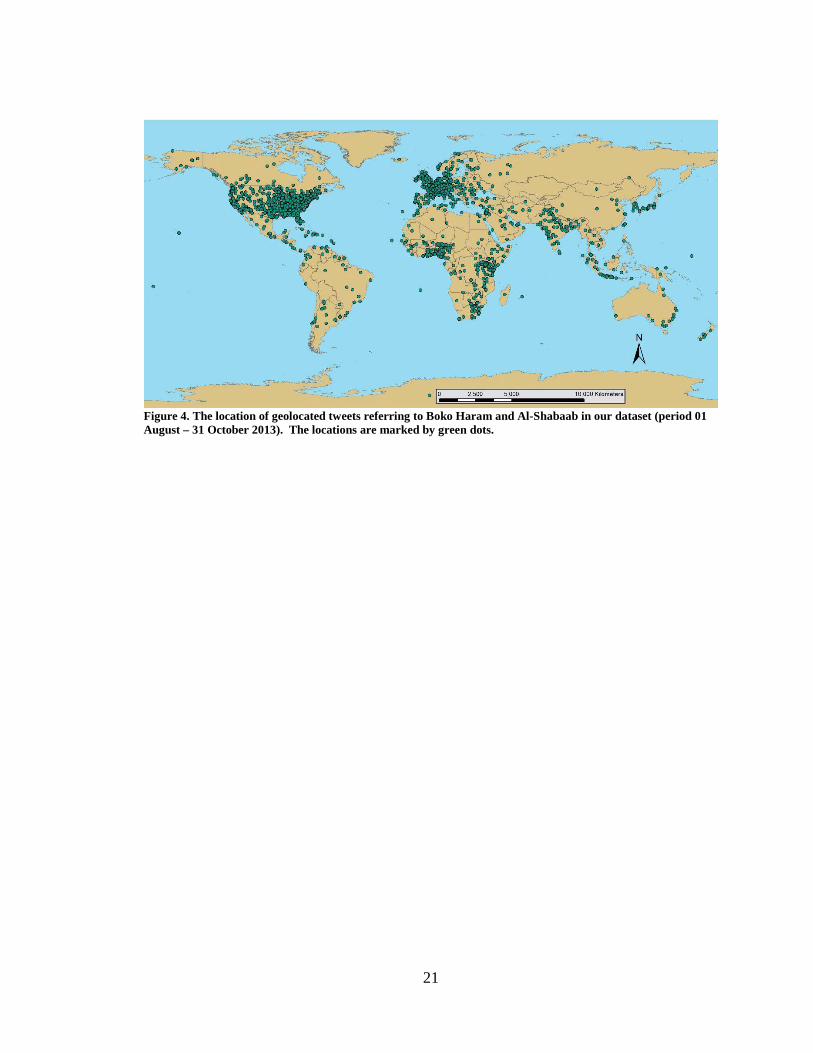
4.4 Dataset for Boko Haram and Al-Shabaab
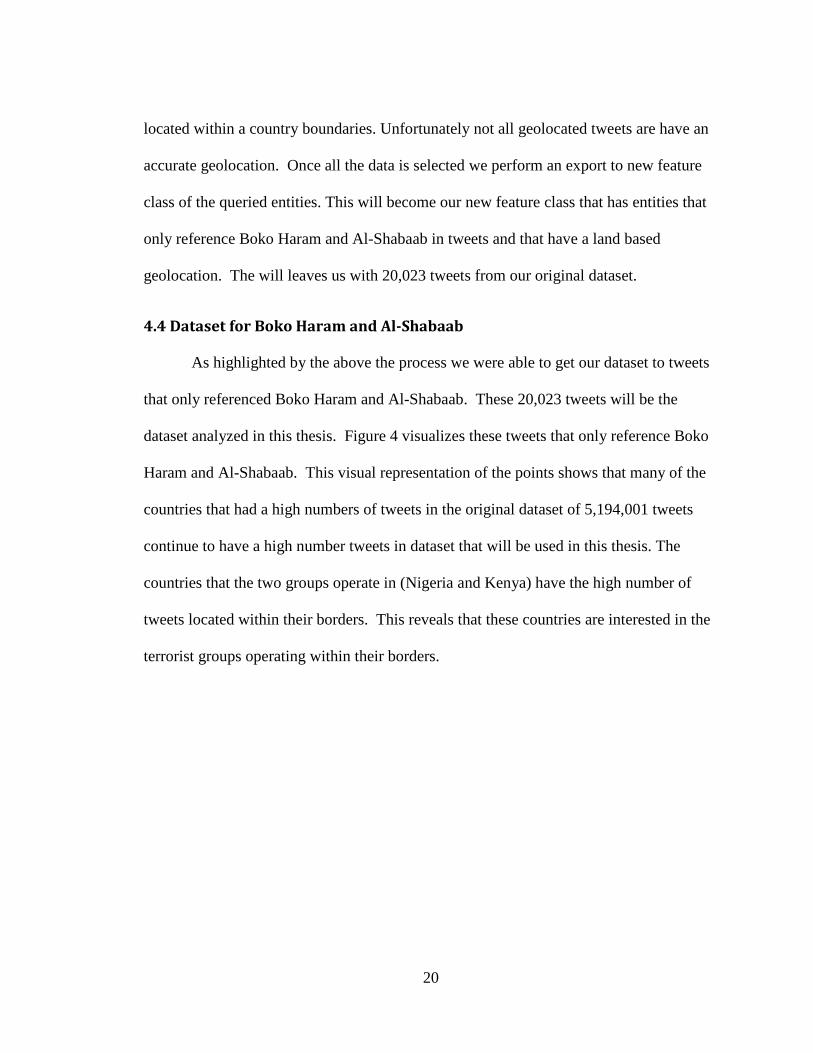
As highlighted by the above the process we were able to get our dataset to tweets
that only referenced Boko Haram and Al-Shabaab. These 20,023 tweets will be the
dataset analyzed in this thesis. Figure 4 visualizes these tweets that only reference Boko
Haram and Al-Shabaab. This visual representation of the points shows that many of the
countries that had a high numbers of tweets in the original dataset of 5,194,001 tweets
continue to have a high number tweets in dataset that will be used in this thesis. The
countries that the two groups operate in (Nigeria and Kenya) have the high number of
tweets located within their borders. This reveals that these countries are interested in the
terrorist groups operating within their borders.
21
Figure 4. The location of geolocated tweets referring to Boko Haram and Al-Shabaab in our dataset (period 01 August – 31 October 2013). The locations are marked by green dots.
22
CHAPTER FIVE: RESULTS
Geospatial Analysis of Boko Haram and Al-Shabaab
5.1 Boko Haram
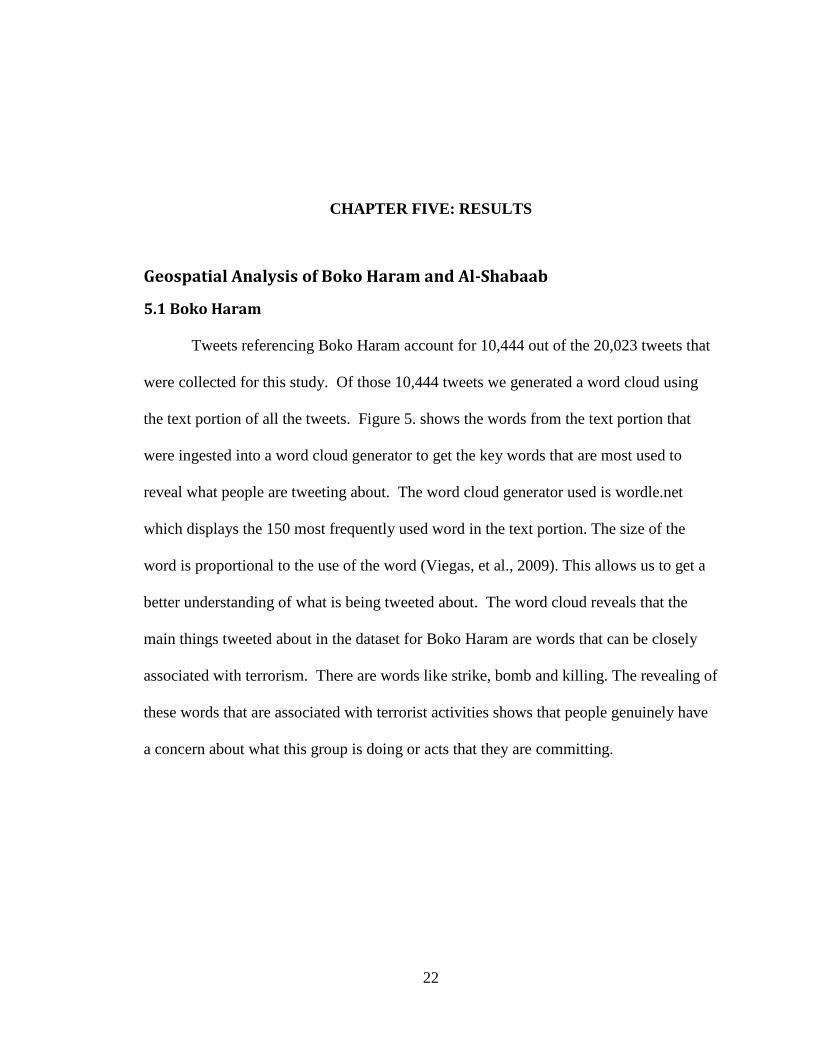
Tweets referencing Boko Haram account for 10,444 out of the 20,023 tweets that
were collected for this study. Of those 10,444 tweets we generated a word cloud using
the text portion of all the tweets. Figure 5. shows the words from the text portion that
were ingested into a word cloud generator to get the key words that are most used to
reveal what people are tweeting about. The word cloud generator used is wordle.net
which displays the 150 most frequently used word in the text portion. The size of the
word is proportional to the use of the word (Viegas, et al., 2009). This allows us to get a
better understanding of what is being tweeted about. The word cloud reveals that the
main things tweeted about in the dataset for Boko Haram are words that can be closely
associated with terrorism. There are words like strike, bomb and killing. The revealing of
these words that are associated with terrorist activities shows that people genuinely have
a concern about what this group is doing or acts that they are committing.
23
Figure 5. A frequency word cloud summarizing Twitter content for our geolocated tweets that referenced either Boko Haram.
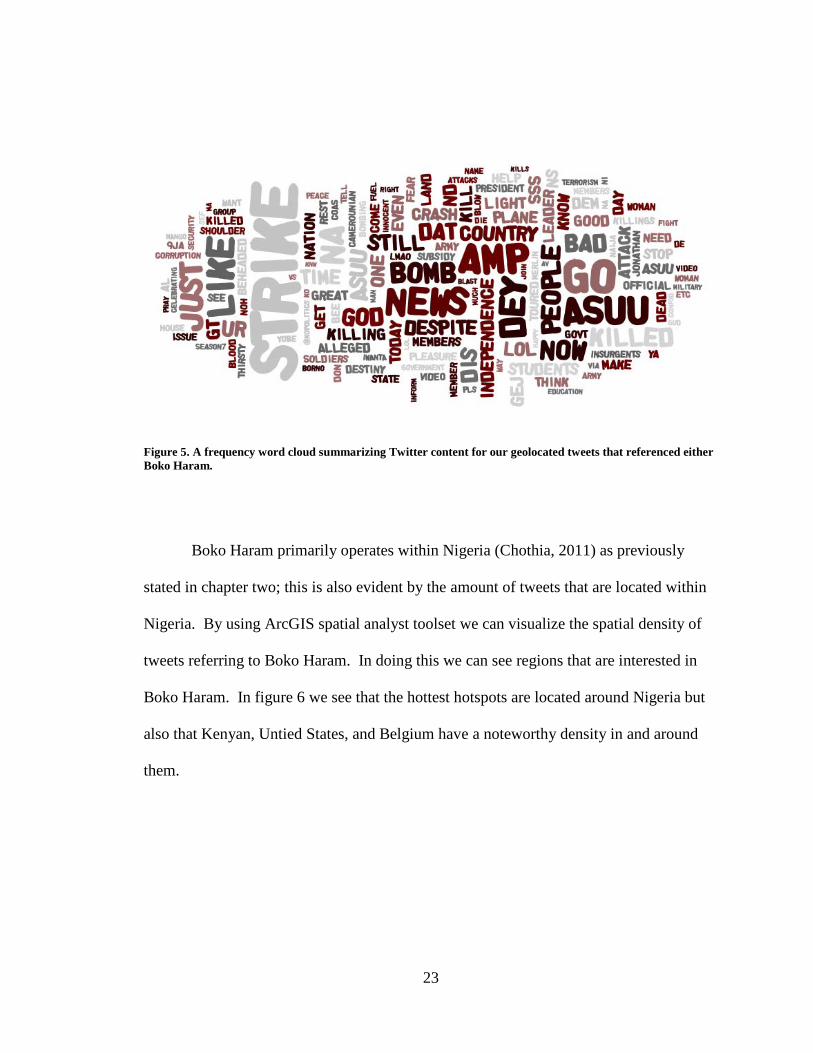
Boko Haram primarily operates within Nigeria (Chothia, 2011) as previously
stated in chapter two; this is also evident by the amount of tweets that are located within
Nigeria. By using ArcGIS spatial analyst toolset we can visualize the spatial density of
tweets referring to Boko Haram. In doing this we can see regions that are interested in
Boko Haram. In figure 6 we see that the hottest hotspots are located around Nigeria but
also that Kenyan, Untied States, and Belgium have a noteworthy density in and around
them.
24
Figure 6. A density analysis revealing hotspots in geolocated tweet, generated using ArcGIS 10.1 Spatial Analysis.
In order for us to better utilize the data that we have and get a true picture of the
data we must create an index that allows us to normalize our data. The reason we
normalize this data is it allows for us to compare relations between countries. To
normalize our dataset we will take our total number of tweets and divide that by the
countries total population. Doing this gives us our participation index. Table 1 shows
our dataset with the countries and the participation index for the top 15 countries that
tweeted about Boko Haram. As you can see this table give us a better understanding of
25
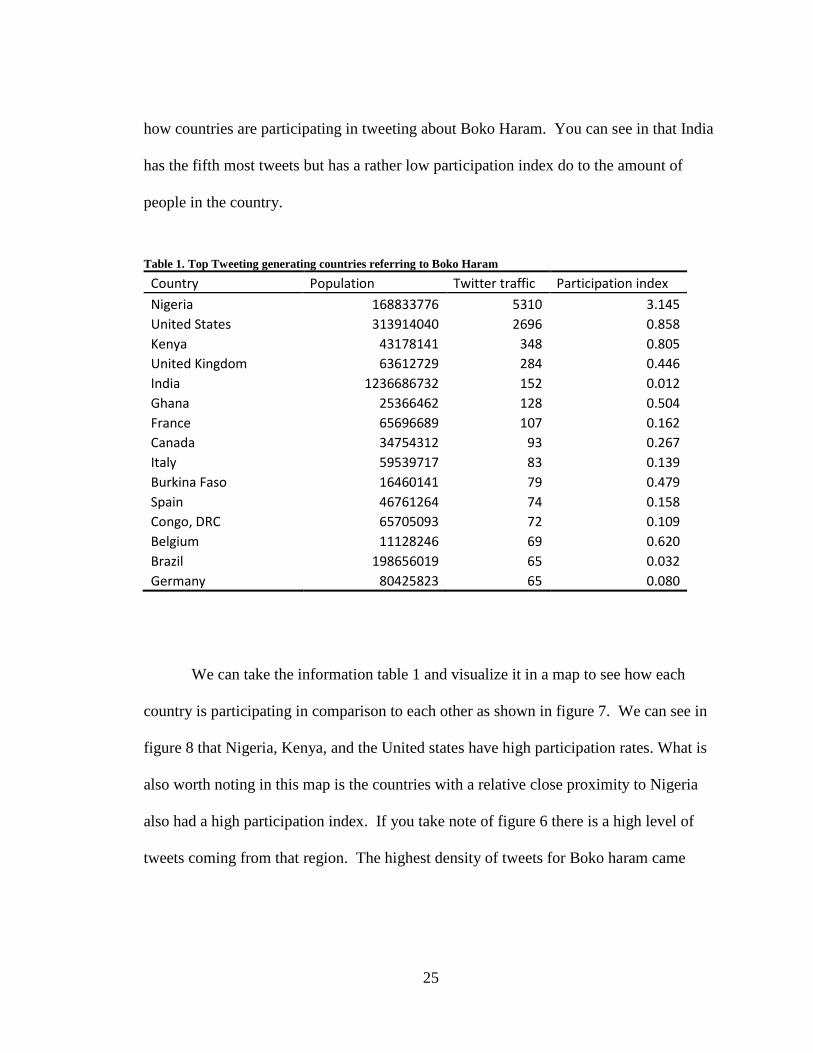
how countries are participating in tweeting about Boko Haram. You can see in that India
has the fifth most tweets but has a rather low participation index do to the amount of
people in the country.
Table 1. Top Tweeting generating countries referring to Boko Haram
Country Population Twitter traffic Participation index Nigeria 168833776 5310 3.145 United States 313914040 2696 0.858 Kenya 43178141 348 0.805 United Kingdom 63612729 284 0.446 India 1236686732 152 0.012 Ghana 25366462 128 0.504 France 65696689 107 0.162 Canada 34754312 93 0.267 Italy 59539717 83 0.139 Burkina Faso 16460141 79 0.479 Spain 46761264 74 0.158 Congo, DRC 65705093 72 0.109 Belgium 11128246 69 0.620 Brazil 198656019 65 0.032 Germany 80425823 65 0.080
We can take the information table 1 and visualize it in a map to see how each
country is participating in comparison to each other as shown in figure 7. We can see in
figure 8 that Nigeria, Kenya, and the United states have high participation rates. What is
also worth noting in this map is the countries with a relative close proximity to Nigeria
also had a high participation index. If you take note of figure 6 there is a high level of
tweets coming from that region. The highest density of tweets for Boko haram came
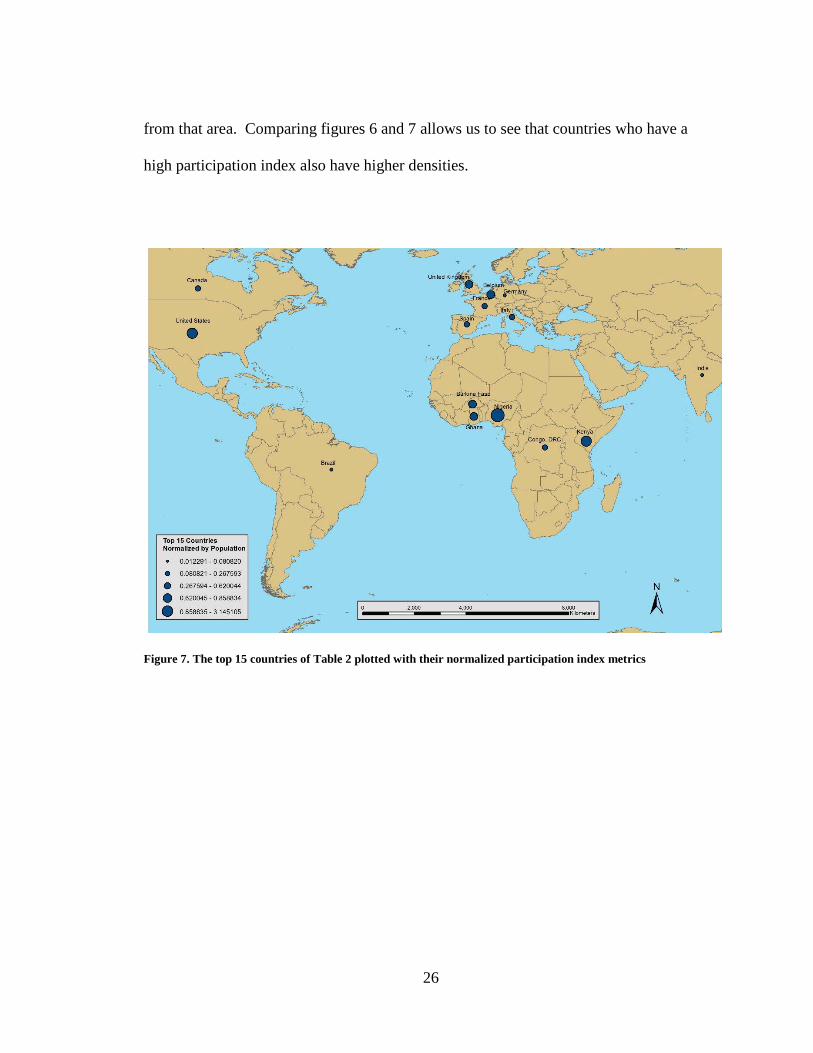
26
from that area. Comparing figures 6 and 7 allows us to see that countries who have a
high participation index also have higher densities.
Figure 7. The top 15 countries of Table 2 plotted with their normalized participation index metrics
27
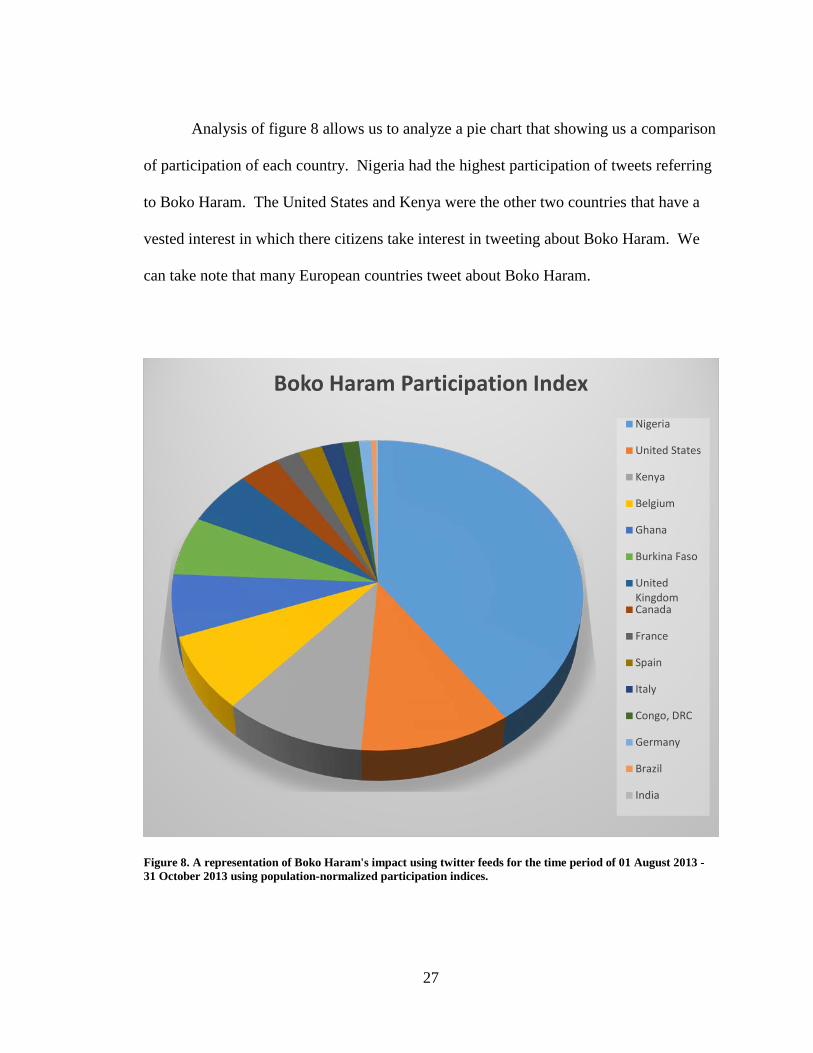
Analysis of figure 8 allows us to analyze a pie chart that showing us a comparison
of participation of each country. Nigeria had the highest participation of tweets referring
to Boko Haram. The United States and Kenya were the other two countries that have a
vested interest in which there citizens take interest in tweeting about Boko Haram. We
can take note that many European countries tweet about Boko Haram.
Figure 8. A representation of Boko Haram's impact using twitter feeds for the time period of 01 August 2013 - 31 October 2013 using population-normalized participation indices.
Boko Haram Participation Index Nigeria
United States
Kenya
Belgium
Ghana
Burkina Faso
UnitedKingdomCanada
France
Spain
Italy
Congo, DRC
Germany
Brazil
India
28
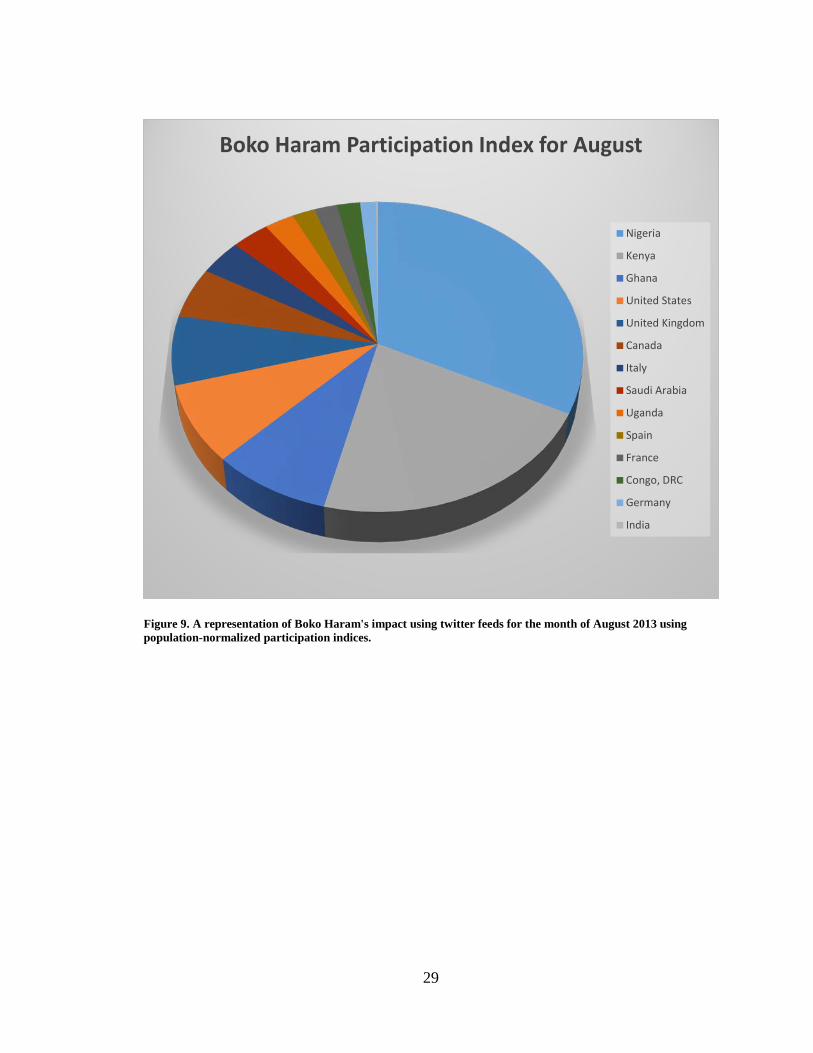
We can further break down the data on Boko haram by the participation indices
by Month. In doing this we look to see the impacts that Boko Haram has over a certain
region each month. What we expect to see in doing this is to see if certain months create
a higher participation index for different countries. We can also see the impact that Boko
Haram has on different nations. This gives us a better understanding on what kind of
impacts this group can have on a month-to-month time frame. Having this breakdown
we will be able to explore what kind of events can possibly impact a culture to take
interest in this group; or possibly see if certain events can create a decline interests of this
group. This will allow us to have a time comparison for the three month study. Figures 9
– 11 have the breakdown of the participation indices broken down by month for the
dataset.
29
Figure 9. A representation of Boko Haram's impact using twitter feeds for the month of August 2013 using population-normalized participation indices.
Boko Haram Participation Index for August
Nigeria
Kenya
Ghana
United States
United Kingdom
Canada
Italy
Saudi Arabia
Uganda
Spain
France
Congo, DRC
Germany
India
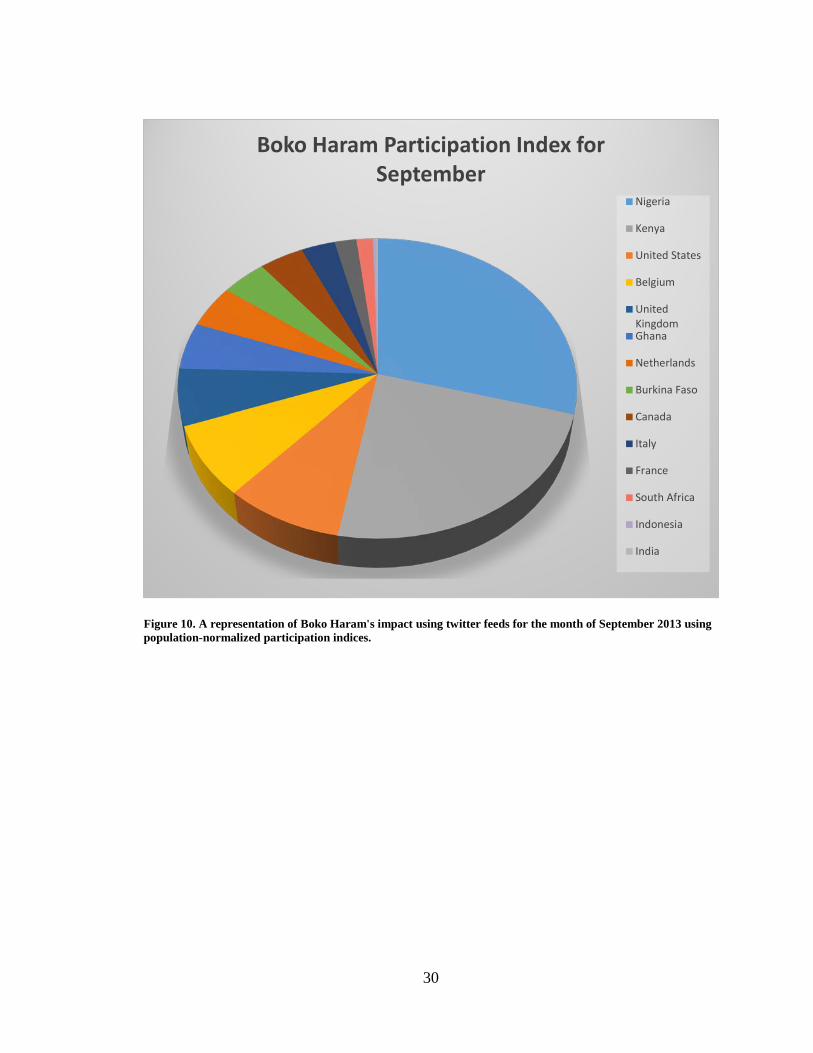
30
Figure 10. A representation of Boko Haram's impact using twitter feeds for the month of September 2013 using population-normalized participation indices.
Boko Haram Participation Index for September
Nigeria
Kenya
United States
Belgium
UnitedKingdomGhana
Netherlands
Burkina Faso
Canada
Italy
France
South Africa
Indonesia
India
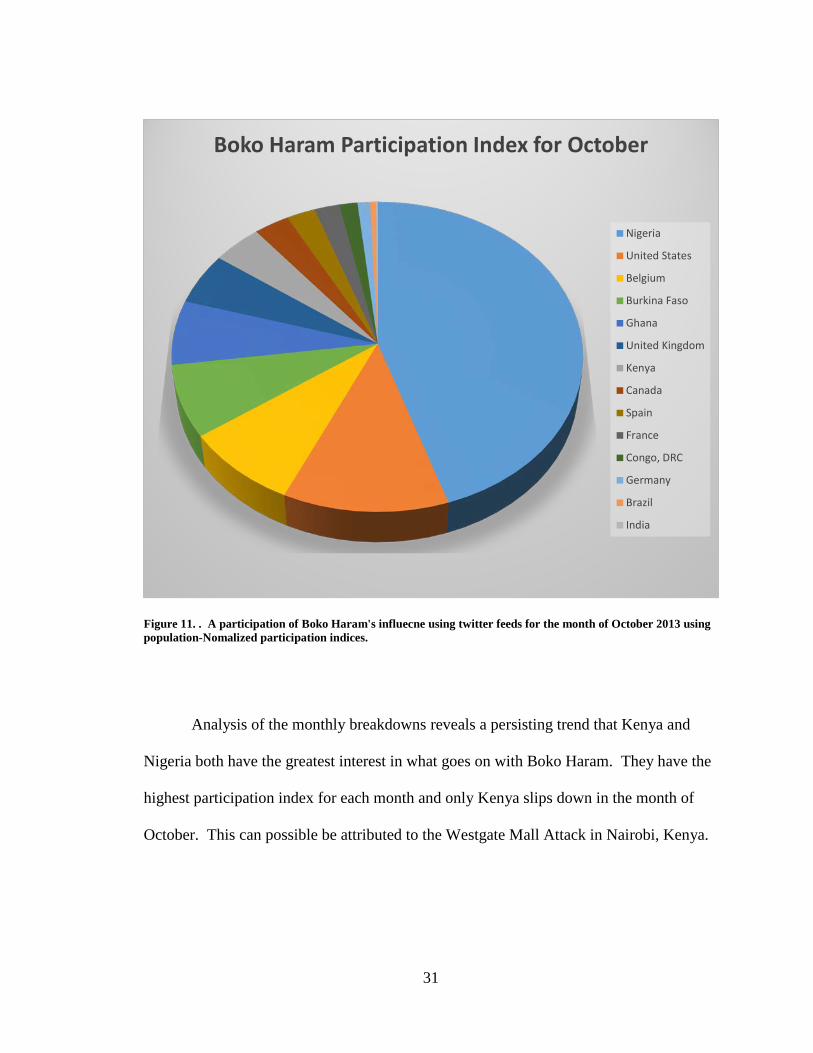
31
Figure 11. . A participation of Boko Haram's influecne using twitter feeds for the month of October 2013 using population-Nomalized participation indices.
Analysis of the monthly breakdowns reveals a persisting trend that Kenya and
Nigeria both have the greatest interest in what goes on with Boko Haram. They have the
highest participation index for each month and only Kenya slips down in the month of
October. This can possible be attributed to the Westgate Mall Attack in Nairobi, Kenya.
Boko Haram Participation Index for October
Nigeria
United States
Belgium
Burkina Faso
Ghana
United Kingdom
Kenya
Canada
Spain
France
Congo, DRC
Germany
Brazil
India
32
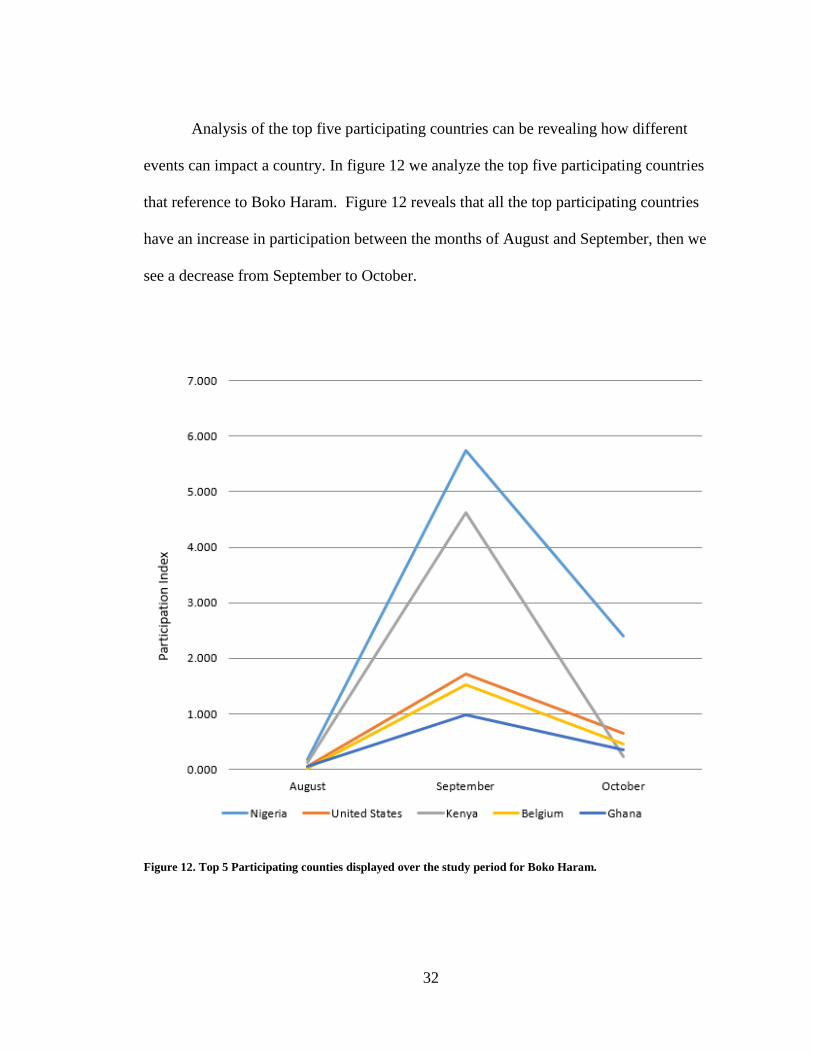
Analysis of the top five participating countries can be revealing how different
events can impact a country. In figure 12 we analyze the top five participating countries
that reference to Boko Haram. Figure 12 reveals that all the top participating countries
have an increase in participation between the months of August and September, then we
see a decrease from September to October.
Figure 12. Top 5 Participating counties displayed over the study period for Boko Haram.
33
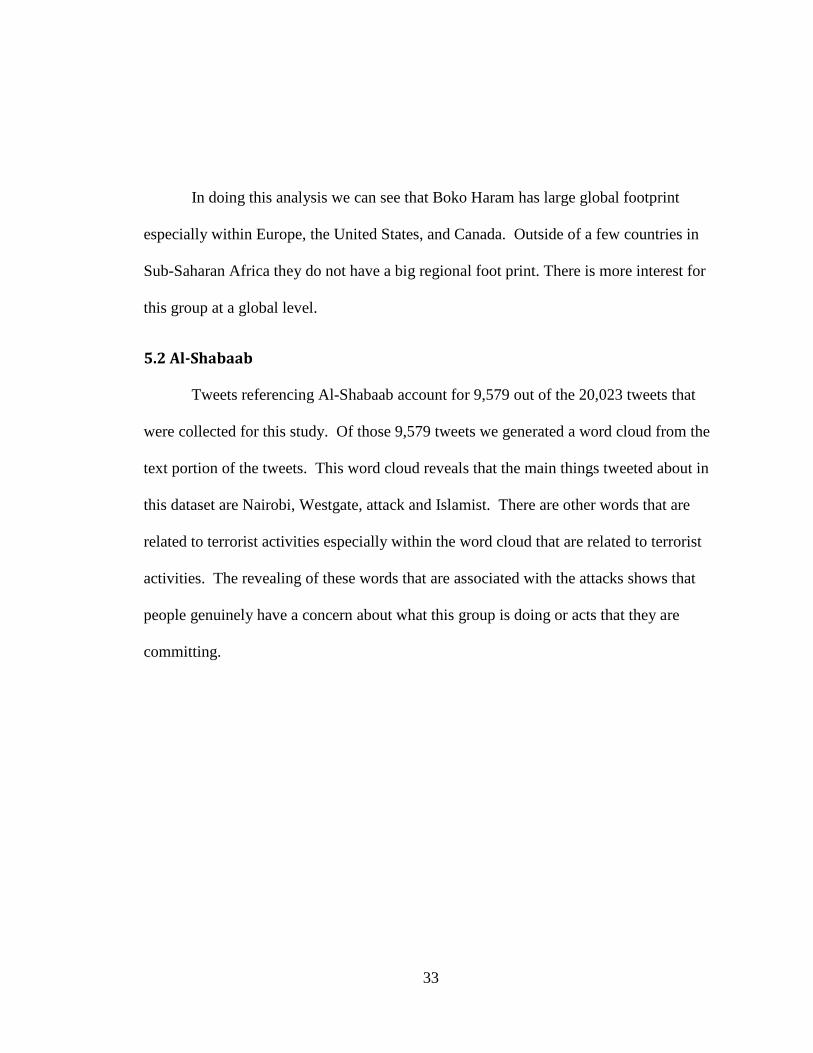
In doing this analysis we can see that Boko Haram has large global footprint
especially within Europe, the United States, and Canada. Outside of a few countries in
Sub-Saharan Africa they do not have a big regional foot print. There is more interest for
this group at a global level.
5.2 Al-Shabaab
Tweets referencing Al-Shabaab account for 9,579 out of the 20,023 tweets that
were collected for this study. Of those 9,579 tweets we generated a word cloud from the
text portion of the tweets. This word cloud reveals that the main things tweeted about in
this dataset are Nairobi, Westgate, attack and Islamist. There are other words that are
related to terrorist activities especially within the word cloud that are related to terrorist
activities. The revealing of these words that are associated with the attacks shows that
people genuinely have a concern about what this group is doing or acts that they are
committing.
34
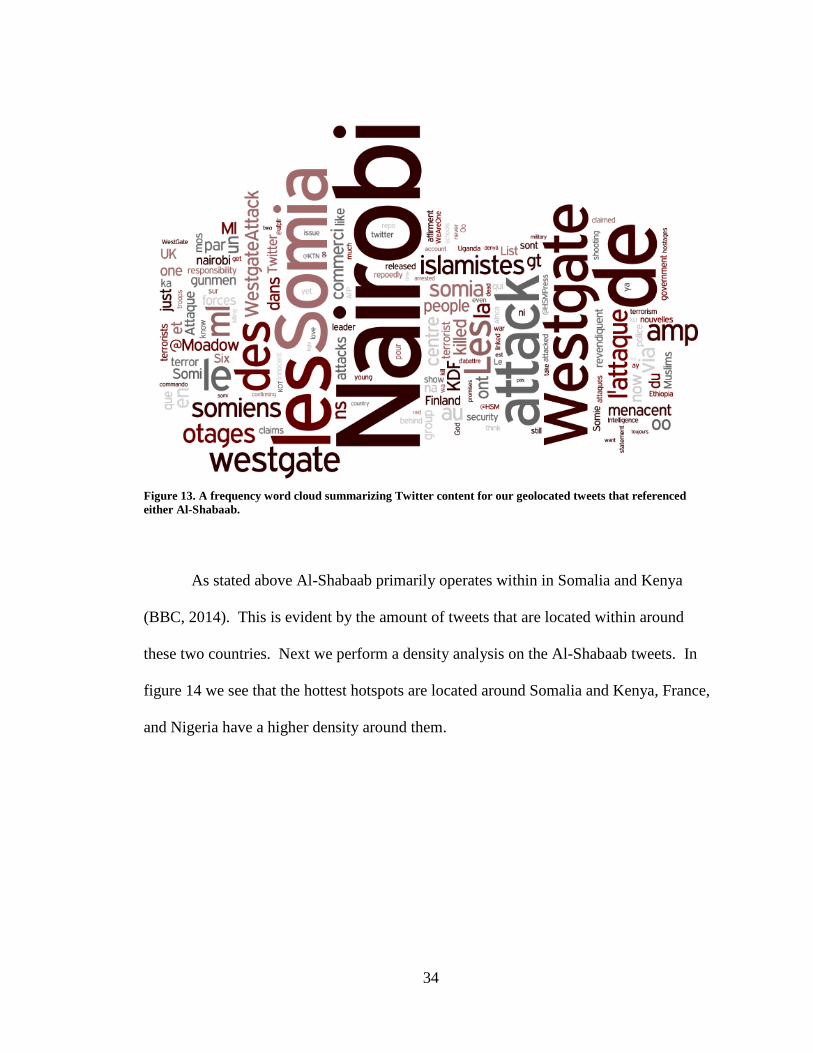
Figure 13. A frequency word cloud summarizing Twitter content for our geolocated tweets that referenced either Al-Shabaab.
As stated above Al-Shabaab primarily operates within in Somalia and Kenya
(BBC, 2014). This is evident by the amount of tweets that are located within around
these two countries. Next we perform a density analysis on the Al-Shabaab tweets. In
figure 14 we see that the hottest hotspots are located around Somalia and Kenya, France,
and Nigeria have a higher density around them.
35
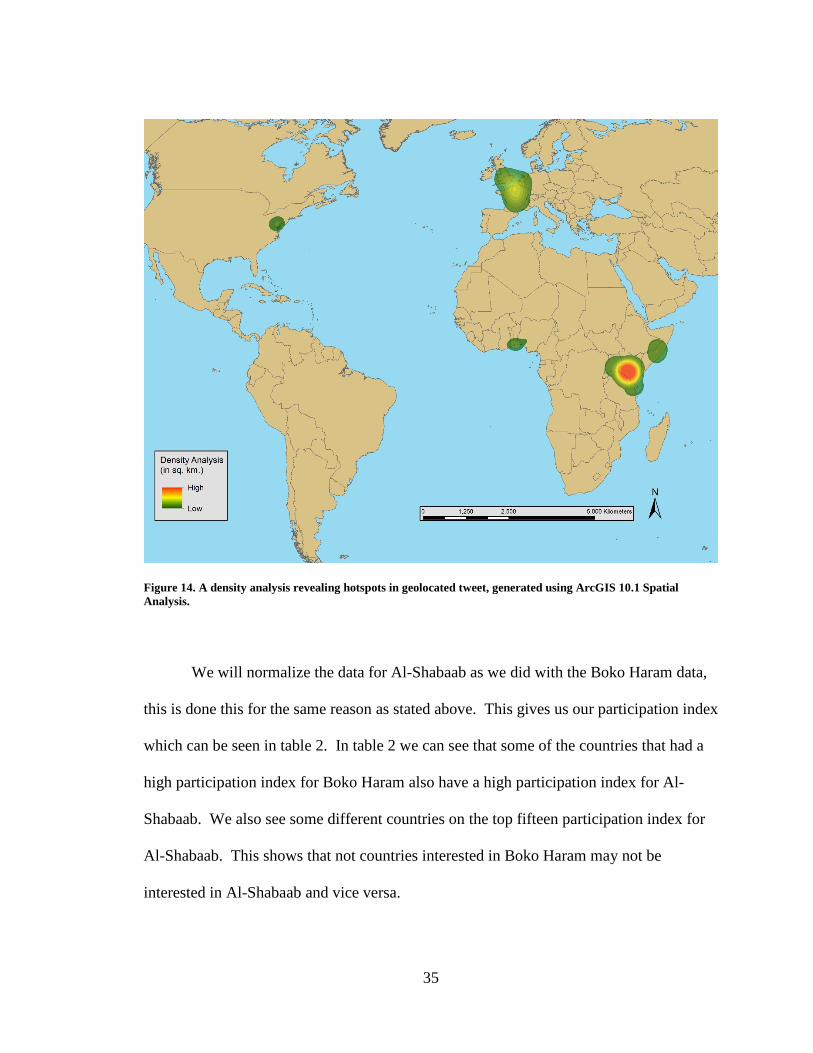
Figure 14. A density analysis revealing hotspots in geolocated tweet, generated using ArcGIS 10.1 Spatial Analysis.
We will normalize the data for Al-Shabaab as we did with the Boko Haram data,
this is done this for the same reason as stated above. This gives us our participation index
which can be seen in table 2. In table 2 we can see that some of the countries that had a
high participation index for Boko Haram also have a high participation index for Al-
Shabaab. We also see some different countries on the top fifteen participation index for
Al-Shabaab. This shows that not countries interested in Boko Haram may not be
interested in Al-Shabaab and vice versa.
36
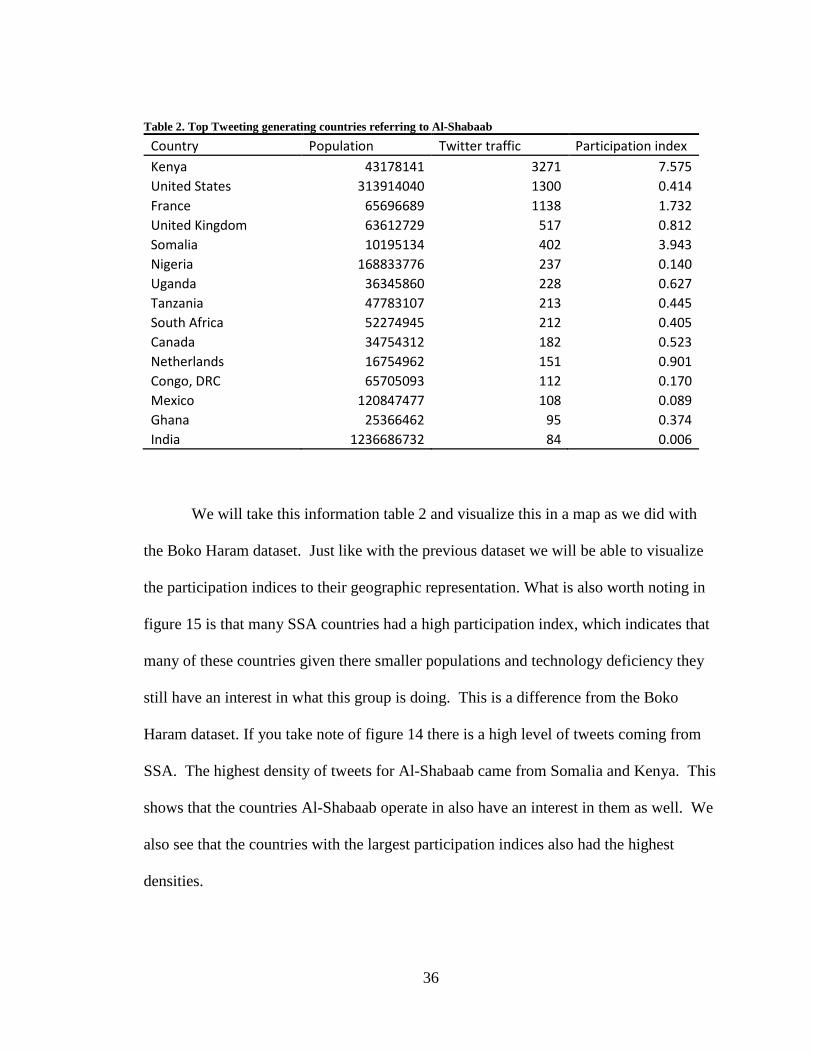
Table 2. Top Tweeting generating countries referring to Al-Shabaab
Country Population Twitter traffic Participation index Kenya 43178141 3271 7.575 United States 313914040 1300 0.414 France 65696689 1138 1.732 United Kingdom 63612729 517 0.812 Somalia 10195134 402 3.943 Nigeria 168833776 237 0.140 Uganda 36345860 228 0.627 Tanzania 47783107 213 0.445 South Africa 52274945 212 0.405 Canada 34754312 182 0.523 Netherlands 16754962 151 0.901 Congo, DRC 65705093 112 0.170 Mexico 120847477 108 0.089 Ghana 25366462 95 0.374 India 1236686732 84 0.006
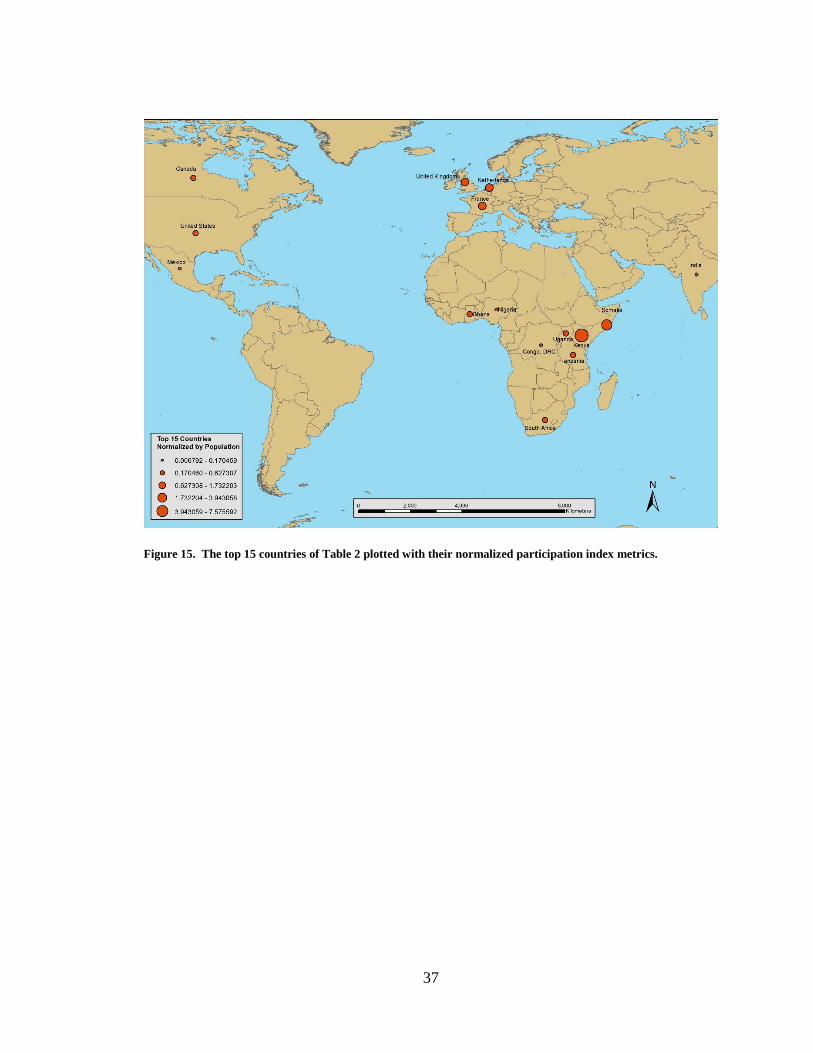
We will take this information table 2 and visualize this in a map as we did with
the Boko Haram dataset. Just like with the previous dataset we will be able to visualize
the participation indices to their geographic representation. What is also worth noting in
figure 15 is that many SSA countries had a high participation index, which indicates that
many of these countries given there smaller populations and technology deficiency they
still have an interest in what this group is doing. This is a difference from the Boko
Haram dataset. If you take note of figure 14 there is a high level of tweets coming from
SSA. The highest density of tweets for Al-Shabaab came from Somalia and Kenya. This
shows that the countries Al-Shabaab operate in also have an interest in them as well. We
also see that the countries with the largest participation indices also had the highest
densities.
37
Figure 15. The top 15 countries of Table 2 plotted with their normalized participation index metrics.
38
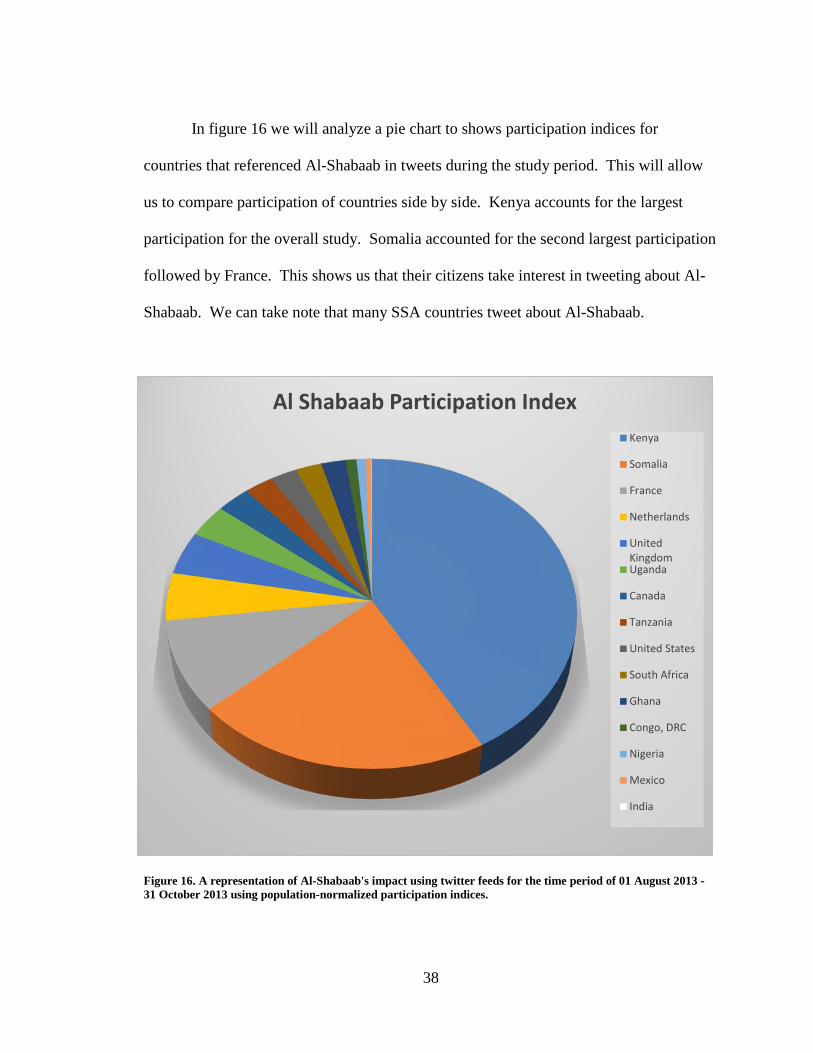
In figure 16 we will analyze a pie chart to shows participation indices for
countries that referenced Al-Shabaab in tweets during the study period. This will allow
us to compare participation of countries side by side. Kenya accounts for the largest
participation for the overall study. Somalia accounted for the second largest participation
followed by France. This shows us that their citizens take interest in tweeting about Al-
Shabaab. We can take note that many SSA countries tweet about Al-Shabaab.
Figure 16. A representation of Al-Shabaab's impact using twitter feeds for the time period of 01 August 2013 - 31 October 2013 using population-normalized participation indices.
Al Shabaab Participation Index Kenya
Somalia
France
Netherlands
UnitedKingdomUganda
Canada
Tanzania
United States
South Africa
Ghana
Congo, DRC
Nigeria
Mexico
India
39
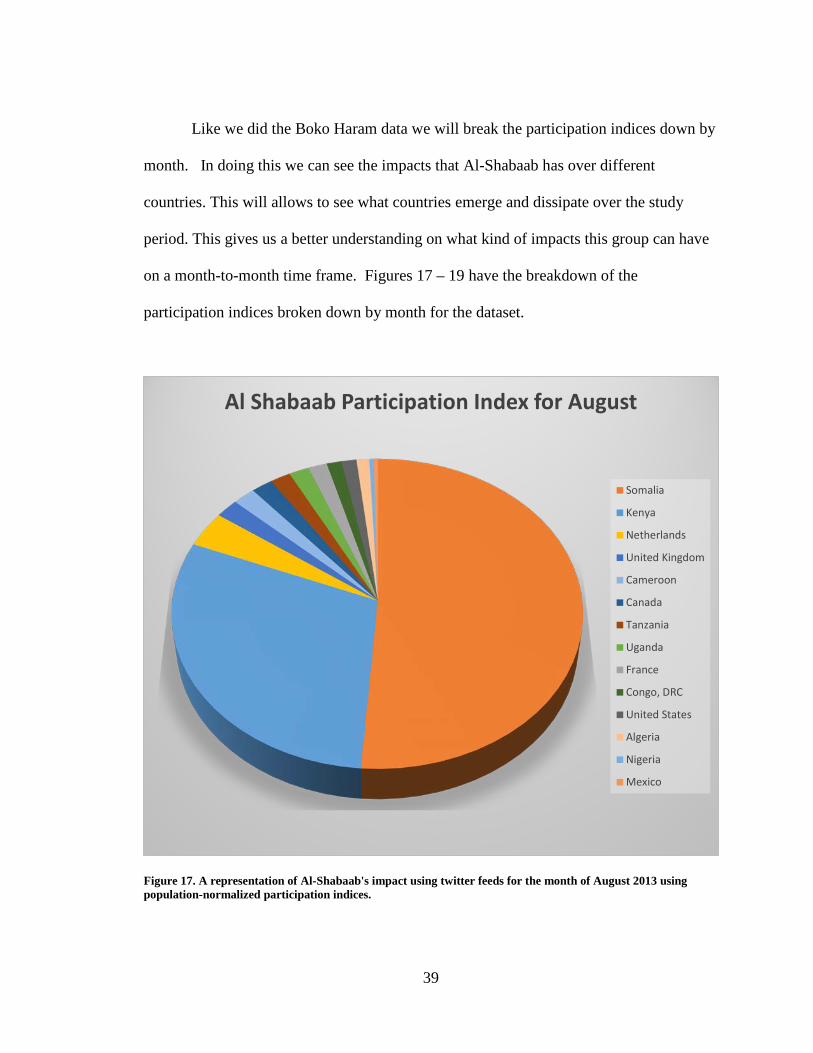
Like we did the Boko Haram data we will break the participation indices down by
month. In doing this we can see the impacts that Al-Shabaab has over different
countries. This will allows to see what countries emerge and dissipate over the study
period. This gives us a better understanding on what kind of impacts this group can have
on a month-to-month time frame. Figures 17 – 19 have the breakdown of the
participation indices broken down by month for the dataset.
Figure 17. A representation of Al-Shabaab's impact using twitter feeds for the month of August 2013 using population-normalized participation indices.
Al Shabaab Participation Index for August
Somalia
Kenya
Netherlands
United Kingdom
Cameroon
Canada
Tanzania
Uganda
France
Congo, DRC
United States
Algeria
Nigeria
Mexico
40
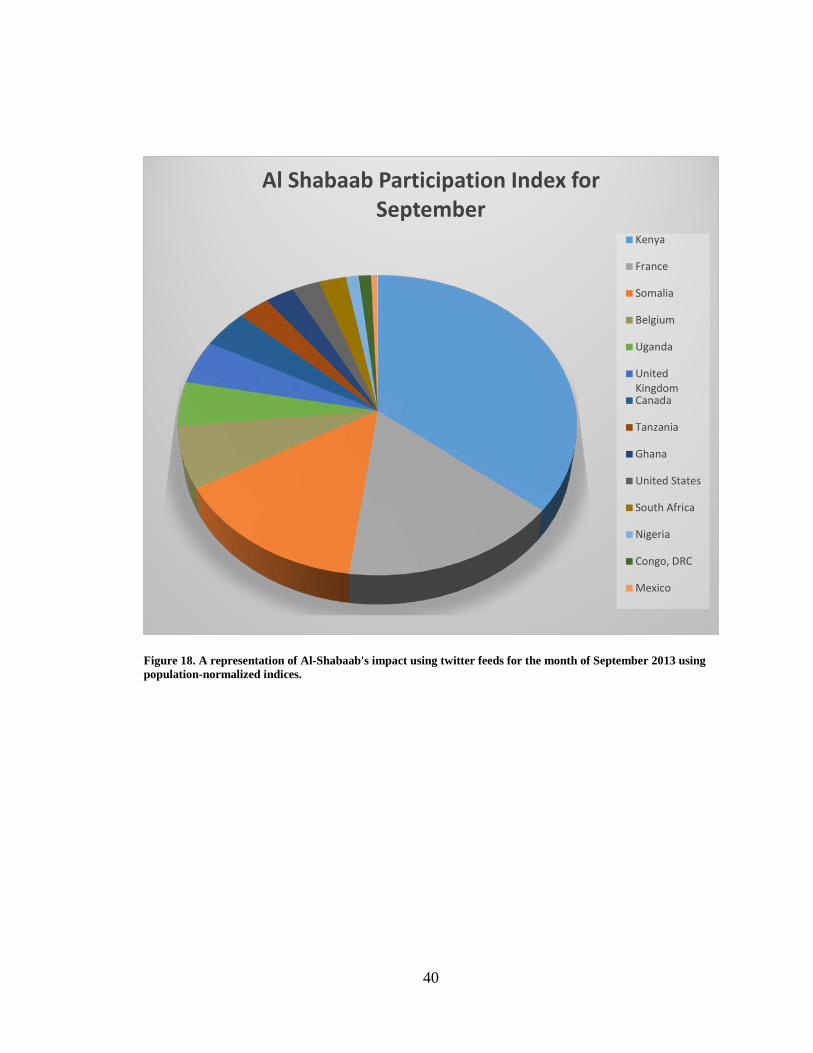
Figure 18. A representation of Al-Shabaab's impact using twitter feeds for the month of September 2013 using population-normalized indices.
Al Shabaab Participation Index for September
Kenya
France
Somalia
Belgium
Uganda
UnitedKingdomCanada
Tanzania
Ghana
United States
South Africa
Nigeria
Congo, DRC
Mexico
41
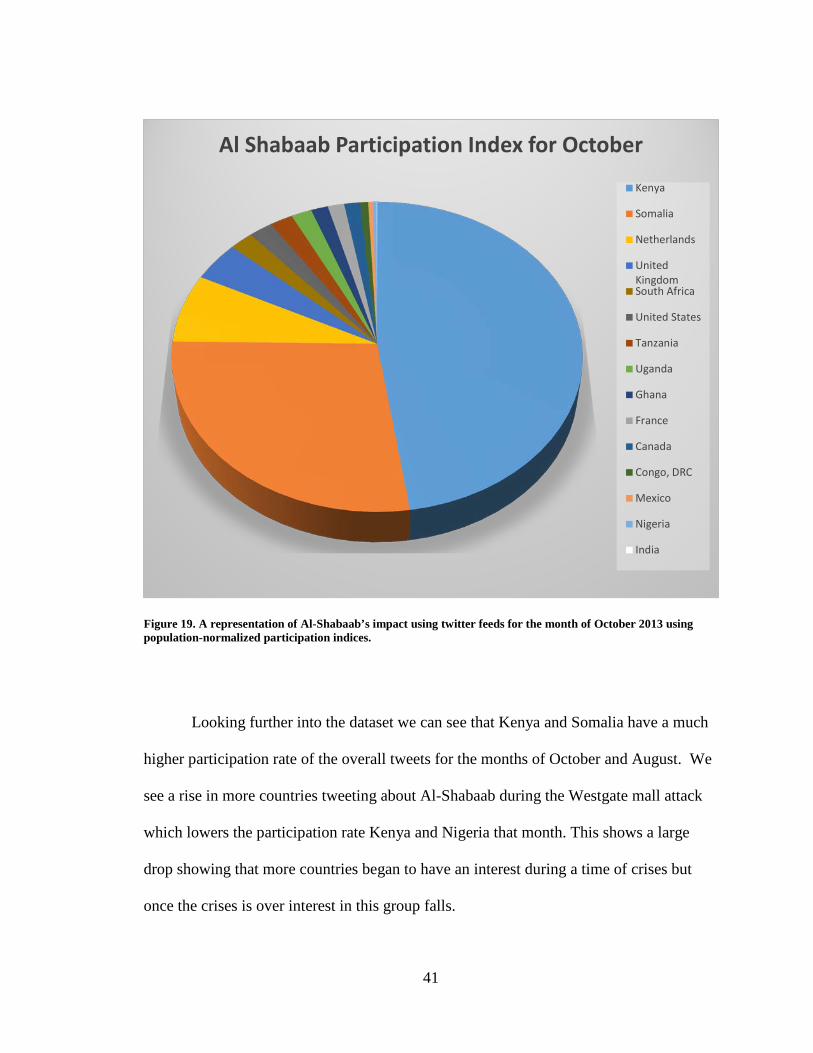
Figure 19. A representation of Al-Shabaab’s impact using twitter feeds for the month of October 2013 using population-normalized participation indices.
Looking further into the dataset we can see that Kenya and Somalia have a much
higher participation rate of the overall tweets for the months of October and August. We
see a rise in more countries tweeting about Al-Shabaab during the Westgate mall attack
which lowers the participation rate Kenya and Nigeria that month. This shows a large
drop showing that more countries began to have an interest during a time of crises but
once the crises is over interest in this group falls.
Al Shabaab Participation Index for October
Kenya
Somalia
Netherlands
UnitedKingdomSouth Africa
United States
Tanzania
Uganda
Ghana
France
Canada
Congo, DRC
Mexico
Nigeria
India
42
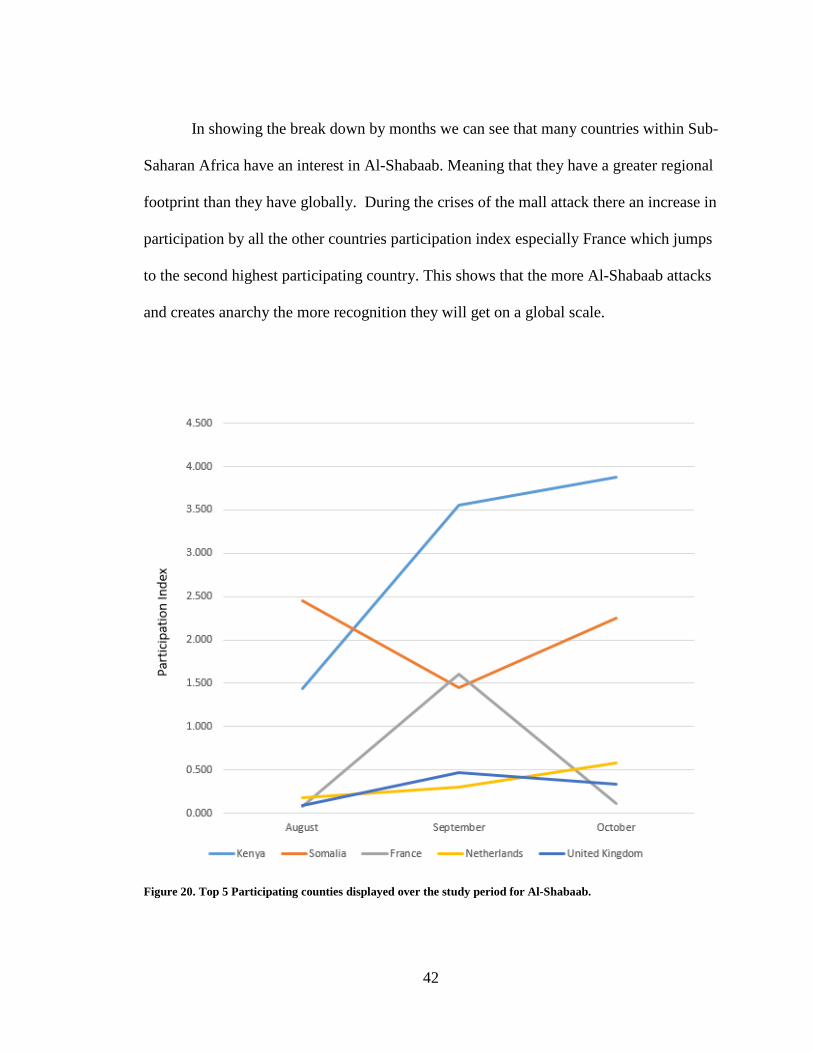
In showing the break down by months we can see that many countries within Sub-
Saharan Africa have an interest in Al-Shabaab. Meaning that they have a greater regional
footprint than they have globally. During the crises of the mall attack there an increase in
participation by all the other countries participation index especially France which jumps
to the second highest participating country. This shows that the more Al-Shabaab attacks
and creates anarchy the more recognition they will get on a global scale.
Figure 20. Top 5 Participating counties displayed over the study period for Al-Shabaab.
43
Analysis of the top five participating countries can be revealing how different
events can impact a country. In figure 20 we analyze the five top participating countries
that refer to Al-Shabaab. We can see that there is a spike in participation from all the
countries except Somalia from August to September. It is interesting that the month of
the Westgate mall attack Somalia has a decrease in participation. The participation from
September to October for the Kenya and the Netherlands continues to rise. Somalia has
an increase and almost returns to what its participation was in August. Then United
Kingdom has a slight decrease but France has a rather large decrease which brings it back
to its normal participation index. Plotting out the participation give us an insight on to
how these countries react to a crises situation involving one of these terrorist
organizations. The two most interesting countries are Somalia and France. These two
countries have the sharpest increases and decreases. This could be that that France has an
interest when a crises happens in Sub-Saharan Africa. Where in Somalia people could be
afraid to tweet and express themselves or Al-Shabaab members could be practicing some
sort of operational security by not wanting to have any part of their plans to be leaked on
social media.
44
CHAPTER SIX: CONCLUSION AND OUTLOOK
6.1 Conclusion Social media has become a staple in everyday life and the use of social media
continues to increase. With this social media becoming a more viable data source and
continuing to grow it will aid in the development for this new type of intelligence
analysis. The more volunteered geographic information that is available the more data
there will be for futures studies to analyze. In this paper we were able to show how just a
small sample of this data can be analyzed and be put into a format that can be utilized by
policy makers to make decision on events that are unfolding.
In this thesis we are able to show which countries have a concerned interest in
these two terrorist groups based off of how their citizens react via social media. We were
able to display this visually and see if neighboring countries have an interest or if they do
not have an interest of these groups. In our study we were able to show that both Kenya
and Somalia have an interest in Al-Shabaab by having the largest participation over the
entire study period. The study also showed that given a time period during a terrorist
attack new interest may form creating a different picture than may be different from what
may be normal picture. We were also able to show that many European countries had an
interest in Al-Shabaab. This was most evident during the month of September in which
the Westgate mall attack took place. We see many Europeans participation index
45
increase. This was especially true with the country of France as they had the second
highest participation during that month. They had a large spike in participation during
that month and then returned in October to around the same participation as they had for
August. Many Sub-Saharan African countries also having an interest in what Al-Shabaab
is doing. This was especially true for many of these countries that are located near or
around Kenya and Somalia.
We were also able to show that Nigeria had the most interest in Boko Haram.
Nigeria is where Boko Haram conducts its operation. The greatest participation for Boko
Haram was in Nigeria but we also see many other countries with interests about this
group. It was worth noting that more European countries had the same or a higher
participation index than many Sub-Saharan African countries. By many European
countries and the United States having high participation rates in this group this shows
that Boko Haram not only has an impact in SSA but has a global impact as well.
We were also able to see how an event can impact how different countries can
switch their participation in a certain group. This was most evident in the Month of
October for the country of Kenya in the Boko Haram dataset. We see their participation
taper way down for Boko Haram. We know that the Westgate mall attack by Al-Shabaab
took place at the end of September so many Kenyans may be more focused on what they
are doing opposed to what other groups in SSA would be doing.
We have addressed a few aspects of how social media can be used to show how
terrorist organizations can have a spatial impact over different countries. First we were
able to show how terrorist organizations can impact different countries based from tweets
46
referring to either Boko Haram or Al-Shabaab. Next we able to show how an event can
impact different countries by either taking more of an interest in these groups or have less
participation in a groups because of some other impact that maybe closer to their region.
6.2 Outlook In this thesis we address some of the ways social media can be utilized in
geospatial analysis. This type of analysis could be looked at as a fusion of the new field
to SOCMINT and GEOINT. These are both new types of intelligence that can utilize
social media that has a growing use around the world. With the continued use of social
media these types of intelligence will continue to be important for future studies.
This type of study can be improved for future studies by focusing keyword
searches on the exact terrorist organizations for an improved dataset. Having this kind of
dataset will give an improvement in the number of tweets that refer to these organization.
This will allow to have a better representation of how these groups can have an impact
over different cultures.
Further analysis into the networks of these organizations will allow us to not only
see what official twitter accounts these organization have but see what kind of
conversations they can impact over social media. Comparing networks to the impacts
they have over countries or even cities would be valuable information to policy makers as
well as researchers. This would be a valuable approach for future work in this study area.
47
REFERENCES
Agbiboa, D. E. 2014. Terrorism without Borders: Somalia’s Al-Shabaab and the global jihad network. Journal of Terrorism Research, 5(1).
Ali, A. M. 2008. The Al-Shabaab Al-Mujahidiin–A Profile of the First Somali Terrorist
Organisation. Çalıştay sunumu: IGAD Capacity Building Programme Against Terrorism (ICPAT), Jinga, Uganda, 28-29.
Allen, W., 2014. Al-Shabaab and the Exploitation of the Subject Network Model. Small
Wars Journal Article, March, 9. BBC 2014, Who are Somalia's al-Shabab? http://www.bbc.com/news/world-africa-
15336689 Bertram, S., Ellison, K. 2014. Sub Saharan African Terrorist Groups’ use of the Internet:
Journal of Terrorism Research, 5(1). Boyd, D., Ellison, N., 2007. Social Network Sites: Definition, History, and Scholarship,
Journal of Computer-Mediated Communication: 13(1), 210-230. Casey, M., Davies, M., 2012. Social Media in Africa. Fontier Advsory and Deloitte,
Johannesburg Stock Exchange. Chothia, F., 2012. Who are Nigeria's Boko Haram Islamists?: BBC News of 11. Correa, T., Hinsley, A., Zuniga H., 2010. Who interacts on the Web?: The intersection of
users’ personality and social media use, Computers in Human Behavior: 26, 247–253
Croitoru, A., Stefanidis A., Radzikowski J., Crooks A., Stahl J., and Wayant, N., 2012.
“Towards a Collaborative GeoSocial Analysis Workbench.” COM-Geo, Washington, DC: ACM.
Croitoru, A., Crooks, A., Radzikowski J., and Stefanidis A., 2013. Geosocial gauge: a
system prototype for knowledge discovery from social media, Internation Journal of Geographic Information Science, 27:12, 2483-2508, DOI: 10.1080/13658816.2013.825724
48
Crooks, A., Croitoru, A., Stefanidis, A. and Radzikowski, J., 2013. #Earthquake: Twitter
as a distributed sensor system. Transactions in GIS: 17 (1), 124-147. Crooks, A., Masad, M., Croitoru A., Cotnoir, A., Stefanidis, A. and Radzikowski, J,
2013. International Relations: State-Driven and Citizen-Driven Networks. Social Science Computer Review Social Science Computer Review DOI: 10.1177/0894439313506851
Edosomwan, S., Kalangot, S., Kouame, D., Watson, J., Seymour, T., 2011. The History
of Social Media and its Impact on Business, The Journal of Applied Management and Entrepreneurship: 16 (3).
Evans, R., 2014. Al-Shabab’s Reach and Influence on Twitter “A case study in Islamist
Extremist use of social media in strategic communication and engagement: IHS-Jane’s.
Fuchs, C., & Horak, E. 2008. Africa and the digital divide. Telematics and Informatics,
25(2), 99-116. Gettleman, J. 2011. Somalia’s Insurgents Embrace Twitter as a Weapon. New York
Times, A14. Goodchild, M., 2007. Citizens as sensors: the world of volunteered geography.
GeoJornal: 29, 211-221. Hughes, D., Rowe, M., Batay, M., Lee, A., 2012. A tale of two sites: Twitter vs.
Facebook and the personality predictors of social media usage, Computers in Human Behavior: 28, 561-569.
Hansen, D., Shneiderman, B., Smith, M., 2010. Analyzing social media networks with
NodeXL: Insights from a connected world. Morgan Kaufmann Kaplan, A., Haenlein, M., 2010. Users of the world, unite! The challenges and
opportunities of Social Media, Business Horizons: 53, 59-68. Kassam, A., 2013. Changing society using new technologies: youth participation in the
social media revolution and its implication for the development of democracy in Sub-Saharan Africa. Education Information Technology: 18, 253-263.
Kietzmann, J., Herkens, I., McCarthy, I., Silvestre, B., 2011 Social media? Get serious!
Understanding the functional building blocks of social media. Business Horizons: 54, 241-251.
49
Lin, W., 2013. Volunteered geographic information and networked publics? Politics of everyday mapping and spatial narratives. GeoJornal: 78, 949-965.
NGA, 2005. Statutory Definition of Geospatial Intelligence and its Amplification,
http://www.gwg.nga.mil/ntb/related/GEOINT_Definitions-Amplification_Memosigned.pdf
Naidu, P. 2013. Increased Presence of Terrorist Organizations on Social Media:
Challenges For Social Networks, http://www.socialmediatoday.com/content/increased-presence-terrorist-organizations-social-media-challenges-social-networks
Odinga, C., 2013. Use of New Media during the Kenya Elections. Master’s Thesis
submitted to the Department of Informatics and Media at Uppsala University. Oh, O., Agrawal, M., Rao, H., 2011. Information control and terrorism: Tracking the
Mumbai terrorist attack through twitter, Information Systems Frontiers: 13 (1), 33-43.
Olorunnisola, A., Martin, B., 2013. Influences of media on social movements:
Problematizing hyperbolic inferences about impacts. Telematics and Informatics: 30, 275-288.
Omand, D., Bartlett, J., Miller, C., 2012. Introducing Social Media Intelligence
(SOCMINT), Intelligence and National Security: 27 (6), 801-823. Owiny, S., Mehta, K., Maretzki, A., 2014. The use of Social Media Technologies to
Create, Preserve, and Disseminate Indigenous Knowledge and Skills to Communities in East Africa, International Journal of Communication: 8, 234-247.
Prucha N., Fisher, A., 2013. Tweeting for the Caliphate: Twitter as the New Frontier for
Jihadist Propaganda, CTC Sentinel: 6 (6), 19-23. Russell, M. 2013, Mining the Social Web: Data Mining Facebook, Twitter, LinkedIn,
Google+, GitHub, and More. O'Reilly Media, Inc., 2013. Smith, T., 2009. The Social Media Revolution: International Journal of Market
Research: 51(4), 559-561. Stefanidis, A., Crooks A., and Radzikowski, J., 2012. Harvesting Ambient Geospatial
Information from Social Media Feeds. GeoJournal doi: 10.1007/s10708-011-9438-2.
50
Stefanidis A., Cotnoir A., Croitoru A., Crooks A., Rice M., Radzikowski J. 2014 Demarcating new boundaries: mapping virtual polycentric communities through social media content. Cartography and Geographic Information Science: 40(2), 116-129.
Sui, D. and Goodchild, M., 2011. The convergence of GIS and social media: challenges
for GIScience. International Journal of Geographical Information Science: 25 (11), 1737-1748.
Viegas, F., Wattengerg, M., Feinberg, J., 2009. Participatory Visualization with Wordle,
IEEE Transactions on Visualization and Computer Graphics 15 (6): 1137-1144. Wyche, S., Schoenebeck, S., and Forte, A., February 2013, “Facebook is a Luxury”: An
Exploratory Study of Social Media use in Rural Kenya, conference on Computer supported cooperative work 2013, 23-27, ACM 978-1-4503-1331-5/13/02
Zook, M., Graham, M., and Shelton, T., February 2011, Analyzing Global Cyberscapes:
Mapping Geo-coded Internet Information, iConference 2011, 522-528, ACM 978-1-4503-0121-3/11/02
Notes
Twitter, 2014. https://about.twitter.com/company
51
BIOGRAPHY
Richard Michael Rodriguez Jr. graduated from Cobre High School, Bayard, New Mexico, in 2002. He received her Bachelor of Science from Western New Mexico University in 2006. He served in the United States Army for three years as a human intelligence collector. Upon leaving the Army he worked as a geospatial engineer for the Army Geospatial Center. Upon completion of his master he will be employed by the National Geospatial-Intelligence Agency.