Embed Size (px)
Citation preview
Z. Wang et al., Int. J. of Safety and Security Eng., Vol. 5, No. 2 (2015) 113–123
© 2015 WIT Press, www.witpress.comISSN: 2041-9031 (paper format), ISSN: 2041-904X (online), http://www.witpress.com/journalsDOI: 10.2495/SAFE-V5-N2-113-123
A SOURCE DATA-DRIVEN METHOD FOR 3D GEOLOGICAL MODELING IN COAL MINES
Z. WANG, J. ZUO, C. YUAN & H. XIEState Key Laboratory of Coal Resources and Mine Safety, China University of Mining and Technology,
Beijing, China.
ABSTRACTBuilding accurate 3D geological models relies heavily on large numbers of data. Nowadays, there are plenty of data including geological, 3D seismic, and roadway data in coal mines, and some special-ized softwares allow modeling complex geological bodies using these data. However, there are still two main problems: the first is how to use such information in one modeling system because of the characteristics of the heterogeneity between seismic and other geological data and the second is how to use the latest data because all the data in coal mines change frequently with the production and orga-nization activities. A solution is presented in this paper based on a source data-driven method for 3D geological modeling using geological data, roadway, and seismic interpretation results in a complete process system. The processing flows include: data integration, time–depth conversion, and surface-based modeling. The method not only effectively takes advantage of various data but also will not lose the correcting information from geologic cognition. Meanwhile, the application in Pingshuo shows that the method is in accord with the dynamic production situation of the coal mine.Keywords: Borehole, coal mine, geological modeling, roadway, seismic.
1 INTRODUCTIONIn recent years, 3D geological modeling has achieved a great development in coal mines. The method provides a powerful means to interpret geological structures and anomaly distributions through visualization and confrontation of data with each other and with the model being cre-ated. Geological modeling in coal mines mainly uses a variety of geological data such as boreholes, cross-sections, and geological maps, generally using surface-based 3D modeling method [1–3] and generalized tri-prism (GTP)-based methods [4,5]. However, these data are often relatively sparse, so it is still a challenge to build an accurate model in coal mines.
Currently, high-resolution 3D seismic technology has been widely used in coal mines, allowing a better constraint on the interpretation of geological structures [6,7]. However, seismic data reflect the travel-time information about seismic reflections, rather than the actual depth of the stratum interfaces. Time–depth conversion must be taken into account when using the results of seismic interpretation for geological modeling. The connection between the time- and depth-domain coordinates is provided by the velocity model. The model must be accurate, or even mild variations can cause structural distortions of time-mi-grated seismic images.
Besides geological and seismic data, roadway data can provide highly accurate informa-tion in depth in coal mines, especially the outcrops in roadways can reveal more useful geological information, including petrophysical parameters on some rock samples from out-crops and accurate coordinates and lateral changes of coal seams. The information provides a favorable means for constructing an accurate velocity model and improving accuracy of the time–depth conversion. Meanwhile, the production and organization activities of mine are all in a 3D dynamic geographical and geological environment. The data, such as the spatial posi-tions of coal seams, faults, and roadways are dynamically updated every day during excavating production. However, the prevailing geological modeling approach is static and

114 Z. Wang et al., Int. J. of Safety and Security Eng., Vol. 5, No. 2 (2015)
no comprehensive convenient software system has been developed to deal with these issues. Therefore, it becomes one of the urgent problems in coal mines that how to build a geological model quickly and dynamically using abundant source data in a study region.
In this paper, considering characteristics of geological modeling in the coal mine, a source data-driven method is presented to build 3D geological structure model from boreholes, cross-sections, geological maps, roadways, and interpretation results of seismic data. The method is actually an integrated modeling process based on standardized data within a Geo-graphic Information System (GIS) called the source data and the integrated modeling process will restart while all the source data are updated and prepared. The rest of the paper is divided into four sections. The first concentrates on overview of the method. The second discusses in detail three main steps of the proposed methods. The third gives an application of the method. The final section concludes the discussion and suggests avenues for further research.
2 OVERVIEW OF THE METHODGeological modeling by means of geological data, roadway, and seismic interpretation results should be a complete process system. The process needs to analyze different data types and generate the source data for modeling. Although specialized software now allows modeling
Figure 1: Process of source data-driven modeling.

Z. Wang et al., Int. J. of Safety and Security Eng., Vol. 5, No. 2 (2015) 115
complex and irregular geological bodies in 3D using multisource data and correcting locally the 3D model using latest data and geologic cognition, local corrections of the model take a lot of work for geologists, because the local corrections are always the geometrical corrections by modifying manually the coordinates of the mesh point on the 3D model and meanwhile the mesh quality and topological relations between meshes should be taken into account. On the other hand, the correcting information will be lost while restarting the modeling process if the information is not saved or considered as modeling source data. It is difficult in an actual work to guarantee all the correcting information to be effectively preserved. Especially, this work is often repeated because all the data in coal mines are dynamically updated with the production and organization activities of mine. Therefore, correcting locally the modeling results is improper. The integrated modeling presented in this paper is based on a source data-driven method. In this way, new data to be added or existing data to be reinterpreted are deemed as source data standardized within a GIS. When all the source data are updated and prepared, the integrated modeling process will restart.
The source data-driven modeling method is shown in Fig. 1. There are three main steps: integration of geoscience data, time–depth conversion and surface based modeling. Integra-tion of geoscience data, discussed in Section 3.1, takes advantages of GIS tools to standardize the multisource data and sets up modeling source database. Time–depth conversion, shown in Section 3.2, realizes the representation of 3D seismic interpretation results in the depth domain. Surface based modeling in Section 3.3 completes the construction of surfaces of geological structures and geological bodies. The modeling process driven by source data not only effectively takes advantage of various data but also will not lose the correcting informa-tion. And the process is also dynamic with the actual changes of the coal mine.
3 STEPS OF THE METHOD
3.1 Integration of geoscience data
Multisource data in coal mines reveal different geological information and geologic recogni-tions. The following data types are used in this paper and it is primarily necessary to analyze the characteristics of these data.
1. Geological maps and cross-sections are generated by geologists to analyze the geologi-cal outcrop and exploration data. The spatial boundaries of strata and structures (includ-ing geological anomaly zone) are constructed from surface mapping to greater depth and constantly changed and updated in the production process of coal mine.
2. Borehole data can finely reflect the stratigraphic structures and the petrophysical infor-mation using well logs along the drilling path. The information is accurate and useful for verifying other data and the 3D model.
3. Measured sections and outcrops can accurately reveal changes of strata and geological structures near the roadway. These data are peculiar in coal mines and accurate for geo-logical interpretation.
4. Roadway and measured points can provide accurate depth coordinates of coal floors or roofs and in fact, these data are useful for understanding the characteristics of strata and rocks along the roadway where there are no boreholes.
5. The results of 3D seismic interpretation can identify the coal floors or roofs in time domain and also reflect features of geological structures, like faults. 3D seismic interpretation

116 Z. Wang et al., Int. J. of Safety and Security Eng., Vol. 5, No. 2 (2015)
always utilizes the migration data and seismic data processing in coal mines in China is always based on the method of Kirchhoff prestack time migration at present [6,7]. These data are far denser than other geological data and can portray the lateral variation of coal seams and other strata. However, such data has geophysical uncertainties and need to be re-interpreted while geological recognition changes.
6. Digital Elevation Mode is used to model the land surface and correlate inconsistent elevations of all data above.
The integrated modeling driven by source data must be based on standardized data. This task can be standardized and effectively done within a GIS. Some similar research can be found in references [8–10]. The integration process standardizes data depending on their type described above. The integration of some data in the same data format, such as section maps in shp file format, may be automated to speed up data processing and allow easier model updating. The integration of other data, such as seismic data, may require user interaction to reinterpretation or validation of them.
On the basis of the coal-forming environment and sequence stratigraphy in coal measures strata, each stratum (geological body) can be considered to be bounded by two surfaces: top and bottom. The top and bottom surfaces are assigned two attributes: upperStratum and lowerStratum. Because the source data above for modeling the top and bottom surfaces are sparse and independent, they are all digitized and managed as points. Meanwhile, the source data for modeling fault surfaces are often digitized and managed as lines, which are used as constraint conditions for generating surfaces. These digitized and standardized geometry objects are also mapped into a same reference projection system, which are deemed as source data for surface-based modeling.
Finally, all the standardized and structured data must be stored in the modeling source database. The relevant information is extracted from the database in the following 3D mode-ling process. If new data may be added or existing data may be reinterpreted, the database should be updated and the 3D modeling must be produced again.
It is well known that the principle of cross-cutting relationships states that the geologic feature, which cuts another is the younger of the two features, such as a fault cutting through another older fault or an erosional stratigraphic surface cutting across older rock layers. These relationships are important for automatically processing the intersection relationship of geometric surfaces in the following 3D modeling process. Usually, geometric surfaces are represented by triangulated irregular network (TIN) and the intersection operation is per-formed using TIN Boolean Algorithm [11]. In this paper, three basic types of cross-cutting relationships between two features are stored in the Geo-relation database, including:
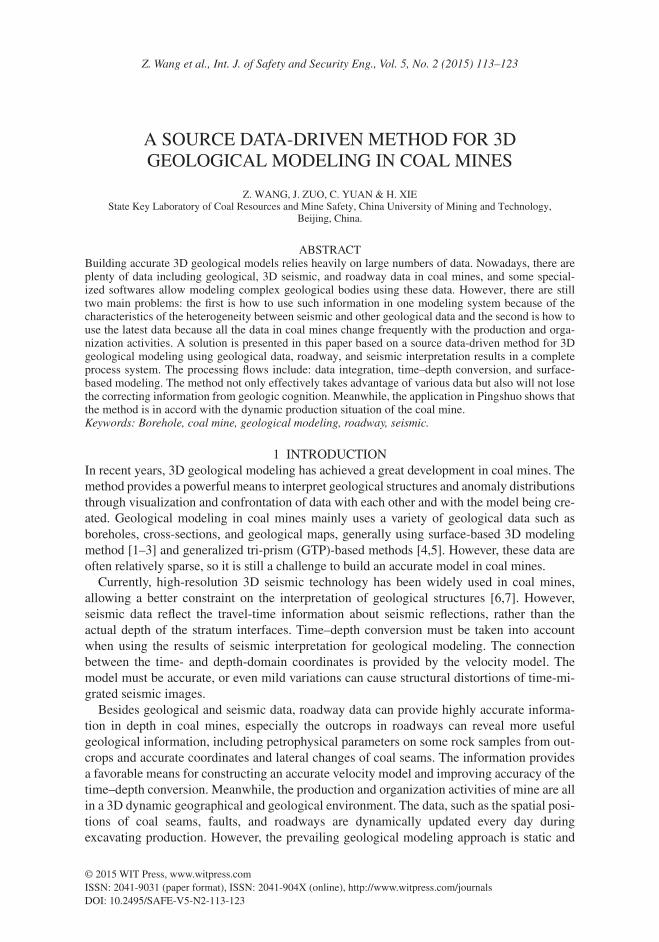
1. Fault surface A cutting through fault surface B, while fault B is older than A. For ex-ample, the geometric surface of role B is intersected by the surface of role A and cannot pass through the surface of A, shown in Fig. 2.
2. Stratum surface A cutting across surface B.3. Geological body A cutting through geological body B, for example, an intrusive rock
body cutting through older stratigraphic layers.
The relationship of fault surface cutting through stratum surface, not stored in the geo-re-lation database, can be gained in spatial analysis method if the two surfaces intersect and the stratum surface cannot pass through the fault surface.
Z. Wang et al., Int. J. of Safety and Security Eng., Vol. 5, No. 2 (2015) 117
3.2 Time–depth conversion
As described above, time–depth conversion is an important step in the whole modeling pro-cess. The interpreting result of seismic data, including coal seams and faults, must be consistent with borehole, measured geological data and roadway in the same space. Time–depth conversion is implemented by using the travel time of seismic reflections and interval velocity. The velocity in 3D space is generally interpolated using the known acoustic velocity logging and the interpolation grid is Cartesian and uniform in three directions (for further details see references [12,13]). However, velocity interpolation functions are dependent upon the particular velocity distribution to be reconstructed, as well as other factors such as the stratigraphic framework [14]; and modeled travel times are sensitive to the spatial interpola-tion scheme employed, especially in discontinuous geologic space. If the lateral and vertical changes of strata at abrupt boundaries are not considered, velocity interpolation in uniform grids will lead to inaccuracies. In this paper, non-uniform and non-Cartesian grids are employed for discretization of complex and irregular velocity domains. The time–depth con-version is implemented through several steps, including structural modeling in time domain, creating interpolating grids, velocity interpolation, and domain conversion.
1. Structural modeling in time domain, considering the influence of stratigraphic frame-work and geological structure of the velocity model, is implemented directly using hori-zons and faults from the seismic interpretation results, shown in Fig. 3a. The modeling method is the same as surface modeling process described in Section 3.3. This geological model in time domain, which emphasizes lateral and vertical changes of the boundaries of a series of lithostratigraphic units, is used as a stratigraphic constraint not only for creating interpolating grids but also for velocity interpolation in the next steps.
2. Creating interpolating grids is related to the basis of the stacking patterns in the coal-forming depositional systems. Strata may terminate along the upper or lower boundary of a depositional sequence, such as toplap and baselap. Therefore, three basic types of grid generation are considered to partition depositional space between two seismic horizons in the structural model in time domain, as shown in Fig. 3b and c. The first type is to partition equidistantly vertically down parallel to the top horizon, describing terminations of strata along the bottom horizon. The second is to partition equidistantly vertically up parallel to the bottom horizon, describing terminations of strata along the
Figure 2: Face intersection of two faults (surface of role B is green and surface of A is orange): before cutting (left); after cutting (A is the younger and B cannot pass through the surface of A) (right).

118 Z. Wang et al., Int. J. of Safety and Security Eng., Vol. 5, No. 2 (2015)
upper horizon. The third is to partition in equal proportion along the middle surface between top and bottom horizons, describing the continuous structural change of the overall strata.
3. Velocity interpolation is to calculate the interval velocity on each grid point. Before the interpolation, the known velocity values should be extracted from the stacking velocity spectrum and velocity logging. Velocities from stacking velocities need to be converted to root mean square velocities and then converted to interval velocities (using, e.g. Dix formula) in order to be compared with logging velocities. The known interval veloci-ties are assigned to the relevant grid points. During the interpolation on the processing gridpoint (Fig. 3e) it is required to search all neighboring known velocity points along the interpolating grid. The searching process must terminate while a geological bound-ary occurs, such as a fault and a horizon. Then, the interpolating is processed using the method of inverse distance weighted interpolation in curvilinear grids. A simple method of coordinate transformation is adopted (Fig. 3f). The interpolating gridpoint is the ori-gin and each gridpoint is projected onto the new x-axis (horizontal), whose new y coor-dinate is given by the projected distance. After all the interval velocities on grid points calculated, the average velocities above the coal floors or roofs can be acquired from the interval velocities. Especially in coal mines, there are many measured points, measured
Figure 3: Velocity modeling in time–depth conversion: (a) structural model in the time domain; (b) partition parallel to the top horizon; (c) partition parallel to the bottom horizon; (d) partition in equal proportion along the middle surface; (e) interpolating grid; (f) coordinate transformation; (g) velocity model with gridded interval velocities in time domain.

Z. Wang et al., Int. J. of Safety and Security Eng., Vol. 5, No. 2 (2015) 119
sections, and outcrops in roadways, which can provide more accurate coordinate value in depth domain. Therefore, these data are also used to calculate average velocities by v = 2 ¥ h/t0, where h is the depth value referencing to seismic datum and t0 is the travel time. These average velocities are used to replace the average velocities converted from the interval velocities.
4. The time–depth domain conversion is to implement after the average velocity on each point of the coal floors or roofs in time domain has been given and calibrated, using eqn (1).
h(t0)= v(t0) ¥ t0/2 (1)
where h is the depth value and t0 is the travel time.
3.3 Surface-based modeling
For this step, all the data should be reliable enough (that means well located and consistent with surrounding information) and information relevant to the 3D modeling in the study area is extracted from the database and imported to the process of surface-based modeling. A single surface is modeled using the discrete smooth interpolation (DSI) algorithm [15]. DSI equations minimize roughness criteria while taking into account the constraints. Thus, the resulting geometry appears smooth and close to the data. The DSI methodology has been applied to numerous problems in structural modeling and can build a surface with complex geometry, such as geological folded and faulted structures [16].
The whole process of surface-based modeling is generally achieved in three steps.
1. Fault constructing is to build fault surfaces using discrete points and fault lines. In this step, it is important to determine how surfaces terminate onto each other, following the relationship between two faults stored in the geo-relation database.
2. Horizon constructing is to create stratigraphic surfaces with discontinuities defined by fault surfaces. All the points of this horizon and fault surfaces should be imported to model the surfaces. The fault surfaces can be considered as given input constraints where stratigraphic surfaces are not continuous. At last, the intersection relationship of surfaces should be handled, following the relationship between two horizons stored in the geo-relation database, shown in Fig. 4 where horizon B is younger than A and the surface of B cuts across the surface of A.
3. Surface closing is to establish a boundary representation model (B-rep model) using the topological relationship between faults and horizon surfaces. Each horizon has the at-tributes: upperStratum and lowerStratum, specifying which stratum (or geological body)
Figure 4: Sketch of surface intersection of horizon A and B (B is younger than A): (a) surfaces reconstructed by interpolating controlling points; (b) after surface intersection.

120 Z. Wang et al., Int. J. of Safety and Security Eng., Vol. 5, No. 2 (2015)
it belongs to. Some part of a fault may be intersected with the stratum and should be considered as the boundary of the stratum. For each stratum, all the relevant horizon and fault surfaces are achieved and constructed as a closed surface.
4 APPLICATION IN PINGSHUO, CHINA
4.1 Integrated modeling
We developed an integrated modeling platform, which includes data integration, time–depth conversion, and surface-based geological modeling according to the method above and used in Pingshuo, in Shanxi province of China. The modeling area of the coal mine is 10.88 km2 and the mining coal seams including coal seam 4 and coal seam 9 distribute widely all over the area. The geological structure of the area is very complicated. Lots of fold and fault struc-tures have been investigated in coal measures strata. The fundamental geological data from the area include geological maps, topographic maps, 83 boreholes, and 19 measured sections. Two horizons (coal seam 4 and coal seam 9) and 181 faults have been interpreted from 3D seismic data.
All of digitized source data derived from the area are first standardized as point and line objects. These objects are attributed as the top or bottom of the coal seams. The cutting relationships of fault surfaces are stored in the Geo-relation database. Time–depth conver-sion transforms the horizons and fault data into depth domain. Fault surfaces are modeled using the point and line object, shown in Fig. 5a and b. Then the top and bottom surface of the coal seams are constructed. Geological modeling is finally finished after surface closing (Fig. 5c and d). Figure 5e is a cutting result of the model, which shows clearly the lateral variation of coal seam 4 and coal seam 9 as well as the cross-cutting relationships of coal seams and faults.
4.2 Dynamic correction
The geological data can be dynamically updated. New data to be added or existing data to be reinterpreted are processed as source data and all corrections of the model are operated on source data. Two examples are discussed as follows.
1. Seismic data to be reinterpreted. Seismic data has geophysical uncertainties and need to be re-interpreted while the coal seam depth and fault positions change in roadway exca-vation process. For example, in Fig. 6, a fault KF248 appearing on working face 9101 is in the wrong position, and is reinterpreted.
2. New measured points of coal seams to be added. The position of coal seams often diverg-es from the actual situation because of the local modeling error. New measured points of coal seams can be obtained in the excavation process to update the position of the coal floor. In the geological model of coal seam 9 (Fig. 7a), the air-return way is above the excavating roadway. New measured points are added to the process of integrated model-ing, and the velocity model is corrected more accurately.
When all the source data are updated and prepared, the integrated modeling process will reproduce the geological model and the updated model, shown in Fig. 6b and Fig. 7b, is more consistent with the actual situation.

Z. Wang et al., Int. J. of Safety and Security Eng., Vol. 5, No. 2 (2015) 121
Figure 5: Source data and geological model: (a) fault lines; (b) fault surfaces; (c) model of coal seam 4; (d) model of coal seam 9; (e) the cutting result for faults and surfaces of coal seams 4 and 9.
Figure 6: The model of fault KF248: (a) wrong position before correlation; (b) actual position after correlation.

122 Z. Wang et al., Int. J. of Safety and Security Eng., Vol. 5, No. 2 (2015)
5 CONCLUSIONSThe geodata in coal mines are abundant and sophisticated. Building an accurate geological model with multi-source data is primarily necessary. However, the processes of collecting data, building geological model, and correcting model are generally separate because of the characteristics of the heterogeneity between seismic and geological data. The method of 3D integrated geological modeling presented in this paper wishes to consider geological mode-ling as a complete process system based on a source data-driven method. If the source data are updated, the integrated process will restart and re-construct the geological model. There-fore, the method is well suitable for the requirements in coal mines because all the data are frequently updated with the production activities. Meanwhile, the method effectively makes full use of geological, seismic, and roadway data in an integrated process and the accuracy of the model could be significantly improved during the dynamic production situation of the coal mine.
Certainly, considering geological modeling as an integrated process can make full use of the advantages of different technologies or methods, but it is still a problem to integrate multisource data in various data formats and semantic descriptions of the same data. There-fore, it is necessary, with the development of technology of 3D geological modeling, to formulate some standards to enhance the interoperability of data sources from different softwares.
ACKNOWLEDGMENTThe work was supported by the National Natural Science Foundation of China (Grant No. 41202238), China Postdoctoral Foundation (No. 20090450466), and the Fundamental Research Funds for the Central Universities.
Figure 7: Updating model using new measured points: (a) and (c) the model of coal seam 9 before correction in map and section view, respectively; (b) and (d) the model of coal seam 9 after correction.

Z. Wang et al., Int. J. of Safety and Security Eng., Vol. 5, No. 2 (2015) 123
REFERENCES [1] Lemon, A.M. & Jones, N.L., Building solid models from boreholes and user-defined
cross-sections. Computers & Geosciences, 29(5), pp. 547–555, 2003. doi: http://dx.doi.org/10.1016/s0098-3004(03)00051-7
[2] Ming, J., Pan, M. & Qu, H.G., GSIS: A 3D geological multi-body modeling system from netty cross-sections with topology. Computers & Geosciences, 36(1), pp. 756–767, 2010. doi: http://dx.doi.org/10.1016/j.cageo.2009.11.003
[3] Wu, Q. & Xu, H., An approach to computer modeling and visualization of geological faults in 3D. Computers & Geosciences, 29(3), pp. 503–509, 2003. doi: http://dx.doi.org/10.1016/s0098-3004(03)00018-9
[4] Wu, L.X., Topological relations embodied in a generalized tri-prism (GTP) model for a 3D geoscience modeling system. Computers & Geosciences, 30(4), pp. 405–418, 2004. doi: http://dx.doi.org/10.1016/j.cageo.2003.06.005
[5] Li, C.C., Wang, B.S. & Xue, H., Coal geological body three-dimensional modeling and cutting based on GTP (in Chinese). Journal of China Coal Society, 33(11), pp. 1268–1271, 2008.
[6] Yang, S.G., Zhang, Y.B. & Xu, H.Y., The application and development trend of the three-dimensional seismic exploration technology in the coalfield (in Chinese). Geo-physical and Geochemical Exploration, 28(6), pp. 500–503, 2004. doi: http://dx.doi.org/10.11720/wtyht.2012.3.09
[7] Peng, S.P., Du, W.F. & Zhao, W., 3D coalfield seismic integrated interpretation tech-nique in complex geological condition (in Chinese). Chinese Journal of Rock Mechan-ics and Engineering, 27(S1), pp. 2760–2765, 2008.
[8] Breunig, M., An approach to the integration of spatial data and systems for a 3D geo-information system. Computers & Geosciences, 25(1), pp. 39–48, 1999. doi: http://dx.doi.org/10.1016/s0098-3004(98)00104-6
[9] Wu, Q. & Xu, H., An effective method for 3D geological modeling with multi-source data integration. Computers & Geosciences, 31(1), pp. 35–43, 2005. doi: http://dx.doi.org/10.1016/j.cageo.2004.09.005
[10] Kaufmann, O. & Martin, T., 3D geological modeling from boreholes, cross-sections and geological maps, application over former natural gas storages in coal mines. Com-puters & Geosciences, 34(3), pp. 278–290, 2008. doi: http://dx.doi.org/10.1016/j.ca-geo.2007.09.005
[11] Moller, T., A fast triangle–triangle intersection test. Journal of Graphics Tools, 2(2), pp. 25–30, 1997. doi: http://dx.doi.org/10.1080/10867651.1997.10487472
[12] Song, L.M., Koopmann, G.H. & Fahnline, J.B., Numerical errors associated with the method of superposition for computing acoustic fields. The Journal of the Acoustical Society of America, 89(6), pp. 26–29, 1991. doi: http://dx.doi.org/10.1121/1.400701
[13] Soldati, A., Particles turbulence interactions in boundary layers. ZAMM–J. Appl. Math. Mech., 85, pp. 683–699, 2005. doi: http://dx.doi.org/10.1002/zamm.200410213
[14] Li, H. & Zhang, G., Application of well-control velocity modeling technology in seismic data processing (in Chinese). Journal of Oil and Gas Technology, 33(8), pp. 73–78, 2011.
[15] Mallet, J.L., Discrete smooth interpolation. ACM (Association for Computing Ma-chinery). Transactions on Graphics, 8(2), pp. 121–144, 1989. doi: http://dx.doi.org/10.1145/62054.62057
[16] Galera, C., Bennis, C., Moretti, I. & Mallet, J.L., Construction of coherent 3D geo-logical blocks. Computers & Geosciences, 29, pp. 971–984, 2003. doi: http://dx.doi.org/10.1016/s0098-3004(03)00085-2