Embed Size (px)
Citation preview
A Sociophonological Analysis
of Mersea Island English:
An investigation of the diphthongs
(), () and ()
Jennifer Amos
A thesis submitted for the degree of PhD Linguistics
Department of Language and Linguistics
University of Essex
September 2011
II
ACKNOWLEDGEMENTS
Firstly, I would like to extend my thanks to all the people of Mersea Island who willingly
gave up their time to help with this study. They welcomed me into their homes, gave me
endless cups of tea and provided me with any information I needed. Also, to all those at
the Mersea Museum, thank you for granting me access to the archive recordings and for
being so patient when I needed help. This research could not have been completed
without you all.
I also wish to thank to the E.S.R.C. for their financial support (Award Number PTA-031-
2006-00256) and my supervisors, Prof. Dr. David Britain and Dr Wyn Johnson, for their
continuous encouragement and faith in my research.
To David, my family and my friends, what can I say? Thank you for your love and
tolerance, for sharing the laughter and the tears, and for always being there.
Finally, to my dad, Adrian – Thank you for being the most hilarious proof-reader anyone
could wish for!
- J.A.

III
“Is the bottle half-full or half-empty? Neither. There is always something in place of
that space where nothing can be seen, whether it be air, or something other. Therefore the
bottle is always full, but, like life, it is not always full of what you expect.”
- Michelle-Lee Phelan
IV
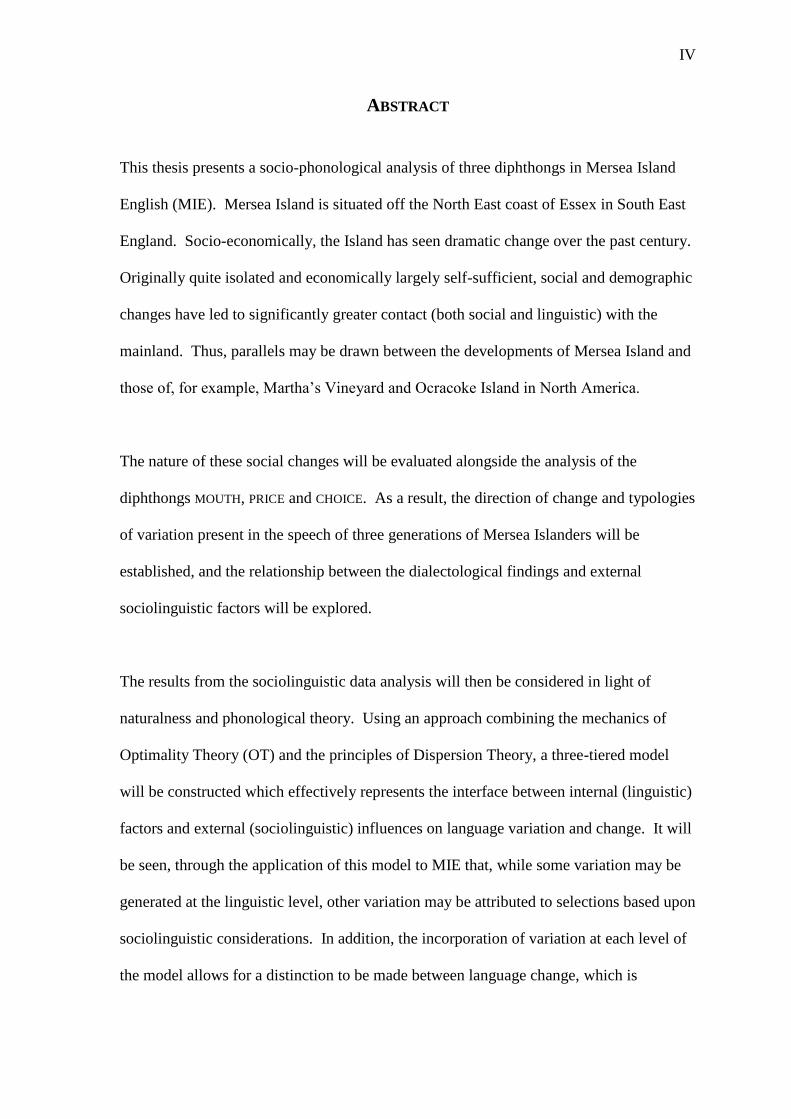
ABSTRACT
This thesis presents a socio-phonological analysis of three diphthongs in Mersea Island
English (MIE). Mersea Island is situated off the North East coast of Essex in South East
England. Socio-economically, the Island has seen dramatic change over the past century.
Originally quite isolated and economically largely self-sufficient, social and demographic
changes have led to significantly greater contact (both social and linguistic) with the
mainland. Thus, parallels may be drawn between the developments of Mersea Island and
those of, for example, Martha’s Vineyard and Ocracoke Island in North America.
The nature of these social changes will be evaluated alongside the analysis of the
diphthongs MOUTH, PRICE and CHOICE. As a result, the direction of change and typologies
of variation present in the speech of three generations of Mersea Islanders will be
established, and the relationship between the dialectological findings and external
sociolinguistic factors will be explored.
The results from the sociolinguistic data analysis will then be considered in light of
naturalness and phonological theory. Using an approach combining the mechanics of
Optimality Theory (OT) and the principles of Dispersion Theory, a three-tiered model
will be constructed which effectively represents the interface between internal (linguistic)
factors and external (sociolinguistic) influences on language variation and change. It will
be seen, through the application of this model to MIE that, while some variation may be
generated at the linguistic level, other variation may be attributed to selections based upon
sociolinguistic considerations. In addition, the incorporation of variation at each level of
the model allows for a distinction to be made between language change, which is

V
generated through linguistic motivations, and change which is motivated by external
sociolinguistic desires.
VI
TABLE OF CONTENTS
Abstract IV
Introduction 1
Chapter 1 11
Mersea Island – The Community: it’s social history and
demographic change
1.1 The Island 12
1.2 Access 15
1.3 The Island’s Geographic Development 15
1.4 Modern Mersea 18
1.5 Summary 29
Chapter 2 30
Methodology
2.1 Data Collection 32
2.1.1 The Interviews 32
2.1.2 The Informants – General Overview 35
2.1.2.1 The Museum Speakers 37
2.1.2.2 The Older Generation 38
2.1.2.3 The Younger Generation 38
2.2 Social Factors 39
2.2.1 Class 39
2.2.2 Age and Gender 41
2.3 The Variables – Extraction, Analysis and Classification 42
2.3.1 Linguistic Constraints 42
2.3.1.1 Syllable Type 43
2.3.1.2 Phonological Environment 44
2.3.1.2.1 The Distribution of /a/ 44
2.3.1.2.2 The Distribution of /a/ 45
2.3.1.2.3 The Distribution of // 46
2.3.1.3 Stress 46
2.3.1.4 LIKE 47
2.4 Historical Data 47
2.4.1 Ellis (1889) 48
2.4.2 Wright (1968) 49
2.4.3 Kurath and Lowman (1970) 50
2.4.4 The Survey of English Dialects (SED) 51
2.5 Summary 52
VII
Chapter 3 53
The Historical Derivation and Variation of the Variable ()
3.1 Historical Sources 54
3.2 Variation of (a) 60
3.2.1 Historical Variation 64
3.2.1.1 Ellis (1889) 64
3.2.1.2 Wright (1968) 64
3.2.1.3 Kurath and Lowman (1970) 65
3.2.1.4 The Survey of English Dialects (SED) 65
3.2.1.5 Summary 66
3.2.2 Modern Variation Studies – The South East 67
3.2.2.1 The East Anglia Fens 67
3.2.2.2 Colchester 69
3.2.2.3 Basildon 70
3.2.2.4 Summary 71
3.2.3 Contemporary Studies of Insular Varieties 72
3.2.3.1 Martha’s Vineyard 72
3.2.3.2 Ocracoke and Smith Island 74
3.2.3.3 The Falkland Islands 76
3.2.3.4 St Helena 78
3.2.3.5 Tristan da Cunha 80
3.3 Summary 81
Chapter 4 83
4.1 () - An Analysis of Social and Linguistic Factors 84
4.2 Social Factors 85
4.2.1 Age 86
4.2.2 Age and Gender 89
4.3 Linguistic Factors 92
4.3.1 Syllable Type 92
4.3.2 Preceding Phonological Environment 94
4.3.3 Following Phonological Environment 98
4.3.3.1 Following Voice 100
4.4 Summary 104
Chapter 5 106
The Historical Derivation and Variation of the Variable (a)
5.1 Historical Sources 107
5.2 Variation of (a) 111
VIII
5.3 Historical Variation 114
5.3.1 Ellis (1889) 114
5.3.2 Wright (1968) 115
5.3.3 Kurath and Lowman (1970) 116
5.3.4 The Survey of English Dialects (SED) 116
5.3.5 Summary 117
5.4 Some More Recent Studies 117
5.4.1 Norwich 118
5.4.2 The East Anglian Fens 120
5.4.3 Other South-Eastern Variation 121
5.4.4 Summary 123
5.5 Contemporary Studies of Insular Varieties 124
5.5.1 Martha’s Vineyard 124
5.5.2 Ocracoke and Smith Island 126
5.5.3 The Falkland Islands 128
5.5.4 St Helena 129
5.5.5 Tristan da Cunha 131
5.6 The Special Status of LIKE – Variation in New Zealand
English
132
5.7 Summary 133
Chapter 6 135
6.1 () - An Analysis of Social and Linguistic Factors 136
6.2 Social Factors 138
6.2.1 Age 138
6.2.2 Age and Gender 139
6.3 Linguistic Factors 140
6.3.1 Syllable Type 140
6.3.2 Preceding Phonological Environment 141
6.3.3 Following Environments 142
6.3.3.1 Voice 143
6.3.3.2 Manner 146
6.3.3.3 Following Place of Articulation 146
6.3.3.4 Following /l/ and the Status of ‘Island’ 147
6.3.4 LIKE 152
6.4 Summary 155
IX
Chapter 7 157
The Historical Derivation and Variation of the Variable ()
7.1 Historical Sources 158
7.1.1 // and //, a Temporary Merger? 159
7.2 Historical Variation 162
7.2.1 Ellis (1889) 162
7.2.2 Kurath and Lowman (1970) 163
7.2.3 The Survey of English Dialects (SED) 164
7.3 Modern Variation Studies 164
7.3.1 British English 165
7.3.2 International Insular Variation 166
7.3.2.1 The Falkland Islands 166
7.3.2.2 St Helena 166
7.3.2.3 Tristan da Cunha 167
7.4 Summary 167
Chapter 8 169
8.1 () - An Analysis of Social and Linguistic Factors 170
8.2 Social Factors 170
8.2.1 Age 170
8.2.2 Age and Gender 172
8.3 Linguistic Factors 173
8.3.1 Syllable Type 173
8.3.2 Phonological Environments 176
8.3.2.1 Preceding Place of Articulation 176
8.3.2.2 Preceding Manner of Articulation 179
8.3.3 The BOY Effect 180
8.4 Summary 183
Chapter 9 185
MIE - Sociolinguistic Considerations
9.1 The Direction of Change 186
9.2 Performance and Enregisterment 190
9.2.1 Performance, Enregisterment and Mersea Island English 193
9.3 Contact, Diffusion and Supra-localisation 200
X
Chapter 10 209
Socio-Phonology: the construction of an integrated model
10.1 What is Optimality Theory? 211
10.1.1 The Nature of Constraints 218
10.1.1.1 Faithfulness Constraints 218
10.1.1.2 Markedness Constraints 221
10.1.2 Optimality Theory and Language Variation 222
10.1.2.1 Tied Violations 223
10.1.2.2 Multiple Grammars 224
10.1.2.3 Stochastic OT 226
10.2 Dispersion Theory 229
10.2.1 Dispersion Constraints 231
10.3 A Three-Part Phonology 236
10.3.1 The Inventory 237
10.3.2 The Realisation 239
10.3.3 The Evaluation of Surface Constraints 241
10.3.4 Evaluation of this Approach 243
10.4 An Inventory- Based Model of Mersea Island English 254
10.4.1 The Inventory 254
10.4.2 The Realisation of Contrasts 254
10.4.2.1 Canadian Raising 255
10.4.2.2 The Dorsal Effect - A lowering of diphthong nuclei
after /k/
257
10.4.2.3 Smoothing - // to /:/ before coda /l/ 259
10.4.2.3.1 Smoothing - Proposal 1 260
10.4.2.3.2 Smoothing - Proposal 2 262
10.4.2.4 Island Monophthongisation 263
10.4.2.5 BOY 266
10.4.3 The Older Speakers – multiple grammars or variable
ranking?
270
10.4.4 Evaluation of Surface Constraint (ESC) 272
10.5 The Sociolinguistic Level of Speech Production 275
10.5.1 Introduction 275
10.5.2 Communicative Competence 276
10.5.3 Where does that leave phonology? Information through
exemplars
280
10.5.4 How this can be implemented through the three-tiered
model
284
10.5.5 The Activation of the Sociolinguistics Matrix and
Evaluative Parameters
291
10.6 The Representation of Types of Change 294

XI
Conclusion 304
Bibliography 308
Appendix A 319
The complete numerical data sets pertaining to the analysis of
the variable ()
Appendix B 339
The complete numerical data sets pertaining to the analysis of
the variable ()
Appendix C The complete numerical data sets pertaining to the analysis of
the variable ()
358
Appendix D
Examples from the Mersea data for each of the variables
examined with respect to preceding and following environments
382
Appendix E
The (stressed) vowel inventories of two Mersea Island speakers
388
XII
LIST OF MAPS, FIGURES, GRAPHS AND TABLES
Maps
1.1 a Location of Mersea Island on the South Eastern coast of England 13
1.1 b Location of Essex in relation to London and surrounding counties 13
1.1 c Location of Mersea Island in relation to the Essex coast 14
1.1 d Close up of Mersea Island 14
2.1 Location of Mersea Island, West Bergholt and Titpree 51
Figures
3.1 The developmental path of /a/ following the lower-centralise-
lower route
55
3.2 The developmental path of /a/ following the centralise-lower-
lower route
55
3.3 The Stages in the Development of Middle English u 57
3.4 The path of the diphthong shift in both front and back vowel
systems
58
3.5 The alternative development of () 59
5.1 The developmental path of /a/ following the lower-centralise-lower
route
108
5.2 The developmental path of /a/ following the centralise-lower-lower
route
108
5.3 The stages in Development of Middle English 109
5.4 The possible developmental path of /a/ in the Essex dialect 111
7.1 The development of /a/ and // demonstrating the potential overlap
of phonemes
160
9.1 The direction of change for the nuclei of Mersea Island //, // and // diphthongs
187
9.2 An S-Curve: pattern of change for the variable (wh) in Central
Canada
189
10.13 A representation of vowel space according to Flemming (2004) 232
10.15 A representation of vowel space according to Flemming (2004) 238
10.19a Illustration of Standard English Diphthongs 246
10.19b Illustration of Standard English centering diphthongs 246
10.20 A simplified segmentation of vowel space used for the analysis of
MIE
247
10.38 A comparison of underlying Grammars for the Older Mersea
generation
271
XIII
Graphs
1.2 The population of Mersea Island 18
1.3c The 2001 population breakdown of West Mersea, Colchester and
the East of England
20
1.4b The net population change in Islander numbers aged 15-24
between July 2001 and June 2009
21
1.5b The net population change for Islanders aged 25-44 between July
2001 and June 2009
23
1.6c The Age of Businesses registered in 2010 in West Mersea,
Colchester and the East of England
25
1.8 Percentage of the West Mersea workforce population (aged 16-74)
according to distance travelled to work
28
4.1c Overall percentage of (a) variants by age 87
4.2c Overall percentage of (a) variant by age 88
4.3 Percentage of (a) variants according to age and gender 90
4.4 Overall percentage of (a) variants according to syllable type 92
4.5 Overall percentage of full and short diphthongal offglides according
to syllable type
93
4.6 Percentage of full and short diphthongal offglides according to age
and syllable type
94
4.7 Overall percentage of (a) variants according to preceding manner
of articulation
95
4.8 Overall percentage of (a) variants according to preceding place of
articulation
96
4.9 Overall percentage of (a) variants according to following manner
of articulation
98
4.10 Overall percentage of (a) variants according to following place of
articulation
100
4.11 Overall percentage of (a) variants according to the voicing of the
following segment
101
4.12 Percentage of (a) variants according to following voice by
Museum speakers
103
4.13 Percentage of (a) variants according to following voice by Older
speakers
103
4.14 Percentage of (a) variants according to following voice by
Younger speakers
103
5.5 Variable () by class and style 119
5.6 Centralisation of (ai) and (au) plotted separately, according to year
of birth.
125
6.1b Percentage of (a) variants according to speaker age 138
6.2 Percentage of (a) variants according to age and gender 139
6.3 Overall percentage of (a) variants according to syllable type 140
6.4 Percentage of (a) variants according to syllable type and age group 141

XIV
6.5 Overall percentage of (a) variant according to preceding manner of
articulation
141
6.6 Overall percentage of (a) variant according to preceding place of
articulation
142
6.7 Overall percentage of (a) variants according to the voicing of the
following segment
144
6.8 Percentage of (a) variants according to following voice by Museum
speakers
145
6.9 Percentage of (a) variants according to following voice by Older
speakers
145
6.10 Percentage of (a) variants according to following voice by
Younger speakers
145
6.11 Overall percentage of (a) variants according to following manner
of articulation
146
6.12 Overall percentage of (a) variants according to following place of
articulation
147
6.13 Overall percentage of (a) variants preceding /l/ 148
6.14 A comparison of the overall percentages of (a) variants according
to /l/ type
149
6.15 Overall percentage of Diphthongal vs. Monophthongal variants for
the token Island
149
6.16 Percentage of (a) variants for Island by Museum speakers 151
6.17 Percentage of (a) variants for Island by Older speakers 151
6.18 Percentage of (a) variants for Island by Younger speakers 151
6.20 An overall comparison of (a) variants according to the functions
of LIKE
154
6.21 A comparison of (a) variants according to the functions of LIKE
by Older speakers
155
6.22 A comparison of (a) variants according to the functions of LIKE
by Younger speakers
155
8.1b Percentage of () variants according to age 171
8.2 Percentage of () variants according to age and gender 172
8.3 Overall usage of () variants according to syllable type 173
8.4 Percentage of () variants according to age and syllable type 175
8.5a Percentage of () variants used by Mersea males according to age
and syllable type
175
8.5b Percentage of () variants used by Mersea females according to
age and syllable type
175
8.6 Overall percentages for () variants by Mersea Island speakers
according to preceding place of articulation
177
8.7 Percentage of () variants by Museum speakers according to
preceding place of articulation
178
8.8 Percentage of () variants by Older speakers according to
preceding place of articulation
178
8.9 Percentage of () variants by Younger speakers according to
preceding place of articulation
178
8.10 Overall percentages of () variants by Mersea Island speakers
according to preceding manner of articulation
179

XV
8.11 Percentage of () variants across lexically derived BOY tokens by
Museum speakers
181
8.12 Percentage of () variants across lexically derived BOY tokens by
Older speakers
181
8.13 Percentage of () variants across lexically derived BOY tokens by
Younger speakers
181
8.14 A comparison of () variants between BOY tokens and all other
tokens by Museum speakers
182
8.15 A comparison of () variants between BOY tokens and all other
tokens by Older speakers
182
9.3 The population of Mersea Island, based on Census data from 1801
to 2001
203
9.4b Percentage of the West Mersea workforce population (aged 16-74)
according to distance travelled to work
205
XVI
Tables
1.3a The 2001 population breakdown of West Mersea, Colchester and
the East of England.
19
1.3b The 2001 population percentages of West Mersea, Colchester and
the East of England.
19
1.4a The Net Migration Statistics, from the 2001 Census, for the 15-24
year old age group in the West Mersea
21
1.5a The Net Migration Statistics, from the 2001 Census, for the 25-44
year old age group
22
1.6a/b Data Demonstrating the Age of Businesses registered in 2010
with a comparison between West Mersea Colchester and the East
of England
24
1.7a Data representing types of employment for residents of West
Mersea, Colchester and the East of England
26
1.7b Percentages of types of employment, ranked according to the
percentages of Mersea residents
27
3.6 Survey of English Dialects variation of // when followed by // in
East Mersea, Tiptree and West Bregholt
66
4.1 a/b Token Numbers/ Percentages of () variants according to age
in Mersea Island English
86
4.2 a/b Token Numbers/ Percentages of () variants according to
diphthong type and age in Mersea Island English
88
6.1a Percentage of (a) variants according to diphthong type and age 138
6.19a/b Overall number/ percentage of (a) tokens for the token LIKE 153
8.1a Percentage of () variants according to age 171
9.4b Percentage of the West Mersea workforce population (aged 16-74)
according to distance travelled to work
205


1
Introduction
2
INTRODUCTION
“This place is even worse that you could imagine in your wildest dreams. No gas or
electric lights. From Sir J.H’s house to post office 2 ½ miles. Got down at 4 p.m. Have to
go to Colchester this afternoon, thank goodness”
From Jay (2005: article 60)
The above message was written on a postcard sent from East Mersea in 1914. It
demonstrates that, less than a century ago, there was a marked difference between city life
and country life in England. With no gas, electricity or even running water at this time,
together with only infrequent carrier carts as transport between the Island and the
mainland, the isolation of the Island community was quite marked. However, even
though the community was relatively isolated, the Island itself was a hive of activity and
the local oystering industry was developing an almost stereotypical association with
Mersea Island.
The following is an excerpt from a news article written in 1895 (see Jay (2005: article 80)
for the full text):
“...one can either hire a trap or go by carrier’s cart to a little place called West Mersea,
about ten miles distant, situate [sic] on the north side of Blackwater Creek, and an island
at high tide. The inhabitants are all occupied in Oyster Dredging”
Indeed, oystering is one of the Island’s oldest industries and the oyster shed, which is
referred to within the full version of the article cited above, still stands and is used by the
industry today. Despite this isolation, which sociolinguists such as Milroy (1987) claim
would have resulted in very strong dialect-reinforcing social networks, the Island has
gradually opened itself up over the last century. The early part of the twentieth century
3
witnessed an increase in public transportation and the occasional private motor vehicle for
more wealthy Islanders or visitors.
Throughout the second half of the twentieth century, significant changes had taken place
across the Island. Among these were the rebuilding of the Strood (the causeway road
which links the Island to the mainland) so that the Island was not cut off by the tides to
the same extent that it had been in the past, and the extensive construction of family
homes on the West side of the Island. The latter development resulted in a dramatic rise
in the population and, as a result of these cumulative factors, Mersea Island was no longer
such an isolated community.
In more recent times, West Mersea has been described by the Guardian in 2006 as:
“where the sea meets the sky and the sky meets the mud. It’s a remote, flat, watery end
zone of Essex”1
In addition, The Telegraph is among the papers which has promoted Island property to
their readers with thought provoking sub-headings such as:
“Is the Island of Mersea the perfect location for commuters in Essex?”2
and has described the road which links Mersea to the mainland as “the causeway to
heaven”3.
1 http://www.guardian.co.uk/lifeandstyle/2006/dec/16/foodanddrink2?INTCMP=SRCH –December 2006
2 http://www.telegraph.co.uk/property/3361460/Property-in-Essex-Causeway-to-heaven-a-16th-century-
house-with-Essex-appeal.html - May 2008 3 http://www.telegraph.co.uk/property/3361460/Property-in-Essex-Causeway-to-heaven-a-16th-century-
house-with-Essex-appeal.html - May 2008
4
This type of media coverage raises awareness of the Island for those outside the local area
and, as a result, the Island also plays host to a number of short term visitors. A number of
these visitors come to savour the produce of the local fishing and oyster industry. Indeed,
the Island houses what has become a nationally iconic seafood restaurant, The Company
Shed. This is run by a local family who have been working the Mersea waters for eight
generations4 and it is regularly featured in good food guides and newspapers, such as The
Guardian’s ‘Top Places to Eat by the Sea’.
It is this unique geographical setting and social and historical developments which make
Mersea Island an ideal community to study dialectologically. Dense multiplex social
networks (where network members share the same acquaintances and are linked to them
through a range of professional and social activities) are a characteristic of more isolated
communities. Through these types of networks, it has been shown that dialect features
and linguistic complexities are reinforced and, therefore, innovative variants are less
likely to permeate the dialect variety. However, once these networks begin to loosen and
their members establish contacts with those of other networks, linguistic innovations may
be introduced, accommodated and reinforced. Therefore, the rises in the residential
population, and other changes to Mersea’s socio-demographic and socio-economic
structure would lead us to expect a weakening of social network ties and a vulnerability to
innovative linguistic forms.
In situations of dialect contact, it has been observed that koineisation and levelling may
lead to the adoption of particular variants, such as those which are considered less marked
or those which represent a phonetically intermediate point between two or more input
4 Information from: www.thecompanyshed.co.uk/about - September 2011
5
variants. In addition, the process of regional dialect levelling has been shown to lead to a
reduction of differences between dialect varieties and, thus, the vernacular speech of a
region will gradually homogenise (Kerswill 2004:671).
However, each community will experience different types of contact. With respect to
insular communities, such as Martha’s Vineyard (Labov 1972, for example) and
Ocracoke Island (Wolfram 2008, for example) off the east coast of North America, a
significant level of contact comes from those short-term visitors to the Island and those
who permanently move to the Island from the mainland. The latter would particularly
result in long-term contact and accommodation. In these situations, investigations into
community affiliation and attitude have proved insightful. For example, correlations can
be found between strong local affiliations and a greater use of local or traditional variants.
Conversely, those who are more positive towards the incoming population (whether
visitors or permanent residents) are more likely to accommodate to the incoming variants
and adopt innovative forms.
However, the communities mentioned above each experience relatively high levels of
contact through tourism and mainland travel. Island communities such as St Helena and
Tristan de Cunha (Schreier 2010a; 2010b, respectively) represent more extreme isolation.
In these communities, the socio-cultural situations are relatively stable (though
historically this may not have always been the case) and, therefore, innovations generated
through high levels of contact with outsiders is less likely. As a result, we would expect
these dialect varieties to remain fairly stable following the initial settlements and
processes of contact and koineisation.
6
The investigation of these varieties, alongside that of Mersea Island English will enable
an investigation into whether the varying types of contact and population movements
have led to similar linguistic developments across these disparate insular communities,
particularly with respect to those whose insular status has been reduced in recent times.
Kerswill (2004) also notes that, with respect to koineisation and levelling processes, “the
degree of difference between the input varieties will affect the amount of accommodation
individuals will have to engage in” (2004:695). Thus, in a community such as Milton
Keynes, where the differences between the contact varieties are sub-phonetic, the
focussing towards particular variants is accelerated. This is likely to be the case with
respect to contact affecting the Mersea Island dialect, as the surrounding varieties contrast
only in linguistically subtle ways. Indeed, Trudgill (1986) notes that, in contact
situations, some forms are more likely to be maintained in place of others due to, for
example, their relative social saliency or linguistic markedness (where the latter tends to
be reduced during contact). For example, the quality of the MOUTH vowel in both Milton
Keynes and Reading has been shown to be moving towards a standard-like [au] form,
despite these communities having inputs of a [] ~ [] nature and contrasting social and
historical developments (Cheshire 1999). Taking into account data from communities
such as these, which contrast with respect to social history and the quality of input
variants during contact, we can assess how typologically similar the emerging dialects
are. Thus, if contact is seen to result in phonologically similar forms across dialects, we
may then be in a position to propose that the direction of change is being guided by
natural phonological desires which would otherwise be inhibited by social isolation.
7
The representation of natural phonological tendencies may be achieved through the
application of phonological theory to sociolinguistic data. For example, a framework
such as Dispersion Theory (which uses the basic mechanics of Optimality Theory)
presents the optimisation and naturalness of the underlying phonological system as its
central driving force. As a result, it aims to evaluate the well-formedness of the
phonemic system as opposed to evaluating individual sounds. Therefore, by considering
the system as a whole, we can look to explain why certain movements to underlying
phonemes may be preferred over others.
These social and linguistic considerations and observations lead to certain questions
which must be approached and considered in the sociophonological analysis of MIE:
1. If insular communities, by their very social structure, will act to reinforce and
stabilise linguistic features and complexities, what happens when contact with
speakers beyond the immediate community becomes established in the long
term?
2. When the strong original community structure begins to erode in favour of
wider regional allegiances, does the linguistic structure begin to move in the
direction of more supralocal dialects, or is it preserved by the community in
the form of identity markers?
3. Furthermore, can we simply account for any apparent change through
sociolinguistic factors relating to contact, local identity and attitudes, and
changes in regional affiliations?
4. Alternatively, in light of variation studies from a range of other disparate
insular communities that demonstrate similar outcomes from dialect contact,
can any changes be represented through phonological theory and the natural
motivations of the underlying linguistic system?

8
This thesis will aim to answer these questions among others in relation to Mersea Island
English, in particular the three variables (), () and (). In order to do this, it is
necessary to explore the historical developments that have taken place on the Island,
which may have influenced and shaped the community’s development over the years. In
addition to local history, the current social structure of the Island needs to be explored so
that the nature of modern Island life can be ascertained. These matters will be presented
and discussed in detail throughout Chapter 1.
Chapter 2 will focus upon the methodology employed in order to carry out the data
collection on Mersea. The nature of the sociolinguistic interviews will be highlighted, as
well as a detailed description of the informants used, and relevant social factors will be
discussed. In addition to these social considerations, the extraction and coding of the data
and the relevant linguistic constraints pertaining to the individual variables will be
examined. This will lead to the examination of each variable’s unique distributional
pattern within the linguistic system. Chapter 2 will close with a brief outline of the
historical dialect sources employed throughout the thesis, in order to provide backgrounds
to each variable’s history.
Chapters 3 and 4 will focus on the variable (). Chapter 3 will detail the historical
development of () as well as results from modern variation studies, in order to give an
idea of any behavioural patterns with which it is associated. These studies will focus,
primarily, upon data from East Anglia and the South East of England in order to set the
relevant dialectological scene in relation to Mersea Island. However, this chapter will
also include observations from international insular studies (in which British English had
9
an input). This is so that any similarities or differences in ()’s behaviour can be
observed and taken into account in other isolated social environments. The information
presented in this chapter will thus provide the basis for the analysis of () in MIE, which
is presented in Chapter 4. This analysis will include results pertaining to the social
factors of age and gender, as well as any applicable linguistic factors.
The structure of these two chapters is replicated in Chapters 5 and 6 and Chapters 7 and 8.
The former pair will discuss and analyse the variable (), while the latter pair will
concentrate on the variable ().
In light of the analyses presented in Chapters 4, 6 and 8, Chapter 9 will consider the
implications that the results have in light of sociolinguistic theory. The nature of
language and dialect change will be discussed, as well as how certain dialect features,
which are enregistered and adopted in dialect performances, may act as preservers of
traditional features in certain contexts. Included in this discussion will be the distinction
between the enregisterment of contextual (or specific) linguistic processes, general
linguistic processes and lexically-based processes and how these can be represented in the
results from data analysis. Finally, aspects of dialect contact, social mobility, and supra-
localisation will be discussed in light of the changes highlighted in the Mersea data.
This discussion will lead to the introduction of ‘naturalness’ as a motivation in linguistic
change, and this will be one of the central themes of Chapter 10. Following a detailed
introduction to the central principles of Optimality Theory and Dispersion Theory,
Chapter 10 will present the construction of an integrated phonological and sociolinguistic
model. This model, which truly represents the socio-phonological interface, will use data

10
patterns highlighted in the previous chapters to demonstrate its application not only to
sociolinguistic variation, but also dialect change. Finally, in light of this model, which
consists of three separate levels of processing, the mechanics of dialect change and
language change will be shown to apply to each level of processing, depending on the
type of change which is being modelled (that is, whether the change is instigated and
motivated internally or externally).
11
Chapter 1
Mersea Island – The community:
its social history and demographic
change
12
1. MERSEA ISLAND – THE COMMUNITY5
This chapter will discuss Mersea Island with respect to its history and socio-demographic
make-up and development. From its relative isolation in the late 19th
century to its more
extensive interconnection with the mainland in the present day, this chapter examines the
evidence for social and demographic change that provides the context for the linguistic
variation and change that I will investigate later.
1.1
The Island
Mersea Island is situated amongst the alluvial plains of North East Essex (in South East
England) between the estuaries of the River Colne and the River Blackwater. It is the
most easterly inhabited island of the British Isles and, at its highest point, sits only
twenty-one metres above sea-level. Its museum highlights evidence of Celtic inhabitation
as well as their salt panning and ceramic industries. In addition, Karbacz notes that,
although Mersea was under early Roman occupation, and is situated very close to the
Romans’ important urban centre Camulodunum (modern day Colchester), “we still call
Mersea by its Saxon name, Meres-ig, the island of the Mere” (1999:14)
5 Note: All the statistical data presented in this chapter are based on those held on the Office for National
Statistics web-site (www.neighbourhood.statistics.gov.uk/dissemination/) unless otherwise stated.
13
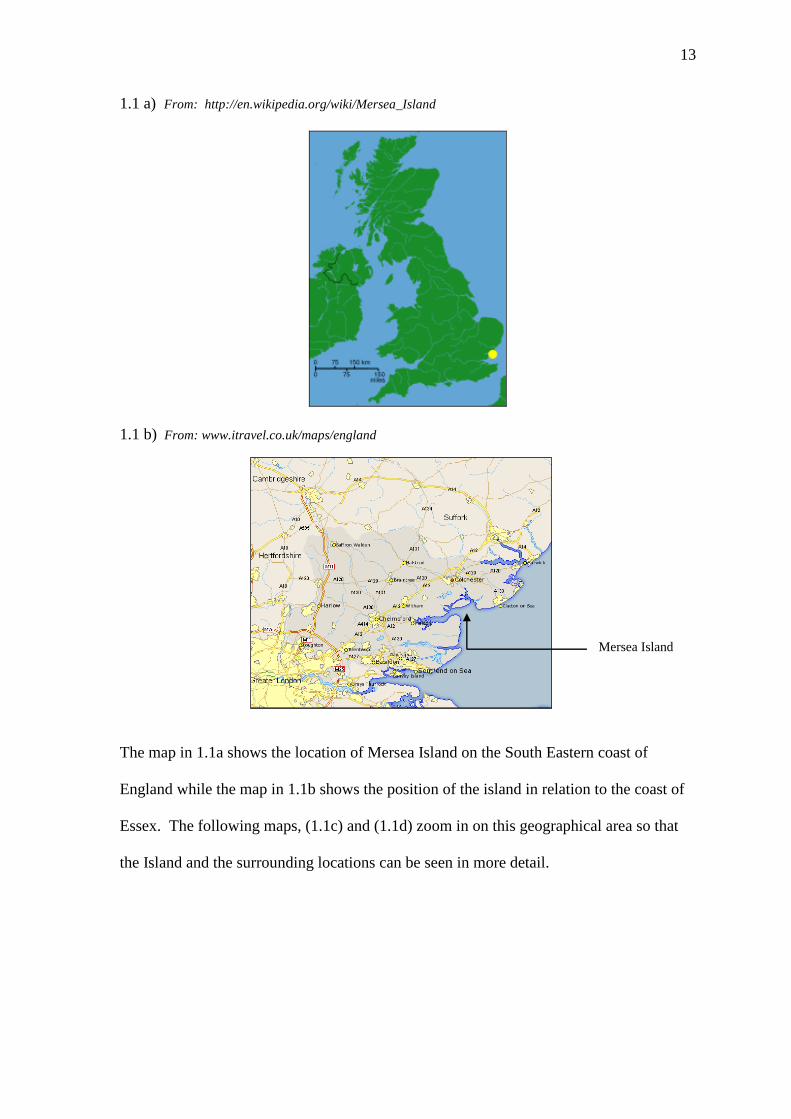
1.1 a) From: http://en.wikipedia.org/wiki/Mersea_Island
1.1 b) From: www.itravel.co.uk/maps/england
Mersea Island
The map in 1.1a shows the location of Mersea Island on the South Eastern coast of
England while the map in 1.1b shows the position of the island in relation to the coast of
Essex. The following maps, (1.1c) and (1.1d) zoom in on this geographical area so that
the Island and the surrounding locations can be seen in more detail.

14
1.1 c) From http://www.multimap.com/maps/#t=l&map=51.84169,0.86927|12|4
Mersea Island
With respect to the Island itself, the population of West Mersea is much denser than the
population of East Mersea and this is highlighted in 1.1d by the denser road grid on the
western side.
1.1 d) From http://en.wikipedia.org/wiki/Image:Mersea_islandmap.jpg
15
1.2
Access
The Island is not permanently accessible from the mainland. Travel to and from the
Island is hindered by the lunar tides which routinely flood the only access road, the
Strood (from the Saxon strod meaning ‘marshy land’). Morant notes in his book A Short
History of Essex (cited in Karbacz (1999:41)) that, in his time (the late 1700s), the Strood
was only passable eight hours a day. Even though current native Islanders generally feel
that the modern tides are higher than they used to be, such dramatic cut-off times as
experienced in Morant’s day no longer occur. However, regular travel to the mainland
(or indeed simply from West Mersea to East Mersea) was not widely available or usual
until twentieth century transport technology was introduced. Thus, many older
generation Islanders cannot remember leaving the Island until their late teens or older.
Indeed, off-island travel was viewed as an experience and even contributed, in one case,
to the allocation of the type of personal nickname so prevalent in this type of small
community. In this case, the nickname ‘Foreigner’ was given to a man who sailed across
to Whitstable in Kent to work on their oyster beds for only a short period and was judged
to have come back to the Island talking with a different accent.
1.3
The Island’s Geographic Development
On many Island maps, Mersea is labelled as consisting of two parts: East Mersea and
West Mersea. This is also reflected in the road system since, when you first enter the
Island from the Strood, the road branches in each direction. The eastern side remains
largely agricultural and has seen little increase in its population over the last 100 years
(see figure 1.2 below). Conversely, the western side has witnessed a dramatic increase in
16
its permanent population (660 in 1801 to 6926 in 2001) due to numerous housing
developments, and continues to experience a large transient population from increased
levels of tourism, especially during the summer months. These tourists include those who
only come to the Island for the day, often to visit the popular seafood restaurant, The
Company Shed. However, Mersea also has five holiday and caravan parks for those who
wish to stay longer, as well as a number of independent bed and breakfast and holiday
properties.
Although the division between East and West Mersea is not significant in modern Island
life, due to advances in motorised transport and loss of the East’s primary school around
the middle of the last century, this has not always been the case. Sourcing the Anglo
Saxon Chronicle, Karbacz (1999) explains that retreating Danish invaders around the
ninth century AD settled on Mersea before advancing once again up the Rivers Thames
and Lea. During this time, a moated area of approximately six acres is thought to have
been constructed around the East Mersea area, effectively enclosing their encampment.
Less than two centuries later, when the Saxon dynasty was restored prior to the Norman
Conquest, further reinforcement of the East-West divide took place when the Manor of
West Mersea (which included parts of the parish of Peldon and parts of Fingringhoe on
the mainland, highlighted in Figure 1.1c) was inherited by the Crown, while the Manor of
East Mersea was held privately (Karbacz (1999:16)). This separation is still visually as
well as psychologically maintained between the parishes through the Deremy Stone
which marks the boundary point between the two.
17
Another notable effect on the Island’s demographic structure came during the sixteenth
and seventeenth centuries when many Dutch and French refugees fled Continental Europe
and settled across East Anglia. The impact of these migrants is still reflected through a
great number of, albeit anglicised, local surnames and it is widely believed that the many
Island families bearing the name ‘French’ are descended from those whose names were
beyond the locals’ linguistic comprehension and capabilities.
More recently however, with the advent of World War ІІ, Mersea became home to not
only a range of military personnel (as with World War І) but was also opened up to many
war-time evacuees for varying lengths of time. The origin of the evacuees was quite
diverse, although local recollections claim the majority were from London. The extent of
contact with the evacuees varied from person to person but their leaving, at the end of
World War II, also coincided with the start of the steady population rise on the Island as
land was sold and new properties were built that became widely available to native
Islanders and Mainlanders alike.
18
Popluation of Mersea Island based on census data from 1801 to 2001
0
1000
2000
3000
4000
5000
6000
7000
18
01
18
11
18
21
18
31
18
41
18
51
18
61
18
71
18
81
18
91
19
01
19
11
19
21
19
31
19
51
19
61
19
71
19
81
19
91
20
01
Date
West Mersea
East Mersea
1.4
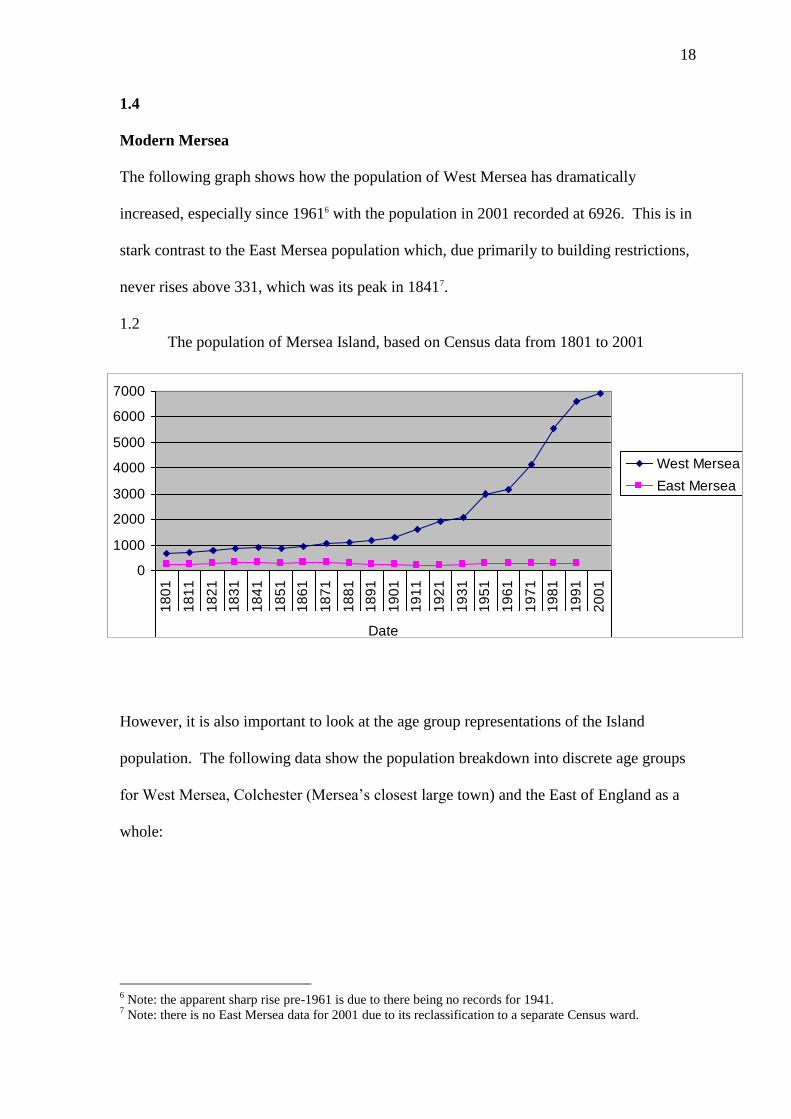
Modern Mersea
The following graph shows how the population of West Mersea has dramatically
increased, especially since 19616 with the population in 2001 recorded at 6926. This is in
stark contrast to the East Mersea population which, due primarily to building restrictions,
never rises above 331, which was its peak in 18417.
1.2
The population of Mersea Island, based on Census data from 1801 to 2001
However, it is also important to look at the age group representations of the Island
population. The following data show the population breakdown into discrete age groups
for West Mersea, Colchester (Mersea’s closest large town) and the East of England as a
whole:
6 Note: the apparent sharp rise pre-1961 is due to there being no records for 1941.
7 Note: there is no East Mersea data for 2001 due to its reclassification to a separate Census ward.

19
1.3 The 2001 population breakdown of West Mersea, Colchester and the East of England.
a) The population numbers
West Mersea Colchester East of England
Aged 0-9 669 19288 665408
Aged 10-19 695 19599 668680
Aged 20-29 510 22072 637383
Aged 30-39 805 24143 827040
Aged 40-49 844 20179 728588
Aged 50-59 1113 20420 707870
Aged 60-69 909 13319 510554
Aged 70-79 864 10434 407903
Aged 80-89 449 5389 198925
Aged 90+ 68 953 35789
Total 6926 155796 5388140
b) The 2001 population percentages
West Mersea Colchester East of England
Aged 0-9 9.66 12.38 12.35
Aged 10-19 10.03 12.58 12.41
Aged 20-29 7.36 14.17 11.83
Aged 30-39 11.62 15.50 15.35
Aged 40-49 12.19 12.95 13.52
Aged 50-59 16.07 13.11 13.14
Aged 60-69 13.12 8.55 9.48
Aged 70-79 12.47 6.70 7.57
Aged 80-89 6.48 3.46 3.69
Aged 90+ 0.98 0.61 0.66

20
c)
The 2001 Population of West Mersea, Colchester and the East of England according to
the percentage of people within each age group
0
10
20
30
Aged 0-9 Aged 10-
19
Aged 20-
29
Aged 30-
39
Aged 40-
49
Aged 50-
59
Aged 60-
69
Aged 70-
79
Aged 80-
89
Aged
90+
Age of Population
Pe
rce
nta
ge
West Mersea Colchester East of England
One aspect which is immediately noticeable is that Mersea has a relatively low population
of those under the age of 49 and a higher percentage population for all age groups of 50
years old and above when compared to nearby Colchester and the East of England as a
whole. One reason for the lower levels of young adults, especially in the 20-29 age
group, could be a result of increases in the number of people able to attend university or
training colleges who, as a result, decide to move away from home to their university
town or city. It may also reflect the lack of local unemployment and unavailability of
many Island homes to first time buyers in this age group. Indeed, it was a common
complaint amongst many of my younger informants that house prices on the Island were
too high for them to consider moving out of home to another Island property. The loss of
Islanders from the younger age brackets can also be seen in the migration figures from
previous years.
21
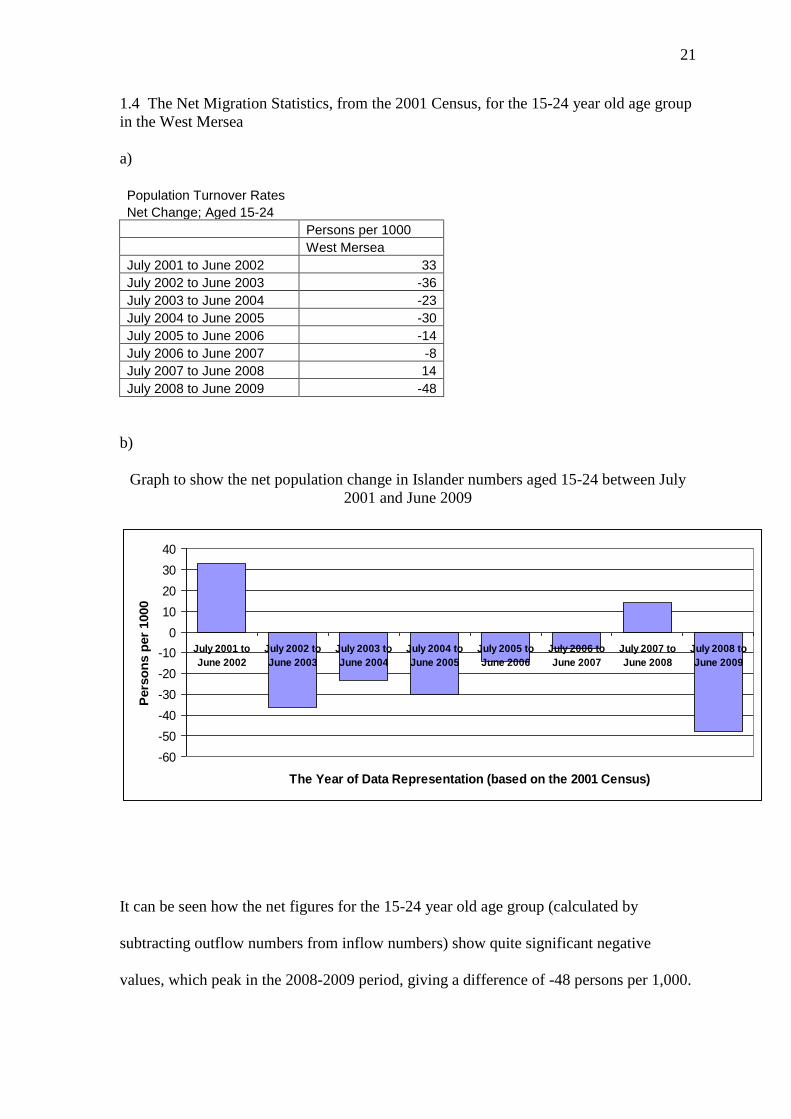
1.4 The Net Migration Statistics, from the 2001 Census, for the 15-24 year old age group
in the West Mersea
a)
Population Turnover Rates
Net Change; Aged 15-24
Persons per 1000
West Mersea
July 2001 to June 2002 33
July 2002 to June 2003 -36
July 2003 to June 2004 -23
July 2004 to June 2005 -30
July 2005 to June 2006 -14
July 2006 to June 2007 -8
July 2007 to June 2008 14
July 2008 to June 2009 -48
b)
Graph to show the net population change in Islander numbers aged 15-24 between July
2001 and June 2009
-60
-50
-40
-30
-20
-10
0
10
20
30
40
July 2001 to
June 2002
July 2002 to
June 2003
July 2003 to
June 2004
July 2004 to
June 2005
July 2005 to
June 2006
July 2006 to
June 2007
July 2007 to
June 2008
July 2008 to
June 2009
The Year of Data Representation (based on the 2001 Census)
Pers
on
s p
er
1000
It can be seen how the net figures for the 15-24 year old age group (calculated by
subtracting outflow numbers from inflow numbers) show quite significant negative
values, which peak in the 2008-2009 period, giving a difference of -48 persons per 1,000.
22
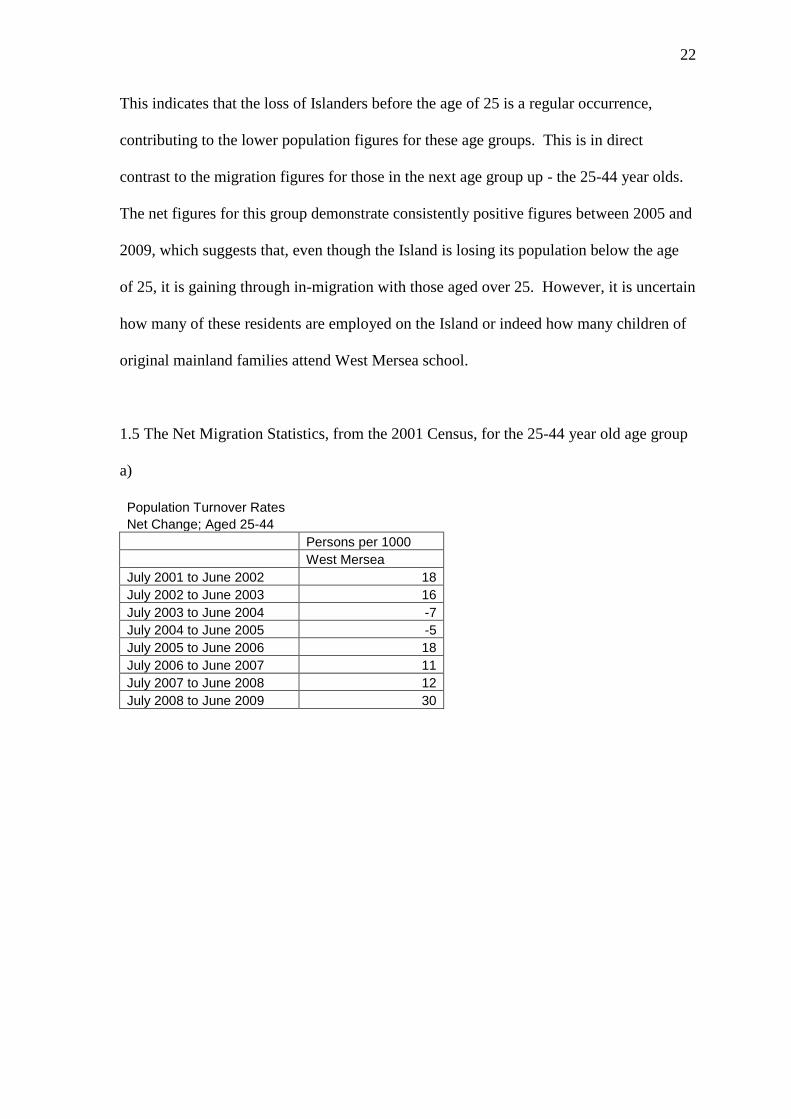
This indicates that the loss of Islanders before the age of 25 is a regular occurrence,
contributing to the lower population figures for these age groups. This is in direct
contrast to the migration figures for those in the next age group up - the 25-44 year olds.
The net figures for this group demonstrate consistently positive figures between 2005 and
2009, which suggests that, even though the Island is losing its population below the age
of 25, it is gaining through in-migration with those aged over 25. However, it is uncertain
how many of these residents are employed on the Island or indeed how many children of
original mainland families attend West Mersea school.
1.5 The Net Migration Statistics, from the 2001 Census, for the 25-44 year old age group
a)
Population Turnover Rates
Net Change; Aged 25-44
Persons per 1000
West Mersea
July 2001 to June 2002 18
July 2002 to June 2003 16
July 2003 to June 2004 -7
July 2004 to June 2005 -5
July 2005 to June 2006 18
July 2006 to June 2007 11
July 2007 to June 2008 12
July 2008 to June 2009 30
23
b)
Graph to show the net population change for Islanders aged 25-44 between July 2001 and
June 2009
The loss of Islanders from younger age groups may be facilitated, at least in part, by the
greater number of opportunities available to modern Islanders to expand their social
networks beyond the Island from an early age. In contrast to older generations (who were
educated to the ages of 14 or 15 in the local school on the Island), the introduction of
compulsory schooling to the age of 16 has lead to Islanders leaving Mersea for their
secondary education, as Mersea school only provides primary education. In addition, if
tertiary education is sought, this too must be completed off the Island. This automatically
introduces Island children to mainland children and so social network ties can become
established across both areas. This in turn provides greater opportunities and motivation
for personal geographical mobility.
Another important factor in the socio-economic development of the Island is that of local
industry. For those belonging to previous generations, it was unusual for someone to be
-10
-5
0
5
10
15
20
25
30
35
July 2001 to
June 2002
July 2002 to
June 2003
July 2003 to
June 2004
July 2004 to
June 2005
July 2005 to
June 2006
July 2006 to
June 2007
July 2007 to
June 2008
July 2008 to
June 2009
The Year of Data Representation (based on the 2001 Census)
Pers
on
s p
er
1000

24
employed off the Island, especially with respect to their first jobs. Therefore, local
Mersea-based jobs were considered the norm and not the exception. However, Jay,
writing in 1996, notes that “at the present time, only one local shop remains trading under
its family name” (1996:1).
That being said, the following data show that Mersea is still a place for established
businesses, even though the original families may no longer be involved in their running.
1.6 Data Demonstrating the Age of Businesses registered in 2010 with a comparison
between West Mersea, Colchester and the East of England
a) The total number of businesses
West Mersea Colchester East of England
Less than 2 Years Old 35 875 30890
2 to 3 Years Old 40 840 30480
4 to 9 Years Old 90 1740 59640
10 or More Years Old 155 2535 92630
Total - all VAT and/or PAYE Based Enterprises 320 5990 213640
b) The percentage of businesses by age and statistical region
West Mersea Colchester East of England
Less than 2 Years Old 10.94 14.61 14.46
2 to 3 Years Old 12.50 14.02 14.27
4 to 9 Years Old 28.13 29.05 27.92
10 or More Years Old 48.44 42.32 43.36
25
c)
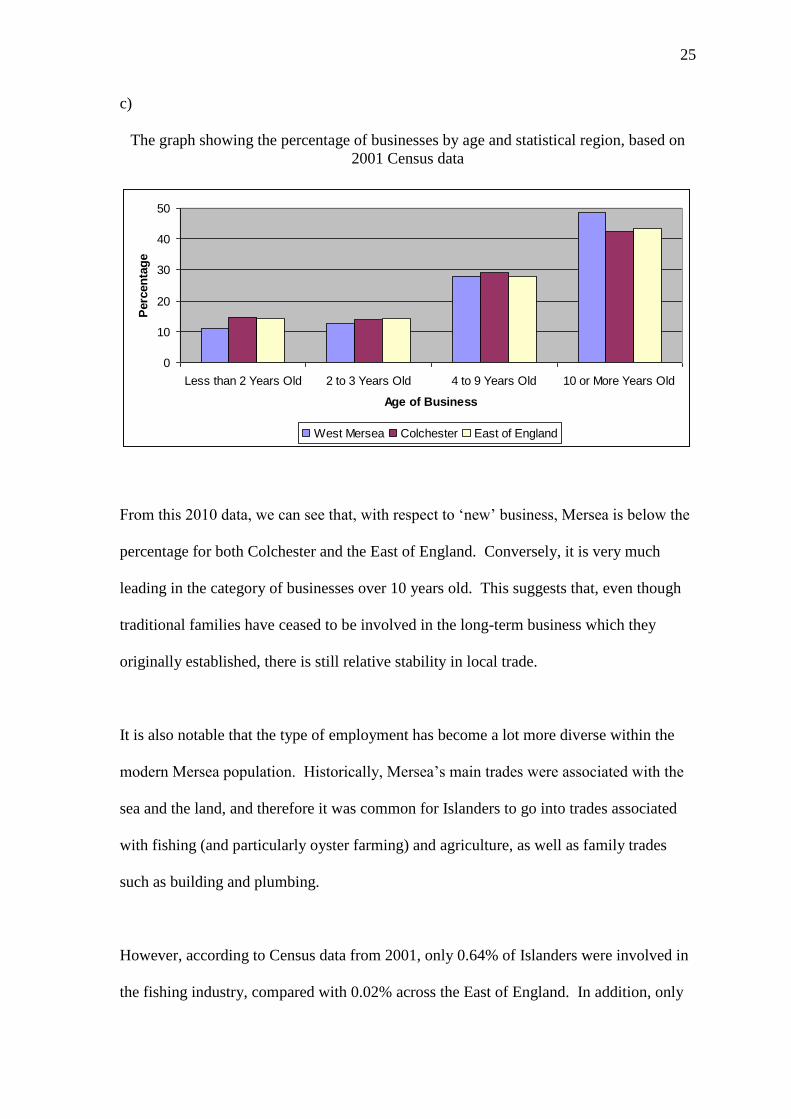
The graph showing the percentage of businesses by age and statistical region, based on
2001 Census data
0
10
20
30
40
50
Less than 2 Years Old 2 to 3 Years Old 4 to 9 Years Old 10 or More Years Old
Age of Business
Perc
en
tag
e
West Mersea Colchester East of England
From this 2010 data, we can see that, with respect to ‘new’ business, Mersea is below the
percentage for both Colchester and the East of England. Conversely, it is very much
leading in the category of businesses over 10 years old. This suggests that, even though
traditional families have ceased to be involved in the long-term business which they
originally established, there is still relative stability in local trade.
It is also notable that the type of employment has become a lot more diverse within the
modern Mersea population. Historically, Mersea’s main trades were associated with the
sea and the land, and therefore it was common for Islanders to go into trades associated
with fishing (and particularly oyster farming) and agriculture, as well as family trades
such as building and plumbing.
However, according to Census data from 2001, only 0.64% of Islanders were involved in
the fishing industry, compared with 0.02% across the East of England. In addition, only
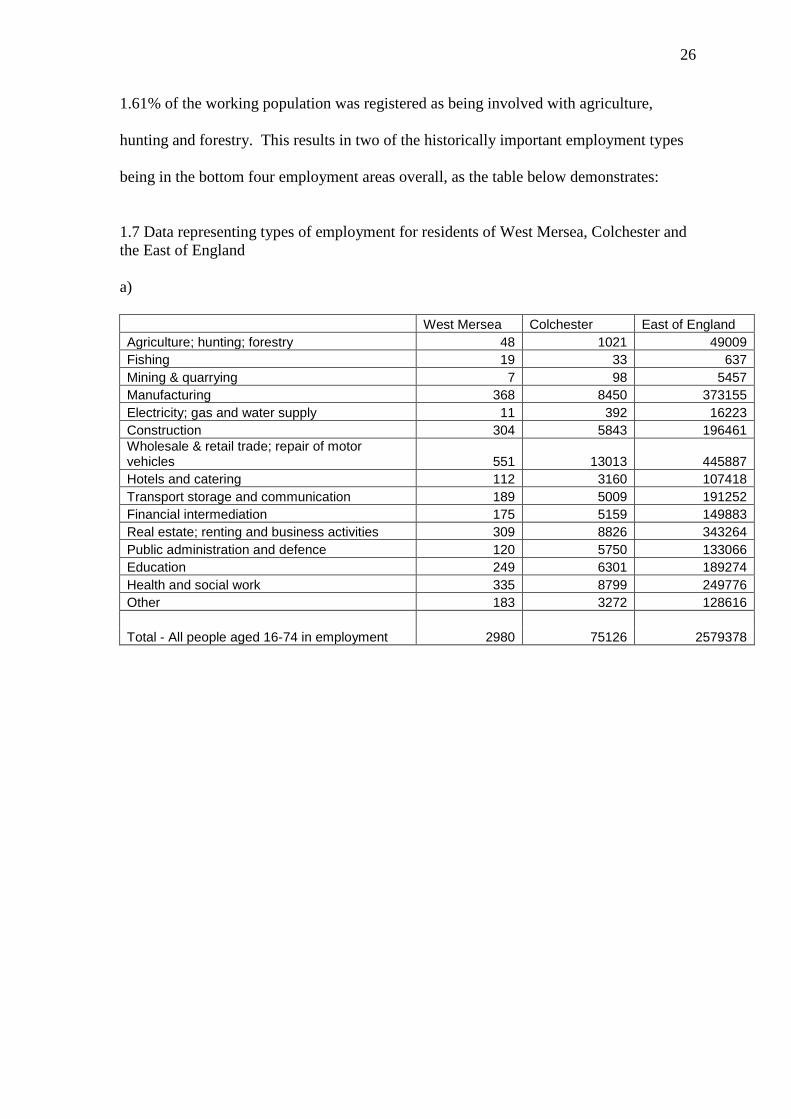
26
1.61% of the working population was registered as being involved with agriculture,
hunting and forestry. This results in two of the historically important employment types
being in the bottom four employment areas overall, as the table below demonstrates:
1.7 Data representing types of employment for residents of West Mersea, Colchester and
the East of England
a)
West Mersea Colchester East of England
Agriculture; hunting; forestry 48 1021 49009
Fishing 19 33 637
Mining & quarrying 7 98 5457
Manufacturing 368 8450 373155
Electricity; gas and water supply 11 392 16223
Construction 304 5843 196461
Wholesale & retail trade; repair of motor vehicles 551 13013 445887
Hotels and catering 112 3160 107418
Transport storage and communication 189 5009 191252
Financial intermediation 175 5159 149883
Real estate; renting and business activities 309 8826 343264
Public administration and defence 120 5750 133066
Education 249 6301 189274
Health and social work 335 8799 249776
Other 183 3272 128616
Total - All people aged 16-74 in employment 2980 75126 2579378
27
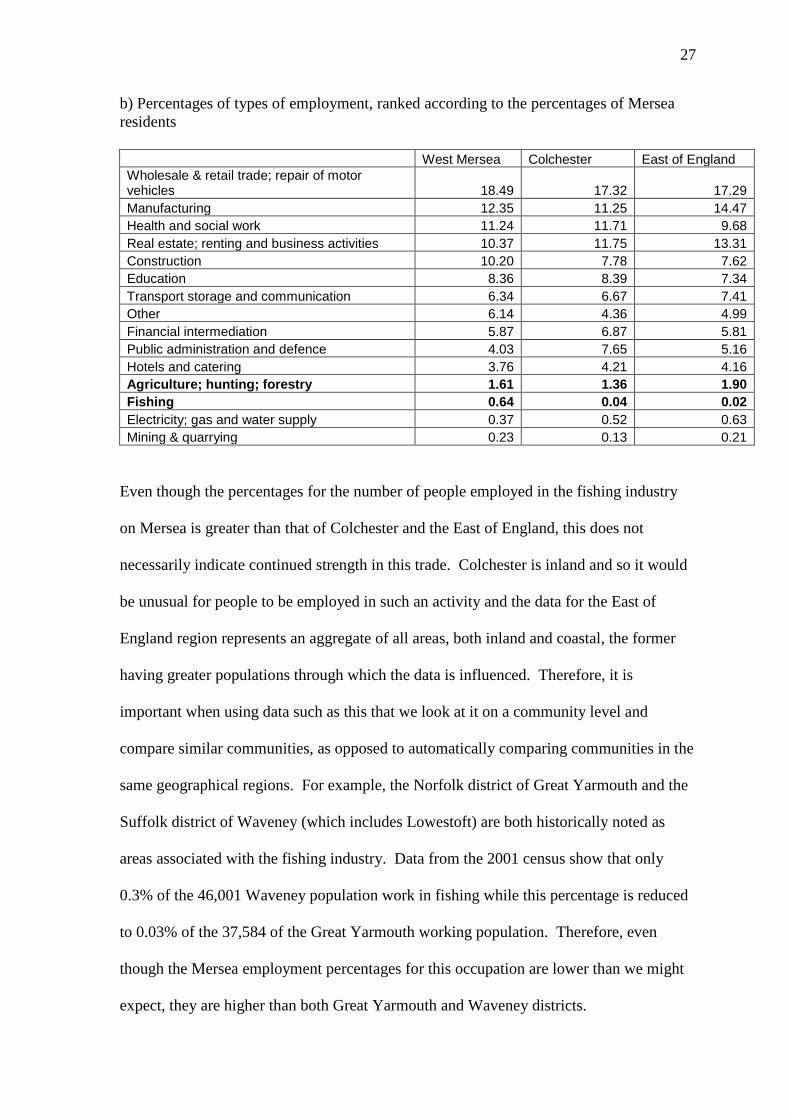
b) Percentages of types of employment, ranked according to the percentages of Mersea
residents
West Mersea Colchester East of England
Wholesale & retail trade; repair of motor vehicles 18.49 17.32 17.29
Manufacturing 12.35 11.25 14.47
Health and social work 11.24 11.71 9.68
Real estate; renting and business activities 10.37 11.75 13.31
Construction 10.20 7.78 7.62
Education 8.36 8.39 7.34
Transport storage and communication 6.34 6.67 7.41
Other 6.14 4.36 4.99
Financial intermediation 5.87 6.87 5.81
Public administration and defence 4.03 7.65 5.16
Hotels and catering 3.76 4.21 4.16
Agriculture; hunting; forestry 1.61 1.36 1.90
Fishing 0.64 0.04 0.02
Electricity; gas and water supply 0.37 0.52 0.63
Mining & quarrying 0.23 0.13 0.21
Even though the percentages for the number of people employed in the fishing industry
on Mersea is greater than that of Colchester and the East of England, this does not
necessarily indicate continued strength in this trade. Colchester is inland and so it would
be unusual for people to be employed in such an activity and the data for the East of
England region represents an aggregate of all areas, both inland and coastal, the former
having greater populations through which the data is influenced. Therefore, it is
important when using data such as this that we look at it on a community level and
compare similar communities, as opposed to automatically comparing communities in the
same geographical regions. For example, the Norfolk district of Great Yarmouth and the
Suffolk district of Waveney (which includes Lowestoft) are both historically noted as
areas associated with the fishing industry. Data from the 2001 census show that only
0.3% of the 46,001 Waveney population work in fishing while this percentage is reduced
to 0.03% of the 37,584 of the Great Yarmouth working population. Therefore, even
though the Mersea employment percentages for this occupation are lower than we might
expect, they are higher than both Great Yarmouth and Waveney districts.
28
However, even though we may want to claim that there is a decline in traditional local
industry, additional data show that local travel is more common than long distance
commuting:
1.8
Percentage of the West Mersea workforce population (aged 16-74) according to distance
travelled to work, from the 2001 census
0
10
20
30
40
50
Works
mainly at or
from home
Less than
2km
2km to less
than 5km
5km to less
than 10km
10km to
less than
20km
20km to
less than
30km
30km to
less than
40km
40km to
less than
60km
60km and
over
No fixed
place of
work
Working
outside the
UK
Working at
offshore
installation
West Mersea Colchester East of England
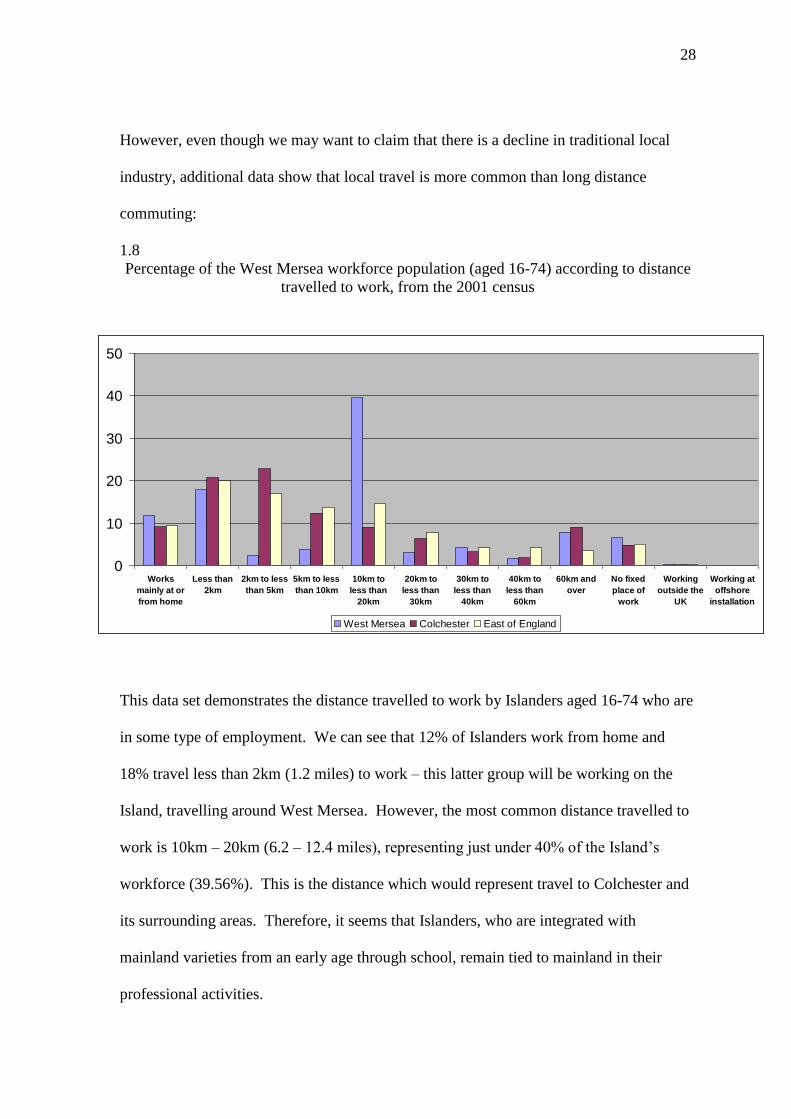
This data set demonstrates the distance travelled to work by Islanders aged 16-74 who are
in some type of employment. We can see that 12% of Islanders work from home and
18% travel less than 2km (1.2 miles) to work – this latter group will be working on the
Island, travelling around West Mersea. However, the most common distance travelled to
work is 10km – 20km (6.2 – 12.4 miles), representing just under 40% of the Island’s
workforce (39.56%). This is the distance which would represent travel to Colchester and
its surrounding areas. Therefore, it seems that Islanders, who are integrated with
mainland varieties from an early age through school, remain tied to mainland in their
professional activities.
29
1.5
Summary
The data presented in this chapter suggest a number of influences on the Mersea
population. The population figures demonstrate a continuous rise in West Mersea’s
residential population over the last century, and that over half of this population is now
professionally employed off the Island. The migration figures from 2001 to 2009 also
suggest that, even though the population is increasing, the main age group which is
experiencing diminishing numbers is the 15-24 group which helps promote the elasticity
of family ties, as members become more scattered, and lessens the Island’s adolescent
population. Conversely, the migration statistics for the 25-44 age group suggest that the
residential population is being bolstered by in-migrants from this age group. The contact
between Islanders and Mainlanders is also promoted through short term visitors, tourists
and holiday makers. This transient population, which is at its peak in the summer
months, adds to the level of contact between dialect varieties. Thus, dialect contact is
being promoted in two ways:
1. Connections with the mainland have become greater and more extensive. As a
result, more Islanders are travelling off the Island for education, work, socialising
etc.
2. More and more people from the outside are coming to the Island. This is being
achieved through tourism and house-moving.

30
Chapter 2
Methodology
31
2. METHODOLOGY
This chapter will discuss the methodology used for this study. As previously outlined,
this study is concerned with the analysis of the dialect spoken on Mersea Island. There
has been no systematic sociolinguistic research carried out on the Island, and it has only
been represented by one speaker from East Mersea in the Survey of English Dialects in
past dialect surveys. Therefore, in order to study the characteristics of the Mersea dialect,
spoken data from Islanders needed to be obtained. In addition, in order to investigate
whether phonological change has taken place, and if so what direction has this change
taken, data needed to be collected from a range of sources so that both an apparent time
and a real time comparison could be made. However, since the focus of this study is the
nature of the modern Island dialect, and how contact with dialects from off the Island may
have affected the dialect of those on the Island, only native Islanders were considered
appropriate for this study.
Therefore, included in this Chapter will be discussions relating to the selection of
informants and the interview structure. In addition, processes involved in the analyis of
the data with respect to token extraction, coding and phonological distribution of the
variables will also be presented.
Finally, this Chapter will provide a brief overview of the primary historical sources which
were used to inform the historical development of each variable in the geographical
region under study.
32
2.1
Data Collection
The following sections will outline the steps taken while collecting data of the Mersea
Island dialect. This was done through a number of informal, casual conversation
interviews (aimed at collecting as relaxed and unmonitored speech as possible) from a
range of Mersea Island natives. These informants were chosen to represent two distinct
age groups so that different stages of the Island’s social and historical development were
represented. In doing this, it is not only the dialectal stages which may be reflected, but
also any changes in attitudes towards the Island community and historical perspectives or
memories (particularly from the oldest speakers) which may not have been recorded
elsewhere. Access to the very oldest members of the community, who would have
represented the dialect in the early twentieth century, proved nearly impossible.
However, with the discovery of an audio archive held by the local museum, a small group
of speakers representing this period of Island life became available for analysis. The
nature of these recordings will also be discussed in greater detail below.
2.1.1
The Interviews
Approaches to Sociolinguistic data collection have taken a number of forms over the
years. These varying methods have included written questionnaires, rapid anonymous
surveys, the reading of word lists and pre-constructed written passages, as well as
structured and unstructured interviews (see, for example, Milroy and Gordon (2003) for a
review of these methods). The method I adopted for the study of Mersea Island English
(MIE) was that of casual, unstructured interviews. Thus, the goal of each interview I
conducted was to capture the type of spontaneous fluent speech associated with the
33
variety’s vernacular. These interviews were always conducted in the informants’
households in a room of their choice. Milroy and Gordon (2003:57-58) note that a
significant advantage of this approach is that, due to the lack of a predetermined structure,
such as that associated with survey questionnaires, the successful interviewer is able to
elicit more extended stretches of conversational (and thus unscripted) speech from the
informant.
However, as is often the case with interaction of this nature, the sociolinguist’s goal of
achieving true unmonitored speech on behalf of the informant is subject to the effects of
the observer’s paradox. This is outlined by Labov (1972) with respect to the aims of
linguistic research in the community as a means of discovering “how people talk when
they are not being observed; yet we can only obtain these data by systematic observation”
(1972:209). In addition to diverting an informant’s attention from the interview situation
through distractions such as telephone conversations, Labov (1972) indicates that the
effects of the paradox may be overcome by involving the subject in questions and topics
which provoke strong emotions. Even though Labov specifically introduces the notion of
the “danger of death” scenario as a prompt for such emotive responses, this approach has
not been proved effective or appropriate for other communities under observation.
Milroy and Gordon (2003:65-66) note that enquiries of this sort in the context of Belfast
interviews elicited quite matter-of-fact accounts of dangerous experiences rather than the
emotional responses achieved by Labov. Thus, the lack of a reliable cross-community
strategy led Milroy (1987) to write that “direct interviewing, however informal on the part
of the field worker, is an uncertain means of gaining access to the vernacular [and] that
the interaction between language and situation is too complex and too little understood
for an interviewer to be able to manipulate it reliably” (1987:26).
34
Regarding the interviews used for this study, I attempted to elicit relaxed conversation
and thus minimise the effects of the observer’s paradox by exploiting both my status as a
native Islander and existing community ties, as well as utilising information gained by
observing the surrounding environment and information gained from previous interviews
with acquaintances. The former allowed me to initiate relevant conversation about local
issues or acquaintances we may have had in common (specifically the person or persons
through whom I was recommended to them), while setting up the necessary recording
equipment in order to help divert attention away from my actions and the presence of the
equipment. In many cases, this was not immediately necessary as I was able to set up
equipment in relatively inconspicuous places while the informants were making cups of
tea. It must be noted at this point that, prior to any equipment activation (usually when I
was first admitted to the home), the informants were explicitly asked if they would permit
me to record them and thus, I provided them with an opportunity to refuse. I also
provided information about my studies and welcomed any questions they had regarding
my work. This procedure itself often generated conversational openings such as
discussions on technological advances. In addition, each informant was asked at the
conclusion of the interview to sign and date the cover of their mini-disk case as evidence
of their consent and also if they would like to be informed of any results from my work.
The use of visual information gained through the location of the interview also provided a
great source of relevant topical conversation. By observing and commenting on, for
example, the type of books in a bookshelf or pictures and paintings on the wall, I was able
to unobtrusively enquire about an informant’s hobbies and family. By introducing and
manipulating conversational topics in this way, I was able to learn which topics appeared
to relax an informant or generate enthusiasm on their part and I could then exploit these
moments.

35
The data utilised for this research focussed on the speech of twenty-eight informants.
The data for five of the male informants came from cassette tapes held by the local
museum and formed part of their archive (see below for more details). These interviews
ranged from 20 to 45 minutes and were recorded in 1978/9. The interviews conducted by
myself (which account for the data pertaining to both the Older and Younger age groups)
ranged from approximately 60 to 165 minutes and were conducted between January 2006
and March 2007. The recording equipment used was a Sony Hi-MD Walkman MZ-RH10
and its appropriate mini-disks. These recordings were then transferred from mini-disk to
ordinary CD disks for audio analysis.
2.1.2
The Informants – A General Overview
Designated Age Group Male Female
Museum 5 0
Older 7 7
Younger 5 4
Total - 28
Twenty eight speakers were chosen, based on the criterion that they had lived on Mersea
Island for their entire lives. Thus, new in-migrants (that is those residents who had
moved to the Island and were not life-long residents) were excluded from this study. Due
to the limited nature of data from East Mersea informants in my corpus, and to achieve
consistency within and across each data set, all speakers chosen for this study had spent
their lives living on the western side of the Island.
36
Data from the Museum archive was in the form of audio cassette tapes. These were
originally produced through the local Lions charity as a means of creating an audio
magazine for Islanders. They included news updates and reports on local events as well
as interviews with Islanders who spent time either talking about a particular topic or about
their life in general as they grew up on the island.
Informants for my own interviews were recruited by one of three methods:
1) THE SNOWBALL METHOD:
This method, as described by Milroy and Gordon (2003:32), takes advantage of
the social networks of participants. A particular advantage of this method, where the
researcher simply asks informants to recommend others whom they feel would be willing
to participate in the study, is a reduction in the likelihood of potential subjects declining
to take part. In doing this, the researcher can begin to shed the status of complete outsider
for one of a friend-of-a-friend, which has been effectively used by, for example, Milroy
(1987) in the study of Belfast communities.
2) PERSONAL INTRODUCTION BY A THIRD PARTY:
Many useful contacts were made throughout the older generation within the
Mersea community when I was invited to help as a volunteer for a local club which
organises activities for those who are partially-sighted. I was introduced to the club
members who had been told about my work and I spent some time talking to them and
giving them my contact details. Many who were not life-long Islanders were still happy
to pass my details on to people they knew.
3) PERSONAL RELATIONSHIP WITH THE RESEARCHER:
These informants make up the smallest group across the Mersea corpus with only
3 informants (all among the younger generation) having a prior relationship with myself.
37
2.1.2.1
The Museum Speakers
The data-set which has been given the ‘Museum’ classification is named as such since the
recordings were sourced from archives held at Mersea Island’s local museum.
Since 1978/9, Mersea Island Lions Club has produced a talking magazine which is
distributed on ordinary cassette tapes and aims to provide a combination of local news
and event updates, as well as interviews with local people who discuss particular topics
(such as the development of local business, transport or simply reminiscences of times
past). The interviews, to which I had access, were conducted mainly at the local council
offices (though occasionally, due to the age and presumably limited mobility of the
participants, they were conducted in the home). Biographical information of those being
interviewed was mainly unavailable, and, although an online description of individual
tapes is in the process of being constructed, many of the entries only have the order of
contents and the name of the interviewee.
Once I was provided with digital copies of the oldest recordings, I methodically went
through them in order to judge which speakers were appropriate. During this time, I also
made notes on recordings that I did not use, so that I too could work with the museum to
update the online site. Therefore, from this period, I chose interviews of five male
speakers (there were no female speakers interviewed during this period who were native
Islanders) and these speakers were born in the years 1883, 1890, 1910, 1916 and the mid-
1920s (- the last of which did not give a specific birth year within the interview but a
rough guess could be made, based on the information provided in the dialogue). It could
be argued that the dates of birth are too widely spread to be combined within the same
38
speaker group, as there is a difference of around 40 years. However, with limited data
available for each speaker, individual speaker analysis would not have elicited enough
tokens for a reliable individual comparison.
Each of the five informants was a native Islander. However, due to the time period in
which they grew up, each member of this group served at some point in the armed forces
and thus travelled away from Mersea. However, each returned after their period of
service had ended and returned to Island employment.
2.1.2.2
The Older Generation
Due to the nature of the educational system on Mersea until the mid-1900s, all older
speakers were educated on the Island until the age of either 14 or 15, depending on their
era, and none received any additional education after this point (with the exception of one
female who went on to train as a nurse). After this time, each older male in the sample
was employed on the Island in local trade. Conversely, two older women were initially
employed off the Island once they had left school but returned to Mersea employment in
later life.
2.1.2.3
The Younger Generation
In order to retain some consistency regarding educational location, I attempted to
interview those informants of the younger generation who had been schooled at West
Mersea primary school. This was achieved for 8 out of 9 informants. The exception to
this was one female who attended a local Colchester private school for part of her primary

39
education. In addition, all informants from this data group attended a local secondary
school in nearby Monkwick and either the local Sixth Form College or local Institute
(both located in central Colchester) for their tertiary education. However, one other
female spent years 7 and 8 (thus aged 11-13 years old) in a Sussex boarding school before
returning to attend the Monkwick school for the remainder of her secondary education.
2.2
Social Factors
This section includes a brief overview of some theoretical issues involved in the
classification and categorisation of informants.
2.2.1
Class
In order to achieve valid comparisons within and across sociolinguistic studies,
sociolinguistic factors must remain as consistent as possible. However, maintaining such
uniformity across research is not only problematic but unrealistic. By way of illustration,
the calculation and constructions of abstract socio-economic class categories through
methods such as the social class index utilised by Trudgill (1974) in Norwich, which was
designed “to measure objectively the social class and status characteristic of the Norwich
sample” (1974:35), may only be applicable to a particular subsection of one society.
However, this cannot accommodate factors such as persons of the same class having
different statuses if they reside in a location which assigns a different class structure
(Milroy and Gordon 2003:44). For example, a builder may hold a different status and be
assigned to a different class in two different communities depending on how each
40
community values that profession, or continued family lineage in a particular geographic
area may be held in higher or lower esteem depending on the society.
The calculation of class on Mersea Island indeed faces such difficulties, as evaluations
appear subjectively dependent upon the subculture to which a person belongs. Thus, it is
from my own experience and impressions from those Islanders with whom I have had
contact, that Islanders whose families are historically established as native families are
held in higher esteem by those from similar local lineage (as opposed to those who have
recently moved to the Island). Therefore, it seems that family history is a far more
significant marker of higher social status than occupation for these residents. This is
perhaps in part due to the perception of professions such as building, shipwrighting and
fishing being derived from ‘Old Mersea’ when it was common for sons to adopt the
father’s, or family’s profession. This type of evaluation (although not as strongly put
forward) was still evident among many of the younger generation of informants, as each
showed an awareness and ability to name prominent Island family-names. Therefore, due
to the subjectivity of these views and the inherent difficulties with calculations of social
class, this was not considered as a social factor for this study. Furthermore, no speaker
recorded during the process of data collection was excluded on the basis of their apparent
class or social standing. For example, no member of the Older speaker group attended
university and all represented similar professions (for example, shipwright, oyster
fisherman and builder). In addition, all members of this group were involved in some
kind of Island activity, from being a organiser at the Church to a member of one of the
local committees.
41
2.2.2
Age and Gender
Age and gender as social variables lend themselves, on the surface, to straightforward
classifications through the categorisation of numerical age and the binary distinction
between males and females, respectively. However, age and gender as social constructs
have been treated more intricately than simple assignment of arbitrary categories. By
way of illustration, Eckert (1998), presenting data from her Belton High sample, posits
that gender be treated as a continuum, since the concept of gender appears to be
intertwined with additional aspects of social identity. Similarly, Eckert (1997) asserts that
age be treated in the form of life stages, which primarily distinguishes childhood from
adolescence from adulthood and explains that age systems “serve to mark not only an
individual’s progress in the life trajectory, but the individual’s progress in relation to
societal norms” (1997:155). Regarding the Mersea sample, informants have been
categorised simply as male or female, since a more detailed in-depth analysis of this
social construct is beyond the scope of this thesis. Similarly, speakers have simply been
assigned to the classification of Older or Younger generation subsets. The Younger
generation of speakers range in age from 18 to 26 years, while the Older generation range
from 58 to 75 years of age.
42
2.3
The Variables – Extraction, Analysis and Classification
All interviews were analysed from start to finish resulting in approximately 32 hours of
data. The analysis of the variables (au), (a) and () were conducted as an
impressionistic or auditory analysis rather than an instrumental analysis8. This was due,
in part, to a lack of consistent recording quality across the interviews, especially the
interviews of the Museum speakers. Also, the focus of this thesis is the representation of
sociolinguistic variation within a phonological model. Therefore, detailed phonetic
descriptions would not be as valuable to the model presented in Chapter 10 as the
perceived phonological categories of the surface variants. Once tokens were extracted
and transcribed, random samples were selected and reanalysed at a later date to ensure
consistency with the original transcription. On the odd occasion where the two
transcribed forms differed, the token was re-analysed for a third time and the majority
form was adopted.
The following sections outline the procedure through which the coding and classification
of data was carried out for the purpose of the analysis.
2.3.1
Linguistic Constraints
Linguistic constraints, or linguistic factors, represent any internal factor which may
correlate or influence sociolinguistic variation. Therefore, with respect to this study,
certain phonological constraints may restrict the distribution of each variable (see below),
while aspects such as specific phonological environments may correlate with the
8 Even though these three variables are the focus of this study, the full (stressed) vowel inventories for two
Mersea Island speakers can be found in Appendix E
43
production of some variables more than others. Thus, all variables were coded according
to the same broad phonological categories:
1. Syllable Type
2. Preceding Phonological Environment
3. Following Phonological Environment
while the following linguistic aspects were taken into account:
4. Prosodic Factors – stress
5. Specific Lexical Items – the case of LIKE, ISLAND and BOY (see the relevant
chapters for details)
2.3.1.1
Syllable Type
The classification of syllable type was a binary choice between those which were open
and those which were closed. Therefore, distinctions such as the following could be
made:
Open – Closed
(au)
allow – loud
houses – house
(a) fly – flight
fighter – slightly
() boy – boys
toilet – jointed
44
2.3.1.2
Phonological Environment
With respect to phonological environment, tokens were coded according to actual, surface
pronunciations as opposed to underlying representations. Therefore, by way of
illustration, the underlying /t/ in lighter could have surfaced (and thus be classified) in
one of three ways – [t], [] or [], depending on the speaker’s pronunciation. Word-initial
or word-final tokens were classified as having no preceding or following environments on
the word level, respectively, and, in the segmental analysis, are represented by the
category ‘None’.
However, with respect to following phonological environment, it must be noted that all
three variables have distributional restrictions, with not all potential following
environments possible in the dialect. These restrictions (following Hammond (1999) who
considers the distribution of American English phonemes in mono-morphemic words),
together with any additional considerations for each variable, will be discussed in more
detail below. However, it is worth noting that Mersea Island English is a non-rhotic
dialect9, so the possibility of following /r/ has been omitted from the discussions.
2.3.1.2.1
The Distribution of /a/
The diphthong /a/ has very restrictive co-occurrence rules with respect to following
segments in English. Indeed, Hammond (1999) illustrates how /a/ does not occur before
any word-final non-coronal consonant. Thus, /pat/ is possible but not */pak/, and it is
9 This is referring to the dialect in the present day. There is evidence of r-colouring in the Survey of
English Dialects and in the speech of an East Mersea informant (whose data is not included here since this
study focuses on those from West Mersea) who was born in 1917.
45
only final /st/, /nt/ and /nd/ cluster which are able to follow it word-finally (for example,
joust, fount and bound).
With respect to word-medial contexts, Hammond suggests that /a/ can occur before /b/
in baobab, before /f/ in dauphin and before // in caoutchouc (1999:121, 123 and 126,
respectively), although these pronunciations seem slightly idiolectal and prone to inter-
speaker variation. Thus, word-medial /a/ has greater restrictions, since it is only found
preceding /t d z/ and the clusters /st/ and /nt/.
2.3.1.2.2
The Distribution of /a/
The distribution of the diphthong /a/, while having a wider distribution than /a/, remains
restricted with respect to which phonological segment can immediately follow it.
The distribution of /a/, in mono-morphemic words, in contrast to /a/, does permit /a/ to
occur before non-coronals, such as labial /m/ and velar /k/, for example climb and hike.
However, /a/ does not co-occur with a following / / in word-final position. With
respect to clusters, in a similar fashion to /a/, the only clusters which are phonologically
permitted to follow /a/ in English are /st/, /nt/ and /nd/ (for example, heist, pint and find).
However, /a/ may also precede /ld/ clusters in words such as wild.
Regarding medial segments, a similar pattern emerges, with the exception of /a/ medial
sequences (such as in tiger). A following dorsal // and the palatals // and // are still
disallowed, while the only medial cluster permitted to follow /a/ is /st/ (such as the loan
word maestro).
46
2.3.1.2.3
The Distribution of //
The distribution of // in monomorphemic words is similar to that already described for
/a/. Following Hammond (1999), we can see that, word-finally, // can also not appear
before non-coronals (though Hammond (1999:111) does suggest coif as a possible /f/
sequence) and the only final clusters which follow // are /st/ and /nt/. However, this
does not take into account the colloquial British English word ‘oik’10
which sees //
preceding a velar consonant.
Word-medially, however, // may precede all oral stops (except /g/), only the coronal
fricatives /s z/ and the approximant /l/. It is not permitted to precede nasals or affricates
in medial position. In addition, it is only following medial /st/ clusters (in words such as
cloister) which are allowed.
2.3.1.3
Stress
Stress placement was not considered as a linguistic variable as all the tokens appear in
stressed syllables. With lexical words however, with respect to /a/, this variable may
also appear in the function words I, my, myself and by in which reduction to [ ~ ] is
common due to their unstressed position in an utterance. For this reason, they have not
been included in the current analysis which instead is focussed primarily on a comparison
of /a/ variants in lexical words as opposed to function words.
10
which is described by the New Penguin English Dictionary as ‘a vulgar, loud, or otherwise obnoxious
man; a yob.” (2000). The New Penguin English Dictionary, Penguin Books.
47
2.3.1.4
LIKE
A further consideration when analysing /a/ is its presence in the token ‘like’. D’Arcy
(2007) identified nine different classifications of like under two broader headings relating
to whether its function is Grammatical or Discursive in nature (2007:392, see Chapter 5.6
for further details).
Drager (2009) used these classifications as a basis for her analysis of like in the speech of
female high school students in New Zealand. She found that the function of like had a
strong correlation with the type of variation produced and, so, the analysis presented here
coded the various functions of like separately and will also examine the different
functions of like apart from the main /a/ analysis.
2.4
The Historical Data
This section will briefly look at the historical data sources which were used to gain a
historical insight to the past developments of each of the variables.
48
2.4.1
Ellis (1889)
Throughout the late nineteenth century, Ellis compiled an extensive corpus of ‘dialect
renderings’ from across the Anglophone parts of England, Ireland, Scotland and Wales
using a three-part methodology:
I. Comparative Specimen (cs) – this involved a reading passage, the purpose of
which was to obtain “dia[lect] renderings of familiar words in various connections and
some characteristic constructions” (1889:7*).
II. Dialect Test (dt) – an additional short passage designed to elicit almost all of the
word categories in the classified word list (see below).
III. Classified Word List (cwl) – an extensive collection of items, which were
subdivided under the headings Wessex and Norse, English and Romance according to
“the vowel of the original language in what corresponds to the accented syllable in
received English” (1889:16*).
Ellis allocated Essex to his Eastern Division and describes this division as follows:
“A closer resemblance to received speech than in any other div[ision]. It is the
region from which rec[eived] sp[eech] was taken, and contains the greater part
of London. The pron[unciation] is, however, not quite uniform, but the
differences are so slight that it has been found extremely difficult to obtain
satisfactory information” (Ellis 1889:188).
Within this division, Essex is grouped with Hertfordshire, Bedfordshire, Huntingdonshire
(in present day Cambridgeshire) and mid-Northamptonshire to form a Mid Eastern dialect
district, whose geographical character is described as long and straggling. He also notes
that, even though the differences between the north of Northamptonshire and the south of
Essex are marked with little or no connections, “I have found it impossible to divide the
district….and have felt it best to consider the different counties involved as forming
‘varieties’” (Ellis 1889:196).
49
As well as a general overview of each division, Ellis gives a description of each county
area within that division, highlighting the prominent dialect characteristics across each of
the methodological approaches. Therefore, it may not be the case that each county
description features the same sociolinguistic variables. Due to this, the assessment of
(), () and () will rely on any descriptions presented as part of the overview of the
Essex region. However, since Ellis used a particular palaeotype from transcribing and
describing sounds and variants, the translation of these symbols to their equivalent
modern IPA symbols by Eustace (1969) will be employed in this thesis.
2.4.2
Wright (1905, reprinted in 1968)
The construction of Wright’s dialect grammar aimed to highlight and describe the main
characteristic features of all British dialects. To do this, it was originally intended to be
based upon non-literary words, as he proposed that their phonological structure would
have been less influenced by literary language (Wright 1968:III). However, due to the
restricted geographical spread of genuine dialect words, Wright’s index of 2,431 items
was mainly based upon words which were represented by both the literary language and
the spoken dialects themselves. The classification of dialects by Wright follows those of
Ellis (discussed above) as he subdivided the Eastern Division into five groups, of which
the Mid Eastern group contained most of Essex, while the South Eastern group contained
south-west Essex (1968:4-5). However, Wright notes that, even though he had extensive
material, “it is often insufficient to enable me to give the exact geographical area over
which many grammatical phenomena extend” (1968:1), and thus he states that the
boundaries and classification of the dialects is arbitrary. Taking this into account, the
grammar is organised in two ways: variant lists according to Old English phonemes and
50
variants listed according to the individual words. However, with respect to the actual
description of the dialectal variants demonstrated by informants, Wright does admit that
he did not set out to present vowel systems in such minute detail as Ellis, since, he claims,
“this grammar would have been of little use to students of English philology” (Wright
1968:11).
2.4.3
Kurath and Lowman (1970)
The focus of this study was only across Southern England and descriptions do not reach
dialect areas north of Warwickshire to the west of England and Lincolnshire to the east.
A specially designed questionnaire was used to investigate approximately three locations
within each of the southern counties. The questionnaire Kurath and Lowman used held
nearly 250 items, which were intended to highlight regional differences in phonology, and
they used the Middle English phonemic system as their frame of analytic reference when
trying to determine the normal development of sounds from the parent phoneme. The
corpus of 56 speakers was collected throughout the 1930s and this Kurath and Lowman
note “appears to suffice for a general view of the dialect structure of this section of
England” (1970:1).
Once the data was collected and analysed, they produced maps highlighting the reflexes
or variants of Middle English vowels used by the informants of each location. Thus, the
type of variants elicited through the questionnaires are clearly demonstrated across
regions, although details of specific places where the data collections took place are not
provided.
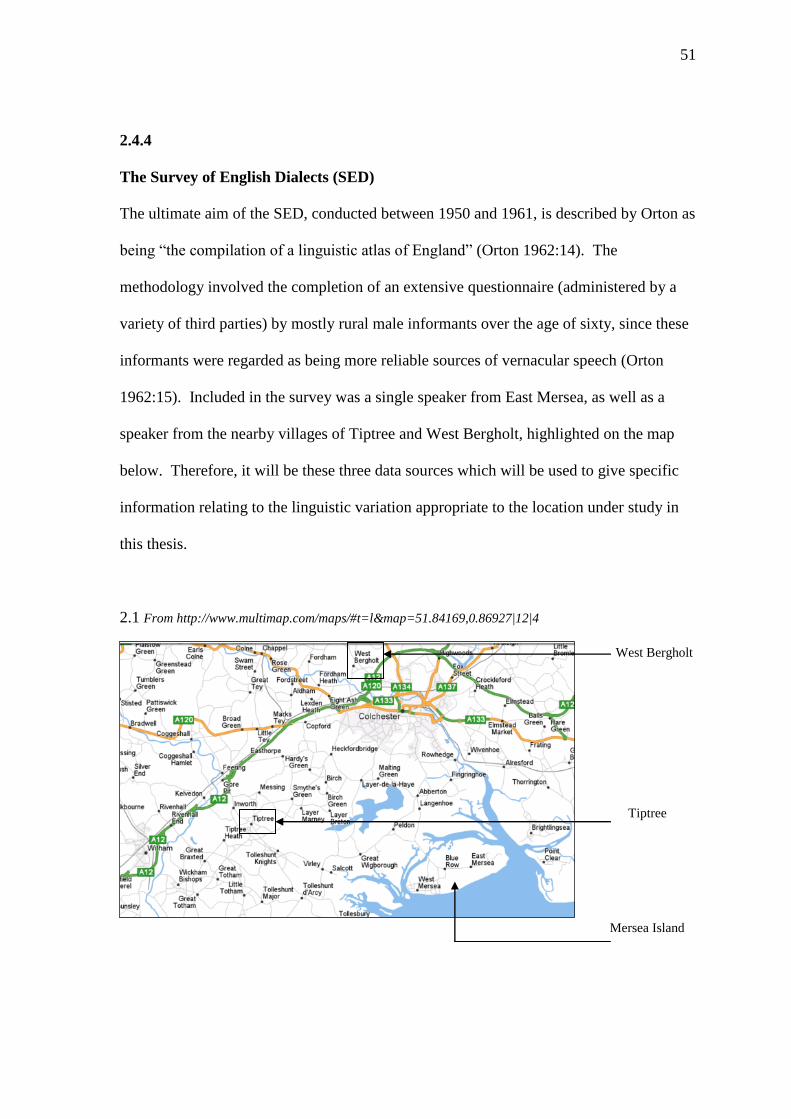
51
2.4.4
The Survey of English Dialects (SED)
The ultimate aim of the SED, conducted between 1950 and 1961, is described by Orton as
being “the compilation of a linguistic atlas of England” (Orton 1962:14). The
methodology involved the completion of an extensive questionnaire (administered by a
variety of third parties) by mostly rural male informants over the age of sixty, since these
informants were regarded as being more reliable sources of vernacular speech (Orton
1962:15). Included in the survey was a single speaker from East Mersea, as well as a
speaker from the nearby villages of Tiptree and West Bergholt, highlighted on the map
below. Therefore, it will be these three data sources which will be used to give specific
information relating to the linguistic variation appropriate to the location under study in
this thesis.
2.1 From http://www.multimap.com/maps/#t=l&map=51.84169,0.86927|12|4
West Bergholt
Tiptree
Mersea Island

52
2.5
Summary
This section has described the methodology employed during data collection on Mersea
Island and its subsequent analysis. In order to extract the most appropriate data for
analysis, casual sociolinguistic interviews were conducted with two distinct age groups of
native Islanders, thus enabling an apparent time analysis of any linguistic changes. In
addition, the discovery of an audio archive held by the local museum allows for a real
time study to be conducted, helping to substantiate any claims from the apparent time
analysis. This data, unlike that of the historical dialect studies outlined above, such as
Ellis (1889), feature conversational data instead of that collected from questionnaires, for
example, and will therefore lend a different perspective to the historical data.
In order to prepare these data for statistical analysis, the coding process has been
discussed, as well as the particular distributional restrictions for each diphthong in
monomorphemes. These distributional restrictions inhibit the data in terms of following
phonological environments and so additional domains, such as syllable type and
preceding phonological environment, will also be analysed.
53
Chapter 3
The Historical Derivation and
Variation of the Variable ()

54
3. THE HISTORICAL DERIVATION AND VARIATION OF THE VARIABLE ()
The following sections will discuss the derivational history of the present-day diphthong
// from Middle English /u:/ as well as identify and discuss past and present variation
reported from studies which have examined this variable.
3.1
Historical Sources
Wells (1982a) classifies the stressed diphthong // as the MOUTH vowel. It may occur in
both open and closed syllables (such as how and hound), though its distribution is
restricted with respect to following phonological environments (see Chapter 2.3.1.2.1
above). The MOUTH lexical set represents the standard stressed diphthong // which is,
in almost all cases, the present day derivation (or reflex) of Middle English /u:/, which
diphthongised as part of the Great Vowel Shift. The phonological ‘event’ known as the
Great Vowel Shift, which began around the fifteenth century, refers to a phonological
change that took place in English, which resulted in the raising of all long vowels and the
diphthongisation of the two high vowels /i:/ and /u:/.
However, the path of development from Middle English /u:/ to present day // remains a
topic of academic debate. This is also true for the developmental path of the diphthong
/a/ which appears to have acted, for the most part, in parallel with // (the path of this
diphthong will be discussed in Chapter 5). However, with respect to //, the opposite
views focus on the relative timing of the centralisation of its nucleus. The first view,
supported by, for example, Wells (1982a:185) and Lass (1987), reports that centralisation
of the diphthong nucleus followed an initial lowering period. Thus, the route from /u:/ to
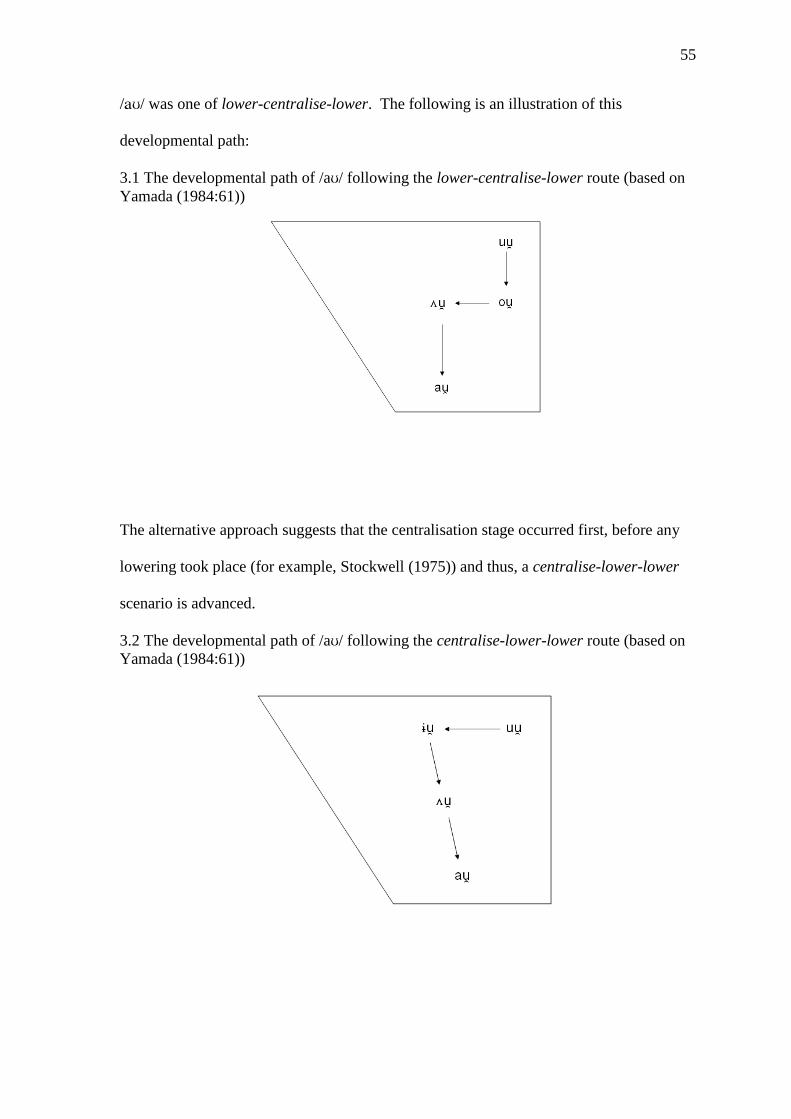
55
// was one of lower-centralise-lower. The following is an illustration of this
developmental path:
3.1 The developmental path of /a/ following the lower-centralise-lower route (based on
Yamada (1984:61))
The alternative approach suggests that the centralisation stage occurred first, before any
lowering took place (for example, Stockwell (1975)) and thus, a centralise-lower-lower
scenario is advanced.
3.2 The developmental path of /a/ following the centralise-lower-lower route (based on
Yamada (1984:61))
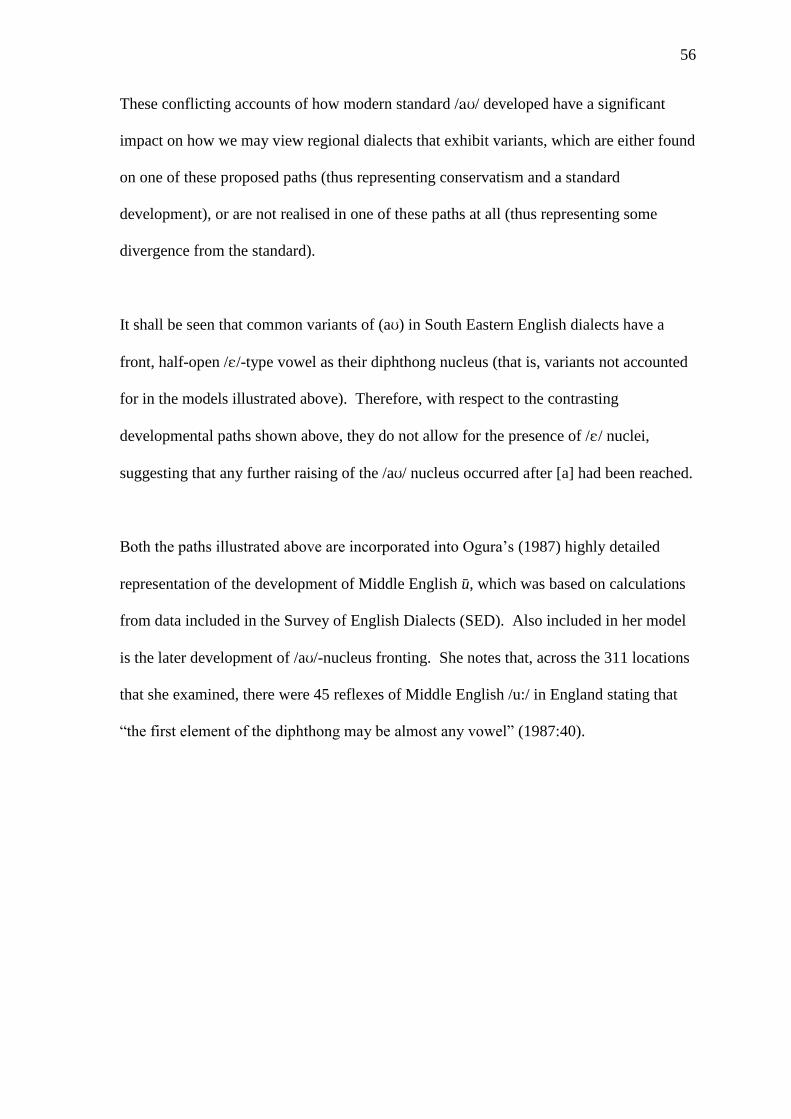
56
These conflicting accounts of how modern standard // developed have a significant
impact on how we may view regional dialects that exhibit variants, which are either found
on one of these proposed paths (thus representing conservatism and a standard
development), or are not realised in one of these paths at all (thus representing some
divergence from the standard).
It shall be seen that common variants of (a) in South Eastern English dialects have a
front, half-open //-type vowel as their diphthong nucleus (that is, variants not accounted
for in the models illustrated above). Therefore, with respect to the contrasting
developmental paths shown above, they do not allow for the presence of // nuclei,
suggesting that any further raising of the /a/ nucleus occurred after [a] had been reached.
Both the paths illustrated above are incorporated into Ogura’s (1987) highly detailed
representation of the development of Middle English u, which was based on calculations
from data included in the Survey of English Dialects (SED). Also included in her model
is the later development of /a/-nucleus fronting. She notes that, across the 311 locations
that she examined, there were 45 reflexes of Middle English /u:/ in England stating that
“the first element of the diphthong may be almost any vowel” (1987:40).
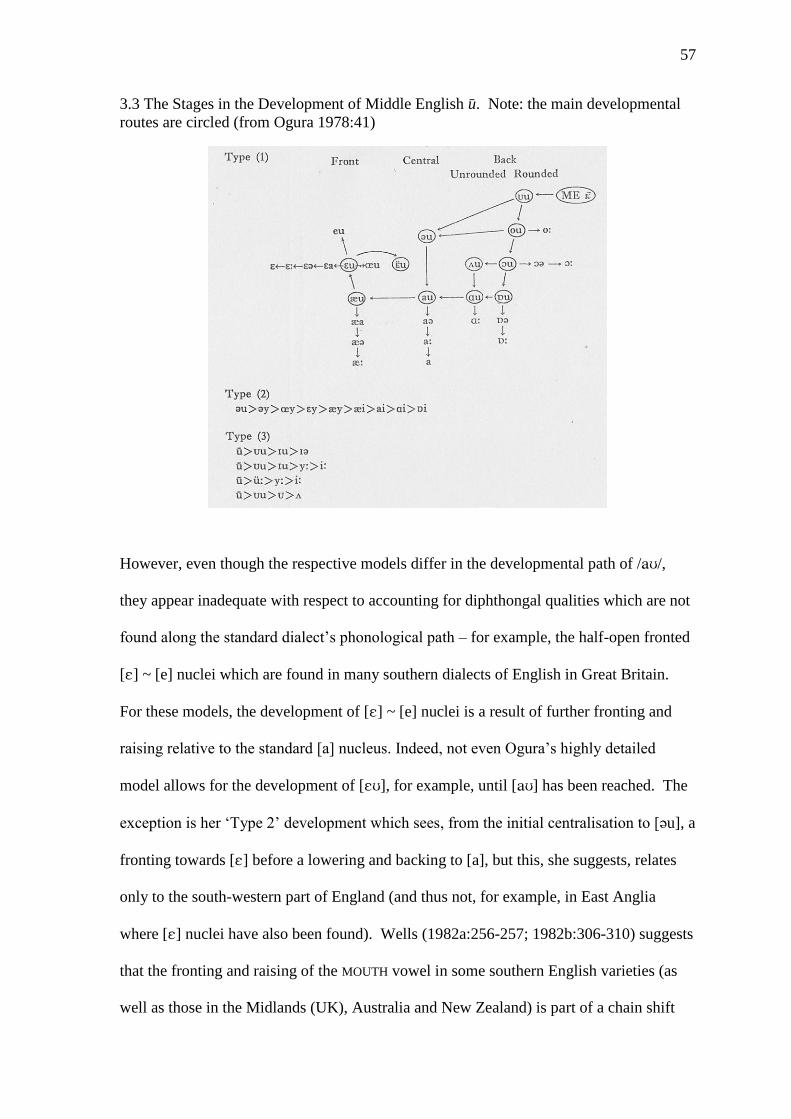
57
3.3 The Stages in the Development of Middle English u. Note: the main developmental
routes are circled (from Ogura 1978:41)
However, even though the respective models differ in the developmental path of //,
they appear inadequate with respect to accounting for diphthongal qualities which are not
found along the standard dialect’s phonological path – for example, the half-open fronted
[] ~ [e] nuclei which are found in many southern dialects of English in Great Britain.
For these models, the development of [] ~ [e] nuclei is a result of further fronting and
raising relative to the standard [a] nucleus. Indeed, not even Ogura’s highly detailed
model allows for the development of [], for example, until [] has been reached. The
exception is her ‘Type 2’ development which sees, from the initial centralisation to [u], a
fronting towards [] before a lowering and backing to [a], but this, she suggests, relates
only to the south-western part of England (and thus not, for example, in East Anglia
where [] nuclei have also been found). Wells (1982a:256-257; 1982b:306-310) suggests
that the fronting and raising of the MOUTH vowel in some southern English varieties (as
well as those in the Midlands (UK), Australia and New Zealand) is part of a chain shift

58
labelled as the Diphthong Shift, which also affected the long vowels /i: u:/ and the
diphthongs /e a o/. This shift is thought to have become widespread in the first half
of the nineteenth century, at the same time that British English was being transported to
Australia (Wells 1982a:257). A simplified version of the proposed vocalic movements of
the Diphthong Shift can be illustrated as follows:
3.4 The path of the diphthong shift in both front and back vowel systems (from Wells
1982a :256)
Even though it is not marked on Wells’ diagram above, which only shows a fronting of
the /a/ nucleus, he does note that this vowel may also raise to [] after the initial
fronting to [] (Wells 1982a:257)
Labov accounts for the change from [a] to [] within the model of the Southern Shift
(1994:208) – a similarly formulated set of changes to that of the Diphthong Shift. This
incorporates changes to a number of vocalic elements across four sub-sets of movement
and includes the nuclei fronting of back-gliding diphthongs (such as // and //). As a
result, the diphthong nucleus of /a/ is fronted and raised to the region of /e/ (while the /e/
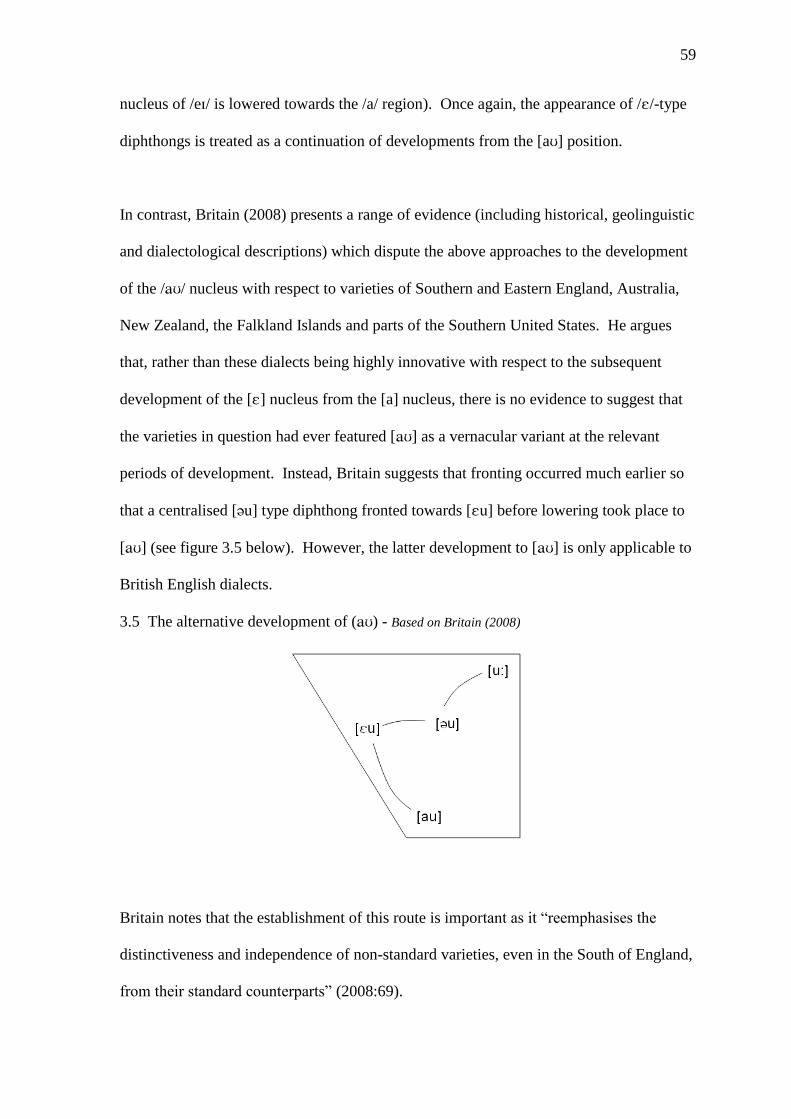
59
nucleus of /e/ is lowered towards the /a/ region). Once again, the appearance of //-type
diphthongs is treated as a continuation of developments from the [a] position.
In contrast, Britain (2008) presents a range of evidence (including historical, geolinguistic
and dialectological descriptions) which dispute the above approaches to the development
of the // nucleus with respect to varieties of Southern and Eastern England, Australia,
New Zealand, the Falkland Islands and parts of the Southern United States. He argues
that, rather than these dialects being highly innovative with respect to the subsequent
development of the [] nucleus from the [a] nucleus, there is no evidence to suggest that
the varieties in question had ever featured [] as a vernacular variant at the relevant
periods of development. Instead, Britain suggests that fronting occurred much earlier so
that a centralised [u] type diphthong fronted towards [u] before lowering took place to
[] (see figure 3.5 below). However, the latter development to [] is only applicable to
British English dialects.
3.5 The alternative development of () - Based on Britain (2008)
Britain notes that the establishment of this route is important as it “reemphasises the
distinctiveness and independence of non-standard varieties, even in the South of England,
from their standard counterparts” (2008:69).
60
3.2
Variation of //
As previously mentioned, Ogura remarks that the nucleus of () could be almost any
vowel and this observation is echoed by Wakelin (1977:8). In addition, Wells
(1982a:152) outlines four main types of variation that may influence the pronunciation of
():
I. “The degree of advancement of the starting point”. For example, he notes that
very fronted starting points typically [~~] are characteristic of traditional Southern
British Englishes.
– These fronted variants have been found across the south in Milton Keynes and
Reading, for example, with respect to working class speakers and speakers
representing more traditional local variants (Cheshire et al (1999), Kerswill and
Williams (2000), for example). Fronting to an // nucleus was also found in the
Fens by Britain (1991) and by Przedlacka (2001) across the four counties of
Buckinghamshire, Essex, Kent and Surrey, while investigating the presence and
nature of Estuary English in 16 year old school children.
Further afield in the UK, Mathisen (1999) observed the use of // and // nuclei in
the speech of her Sandwell (West Midlands) informants, particularly throughout
the speech of working class males. In addition, she notes that the area’s
diphthongised GOOSE vowel ([u]) may lead to pairs such as shooting and shouting
becoming homophonous.
61
II. “The degree of openness of the starting point”. For example, Wells suggests that
half-open starting points, or those even closer, of the qualities [~~] are associated
with older and rural speech (though he does not indicate particular geographic regions
for this observation).
– However, Williams and Kerswill (1999) note a pronunciation of [] is present in
their Hull data, but they fail to comment on this and limit their observation only to
the tendency for strong labialisation of the diphthong offset.
Diphthongs with a nucleus quality produced in the region of // have been
reported in other parts of the UK, however. Mees and Collins (1999) describe the
quality of /a/ in their Cardiff data as a diphthong whose starting point “is low
back rather than truly central” (1999:191), and therefore they represent it as [u]
as opposed to [u] (see also Collins and Mees (1990)). In addition, Stuart-Smith
(1999), when giving a summary of Glasgow vowels, notes that while the Glasgow
Vernacular prefers a short [] vowel for this diphthong, Standard Glasgow English
is represented by a diphthong of an [] quality. This Standard Glasgow variant is
also found in data from Edinburgh English (Chirrey 1999)
III. “The quality of the second element”. By way of illustration, Wells suggests that
an []-type diphthong featuring a front unrounded second element is represented in
some areas of Southern England. Also, a mid-central type element resulting in the
centring []-type diphthong can be found in London Cockney English. It is also
possible for there to be no second element, and thus, through a process of
monophthongisation, renderings such as [: ~ a:] are also found in London Cockney.
– With respect to the qualities of the /a/ offglide, unrounding to [] has been
reported in areas such as Reading (Williams and Kerswill 1999) and Milton
Keynes (Kerswill. and Williams. 2000). In these two locations, this form is
associated particularly with the older working class speakers. However,
62
Przedlacka (2001) found offglide lowering to [] in the data of 16 year old
speakers across the counties of Buckinghamshire, Essex, Kent and Surrey. In
contrast, the centralisation of the /a/ offglide to schwa was reported in London
Cockney (Sivertsen (1960)) and, indeed, Matthews (1938 [1972] cited in Ryfa
(fc)) states that Cockneys, who are considered less broad, employ [] as the
offglide to /a/.
Regarding monophthongisation of /a/, both Sivertsen (1960) and Tollfree (1999)
report on the use of a monophthong in London speakers. However, it can also be
found outside London, indicating that it is not a uniquely defining feature of the
city or indeed the southeast. For example, Britain (1991) notes monophthongal
forms of [e: ~ : ~ a: ~ :] qualities in his East Anglian Fens data while Docherty
and Foulkes (1999) and Stoddart et al (1999) note that [a:] is the main local
variant in their Derby and Sheffield data, respectively.
IV. “The ‘speed’ of the diphthong”, which tends to affect the articulation of the initial
element causing a prolonged articulation of the onglide (which is a particular
characteristic of the American South).
– However, others, such as Tollfree (1999), have noted diphthongs, such as [:],
where the second element has a very short duration and, thus, the first element is
prolonged.
Indeed, these are similar points of variation associated with the // diphthong (see 5.2
below) and, also in a similar fashion to //, the MOUTH vowel is susceptible to smoothing
processes, particularly in the context of // triphthong sequences. Thus, tower /t/

63
may become [ta:] or even [t:] through smoothing and subsequent monophthongisation,
leading it to become homophonous with tar (Wells 1982a:238-239).
One final aspect of () variation, which is also a shared characteristic with //, is that of
‘Canadian’ Raising (see for example, Chambers (1989) or Britain (1995; 1997)). Unlike
the variation reported for //, there have been no reports of Canadian Raising patterns in
England, and Trudgill notes that “we nowhere find different allophones of /au/ in voiced
and voiceless environments” (1986:156). The Canadian Raising process is where the
diphthong variants of // and // are in complementary distribution – those with a raised
nucleus appearing before voiceless consonants and those with lowered nuclei surfacing
before voiced consonants and all other environments. Thus, with respect to //, pairs
such as [] ~ [] versus [ld] occur.
The following sections will present the findings from a range of historical and modern
dialect studies relating to the behaviour of the () variable. The initial discussion will be
primarily concerned with data from East Anglia in general before attention is turned
briefly to some international varieties of English. This will construct a picture of what
variants are represented in the regions surrounding Mersea Island and, therefore, those
varieties with which Islanders are more likely to share sustained contact. In addition, by
looking at the behaviour of () in international insular varieties, we can examine patterns
of variation across a range of sociolinguistic environments which might share similar
patterns of contact with outside varieties.
64
3.2.1
Historical Variation
In order to establish the historical development of the () variable in the area under
analysis, this section will examine its variation as presented in a selection of historical
dialect studies. The inclusion of historical data will also enable a real time perspective of
variation and change to be established and, through a comparison with the modern data
collected for this study, the trajectory of changes relating to this diphthong may be
uncovered.
3.2.1.1
Ellis (1889)
The dialect survey conducted in Essex is described by Ellis as failing to obtain and “bring
out the chief peculiarities” (1889:221) of the region. However, the data acquired with
respect to // suggests the variation at the time included variants such as [] and [],
but Ellis notes that [] should be taken as the general sound for the county. However,
one additional observation to be made comes from data from Maldon (a town
approximately 15 miles from Mersea Island), where it is noted that an occasional prefix
of // is added to the diphthong leading to variations such as {nE’u}– [n]11
.
3.2.1.2
Wright (1905, reprinted in 1968)
The result of Wright’s dialect survey is the observation that, with respect to Old English
long u (or u ), [eu] is common in Eastern England for words such as about, house and
11
Note: the transcription using the notation of Ellis is included within { } brackets while the translated
modern IPA symbols (using Eustace 1969 for the translation) are enclosed within the conventional [ ]
square brackets.
65
south, even though [u] is present in Norfolk. In addition, OE u r is noted to have
achieved breaking through schwa insertion in the items our and shower and has the
pronunciation [u] in north-east Norfolk and east Suffolk (1968:151).
3.2.1.3
Kurath and Lowman (1970)
Kurath and Lowman noted that, in the central southern counties they investigated (Essex
was classified as an east-central county), Standard British English [u] did not emerge in
the speech of those under investigation whereas [u ~ ~ u] were universal (1970:5).
In addition, an isogloss pertaining to /a/ variation was constructed and ran from the
western Sussex border (with Hampshire) up towards central Worcestershire as a way of
visually separating Western [u] from Eastern [u] (1970:35). However, it must be noted
that they also observed a consistent Norfolk pronunciation, which deviated from this
Eastern form, as [u] with occasional [u ~ u] (1970:5).
3.2.1.4
The Survey of English Dialects (SED)
A comparison of three locations from the SED’s data survey (East Mersea, Tiptree and
West Bergholt, see the map in 2.1 above) shows Ellis’ assessment of [] as the
predominant variant holds true across each location. By way of illustration, the tokens
about, cloud, houses and cow demonstrate the stable nature of the variant before a
voiceless and voiced consonant, a morpheme boundary and in a word-final open syllable.
Indeed, variation only becomes apparent when // is followed by //.
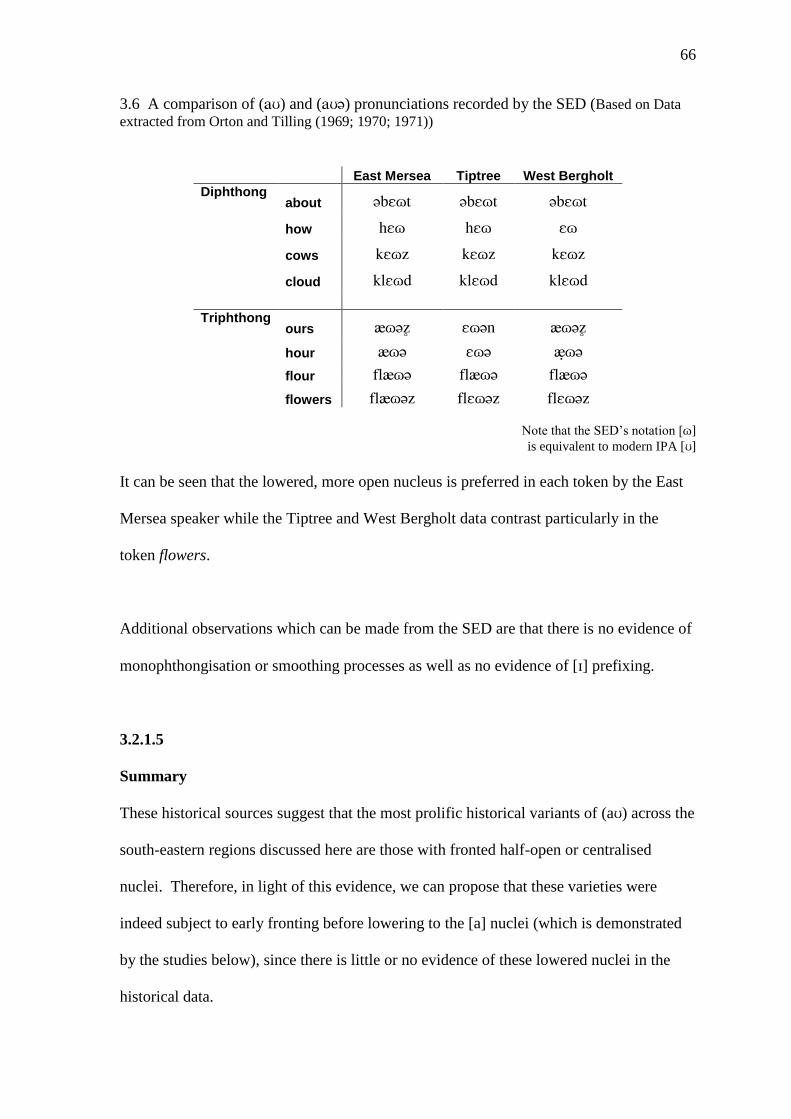
66
3.6 A comparison of () and () pronunciations recorded by the SED (Based on Data
extracted from Orton and Tilling (1969; 1970; 1971))
East Mersea Tiptree West Bergholt
Diphthong about
how
cows
cloud
Triphthong
ours
hour
flour
flowers
Note that the SED’s notation []
is equivalent to modern IPA []
It can be seen that the lowered, more open nucleus is preferred in each token by the East
Mersea speaker while the Tiptree and West Bergholt data contrast particularly in the
token flowers.
Additional observations which can be made from the SED are that there is no evidence of
monophthongisation or smoothing processes as well as no evidence of [] prefixing.
3.2.1.5
Summary
These historical sources suggest that the most prolific historical variants of (a) across the
south-eastern regions discussed here are those with fronted half-open or centralised
nuclei. Therefore, in light of this evidence, we can propose that these varieties were
indeed subject to early fronting before lowering to the [a] nuclei (which is demonstrated
by the studies below), since there is little or no evidence of these lowered nuclei in the
historical data.

67
3.2.2
Modern Variation Studies – The South East
This section will give a brief overview of some sociolinguistic variation studies which
have focussed upon (), or included it as part of a dialect survey. Due to the location of
the community under study, varieties from the South East of England will be primarily
considered alongside those studies whose geographical focus is on locations closest to
Mersea Island. This will demonstrate the type of variation most likely to be in contact
with that of Mersea Island and will help to generate an overall picture of regional
variation in the south east of East Anglia.
3.2.2.1
The East Anglian Fens
The Fens are a low lying area spanning four counties: parts of west Norfolk, north
Cambridgeshire, southeast Lincolnshire and northwest Suffolk. Historically, the southern
two thirds of the Fenland area was made up of undrained marshland which was prone to
flooding, making the land unsuitable for settlement (Britain 1997:19). As a result, the
population was confined to a number of smaller settlements and communities which
scattered about the region. The reclamation of the land, as it was drained in the
seventeenth century, was a turning point in the region’s history as these once isolated
communities were now accessible. This is reflected in the extent of population growth
between 1563 and 1801 in areas such as Wisbech and March, which were inaccessible
before reclamation. The population of these areas grew from 1,210 and 1,025, to 4,710
and 2,514, respectively, and Britain notes that the origins of the in-coming population
were mixed and varied (Britain 1997:19-20). As a result, these once isolated
68
communities found themselves in high contact situations, particularly between those
dialect varieties of the eastern and western Fens.
As we shall see below, Britain (1991) found prominent Canadian Raising patterns with
respect to the () variable (see 5.4.2 in particular). However, no such pattern, even in the
historical data of the SED pertaining to the region under investigation, could be found for
(). Even though Canadian Raising variation was not found to occur with this variable,
the Fens data demonstrate certain phonological influences on the variation pattern which
was analysed.
Using data from the SED, Britain established that traditional realisations of () across
available Fenland locations were diphthongs whose nucleus was predominantly of an []-
type quality. However, Britain’s data highlighted a number of different monophthongal
variations with qualities representing [e : ~ : ~ a: ~ :]. Looking at both word-medial
and word-final environments, as well as whether // was part of a triphthong, Britain
found that following phonological environment correlated with the production of
diphthongal or monophthongal variants. For example, even though the analysis
highlighted greater diphthong usage in Eastern areas and greater monophthong usage in
Western areas, overall, monophthongs were more common when () preceded [] and
[t]. Conversely, diphthongal variants were more likely in word-final position preceding a
vowel or a pause. Building on this analysis, Britain investigated the relationship between
monophthongisation of /a/ and its onset quality by dividing his 81 informants into five
groups, according to the extent of monophthongal use and the quality of their
monophthong and diphthong realisations. However, he did not report any link between,
for example, onset quality and frequency of diphthong pronunciations (i.e. Group Five
69
exhibited almost categorical [a] onsets and diphthongal variants while Group Four,
having mostly [e] onsets, also used mainly diphthongal forms (1991:128-129)).
3.2.2.2
Colchester
In Colchester, Britain’s oldest recorded town, which is approximately a twenty minute
drive from Mersea Island and can be described as its nearest urban centre, Ryfa (2005)
explored many linguistic variables including the MOUTH vowel. Ryfa’s work focussed
upon data from two youth groups, which she categorised as ‘Chavs’ (working class) and
‘Grungers’ (middle class) – however, see Ryfa (2005) for a more detailed description of
these groups. Her study analysed the speech of eight informants, four from each social
group, and consisted of spontaneous interviews across Colchester town centre where Ryfa
approached the individuals and asked permission to record them at that time.
She found that, whereas the Grungers were more likely to use variants which
approximated standard //, the Chavs preferred more fronted diphthongs. Another
observation which can be taken from her analysis is that both groups used a
monophthongal [a:] variant (Grungers 31% and Chavs 25%, Ryfa (2005:52)), but other
monophthongs can be found, ranging in quality from a front open [:] to a back
unrounded [:]. Also, there is no case of half open []-type onglides to the diphthongs
within her Colchester data, suggesting that Colchester youths, or at least those
interviewed for this study, are utilising only lowered diphthongal nuclei for this variable.
70
3.2.2.3
Basildon
Basildon was built in the 1950s as a post-war ‘New Town’. Fox (2000) notes that the
majority of the establishing population consisted of families of working class origin who
moved out of the London’s East End districts. Therefore, the incoming London variety
would have dominated not only the other input dialects, but also the original dialect
spoken in Basildon (which was, before the new town development quite rural and
sparsely populated). Therefore, the focus of Fox’s survey of this area was to investigate
whether this original Cockney influence still remained in the Basildon dialect, or whether
the dialect had succumbed to what has been referred to as ‘Estuary English’ (a variety
which, it has been proposed, has resulted from Londoners modifying their Cockney
speech towards that of the areas to which they move and RP speakers accommodating
their dialect towards that of the incomers (Coggle 1993 cited in Fox 2000:1)).
The survey of Basildon speech utilised a rapid anonymous survey (which involved the
reading of a short passage) as well as interviews carried out at a local youth centre. All
informants were adolescents between 12 and 19 years old – 22 informants being recorded
during the interviews and 30 informants used for the reading passage survey.
This study looked at a number of phonological variables, including the MOUTH vowel,
with the aim of assessing whether the vernacular speech of Basildon “is simply ‘Cockney
gone east’ as opposed to so-called Estuary English” (Fox 2000:1). Citing a range of other
previous research, Fox describes the traditional Cockney diphthong as one with an []
nucleus, while the Cockney monophthong has an [a] quality. Conversely, Estuary

71
English, not employing the monophthong, has been shown to have diphthong nuclei of [e
~ a ~ ] qualities (Fox 2000:5-6).
With respect to the actual analysis, Fox’s data only consisted of tokens extracted from six
teens aged 13 to 15 years, the rest of the informants being excluded for reasons of non-
eligibly and low quantities of data. With respect to //, she found that the monophthong
[a:] (often said to be a defining feature of Cockney) was quite prevalent in the data and
also that the vowel has a more central offglide, lending the diphthong a [] quality. This
observation is in line with Altendorf (2003), who notes that a monophthong realisation for
() is characteristic of Cockney as opposed to Estuary English and that her data
demonstrate that it is “confined to the working class” (2003:103). This, she claims, helps
strengthen the case that Basildon English is a diffused Cockney dialect as opposed to
Estuary English.
3.2.2.4
Summary
These studies, once again, show that traditional variants in the South East, with the
exception of Cockney English and areas of the Fens, were diphthongal in nature. The
nucleus qualities of these diphthongs range between front, half open and open vowels.
Also, the distribution of these diphthongal and any monophthongal variants may be
influenced by the social factor of class as well as phonological context.
72
3.2.3
Contemporary Studies of Insular Varieties
This section will specifically focus upon studies of insular communities. These studies
will highlight how a changing demographic and socio-economic status can influence not
only linguistic variation, but also the attitudes towards that variation. The locations of
these studies will include analyses from the United States, the Falkland Islands, St Helena
and Tristan da Cunha. Through the incorporation of these studies, it will be possible to
highlight not only possible linguistic constraints that must be considered in the analysis of
Mersea Island English, but also any social and attitudinal factors which might also be
relevant.
3.2.3.1
Martha’s Vineyard
Martha’s Vineyard is an island off the coast of Boston, Massachusetts. This was the
location of Labov’s groundbreaking sociolinguistic study (1963 reprinted in Labov
(1972)), which investigated the correlation between the variants of () and ()12
and the
many social factors pertaining to the community under observation. The particular
variation under investigation was the distribution of raised or centralised nuclei of the
diphthongs. At the time of the study, Labov notes that, with respect to data from the
Linguistic Atlas of New England, Martha’s Vineyard // shows little centralisation
whereas // is “well centralised” (1972:11).
1,500 tokens of () were extracted from 69 speakers, and the results showed that
centralisation seemed to be phonologically conditioned, with respect to following
12
Note that Labov used the notations (ay) and (aw) for () and (), respectively. The latter pair has been
retained here, and throughout this thesis for consistency.
73
environment. Thus, voiceless obstruents were found to favour centralisation while
sonorants and nasals disfavoured it (see Labov (1972:20) for the full scale). Although
Labov does not say as much, this pattern of centralisation coincides with the type of
environments found in Canadian Raising patterns.
Centralisation was also discovered to increase successively from the oldest speakers (75+)
to the 31-45 year old group, which represents the peak of centralisation across all the age
groups. The final age group, the youngest at 14-30, however, shows a decline in
centralisation (by almost half compared to that of the 31-45 year old group). Indeed,
Labov notes that, since the level of centralisation is at a minimum for both the very old
and the very young, it “shows that the effect of age cannot be discounted entirely, and it
may indeed be a secondary factor in this distribution over age levels” (1972:24).
Another significant factor was found to be the speaker’s social orientation and attitude to
the Island, in that a positive orientation towards Martha’s Vineyard strongly correlated
with higher degrees of centralisation (Labov 1972:39).
These findings were supported by Pope et al (2007) who reconstructed the original
Martha’s Vineyard study. Keeping the original methodology intact, 116 speakers were
interviewed and 2,500 tokens of () were extracted. They too found correlations with
phonological context and, particularly, their attitudinal assessment found that there
remained a correlation between speakers’ attitudes and the amount of centralisation
(2007:621). However, they noted that both () and () variables did not seem to be
salient (or above the level of consciousness), and that their data, collected in 2002,
74
showed levels of centralisation receding (with () not being affected as much as (a)).
This was particularly true with speakers born after 1979 (2007:623).
These studies indicate that the additional aspect of social orientation may be a significant
factor in shaping sociolinguistic variation. Types of attitude may act to inhibit or,
conversely, promote certain types of change depending upon a variant’s social evaluation
when introduced though contact. The type of contact experienced by Martha’s Vineyard
Islanders with the mainland also appears to be reciprocal. That is, even though many
tourists and permanent residents come to the Island, the Islanders also travel off the Island
for professional or social activities (in this respect, the contact situation on Martha’s
Vineyard is similar to that of Mersea).
3.2.3.2
Ocracoke and Smith Island
Ocracoke and Smith Island are two islands off the coast of the Eastern United States
which are only accessible by ferry. Ocracoke Island is situated off the coast of North
Carolina and has been subject to a significant rise in the level of tourism in recent
decades. However, Smith Island, located in the Chesapeake Bay area of Maryland, has
not had such a tourism boost and, instead, has even begun experiencing a decline in its
residential population (see, for example, Schilling-Estes and Wolfram (1999), Schilling-
Estes (2002) and Wolfram (2008)).
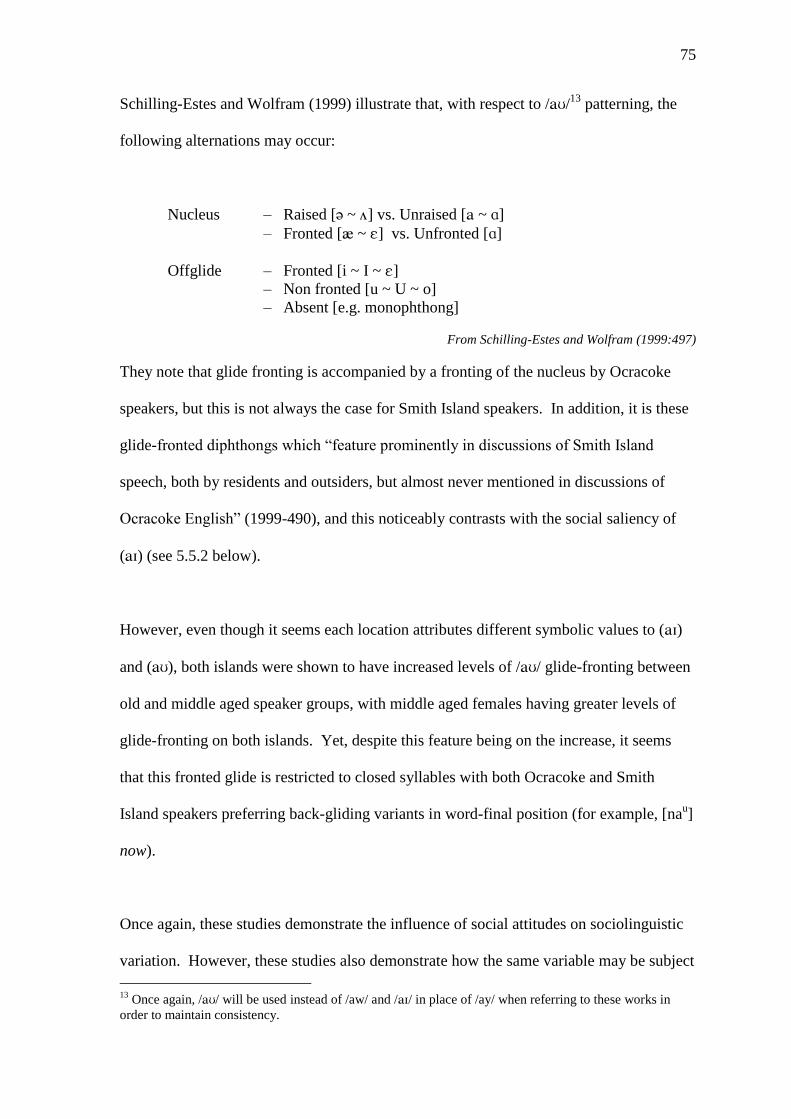
75
Schilling-Estes and Wolfram (1999) illustrate that, with respect to //13
patterning, the
following alternations may occur:
Nucleus – Raised [ ~ ] vs. Unraised [ ~ ]
– Fronted [ ~ ] vs. Unfronted []
Offglide – Fronted [i ~ I ~ ]
– Non fronted [u ~ U ~ o]
– Absent [e.g. monophthong]
From Schilling-Estes and Wolfram (1999:497)
They note that glide fronting is accompanied by a fronting of the nucleus by Ocracoke
speakers, but this is not always the case for Smith Island speakers. In addition, it is these
glide-fronted diphthongs which “feature prominently in discussions of Smith Island
speech, both by residents and outsiders, but almost never mentioned in discussions of
Ocracoke English” (1999-490), and this noticeably contrasts with the social saliency of
() (see 5.5.2 below).
However, even though it seems each location attributes different symbolic values to ()
and (), both islands were shown to have increased levels of // glide-fronting between
old and middle aged speaker groups, with middle aged females having greater levels of
glide-fronting on both islands. Yet, despite this feature being on the increase, it seems
that this fronted glide is restricted to closed syllables with both Ocracoke and Smith
Island speakers preferring back-gliding variants in word-final position (for example, [nau]
now).
Once again, these studies demonstrate the influence of social attitudes on sociolinguistic
variation. However, these studies also demonstrate how the same variable may be subject
13
Once again, // will be used instead of /aw/ and // in place of /ay/ when referring to these works in
order to maintain consistency.

76
to contrasting social evaluations in different communities. In addition, the data
demonstrate how an almost allophonic distribution of variants may be found according to
phonological environment. This was also noted for Martha’s Vineyard above and it may
suggest that, in insular communities where there is increasing contact between dialect
varieties, these types of allophonic alternations may arise as a result of phonological re-
allocation (see Chapter 9 for a more in-depth discussion of this point).
3.2.3.3
The Falkland Islands
The Falkland Islands are situated in the South Atlantic Ocean with the British laying
claim to them in 1690. Sudbury (2000), Sudbury and Britain (2000) and Britain and
Sudbury 2010) note that colonisation of the Falklands contrasts with other colonial events
across the English speaking world, in that there was no indigenous population with which
the settlers could have contact. Thus, the original colonising population (consisting of
predominantly British nationals) had little contact with other language forms14
during the
initial settling period.
Across the nineteenth and twentieth centuries, sporadic immigration from areas across
South America, Scandinavia and the British Isles resulted in a population peak of 2,400
island residents in 1931. However, many of those coming to the islands did not become
permanently established there and thus the Island population was transient and in a state
of fluctuation. Sudbury goes on to note that, even though the population and economy
declined dramatically following the Second World War, the modern population consists
of only 60% ‘native’ Islanders. The remaining population consists of 30% British
14
Although Sudbury notes that a small proportion of early settlers were from Northern Europe
77
residents with the remaining 10% being made up from a diverse mixture of Europeans,
Americans and Asians (Sudbury 2000; Sudbury and Britain 2000; Britain and Sudbury
2010).
With respect to /a/, Sudbury (2000) notes that it is unlikely that the range of early
Falkland settlers (mainly from the West Country and Scotland) would have brought
diphthongs with open nuclei and that the main variants would have been those with mid-
central and mid-front nuclei qualities.
The subsequent analysis of Falkland Island English (FIE) resulted in 4695 tokens of (a),
which were elicited through casual, unstructured sociolinguistic interviews. From these
tokens, diphthongs with onset qualities of [a ~ ~ ] were found as well as degrees of
offglide weakening15
, the latter being a characteristic of other Southern Hemisphere
Englishes. The analysis of onset quality revealed fewer diphthongs with open nuclei were
produced before voiceless consonants, suggesting a Canadian Raising type pattern.
However, Sudbury notes that “this allophonic patterning is less striking than in other
varieties” (2000:275) and highlights significant variation across the behaviour of FIE
speakers. This subtle allophonic pattern may reflect the natural direction of change from
half-open to open nuclei in this dialect. Trudgill (1986) notes that the Canadian Raising
pattern may result from a natural re-allocation of variants during dialect contact and
language change and thus, the observations made with respect to the Falklands data
resembles that of the Mersea Island analysis (See Chapter 9 for further details).
15
Sudbury (2000) distinguishes between a full [u] offglide, a weakened [V] offglide and a monophthong
[V:]
78
With respect to the quality of the offglide, Sudbury found that younger speakers were
more prone to glide weakening, indicating a change towards the weakened
monophthongal forms, and that females seemed to be leading this change away from
diphthongal forms. However, Sudbury does note that the “overall scores are very similar
between groups” (2000:277). Even though the levels of glide weakening and
monophthongisation of () are more frequent in the younger speakers, there is no
parallel behaviour in the offglide of () in Falkland Island English (see section 5.5.3
below for a description of this variable). This suggests that either () is more susceptible
to these weakening processes or that, if monophthongisation is a continuation of
developments to the diphthong, changes to () are more advanced than those relating to
().
3.2.3.4
St Helena
English on the island of St Helena, in the South Atlantic Ocean, can be traced to 1658
when it was colonised by the East India Company. Schreier (2008; 2010a) demonstrates
that the island’s population has undergone extensive language contact and ethnic mixing.
The founding community represented Europeans from England and France as well as
West Africans, Indians and Madagascans. Schreier goes on to show how this population
was also socially diverse, featuring a mixture of soldiers, planters’ servants and slaves
brought by the East India Company and that, although not much is known about the
nature of the British settlers, “many – if not most – of them came from Southern, perhaps
South-eastern England” (Schreier 2010a:225). In addition, it seems likely these British
settlers represented those from the working classes.
79
Travel to and from the island is incredibly restricted and, even though the population in
2010 was recorded as approximately 4,000 (Schreier 2010a), this is a significant
reduction from the population recorded a decade before. This is due to around 30 per
cent of the population leaving St Helena once the United Kingdom granted the islanders
full citizenship rights.
After integrating himself successfully in the community and establishing substantial
network ties, Schreier collected a corpus of 33 informants ranging across the regions of
the island. From this corpus, 20 informants born between 1911 and 1940 were selected,
equally representing both genders (Schreier 2008:162-163). Though there is no
indication of early forms of the // diphthong, the modern analysis of () resulted in the
observation of [ ~ ~ ] as the most usual pronunciations across the islanders
(Schreier 2008; 2010a). Even though there was no apparent Canadian Raising pattern (as
observed for the /a/ diphthong, see 5.5.4 below), Schreier observed a distinction between
the behaviour of some function words and lexical words. Indeed, the backed // quality
of the diphthong nucleus was noted for the function words out and about, while the
nucleus for lexical words tended to be more fronted (but not so fronted that it encroached
on the vowels // and //).
In addition, in contrast to the behaviour of Falkland Island English (see above), glide
weakening of St Helena is reported by Schreier to be uncommon in the speech of his
informants. Thus, full diphthong offglides are maintained.
The lack of contact with outsider varieties in recent history may account for the lack of
Canadian Raising type patterns for this variable. However, it may also be the case that a
80
change towards [] has been completed and the allophonic distribution was only
temporary and, thus, has been lost from the dialect (compare this with the behaviour of
() in 5.5.4 below).
3.2.3.5
Tristan da Cunha
Situated in the South Atlantic (south of St Helena and west of Cape Town, South Africa),
Schreier notes that, as of June 2008, the variety known as Tristan da Cunha English
(TdCE) is spoken by a community of only 278 speakers (Schreier 2010b:245). The
development of TdCE began in the 1820s and the initial mix incorporated many varieties
across the British Isles, Northeast United States, South Africa and St Helena and present
day speakers are monolingual with respect to the TdCE variety (though Schreier notes
that there are occasional borrowings from Afrikaans (2010b:245)).
With respect to significant historical events, in the autumn of 1961, volcanic activity on
the island forced a mass evacuation. However, these evacuees, who were mainly based in
Southampton (UK), returned home from England in 1963, but this two-year break
encouraged the modernisation and adoption of Western culture by the islanders. Social
stability has since then returned and Schreier observes that prolonged or permanent out-
migration is rare (2010b:248).
With respect to variation of //, Schreier writes that the most usual pronunciations are of
[ ~ ] qualities and that there is no evidence of Canadian Raising patterns for this
diphthong. Indeed, Schreier notes that since neither TdCE nor St Helena English (StHE)
exhibit Canadian Raising patterns for //, but do for //, this is evidence of the influence
81
that StHE had on the historical formation of TdCE (2010b:230). Thus, in a similar
fashion to St Helena, it may be the high degree of isolation which is preserving the
Canadian Raising type pattern of (), rather than allowing the change to complete as it
may have done for ().
3.3
Summary
This section has discussed the historical variation and derivation of the variable (). We
have seen that present-day // derives from Middle English /u:/, as a result of
developments associated with the Great Vowel Shift. Even though the path of //’s
development appears uncertain and controversial, historical evidence from Essex seems
to support Britain’s (2008) proposal of earlier fronting towards [] before lowering to
[] occurred.
With respect to more modern sociolinguistic studies, it has been observed that ()
variation can include a range between diphthongs which have a half-open [] nucleus
(generally those representing older, more traditional pronunciations), and a lowered [a] or
lowered and backed [] nucleus (which are generally more innovative, modern variants).
These qualities also reflect a similar range of monophthongal vowel variants. It has also
been observed, through international island studies, that the saliency of () variation can
be associated with social attitudes, which may have a direct influence on the pattern of
both intra and inter-speaker variation. We have seen that the direction of change from
some of these international studies reflect the trajectory of [] to [a] nuclei in South-
eastern British Englishes despite having quite contrasting socio-demographic histories.
Finally, these studies have also demonstrated that Canadian Raising patterns are

82
uncommon with respect to () variation, although other variation patterns, such as
variation between lexical and functional words (St Helena) and variation according to
syllable structure (Ocracoke and Smith Island), have been noted.
83
Chapter 4
() - An Analysis of Social and
Linguistic Factors
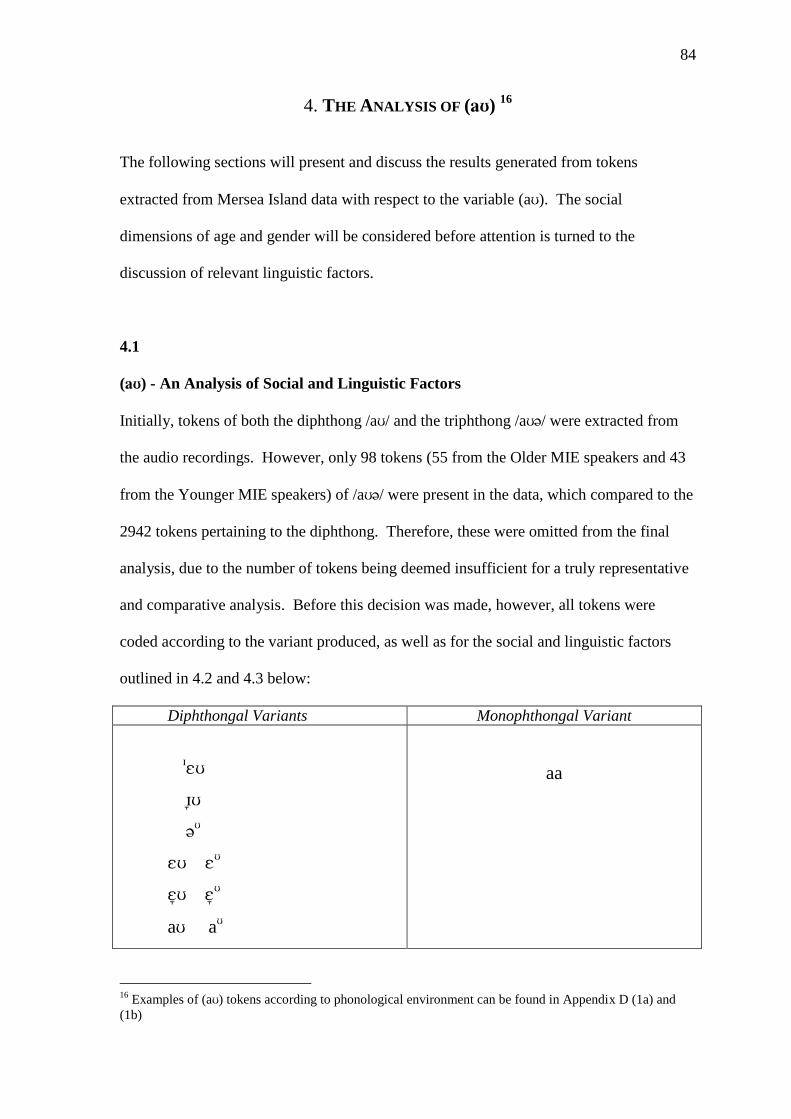
84
4. THE ANALYSIS OF () 16
The following sections will present and discuss the results generated from tokens
extracted from Mersea Island data with respect to the variable (a). The social
dimensions of age and gender will be considered before attention is turned to the
discussion of relevant linguistic factors.
4.1
() - An Analysis of Social and Linguistic Factors
Initially, tokens of both the diphthong /a/ and the triphthong /a/ were extracted from
the audio recordings. However, only 98 tokens (55 from the Older MIE speakers and 43
from the Younger MIE speakers) of /a/ were present in the data, which compared to the
2942 tokens pertaining to the diphthong. Therefore, these were omitted from the final
analysis, due to the number of tokens being deemed insufficient for a truly representative
and comparative analysis. Before this decision was made, however, all tokens were
coded according to the variant produced, as well as for the social and linguistic factors
outlined in 4.2 and 4.3 below:
Diphthongal Variants Monophthongal Variant
a a
aa
16
Examples of (a) tokens according to phonological environment can be found in Appendix D (1a) and
(1b)
85
As previously described, age was categorised according to whether the data was from the
museum archive or from sociolinguistic interviews of Older and Younger Islanders
carried out on the island of Mersea in 2006 and 2007. As the table above shows, there
was little variation in the quality of the diphthongal offglide. Therefore, due to the
complexity of the variant spread, the majority of this analysis will focus upon percentages
relating to variation regarding the diphthongal nucleus types:
- type
- type
- type
- type
a - type
aa - type
The notation ‘aa’ will be used to represent the monophthongal variant which is more
typically represented as [a:] so that it is distinguishable from diphthongs with an [a] type
nucleus. This notation will also help the examination of the monophthongal variants in
Chapter 10, since it allows for a quality to be assigned to each timing-tier slot.
4.2
Social Factors
This section will outline the results pertaining to (a) with respect to the social factors of
age and gender.
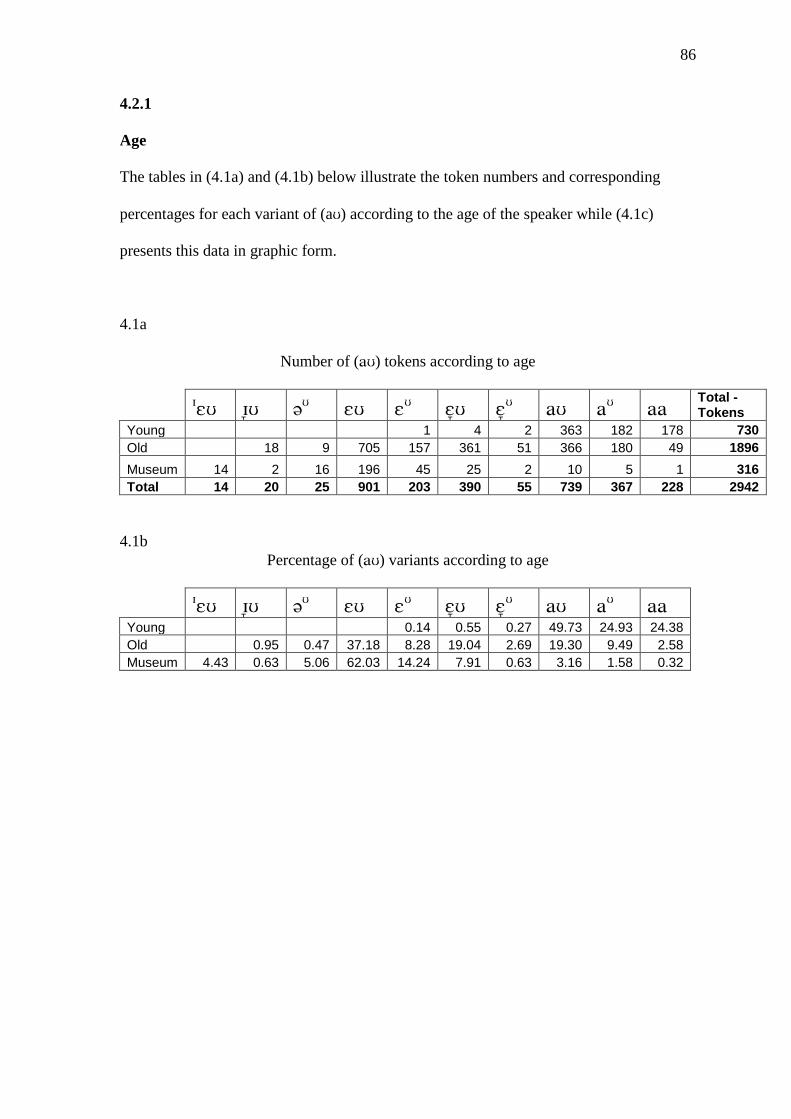
86
4.2.1
Age
The tables in (4.1a) and (4.1b) below illustrate the token numbers and corresponding
percentages for each variant of (a) according to the age of the speaker while (4.1c)
presents this data in graphic form.
4.1a
Number of () tokens according to age
Total - Tokens
Young 1 4 2 363 182 178 730
Old 18 9 705 157 361 51 366 180 49 1896
Museum 14 2 16 196 45 25 2 10 5 1 316
Total 14 20 25 901 203 390 55 739 367 228 2942
4.1b
Percentage of () variants according to age
Young 0.14 0.55 0.27 49.73 24.93 24.38
Old 0.95 0.47 37.18 8.28 19.04 2.69 19.30 9.49 2.58
Museum 4.43 0.63 5.06 62.03 14.24 7.91 0.63 3.16 1.58 0.32
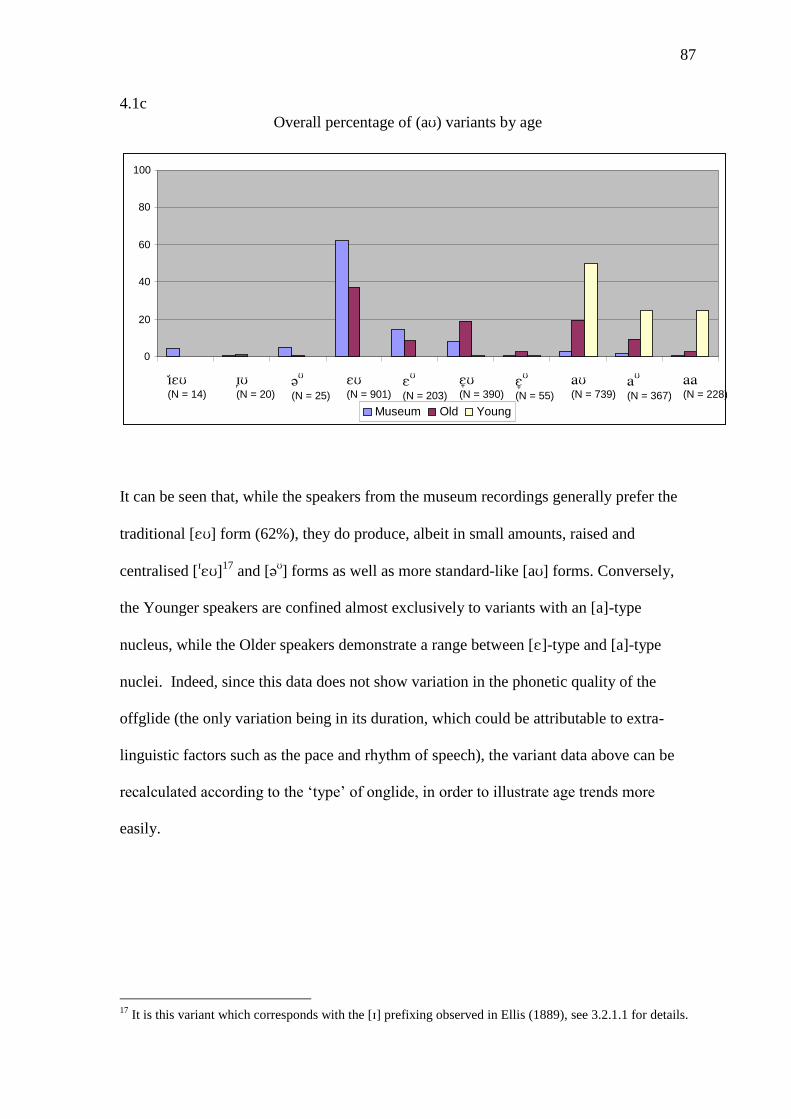
87
4.1c
Overall percentage of (a) variants by age
It can be seen that, while the speakers from the museum recordings generally prefer the
traditional [] form (62%), they do produce, albeit in small amounts, raised and
centralised []
17 and [
] forms as well as more standard-like [a] forms. Conversely,
the Younger speakers are confined almost exclusively to variants with an [a]-type
nucleus, while the Older speakers demonstrate a range between []-type and [a]-type
nuclei. Indeed, since this data does not show variation in the phonetic quality of the
offglide (the only variation being in its duration, which could be attributable to extra-
linguistic factors such as the pace and rhythm of speech), the variant data above can be
recalculated according to the ‘type’ of onglide, in order to illustrate age trends more
easily.
17
It is this variant which corresponds with the [] prefixing observed in Ellis (1889), see 3.2.1.1 for details.
0
20
40
60
80
100
(N = 14)
(N = 20)
(N = 25)
(N = 901)
(N = 203)
(N = 390)
(N = 55)
(N = 739)
(N = 367)
(N = 228)
Museum Old Young
88
4.2a
Number of () tokens according diphthong type and age
Total
Museum 16 16 241 27 15 1 316
Old 18 9 862 412 546 49 1896
Young 1 6 545 178 730
Total 34 25 1104 445 1106 228 2942
4.2b
Percentage of () variants according to diphthong type and age
Museum 5.06 5.06 76.27 8.54 4.75 0.32
Old 0.95 0.47 45.46 21.73 28.80 2.58
Young 0.14 0.82 74.66 24.38
4.2c
Overall percentage of (a) variant by age
Thus, the transitional nature of the Older speakers from more traditional variants (used
mainly by the Museum speakers) on the left of the graph to more innovative variants
(used by the Younger speakers) on the right is now clearer to see. The above data also
0
20
40
60
80
100
(N = 34)
(N = 25)
(N = 1104)
(N = 445)
(N = 1106)
(N = 228)
Museum Old Young
89
demonstrate a transition from [] to []- type diphthongs in the speech of the Museum
speakers, as opposed to a shift from [] to [a]- type variants, which would be predicted by
the models outlined in figures 3.1 and 3.2 in the previous chapter.
It can be suggested that the extent of the variation demonstrated by the Older speakers
marks or highlights the generational period in which the change from []-type to [a]-type
variants was at its most prolific. Indeed, the period in which these speakers were growing
up coincides with periods of sharp demographic change (see Chapter 1 for a discussion on
the changes to the Island’s demographic structure).
4.2.2
Age and Gender
Unlike the Older and Younger speaker groups, the only suitable speakers for analysis
from the museum recordings were male. Therefore, the variant patterning of this speaker
group is akin to the data which have already been presented in both 4.1 and 4.2 above.
However, for ease of comparison, this data set is repeated below.
90
4.3
Percentage of (a) variants according to age and gender
Once again, the range of variation produced by the Older speakers can be seen to be
demonstrated by both genders. However, the data show that, while there is little
difference between the Older females’ use of traditional []-types and Standard English
[a]-types, the males clearly prefer the former. Another observation that can be made with
respect to the Older speakers’ data is that, not only do these females seem more advanced
than the males in the change from []-types to [a]-types, but they also demonstrate a
greater use of the monophthong than the males (35 tokens, 4%, as opposed to 14 tokens,
1%, respectively).
However, this is not the case when we consider the Younger generation. The graph in 4.3
illustrates how the young males, now almost completely employing [a]-type variants, are
favouring the monophthong more than the females (105 tokens, 29%, versus 73 tokens,
20%, respectively) while females are, once again, favouring more standard-like [a]-types.
0
20
40
60
80
100
Male (N = 367)
Female (N = 363)
Male (N = 1036)
Female (N = 860)
Male (N = 316)
Young Old Museum
91
This may suggest that, while [a] is being developed as a supralocal form (as opposed to
a simple assimilation to the Standard variety), the monophthong is being treated and
adopted as a vernacular variant, which is not necessarily a continuation or progression of
the [a] variant.
With respect to group affiliation, sociolinguistic research (such as Trudgill (1974)) has
shown that males will tend to show greater use of vernacular forms regarding stable
variants. However, it has also been shown that females seem “to initiate changes above
the level of social awareness [and that] such changes tend to be in the direction of prestige
norms” (Coates 2004:185). Thus, one possible interpretation of the Mersea data is that
the change from [] to [a] is above the level of social consciousness and, therefore,
females of both Younger and Older groups gravitate towards and select the [a] variant
(indeed, it could be suggested that it is the Older females who are leading this change
from [])18
. Conversely, the males of these respective generations retain the non-
standard, traditional [] variant and lag behind in the change towards [a] until it is
established within the community. Once the shift has established itself and become
stabilised, however, the males then re-orientate themselves towards another non-standard
variant with which they can affiliate (see Chapter 9 for a discussion of the variation and
change on Mersea Island with respect to all three variables under analysis).
18
See Chapter 9.3 below for a discussion of this as a change relating to dialect supralocalisation.
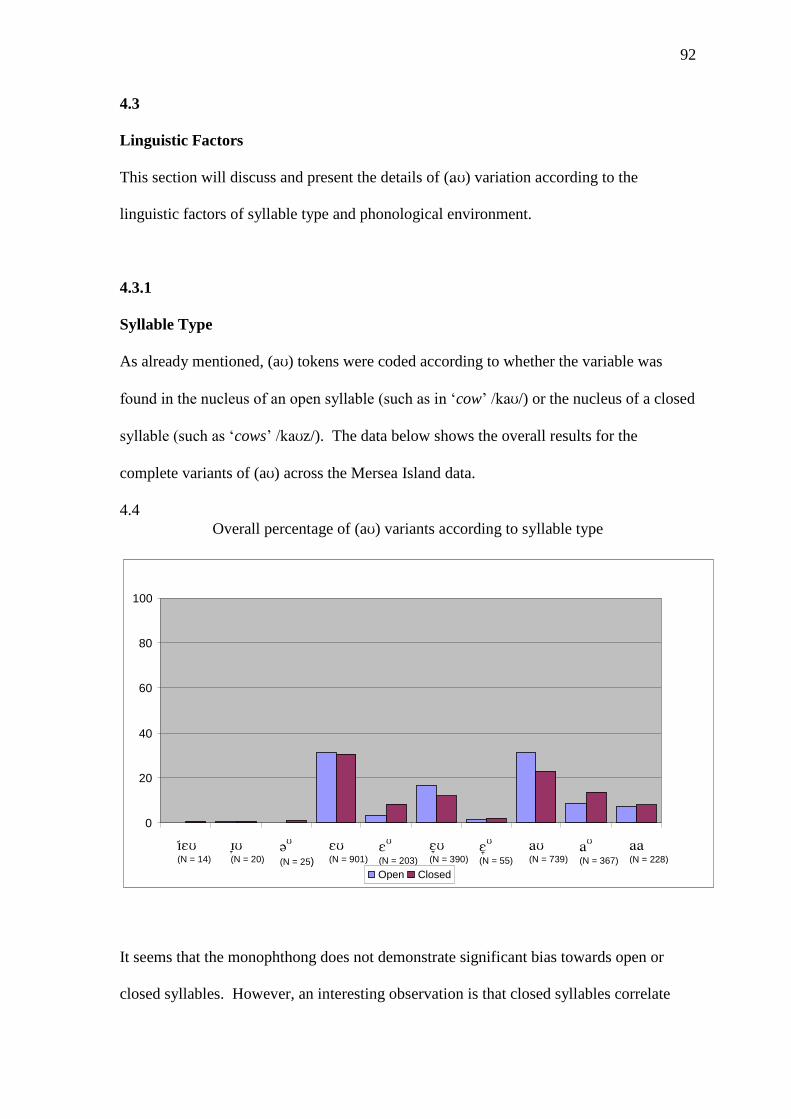
92
4.3
Linguistic Factors
This section will discuss and present the details of () variation according to the
linguistic factors of syllable type and phonological environment.
4.3.1
Syllable Type
As already mentioned, (a) tokens were coded according to whether the variable was
found in the nucleus of an open syllable (such as in ‘cow’ /ka/) or the nucleus of a closed
syllable (such as ‘cows’ /kaz/). The data below shows the overall results for the
complete variants of (a) across the Mersea Island data.
4.4
Overall percentage of (a) variants according to syllable type
It seems that the monophthong does not demonstrate significant bias towards open or
closed syllables. However, an interesting observation is that closed syllables correlate
0
20
40
60
80
100
(N = 14)
(N = 20)
(N = 25)
(N = 901)
(N = 203)
(N = 390)
(N = 55)
(N = 739)
(N = 367)
(N = 228)
Open Closed
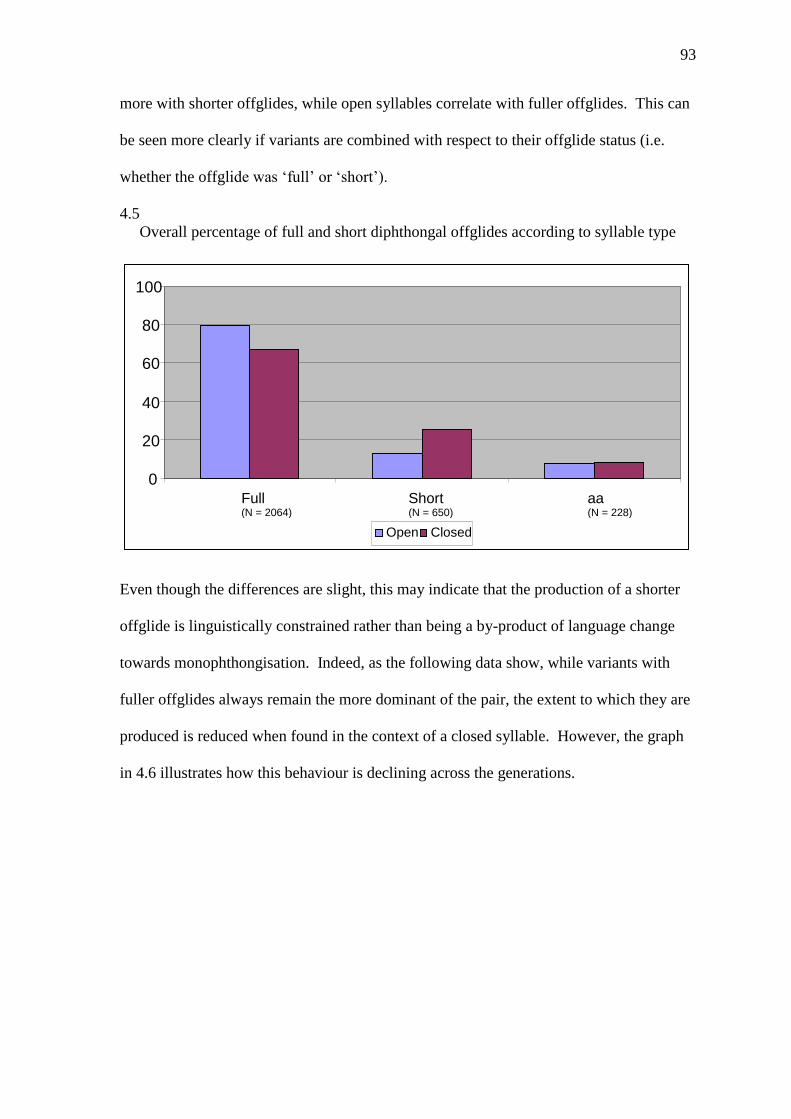
93
more with shorter offglides, while open syllables correlate with fuller offglides. This can
be seen more clearly if variants are combined with respect to their offglide status (i.e.
whether the offglide was ‘full’ or ‘short’).
4.5
Overall percentage of full and short diphthongal offglides according to syllable type
Even though the differences are slight, this may indicate that the production of a shorter
offglide is linguistically constrained rather than being a by-product of language change
towards monophthongisation. Indeed, as the following data show, while variants with
fuller offglides always remain the more dominant of the pair, the extent to which they are
produced is reduced when found in the context of a closed syllable. However, the graph
in 4.6 illustrates how this behaviour is declining across the generations.
0
20
40
60
80
100
Full (N = 2064)
Short (N = 650)
aa (N = 228)
Open Closed
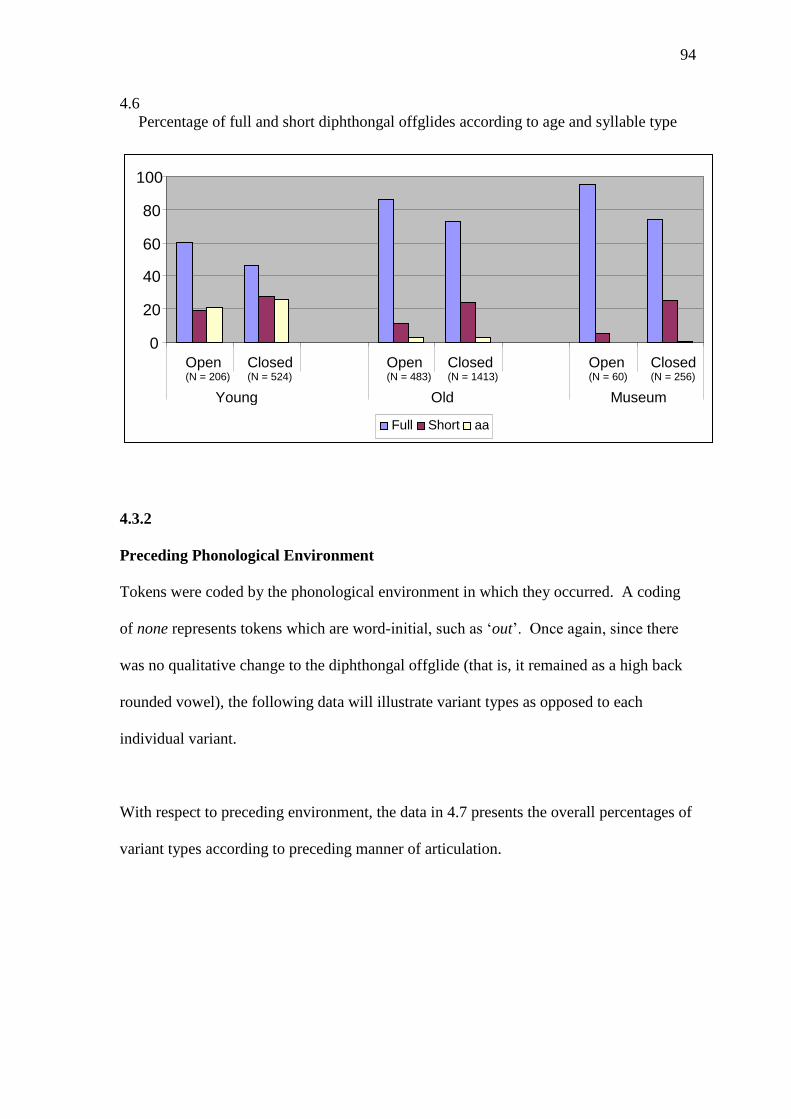
94
4.6
Percentage of full and short diphthongal offglides according to age and syllable type
4.3.2
Preceding Phonological Environment
Tokens were coded by the phonological environment in which they occurred. A coding
of none represents tokens which are word-initial, such as ‘out’. Once again, since there
was no qualitative change to the diphthongal offglide (that is, it remained as a high back
rounded vowel), the following data will illustrate variant types as opposed to each
individual variant.
With respect to preceding environment, the data in 4.7 presents the overall percentages of
variant types according to preceding manner of articulation.
0
20
40
60
80
100
Open (N = 206)
Closed (N = 524)
Open (N = 483)
Closed (N = 1413)
Open (N = 60)
Closed (N = 256)
Young Old Museum
Full Short aa
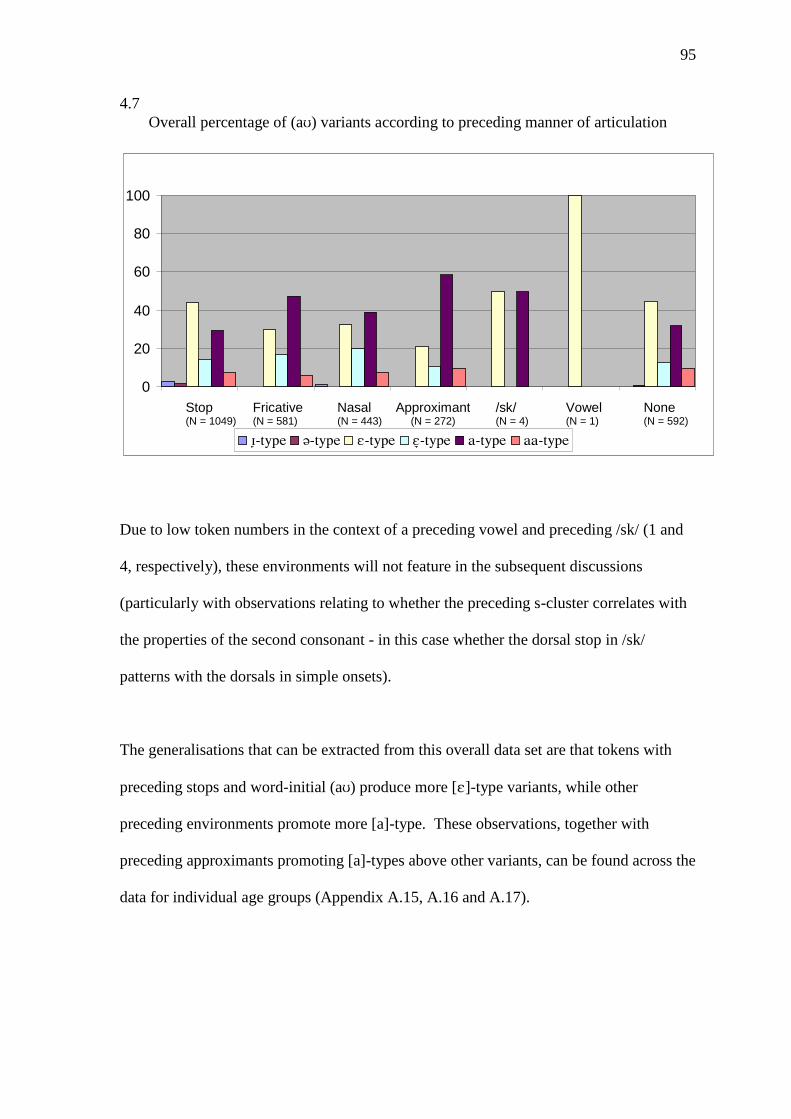
95
4.7
Overall percentage of (a) variants according to preceding manner of articulation
Due to low token numbers in the context of a preceding vowel and preceding /sk/ (1 and
4, respectively), these environments will not feature in the subsequent discussions
(particularly with observations relating to whether the preceding s-cluster correlates with
the properties of the second consonant - in this case whether the dorsal stop in /sk/
patterns with the dorsals in simple onsets).
The generalisations that can be extracted from this overall data set are that tokens with
preceding stops and word-initial (a) produce more []-type variants, while other
preceding environments promote more [a]-type. These observations, together with
preceding approximants promoting [a]-types above other variants, can be found across the
data for individual age groups (Appendix A.15, A.16 and A.17).
0
20
40
60
80
100
Stop (N = 1049)
Fricative (N = 581)
Nasal (N = 443)
Approximant (N = 272)
/sk/ (N = 4)
Vowel (N = 1)
None (N = 592)
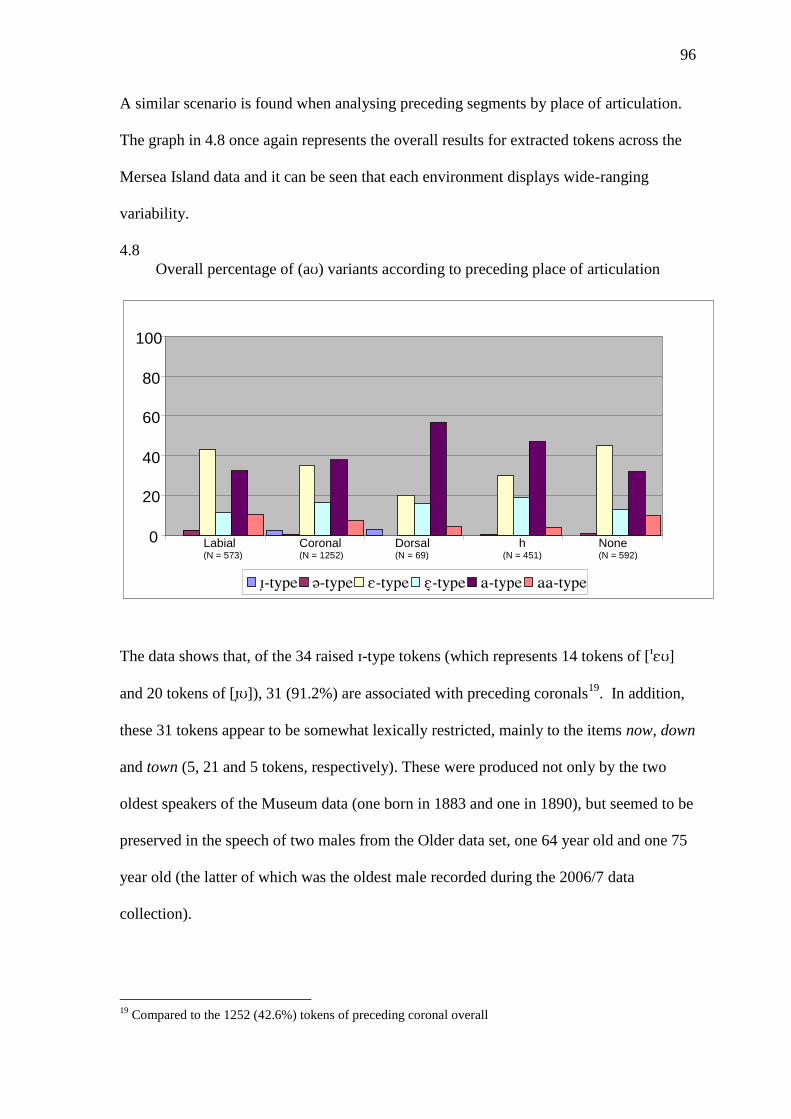
96
A similar scenario is found when analysing preceding segments by place of articulation.
The graph in 4.8 once again represents the overall results for extracted tokens across the
Mersea Island data and it can be seen that each environment displays wide-ranging
variability.
4.8
Overall percentage of (a) variants according to preceding place of articulation
The data shows that, of the 34 raised -type tokens (which represents 14 tokens of []
and 20 tokens of []), 31 (91.2%) are associated with preceding coronals19
. In addition,
these 31 tokens appear to be somewhat lexically restricted, mainly to the items now, down
and town (5, 21 and 5 tokens, respectively). These were produced not only by the two
oldest speakers of the Museum data (one born in 1883 and one in 1890), but seemed to be
preserved in the speech of two males from the Older data set, one 64 year old and one 75
year old (the latter of which was the oldest male recorded during the 2006/7 data
collection).
19
Compared to the 1252 (42.6%) tokens of preceding coronal overall
0
20
40
60
80
100
Labial (N = 573)
Coronal (N = 1252)
Dorsal (N = 69)
h (N = 451)
None (N = 592)
97
Another interesting observation is that, even though it is the source of the fewest tokens,
the most outstanding environment is that of preceding dorsals, which seem to prompt
more [a]-type articulations when compared to the behaviour of the other environments,
and this trend is repeated in the Museum and Older data sets (see Appendix A.18 and
A.19). Indeed, the preceding dorsal environment is the one of least stability in the
Museum data and the only environment which favours [a]-type variants above []-type
variants in the Older speakers’ data (55.6% for [a]-type variants compared to 22.2% for
[]-type variants).
One possible motivation for this dorsal pattern is that, as the tongue retracts towards the
back of the mouth in order to make the necessary closure at the velum, it is in a low
position when it comes to making the following vowel articulation. Therefore, it would
require more time and effort on the part of the speaker to front and raise the tongue
towards the [] target area and, since there is no phonemic distinction between [] and
[a] which would require greater articulatory precision, the articulation of [a]-types is
favoured. Thus, the patterning of the data suggests that, this phonological environment
could have been the environment which helped promote and encourage the change from
[] to [a].
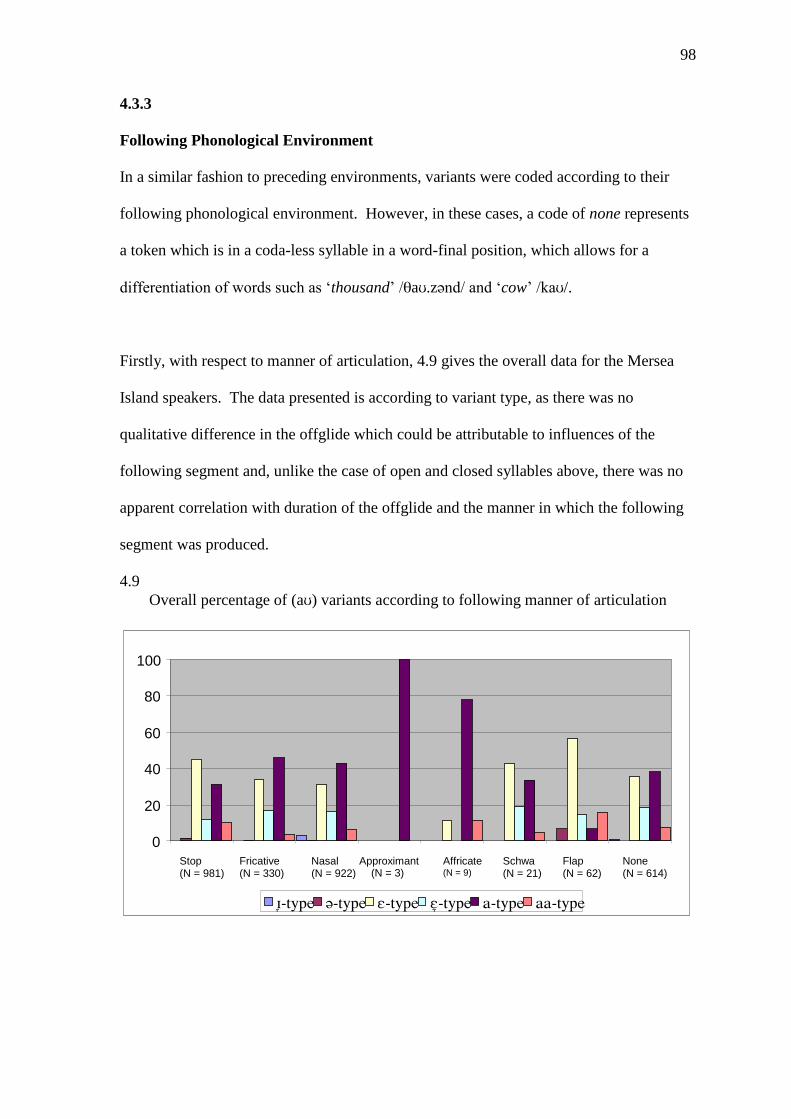
98
4.3.3
Following Phonological Environment
In a similar fashion to preceding environments, variants were coded according to their
following phonological environment. However, in these cases, a code of none represents
a token which is in a coda-less syllable in a word-final position, which allows for a
differentiation of words such as ‘thousand’ /a.znd/ and ‘cow’ /ka/.
Firstly, with respect to manner of articulation, 4.9 gives the overall data for the Mersea
Island speakers. The data presented is according to variant type, as there was no
qualitative difference in the offglide which could be attributable to influences of the
following segment and, unlike the case of open and closed syllables above, there was no
apparent correlation with duration of the offglide and the manner in which the following
segment was produced.
4.9
Overall percentage of (a) variants according to following manner of articulation
0
20
40
60
80
100
Stop (N = 981)
Fricative (N = 330)
Nasal (N = 922)
Approximant (N = 3)
Affricate (N = 9)
Schwa (N = 21)
Flap (N = 62)
None (N = 614)
99
It seems that, overall, only following stops, flaps and schwa correlate with higher
proportions of []-types as opposed to [a]-types (the latter data of which were made up of
the tokens ‘now-a-days’, ‘allowance’ and the surname ‘Haward(s)’). However, this
pattern is not generally reflected by the individual age groups (see Appendix A.21, A.22
and A.23).
In a similar fashion to following manner of articulation, following place of articulation
does not seem to have any significant effect on the duration of the offglide, except in the
case of following labials. It has already been noted (in 2.3.1.2.1 above) that the
distribution of (a) is heavily restricted in mono-morphemes so that it, generally, does not
occur before non-coronals. Therefore, the data set representing following labials below
(which promote [a]-type variants more than any other environment) is primarily from
complex words (such as endowment, ploughman and allowing, the latter coded as
following [w], due to the presence of the labial glide acting as a prominent hiatus
breaker). However, this category does also include 6 tokens with following /f/s. The
source of these tokens comes from th-fronted tokens of south [saf], which breaks the
requirement for only tauto-syllabic coronals.
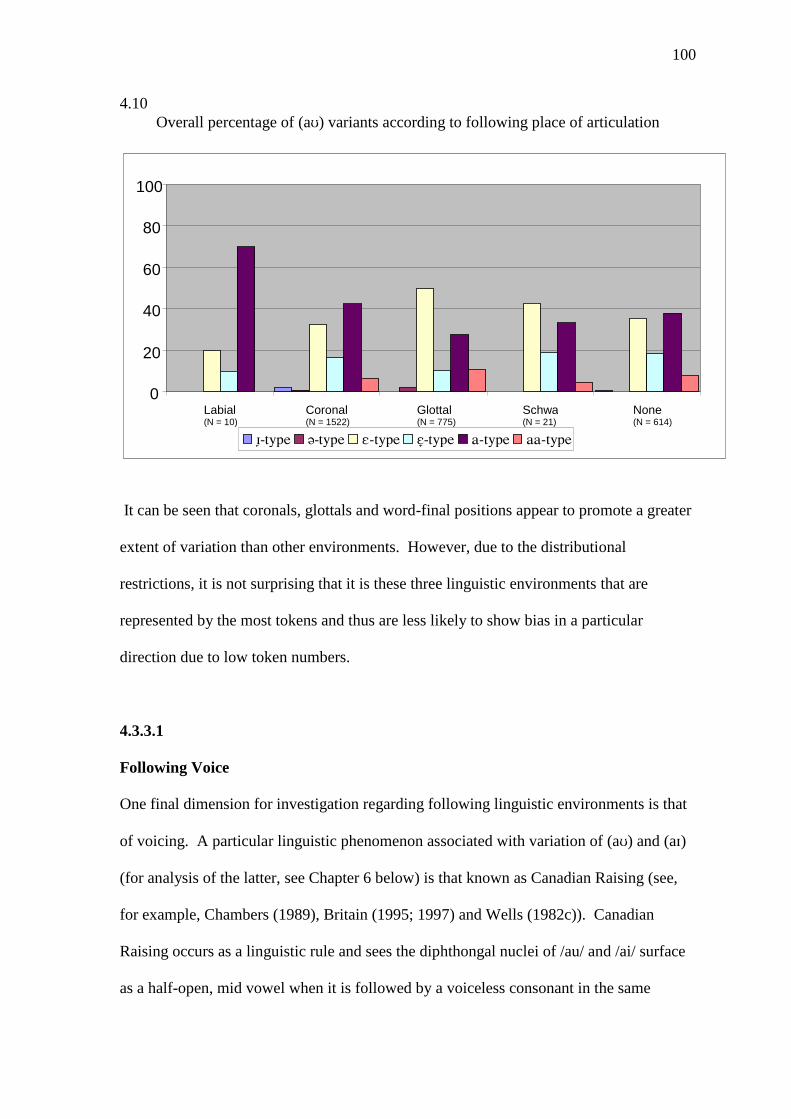
100
4.10
Overall percentage of (a) variants according to following place of articulation
It can be seen that coronals, glottals and word-final positions appear to promote a greater
extent of variation than other environments. However, due to the distributional
restrictions, it is not surprising that it is these three linguistic environments that are
represented by the most tokens and thus are less likely to show bias in a particular
direction due to low token numbers.
4.3.3.1
Following Voice
One final dimension for investigation regarding following linguistic environments is that
of voicing. A particular linguistic phenomenon associated with variation of (a) and (a)
(for analysis of the latter, see Chapter 6 below) is that known as Canadian Raising (see,
for example, Chambers (1989), Britain (1995; 1997) and Wells (1982c)). Canadian
Raising occurs as a linguistic rule and sees the diphthongal nuclei of /au/ and /ai/ surface
as a half-open, mid vowel when it is followed by a voiceless consonant in the same
0
20
40
60
80
100
Labial (N = 10)
Coronal (N = 1522)
Glottal (N = 775)
Schwa (N = 21)
None (N = 614)

101
syllable. Thus, pairs of words such as out [t]~ loud [ld] and house [hs] ~ houses
[hzz] (Wells 1982c:494) are derived.
The data in 4.11 present the overall percentages for Mersea Island speech. The pattern
which emerges, albeit slight, illustrates that more raised variants were produced in the
context of preceding voiceless consonants and a greater degree of lowered variants were
produced before voiced consonants. With respect to word-final (a), the Canadian
Raising literature suggests that this should pattern like those tokens with a following
voiced consonant. The separation of these three contexts shows that the expected pattern
is found in the Mersea speakers’ overall data.
4.11
Overall percentage of (a) variants according to the voicing of the following segment
This scenario is replicated by the Older speakers’ data (4.13), in which the data show a
slight correlation between []-types preceding voiceless consonants and [a]-types
preceding voiced consonants, while the Museum data in (4.12) shows that, even though
0
20
40
60
80
100
(N = 34)
(N = 25)
(N = 1104)
(N = 445)
(N = 1106)
(N = 228)
Voiced Voiceless None

102
[]-types produce the most tokens, lowered [a]-types are greater before voiced
consonants. However, these patterns are lost in the data from Younger speakers (4.14)
since there are only 7 tokens of raised [] or slightly raised [] types.
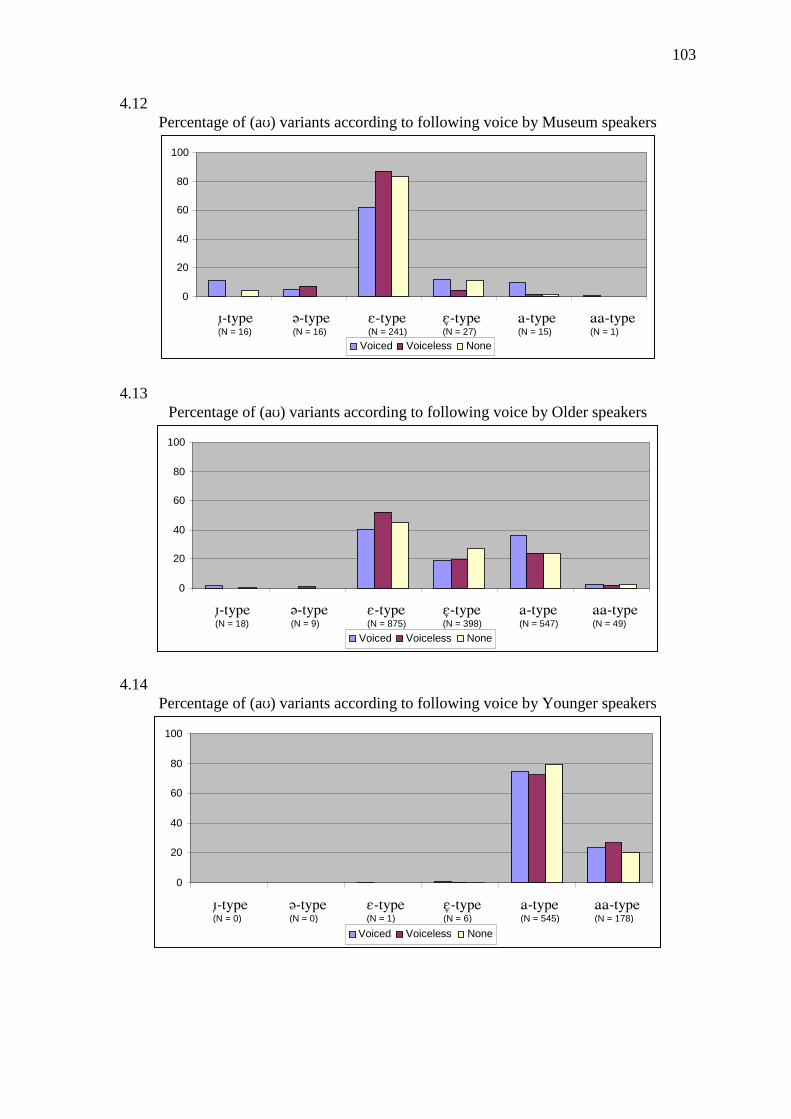
103
4.12
Percentage of (a) variants according to following voice by Museum speakers
4.13
Percentage of (a) variants according to following voice by Older speakers
4.14
Percentage of (a) variants according to following voice by Younger speakers
0
20
40
60
80
100
(N = 16)
(N = 16)
(N = 241)
(N = 27)
(N = 15)
(N = 1)
Voiced Voiceless None
0
20
40
60
80
100
(N = 18)
(N = 9)
(N = 875)
(N = 398)
(N = 547)
(N = 49)
Voiced Voiceless None
0
20
40
60
80
100
(N = 0)
(N = 0)
(N = 1)
(N = 6)
(N = 545)
(N = 178)
Voiced Voiceless None

104
It was noted previously in the analysis of (a) that, with respect to following manner of
articulation, nasals appear to promote [a]-type variants and that flaps display the greatest
range of variants and correlate with monophthongisation, particularly in Younger
speakers. Both of these environments share the feature [+VOICE] which is consistent with
the finding that following voiced consonants attract [a]-type variation. Thus, we can
propose that, whereas preceding dorsals appear to lead the change from [] to [a], with
respect to following environments, it is voiced consonants (in particular, nasals) which
recognise or promote [a] and following flaps which are leading in the subsequent change
to the monophthong.
4.4
Summary
This section has presented results from the analysis of () in the data from Mersea Island
English. It has shown that there has been a change from the more traditional []-type
diphthongs towards more open [a]-type diphthongs. This transition is illustrated nicely
by the spread and use of variants (particularly the intermediate []-type diphthongs) by
the Older speakers. However, regarding the Older speakers, it seems that it is the Older
males who are retaining the traditional variants to a greater extent than females (this is in
keeping with the results for (a) but contrast with the behaviour of this group regarding
the () variable, see Chapter 8 below). With respect to the Younger speakers, the males
exhibit a higher percentage of monophthongal variants, but the overall level of this
variant is relatively small, indicating that it has not yet taken a hold within the speech
community.
105
The analysis of linguistic factors shows that a full diphthongal offglide correlates with
open syllables while shorter offglides are favoured more by closed syllables. In addition,
with respect to phonological environments, it has been seen that word-initial (a),
preceding stops and preceding labials are the highest retainers of traditional []-type
diphthongs. Conversely, preceding dorsals have a greater correlation with the lower, more
open [a]-type diphthongs and therefore may be one of the phonological environments
leading the change to [a]
Finally, an analysis of following voice has shown that a pattern similar to that of
Canadian Raising can be found in the Mersea data. Thus, raised diphthongal nuclei had a
higher percentage of occurrence when preceding voiceless consonants and lower, more
open nuclei were found to correlate more with all other environments. However, even
though such a pattern is evident in the data relating to the Museum and Older speakers,
this pattern no longer exists in the speech of the Younger informants. Instead, we can see
that it is following voiceless consonants which cause more monophthongs to surface
while diphthongs have a slightly stronger correlation with all other environments.
106
Chapter 5
The Historical Derivation and
Variation of the Variable (a)

107
5.THE HISTORICAL DERIVATION AND VARIATION OF THE VARIABLE (a)
This section will examine and discuss the historical derivations of the diphthong // by
initially identifying its source phoneme in Middle English before examining historical
dialect evidence relating specifically to the dialect varieties of Essex and East Anglia.
5.1
Historical Sources
The variable (), which occurs in both open and closed syllables, is also known, through
Wells’ (1982a) classification system, as the PRICE lexical set. It relates to the stressed
standard English // diphthong and has been, for the most part, historically derived from
Middle English /i:/ which, as a result of the Great Vowel Shift, diphthongised. However,
as with (), the direction of the developmental path from Middle English /i:/ to present
day // is the subject of academic debate and remains controversial. For example, Lass
(1987) supports the idea that, after the Great Vowel Shift, the nucleus of the newly
diphthongised /i:/ initially lowered before being centralised. Thus, with respect to the
standard dialect, the sequence of lower-centralise-lower process results in the present day
// pronunciation, while, it is argued, some dialects then backed the nucleus further
towards // or //.
108
5.1 The developmental path of /a/ following the lower-centralise-lower route (based on
Yamada (1984:61))
Conversely, it is also proposed that, after the initial diphthongisation process, the nucleus
first moved to a central position before lowering took place. This centralise-lower-lower
development is supported by, for example, Strang (1970) and Stockwell (1975), but
Yamada (1984:61, citing Anderson and Jones 1977) notes that both possibilities are
empirically supportable (however, see Ogura (1987) or Britain (1991) for a critical
evaluation of these contrasting approaches).
5.2 The developmental path of /a/ following the centralise-lower-lower route (based on
Yamada (1984:61))
109
However, it seems that, even though the route from /i:/ to // is different, the centralise-
lower-lower model still suggests that any backing towards //~// in non-standard
dialects must have occurred after // was reached, suggesting that dialects with backed or
backed and raised variants were more advanced in terms of the developmental chain, and
highly innovative compared to those which did not back the nucleus. Indeed, Stockwell
refers to these types of dialect as advanced dialects, as they have continued the chain of
development (1975:347).
Both of these approaches are incorporated into Ogura’s (1987) model which is based on
data from the SED. Ogura discovered 17 reflexes of Middle English /i:/ across the 311
locations from which she extracted data and these are linked according to the diagram
below:
5.3 The stages in Development of Middle English (from Ogura 1987:36)
One aspect that this model does have in common with those above is that backing
occurred only after an [] variant had been achieved. This is a similar observation to that
previously made with respect to () (see 3.1 above). An account of these developments
110
of backing and raising is provided by the Diphthong Shift outlined by Wells (1982a:256-
257) and, alternatively, Labov’s model of the Southern Shift (1994:208).
The processes outlined by the Diphthong Shift see the nucleus of the PRICE vowel back
and raise towards [], although Wells notes that raising may not always occur, resulting
in diphthongs of [] ~ [] qualities (1982a:257). Once the PRICE nucleus has raised to
the region of [], the CHOICE diphthong then raises to avoid a merger, resulting in
qualities such as []. Labov incorporates this in his model of the Southern Shift and he
claims that “there can be no question that the movements of [] and [] form a chain
shift and that the nuclei are rising” (1994:170).
However, Britain (2002b) observes that data from Ellis (1889) show diphthongs with
back mid-open [ ~ ] and central onsets were prolific in the Essex area. Therefore,
given that these variants were present in the nineteenth century, while the presence of [a]
forms was less frequent, we might want to suggest that the backing of the /a/ nucleus
(similar to the fronting of the /a/ nucleus discussed above) occurred a lot sooner in the
Essex dialect than the models above allow. The resulting path may, therefore, be
illustrated as follows:
111
5.4 The possible developmental path of /a/ in the Essex dialect
5.2
Variation of //
In a similar fashion to the variation of /au/ (see 3.2 above), Wells (1982a:149) observes
that there are four main types of variation with respect to the elements of this diphthong:
I. “The degree of advancement of the starting point”. For example, very back [] ~
[] nuclei “are characteristic of the urban south of England”.
– For example, in Derby, Docherty and Foulkes (1999) found standard [] was the
preferred variant for middle class speakers. However, this variant accounted for
only 30% of the working class data. Instead, the working class speakers in their
data (in particular, the working class males) produced a diphthong with a backed
[] or [] onglide. This male preference for backed [] onglides, with females
preferring more fronted [a] onglides, was also found by Stoddart et al (1999) in
their Sheffield data.
With respect to more southern varieties, data from Milton Keynes and Reading
show that [] and [] nuclei are only preserved in the oldest of speakers in the
former, while, in the latter, they are still maintained to a certain extent in the
112
speech of the younger informants (Cheshire et al (1999), Kerswill and Williams
(2000) and Williams and Kerswill (1999)).
II. “The degree of openness of the starting point”. For example, nuclei of a quality
similar to []~[]~[] are considered typical of the rural south of England.
– However, Przedlacka (2001) found [] nuclei for this diphthong surface in her
data for young Received Pronunciation (RP) speakers who attended Eton College.
Further afield, /a/ diphthongs with nucleic qualities of [] and [] have been
found in Cardiff English (Collins and Mees (1990) and Mees and Collins (1999))
and Glasgow English (Stuart-Smith (1999)).
III. “The quality of the second element”. For example, the offglide may be of an [] or
[] quality as a result of reduction caused by a longer nucleus.
– In her detailed discussion of Englishes of the Southeast, Ryfa (fc) does not
highlight any account of an /a/ diphthong surfacing with offglide qualities other
than [].
However, variation in the offglide quality may come about through glide
weakening in some varieties of English. For example, Schreier (2010b) notes that
the offglide quality of // in Tristan da Cunha English may surface as [] in
certain contexts due to glide weakening processes.
IV. “The ‘speed’ of the diphthong”. For example, ‘slow’ diphthongs with reduced
offglides or those in which monophthongisation occurs are characteristic of the American
South but may also be found in London.
– Docherty and Foulkes (1999) and Stoddart et al (1999) report diphthongs with
long nuclei leading to offglide reduction in Derby and Sheffield, respectively.
Docherty and Foulkes note that it is almost exclusively the working class females
113
who utilise [a::] while Stoddart et al show that if [a:
] surfaces, it does so for the
pronoun I.
With respect to the monophthongisation of //, these have been reported across
the South East England with qualities ranging from backed [:] and [:] in London
(Tollfree 1999) and the Fens (Britain 1991) to a more fronted [a:] in Colchester
(Ryfa 2005). Even though monophthongisation is generally associated with
working class speech, Kerswill et al (2006) show how monophthongal realisations
of // also correlate with non-Anglo males in inner London (as opposed to Anglos
in outer London or areas on the London periphery).
Wells (1982a) also notes that // is particularly sensitive to smoothing processes through
which monophthongisation takes place by adopting the phonetic characteristics of the
nucleus. This is followed by a lengthening process which creates a monophthong of that
quality. However, he particularly uses examples of the // triphthong to demonstrate
this process (such as where fire /f/ becomes [f]) and not the diphthong itself since
smoothing is only permitted in the context of a following vowel.
Other factors which can affect the realisation of this diphthong include following
phonological environment. The process of Canadian Raising, which has already been
discussed in 3.2 above with respect to /au/, sees the nucleus of // surfacing as [], for
example, in the context of a following voiceless consonant. Therefore, pairs such as tight
/tt/ and tide /td/ are created. Although it has been claimed by some that Canadian
114
Raising patterns do not occur in the United Kingdom20
(see 3.2 above), data presented by
Britain (for example, (1991; 1995; 1997)) strongly demonstrate a Canadian Raising
pattern of // in the East Anglian Fens (see below for details).
The following sections will report the findings from a range of historical and modern
dialect studies of () with particular focus upon variation in East Anglia in general before
attention is turned to data from international studies.
5.3
Historical Variation
The following section will focus on data from the selection of historical data sources as
outlined in Chapter 2.4 above.
5.3.1
Ellis (1889)
With respect to the pronunciation of items representing Middle English /i:/, Ellis notes
that common pronunciations in Essex, using the translations of Eustace (1969), would be
[], [] and []. Even though there is fairly even variation across all tokens in the Essex
word list, it is worth noting the pronunciation of the tokens lice, mice and height:
20
Though Trudgill (1986) reports that different allophones of /ai/ may be found in a part of east Yorkshire,
he also notes that the phonetic forms in the alternations bear no resemblance to those of Canadian Raising
(1986:156)
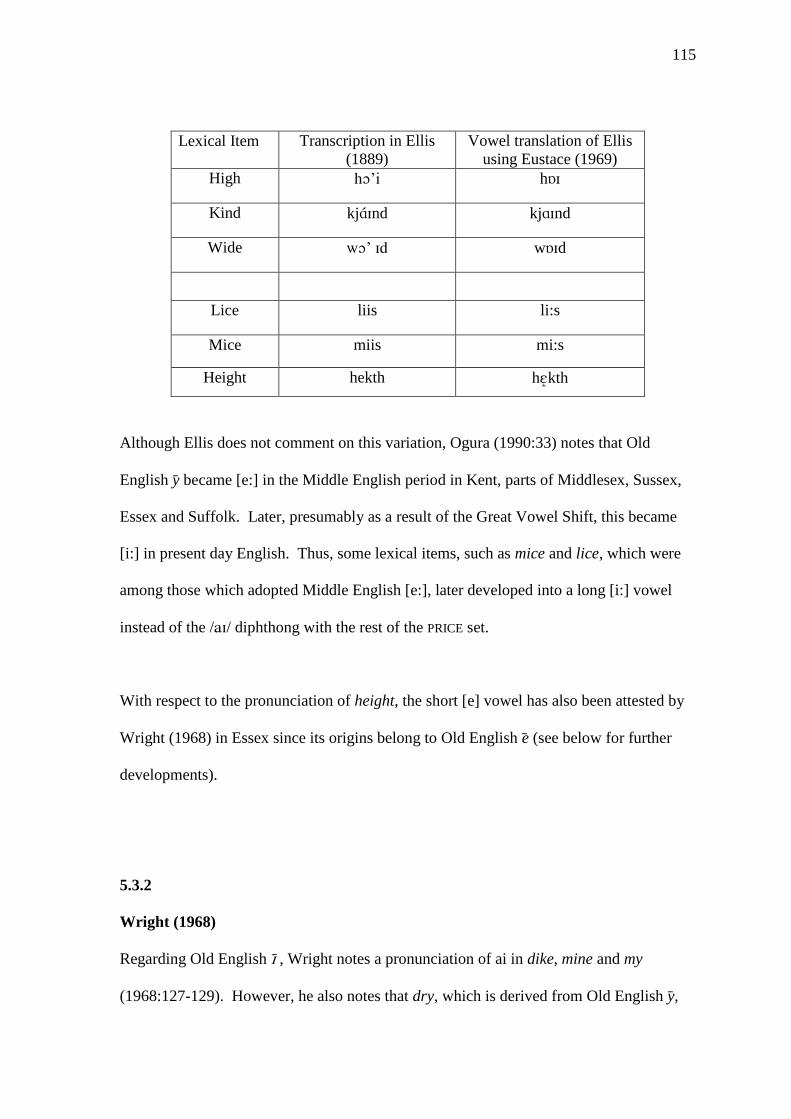
115
Lexical Item Transcription in Ellis
(1889)
Vowel translation of Ellis
using Eustace (1969)
High ’i h
Kind kjnd kjnd
Wide ’ wd
Lice liis li:s
Mice miis mi:s
Height hekth hkth
Although Ellis does not comment on this variation, Ogura (1990:33) notes that Old
English y became [e:] in the Middle English period in Kent, parts of Middlesex, Sussex,
Essex and Suffolk. Later, presumably as a result of the Great Vowel Shift, this became
[i:] in present day English. Thus, some lexical items, such as mice and lice, which were
among those which adopted Middle English [e:], later developed into a long [i:] vowel
instead of the // diphthong with the rest of the PRICE set.
With respect to the pronunciation of height, the short [e] vowel has also been attested by
Wright (1968) in Essex since its origins belong to Old English e (see below for further
developments).
5.3.2
Wright (1968)
Regarding Old English , Wright notes a pronunciation of ai in dike, mine and my
(1968:127-129). However, he also notes that dry, which is derived from Old English y,

116
has a pronunciation of ‘oi’ (1968:153). As noted above, Wright observed that, in Essex, a
reflex of Old English e was the front, half open [e] vowel in the token height. He also
noted that die may be pronounced as [e] or [i]. However, there is no evidence from
either Ellis or the SED to suggest that this was an active pronunciation in the area under
investigation.
5.3.3
Kurath and Lowman (1970)
Kurath and Lowman’s study of Southern British English notes that the diphthong
resulting from Middle English /i:/ starts in a centralised position, leaving the most
common variant with a centralised nucleus [], though a more backed [] may also
occur. This, they note, is the case in the west of the country and East Anglia, as well as
being largely represented in the South-eastern counties
5.3.4
The Survey of English Dialects (SED) (Orton 1962)
The majority variant in the East Mersea sample was [], occurring in 52 out of a possible
74 tokens. At no point in the data from this speaker was there standard-like [] variants
present. However, other variants included:
A centralised [] e.g. dry
A centralised and raised [] e.g. bind
A more open [] e.g. tried
A lowered [] e.g. eye
and
A lowered and backed [] e.g. height
117
However, the last of these variants, [], only occurred in four tokens (height, ice, iron
and lie) and, therefore, by looking at the following environments of these words, we can
observe no potential Canadian Rising pattern. This observation also holds true for the
two nearby locations of Tiptree and West Bergholt, where [] was also the variant of
preference.
The SED data does suggest a shift since the time of Ellis’ study, however. The use of [e]
in height is no longer apparent while the long [i:] in mice and lice appears to have given
way to the PRICE diphthong. With respect to lice, both East Mersea and West Bergholt
are represented as having [], while Tiptree is variable between the long vowel [i:] and
the diphthong. Mice, on the other hand, is variable in East Mersea and Tiptree, but only
has the diphthong in West Bergholt.
5.3.5
Summary
Even though there are some instances of low back [] nuclei, these historical sources
suggest that back mid vowels such as [] and more centralised [] nuclei were the more
common variants across the south eastern counties, and Essex in particular. However,
there have been some lexical exceptions in the development of //, such as those which
have origins in Old English y and e.
5.4
Some More Recent Studies
Now that we have gained some insight into the historical development and the traditional
variants of () in the region under investigation, attention will now be turned to the status
118
of this variable, as reported by some more recent sociolinguistic studies. The initial focus
will be on those studies which are geographically close to the location under study,
Mersea Island. Thereby, an idea of the variant geography of the South-eastern region can
be ascertained. Following this will be a closer look at the behaviour of (a) in insular
communities around the world. These will help establish any patterns of variation which
may surface as a result of socio-demographic isolation.
5.4.1
Norwich
Trudgill (1974; 1988) studied the East Anglian city of Norwich (Norfolk) in both real and
apparent time through a comparison of four speech styles – word list style (WLS),
reading passage (RPS), formal style (FS) and casual style (CS). As a result of the
apparent time study, Trudgill (1974) identified the variation of Middle English /i:/ as
being representative of linguistic change. Among his arguments was the overlapping
nature of the data relating to the middle working class speakers, which featured more [
~ ] type variables compared to the data from the lower working class.
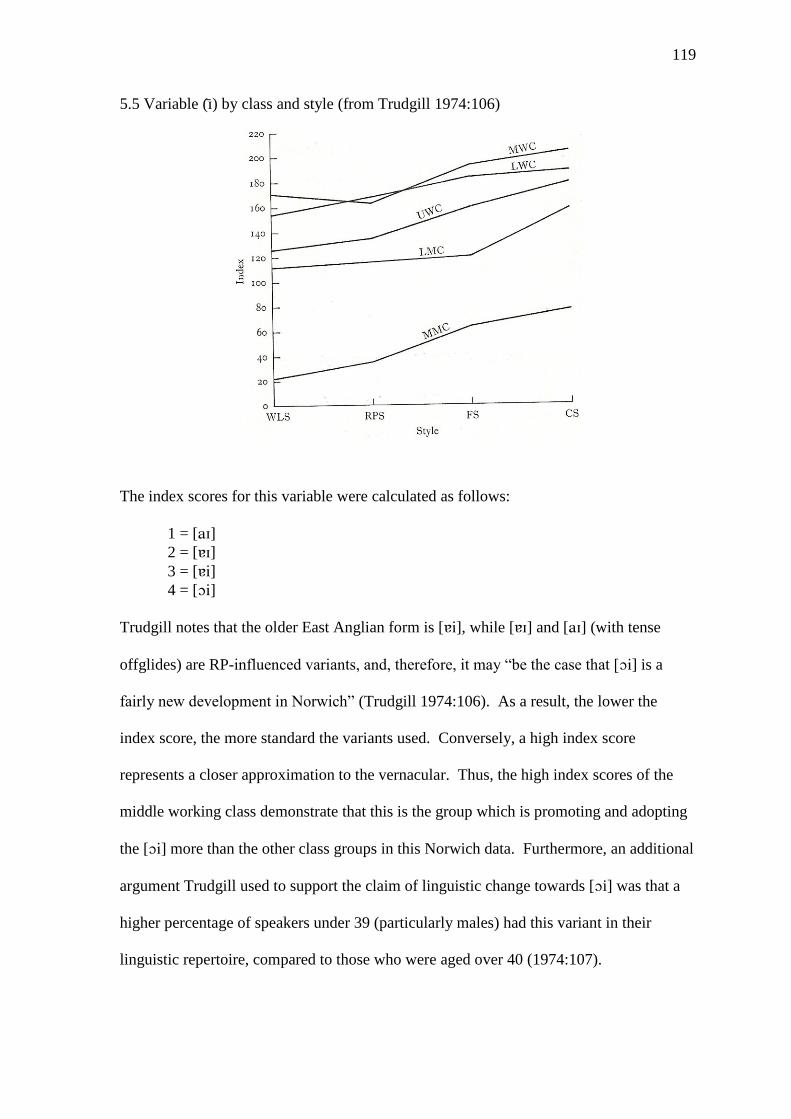
119
5.5 Variable () by class and style (from Trudgill 1974:106)
The index scores for this variable were calculated as follows:
1 = [] 2 = [] 3 = [] 4 = []
Trudgill notes that the older East Anglian form is [], while [] and [] (with tense
offglides) are RP-influenced variants, and, therefore, it may “be the case that [] is a
fairly new development in Norwich” (Trudgill 1974:106). As a result, the lower the
index score, the more standard the variants used. Conversely, a high index score
represents a closer approximation to the vernacular. Thus, the high index scores of the
middle working class demonstrate that this is the group which is promoting and adopting
the [] more than the other class groups in this Norwich data. Furthermore, an additional
argument Trudgill used to support the claim of linguistic change towards [i] was that a
higher percentage of speakers under 39 (particularly males) had this variant in their
linguistic repertoire, compared to those who were aged over 40 (1974:107).

120
A comparison of this variable in real time was made possible when Trudgill (1988)
revisited Norwich for additional data and the original methodologies were maintained,
even though he did not conduct the interviews himself. Although the quality of the
diphthongal nucleus seemed to have shifted from [], Trudgill notes that there “has also
been an increase in the use of variants of /ai/ as in nice with a back rounded onset [αi]”
(1988:40), thus confirming the apparent time findings of the previous study which
highlighted a change away from the traditional [] form.
5.4.2
The East Anglian Fens
Even though Canadian Raising patterns of /ai/ variation had been rarely attested within
the UK, Britain (1991) presented findings from the SED as well as data collected from 81
speakers located across the Fenland areas, which clearly demonstrated such a pattern.
However, he did also observe a contrasting pattern between those speakers from Eastern
areas compared with those from Western areas. He observed that, in pre-voiceless
contexts (in which Canadian Raising would promote raised diphthong nuclei), raised
nuclei are clearly a feature of Eastern dialects, while those in the West prefer more open
variants. In addition, an age comparison demonstrated that a contextual Canadian Raising
contrast of raised and open variants had retreated eastwards in favour of categorical open
variants and monophthongal forms.
By way of explanation, Britain (1991) suggested that this Canadian Raising pattern may
have come about from processes of focussing and reallocation. Thus, when the Eastern
dialects (with raised variants in all environments) came into prolonged contact with
121
Western dialects (which had open variants in all contexts) after the extensive draining of
the marshlands in the seventeenth century, it led to a focussed variety in the Central
Fenland regions. Subsequent reallocation of forms to particular phonological contexts
(namely raised variants before voiceless consonants and lowered variants elsewhere)
resulted in the type of Canadian Raising pattern that was observed (Britain 1991:96-97).
One further observation, with respect to the Fenland data, concerns monophthongisation
and the environment of (a) preceding /l/. Britain notes that females of both ages were
more advanced regarding monophthong production than their male counterparts, while
the sequence /ail/ had the greatest proportion of monophthongal forms. This suggests that
“/ail/ is undoubtedly the leading environment in the linguistic change in progress”
(Britain 1991:91).
5.4.3
Other South-Eastern Variation
In Colchester (Britain’s oldest recorded town and a 20-minute drive from Mersea Island),
Ryfa investigated the speech of two young social groups known as the Chavs and the
Grungers (see Ryfa (2005) for detailed explanation and characteristics of these social
groups). She identified eleven variants of (a) ranging from standard [a] to a raised []
and monophthongs of both raised and lowered qualities. The middle class Grungers were
found to use the standard form in 82% of tokens while the working class Chavs used it in
only 24% of tokens, preferring more raised forms instead. In addition, monophthongs
122
were found in the speech of both groups with the Grungers preferring more backed [a : ~
:] variants and the Chavs the more centralised [a:] variant (2005:50).
Other data from the South East and London areas can be found in Przedlacka (2001),
Tollfree (1999) and Fox (2007) . For example, Przedlacka’s investigation into Estuary
English shows that, in the speech of adolescents, backed and rounded [ ~ ] variants
were used in Buckinghamshire while Essex, Kent and Surrey represented [a ~ ]
variants (2001:42).
Tollfree (1999) also observes backed, slightly less rounded [] variants in her South
London data. This can be compared with her more standard London data, which exhibits
a range of more fronted [a ~ a ~ a] variants. She also notes that the second element, or
offglide of the diphthong can be centralised and is often brief or wholly lacking from
pronunciation (Tollfree 1999:168).
This variation between backed [] nuclei and more fronted [a] nuclei was also found by
Fox (2007). Her, analysis of Tower Hamlets adolescents (in the East End of London),
identified three types of backed variants [:] ~ [] ~ [] and three more fronted variants
[] ~ [a] ~ [], the latter set being regarded as the newer variants, while the backed
variants were being preserved, particularly by preceding voiced stops. This fronting, Fox
suggested, could “indicate that the PRICE vowel may be undergoing a reversal of the
diphthong shift” (2007:159). Fox also found that the ethnicity of her informants
correlated with the quality of the nucleus. For example, 93% of the Bangladeshi
speakers’ data consisted of fronted variants. In contrast, the white British and mixed
origin speakers preferred backed variants, 62% and 63% respectively (Fox 2007:160).
123
Cheshire et al (1999), studying and comparing the locations of Milton Keynes and
Reading, noted that, among the very oldest pre-New Town speakers in Milton Keynes,
there can be found raised [] and [] variants. However, in Reading, these were being
maintained by children. They suggested that the target is not the RP variant, but rather a
London-like, and perhaps supra-local, [] variant, with a low backed nucleus “which is
geographically widespread in south-eastern urban varieties” (1999:6).
5.4.4
Summary
From these studies, we can see that variation of (a) with respect to the quality of the
offglide does not tend to deviate from the high front // region. The only exception seems
to be when the offglide is weakened towards a monophthong. In contrast, the diphthongal
nucleus may be found in raised and backed positions towards the //~// regions in more
traditional dialects across the South East. This suggests that, in these dialects, lowering to
[a] had not occurred before backing and raising, which is what the diphthong shift and
the southern shift would suggest. However, backed variants, can be found in the speech
of some South-eastern adolescents suggesting that these dialect areas may be undergoing
parts of the diphthong shift, which is causing the backing of the /a/ nucleus towards [ ~
].
In addition, monophthongal realisations have been found in the speech of some younger
informants, indicating that these are innovative variants in some dialect communities.
However, as Britain (1991) noted in his Fenland data, the extent of monophthongisation
124
may be conditioned by phonological context, specifically with respect to the increased
amounts of monophthongs likely before /l/.
5.5
Contemporary Studies of Insular Varieties
As noted above, the following sections will look at selected studies from a range of
insular communities with respect to the variable (a). These studies will be able to
highlight any patterns of variation which may have been influenced by the unique social
development of each location.
5.5.1
Martha’s Vineyard
As previously mentioned, the pioneering research carried out by Labov (re-printed as part
of Labov (1972)) in Martha’s Vineyard, off the New England coast, focussed on the two
diphthongal variables (a) and (au)21
regarding the degree of centralisation of their nuclei.
With respect to (a), Labov collected 3,500 tokens and found that, even though the results
did not seem to pattern with style, a number of factors influenced the centralised variants.
Among these, phonological environment was found to correlate with the degree of
centralisation. For example, a following /t/ or /s/ was found to favour centralisation the
most while a following /m/ favoured centralisation the least These findings were also
supported in subsequent studies by Pope et al (2007) and Blake and Josey (2003) with the
latter noting that “the findings suggest that the variable presence of the Canadian Raising
rule in the speech of Vineyarders today follows the same directional pattern observed by
Labov” (Blake and Josey 2003:465).
21
Note that in Labov’s work, these were referred to as (ay) and (aw)
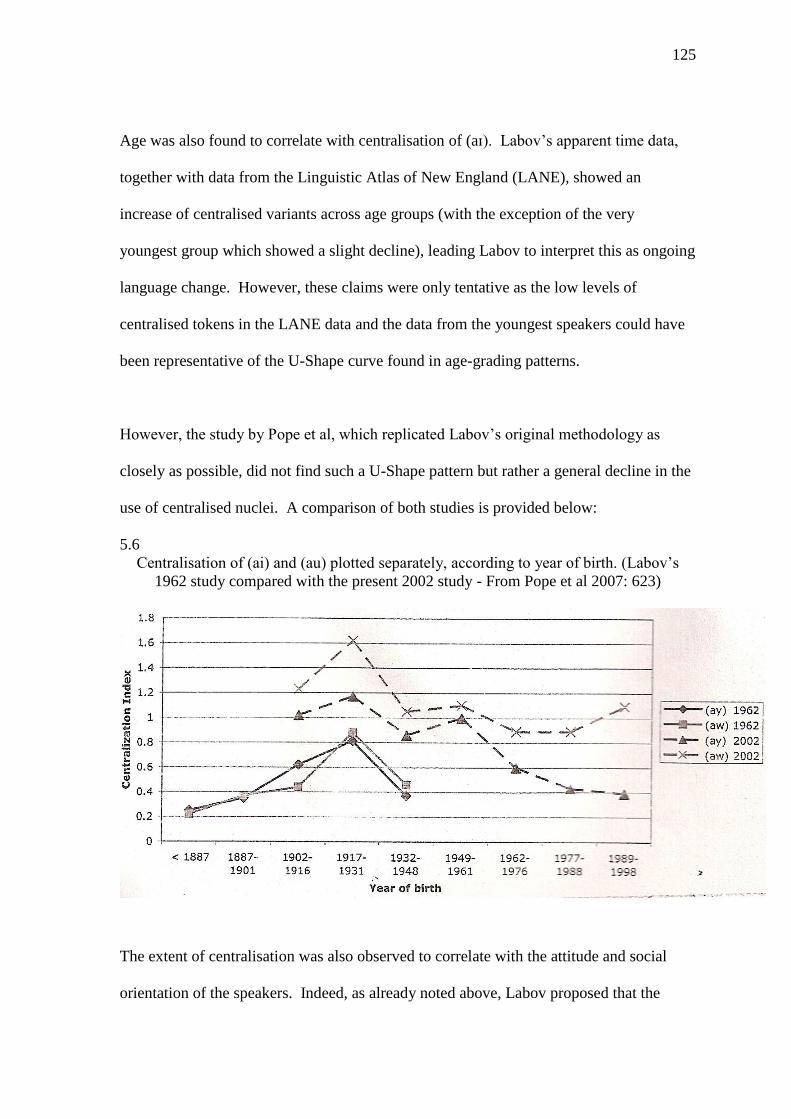
125
Age was also found to correlate with centralisation of (a). Labov’s apparent time data,
together with data from the Linguistic Atlas of New England (LANE), showed an
increase of centralised variants across age groups (with the exception of the very
youngest group which showed a slight decline), leading Labov to interpret this as ongoing
language change. However, these claims were only tentative as the low levels of
centralised tokens in the LANE data and the data from the youngest speakers could have
been representative of the U-Shape curve found in age-grading patterns.
However, the study by Pope et al, which replicated Labov’s original methodology as
closely as possible, did not find such a U-Shape pattern but rather a general decline in the
use of centralised nuclei. A comparison of both studies is provided below:
5.6
Centralisation of (ai) and (au) plotted separately, according to year of birth. (Labov’s
1962 study compared with the present 2002 study - From Pope et al 2007: 623)
The extent of centralisation was also observed to correlate with the attitude and social
orientation of the speakers. Indeed, as already noted above, Labov proposed that the
126
increase of centralised variants was in response to the growth of summer tourism on the
island and, thus, speakers used their linguistic resources to create and maintain their
native islander status. However, even though this was tested by Pope et al and found to
still be valid on the island, Blake and Josey (2003), who also found a decline in (a)
centralisation, reported that the iconic status of centralised /a/ had been lost and native
islanders no longer had any vested interest in trying to linguistically separate themselves
from the summer tourists. In retaliation to this, Pope et al suggested that a
misinterpretation of social data, together with clashing methodologies in the initial data
collection, resulted in these contrasting conclusions - see Pope et al (2007:624 onwards)
for a discussion of these points.
5.5.2
Ocracoke and Smith Island
As previously noted in section 3.2.3.2 above, Ocracoke and Smith Island are two
inhabited islands off the Eastern coast of the United States of America. The former is
situated off the coast of North Carolina, while the latter is located in the Chesapeake Bay
area of Maryland. Both are only accessible by ferry and while Ocracoke has witnessed a
huge rise in tourism levels over recent decades, Smith Island does not have such a vibrant
tourism industry and is even experiencing a decline in its residential population (see, for
example, Schilling-Estes and Wolfram (1999), Schilling-Estes (2002) and Wolfram
(2008)). In both islands, the diphthong /a/ is realised with a raised onset in the region of
[] or [] and, while this is a noticeable stereotype of Ocracoke English, it is rarely
perceived as a marker of Smith Island English. This is in contrast to the (au) alternations
in these communities mentioned above (Schilling-Estes and Wolfram (1999-490)).
Indeed, the salience of this feature is once again suggested as having an influence on the
127
variation patterning of each island. Therefore, where raising and backing of /a/ is salient
in Ocracoke, it is observed to be receding as a dialect feature, with the exception of the
speech of those belonging to the closely-knit Poker Game Network22
who seem to
promote and preserve traditional island features. Conversely, the 24 Smith Island
speakers showed an increase of raised and backed variants, particularly among the middle
aged and young speakers.
Another point of contrast in the behaviour of these variables comes with respect to
following phonological environment. In the Ocracoke data, the raising and/ or backing of
/a/ was favoured before voiced environments (such as in tide), which is similar to that of
the Martha’s Vineyard data mentioned above, while in the Smith Island data, raising and/
or backing was favoured before voiceless environments (for example, tight). Schilling-
Estes and Wolfram (1999:495) note that, in earlier work, this difference was attributed to
the peripheral and non-peripheral nature of [] and [
], respectively. However, in the
light of additional data from the United States, this is no longer considered by them as a
viable explanation, since this data does not fit the predicted pattern proposed by their
original model. Instead, the contrasting symbolic nature of raised and/or backed variants
is given explanatory theoretical status. Therefore, with the raised and/ or backed variant
acting, in Ocracoke, as a “symbolic icon of Islander speech and Islander identity”
(Schilling-Estes and Wolfram 1999:496), which can be used to distance locals from
tourists, only those who want to project an island affiliation will retain this feature.
However, on Smith Island, where it does not serve as a marker of island status, it is not as
readily manipulated and may be retained without socio-psychological pressure.
22
These are a group of men who regularly meet to play poker and who “project a highly (traditionally)
masculine image, and who pride themselves on speaking the authentic Ocracoke dialect” Wolfram and
Schilling-Estes (2006:239)
128
5.5.3
The Falkland Islands
The Falkland Islands are a group of islands east of Argentina in the South Atlantic Ocean.
The main resident population lives on East Falkland in the Capital Stanley (Britain and
Sudbury 2010). Even though uninterrupted Anglophone settlement can be traced back to
the 1830s (with the initial British claim going back to 1690), Britain and Sudbury
(2010:212) note that, according to the 2006 census, 55% of the population were born
outside the Falklands. This population is represented by those from Great Britain, St
Helena, Chile, Australia and a range of many other nationalities. As a result, the
Falklands “should in no way be seen as demographically homogenous or monocultural”
(Britain and Sudbury 2010:212) 23
.
With respect to the () variable, Sudbury (2000) notes that the originating population,
representing mainly Scotland and the West Country, would have brought with them
variants with [ ~ ~ ] nuclei qualities (2000:222). In addition to these, diphthongs with
open back [ ~ ] nuclei may also have been present, but those with open front [ ~ ]
nuclei “are likely to have been in the minority at the time of the Falklands colonisation”
(2000:222).
Finally, Sudbury observes that the original offglide qualities were high front [ ~ i] and,
therefore, varied with respect to the degree of tenseness. However, monophthongs were
also recorded, but these were particularly restricted to –ight lexical items (2000:222).
23
See Section 3.2.3.3 for more details of the settlement history.
129
The analysis of modern Falkland Island English (FIE) demonstrated that the preferred
variants of () had nuclei of [ ~] qualities. This suggests a degree of conservatism in
the dialect as these onsets do not seem to have progressed or diverged much from that of
the original settlers. However, Sudbury discovered a consistent Canadian Raising pattern
with respect to //. She concludes that realisations of // preceding voiceless
environments strongly favour a close mid onset, while the nucleus of // in other
environments is lower, though does not reach a fully open position. Thus, even though an
allophonic distribution akin to Canadian Raising can be found, the phonetic distinction
between allophones is less marked than in other Canadian Raising dialects (Sudbury
2000:233).
Due to the extent of settlers from Scotland, Sudbury also tested for patterns relating to the
Scottish Vowel Length Rule (SVLR). This rule generally predicts (with respect to //)
that // nuclei will be represented by open vowels only before voiced fricatives, /r/ and
word or morpheme boundaries24
. However, even though some speakers exhibited
differences in the contextual usage of () variants, Sudbury notes that these “were not
always in the direction predicted by the SVLR” (2000:243). This led Sudbury to
conclude that the SVLR does not apply as a general rule in FIE.
5.5.4
St Helena
The island of St Helena, in the mid-central South Atlantic Ocean, was recorded as having
a population of 5,644 in 1987. However, since then, due to St Helenians being granted
24
See the processes associated with Aitken’s Law in Wells (1982b) for more detailed information.

130
full British Citizenship, this population has decreased by 20.3% due to extreme out-
migration (Schreier 2008:93). Schreier (2008; 2010a) records that the founding
population of the island formed four principle groups, namely the British and European
settlers, slaves from Africa, Madagascar and Asia, and labourers from China. Schreier
goes on to write that, even though there is a lack of specific information relating to the
British Settlers, it seems likely that the London area (perhaps the Greater London area)
was the place of origin for many of them (2008:95)25
. The extensive range of island
settlers over the history of St Helena has led to a sociolinguistic environment which is
diverse and heterogeneous. However, even with such social and linguistic diversity,
Schreier observes that “its most influential founders came from the British Southeast and
Madagascar” (2008:227), while the other linguistic groups had little impact on the
resulting dialect.
Regarding variation of (), Schreier notes that [] is the most common variant (although
an open [] nucleus may also surface). However, instead of proposing that these backed
variants are preserved from older forms of the dialect, which may then lower towards [],
Schreier claims a backing of the // nucleus to the [] region has taken place, which is
indicative that St Helenian English (StHE) has undergone at least part of the diphthong
shift. He likens this to the pronunciation of Cockney English and Australian English
(2010a:234). In addition to this, the data from St Helena demonstrate evidence of
Canadian Raising. Thus, the nucleus of // was found to raise towards the mid central
region of [ ~ ] before voiceless consonants and is lowered in all other environments.
25
See Section 3.2.3.4 for additional details regarding the social history of St Helena
131
Finally, even though Schreier notes some mild glide weakening (with respect to the
second element of the diphthong, []) he does not report any use of full monophthongal
variants in StHE (2008; 2010a).
5.5.5
Tristan da Cunha
Tristan da Cunha is a sparsely populated island, with only 278 speakers of Tristan da
Cunha English (TdCE) recorded in 2008 (Schreier 2010b:245). The now monolingual
Anglophone community has developed out of a number of inputs ranging from the British
Isles to the Northeast United States to South Africa and St Helena. A significant
observation of the island community is that the population resides in one settlement
(eliminating the possibility of regional variation). As a result, the social networks of
inhabitants are very dense and multiplex in their structure. Finally, Schreier notes that the
population have a strong Tristanian identity and “their sense of orientation is focussed on
the island” (2010b:246)26
.
The modern TdCE dialect, with respect to //, exhibits an innovative allophonic pattern
between a ‘fast’ [] diphthong and a ‘slow’ [] diphthong (Schreier 2010b:249). These
allophones follow a Canadian Raising type pattern in that the former can be found before
voiceless consonants, while the latter surfaces elsewhere. The nature of the slow []
diphthong, Schreier observes, is indicative of the // diphthong having taken part in the
diphthong shift as well as glide weakening. However, there are no reports of the latter
process of glide weakening leading to monophthongisation.
26
See Section 3.2.3.5 for more information regarding the history of Tristan da Cunha
132
5.6
The Special Status of LIKE – Variation in New Zealand English
The use of like with either grammatical or discourse functions leads it to be a highly
frequent item throughout spoken language data (although different functions of like will
represent different usage frequencies). Due to the multi-dimensional nature of this item,
it is worth considering it separately from other () tokens. Even though other studies
(such as Cheshire and Fox (2007), Macaulay (2001) and Tagliamonte and Hudson
(1999)) have looked at the uses of like from the perspective of variation within the
quotative system, the following discusses how phonetic variation of like can be employed
to signal group affiliation as well as like-function.
D’Arcy observes that in “the media there is a tendency to talk of like as a single,
monolithic entity” (2007:391) and thus highlights nine categories of LIKE. These may
surface under the two broader categories of grammatical uses (for example, LIKE as a verb
or adverb) and vernacular uses (for example, LIKE as a quotative complementiser or
discourse marker). Using a subsection of these classifications (determined by frequency
of tokens and, thus, available data), Drager (2009) investigated the variation of LIKE in the
speech of girls in an all-girls high school in New Zealand. Her analysis was based on
ethnographic observations of student groups, determined by where they ate lunch. The
two primary groups were the Common Room Girls (CR) and the non-Common Room
Girls (NCR). The variation analysed included the quality of the vowel, whether the final
/k/ was realised and degrees of glottalisation.
A subsequent acoustic analysis of tokens demonstrated that the realisation of LIKE was not
only grammatically conditioned, but also socially conditioned so that speakers could
133
manipulate pronunciations as they construct their social identity or persona. For example,
in a comparison of quotative like with grammatical functions of like, her results showed
that “a token was significantly less likely to be quotative like if it was more diphthongal”
and thus, “tokens with vowels that were more diphthongal were more likely to be a
grammatical function of like” (2009:116). In addition, when comparing the realisations
of the /k/ in the quotative like and the discourse particle like, Drager observed that a
speaker was more likely to realise the /k/ in a quotative like as opposed to a discourse
particle like if she were a NCR girl and thus “more likely to drop the /k/ in the quotative
than in the discourse particle if she was a CR girl” (2009:122)27
.
5.7
Summary
Even though the historical source of present day // can be identified as mostly Middle
English /i:/, the subsequent path of derivation remains uncertain. Historical dialect
surveys suggest that a traditional variant of () in Essex is [] while in some areas,
notably across the East Anglian Fens, Canadian Raising patterns were established.
However, modern studies have shown that, in the UK, while patterns of Canadian Raising
are evident in a few locations, (a) has undergone or is undergoing linguistic change either
towards a standard-like /a/ diphthong, or towards a newly levelled or supralocal variant,
such as []. Also, it has been shown that the quality of the diphthong is considered a
salient sociolinguistic marker, not just in the UK, but in other locations such as those in
the United States and New Zealand, as presented here. In these locations, the level of
27
Drager classified a /k/ as being dropped if it could not be heard during the auditory analysis (2009:106).
If the /k/ appeared glottalised, this was marked as such but still treated as having the /k/ not realised
(2009:107).
134
social awareness regarding (a) variation may affect the variant patterning within a speech
community as speakers attempt to construct their sociolinguistic identities.
The examination of insular communities has demonstrated that the development of
allophonic distributions of () variants in a manner similar to that of Canadian Raising is
more likely to develop for this diphthong than for (). Perhaps, due to this allophonic
variation, the // diphthong is less susceptible to processes of glide weakening, in these
communities, which contrasts with the behaviour of ().
135
Chapter 6
() - An Analysis of Social and
Linguistic Factors
136
6. THE ANALYSIS OF () 28
The following sections will present the results for the variable (a) in Mersea Island
English. The social dimensions of age and gender will initially be presented before a
subsequent analysis of linguistic factors.
6.1
() - An Analysis of Social and Linguistic Factors
As previously mentioned in Section 2.3.1.3, the analysis of function words (including I,
my, myself and by) will not be discussed here. Rather, this analysis will be restricted to
the behaviour of lexical words, together with a comparison of variants pertaining to the
different functions of ‘like’. Also included in this analysis, but treated separately due to
their behaviour in the data, will be an investigation into the behaviour of tokens in which
(a) immediately precedes /l/.
Following the methodology outlined in Chapter 2 above, 3620 tokens of (a) were
extracted from the data. In addition, 218 tokens of (a) preceding /l/ and 746 tokens of
LIKE were extracted. Thirteen variants were identified and these can be categorised into
the following subgroups:
1 2 3
Primary Variants Lowered and Backed
Variants
Unstressed and Reduced
Variants
28
Examples of (a) tokens according to phonological environment can be found in Appendix D (2a) and
(2b)
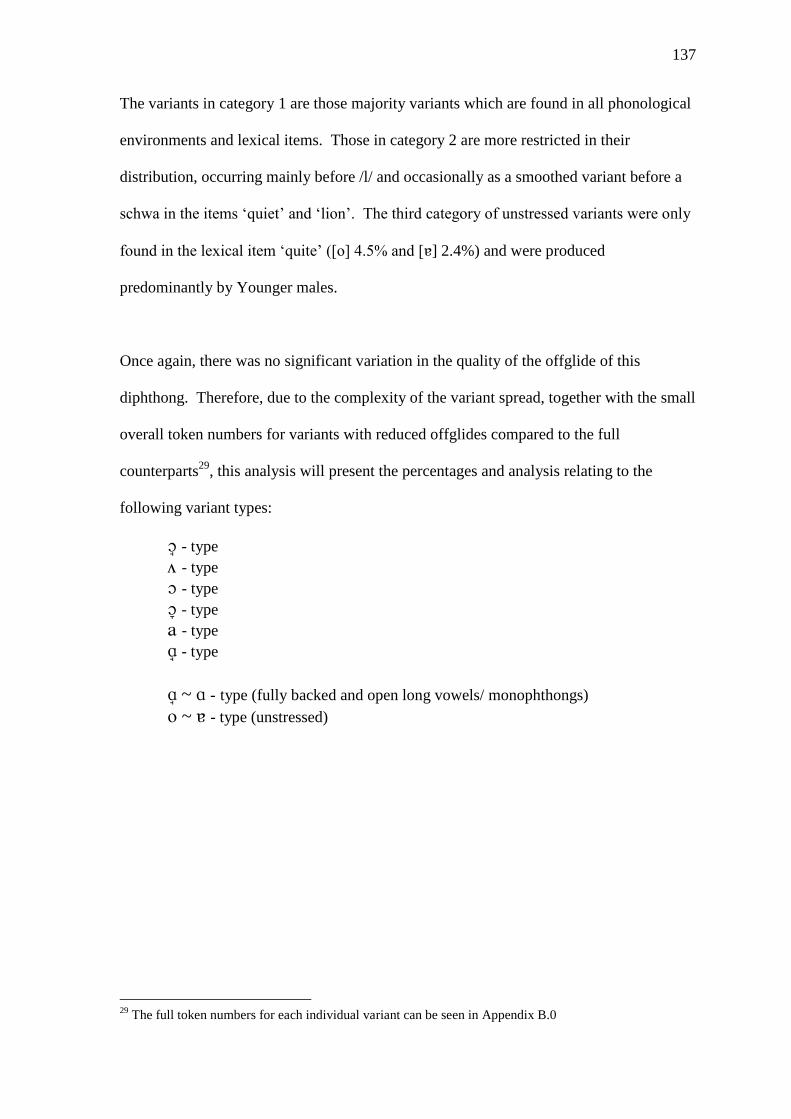
137
The variants in category 1 are those majority variants which are found in all phonological
environments and lexical items. Those in category 2 are more restricted in their
distribution, occurring mainly before /l/ and occasionally as a smoothed variant before a
schwa in the items ‘quiet’ and ‘lion’. The third category of unstressed variants were only
found in the lexical item ‘quite’ ([o] 4.5% and [] 2.4%) and were produced
predominantly by Younger males.
Once again, there was no significant variation in the quality of the offglide of this
diphthong. Therefore, due to the complexity of the variant spread, together with the small
overall token numbers for variants with reduced offglides compared to the full
counterparts29
, this analysis will present the percentages and analysis relating to the
following variant types:
- type - type - type - type - type - type
~ - type (fully backed and open long vowels/ monophthongs)
~ - type (unstressed)
29
The full token numbers for each individual variant can be seen in Appendix B.0
138
6.2
Social Factors
This section will outline the results pertaining to (a) with respect to the social factors of
age and gender.
6.2.1
Age
The data in 6.1 demonstrate how the variant use has changed across the three age groups.
6.1a
Percentage of (a) variants according to diphthong type and age
Young 0.00 0.00 2.67 9.24 85.88 0.84 0.31 1.07
Old 1.20 0.90 21.61 16.33 58.96 0.65 0.05 0.30
Museum 11.59 8.94 62.25 7.62 9.27 0.00 0.33 0.00
6.1b
Percentage of (a) variants according to speaker age
It can be seen that the Museum speakers, while using small levels of the standard variant,
are the greatest proponents of the -type variants, as well as featuring the greatest levels
of - type and -type variants. Conversely, the Younger speakers use small amounts of
the more rounded and - type variants and, thus, their speech is characterised
0
20
40
60
80
100
59)
(N = 45)
(N = 657)
(N = 472)
(N = 2337)
(N = 24)
(N = 6)
(N = 20)
Museum Old Young
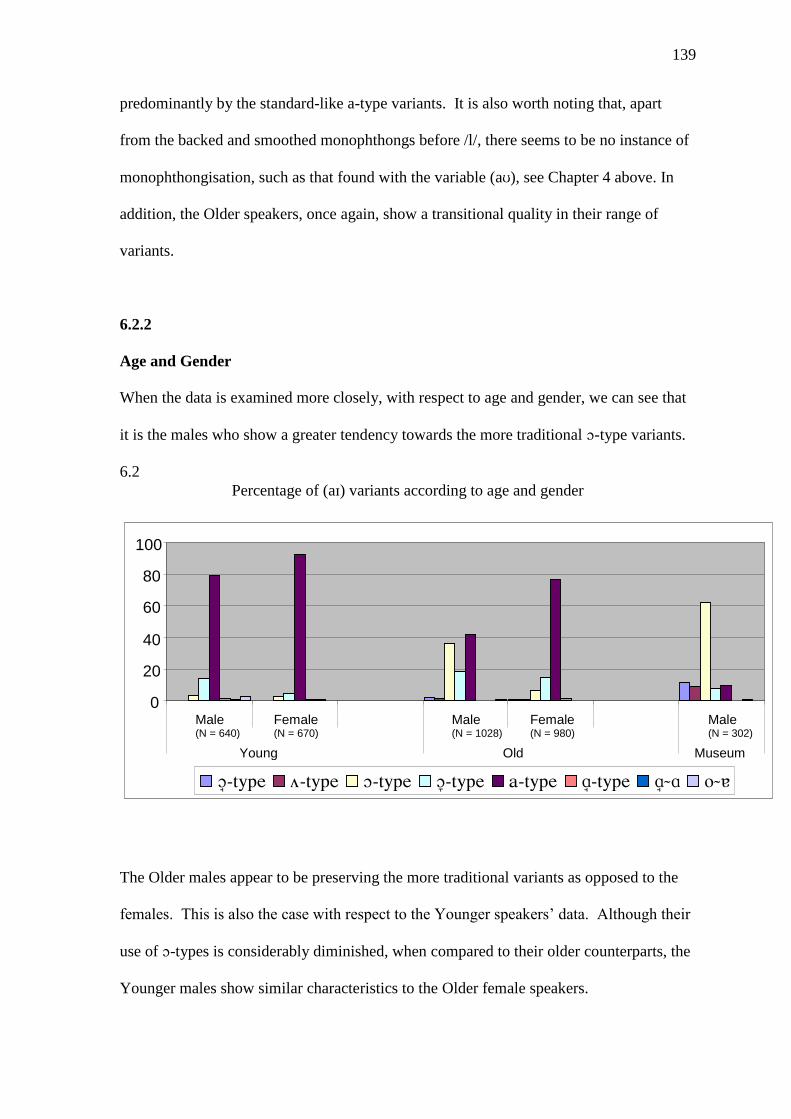
139
predominantly by the standard-like a-type variants. It is also worth noting that, apart
from the backed and smoothed monophthongs before /l/, there seems to be no instance of
monophthongisation, such as that found with the variable (a), see Chapter 4 above. In
addition, the Older speakers, once again, show a transitional quality in their range of
variants.
6.2.2
Age and Gender
When the data is examined more closely, with respect to age and gender, we can see that
it is the males who show a greater tendency towards the more traditional -type variants.
6.2
Percentage of (a) variants according to age and gender
The Older males appear to be preserving the more traditional variants as opposed to the
females. This is also the case with respect to the Younger speakers’ data. Although their
use of -types is considerably diminished, when compared to their older counterparts, the
Younger males show similar characteristics to the Older female speakers.
0
20
40
0
60
80
100
Male (N = 640)
Female (N = 670)
Male (N = 1028)
Female (N = 980)
Male (N = 302)
Young Old Museum
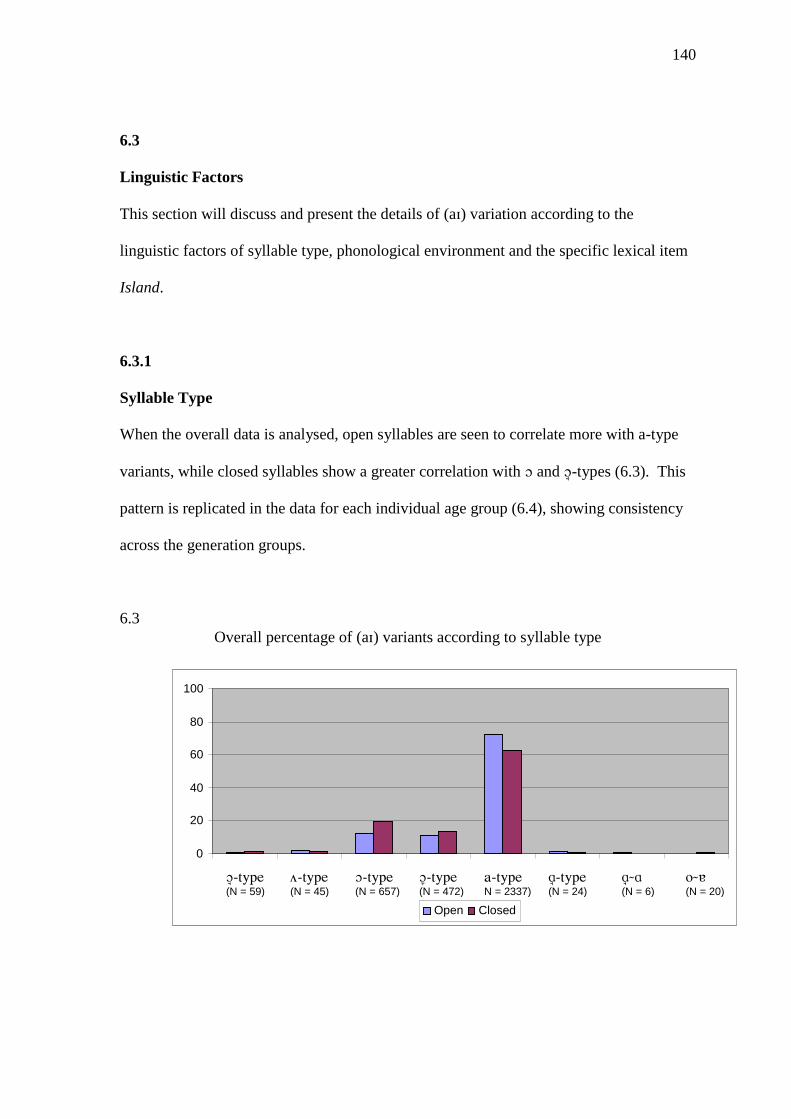
140
6.3
Linguistic Factors
This section will discuss and present the details of (a) variation according to the
linguistic factors of syllable type, phonological environment and the specific lexical item
Island.
6.3.1
Syllable Type
When the overall data is analysed, open syllables are seen to correlate more with a-type
variants, while closed syllables show a greater correlation with and -types (6.3). This
pattern is replicated in the data for each individual age group (6.4), showing consistency
across the generation groups.
6.3
Overall percentage of (a) variants according to syllable type
0
20
40
60
80
100
(N = 59)
(N = 45)
(N = 657)
(N = 472)
N = 2337)
(N = 24)
(N = 6)
(N = 20)
Open Closed
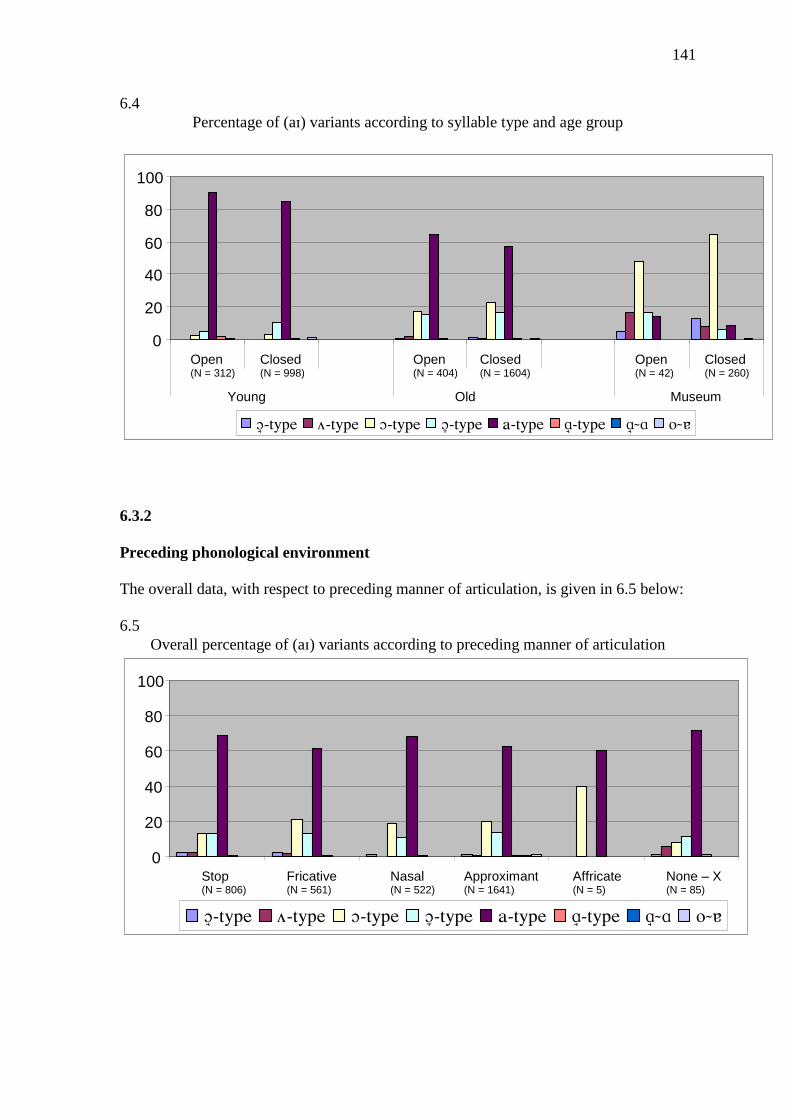
141
6.4
Percentage of (a) variants according to syllable type and age group
6.3.2
Preceding phonological environment
The overall data, with respect to preceding manner of articulation, is given in 6.5 below:
6.5
Overall percentage of (a) variants according to preceding manner of articulation
0
20
40
60
80
100
Open (N = 312)
Closed (N = 998)
Open (N = 404)
Closed (N = 1604)
Open (N = 42)
Closed (N = 260)
Young Old Museum
0
20
40
60
80
100
Stop (N = 806)
Fricative (N = 561)
Nasal (N = 522)
Approximant (N = 1641)
Affricate (N = 5)
None – X (N = 85)
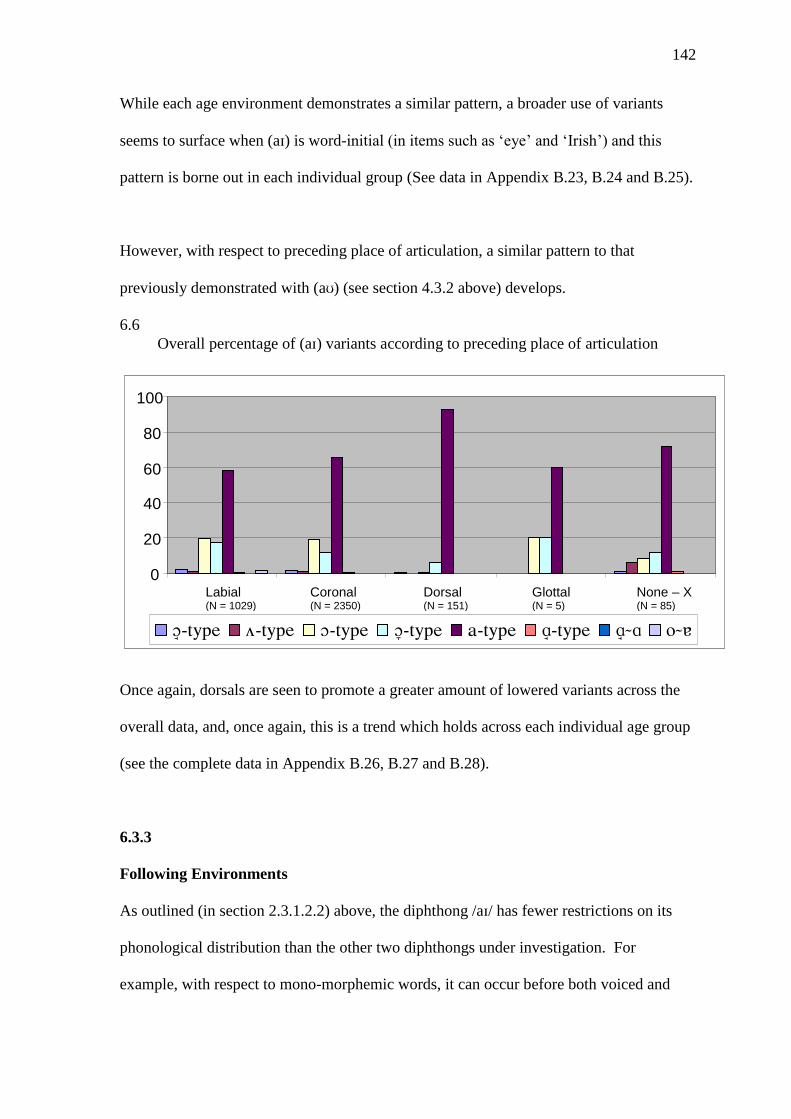
142
While each age environment demonstrates a similar pattern, a broader use of variants
seems to surface when (a) is word-initial (in items such as ‘eye’ and ‘Irish’) and this
pattern is borne out in each individual group (See data in Appendix B.23, B.24 and B.25).
However, with respect to preceding place of articulation, a similar pattern to that
previously demonstrated with (a) (see section 4.3.2 above) develops.
6.6
Overall percentage of (a) variants according to preceding place of articulation
Once again, dorsals are seen to promote a greater amount of lowered variants across the
overall data, and, once again, this is a trend which holds across each individual age group
(see the complete data in Appendix B.26, B.27 and B.28).
6.3.3
Following Environments
As outlined (in section 2.3.1.2.2) above, the diphthong /a/ has fewer restrictions on its
phonological distribution than the other two diphthongs under investigation. For
example, with respect to mono-morphemic words, it can occur before both voiced and
0
20
40
60
80
100
Labial (N = 1029)
Coronal (N = 2350)
Dorsal (N = 151)
Glottal (N = 5)
None – X (N = 85)
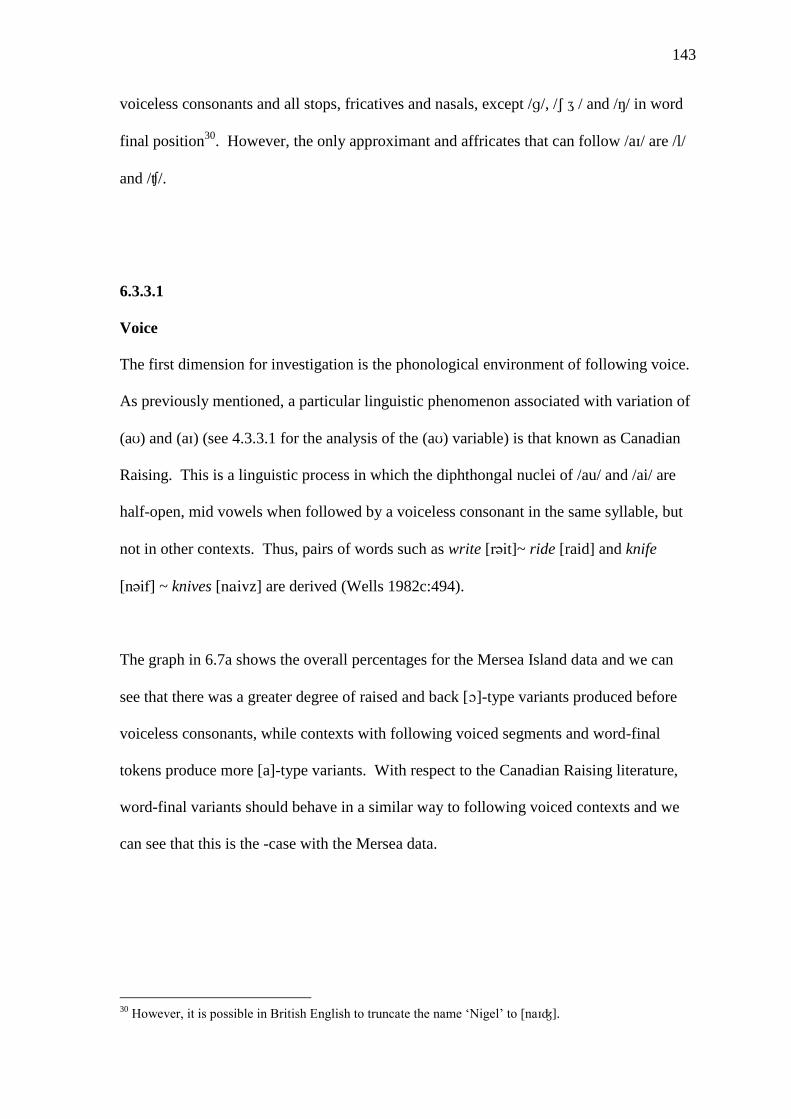
143
voiceless consonants and all stops, fricatives and nasals, except //, / / and // in word
final position30
. However, the only approximant and affricates that can follow /a/ are /l/
and //.
6.3.3.1
Voice
The first dimension for investigation is the phonological environment of following voice.
As previously mentioned, a particular linguistic phenomenon associated with variation of
(a) and (a) (see 4.3.3.1 for the analysis of the (a) variable) is that known as Canadian
Raising. This is a linguistic process in which the diphthongal nuclei of /au/ and /ai/ are
half-open, mid vowels when followed by a voiceless consonant in the same syllable, but
not in other contexts. Thus, pairs of words such as write [t]~ ride [raid] and knife
[] ~ knives [z] are derived (Wells 1982c:494).
The graph in 6.7a shows the overall percentages for the Mersea Island data and we can
see that there was a greater degree of raised and back []-type variants produced before
voiceless consonants, while contexts with following voiced segments and word-final
tokens produce more [a]-type variants. With respect to the Canadian Raising literature,
word-final variants should behave in a similar way to following voiced contexts and we
can see that this is the -case with the Mersea data.
30
However, it is possible in British English to truncate the name ‘Nigel’ to [na].
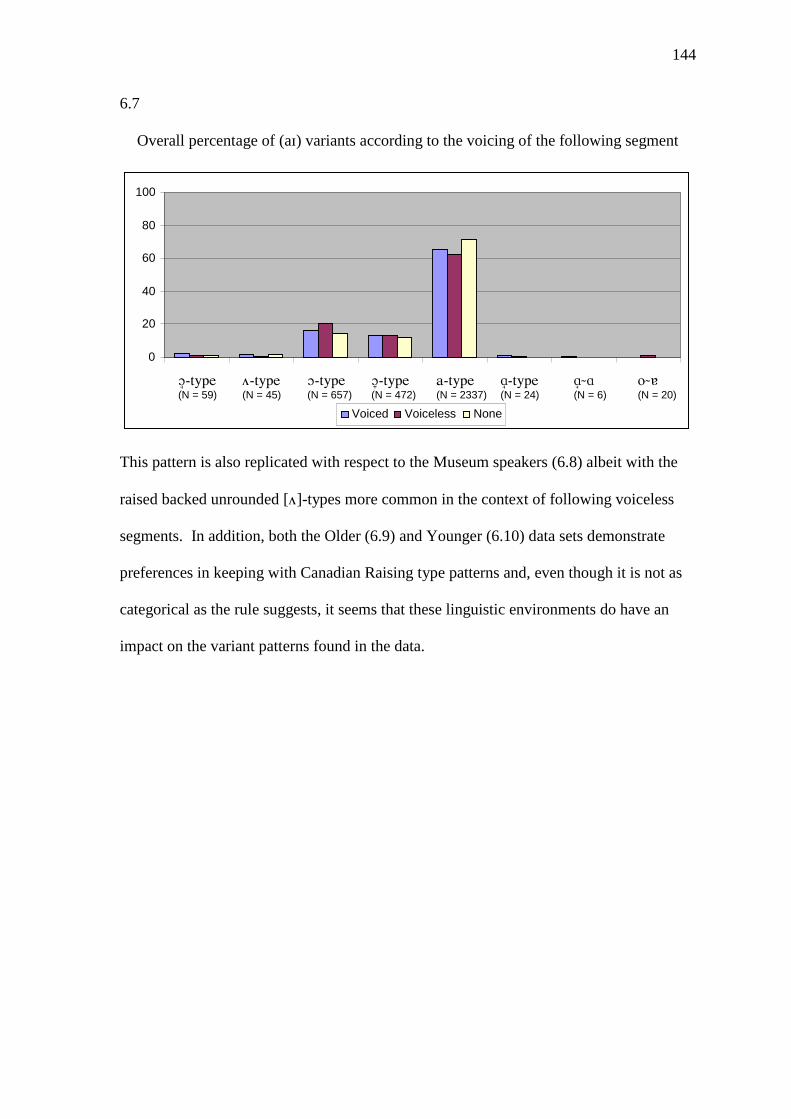
144
6.7
Overall percentage of (a) variants according to the voicing of the following segment
This pattern is also replicated with respect to the Museum speakers (6.8) albeit with the
raised backed unrounded []-types more common in the context of following voiceless
segments. In addition, both the Older (6.9) and Younger (6.10) data sets demonstrate
preferences in keeping with Canadian Raising type patterns and, even though it is not as
categorical as the rule suggests, it seems that these linguistic environments do have an
impact on the variant patterns found in the data.
0
20
40
60
80
100
(N = 59)
(N = 45)
(N = 657)
(N = 472)
(N = 2337)
(N = 24)
(N = 6)
(N = 20)
Voiced Voiceless None

145
6.8 Percentage of (a) variants according to following voice by Museum speakers
6.9 Percentage of (a) variants according to following voice by Older speakers
6.10 Percentage of (a) variants according to following voice by Younger speakers
0
20
40
60
80
100
(N = 35)
(N = 27)
(N = 188)
(N = 23)
(N = 28)
(N = 0)
(N = 1)
(N = 0)
Voiced Voiceless None
0
20
40
60
80
100
(N = 24)
(N = 18)
(N = 434)
(N = 328)
(N = 1184)
(N = 13)
(N = 1)
(N = 6)
Voiced Voiceless None
0
20
40
60
80
100
(N = 0)
(N = 0)
(N = 35)
(N = 121)
(N = 1125)
(N = 11)
(N = 4)
(N = 14)
Voiced Voiceless None
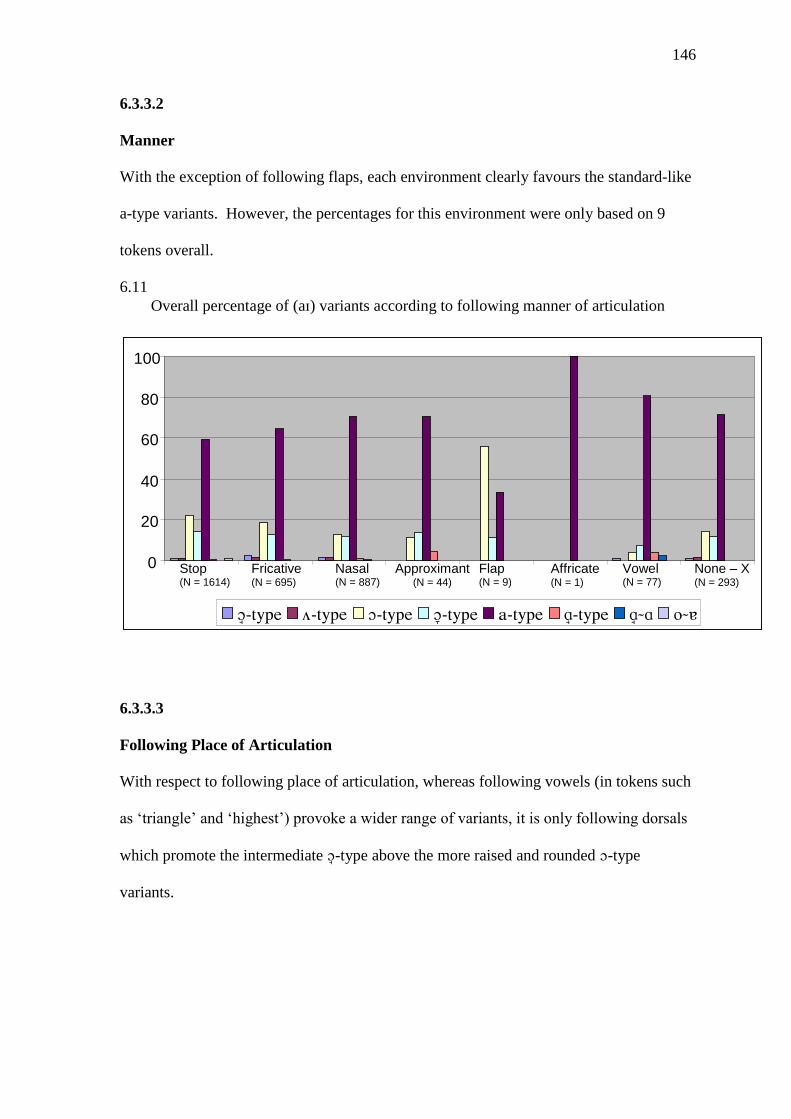
146
6.3.3.2
Manner
With the exception of following flaps, each environment clearly favours the standard-like
a-type variants. However, the percentages for this environment were only based on 9
tokens overall.
6.11
Overall percentage of (a) variants according to following manner of articulation
6.3.3.3
Following Place of Articulation
With respect to following place of articulation, whereas following vowels (in tokens such
as ‘triangle’ and ‘highest’) provoke a wider range of variants, it is only following dorsals
which promote the intermediate -type above the more raised and rounded -type
variants.
0
20
40
60
80
100
Stop (N = 1614)
Fricative (N = 695)
Nasal (N = 887)
Approximant (N = 44)
Flap (N = 9)
Affricate (N = 1)
Vowel (N = 77)
None – X (N = 293)
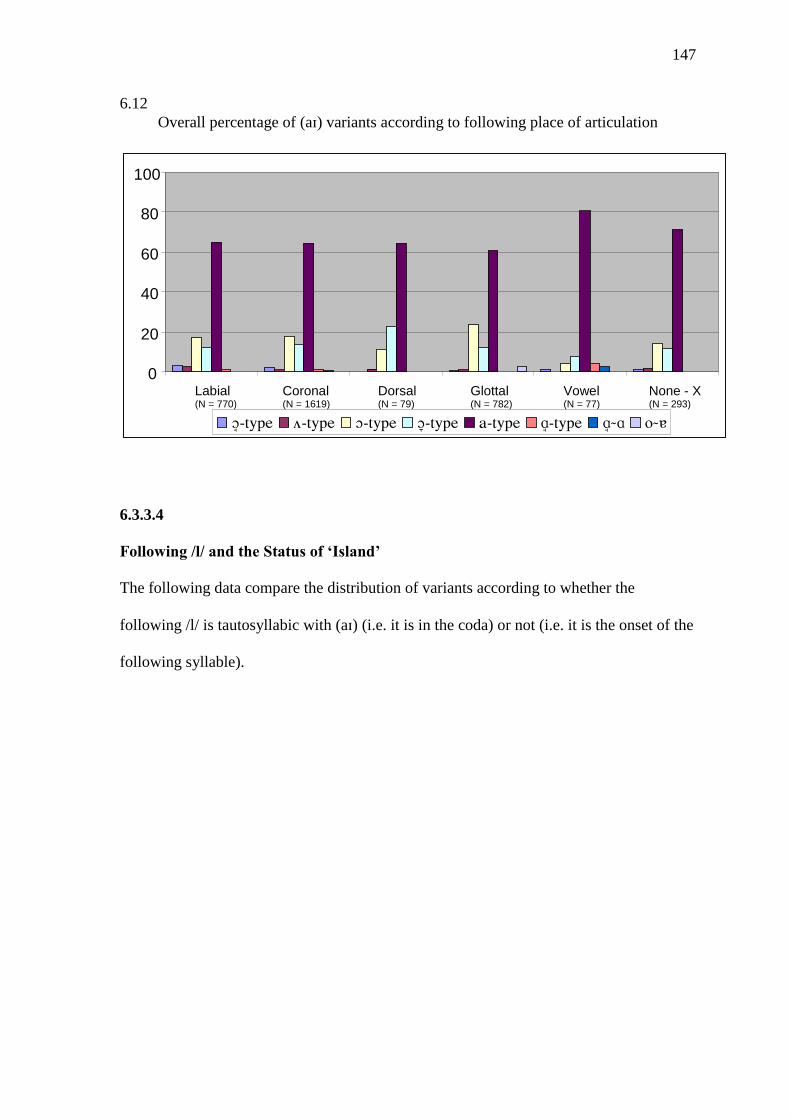
147
6.12
Overall percentage of (a) variants according to following place of articulation
6.3.3.4
Following /l/ and the Status of ‘Island’
The following data compare the distribution of variants according to whether the
following /l/ is tautosyllabic with (a) (i.e. it is in the coda) or not (i.e. it is the onset of the
following syllable).
0
20
40
60
80
100
Labial (N = 770)
Coronal (N = 1619)
Dorsal (N = 79)
Glottal (N = 782)
Vowel (N = 77)
None - X (N = 293)
148
6.13
Overall percentage of (a) variants preceding /l/
The data show that variants with backed [] ~ [] nuclei rarely surface in this context,
while low back open [] ~ [] variants are preferred and, on the surface, there seems little
difference between the influence of /l/ when each phonological position is compared.
However, when the 107 tokens of ‘Island’ are separated from the ‘Non-Coda L’ data, a
quite different pattern emerges.
0
20
40
60
80
100
(N = 2)
(N = 1)
(N = 3)
(N = 41)
(N = 29)
(N = 142)
Coda L Non Coda L
149
6.14
A comparison of the overall percentages of (a) variants according to /l/ type
The data now demonstrate how, with the extraction of ‘Island’, Non-Coda L does not
exhibit any smoothed and backed variants. Instead, ‘Island’ appears to pattern with the
tokens which have a following /l/ in the coda (such as while and tile), particularly with
respect to the use of the backed monophthong []. This is demonstrated by the overall
comparison of diphthong variants versus monophthong variants:
6.15
Overall percentage of Diphthongal vs. Monophthongal variants for the token Island
The data suggest that a monophthong realisation of ‘Island’ is lexically conditioned, since
it does not conform to the expected [] monophthong before coda /l/. In addition, this
0
20
40
60
80
100
(N = 2)
(N = 1)
(N = 3)
(N = 41)
(N = 29)
(N = 142)
Coda L Non Coda L Island
0
20
40
60
80
100
Diphthong (N = 27)
Monophthong (N = 80)
Island

150
pattern could also suggest that the pronunciation of ‘Island’ is a type of iconic marker
within Mersea Island speech (this latter point will be discussed further in Chapter 9
below). Indeed, this pattern is reinforced in each age group. However, as 6.18 illustrates,
the Younger speakers seem to be adopting more diphthongal realisations for ‘Island’
compared to the other two age groups. This could suggest that the lexical effect of this
item on variation is beginning to be lost in Mersea Island English as it converges with the
expected pattern of (a) before a non-coda /l/. However, the limited token numbers for
the Younger speakers (9 tokens) would need to be expanded before this claim could be
established.
151
6.16
Percentage of (a) variants for Island by Museum speakers
6.17
Percentage of (a) variants for Island by Older speakers
6.18
Percentage of (a) variants for Island by Younger speakers
0
20
40
60
80
100
Diphthong (N = 2)
Monophthong (N = 7)
Island
0
20
40
60
80
100
Diphthong (N = 20)
Monophthong (N = 69)
Island
0
20
40
60
80
100
Diphthong (N = 5)
Monophthong (N = 4)
Island
152
6.3.4
LIKE
The analysis of the MIE data yielded 746 tokens of LIKE. These were coded according
to either their grammatical function (298 tokens) or their discursive function (448 tokens)
following D’Arcy (2007). Below are examples of these individual functions from the
Mersea Island data (note - the letters after each example represent the informant’s speaker
ID code):
Grammatical Functions
Lexical Verb: “we didn’t like it” (DS)
Adverb: “he looks like him” (AF)
Conjunction: “it sounded like they were singing” (LD)
Suffix: “factory-like” (DS)
Discourse Functions
Discourse Marker: “Like, my last recording was with this little girl” (SG)
Discourse Particle: “this water's like gonna electrocute everyone” (CL)
Approximate Adverb: “it sat there for ages like days” (TH)
Quotative: “all the children were like "are you recording?" (SG)
The following tables show the overall token count for each category and their
corresponding percentages.
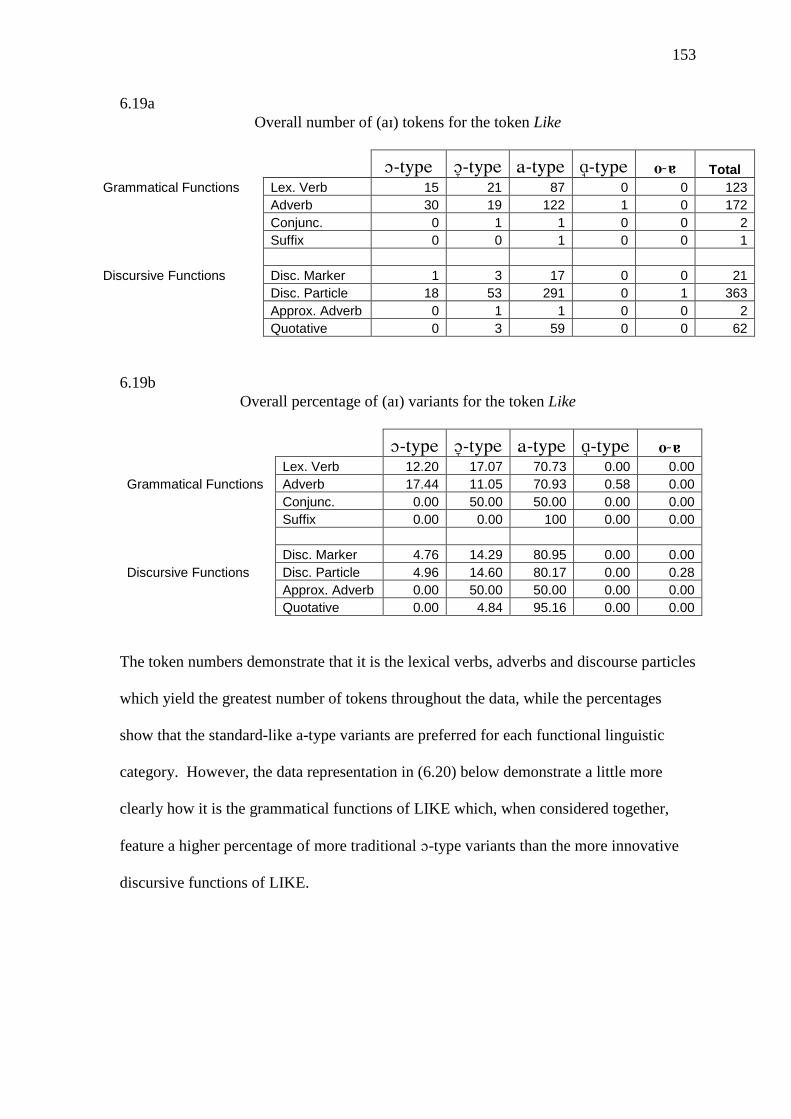
153
6.19a
Overall number of (a) tokens for the token Like
Total
Grammatical Functions Lex. Verb 15 21 87 0 0 123
Adverb 30 19 122 1 0 172
Conjunc. 0 1 1 0 0 2
Suffix 0 0 1 0 0 1
Discursive Functions Disc. Marker 1 3 17 0 0 21
Disc. Particle 18 53 291 0 1 363
Approx. Adverb 0 1 1 0 0 2
Quotative 0 3 59 0 0 62
6.19b
Overall percentage of (a) variants for the token Like
Lex. Verb 12.20 17.07 70.73 0.00 0.00
Grammatical Functions Adverb 17.44 11.05 70.93 0.58 0.00
Conjunc. 0.00 50.00 50.00 0.00 0.00
Suffix 0.00 0.00 100 0.00 0.00
Disc. Marker 4.76 14.29 80.95 0.00 0.00
Discursive Functions Disc. Particle 4.96 14.60 80.17 0.00 0.28
Approx. Adverb 0.00 50.00 50.00 0.00 0.00
Quotative 0.00 4.84 95.16 0.00 0.00
The token numbers demonstrate that it is the lexical verbs, adverbs and discourse particles
which yield the greatest number of tokens throughout the data, while the percentages
show that the standard-like a-type variants are preferred for each functional linguistic
category. However, the data representation in (6.20) below demonstrate a little more
clearly how it is the grammatical functions of LIKE which, when considered together,
feature a higher percentage of more traditional -type variants than the more innovative
discursive functions of LIKE.

154
6.20
An overall comparison of (a) variants according to the functions of LIKE
With respect to individual age groups, the data from the Museum group only produced 9
grammatical tokens (8 of which were [] and one of which was []) and no discursive
tokens. However, when looking at the other two groups, there appears to be little
difference between the variant pattern of grammatical and discursive LIKE in the
Younger speakers (6.22). However, there is a slight difference in the data relating to the
Older group, particularly regarding the greater use of the intermediate -type variants in
discursive functions of LIKE (6.21).
0
20
40
60
80
100
Grammatical Functions (N = 298)
Discursive Functions (N = 448)
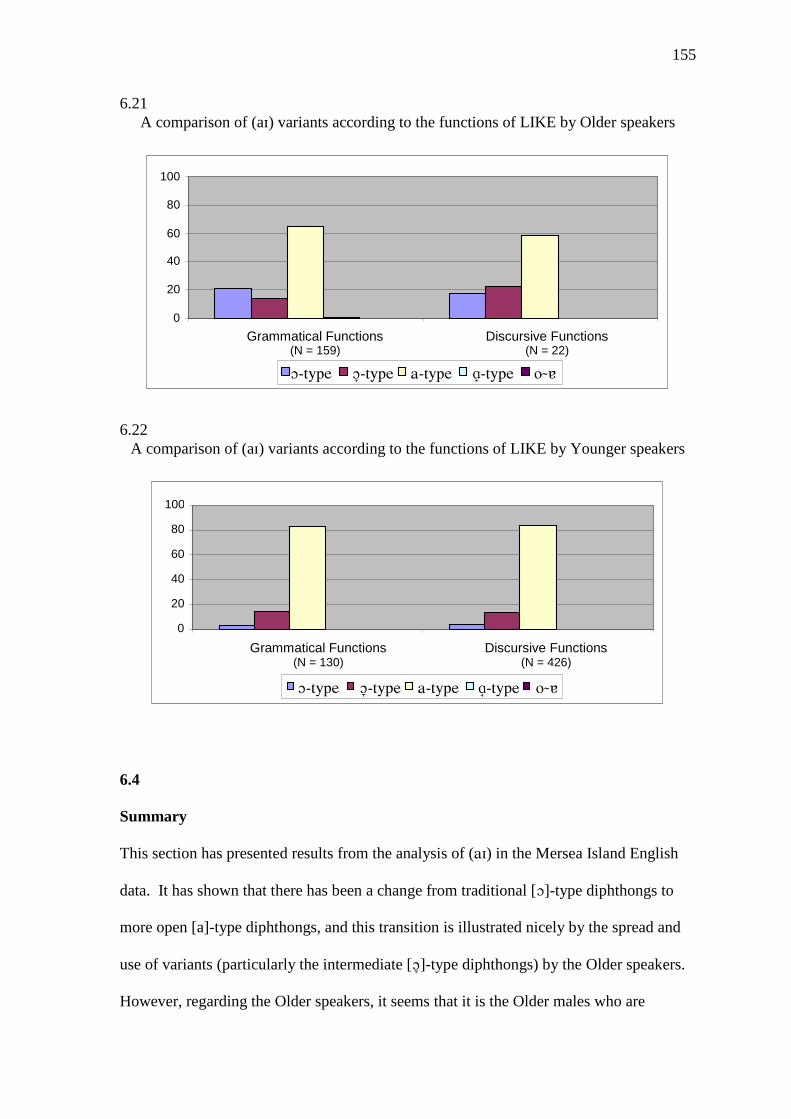
155
6.21
A comparison of (a) variants according to the functions of LIKE by Older speakers
6.22
A comparison of (a) variants according to the functions of LIKE by Younger speakers
6.4
Summary
This section has presented results from the analysis of () in the Mersea Island English
data. It has shown that there has been a change from traditional []-type diphthongs to
more open [a]-type diphthongs, and this transition is illustrated nicely by the spread and
use of variants (particularly the intermediate []-type diphthongs) by the Older speakers.
However, regarding the Older speakers, it seems that it is the Older males who are
0
20
40
60
80
100
Grammatical Functions (N = 159)
Discursive Functions (N = 22)
0
20
40
60
80
100
Grammatical Functions (N = 130)
Discursive Functions (N = 426)
156
retaining the traditional variants to a greater extent than females (and this contrasts with
the behaviour of the Older group regarding the () variable, see Chapter 8 below).
With respect to linguistic factors, we have seen that syllable type, preceding and
following manner of articulation and following place of articulation do not seem to have a
great impact on the type of variant produced. However, it has been shown that preceding
manner of articulation shares some similarities with the analysis of (a) (see sections
4.3.2 and 6.3.2 above) in that preceding dorsal consonants actively promoted lower [a]
nuclei and, thus, wider diphthongs. Once again, this could be one of the phonological
environments leading the change to [a]. Also, an analysis of following voice has shown
that a pattern similar to that of Canadian Raising is present, with more raised diphthongal
nuclei surfacing before voiceless consonants and more open, or lower variants surfacing
before all other environments.
The specific environment of // + /l/ was investigated and results show that, when coda
/l/ and non-coda /l/ data are compared, there appears to be no difference between them, in
terms of the variants used. However, when the token island is extracted from the non-
coda /l/ data, it has been shown that non-coda /l/ tokens favour a diphthongal variant
while coda /l/ tokens and island clearly favour monophthongal variants.
Finally, the investigation of LIKE has shown that, when LIKE functions grammatically, it
correlates with a higher percentage of traditional variants while discursive functions
correlate with more recent [a]-type variants. However, even though the Older group
shows a difference in this direction, there appears to be no contrast in the variant usage
for the Younger speakers.
157
Chapter 7
The Historical Derivation and
Variation of the Variable ()
158
7. THE HISTORICAL DERIVATION AND VARIATION OF THE VARIABLE ()
The following will be a discussion of the derivation of present day // in British English.
Included will be its historical sources, as well as data from historical and present day
dialectal studies, which will demonstrate the type of variation which can be found in
Essex and, more broadly, across the United Kingdom.
7.1
Historical Sources
The variable () represents the stressed diphthong // or what Wells (1982a) classifies as
the CHOICE vowel. Unlike /a/ and /a/, // did not develop as a result of the Great Vowel
Shift. Instead, present day // words are derived from Middle English /i/ and /ui/
diphthongs, and Wells notes that “all CHOICE words are believed to be ultimately loan
words, mainly from French” (1982a:209). Thus, those words which are derived from
Middle English /i/ include boy, oyster and noise, while those which are derived from
Middle English /ui/ include oil, boil (v) and join. In addition, Wells notes that in some
dialects those words derived from Middle English /ui/ developed into [i] or [i] which
resulted in these forms becoming homophones with those of the PRICE set (see below).
In addition to these sources, the CHOICE lexical set is completed by some lexical items
which contained Middle English /i:/ (and thus ‘should’ have developed into present day
/ai/ with the rest of the PRICE set) - for example, the final syllable of employ became
distinct from that of imply (Wells 1982a:209)
159
7.1.1
// and // - a Near or Temporary Merger?
Labov (1994) demonstrates, through literary sources and historical dialect observations,
that an apparent merger between the diphthongs // and // seems to have started around
the fifteenth century. However, even though there is literary evidence at this time, Labov
(1994:307) suggests that general recognition of this merger began to appear in the late
seventeenth century, when pairs such as loin ~ line and oil ~ isle were treated as
homophones.
Following the work by Nunberg, who traced the history and progress of change of the
modern // diphthong, Labov (1994) presents data suggesting that, in the Middle English
period, the // diphthong had two allophonic realisations: [ui], with a high back nucleus,
and [oi], with a mid back nucleus. As the nucleus of the [ui] allophone lowered and
centralised in the seventeenth century, it became close to the developing Middle English
as it progressed towards modern standard /a/. During this centralisation phase, the
allophones of // were affected differently according to phonological context. For
example, // diphthongs in pre-/nt/ environments (e.g. joint) were more likely to
centralise than those in pre-/l/ environments (e.g. boil). As a result, Labov notes that,
during this period, “the reflexes of ME and the originally high allophones of /oy/ were
[…] of close approximation”31
(1994:375). This can be illustrated as follows:
31
Note, Labov uses /oy/ to represent //
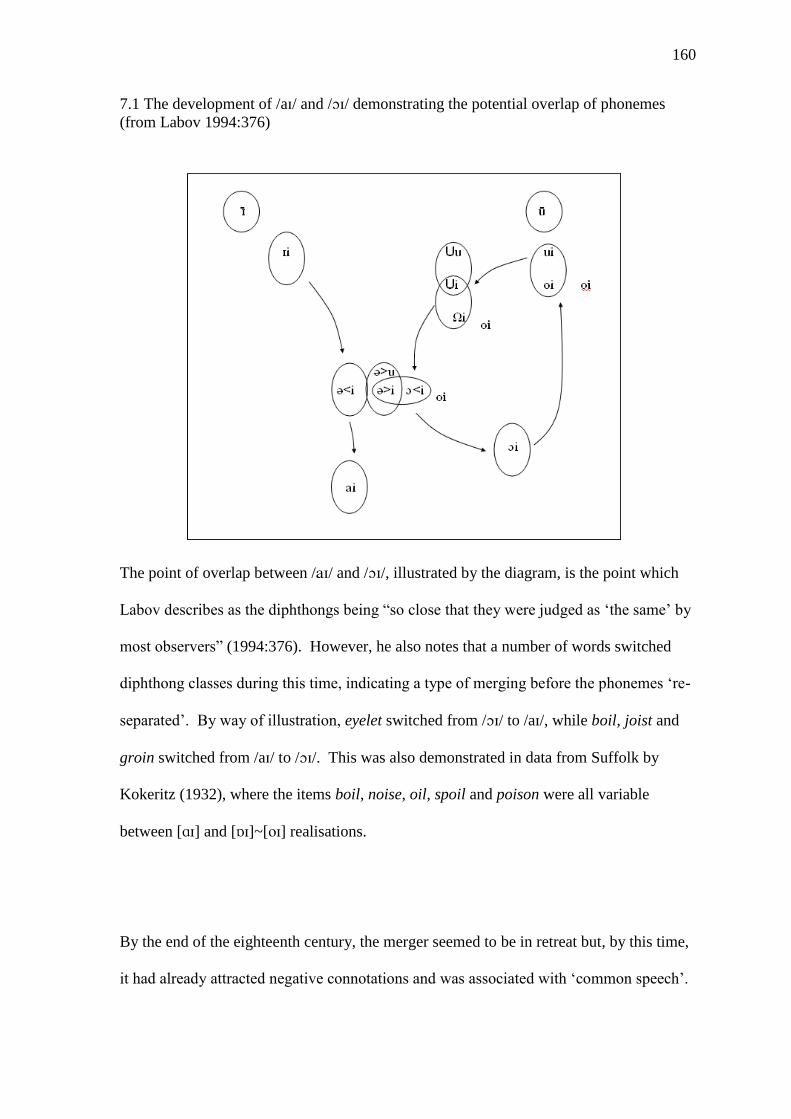
160
7.1 The development of /a/ and // demonstrating the potential overlap of phonemes
(from Labov 1994:376)
The point of overlap between // and //, illustrated by the diagram, is the point which
Labov describes as the diphthongs being “so close that they were judged as ‘the same’ by
most observers” (1994:376). However, he also notes that a number of words switched
diphthong classes during this time, indicating a type of merging before the phonemes ‘re-
separated’. By way of illustration, eyelet switched from // to /a/, while boil, joist and
groin switched from /a/ to //. This was also demonstrated in data from Suffolk by
Kokeritz (1932), where the items boil, noise, oil, spoil and poison were all variable
between [] and []~[] realisations.
By the end of the eighteenth century, the merger seemed to be in retreat but, by this time,
it had already attracted negative connotations and was associated with ‘common speech’.
161
However, the process of de-merging these two diphthongs continued and they remain
distinct in Modern English dialects. This, Labov (1994:308-309) notes, is true of a wide
range of British English dialects (including those representing the London vernacular,
Southern British dialects as well as Birmingham and Manchester dialects). The only
exception, Labov indicates, where the // and // merger “appears in current dialect
records [is] the county of Essex in the southeast” (1994:309).
Using data from the Survey of English Dialects, Labov extracted /a/ and // data from
seventeen locations across the county of Essex. Nine of these locations demonstrated a
merger between the diphthongs, while only two had distinct realisations for /a/ and //.
The remainder of locations, however, demonstrated separate realisations for /a/ and //,
but, phonetically, the differences between them were smaller, [] and [], respectively.
This was substantiated by Labov’s own analysis of data from the east Essex village of
Tillingham (which was fully merged in the SED data). However, spectrographic analyses
conducted by Labov suggested that the realisations of the ‘merged’ diphthongs were
phonetically distinct. This led Labov to hypothesise that, even though a merger was
perceived, “/ay/ and /oy/ were not completely merged in the eighteenth century, but only
closely approximated in a near merger” (1994:384).

162
7.2
Historical Variation
The following section will focus on data from the selection of historical data sources as
outlined in 2.4 above.
7.2.1
Ellis (1889)
Even though Ellis does not give any specific commentary on this variable in Essex, his
data suggest that at least some parts of Essex retained the split in which () is
pronounced differently in tokens derived from Middle English /ui/. For example, the five
items which were present in the Essex word-list data predominantly show a rounded [o]
for the diphthongal nucleus in the words boy and voice, while an open [a] nucleus is
present in spoil, boil (v) and oil.
Lexical Item Transcription in Ellis
(1889)
Vowel translation of Ellis
using Eustace (1969)
Boy bo b
Voice wois ws
Spoil spa’il spl
Boil (v) ba’il bl
Oil a’il l
163
However, it is interesting to note that these forms do not seem to be homophonous with
the PRICE set in Ellis’ survey. Indeed, as noted above in section 5.3.1, the predominant
pronunciation of the PRICE vowel has a lower and backed rounded nucleus. As a result,
the PRICE set represents [], which contrasts with both sets above with respect to height
and lip rounding. Therefore, it seems that the above tokens (in which () precedes /l/)
are not homophones with (ai), but have remained distinct from the rest of the () set
through a lowering of the nucleus.
7.2.2
Kurath and Lowman (1970)
The dialect study conducted by Kurath and Lowman indicates that data from around
locations in East Essex and West Essex (towards London and Middlesex) include
derivatives of Middle English /oi/ and /ui/ surviving as distinct phonemes [o] and [],
respectively (Kurath and Lowman 1970:26). Thus, in these areas, point and oil rhyme
with pint and mile. However, this distinction is not represented in the data from the SED
(see below) suggesting that this dialect feature was receding at the time of these studies.
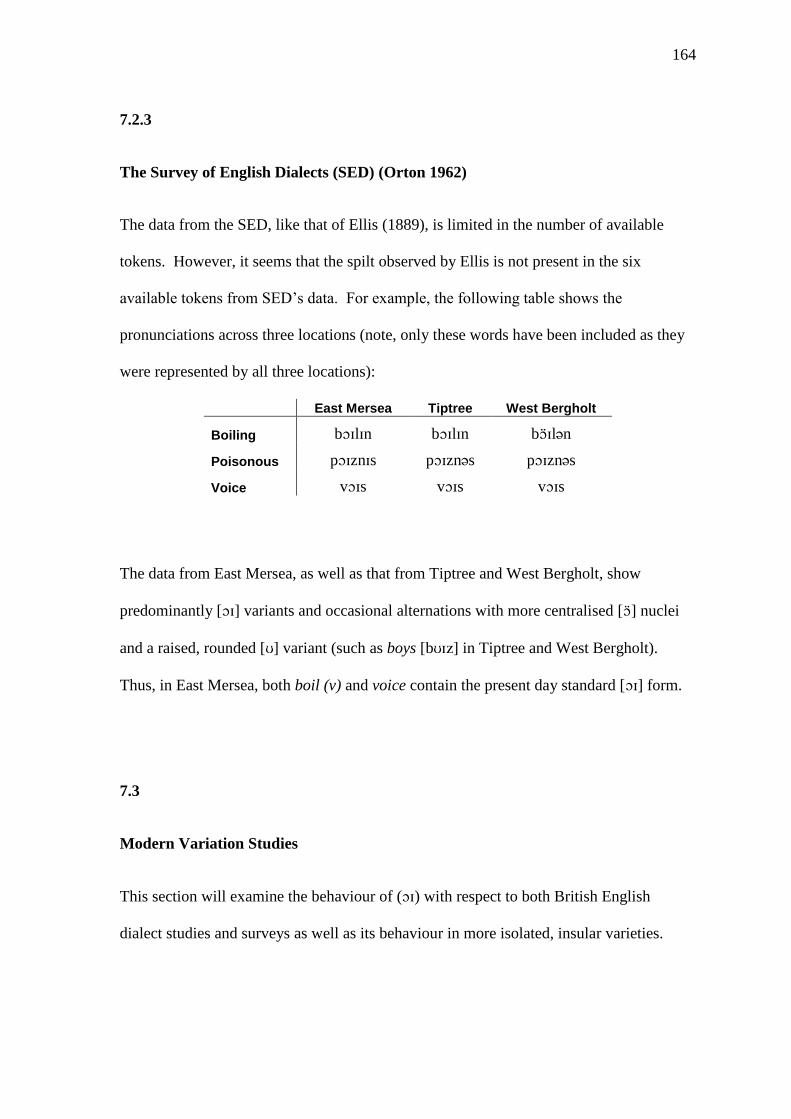
164
7.2.3
The Survey of English Dialects (SED) (Orton 1962)
The data from the SED, like that of Ellis (1889), is limited in the number of available
tokens. However, it seems that the spilt observed by Ellis is not present in the six
available tokens from SED’s data. For example, the following table shows the
pronunciations across three locations (note, only these words have been included as they
were represented by all three locations):
East Mersea Tiptree West Bergholt
Boiling bln bln bln
Poisonous pzns pzns pzns
Voice vs vs vs
The data from East Mersea, as well as that from Tiptree and West Bergholt, show
predominantly [] variants and occasional alternations with more centralised [] nuclei
and a raised, rounded [] variant (such as boys [b] in Tiptree and West Bergholt).
Thus, in East Mersea, both boil (v) and voice contain the present day standard [] form.
7.3
Modern Variation Studies
This section will examine the behaviour of () with respect to both British English
dialect studies and surveys as well as its behaviour in more isolated, insular varieties.
165
7.3.1
British English
Despite its intriguing historical development, there has been no systematic sociolinguistic
study of () within the British Isles. However, researchers have mentioned it in passing
when conducting broader dialect surveys.
For example, in Newcastle, Derby, Sheffield, Milton Keynes, Reading and Hull (see
Foulkes and Docherty (1999) for information on the individual studies), the CHOICE
vowel is noted simply as the standard [] variant. The wide geographical range of these
locations indicates the regional variation, with respect to this variable is minimal.
However, Trudgill (1999:130) notes that, in Norwich, the lexical item boil has a
noticeable PRICE vowel, though he remarks that this feature is very recessive. Other
variants of () in Norwich which Trudgill notes, range from [i], the most local form, to
the standard [].
Additional variation observed by Tollfree (1999:168) in South East London is that, in this
area, the CHOICE nucleus ranges between a rounded [o] and a more open [], while
younger speakers may use a very advanced or centralised nucleus, producing a diphthong
of an [o ] quality.
166
7.3.2
International Insular Variation
This section will specifically focus upon modern studies of insular communities. These
studies will highlight the behaviour of () in communities with unique socio-
demographic histories to see if any parallels may be drawn between them and the
behaviour of () in British English dialects.
7.3.2.1
The Falkland Islands32
Sudbury (2000) and Sudbury and Britain (2000), while including () in the overall
description of Falkland Island English (FIE), do not discuss the variable in detail.
However, the diphthongal quality [] reflects that of Standard British English and
Sudbury notes that this realisation “is consistent with all the historical sources and other
southern hemisphere varieties” (Sudbury 2000:180).
7.3.2.2
St Helena33
The quality of // in St Helenian English (StHE) was found by Schreier (2008; 2010a) to
have a close back and slightly raised [o ]-type nucleus (another indication, Schreier
claims, that StHE has taken part in some aspects of the Diphthong Shift) as well as a more
centralised [] offglide. In addition to this, Schreier (2008; 2010a) observes how one
speaker exhibited an // diphthong for certain // items, such as boil. This use of what
Schreier calls ‘an archaic dialect feature’ could be a remnant of the British inputs brought
to the island by the early settlers, possibly those who came from the southeast of England
32
See Chapters 3 and 5 for an overview of the Falkland’s historical development. 33
See Chapters 3 and 5 for an overview of St Helena’s historical development.

167
in the early part of the eighteenth century. However, Schreier suggests that we should
“probably not interpret too much here since this realisation is rare and unusual in StHE”
(2008:171).
7.3.2.3
Tristan da Cunha34
The // diphthong in Tristan da Cunhan English (TdCE) has a close back nucleus of an
[o]-type quality. However, unlike StHE, there is no raising of the nucleus towards [o ].
Therefore, Schreier suggests that this diphthong has not taken part in the Diphthong Shift,
which he claims has affected the realisation of /a/., see section 5.5.5 above.
The use of the // diphthong for // also features in TdCE, and Schreier (2010b)
observes that it is also reflected in some local place names. This suggests that this dialect
feature was transported to the island during its early colonisation and that the denseness
of the social structure has helped in its preservation.
7.4
Summary
The Standard English diphthong has been shown to have a range of historical sources.
Looking at historical data, it has been found that, in some parts of Essex, lexical items
which have derived // via Middle English /ui/ have adopted an [a]-type nucleus to the
diphthong, such as [spail] spoil. Even though this split has been attested in Essex and
other areas of East Anglia, it seems that this feature has receded in favour of diphthongs
with a more standard-like quality //. However, present day variation of this diphthong
34
See Chapters 3 and 5 for an overview of Tristan da Cunha’s historical development.
168
does not reflect a use of [a] nuclei. Instead, the variation studies presented here
demonstrate that the realisation of this diphthong may include a degree of nucleus
centralisation ([] ~ []) and raising ([o]).
The dialect evidence from British-colonised insular communities mentioned above
demonstrates that lingering mergers of some // items with the // diphthong is still
possible, but only in the most conservative speech on St Helena and Tristan da Cunha. In
contrast, FIE represents a British standard-like // diphthong, suggesting that any merged
forms transported to the island by early settlers have been lost.

169
Chapter 8
() - An Analysis of Social and
Linguistic Factors
170
8. THE ANALYSIS OF () 35
The following sections will present the results generated for the variable () in Mersea
Island English. Initially, the social dimensions of age and gender will be explored before
attention is turned to an examination of linguistic factors.
8.1
() – The Variants
286 tokens of () were extracted from the data and were coded according to the
methodology outlined in Chapter 2 above. The four variants identified throughout the
data differ with respect to the degree of backness and lip-rounding:
~ ~ ~ 36
8.2
Social Factors
This section will outline the results pertaining to () with respect to the social factors of
age and gender.
8.2.1
Age
The data in 8.1 show the distribution of () variants according to the age of the speaker.
It can be seen that the standard variant [] is the majority variant for all three age groups.
35
Examples of () tokens according to phonological environment can be found in Appendix D (3a) and
(3b) 36
Note: even though this variant has been included in the subsequent analysis, it only surfaced 5 times. In
each, it was before a tautosyllabic /l/ in the items ‘oil’, ‘coil’ and ‘coils’.
171
However, it can also be seen that it is only the Museum and Older speakers who use the
most traditional rounded and centralised variant ([]).
8.1a
Percentage of () variants according to age
Young 0.00 4.76 95.24 0.00
Old 25.14 13.14 58.86 2.86
Museum 29.63 3.70 66.67 0.00
8.1b
Percentage of () variants according to age
While the older speakers retain almost the same level of [] compared to the Museum
speakers, they exhibit higher levels of the seemingly intermediate [] variant. This is
another possible indication of the transitional nature of this speaker group.
0
20
40
60
80
100
Museum (N = 27)
Old (N = 175)
Young (N = 84)
172
8.2.2
Age and Gender
When the data are broken down by both age and gender, it is the behaviour of the Older
females that stands out, since it is this group which uses the highest percentage of [] and
[] (33.7% and 18.6%, respectively) compared to any other group.
8.2
Percentage of () variants according to age and gender
Thus, it seems to be the Older females who are utilizing the [] form more than their
male counterparts. Indeed, this is a higher percentage than even the Museum speakers
(who were all male).
0
20
40
60
80
100
Male (N = 45)
Female (N = 39)
Male (N = 89)
Female (N = 86)
Male (N = 27)
Young Old Museum
173
8.3
Linguistic Factors
This section will discuss and present the details of () variation according to the
linguistic factors of syllable type, phonological environment and lexical item.
8.3.1
Syllable Type
When we look at the overall data, we can see that neither syllable type appears to
influence the choice of variant, except in the case of [] which only occurs in closed
syllables. However, as already noted above, these tokens were all in the context of coda
/l/.
8.3
Overall usage of () variants according to syllable type
Once the data are broken down to show the individual age groups, we can see that the
older groups show a distinct preference for [] in closed syllables compared to open
syllables (8.4).
0
20
40
60
80
100
Open (N = 144)
Closed (N = 142)
174
8.4
Percentage of () variants according to age and syllable type
This observation is also apparent among the individual age and gender groups. The male
Museum speakers (8.5a) demonstrate a preference for [] in closed syllables and this
preference is also reflected in the data for the Older females (8.5b). With respect to the
Museum data, even though there were only 5 tokens of () in closed syllables, it is
interesting to note that the 3 [] tokens represented the lexical item ‘boys’ (while the
remaining two were ‘join’). This observation and the seemingly special status of BOY
will be discussed in more detail throughout the remainder of this analysis.
0
20
40
60
80
100
Open (N = 36)
Closed (N = 48)
Open (N = 86)
Closed (N = 89)
Open (N = 22)
Closed (N = 5)
Young Old Museum
175
8.5a
Percentage of () variants used by Mersea males according to age and syllable type
8.5b
Percentage of () variants used by Mersea females according to age and syllable type
0
20
40
60
80
100
Open (N = 23)
Closed (N = 22)
Open (N = 46)
Closed (N = 43)
Open (N = 22)
Closed (N = 5)
Young Old
Museum
0
20
40
60
80
100
Open (N = 13)
Closed (N = 26)
Open (N = 40)
Closed (N = 46)
Young Old

176
8.3.2
Phonological Environments
When investigating preceding and following phonological environments, the correlation
between variant patterns and the lexical item ‘boy’ (together with its derivative ‘boys’)
which was previously alluded to with respect to syllable type, is reoccurring. For
example, due to the BOY effect, which sees a higher correlation of [] following the
labial stop in the items ‘boy’ and ‘boys’, () in word final position and before fricatives
show a higher percentage of []. Therefore, due to the biased nature of the following
phonological environment data, together with the distributional restrictions outlined in
section 2.3.1.2.3 above, only preceding phonological environments will be discussed here
to illustrate and establish the BOY effect. (For a break down of following phonological
environments plus graphs, see Appendix C.16-C.27).
8.3.2.1
Preceding Place of Articulation
The preceding place of articulation demonstrates that it is a preceding labial place which
promotes the rounded [] variant considerably more than any other category. This can
be seen in the overall data provided in 8.6 below. However, it is also interesting that the
3 tokens of preceding [sp] (all produced by older females) do not provoke an [] variant,
despite the labial quality of the adjacent [p]. This is perhaps an indication of the /s/-
cluster’s status as a complex segment, as opposed to two separate segments where the
second element has a full LABIAL specification.
177
8.6
The overall percentages for () variants by Mersea Island speakers according to
preceding place of articulation
The correlation between preceding labials and [] is also apparent throughout each
individual age group, and it is the only environment in which young speakers were found
to deviate from the standard [] variant as a comparison of the graphs in 8.7, 8.8 and 8.9
will illustrate. However, it is not surprising, perhaps, that a preceding labial articulation
would promote a more rounded vowel articulation due to a coarticulatory effect which
spreads the LABIAL feature. However, the data for preceding manner also highlight a
particular correlation which cannot be explained so easily.
0
20
40
60
80
100
Labial (N = 157)
Coronal (N = 77)
Dorsal (N = 3)
Word-initial (N = 46)
[sp] (N = 3)
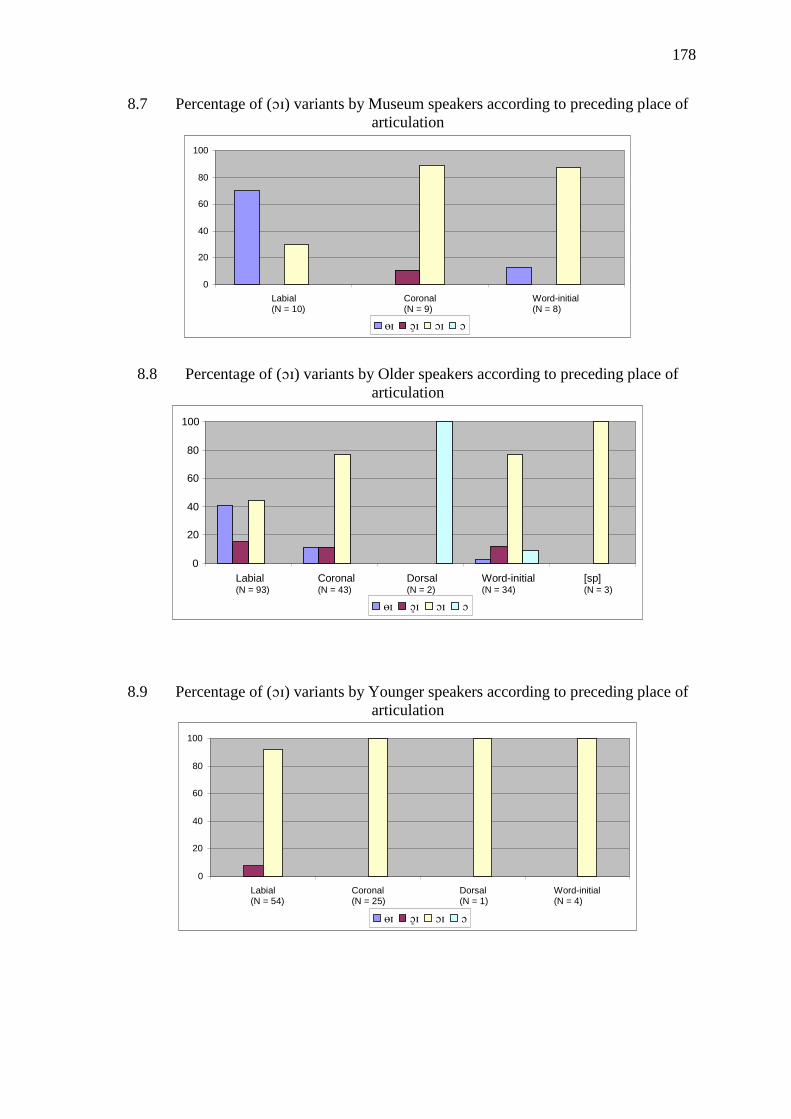
178
8.7 Percentage of () variants by Museum speakers according to preceding place of
articulation
8.8 Percentage of () variants by Older speakers according to preceding place of
articulation
8.9 Percentage of () variants by Younger speakers according to preceding place of
articulation
0
20
40
60
80
100
Labial (N = 10)
Coronal (N = 9)
Word-initial (N = 8)
0
20
40
60
80
100
Labial (N = 93)
Coronal (N = 43)
Dorsal (N = 2)
Word-initial (N = 34)
[sp] (N = 3)
0
20
40
60
80
100
Labial (N = 54)
Coronal (N = 25)
Dorsal (N = 1)
Word-initial (N = 4)
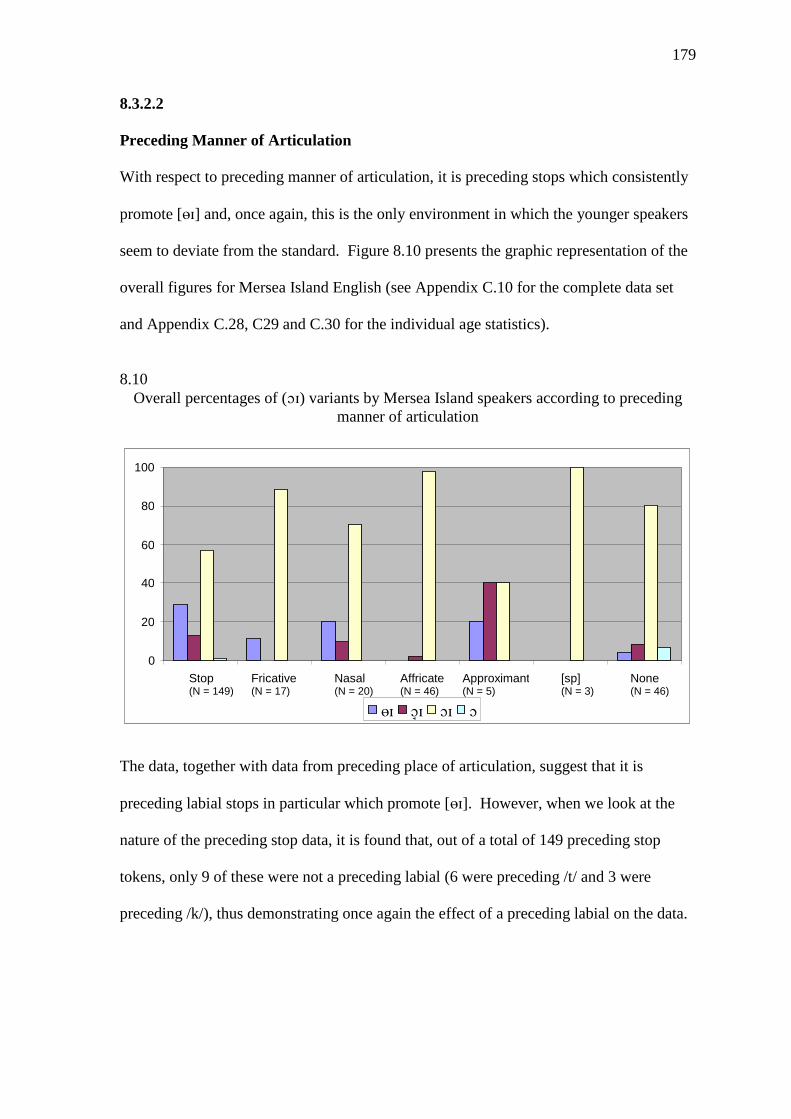
179
8.3.2.2
Preceding Manner of Articulation
With respect to preceding manner of articulation, it is preceding stops which consistently
promote [] and, once again, this is the only environment in which the younger speakers
seem to deviate from the standard. Figure 8.10 presents the graphic representation of the
overall figures for Mersea Island English (see Appendix C.10 for the complete data set
and Appendix C.28, C29 and C.30 for the individual age statistics).
8.10
Overall percentages of () variants by Mersea Island speakers according to preceding
manner of articulation
The data, together with data from preceding place of articulation, suggest that it is
preceding labial stops in particular which promote []. However, when we look at the
nature of the preceding stop data, it is found that, out of a total of 149 preceding stop
tokens, only 9 of these were not a preceding labial (6 were preceding /t/ and 3 were
preceding /k/), thus demonstrating once again the effect of a preceding labial on the data.
0
20
40
60
80
100
Stop (N = 149)
Fricative (N = 17)
Nasal (N = 20)
Affricate (N = 46)
Approximant (N = 5)
[sp] (N = 3)
None (N = 46)
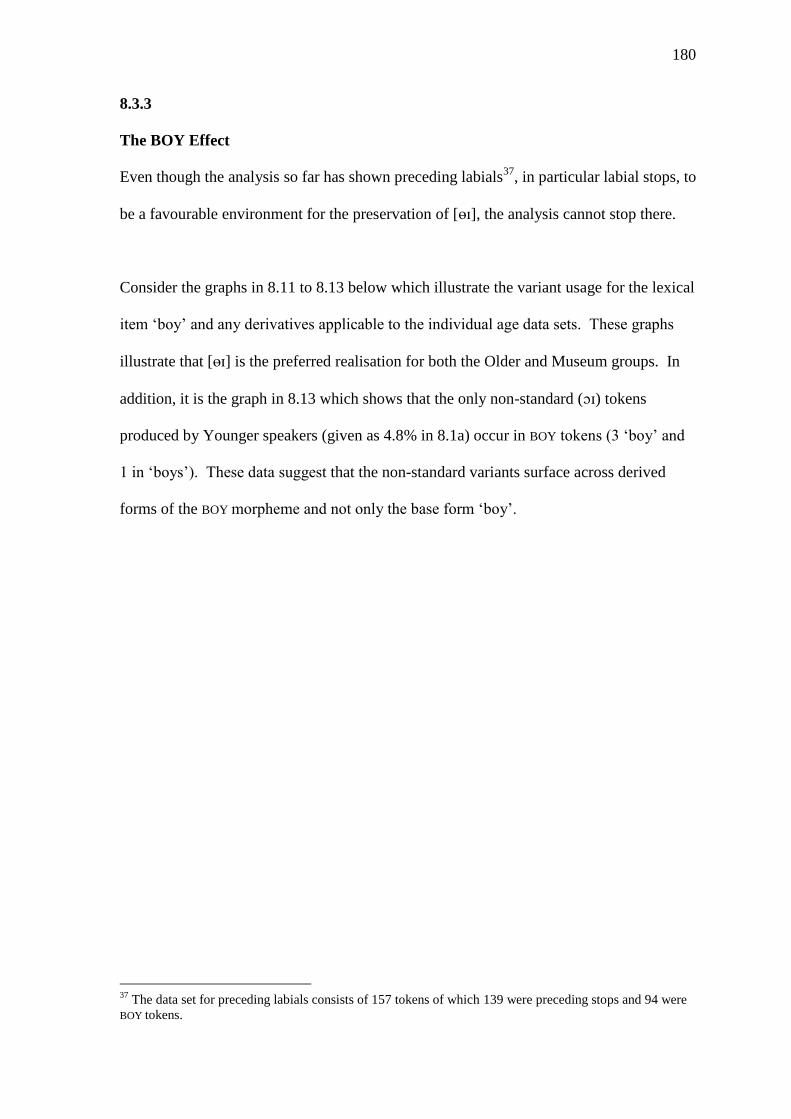
180
8.3.3
The BOY Effect
Even though the analysis so far has shown preceding labials37
, in particular labial stops, to
be a favourable environment for the preservation of [], the analysis cannot stop there.
Consider the graphs in 8.11 to 8.13 below which illustrate the variant usage for the lexical
item ‘boy’ and any derivatives applicable to the individual age data sets. These graphs
illustrate that [] is the preferred realisation for both the Older and Museum groups. In
addition, it is the graph in 8.13 which shows that the only non-standard () tokens
produced by Younger speakers (given as 4.8% in 8.1a) occur in BOY tokens (3 ‘boy’ and
1 in ‘boys’). These data suggest that the non-standard variants surface across derived
forms of the BOY morpheme and not only the base form ‘boy’.
37
The data set for preceding labials consists of 157 tokens of which 139 were preceding stops and 94 were
BOY tokens.

181
8.11 Percentage of () variants across lexically derived BOY tokens by Museum speakers
8.12 Percentage of () variants across lexically derived BOY tokens by Older speakers
8.13 Percentage of () variants across lexically derived BOY tokens by Younger speakers
0
20
40
60
80
100
boy (N = 6)
boys (N = 3)
0
20
40
60
80
100
boy (N = 35)
boys (N = 33)
boy's (N = 1)
0
20
40
60
80
100
boy (N = 10)
boys (N = 3)
boyfriend (N = 1)
boyish (N = 1)
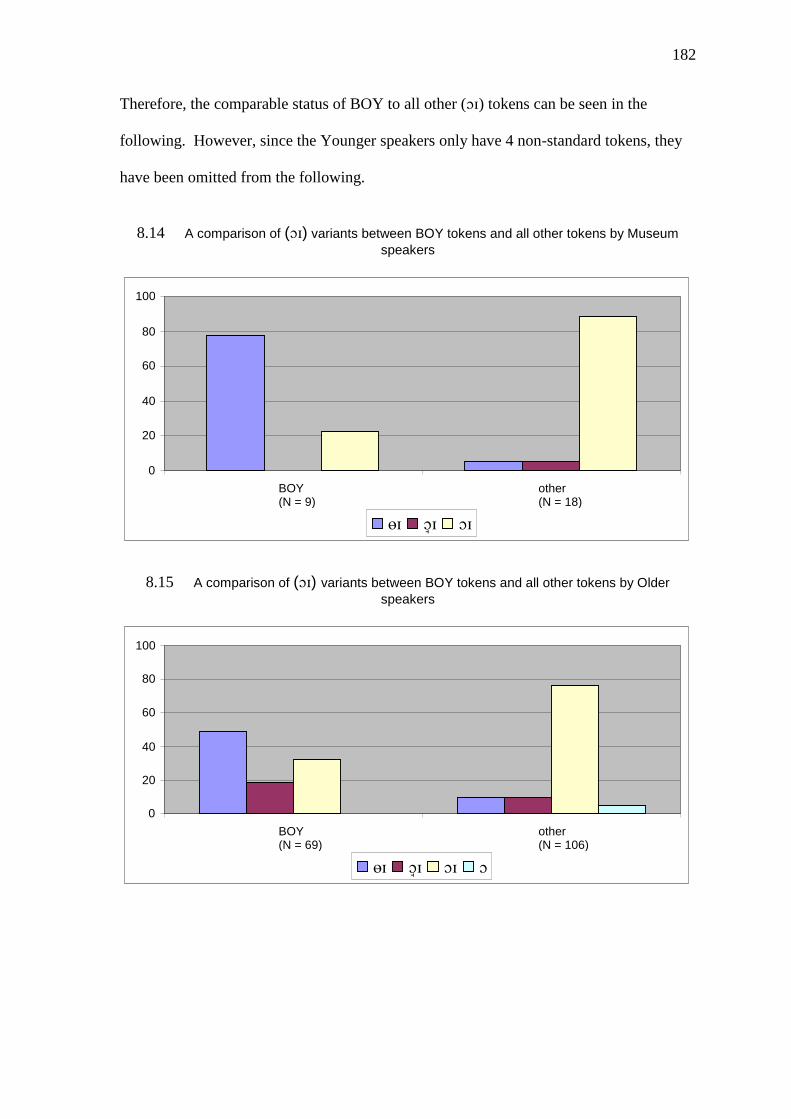
182
Therefore, the comparable status of BOY to all other () tokens can be seen in the
following. However, since the Younger speakers only have 4 non-standard tokens, they
have been omitted from the following.
8.14 A comparison of () variants between BOY tokens and all other tokens by Museum
speakers
8.15 A comparison of () variants between BOY tokens and all other tokens by Older
speakers
0
20
40
60
80
100
BOY (N = 9)
other (N = 18)
0
20
40
60
80
100
BOY (N = 69)
other (N = 106)
183
The asymmetry between BOY tokens and Other tokens is clear for both age groups. This
suggests that a type of lexical effect has attached to BOY and has thus enabled it to
preserve the traditional dialect feature to a greater extent than other words. Another
factor which may have caused the preservation of [] in these words is that boy is often
used in the performance phrase ‘my boy’ [ ] when Mersea Islanders are discussing
the speech of their elders or peers. For example, “oh, it’s always [m b] this or [m
bz] that” (from an Older Mersea speaker). Wolfram and Schilling-Estes (2006, for
example) note that a dialect performance is where speakers enhance the vernacular for
demonstration purposes and that performance phrases are specific rote phrases, which
highlight a number of dialect features. These practiced phrases act as preservers of
certain salient dialect features for native speakers and, thus, will help to preserve certain
forms within these specific contexts. However, even though the amount of data is
restricted with respect to token numbers, this effect seems to be receding as the Younger
group does not appear to have the [] variant to the same degree as the previous
generation, even in the context of BOY tokens.
8.4
Summary
The analysis of the () variable has shown that the standard diphthong [] is the
favoured variant across each age and gender group. However, once again the transitional
nature of the Older generation can be seen. This group not only has a relatively high level
of traditional [], but also the highest level of the intermediate [] variant and it is the
females in this group who are retaining the traditional forms more than the males.
184
Linguistic factors appear, at first, to play a role with respect to preceding place and
manner of articulation. However, even though the analysis initially shows that preceding
labials and stops act as the main preservers of the traditional [] form, a closer look
suggests that it is in fact the preceding labial stop associated with the lexical item BOY
which is the source of most [] forms within the data.
185
Chapter 9
Mersea Island English -
Sociolinguistic Considerations

186
9. MIE - SOCIOLINGUISTIC CONSIDERATIONS
This chapter will discuss the data presented in Chapters 4, 6 and 8 in more detail. The
variant patterns discovered in the MIE data will be considered alongside sociolinguistic
issues relating to linguistic change (such as change through contact), the creation of
iconic markers within a dialect, as well as language change being the product of more
‘natural’ linguistic tendencies and motivations. We will see how the use of certain
variants in dialect performance can act as preservers of traditional forms and may also
indicate whether certain phonological rules are encoded in the dialect grammar. In
addition, we will discuss how socio-demographic change can lead to the widening of
social networks and social practices and how this may be linked to the creation of supra-
local variants.
9.1
The Direction of Change
The data analysis of MIE has shown that, while the Museum speakers predominantly use
the older and more traditional forms of all three variables, the Younger speakers use more
of the innovative forms. However, even though there is variation in these age groups,
neither exhibits quite the extent of variation as the Older speaker group.
Though variation in a language or dialect can indicate a state of stable variation (that is,
variation which occurs between variants with none evolving to become the primary
variant over time), when it is indicative of change, age is the primary social factor with
which the variation correlates. Therefore, when looking at variation in sociolinguistic
data in either real or apparent time, change is indicated when a variant, which is least
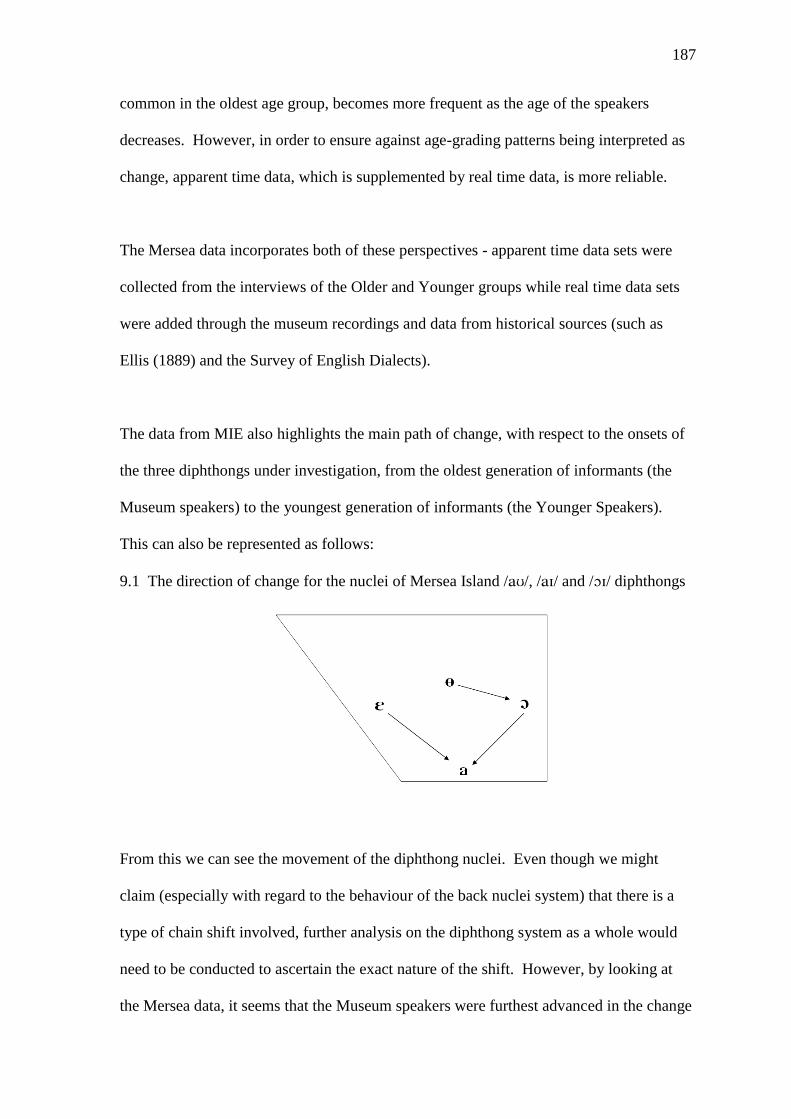
187
common in the oldest age group, becomes more frequent as the age of the speakers
decreases. However, in order to ensure against age-grading patterns being interpreted as
change, apparent time data, which is supplemented by real time data, is more reliable.
The Mersea data incorporates both of these perspectives - apparent time data sets were
collected from the interviews of the Older and Younger groups while real time data sets
were added through the museum recordings and data from historical sources (such as
Ellis (1889) and the Survey of English Dialects).
The data from MIE also highlights the main path of change, with respect to the onsets of
the three diphthongs under investigation, from the oldest generation of informants (the
Museum speakers) to the youngest generation of informants (the Younger Speakers).
This can also be represented as follows:
9.1 The direction of change for the nuclei of Mersea Island //, // and // diphthongs
From this we can see the movement of the diphthong nuclei. Even though we might
claim (especially with regard to the behaviour of the back nuclei system) that there is a
type of chain shift involved, further analysis on the diphthong system as a whole would
need to be conducted to ascertain the exact nature of the shift. However, by looking at
the Mersea data, it seems that the Museum speakers were furthest advanced in the change
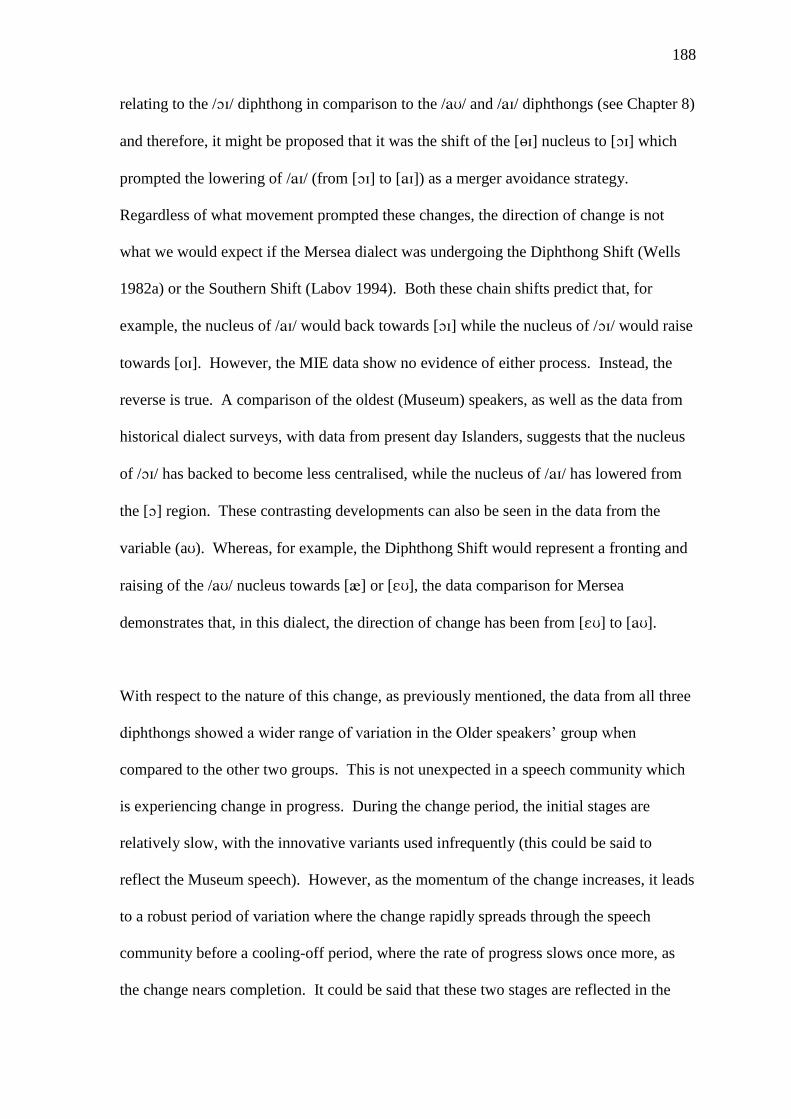
188
relating to the // diphthong in comparison to the // and // diphthongs (see Chapter 8)
and therefore, it might be proposed that it was the shift of the [] nucleus to [] which
prompted the lowering of // (from [] to []) as a merger avoidance strategy.
Regardless of what movement prompted these changes, the direction of change is not
what we would expect if the Mersea dialect was undergoing the Diphthong Shift (Wells
1982a) or the Southern Shift (Labov 1994). Both these chain shifts predict that, for
example, the nucleus of // would back towards [] while the nucleus of // would raise
towards []. However, the MIE data show no evidence of either process. Instead, the
reverse is true. A comparison of the oldest (Museum) speakers, as well as the data from
historical dialect surveys, with data from present day Islanders, suggests that the nucleus
of // has backed to become less centralised, while the nucleus of // has lowered from
the [] region. These contrasting developments can also be seen in the data from the
variable (a). Whereas, for example, the Diphthong Shift would represent a fronting and
raising of the // nucleus towards [] or [], the data comparison for Mersea
demonstrates that, in this dialect, the direction of change has been from [] to [].
With respect to the nature of this change, as previously mentioned, the data from all three
diphthongs showed a wider range of variation in the Older speakers’ group when
compared to the other two groups. This is not unexpected in a speech community which
is experiencing change in progress. During the change period, the initial stages are
relatively slow, with the innovative variants used infrequently (this could be said to
reflect the Museum speech). However, as the momentum of the change increases, it leads
to a robust period of variation where the change rapidly spreads through the speech
community before a cooling-off period, where the rate of progress slows once more, as
the change nears completion. It could be said that these two stages are reflected in the
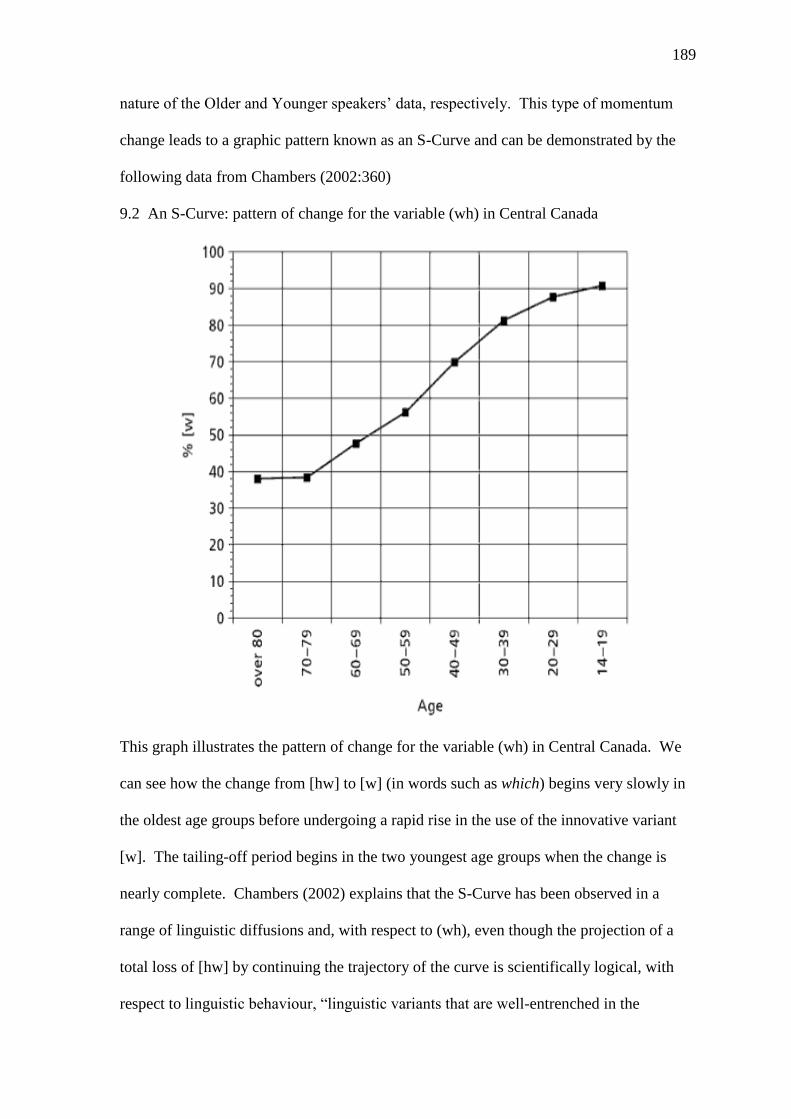
189
nature of the Older and Younger speakers’ data, respectively. This type of momentum
change leads to a graphic pattern known as an S-Curve and can be demonstrated by the
following data from Chambers (2002:360)
9.2 An S-Curve: pattern of change for the variable (wh) in Central Canada
This graph illustrates the pattern of change for the variable (wh) in Central Canada. We
can see how the change from [hw] to [w] (in words such as which) begins very slowly in
the oldest age groups before undergoing a rapid rise in the use of the innovative variant
[w]. The tailing-off period begins in the two youngest age groups when the change is
nearly complete. Chambers (2002) explains that the S-Curve has been observed in a
range of linguistic diffusions and, with respect to (wh), even though the projection of a
total loss of [hw] by continuing the trajectory of the curve is scientifically logical, with
respect to linguistic behaviour, “linguistic variants that are well-entrenched in the
190
language, as this one clearly is, tend to linger” (2002:326). Therefore, a diffused change
may never reach its full conclusion. This may be because the diffusion is halted before it
can affect all linguistic environments or that, even though the older feature has lost its
social standing within a dialect community, it is still preserved as a feature of that
community through iconic phrases and relic forms (including, for example, street and
place names). Indeed, the preservation of forms in certain phrases and contexts can
prevent a change from reaching full completion and, as a result, the forms can acquire
particular types of social symbolism, both within and outside a community.
This point will now be discussed in relation to the patterns of Canadian Raising, BOY
rounding and ‘Island’ monophthongisation found in the Mersea Island data.
9.2
Performance and Enregisterment
Schilling-Estes (1998) defines performance speech as “that register associated with
speakers attempting to display for others a certain language or language variety, whether
their own or that of another speech community” (1998:53). In contrast to the type of
natural speech modern sociolinguistics strives to capture, it is the type of speech which is
above the level of consciousness for a speaker who, in a sense, chooses to manipulate
their speech in order to perform or emulate certain linguistic characteristics. This was
discovered in both the speech communities of Smith Island and Ocracoke (off the North
Carolina coast, USA) with respect to the variables () and (). Schilling-Estes and
Wolfram (1999:503) note that Smith Islanders manipulate and openly discuss the nucleic
quality of // diphthong but not the quality of the // nucleus, suggesting a greater
awareness of // variation at both speaker and community levels. Conversely, Ocracoke
191
speakers ‘performed’ variation of // but paid little attention to the variable qualities of
//. Indeed, Schilling-Estes’ (1998) analysis of a male Ocracoke Islander, Rex, shows
that during the recitation of a particular rote phrase (which includes the popular Island
phrase ‘It’s a high tide on the sound side’), he consistently manipulated and raised the
nucleus of the // diphthong towards the older, more traditional form but did not perform
that same action for the // diphthong, which was also contained within the domain of
the ‘performance phrase’ in the lexical item ‘sound’. Schilling-Estes (1998:63) goes on
to note that the ‘artistic performance’ accompanying Rex’s linguistic performance
encodes the persona of a “jovial old fisherman”. This suggests that there is a level of
social meaning attached to and implied by the performed linguistic structures and that
these social connotations are available for interpretation by those who are perceiving the
speech event as a whole.
This link between certain linguistic structures and encoded social values has been present
and discussed with respect to the notion of ‘dialect enregisterment’ (see for example,
Agha (2003), Beal (2009) and Johnstone et al (2006)). Agha defines enregisterment as
the processes through which ‘a linguistic repertoire becomes differentiable within a
language as a socially recognized register of forms” (2003:231). Therefore, by using a
specific linguistic feature, or set of features, a person can establish a link between those
features and, for example, a certain geographic location and/ or social group belonging to
the location. However, this kind of correlation can only be established if the speaker or
perceiver is aware (on some level) of the linguistic difference in the first place (that is,
members of a speech community cannot attribute distinct social correlations of linguistic
forms within their community if it is thought that everyone in it speaks the same way).
Therefore, variable linguistic features must be perceptually distinct or salient in order for
192
them to be initially recognised as ‘different’. Once linguistic features of a speaker or a
community have been tied to social aspects, such as locality or stylistic variation between
variants which are considered ‘local’ and ‘non-local’ (the latter most likely belonging to a
standard variety), they become available for dialect performances and overt discussion,
both within and outside the community.
The behaviour of // and // diphthongs in Ocracoke and Smith Island, mentioned
above, can illustrate how features may become enregistered within a community in
different ways. For example, since variation of the // diphthong is openly discussed as a
feature of Ocracoke English by native Islanders but not variation relating to //, this
suggests that it is the former which is enregistered for these speakers and not the latter.
As a result, // raising and backing is available for manipulation in performance phrases.
Conversely, the opposite can be said for Smith Island English, where // raising could be
said to be enregistered (and thus open for social comment between Islanders) and not //.
With respect to how the performance of enregistered features can reflect linguistic
structure, Schilling-Estes (1998:62) notes that the performance speech of her subject,
Rex, emulates the linguistic patterning of the variable () with respect to linguistic
context (that is, a raised // nucleus is more prolific in certain phonological environments
compared to others, see section 5.5.2 for more details). This indicates that aspects of
phonological conditioning of this variable must also be enregistered for this speaker.
This is also reflected in Chambers’ (1989) observations with respect to // and // in
Canadian Raising dialects. Citing and discussing Vance’s 1987 observation that
Americans, while prone to making overt comments regarding words with raised and
193
backed nuclei pronunciations of //, ignore words which are prone to // raising,
Chambers states that “/aw/-raising and /ay/-raising exist independently of one another in
the phonologies of regional accents” (1989:77). Therefore, if we accept that the raising
rules for these diphthongs are independent in our phonologies, this can help explain why
one may become enregistered and disassociated from the other.
However, these scenarios differ from the apparent situation of Mersea Island English with
respect to // and // variation. This will now be discussed below along with the
variation discovered in relation to the BOY and ‘Island’ lexical items.
9.2.1
Performance, Enregisterment and Mersea Island English
The data analysis presented in Chapters 4 and 6 demonstrates a correlation associated
with the phonological process of Canadian Raising. However, when both Islanders and
outsiders comment on their speech and use rote phrases38, they use raised // and //
nuclei consistently across phonological contexts and do not accommodate the Canadian
Raising rule during any performance or dialect comment. Therefore, it could be
suggested that it is only the raised nuclei of these diphthongs which are enregistered or
associated with this dialect and not any type of contextual phonological raising rule.
This could be further evidence to suggest that the phonological context correlations found
in the data are the result of natural trajectories and tendencies in the linguistic changes
from // to // and // to //, since the phonological rules have not become stabilised
or enregistered as part of the dialect. Britain (1991) discovered a strong Canadian
38
Note, this is based on both data from the interviews which make up the whole Mersea Corpus as well as
the researcher’s personal experience.

194
Raising pattern when analysing his data of Fenland speakers (although, this pattern was
only found for the variable () and not ()). Britain explains his data through increased
contact between dialect varieties: [] variants from the Western dialects, [] from the
Eastern dialects and whatever the native Fenland form was at the time. When these
varieties began to mix, due to increased contact opportunities, the Central Fenland variety
became more focussed as Western [] forms were reallocated to the context of pre-
voiced consonants while the Eastern [] forms were reallocated to pre-voiceless
consonants.
The motivation for this pattern of variant allocation can be found through the notion of
phonological naturalness. Laver (1994:445-447) presents a number of cross-linguistic
studies which demonstrate varying vowel durations in the context of following
consonants (that is, following consonants which are part of the same syllable rime) and
notes that, with respect to English, vowel durations before voiceless consonants are
shorter than those before voiced consonants. Working on this observation, Trudgill
(1986:155) proposes that, since a general tendency of most English varieties is the
production of longer vowels in pre-voiced consonant position, more open diphthongs
would then also be favoured in this environment (due to the greater amount of time
available for their articulation).
The MIE patterns for both () and () can therefore be attributed to natural trajectory of
change and variation according to phonological environment. If we accept that the
traditional MIE forms were // and // in all phonological positions, as contact
increased between Islanders and Mainlanders (through increased off-Island transportation
and a significant increase in residential Island housing, leading to large amounts of in-
195
migration), greater exposure to the more mainstream, innovative [] and [] variants
would have occurred. The subsequent change towards these wider diphthongs therefore
followed the more natural allocation path with the wider diphthongs becoming more
prominent in pre-voiced consonant positions and the narrower diphthongs more
prominent in pre-voiceless consonant environments. The Canadian Raising type pattern
uncovered in the data can therefore be viewed as the residue of changes from [] to [a]
and [] to [a], and is thus a linguistic constraint on change rather than a phonological
rule as it exists in Canada and the Fens.
The intertwining nature of phonological change and phonological structure was observed
by Weinreich et al (1968) who state that “linguists are naturally suspicious of any account
of change which fails to show the influence of the structural environment upon the feature
in question” (1968:172). Thus, part of the embedding problem outlined by Weinreich et
al suggests that a feature is ‘embedded’ in a linguistics matrix. Consequently, as one
features changes, other forms within the matrix are susceptible to change as well, even
though changes affecting other features within the matrix may take a number of years to
come about. However, in addition to the linguistic matrix of features which acts to unify
the linguistic system, or parts of the linguistic system, Weinreich et al caution that any
change is also embedded within a complex social matrix. Therefore, the interpretation of
language change data “depends upon the entire sociolinguistic structure” (1968:177), not
just observations with respect to the variant distributions across real and apparent time.
The linguistic conditioning on the variation and subsequent change regarding the
variables () and () is, therefore, similar to the conditioning factors of Neo-
Grammarian sound changes, where certain phonological environments may be affected
196
before others during change (see Labov (1994) for an overview and evaluation of types of
sound change). In this case, it was the more natural environments which led the change
and perhaps instigated the shift in the underlying phonemic structure, or matrix.
However, unlike the Fenland data discussed above, which show a strong and distinctive
Canadian Raising pattern for // due to the degree of focussing in the Central Fenland
areas, the Mersea data for both variables do not show a strongly focussed pattern. This
may be attributed to the relative demographic stability enjoyed by Fenland areas after the
initial contact event occurred, whereas the contact situation on Mersea has not been
followed by stability of this kind. As a result, the phonological processes governing the
raising patterns have not stabilised in the MIE speech community and the change is
working towards completion. Therefore, it seems logical to assume that this Canadian
Raising type pattern, which seems to be below the level of consciousness and social
comment, will not become a defining feature of this dialect and that the change affecting
these diphthongs will eventually affect all phonological environments.
However, even though there seems to be no phonological raising rule embedded in the
performance of // and //, according to following context, there seems to a possibility
of interacting phonological and lexical conditioning applying to the items BOY and
‘Island’ for // and //, respectively. These will now be discussed in turn.
With respect to the performance phrase ‘My Boy’, we can argue that the ‘my’ element is
rendered [m] due to an extended performance convention which affects any underlying
//. That is, all /a/ diphthongs are raised to [] during performance. However, it could
also be argued that a pronunciation of [m] is only triggered in the specific environment
of this phrase. Without evidence to strongly support either of these claims (due to ‘my’

197
not appearing in any other performance phrase context), the status of ‘boy’ in MIE must
also be discussed. Schilling-Estes (1998:61) notes that the prominence of the raised //
nucleus in pre-voiced consonant position is enhanced by its frequency in this context
within performance phrases, compared to the frequency of pre-voiceless consonant
positions. The same could be said for the context of // following a voiced bilabial /b/.
This particular labial segment is by far the most frequent throughout the data sets and
derived BOY forms were the most frequent lexical items with a preceding /b/. Thus, the
data show that, for all age groups, the preceding /b/ segment promotes more non-standard,
centralised variants in natural, non-performance speech and is the variant of choice in the
‘my boy’ performance phrase.
One possible reason for the preservation of this feature in this phonological context
(already advanced in section 8.3.3) is the spread of labiality from the /b/ to the following
vowel. However, we could also claim that, as a result of both this phrase’s prominence
and frequency of environment, these factors have helped enregister and associate the []
variant with traditional Mersea Island English and the context of preceding /b/ in
particular. Therefore, if it is the phonological rule which has been encoded (i.e. // is
fronted following /b/) we would expect to find the fronted centralised variant ‘performed’
after a /b/ even when it is not in the context of the ‘my boy’ phrase. Conversely, if the
phonological rule has not been encoded, the fronted centralised variant would not be
realised outside the context of the lexical item BOY. Unfortunately, the data collected
which represents the Mersea corpus does not hold the answer to this, as it does not
represent any speaker using elongated performances which might include the sequence /b/
+ // in another lexical context. However, since the fronting and centralisation of the
diphthong in BOY words is apparent in both natural speech and in the performance phrase,
198
it might be suggested that the retention of the non-standard traditional form is not simply
a by-product of its enregisterment, but rather it may be strengthened in both speech
contexts by a combination of natural phonological processes and the embedding of its
social representations.
In contrast to both // and // raising and // fronting, the monophthongisation of // in
the lexical item ‘Island’ does not appear to be an enregistered feature of MIE. The word
‘Island’ does not feature in any performance phrase, and monophthongisation in this word
does not feature in any comments of the dialect by the speakers who were interviewed.
The data presented in Chapter 6 demonstrate that, for the MIE speakers analysed in this
study, there is never a case where a monophthongal variant of an []~[] quality is
produced in the context of a following non-coda /l/ (for example, in words such as ‘pilot’
and ‘skylark’). Instead, these []~[] variants are only used where the following /l/ is in
the syllable coda and is therefore articulated as a dark /l/ (for example, in words such as
‘mile’ and ‘while’). However, within this set of monophthongal variants is the word
‘Island’. Even though this item represents // followed by a clear onset /l/, the data
clearly demonstrate that it patterns with that of the coda /l/ words and prompts
substantially more monophthongal variants.
Thus, these data suggest some kind of lexical effect on the variant conditioning in this
word. However, as mentioned above, this word does not seem to be a part of any
performance phrase known to the researcher (from both academic and personal
experience), and the monophthongal realisation in neither the word ‘Island’ nor in
ordinary coda /l/ words is commented on by Islanders in discussions relating to their
199
dialect features. These observations suggest that, unlike the features previously
mentioned in the section, this is not considered as either a linguistic or a social marker of
MIE. Indeed, the data presented in Chapter 6 show that the Younger speakers are losing
the monophthong as a variant in ‘Island’ and are instead converging it with the pattern of
the other non-coda /l/ words. It must be noted that there were only nine tokens of ‘Island’
in the Younger speakers’ data and so this assertion is only tentative based on such limited
data.
With this in mind, it may be possible to argue that either the monophthong was extended
to the non-coda /l/ ‘Island’ from the smoothing environment of the coda /l/ (perhaps as a
result of the frequency of this word in the particular society), or that there has been a
change from a monophthong to a diphthong in the context of following /l/, with the clear
/l/ contexts progressing through the change ahead of the monophthong preserving dark /l/
contexts. If this latter scenario was the case, the relic form [] could have been
prevented from joining the change due to its frequency of use in the speech of Islanders.
This scenario, if correct, could then be claimed to be spreading through the Younger
generation speakers. Thus, even though this generation still exhibits non-standard
behaviour in the form of 44% of monophthongs for ‘Island’ (compared to the 77% of the
Older speakers) and 54% monophthongs before regular coda /l/ words (compared to 74%
in the Older speakers’ data), it still represents a decline in []~[] variants.
However, previous linguistic research which has considered the effect of frequency on
change (such as Bybee (2002; 2006)) has suggested that, as a general rule, high frequency
words will change at a faster rate, compared to those of lower frequency with respect to
changes linked to phonetic processes. Conversely, changes associated with grammatical

200
or analogical change show high frequency items as inhibitors of change and thus
generally act as preservers of traditional forms. Therefore, since the case of variation
between a monophthong and a diphthong would be considered as a phonetic change, we
would expect a frequent word (with respect to the social and geographic context of
Mersea Island speech) like ‘Island’ to be at the forefront of change, not acting as the
preserver of the, possibly, older form. As a result, it may be a case for arguing in favour
of the independence of place names in frequency calculations.
Perhaps this apparent ‘anti-frequency’ effect could be attributed to a type of social
saliency which has attached to the [] form in the past, with it becoming so
entrenched as to enregister the feature as part of the local speech pattern. Thus, a
weakening of the enregisterment would mean that current generations do not have this
level of social attachment to the feature and, as a result, it is gradually being lost in MIE
speech. Therefore, we could propose that, while enregistered and salient features of a
dialect are subject to inter-speaker and inter-community variation, they are also subject to
inter-generation variation as well.
9.3
Contact, Diffusion and Supra-localisation
It has already been noted earlier in this section how the demographic structure of the
Island has changed so that Islanders now have greater opportunities to be in contact with
non-Islanders. Thus, where there once existed a strong natural barrier to inter-regional
communication for the Island, this barrier has been overcome and its effects have been
weakened, so that contact between mainland varieties and the Island variety has been
strengthened. This strengthening of contact between Islanders and non-Islanders has led
201
to a weakening of community network structures for the Island inhabitants. Even though
there is a great diversity in the network structure of Island residents (primarily depending
on whether they went to the local primary school and how involved a resident chooses to
be in Island life and traditional Island activities), the compulsory act of schooling young
Island children on the mainland from the point of secondary school onwards (which was
not the case for the Older generation speakers in the study) means that from the age of 11
years, all Island children immediately have their social networks opened up, loosened and
geographically expanded.
Discussing the process of dialect levelling and supralocalisation, Britain (2010) defines
the notion of a ‘region’ with respect to the classification of ‘space’. Basing much of his
discussion on Allen et al (1998), Britain notes that a region cannot solely be defined by
physical geographical space or politically defined borders. Instead, they are areas which
are formed by social practice. Thus, the consistent routinised movement of individuals
leads, over time, to the creation of spatialised patterns, and it is the domain of these
patterns which leads to the emergence of ‘places’ and ‘regions’. The perception of
geographical space as something which is less physically defined and more socially
defined automatically puts emphasis on the role of social practice, particularly routine
social practice (such as travel to work and school), and enables us to explore processes
immediately above the level of the ‘local’. Consequently, the term supralocal may be
used to denote processes that are above the regional level of analysis – for example,
changes taking place across a county relative to, say, a large town within that county
(Britain 2010).
202
Studying the diffusion of innovative linguistic forms at this more micro-level of society
can be done using observations of social network structure and strength, with respect to
both individual informants and general observations of a speech community as a whole.
Social Network theory, as proposed by Milroy (see Milroy (1987), for example), suggests
that the closer and denser your network ties, the less likely you are to be influenced by
externally derived linguistic innovations. Therefore, people living in small, tight-knit
communities, whose social and professional activities are confined to a limited area and
limited individuals, are less likely to be exposed to and accommodate with innovative
forms in their linguistic repertoire and more likely to reinforce traditional and perhaps
more marked forms. Conversely, the more open your social network, the more exposed
you become to linguistic innovations and the more likely you are to accommodate to a
variety of new linguistic features. As a result, those with open, loose networks are more
likely to accept innovative forms into their personal linguistic repertoire.
Thus, the gradual ‘opening-up’ of the Mersea Islanders’ social networks has meant the
speakers within the community have become more susceptible to the comparatively
innovative forms used in mainland varieties.
Indicators of the geographical widening of network structure can be seen in a number of
ways on Mersea Island. When the Older informants were growing up, education was
restricted to the Island school and employment was mainly provided by local Island trade.
In addition, due to the limited availability of transport on and off the Island, travel to the
mainland was typically restricted to those who had family living there. Conversely, the
Younger generation speakers automatically receive their secondary and tertiary education
off the Island and are mainly employed in mainland jobs. The immediate effect of this is
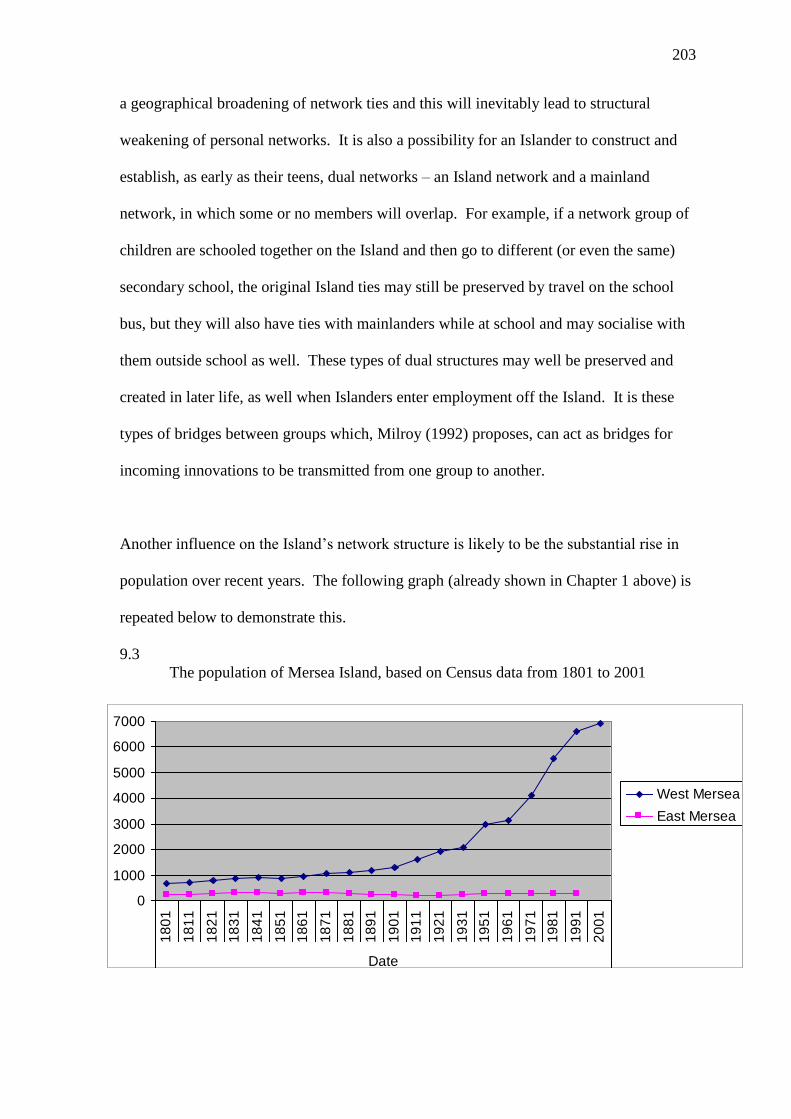
203
Popluation of Mersea Island based on census data from 1801 to 2001
0
1000
2000
3000
4000
5000
6000
7000
18
01
18
11
18
21
18
31
18
41
18
51
18
61
18
71
18
81
18
91
19
01
19
11
19
21
19
31
19
51
19
61
19
71
19
81
19
91
20
01
Date
West Mersea
East Mersea
a geographical broadening of network ties and this will inevitably lead to structural
weakening of personal networks. It is also a possibility for an Islander to construct and
establish, as early as their teens, dual networks – an Island network and a mainland
network, in which some or no members will overlap. For example, if a network group of
children are schooled together on the Island and then go to different (or even the same)
secondary school, the original Island ties may still be preserved by travel on the school
bus, but they will also have ties with mainlanders while at school and may socialise with
them outside school as well. These types of dual structures may well be preserved and
created in later life, as well when Islanders enter employment off the Island. It is these
types of bridges between groups which, Milroy (1992) proposes, can act as bridges for
incoming innovations to be transmitted from one group to another.
Another influence on the Island’s network structure is likely to be the substantial rise in
population over recent years. The following graph (already shown in Chapter 1 above) is
repeated below to demonstrate this.
9.3
The population of Mersea Island, based on Census data from 1801 to 2001
204
The sheer rise in population creates greater opportunities for interaction with those
incoming residents, who are likely to represent a wide range of dialect backgrounds.
However, it should be noted that increased population would not automatically signal the
weakening of network ties in a community. Individuals tied to Island life may still
restrict their interactions with those others who are deeply connected to the community
through family history, employment and social activities. It would be these networks that
would remain dense and multiplex and would continue to reinforce traditional linguistic
forms.
Another point to consider with respect to the regional spread of network ties is how
mobile Islanders may be in their day-to-day lives. The community itself has many shops
and amenities to provide for the population (such as garage mechanics, a doctor’s
surgery, a dentist and a vet). Therefore, the graph below illustrates the approximate
distance that a member of the Mersea workforce travels to work, compared to the same
data from Colchester residents and the overall statistics from the East of England
(previously presented in section 1.4 above).
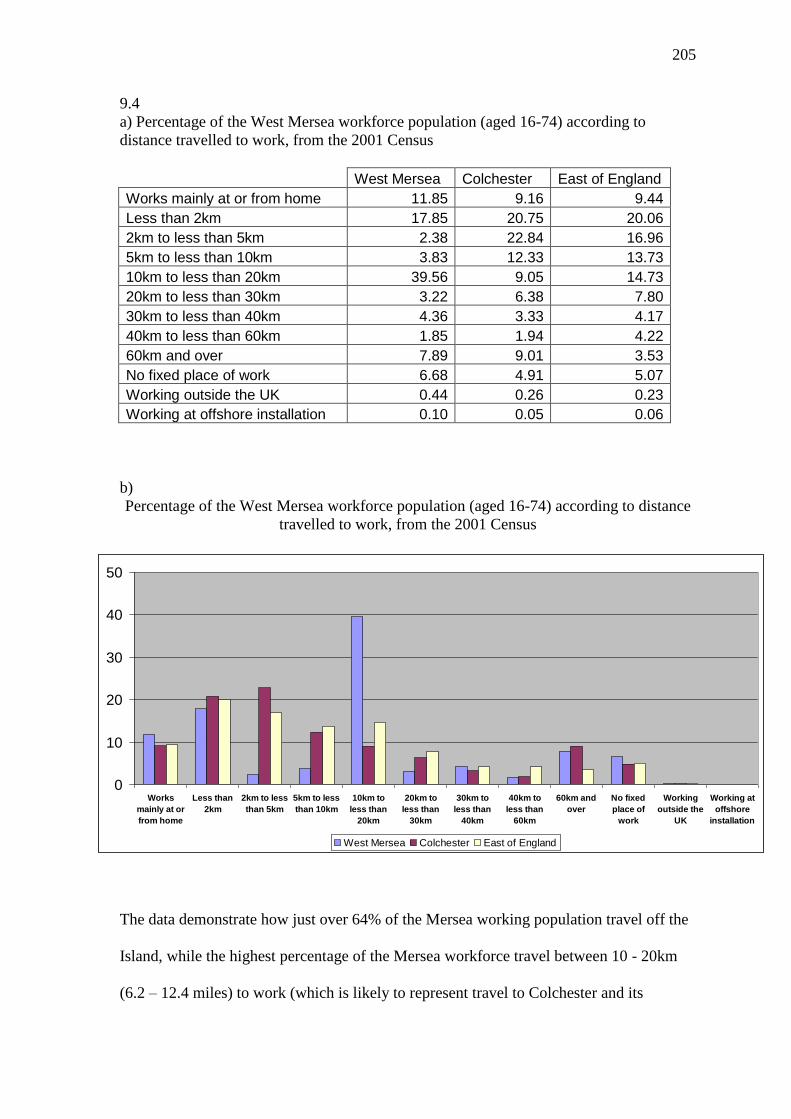
205
9.4
a) Percentage of the West Mersea workforce population (aged 16-74) according to
distance travelled to work, from the 2001 Census
West Mersea Colchester East of England
Works mainly at or from home 11.85 9.16 9.44
Less than 2km 17.85 20.75 20.06
2km to less than 5km 2.38 22.84 16.96
5km to less than 10km 3.83 12.33 13.73
10km to less than 20km 39.56 9.05 14.73
20km to less than 30km 3.22 6.38 7.80
30km to less than 40km 4.36 3.33 4.17
40km to less than 60km 1.85 1.94 4.22
60km and over 7.89 9.01 3.53
No fixed place of work 6.68 4.91 5.07
Working outside the UK 0.44 0.26 0.23
Working at offshore installation 0.10 0.05 0.06
b)
Percentage of the West Mersea workforce population (aged 16-74) according to distance
travelled to work, from the 2001 Census
0
10
20
30
40
50
Works
mainly at or
from home
Less than
2km
2km to less
than 5km
5km to less
than 10km
10km to
less than
20km
20km to
less than
30km
30km to
less than
40km
40km to
less than
60km
60km and
over
No fixed
place of
work
Working
outside the
UK
Working at
offshore
installation
West Mersea Colchester East of England
The data demonstrate how just over 64% of the Mersea working population travel off the
Island, while the highest percentage of the Mersea workforce travel between 10 - 20km
(6.2 – 12.4 miles) to work (which is likely to represent travel to Colchester and its
206
surrounding areas). Conversely, only 29.7% of Islanders work from home or on the
Island (the latter group being represented by the less than 2km (1.2 miles) category).
We could suggest, therefore, that a typical Islander is likely to centre not only their
educational networks on the mainland (at least from secondary education), but also their
professional networks. As a result, it seems logical to suggest that a modern Islander’s
typical social network will exhibit ties not only on the Island, but in the surrounding areas
on the mainland, leaving the once isolated Island dialect more susceptible to influences
from these surrounding regions.
Britain (2002c), with respect to movement within geographical locations, states that
“Intra-regional mobility, whilst breaking down networks and routines at the very local
level, reinforces supra-local structure” (2002c:62). Britain refers to these areas which
have undergone regional levelling as ‘regional koines’ as they represent levelled, supra-
local varieties which act as larger areas of less geographically internal linguistic diversity,
since they represent an amalgam of locales, which were once a lot more linguistically
diverse and distinct. This process of dialect supralocalisation is also referred to as
‘regional dialect levelling’ which Torgersen and Kerswill define as “the reduction of the
number of variants following speaker accommodation through face-to-face interaction”
(2004:26).
The face-to-face interaction between speakers of dialect regions is also central to the
notion of macro-level linguistic diffusion although, in contrast to levelling which may be
considered on a micro-level, the geographical area in which diffused forms spread can be
much greater. Linguistic diffusion of innovative forms (see, for example, Britain (2002a)

207
and Trudgill (1986)) involves the introduction of a novel linguistic form from another
community in which that feature is the norm. The driving force behind diffusion types is
necessarily contact between speakers from each community (that is, speakers with a
linguistic form coming into contact with speakers without that same form, or vice versa).
Indeed, Britain (forthcoming) states that diffusion models supposedly reflect the
geographies of interaction and represent who speaks to whom and where. However,
Britain also outlines general weaknesses of contemporary diffusion models as relating to
their failure to adopt a richly socialised and interactional perspective relating to the spaces
across which features diffuse.
As linguistic forms diffuse, they may supplant existing forms or create intermediate,
compromised forms (see Britain (2002c) for more details). In addition, newly diffused
innovations may be re-evaluated with respect to their social connotations, and this could
have a direct influence upon the variation and interactional usage between local features,
newly diffused features and standard variants (see, for example, Docherty et al (1997) and
Milroy et al (1994) for discussions of this relating to the variable (t) in Newcastle).
Taking these points into consideration, it stands to reason, therefore, that linguistic
features which are most compromised during contact situations are those which are
distinct between the varieties which come into contact, since they will be perceptually
more distinct. Thus, if we propose that the features which are marked, both perceptually
and socially, are those which are the most at risk from levelling processes when contact
situations arise, the diphthongs under investigation are prime candidates for change, since
they are susceptible to social comment, evaluation and are treated as markers of the MIE
dialect.
208
However, two possible paths of explanation are that:
1) since the new incoming variants are those associated with the standard variety, the
change is influenced by this standard ideal and is therefore assimilating to it.
or
2) due to the contact situation (which has been developing and increasing between
Islanders and non-Islanders over the last 50 years or so), the linguistic change is
influenced not only by the incoming innovative variants, but also by the natural
motivations of the underlying phonological system. Therefore, the motivations
which cause a movement towards less-marked forms are perhaps triggered by the
weakening of strong, linguistically reinforcing, network ties.
Indeed, the former suggestion cannot tell the entire story, as we would be hard pressed
and perhaps irrational to devise a theory as to why emulating the standard form became
so important to these Islanders at a time when their local identity was so under threat.
However, if we suggest that supra-local forms of these diphthongs were adopted as a
result of contact and the creation of a supra-local dialect region, we might then be able to
theorise that the reason behind the generation and adoption of the innovative forms was a
preference for a more harmonic and ‘natural’ diphthong system in the underlying
phonology. Thus, a combination of approaches might be advanced to suggest that
phonological motivations allowed the innovative [], [] and [] forms to be generated
and awareness and exposure to the standard (through contact and off-the-Island
schooling) allowed these variants to become established within the dialect.
It is this point of phonological naturalness which will be discussed at greater length in the
next chapter where an integrated model of phonological derivation and sociolinguistic
conditioning factors upon variation will be presented.
209
Chapter 10
Socio-Phonology: the construction
of an integrated model

210
10. Socio-Phonology: the construction of an integrated model
This Chapter will explore the results from the Mersea Island data analysis (presented in
previous Chapters) in relation to phonological theory. The application of phonological
theory to this sociolinguistic data will allow the phenomenon of dialect change to be
explored from a different perspective. For example, the data presented in the Chapters
above highlight a shift from [] to [], [] to [] and [] to [] between the Museum
and Younger speakers. However, even though these changes (as well as specific patterns
of variation) have been discussed with respect to change, contact and performance, these
have not addressed the issue of what is happening in the underlying structure of the
dialect and the changes to the grammars of the dialect’s speakers. Furthermore, an
exploration of phonological theory can help inform an investigation of variation and
change by highlighting any linguistic constraints of influences upon the variation as well
as any factors which are likely to shape the trajectory of change.
Both Optimality Theory and Dispersion Theory will be introduced, and it will be argued
that they are effective tools for dealing with issues relating to the direction of change we
have seen in the Mersea Island diphthongs. Using a combination of these theories,
together with sociolinguistic constraints on the data, an integrated socio-phonological
model will be constructed and presented as a way of illustrating the interface between
Sociolinguistics and Phonology.
211
10.1
What is Optimality Theory?
Optimality Theory, as originally proposed by Prince and Smolensky (1993; 2004), is an
output-based model of language39
. Although it is generally associated with phonology, it
has found applications in other domains of language and, compared to previous input-
driven models40
, such as that presented in Chomsky and Halle’s (1968) Sound Pattern of
English, Optimality Theory allows for a graphical evaluation of not only the resulting
surface form, but also the other possible contenders which may be logically derived from
the underlying form. By way of illustration, 10.1 demonstrates the conventional lay-out
of an OT tableau.
10.1
/Input/ Constraint 1 Constraint 2 Constraint 3
Candidate 1
Candidate 2
In OT, the underlying representation of a linguistic unit is represented as the input.
Therefore, the input needs a mechanism which will transform it into differing possible
realisations. This list, or set of possible outputs (which includes one completely faithful
to the input) is produced by what is known as the Universal Generator, abbreviated to
GEN. McCarthy states that the phonological GEN “performs various operations on the
input, deleting segments, epenthesising them, and changing their feature values”
(2008:16). Therefore, GEN defines the range of the candidates which will compete with
each other through a particular constraint ranking. However, the inherently unrestricted
nature of GEN means that each set of candidates which can be derived from a single input
39
Thus, the input and its sequential derivation towards an output, through rewrite rules, is not the primary
focus. Instead, a number of possible outputs (including one which is identical to the input) are generated
and their performance is compared in relation to each other, not in relation to how they compare to the
original input. 40
Therefore, the focus is on the input and the application of transformation rules in order to generate an
output.
212
is infinite. McCarthy, acknowledging this problem, states that “the grammar as a whole
does not overgenerate because the constraints filter the contents of the candidate sets”
(2008:11). Therefore, by limiting or filtering the outputs of GEN, we do not end up with
candidate sets which include what could be considered as illogical or unreasonable, with
respect to the language being modelled (such as a competing candidate [] for an input
//).
However, the nature of the input itself is not without controversy. Prince and Smolensky
(1993:209; 2004:225) originally propose that, through the notion of ‘Richness of the
Base’, languages do not vary with respect to the structure of their underlying lexicons.
Therefore, the ideals behind richness of the base are that languages do not differ with
respect to their inputs (that is, the structures of their inputs are universal) and that the
diversity of forms in the base (or input) are such because there are no language-specific
restrictions in operation at this level.
In the tableau above, the input, which represents the underlying form, is provided in the
top left cell and possible outputs which may be derived from it are listed in the column
below. Along the row to the right of the input are noted the various constraints imposed
by the language which are applicable to a particular analysis. Constraints provide certain
criteria or conditions which the surface form must meet in order to be selected, and are
ranked in order of importance – the further to the left a constraint is placed, the more
important it is that a candidate does not violate its conditions. The solid line between
Constraints 1 and 2 reveals that there is a ‘dominance relation’ between Constraint 1 and
Constraints 2 and 3, meaning that Constraint 1 is the most significant in shaping the
phonology of the language and cannot be dominated. In addition, while we can say that
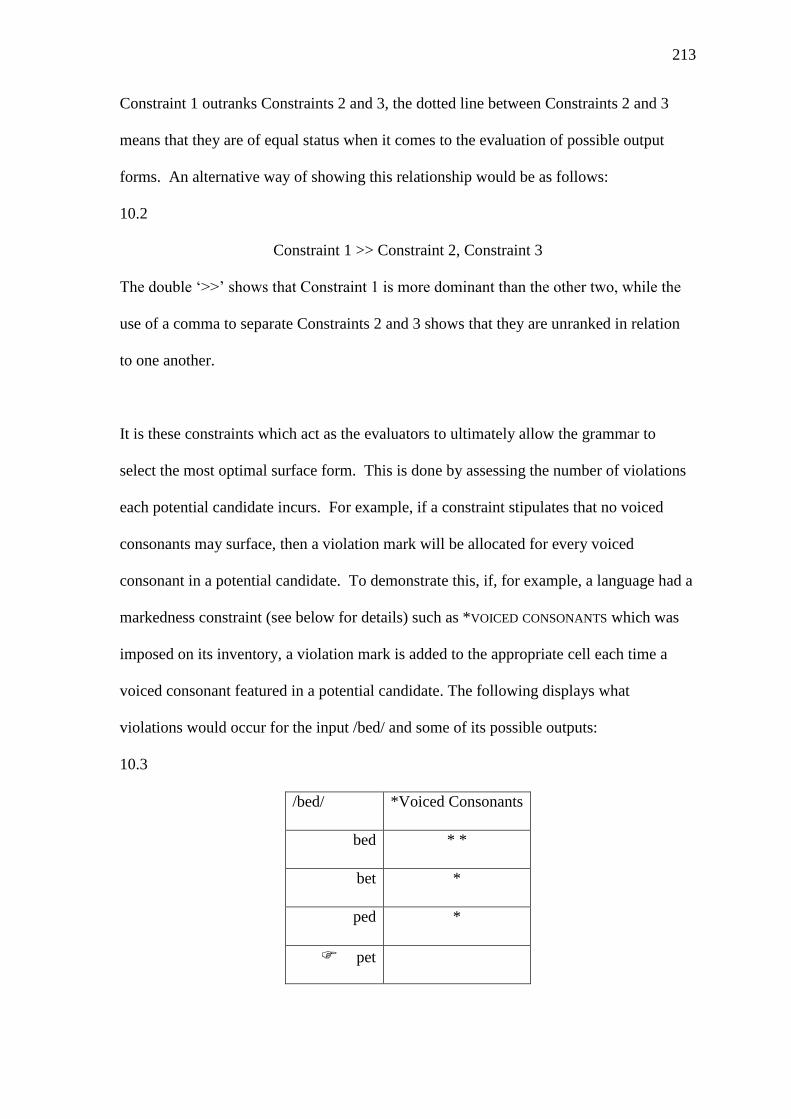
213
Constraint 1 outranks Constraints 2 and 3, the dotted line between Constraints 2 and 3
means that they are of equal status when it comes to the evaluation of possible output
forms. An alternative way of showing this relationship would be as follows:
10.2
Constraint 1 >> Constraint 2, Constraint 3
The double ‘>>’ shows that Constraint 1 is more dominant than the other two, while the
use of a comma to separate Constraints 2 and 3 shows that they are unranked in relation
to one another.
It is these constraints which act as the evaluators to ultimately allow the grammar to
select the most optimal surface form. This is done by assessing the number of violations
each potential candidate incurs. For example, if a constraint stipulates that no voiced
consonants may surface, then a violation mark will be allocated for every voiced
consonant in a potential candidate. To demonstrate this, if, for example, a language had a
markedness constraint (see below for details) such as *VOICED CONSONANTS which was
imposed on its inventory, a violation mark is added to the appropriate cell each time a
voiced consonant featured in a potential candidate. The following displays what
violations would occur for the input /bed/ and some of its possible outputs:
10.3
/bed/ *Voiced Consonants
bed * *
bet *
ped *
pet

214
Thus, in this example, [pet] would be the winning candidate from this candidate set as
neither consonant is voiced. The winner is then, typically, indicated by ‘’.
Therefore, one advantage of this model is that it allows for flexibility within our personal
grammars, particularly with respect to constraints which are unranked in relation to each
other (as illustrated in 10.1 above). In OT, constraints are intended to be regarded as
universal, and they can be rearranged language-specifically in order to accommodate
differing surface forms, which may derive from the same underlying input. This contrasts
with rule-based systems which cannot accommodate such variation in this way. For
example, a rule-based model may represent the following:
10.4
A → B / V ____ # 41
Thus, the input is fed into the rule and A would be transformed when positioned in the
linguistic context of VA# so that the surface form would be VB#. In order to change the
surface form of the underlying input, say in the context of language change, a new rule
must be written or rule ordering must be changed. However, if we were to represent this
in an OT framework, it could be represented as the following:
10.5
/VA#/ Constraint 1 Constraint 2 Constraint 3
a. VA#
b. VB#
c. V #
41
Note: V = Vowel and # = a word boundary
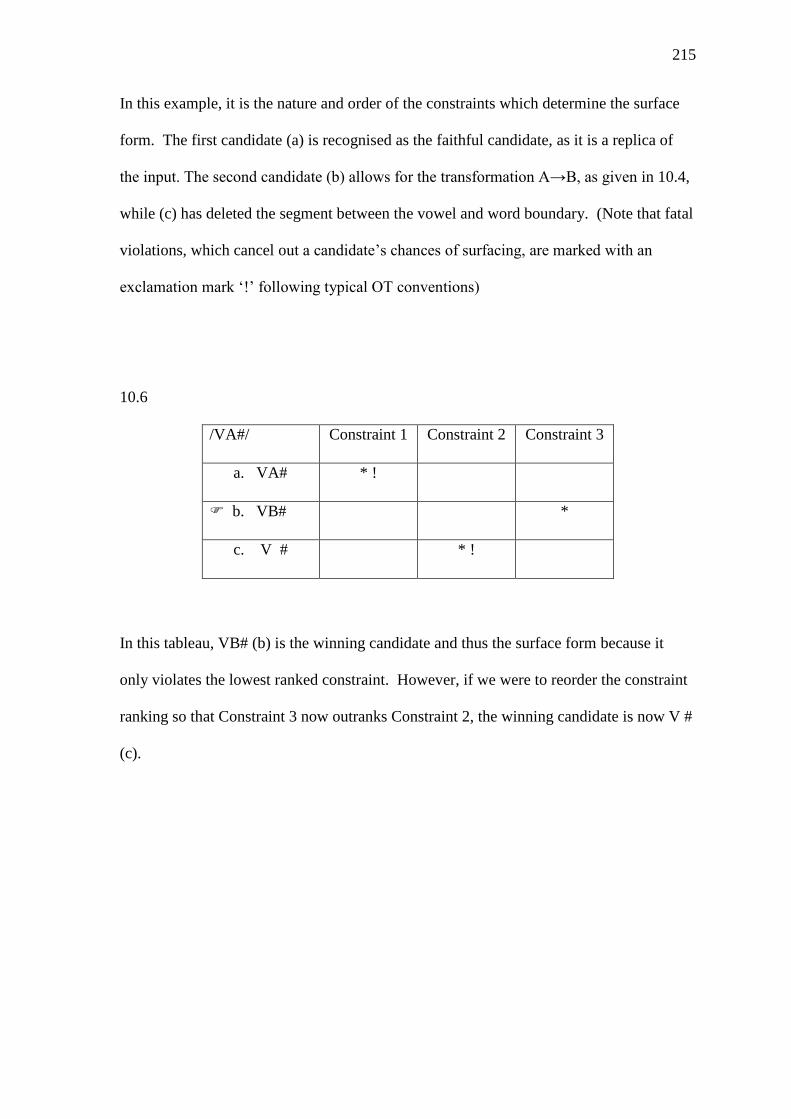
215
In this example, it is the nature and order of the constraints which determine the surface
form. The first candidate (a) is recognised as the faithful candidate, as it is a replica of
the input. The second candidate (b) allows for the transformation A→B, as given in 10.4,
while (c) has deleted the segment between the vowel and word boundary. (Note that fatal
violations, which cancel out a candidate’s chances of surfacing, are marked with an
exclamation mark ‘!’ following typical OT conventions)
10.6
/VA#/ Constraint 1 Constraint 2 Constraint 3
a. VA# * !
b. VB# *
c. V # * !
In this tableau, VB# (b) is the winning candidate and thus the surface form because it
only violates the lowest ranked constraint. However, if we were to reorder the constraint
ranking so that Constraint 3 now outranks Constraint 2, the winning candidate is now V #
(c).
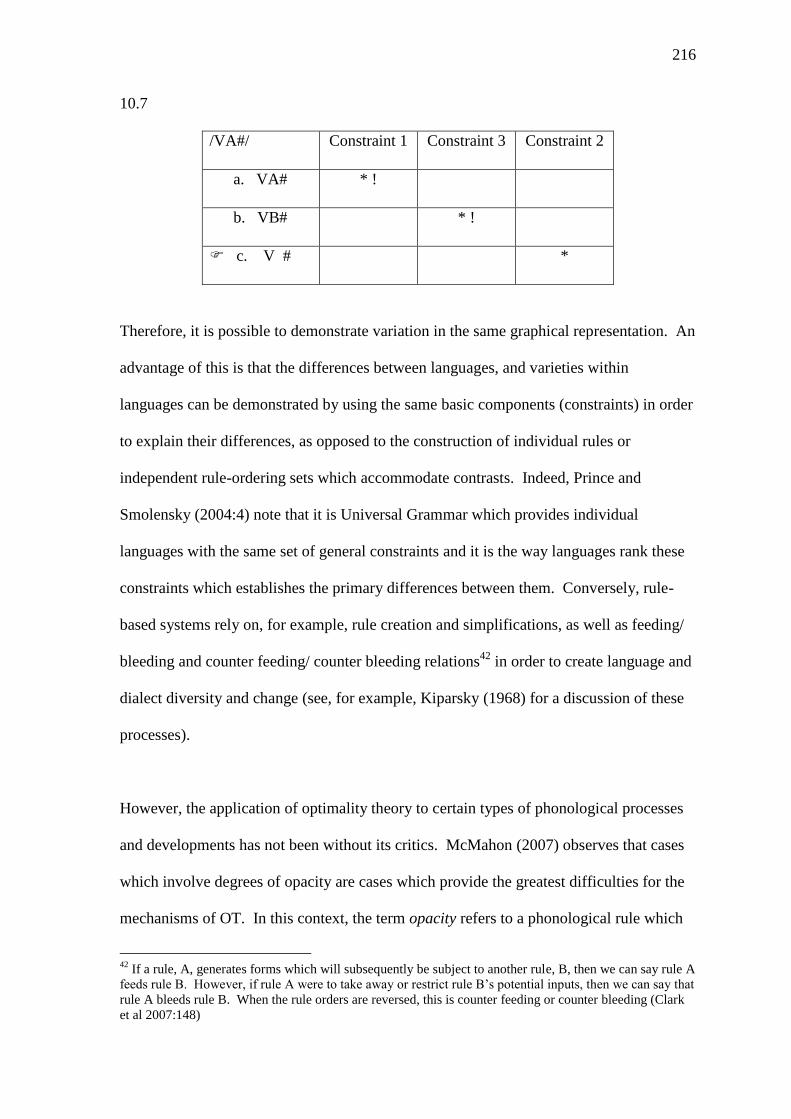
216
10.7
/VA#/ Constraint 1 Constraint 3 Constraint 2
a. VA# * !
b. VB# * !
c. V # *
Therefore, it is possible to demonstrate variation in the same graphical representation. An
advantage of this is that the differences between languages, and varieties within
languages can be demonstrated by using the same basic components (constraints) in order
to explain their differences, as opposed to the construction of individual rules or
independent rule-ordering sets which accommodate contrasts. Indeed, Prince and
Smolensky (2004:4) note that it is Universal Grammar which provides individual
languages with the same set of general constraints and it is the way languages rank these
constraints which establishes the primary differences between them. Conversely, rule-
based systems rely on, for example, rule creation and simplifications, as well as feeding/
bleeding and counter feeding/ counter bleeding relations42
in order to create language and
dialect diversity and change (see, for example, Kiparsky (1968) for a discussion of these
processes).
However, the application of optimality theory to certain types of phonological processes
and developments has not been without its critics. McMahon (2007) observes that cases
which involve degrees of opacity are cases which provide the greatest difficulties for the
mechanisms of OT. In this context, the term opacity refers to a phonological rule which
42
If a rule, A, generates forms which will subsequently be subject to another rule, B, then we can say rule A
feeds rule B. However, if rule A were to take away or restrict rule B’s potential inputs, then we can say that
rule A bleeds rule B. When the rule orders are reversed, this is counter feeding or counter bleeding (Clark
et al 2007:148)

217
prompts a surface form which is not expected in a given phonological context. This is
formalised by Kiparsky (1973, 1976 - cited in McCarthy (2007:11) as follows:
Opacity
A phonological rule P of the form A → B / C___ D is opaque if there are surface
structures with any of the following characteristics:
a. instances of A in the environment C___ D,
b. instances of B derived by P that occur in environments other than C___ D,
or c. instances of B not derived by P that occur in the environment C___ D.
Therefore, in order to get any of the outputs in a, b or c, more than one derivational step
must be taken. In a Classic OT framework, a constraint ranking which prompts the
output CBD would need to be constructed to reflect the original rule. However,
additional language specific constraints (such as those stipulating specific lexical items)
would be needed if the output was, for example, CAD instead. Indeed, McMahon notes
that “the more opaque a phonological process is, the harder it is to model in OT without
considerable extension of the permitted constraint types and theoretical machinery”
(2007:343). Thus, in order to derive an OT framework which reflects opaque processes
(such as vowel alternations which result from the interaction of phonology and
morphology43
), novel constraints (which may or may not be proposed as part of the
universal constraint grammar) are introduced, or adapted frameworks are constructed and
applied to problematic data, such as the recent theory of Candidate Chains (as proposed
by McCarthy (2006; 2007)). On the other hand, McMahon (2007:357) does observe that
classic OT’s failure to represent opacity does allow for the future development of the
theory (although she stipulates that its development will depend on how people approach
problematic data and the strength of their argumentation).
43
An example of this would be the vowel alternations involved with, what McMahon (2007) refers to as the
Modern English Vowel Shift Rule (which can be seen in words pairs such as divine ~ divinity and sane ~
sanity)
218
10.1.1
The Nature of Constraints
A central feature of Optimality Theory is that every constraint has the potential to be
violated. Therefore, it is a matter of dominance relationships, as opposed to the rigidity
of traditional rule-based models where the interaction of rules needs to be regulated so
that their order and interaction yields only the desired output. These constraints are
described as belonging to two broad categories – Faithfulness constraints and Markedness
constraints.
10.1.1.1
Faithfulness Constraints
Faithfulness constraints, in their most basic sense, are those which prohibit any
differences between the input and the output. Therefore, the input specifications must
remain intact and unaltered in the surface form. The implication of such constraints helps
to force contrasts in the surface forms. Indeed, McCarthy (2008) observes that “no other
theory of language has anything like OT’s faithfulness constraints” (2008:13). In
addition, he adds that the actual notion of faithfulness constraints could only make sense
in a theory such as OT which allows for constraint violations. Two examples of active
faithfulness constraints are those known as DEP and MAX and these guard against
epenthesis and deletion, respectively. The constraint DEP, which is short for
DEPENDENCY, requires every segment in the surface form to be represented in the input
and, therefore, the output ‘depends’ upon the input as the source of its components.
When DEP is active in a constraint ranking, one violation mark is usually assigned for
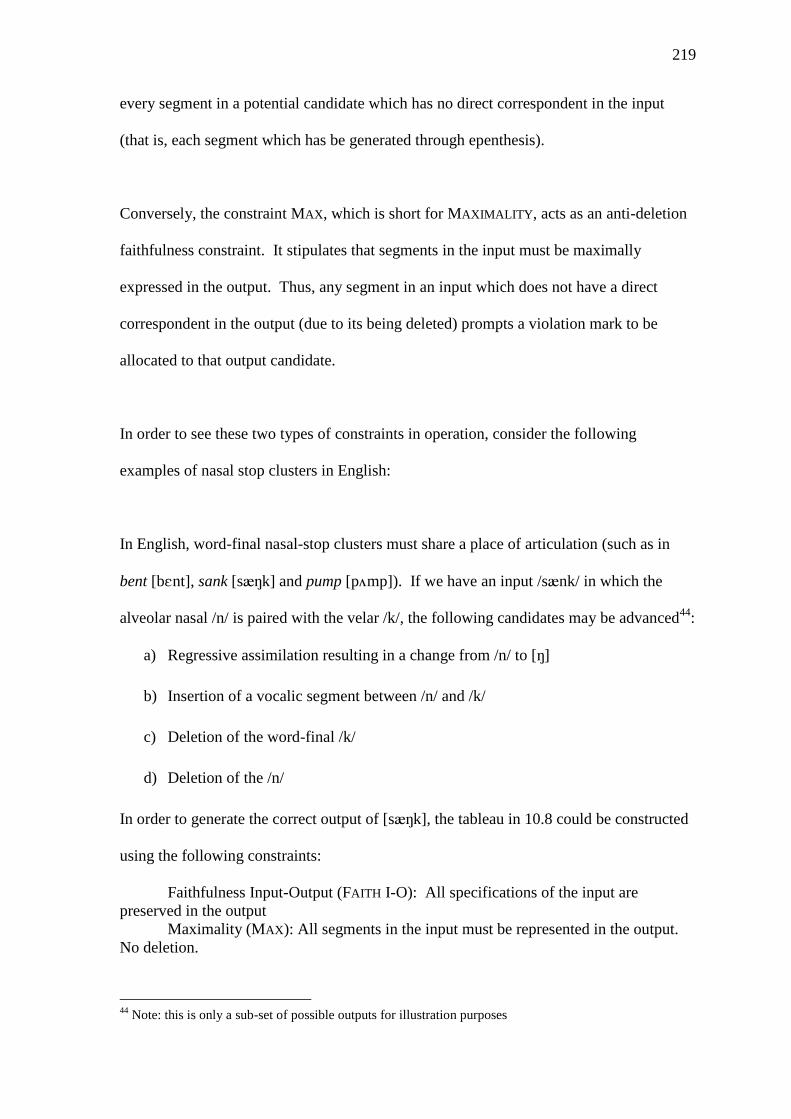
219
every segment in a potential candidate which has no direct correspondent in the input
(that is, each segment which has be generated through epenthesis).
Conversely, the constraint MAX, which is short for MAXIMALITY, acts as an anti-deletion
faithfulness constraint. It stipulates that segments in the input must be maximally
expressed in the output. Thus, any segment in an input which does not have a direct
correspondent in the output (due to its being deleted) prompts a violation mark to be
allocated to that output candidate.
In order to see these two types of constraints in operation, consider the following
examples of nasal stop clusters in English:
In English, word-final nasal-stop clusters must share a place of articulation (such as in
bent [bnt], sank [sk] and pump [pmp]). If we have an input /snk/ in which the
alveolar nasal /n/ is paired with the velar /k/, the following candidates may be advanced44
:
a) Regressive assimilation resulting in a change from /n/ to []
b) Insertion of a vocalic segment between /n/ and /k/
c) Deletion of the word-final /k/
d) Deletion of the /n/
In order to generate the correct output of [sk], the tableau in 10.8 could be constructed
using the following constraints:
Faithfulness Input-Output (FAITH I-O): All specifications of the input are
preserved in the output
Maximality (MAX): All segments in the input must be represented in the output.
No deletion.
44
Note: this is only a sub-set of possible outputs for illustration purposes
220
Dependency (DEP): All segments in the output must be represented in the input.
No insertion.
Agree PLACE: The elements of a consonant cluster must share a place of
articulation.
10.8
/snk/ DEP MAX AGREE PLACE FAITH I-O
snk *!
sk *
snk *! *
sn *!
sk *!
Tableau such as these are there created as a type of post hoc rationalisation as it is only
the surface form which is available for analysis. Thus, once a constraint ranking is
established for one output, it can then be tested against others and used to predict how the
grammar would process particular inputs.
Thus, we can see from this example how Dep and Max guard against the construction of a
new syllable ([snk]) and the reduction of the nasal cluster ([sn] and [sk]),
respectively. The faithful candidate ([snk]) violates Agree PLACE which, since its
ranking dominates the lowest ranked Faith I-O constraint, the input cannot surface in
favour of the assimilated candidate [sk]. Once this ranking is in place, it can be tested
against other items with nasal clusters to check its validity and be used to predict the
surface forms of proposed nasal cluster inputs.
However, it must be noted that this example uses the constraint FAITH I-O and not an
IDENTITY constraint, which is an alternative segmental faithfulness constraint. In this
example, the constraint FAITH I-O is generalising over the collective features represented
by the segments in the input and ensuring that these features are not altered (such as the

221
alveolar nasal’s transformation to the velar nasal). However, the family of IDENTITY
constraints (IDENT for short) allows for a constraint representative of each distinctive
feature to be included within the constraint hierarchy. Thus, we can define it as follows:
INDENT (F) – Correspondent segments are identical in the feature (F)
(See McCarthy and Prince (1995:16))
Therefore, since the place feature is being altered in the above example, we could
substitute FAITH I-O for IDENT(PLACE) for a more specific analysis. However, the resulting
output would remain the same.
10.1.1.2
Markedness Constraints
Whereas faithfulness constraints operate to keep the input and output as closely related as
possible, markedness constraints aim to promote the most ‘natural’ forms in language,
giving rise to surface forms which are the least marked. Therefore, they can work in
direct opposition to the faithfulness constraints which will conspire to retain marked
features which are present in the input. By way of illustration, it has been observed that
the basic syllable structure is CV (Consonant + Vowel) and that, in some languages, a
coda consonant is disallowed during the parsing of syllable strings, making marked
structures such as CVC redundant. This can be achieved through the introduction of a
constraint such as *Coda:
*CODA: Parsed syllables must not contain a coda consonant.
This negative constraint which will aim to eradicate any coda consonant represented in
the input will then work in opposition to the faithfulness constraint Max, which guards

222
against the deletion of phonetic detail from the input form. An example of how this may
work in a language which does not allow coda consonants is given in 10.8
10.8
/CVC/ *CODA MAX
CVC *!
CV *
Using this ranking, the winning candidate is the unmarked CV form. However, a reversal
of this ranking would allow the coda to surface:
10.9
/CVC/ MAX *CODA
CVC *
CV *!
10.1.2
Optimality Theory and Language Variation
The increased application of constraint-based models such as OT), as opposed to rule-
based models, has gradually made the process of phonological transformation by rules
and derivation less common in phonological analyses. However, Anttila notes that “work
on phonological variation has continued largely independently of phonological theory,
often consciously emphasising its empirical character” (2002:214). Therefore, research
on the nature of phonological variation and change has largely focussed on empirical
sociolinguistic studies without the application of an accompanying phonological model.
However, the advent of OT has provided the linguist with an approach which can provide
novel strategies for modelling linguistic variation and change.
Some of these strategies are briefly outlined below.
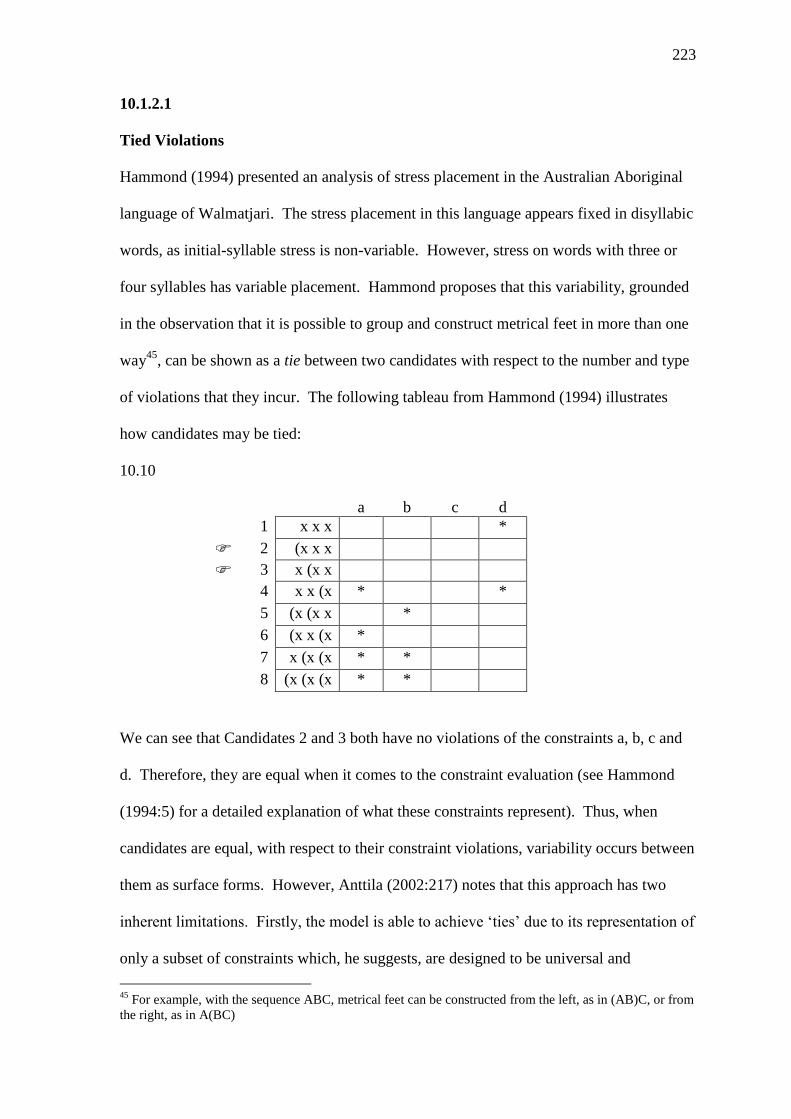
223
10.1.2.1
Tied Violations
Hammond (1994) presented an analysis of stress placement in the Australian Aboriginal
language of Walmatjari. The stress placement in this language appears fixed in disyllabic
words, as initial-syllable stress is non-variable. However, stress on words with three or
four syllables has variable placement. Hammond proposes that this variability, grounded
in the observation that it is possible to group and construct metrical feet in more than one
way45
, can be shown as a tie between two candidates with respect to the number and type
of violations that they incur. The following tableau from Hammond (1994) illustrates
how candidates may be tied:
10.10
a b c d
1 x x x *
2 (x x x
3 x (x x
4 x x (x * *
5 (x (x x *
6 (x x (x *
7 x (x (x * *
8 (x (x (x * *
We can see that Candidates 2 and 3 both have no violations of the constraints a, b, c and
d. Therefore, they are equal when it comes to the constraint evaluation (see Hammond
(1994:5) for a detailed explanation of what these constraints represent). Thus, when
candidates are equal, with respect to their constraint violations, variability occurs between
them as surface forms. However, Anttila (2002:217) notes that this approach has two
inherent limitations. Firstly, the model is able to achieve ‘ties’ due to its representation of
only a subset of constraints which, he suggests, are designed to be universal and
45
For example, with the sequence ABC, metrical feet can be constructed from the left, as in (AB)C, or from
the right, as in A(BC)
224
sufficiently detailed enough to distinguish candidates, even if that means relying on much
lower ranked constraints present in the grammar. Secondly, one aspect of variation which
is not represented in this model is the degree to which each battling candidate surfaces,
and thus, it cannot account for one variant being dominant over the other in natural
speech.
10.1.2.2
Multiple Grammars
Analyses incorporating a multiple grammars approach propose that variation arises from
invariant grammars, whose individual winning candidates are presented as the choices for
the surface form. Therefore, the initial stages, when using this approach, are to determine
what the possible grammars are (that is, all the possible ways there are of ranking the
constraints in use) and what kinds of possible surface forms or trends these grammars will
produce. These predictions can then be tested against real data to see if the predicted
types of variation approximate the real speech data. Kiparsky states that “variation comes
from competition of grammatical systems (in the individual or in the community)”
(1993:2) and, using American English, applies this model to variation patterns in t/d
deletion. He notes that there are three ways of dealing with t/d clusters which lend
themselves to the deletion of final segments:
1) The word final t/d can remain as the coda (for example, [lost][everything])
2) The word final t/d is not affiliated with any syllabic position (for example,
[los]t[everything])
3) The word final t/d can be re-syllabified as an onset (for example,
[los][teverything])

225
The first option would lead to violations of syllabic constraints on complex codas, the
second would violate Align constraints as the syllable boundaries of the input would be
altered and, finally, option three would lead to the non-parsing and, thus, deletion of a
segment. The constraints proposed by Kipasky which reflect each of these options are
SYLLABLE-WELL FORMEDNESS46
, PARSE47
and ALIGN48
, respectively. Therefore,
three possible rankings representing three competing grammars can be proposed using
these constraints
Grammar 1 -
SYLLABLE – WELL FORMEDNESS >> ALIGN >> PARSE
Grammar 2 –
ALIGN >> SYLLABLE – WELL FORMEDNESS >> PARSE
GRAMMAR 3 -
SYLLABLE – WELL FORMEDNESS >> PARSE >> ALIGN
Each of these grammars would be activated so that candidates can be evaluated against
them in parallel and, as a result, variation would occur between the winning candidates of
each grammar.
46
This constraint ensures that any syllables in the output are formed according to the requirements of the
language. 47
The PARSE constraint, from containment theory (see Prince and Smolensky (1993, 2004) or McCarthy
(2008)) guards against deletion by making sure all phonological material in the input is parsed and
represented in the output. 48
ALIGN constraints ensure that constituents (such as syllable and morpheme boundaries) retain the same
relation to each other in the output as they do in the input (see Prince and Smolensky (1993, 2004)
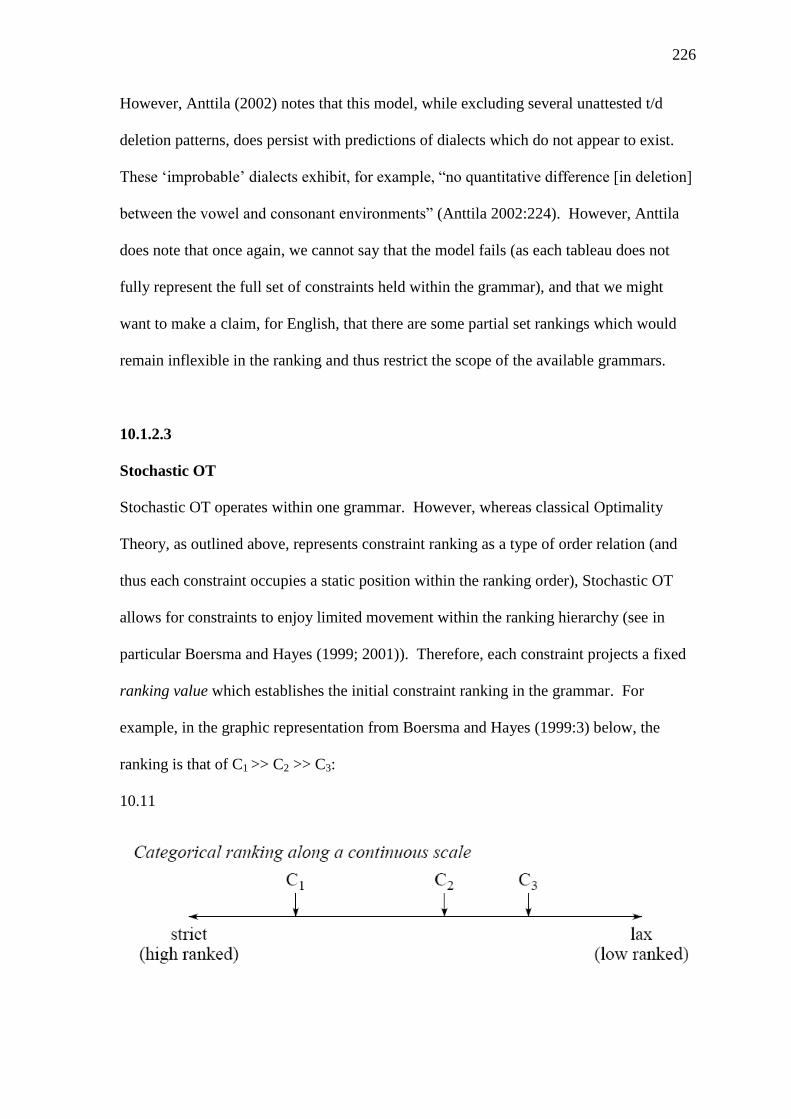
226
However, Anttila (2002) notes that this model, while excluding several unattested t/d
deletion patterns, does persist with predictions of dialects which do not appear to exist.
These ‘improbable’ dialects exhibit, for example, “no quantitative difference [in deletion]
between the vowel and consonant environments” (Anttila 2002:224). However, Anttila
does note that once again, we cannot say that the model fails (as each tableau does not
fully represent the full set of constraints held within the grammar), and that we might
want to make a claim, for English, that there are some partial set rankings which would
remain inflexible in the ranking and thus restrict the scope of the available grammars.
10.1.2.3
Stochastic OT
Stochastic OT operates within one grammar. However, whereas classical Optimality
Theory, as outlined above, represents constraint ranking as a type of order relation (and
thus each constraint occupies a static position within the ranking order), Stochastic OT
allows for constraints to enjoy limited movement within the ranking hierarchy (see in
particular Boersma and Hayes (1999; 2001)). Therefore, each constraint projects a fixed
ranking value which establishes the initial constraint ranking in the grammar. For
example, in the graphic representation from Boersma and Hayes (1999:3) below, the
ranking is that of C1 >> C2 >> C3:
10.11
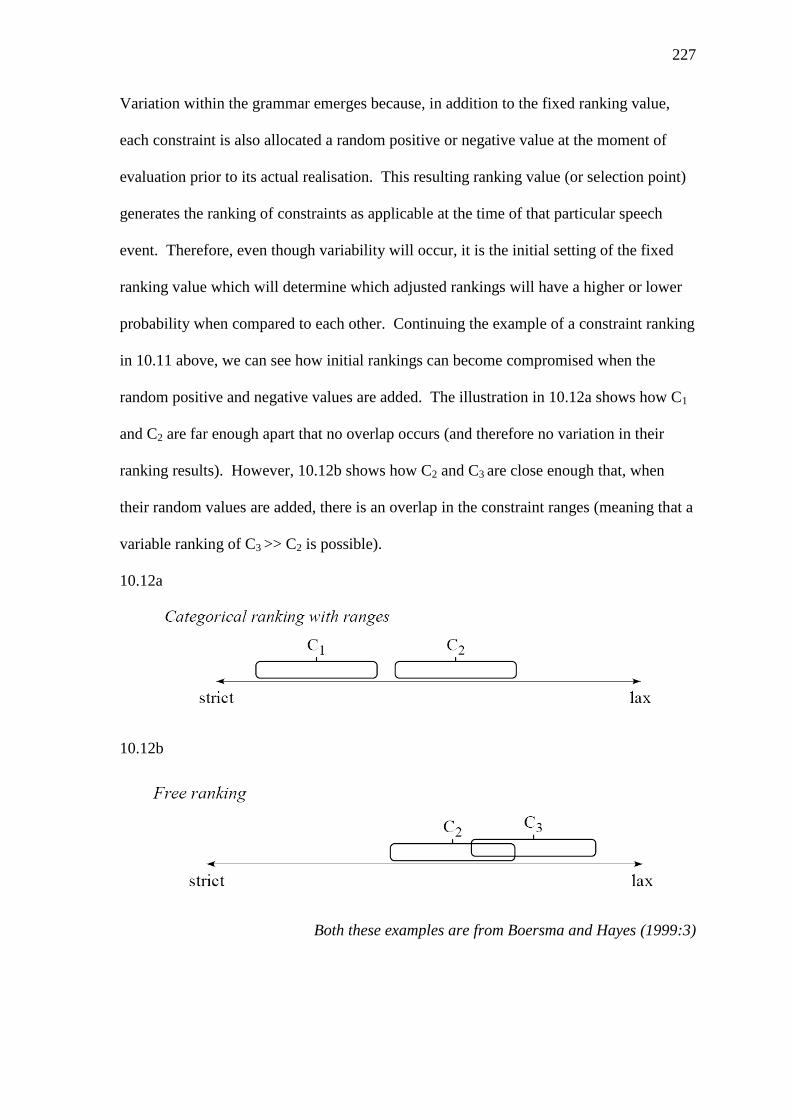
227
Variation within the grammar emerges because, in addition to the fixed ranking value,
each constraint is also allocated a random positive or negative value at the moment of
evaluation prior to its actual realisation. This resulting ranking value (or selection point)
generates the ranking of constraints as applicable at the time of that particular speech
event. Therefore, even though variability will occur, it is the initial setting of the fixed
ranking value which will determine which adjusted rankings will have a higher or lower
probability when compared to each other. Continuing the example of a constraint ranking
in 10.11 above, we can see how initial rankings can become compromised when the
random positive and negative values are added. The illustration in 10.12a shows how C1
and C2 are far enough apart that no overlap occurs (and therefore no variation in their
ranking results). However, 10.12b shows how C2 and C3 are close enough that, when
their random values are added, there is an overlap in the constraint ranges (meaning that a
variable ranking of C3 >> C2 is possible).
10.12a
10.12b
Both these examples are from Boersma and Hayes (1999:3)
228
It is the overlap in 10.12b which leads to variation if the constraints involved are those
which can influence the selection of a surface candidate.
However, since it is a requirement that each constraint employs the same standard
deviation, Anttila (2007:534) observes that there are some patterns that provide a
challenge for Stochastic OT. For example, he notes that, in a ranking of A B C, where A
must outrank B (A>>B) but C may appear in any ranked position49
, Stochastic OT would
not be able to maintain this grammar without either a reanalysis of data and subsequent
application of different constraints, or the provision for each constraint to have a different
standard deviation.
Even though these three approaches allow for variation of outputs, and have been used to
approximate the results of some established empirical data (as opposed to being
predictive), they do not allow for the evaluation of the underlying system when variation
leads to change. Instead, they are limited to recognising change as the re-ranking of
constraints to avoid tied candidates, the loss of an active parallel grammar or the
alteration of ranking values and random deviation values, which do not take into account
how these changes will affect underlying phonological structure.
In addition, even though these models have been applied to some empirical data, they do
not allow for any qualitative aspects of variation, such as style or intra-speaker
correlations within the variation pattern.
49
C>>A>>B or A>>C>>B or A>>B>>C
229
One possible approach that could model the variation and change in Mersea Island
English and represent some of the variation patterns highlighted by the data analyses is
Dispersion Theory. Therefore, the following sections will introduce the phonological
theory of Dispersion (as presented by Flemming (2004; 2006)), whose focus is on
underlying phonological structure and maintenance of structure. The main principles of
this theory will be discussed before attention is turned to how a theory of dispersion can
be incorporated into a three-tiered model of language in which the derivation and
variation of linguistic units is represented in both phonological derivation and
sociolinguistic practice.
10.2
Dispersion Theory
Flemming (2004; 2006), by means of phonetic classification and mapping of speech
sounds, aimed to explore, through an optimality theoretic framework, the “general
character of the constraints imposed on phonology by the need to minimise confusion”
(2004:232). By taking a more perceptual (as opposed to a productive) stance, the model
approaches a theory of speech by considering the conflict between constraints which
minimise effort on behalf of the speaker and those which ensure the perceiver can recover
enough distinctive information in order to avoid perceptual confusion. Thus, the theory
promotes the existence of constraints which maintain contrasts between individual units,
while the relative markedness of a sound is dependent upon the sounds with which it is
intended to contrast. Thus, contrasts are more marked the less distinct they are.
230
Using the distribution of a language’s vocalic elements, Flemming (2004:236) notes that
the selection of phonological contrasts within the vowel space is subject to three
functional goals:
1. Minimise Articulatory Effort – articulatory effort on the part of the speaker should
be minimised
2. Maximise Distinctiveness of Contrasts – individual forms must be as distinct from
each other as possible
3. Maximise the Number of Contrasts – the phonological inventory must contain as
many contrasts as possible
These fundamental goals each relate to a set of OT constraints which help to construct the
grammar. Thus, this type of functionalist approach influences the construction and
evaluation of the phonological system. However, McCarthy (2002:227) refers to
Dispersion Theory as a method which provides a type of meta-grammar whose
motivation is to evaluate candidate grammars as opposed to linguistic expression. This
contrasts with the classic ideals of OT in which it is the linguistic expressions (or units)
which are subjected to evaluations and not the linguistic generalisations. Therefore, the
basis of these two theoretical approaches to phonology cannot be directly compared (even
though they use the same basic machinery with respect to the application of constraints)
since their domains of application differ – whereas Dispersion Theory aims to provide
justification for the distribution of sounds in the underlying phonological system and not
to evaluate sound strings in preparation for realisation, Classic OT makes no assertions on
the underlying sound system but rather it proposes a number of surface form candidates
which compete for eventual realisation.
231
10.2.1
Dispersion Constraints
The conflicting nature of an inventory’s three functional goals (as outlined above) makes
OT an ideal framework since its very nature allows for the resolution of conflicts through
the relative ranking of representative constraints. Therefore, this section will introduce
the basic constraints involved in Dispersion Theory following Flemming (2004; 2006).
Minimise Articulatory Effort
Flemming suggests that “two of the fundamental forces shaping phonology are the need
to minimize effort on the part of the speaker and the need to minimize the likelihood of
confusion on the part of the listener” (2004:232). The articulatory effort on the part of the
speaker relates to the articulatory requirements of a particular sound in a particular
context. As a result, effort minimization on the part of the speaker may reduce the degree
of contrast between segments. For example, Flemming notes that “effort minimization
dictates that vowels should accommodate to the articulatory requirements of neighboring
consonants” (2004:235). As a result, a language will have a tendency to nasalize vowels
in between two nasal consonants (such as in man and sang). However, if the language in
question maintains a phonemic distinction between oral and nasal vowels, this process
will be minimized in order to maintain the contrast for perceptual purposes.
Minimum Distance – MIN DIST
The constraint MIN DIST ensures that the distinctiveness of contrasts is maximised. This
family of constraints make particular use of Formant structure as descriptors and phonetic
reference points. Formants are concentrations of acoustic energy which are combinations
of frequencies as air vibrates in the vocal tract. The three dominant formants in vowel
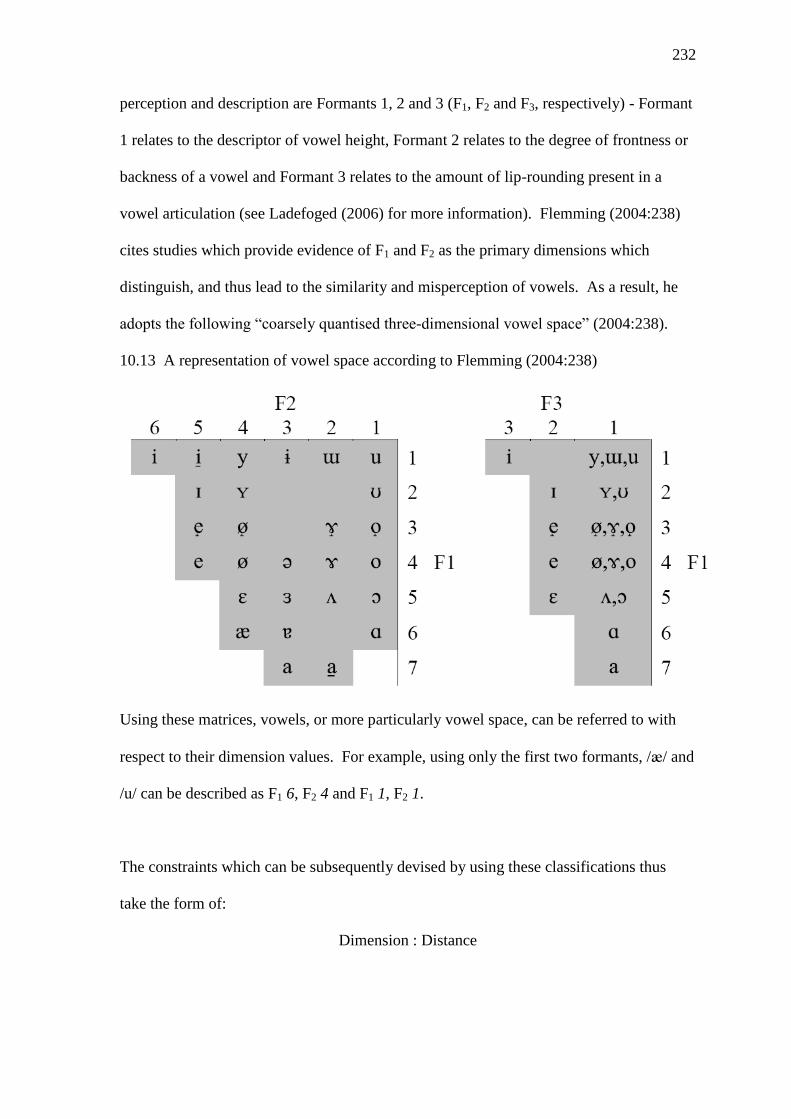
232
perception and description are Formants 1, 2 and 3 (F1, F2 and F3, respectively) - Formant
1 relates to the descriptor of vowel height, Formant 2 relates to the degree of frontness or
backness of a vowel and Formant 3 relates to the amount of lip-rounding present in a
vowel articulation (see Ladefoged (2006) for more information). Flemming (2004:238)
cites studies which provide evidence of F1 and F2 as the primary dimensions which
distinguish, and thus lead to the similarity and misperception of vowels. As a result, he
adopts the following “coarsely quantised three-dimensional vowel space” (2004:238).
10.13 A representation of vowel space according to Flemming (2004:238)
Using these matrices, vowels, or more particularly vowel space, can be referred to with
respect to their dimension values. For example, using only the first two formants, // and
/u/ can be described as F1 6, F2 4 and F1 1, F2 1.
The constraints which can be subsequently devised by using these classifications thus
take the form of:
Dimension : Distance

233
Therefore, the constraint MIN DIST F1:2 means that there must be a gap of at least two
squares between forms being evaluated on the F1 dimension. For example, the pair u ~
would be acceptable by this constraint but the pair u ~ would not be acceptable.
Since one requirement is that auditory distinctiveness should be maximised, less distinct
contrasts incur more serious violations. This is formalised by Flemming (2004:239) as
follows:
MIN DIST = D:n is ranked above MIN DIST = D:n +1
Therefore, by using this formula ranking we are saying that a violation of MIN DIST D:n is
more serious than a violation of MIN DIST D:n +1 since the former constraint will permit
a smaller distance between forms being evaluated which may compromise auditory
distinctiveness.
Maximise Contrasts – MAX CONT
Implemented as a positive constraint, MAX CONT aims to select an inventory of sounds
which represent the largest amount of contrasts. However, the requirements of MAX
CONT will conflict with those of MIN DIST and so, depending on their relative rankings,
MAX CONT will instead be allowed to select the largest viable inventory (that is, the
largest inventory permitted by the interaction and restrictions of other constraints). For
example, a language may guard against vowels which are too close together with respect
to F1 distance by ranking a MIN DIST constraint, such as MIN DIST F1:3, higher than MAX
CONT. This would ensure that contrasts are achieved up to, and including vowels three
spaces apart on the F1 dimension and any further attempt by the system at maximisation is
disallowed. This can be demonstrated by the selection of front vowels below. It is also
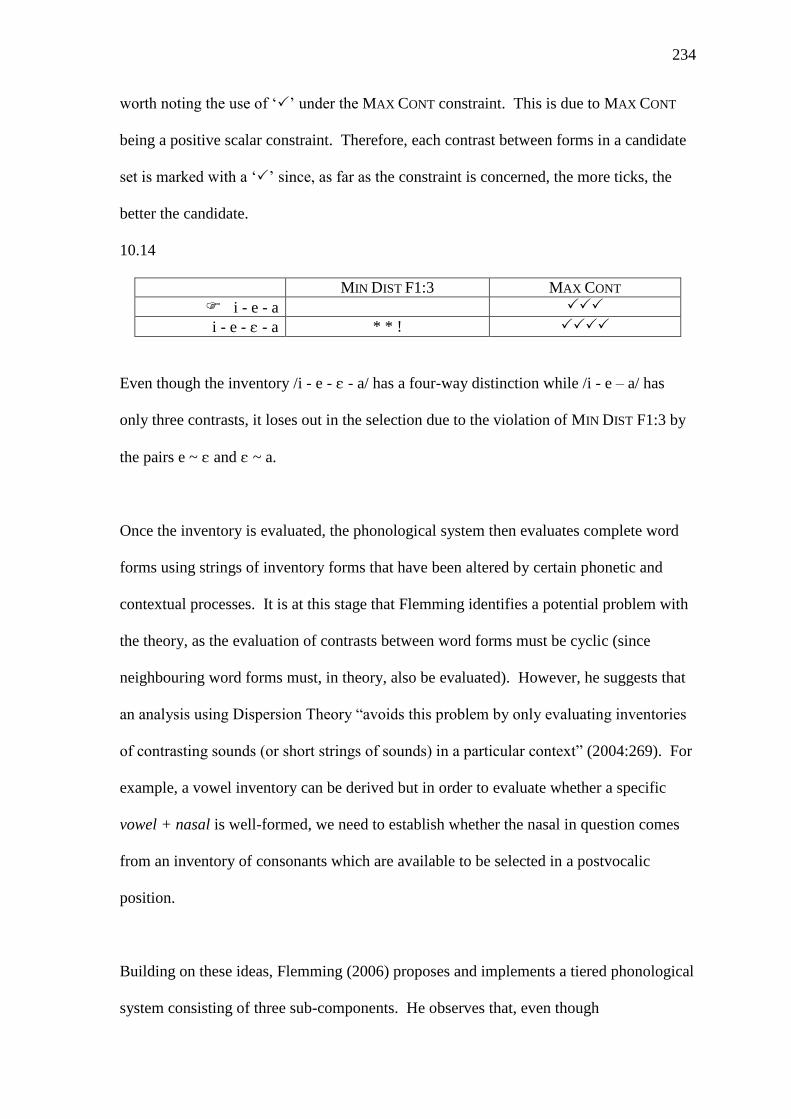
234
worth noting the use of ‘’ under the MAX CONT constraint. This is due to MAX CONT
being a positive scalar constraint. Therefore, each contrast between forms in a candidate
set is marked with a ‘’ since, as far as the constraint is concerned, the more ticks, the
better the candidate.
10.14
MIN DIST F1:3 MAX CONT
i - e - a
i - e - - a * * !
Even though the inventory /i - e - - a/ has a four-way distinction while /i - e – a/ has
only three contrasts, it loses out in the selection due to the violation of MIN DIST F1:3 by
the pairs e ~ and ~ a.
Once the inventory is evaluated, the phonological system then evaluates complete word
forms using strings of inventory forms that have been altered by certain phonetic and
contextual processes. It is at this stage that Flemming identifies a potential problem with
the theory, as the evaluation of contrasts between word forms must be cyclic (since
neighbouring word forms must, in theory, also be evaluated). However, he suggests that
an analysis using Dispersion Theory “avoids this problem by only evaluating inventories
of contrasting sounds (or short strings of sounds) in a particular context” (2004:269). For
example, a vowel inventory can be derived but in order to evaluate whether a specific
vowel + nasal is well-formed, we need to establish whether the nasal in question comes
from an inventory of consonants which are available to be selected in a postvocalic
position.
Building on these ideas, Flemming (2006) proposes and implements a tiered phonological
system consisting of three sub-components. He observes that, even though
235
distinctiveness constraints favour maximisation of perceptual differences between sounds
which are intended to contrast, these constraints would also prompt positional
neutralisation effects as results from processes such as assimilation. In other words, an
established contrast between forms in the phonological inventory would then be
neutralised in the surface realisation due to a lack of distinctiveness in a particular
phonological environment. However, the freedom to which distinctiveness constraints
may interact with other phonological constraints must be limited so that effects such as
contextual enhancement of contrasts (as opposed to contextual neutralisation), which are
not attested, cannot be imposed on the surface forms. Indeed, the acknowledgement that
distinctiveness is not the only mechanism required by perceptual devices, together with
the desire to keep any system of contrasts as consistent as possible across all contexts,
leads Flemming to the following:
“The distinctiveness constraints evaluate contrasts between
words only to check that the contrasts are adequately realised
on the surface – if not, they are neutralised (giving rise to
positional neutralisation). However, distinctiveness constraints
play no other role in the mapping from underlying to surface
form. That mapping is governed by constraints requiring
faithful realisation of the underlying contrasts in conflict with
markedness constraints (articulatory constraints, metrical
constraints, etc). The faithfulness constraints favour consistent
realisation of the inventory of contrasts in all contexts.”
(2006:1)
Thus, distinctiveness constraints apply to surface forms in context while any
enhancements of the system are carried out in the segmental inventory, free from context.
The result of this is a three-tiered phonological model in which particular constraints are
activated at specific times. Firstly, constraints which apply to the underlying system are
activated in the first tier, where only individual units, free from other linguistic contexts,
236
are present. The subsequent tiers then evaluate the underlying segments as they appear in
phonological strings (such as word forms) before further distinctiveness checks take place
in the final tier.
The following sections will outline the three sub-components of this model as presented
by Flemming (2006) before a subsequent discussion and demonstration of how it may be
applied to the variable data previously presented in this thesis. Accompanying this will
be highlights of any problems encountered in the application of this model to empirical
data, as well as how these problems may be overcome. The result will be a modified
phonological model which is designed to represent the interface of phonology and
sociolinguistics.
10.3
A Three- Part Phonology
Flemming (2006) outlines three sub-components which complement each other in an
individual yet hierarchical structure. Therefore, it is a stratal-type system through which
the derivational output of one stage provides the input for the next (see, for example,
Kiparsky (2000; 2008)). However, he notes that, even though these individual
components are distinguished, due to them enjoying limited interaction, “they are not
organised in a serial derivation” (2006:9), which is the case with normal stratal models.
These components are the Inventory, the Realisation and the Evaluation of Surface
Contrasts (ESC). This section will briefly outline each component in turn using
Flemming’s own examples, before demonstrating how they interact as a whole.
237
10.3.1
The Inventory50
“The Inventory selects a basic inventory of contrasting segment types” (2006:10)
To create an inventory of sounds is to select a set of individual forms which will be
consistent in their realisation irrespective of context. Therefore, a phonological inventory
will be made up of single, context-free sound segments, or phonemes. These will also
reflect the perceptual considerations of the linguistic system and effectively represent the
categorical divisions of perceptual space.
The selection of inventory segments relies upon the relative ranking of MIN DIST and
MAX CONT constraints (see 10.2.1 above) as well as what Flemming describes as
segment-internal articulatory markedness constraints (such as effort constraints).
Importantly, contextual markedness constraints are not activated by the system at this
stage.
By way of demonstration, consider the following selection of the vowel inventory of
Cantonese. Of particular interest here are the contrasts relating to backness and
roundedness. In addition, since the constraints rely on the classifications used in
Flemming’s perceptual grid, as presented in figure 10.13 above, it is reproduced here for
convenience.
50
From this point onwards, a capital letter (Inventory) will signify the underlying stage of derivation where
possible phonemic sets are evaluated. However, lower case (inventory) will refer to the actual set of
phonemes selected at this stage of derivation.
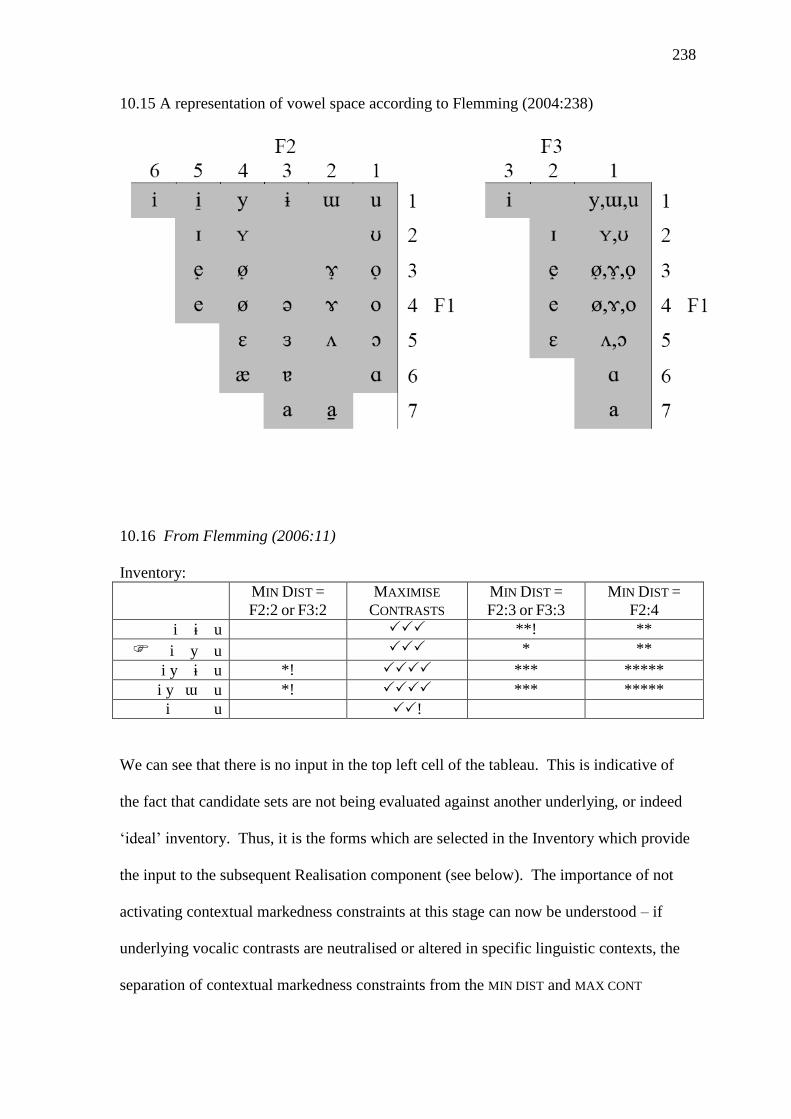
238
10.15 A representation of vowel space according to Flemming (2004:238)
10.16 From Flemming (2006:11)
Inventory:
MIN DIST =
F2:2 or F3:2
MAXIMISE
CONTRASTS
MIN DIST =
F2:3 or F3:3
MIN DIST =
F2:4
i u **! **
i y u * **
i y u *! *** *****
i y u *! *** *****
i u !
We can see that there is no input in the top left cell of the tableau. This is indicative of
the fact that candidate sets are not being evaluated against another underlying, or indeed
‘ideal’ inventory. Thus, it is the forms which are selected in the Inventory which provide
the input to the subsequent Realisation component (see below). The importance of not
activating contextual markedness constraints at this stage can now be understood – if
underlying vocalic contrasts are neutralised or altered in specific linguistic contexts, the
separation of contextual markedness constraints from the MIN DIST and MAX CONT
239
constraints allow for the relative stability of the underlying inventory across all contexts
(Flemming 2006:11).
10.3.2
The Realisation
“The Realisation component maps an input string onto its phonetic realisation”
(2006:11)
At this stage, individual inventory segments are put together in order to form segment
strings, or words. Thus, the input segments for this component are those which have been
generated by the Inventory constraints. Since formally individual and context-free
segments are now adjacent to each other, they have phonological context and, therefore,
contextual markedness constraints can now be activated. Flemming notes that it is these
constraints which motivate contextual variation, such as certain co-articulatory effects.
However, these alternations are not evaluated by MIN DIST. These constraints are only
reactivated in the third and last component which evaluates the output from Realisation.
Instead, the preservation of contrasts in Realisation is maintained by a mixture of
faithfulness constraints.
Therefore, the mechanics of this stage allow not only for contextual alternations, such as
co-articulation effects, to be established, but also aspects such as syllabification and stress
assignment to be calculated. This is due to the inclusion of certain phonetic information
which is accessed and mapped as the segmental strings are formed. The mapping of input
strings and evaluation of candidates at this stage resembles more of a Classic OT
approach with respect to the faithfulness constraints (aiming to preserve the qualities of
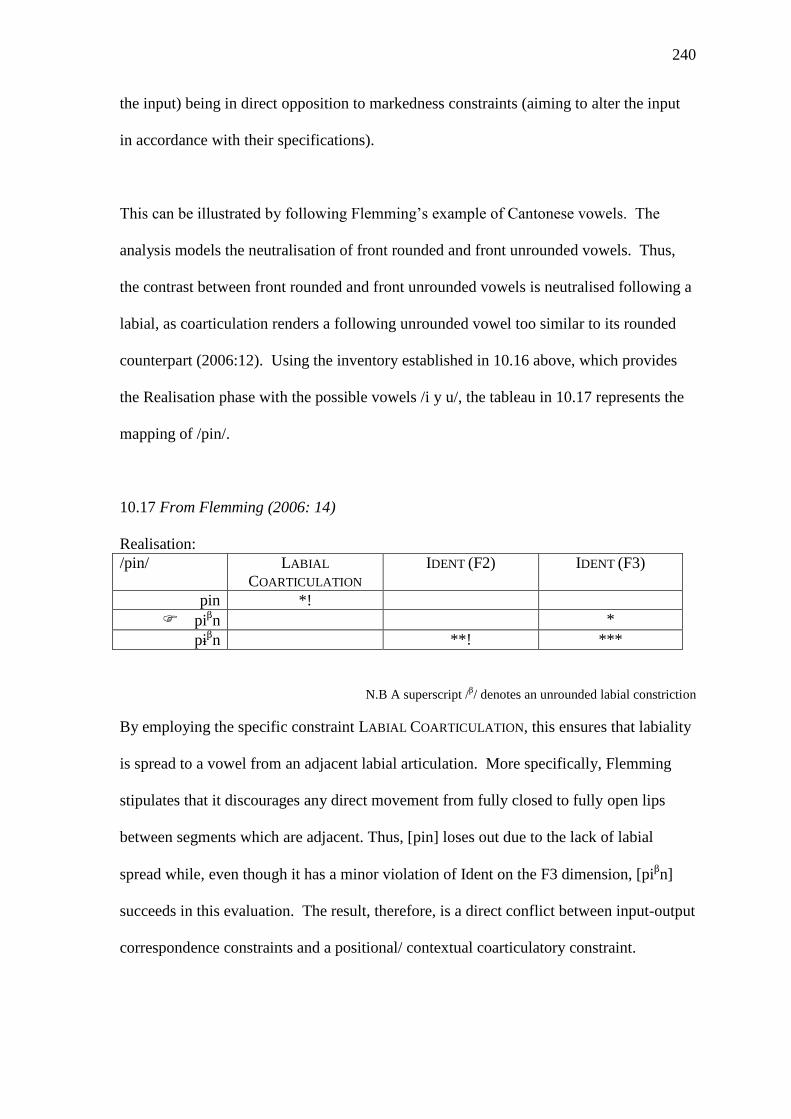
240
the input) being in direct opposition to markedness constraints (aiming to alter the input
in accordance with their specifications).
This can be illustrated by following Flemming’s example of Cantonese vowels. The
analysis models the neutralisation of front rounded and front unrounded vowels. Thus,
the contrast between front rounded and front unrounded vowels is neutralised following a
labial, as coarticulation renders a following unrounded vowel too similar to its rounded
counterpart (2006:12). Using the inventory established in 10.16 above, which provides
the Realisation phase with the possible vowels /i y u/, the tableau in 10.17 represents the
mapping of /pin/.
10.17 From Flemming (2006: 14)
Realisation:
/pin/ LABIAL
COARTICULATION
IDENT (F2) IDENT (F3)
pin *!
pin *
pn **! ***
N.B A superscript // denotes an unrounded labial constriction
By employing the specific constraint LABIAL COARTICULATION, this ensures that labiality
is spread to a vowel from an adjacent labial articulation. More specifically, Flemming
stipulates that it discourages any direct movement from fully closed to fully open lips
between segments which are adjacent. Thus, [pin] loses out due to the lack of labial
spread while, even though it has a minor violation of Ident on the F3 dimension, [pin]
succeeds in this evaluation. The result, therefore, is a direct conflict between input-output
correspondence constraints and a positional/ contextual coarticulatory constraint.
241
Once the realisation has been mapped and a candidate has been selected, each string will
then activate the final stage – The Evaluation of Surface Contrasts.
10.3.3
The Evaluation of Surface Contrasts - (ESC)
The ESC is where the distinctiveness of contrasts is assessed, based on the phonetically
mapped outputs of the Realisation stage. In order to do this, MinDist must once again be
activated in order to see if the outputs of Realisation are too similar to other potential
word forms. Importantly, however, Flemming notes that “there is no re-ranking of
constraints between components, although only certain classes of constraints apply in
each component” (2006:14). Therefore, the MinDist constraints must remain in the same
dominance relations in the ESC as they were in the Inventory.
The mechanics of the ESC allow for the target input to be evaluated in relation to a set of
other inputs with which it minimally contrasts. Ideally, this set would contain all possible
input forms which differ from the target by at least one segment as well as some
additional forms. Each input form from the set has the potential to be realised or indeed
neutralised with a neighbouring member of the set.
A merger can be obtained by having a violation of a higher ranked MinDist constraint in
relation to a constraint such as *MERGE (which prevents neutralisations). Therefore, if
the alterations made by contextual markedness constraints render, for example, a vowel
too close to a neighbouring Inventory vowel, the contrast between the two ceases to
surface. For example, in the case of Cantonese vowels, if the output [pin], from the
Realisation violates a highly ranked MinDist constraint, by virtue of being too close to
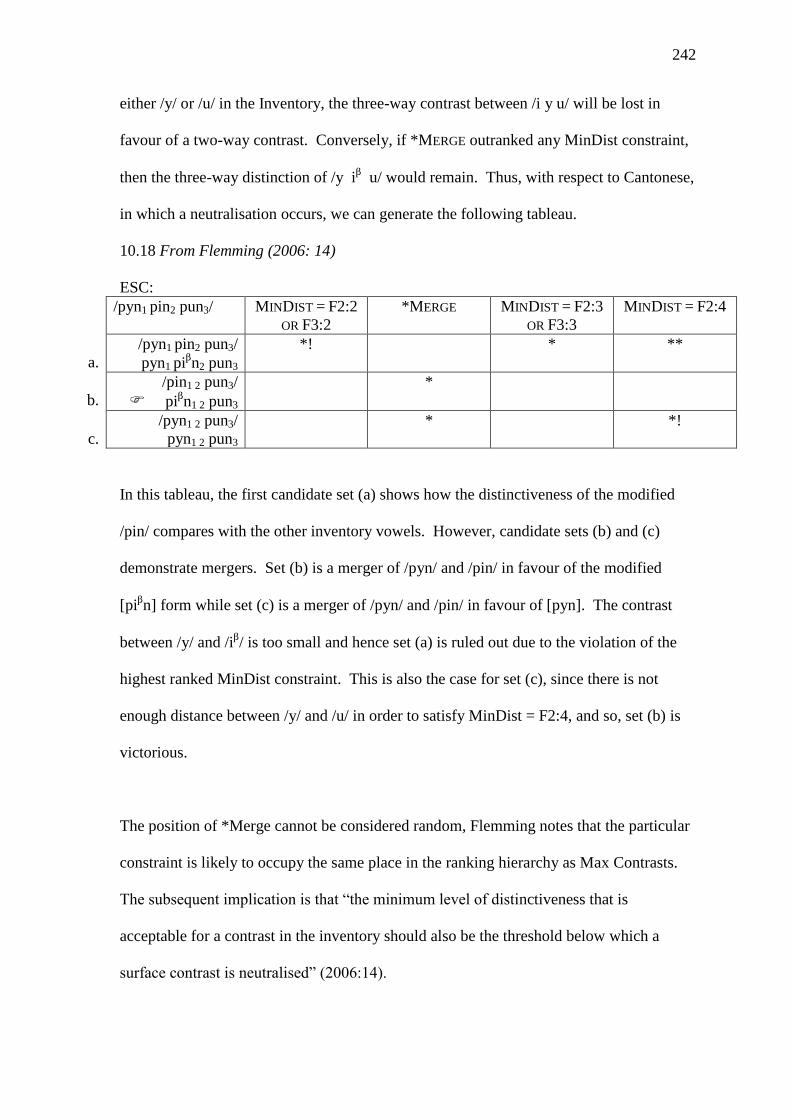
242
either /y/ or /u/ in the Inventory, the three-way contrast between /i y u/ will be lost in
favour of a two-way contrast. Conversely, if *MERGE outranked any MinDist constraint,
then the three-way distinction of /y i u/ would remain. Thus, with respect to Cantonese,
in which a neutralisation occurs, we can generate the following tableau.
10.18 From Flemming (2006: 14)
ESC:
/pyn1 pin2 pun3/ MINDIST = F2:2
OR F3:2
*MERGE MINDIST = F2:3
OR F3:3
MINDIST = F2:4
a.
/pyn1 pin2 pun3/
pyn1 pin2 pun3
*! * **
b.
/pin1 2 pun3/
pin1 2 pun3
*
c.
/pyn1 2 pun3/
pyn1 2 pun3
* *!
In this tableau, the first candidate set (a) shows how the distinctiveness of the modified
/pin/ compares with the other inventory vowels. However, candidate sets (b) and (c)
demonstrate mergers. Set (b) is a merger of /pyn/ and /pin/ in favour of the modified
[pin] form while set (c) is a merger of /pyn/ and /pin/ in favour of [pyn]. The contrast
between /y/ and /i/ is too small and hence set (a) is ruled out due to the violation of the
highest ranked MinDist constraint. This is also the case for set (c), since there is not
enough distance between /y/ and /u/ in order to satisfy MinDist = F2:4, and so, set (b) is
victorious.
The position of *Merge cannot be considered random, Flemming notes that the particular
constraint is likely to occupy the same place in the ranking hierarchy as Max Contrasts.
The subsequent implication is that “the minimum level of distinctiveness that is
acceptable for a contrast in the inventory should also be the threshold below which a
surface contrast is neutralised” (2006:14).

243
10.3.4
Evaluation of this Approach
The innovative incorporation of phonetic mapping in the Realisation allows for
phonetically detailed representations to be generated before further evaluation by
phonological mechanisms in the ESC. A benefit of this is, for example, that the
consistency of contrasting Inventory forms across all linguistic contexts is established
before they are modified and evaluated by the subsequent components. Another benefit is
that phonetically derived alternations can be established in the Realisation before being
passed onto the phonologically-based ESC, which then evaluates these outputs with
respect to the final distribution of contrast but cannot directly influence them. Thus, the
phonetics ~ phonology interface is well represented but, at the same time, limited due to
the restricted interaction between Realisation and ESC.
One drawback of this model, as it stands, is that it has been constructed by Flemming to
model and explore the nature of segmental neutralisations and positional enhancements
and not language or dialect variation and change. There are, however, aspects of this
approach which can benefit a variation analysis:
Consistency of the Inventory
Flemming (2004:232) notes that one desire of a phonology is that perceptual differences
between units should not be too subtle or else they are more likely to lead to perceptual
confusions. As a result, we can say that by allowing a maximally distinct inventory of
sounds, this reflects the natural tendencies and desires of the phonological system. Thus,
differences across language inventories will be established through contrasting rankings
244
of the MinDist and Max Contrasts constraints. This may even be extended to more
similar dialect varieties of languages, where we may want to claim similar underlying
inventories (reflecting membership of a particular ‘language’ or ‘language family’) but
contrasting derivations in the Realisation (reflecting variation within a ‘language’ or
‘language family’).
Contextual Variation
As we have seen, the Realisation phase takes into account linguistic context and can force
contextual deviations from the Inventory’s output selection. A benefit of this, with
respect to dialect variation, is the power to model differences between dialects of the
same language variety which adhere to particular linguistic patterns according to context,
such as Canadian Raising (as previously outlined).
Building on these observations, the following sections will present and discuss how some
of the patterns of variation observed in the Mersea Island English data (presented in
Chapters 4, 6 and 8 above) can be modelled using Flemming’s inventory-based model as
a guide. We will see that it is not only necessary to include the phonetic mapping of
underlying forms (which establishes linguistic context), but it is also necessary to
introduce a new component which can represent the interface between phonology and
sociolinguistics. This sociolinguistic component will be introduced as a way of
demonstrating not only contextual and stylistic variation, but also as a way of introducing
variation leading to dialect change over time.
245
10.4
An Inventory- Based Model of Mersea Island English
This section will explore how the empirical sociolinguistic data presented in this thesis
may be phonologically modelled.
Initially, I shall present examples of data following Flemming’s model (as outlined
above). However, once this has been done, it will be seen that, in order to represent the
data appropriately, modifications to the ESC must be made.
10.4.1
The Inventory
As previously discussed, the constraints which are active at this level are those which
regulate the underlying segmental inventory – MinDist, Max Contrast and any applicable
segmental articulatory markedness constraints.
In the previous examples and discussions, simple vowels have been discussed with
respect to the grid utilised by Flemming (2004; 2006). However, since the analysis of
Mersea Island English presented in this thesis centres on the variation of diphthongs,
certain descriptive modifications need to be made. Therefore, the following will apply as
outlined below:
MIN DIST – activated to regulate the spread of diphthongs across
articulatory and perceptual space.
MAXIMISE CONTRAST – aims to generate the largest inventory of
distinctive forms.
Segmental Articulatory Markedness Constraints – these constraints
would include those which aim to enhance the internal structure and integrity
of the diphthongs.
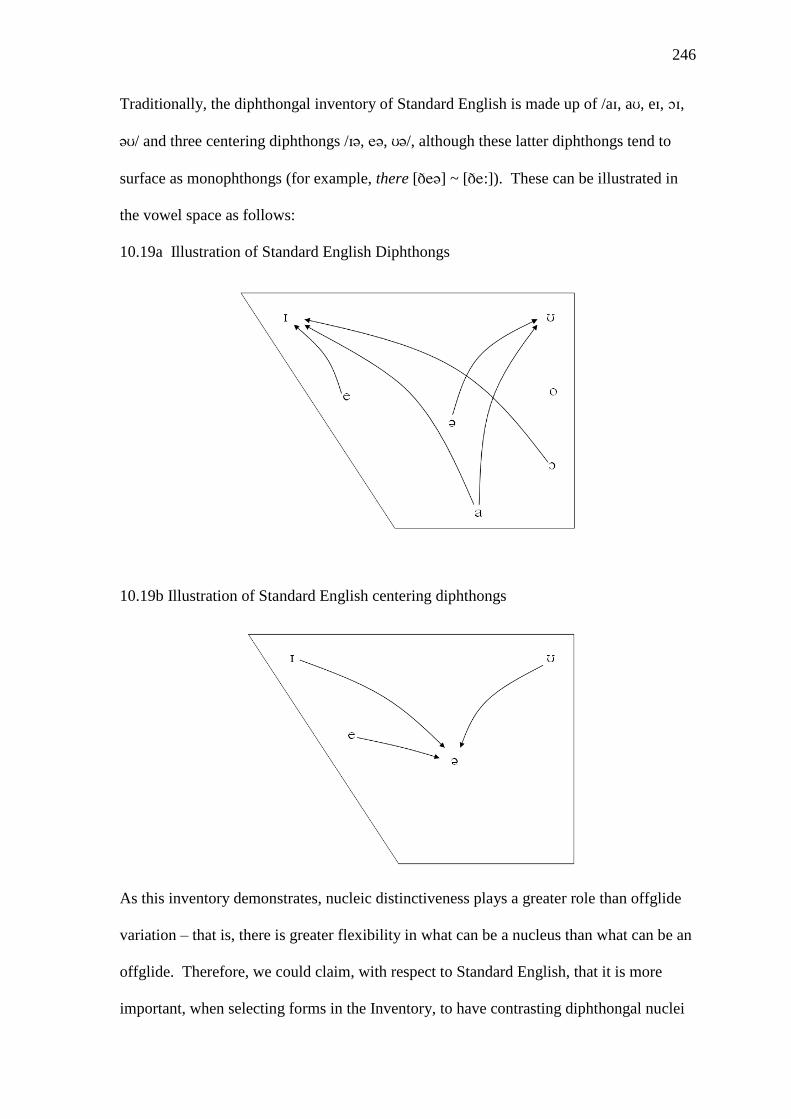
246
Traditionally, the diphthongal inventory of Standard English is made up of /a, a, e, ,
/ and three centering diphthongs /, , /, although these latter diphthongs tend to
surface as monophthongs (for example, there [] ~ [:]). These can be illustrated in
the vowel space as follows:
10.19a Illustration of Standard English Diphthongs
10.19b Illustration of Standard English centering diphthongs
As this inventory demonstrates, nucleic distinctiveness plays a greater role than offglide
variation – that is, there is greater flexibility in what can be a nucleus than what can be an
offglide. Therefore, we could claim, with respect to Standard English, that it is more
important, when selecting forms in the Inventory, to have contrasting diphthongal nuclei
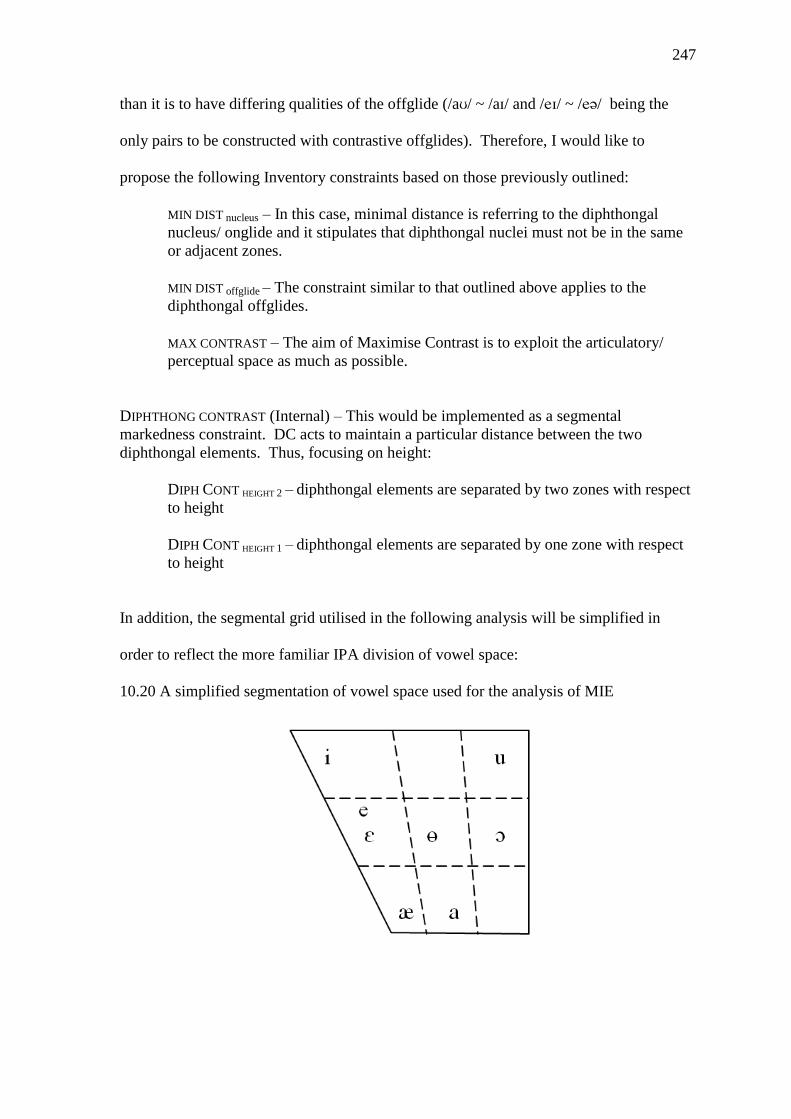
247
than it is to have differing qualities of the offglide (/a/ ~ /a/ and // ~ // being the
only pairs to be constructed with contrastive offglides). Therefore, I would like to
propose the following Inventory constraints based on those previously outlined:
MIN DIST nucleus – In this case, minimal distance is referring to the diphthongal
nucleus/ onglide and it stipulates that diphthongal nuclei must not be in the same
or adjacent zones.
MIN DIST offglide – The constraint similar to that outlined above applies to the
diphthongal offglides.
MAX CONTRAST – The aim of Maximise Contrast is to exploit the articulatory/
perceptual space as much as possible.
DIPHTHONG CONTRAST (Internal) – This would be implemented as a segmental
markedness constraint. DC acts to maintain a particular distance between the two
diphthongal elements. Thus, focusing on height:
DIPH CONT HEIGHT 2 – diphthongal elements are separated by two zones with respect
to height
DIPH CONT HEIGHT 1 – diphthongal elements are separated by one zone with respect
to height
In addition, the segmental grid utilised in the following analysis will be simplified in
order to reflect the more familiar IPA division of vowel space:
10.20 A simplified segmentation of vowel space used for the analysis of MIE
248
Therefore, even though this grid does not reflect segments with the same phonetic
accuracy as that used by Flemming, the use of phonological target zones will help to
simplify the MinDist and Diph Contrast calculations.
Since this thesis is concerned with the behaviour and interaction of the three diphthongs
/a/, /a/ and //, this is where the following tableaux will focus. In addition, the tableaux
are not directly concerned, as in Flemming’s work, with the number of contrasts which
can be established through the optimisation of the vowel space. Instead, the primary
concern of the model is to examine how, by using dispersion theory, the integrity of the
diphthongal system is established and maintained. Thus, by using a subset of this system
(/a/, /a/, //), we can explore how the direction of change in Mersea Island English is
motivated and optimised, as opposed to seeing how the entire system is maintained over
various linguistic contexts.
To start, let us consider how we might derive a Standard English Inventory of sounds,
namely /a/, /a/ and //.
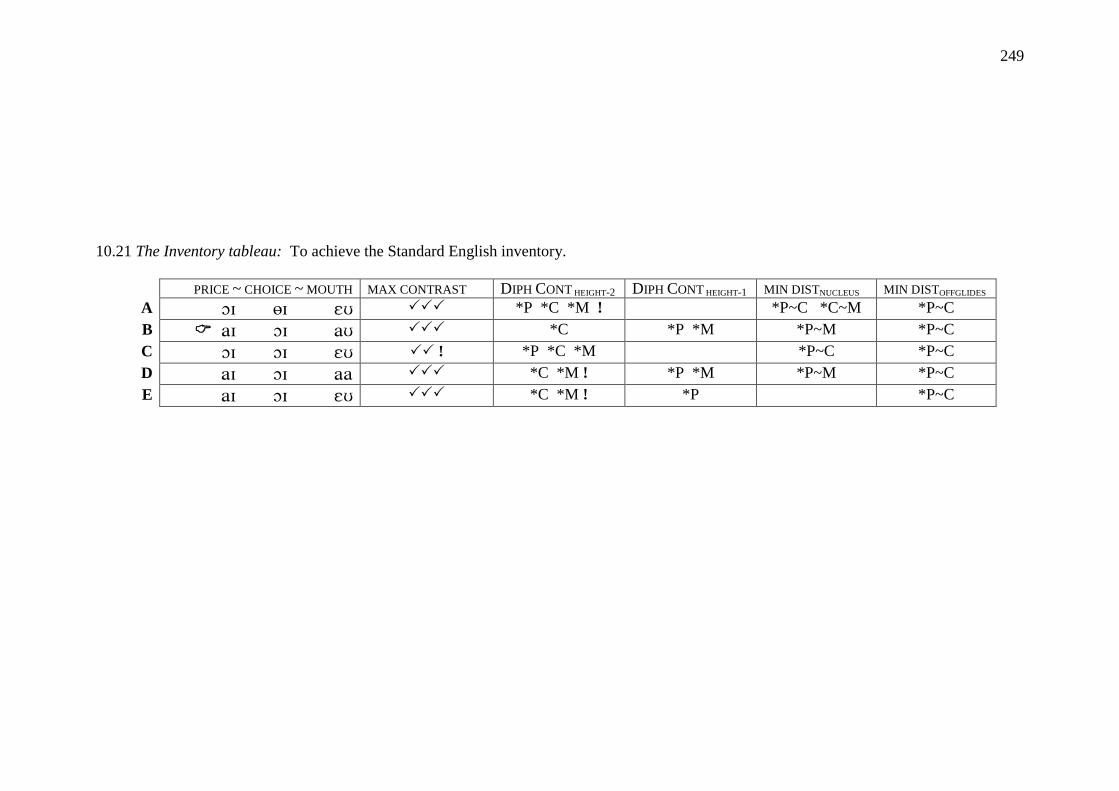
249
10.21 The Inventory tableau: To achieve the Standard English inventory.
PRICE ~ CHOICE ~ MOUTH MAX CONTRAST DIPH CONT HEIGHT-2 DIPH CONT HEIGHT-1 MIN DISTNUCLEUS MIN DISTOFFGLIDES
A *P *C *M ! *P~C *C~M *P~C
B *C *P *M *P~M *P~C
C ! *P *C *M *P~C *P~C
D *C *M ! *P *M *P~M *P~C
E *C *M ! *P *P~C
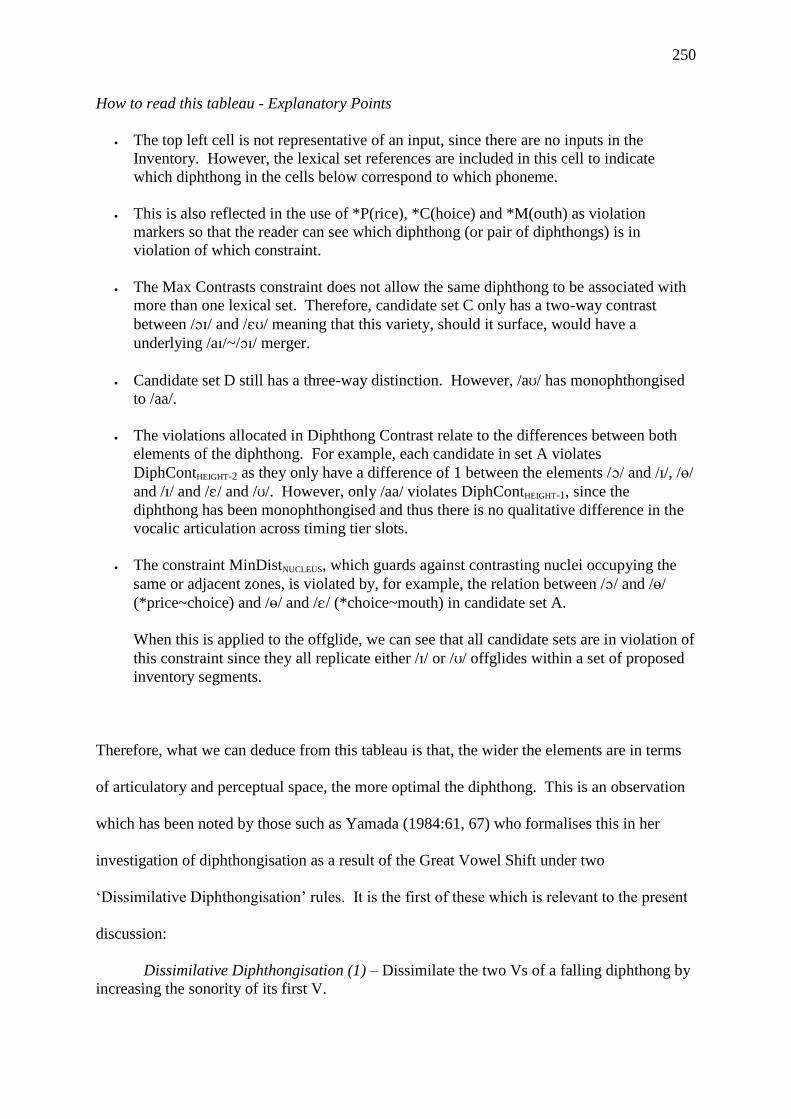
250
How to read this tableau - Explanatory Points
The top left cell is not representative of an input, since there are no inputs in the
Inventory. However, the lexical set references are included in this cell to indicate
which diphthong in the cells below correspond to which phoneme.
This is also reflected in the use of *P(rice), *C(hoice) and *M(outh) as violation
markers so that the reader can see which diphthong (or pair of diphthongs) is in
violation of which constraint.
The Max Contrasts constraint does not allow the same diphthong to be associated with
more than one lexical set. Therefore, candidate set C only has a two-way contrast
between // and // meaning that this variety, should it surface, would have a
underlying /a/~// merger.
Candidate set D still has a three-way distinction. However, /a/ has monophthongised
to /aa/.
The violations allocated in Diphthong Contrast relate to the differences between both
elements of the diphthong. For example, each candidate in set A violates
DiphContHEIGHT-2 as they only have a difference of 1 between the elements // and //, //
and // and // and //. However, only /aa/ violates DiphContHEIGHT-1, since the
diphthong has been monophthongised and thus there is no qualitative difference in the
vocalic articulation across timing tier slots.
The constraint MinDistNUCLEUS, which guards against contrasting nuclei occupying the
same or adjacent zones, is violated by, for example, the relation between // and //
(*price~choice) and // and // (*choice~mouth) in candidate set A.
When this is applied to the offglide, we can see that all candidate sets are in violation of
this constraint since they all replicate either // or // offglides within a set of proposed
inventory segments.
Therefore, what we can deduce from this tableau is that, the wider the elements are in terms
of articulatory and perceptual space, the more optimal the diphthong. This is an observation
which has been noted by those such as Yamada (1984:61, 67) who formalises this in her
investigation of diphthongisation as a result of the Great Vowel Shift under two
‘Dissimilative Diphthongisation’ rules. It is the first of these which is relevant to the present
discussion:
Dissimilative Diphthongisation (1) – Dissimilate the two Vs of a falling diphthong by
increasing the sonority of its first V.
251
As a result, the newly developed diphthong will continue to develop by lowering the nucleus
to a more sonorous position and thus creating a wider sonority (and articulatory) gap between
the two vowels.
Therefore, it seems reasonable to assume that the wider the diphthong, the less marked it is in
terms of perceptual distinctiveness (even though the articulatory effort involved will be
greater).
We can also present this claim by examining the nature of the quantum vowels /a i u/.
10.22
These vowels are generally proposed as being ‘unmarked’ due to their positioning and status
in phonological systems across languages. By extension, therefore, we might make the
assertion that the diphthongs /ai/ and /au/ are indeed ‘unmarked diphthongs’51 and that any
changes which occur to the phonological system are towards these more natural forms.
Indeed, we could claim that the winning inventory presented in 10.21 (which contains these
two diphthongs) reflects the inventory of the Younger speakers of Mersea Island English,
considering the analysis of their data.
51
It could also be claimed that /iu/, usually represented as /ju/ completes this diphthongal set. However, a
discussion of this feature is outside the scope of this thesis and will not be discussed here.
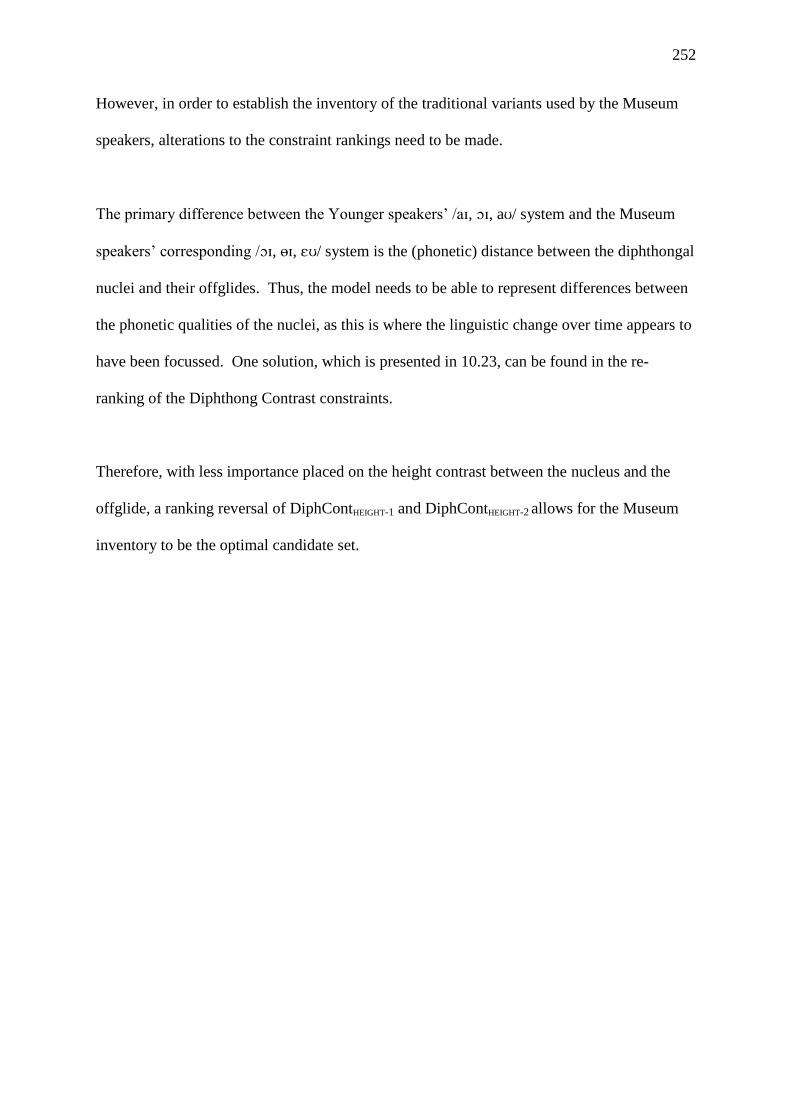
252
However, in order to establish the inventory of the traditional variants used by the Museum
speakers, alterations to the constraint rankings need to be made.
The primary difference between the Younger speakers’ /a, , a/ system and the Museum
speakers’ corresponding /, , / system is the (phonetic) distance between the diphthongal
nuclei and their offglides. Thus, the model needs to be able to represent differences between
the phonetic qualities of the nuclei, as this is where the linguistic change over time appears to
have been focussed. One solution, which is presented in 10.23, can be found in the re-
ranking of the Diphthong Contrast constraints.
Therefore, with less importance placed on the height contrast between the nucleus and the
offglide, a ranking reversal of DiphContHEIGHT-1 and DiphContHEIGHT-2 allows for the Museum
inventory to be the optimal candidate set.
253
10.23 The inventory tableau: To achieve the Traditional Mersea inventory.
PRICE ~ CHOICE ~ MOUTH MAX CONTRAST DIPH CONT HEIGHT-1 DIPH CONT HEIGHT-2 MIN DISTNUCLEUS MIN DISTOFFGLIDES
A * P *C *M *P~C *C~M *P~C
B * P *M ! *C *P~M *P~C
C ! *P *C *M *P~C *P~C
D *P *M ! *C *M *P~M *P~C
E *P ! *C *M *P~C
254
If we consider the development of // and //, as discussed in Chapters 3 and 5,
respectively, we can see that the nuclei developments in this dialect from [] and [] to []
and [] (following the developments of the Great Vowel Shift) enhance the distance between
the diphthongal elements. Therefore, this change is in accordance with the optimisation of
the system outlined by Dispersion Theory. This optimisation then continues as the [] and
[] nuclei lower to [a].
However, this leads to speculation regarding the variable nature of the Older speakers’ data.
The data from this group represent variables from both inventory systems and may be
modelled using both variable rankings between the Diphthong Contrast constraints or by
proposing a multiple grammars type of analysis. This point will be examined in more detail
in 10.4.3 below once the analysis of the Museum and Younger speakers’ data has been
completed.
10.4.2
The Realisation of Contrasts
As previously outlined, this stage activates contextual markedness constraints and deactivates
Min Dist constraints. It is at this level that the individual forms selected by the Inventory are
mapped together as phonetic strings and therefore, certain types of information, such as
gestural articulation, become available for phonological constraint assessment. Since the Min
Dist constraints are redundant here, a ranking of correspondence (faith) constraints is needed,
as well as their opposing markedness constraints.
In this section, the apparent contextual effects of Canadian Raising, the lowering after
dorsals, smoothing of /a/ before /l/ and the preceding labial effect on //, which have been
255
highlighted in the data analysis above, will be modelled according to the Museum and
Younger speakers’ inventories.
10.4.2.1
Canadian Raising
As discussed above, Canadian Raising (CR) is the phonological process which sees the nuclei
of /a/ and /a/ realised as raised [~] and [], respectively, before voiceless consonants.
This can be achieved through a ranking of the following constraints:
RAISE VOWEL – No diphthongal nuclei of [+low] before a voiceless consonant
(However, [+low] required elsewhere)
IDENT1ST/ 2nd element – The specifications of the diphthongal elements in the input are
preserved in the output
The Raise Vowel constraint penalises the nuclei of diphthongs if they are low before a
voiceless consonant. In Standard English, the only diphthongs with phonologically low
nuclei are /a/ and /a/ and so these are the only diphthongs which would be affected by this
constraint. Working in opposition to this are the two faithfulness constraints Ident 1st element
and Ident 2nd element. These act to preserve the quality of the inventory forms which provide
the input for the Realisation stage. In order to achieve a CR correspondence, these
constraints can be ranked as follows:
RAISE VOWEL >> IDENT 1st element >> IDENT 2nd element
The two Ident faithfulness constraints have been ranked in this way to reflect the idea that it
is a worse violation to alter the quality of the diphthong nucleus than it is to alter the quality
of the offglide. In the tableaux below this ranking becomes apparent.
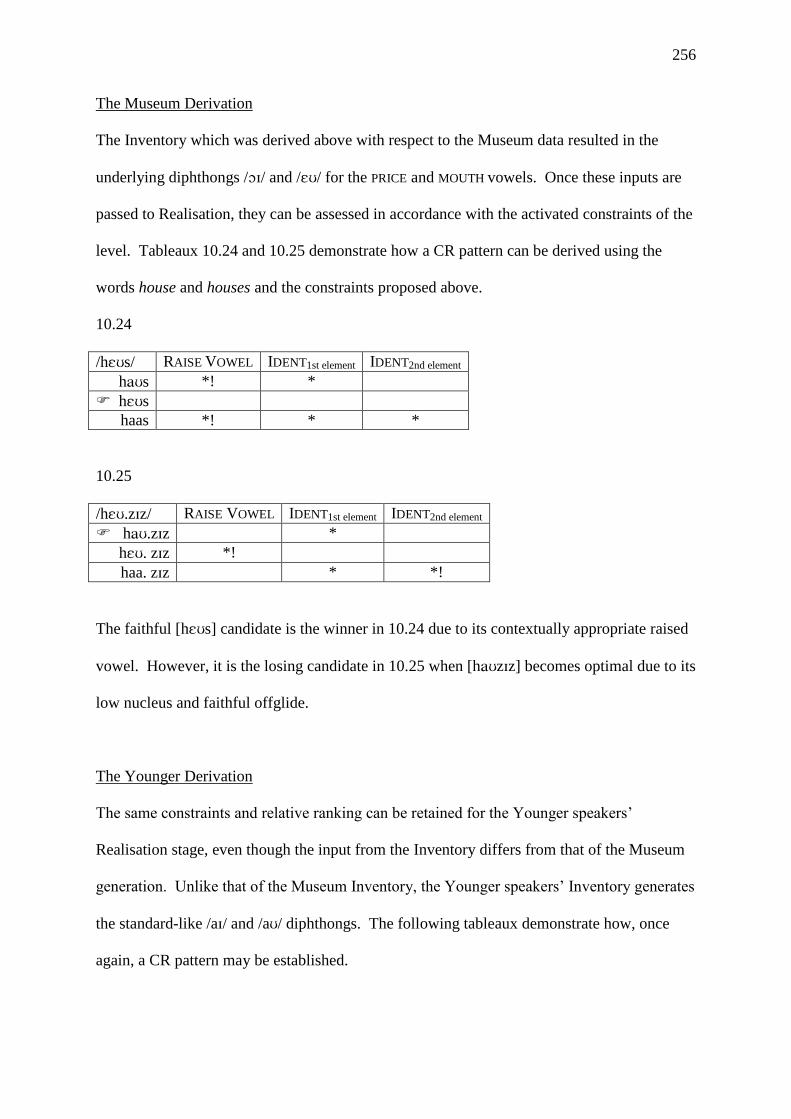
256
The Museum Derivation
The Inventory which was derived above with respect to the Museum data resulted in the
underlying diphthongs // and // for the PRICE and MOUTH vowels. Once these inputs are
passed to Realisation, they can be assessed in accordance with the activated constraints of the
level. Tableaux 10.24 and 10.25 demonstrate how a CR pattern can be derived using the
words house and houses and the constraints proposed above.
10.24
/hs/ RAISE VOWEL IDENT1st element IDENT2nd element
hs *! *
hs
haas *! * *
10.25
/h.zz/ RAISE VOWEL IDENT1st element IDENT2nd element
h.zz *
h. zz *!
haa. zz * *!
The faithful [hs] candidate is the winner in 10.24 due to its contextually appropriate raised
vowel. However, it is the losing candidate in 10.25 when [hzz] becomes optimal due to its
low nucleus and faithful offglide.
The Younger Derivation
The same constraints and relative ranking can be retained for the Younger speakers’
Realisation stage, even though the input from the Inventory differs from that of the Museum
generation. Unlike that of the Museum Inventory, the Younger speakers’ Inventory generates
the standard-like /a/ and /a/ diphthongs. The following tableaux demonstrate how, once
again, a CR pattern may be established.
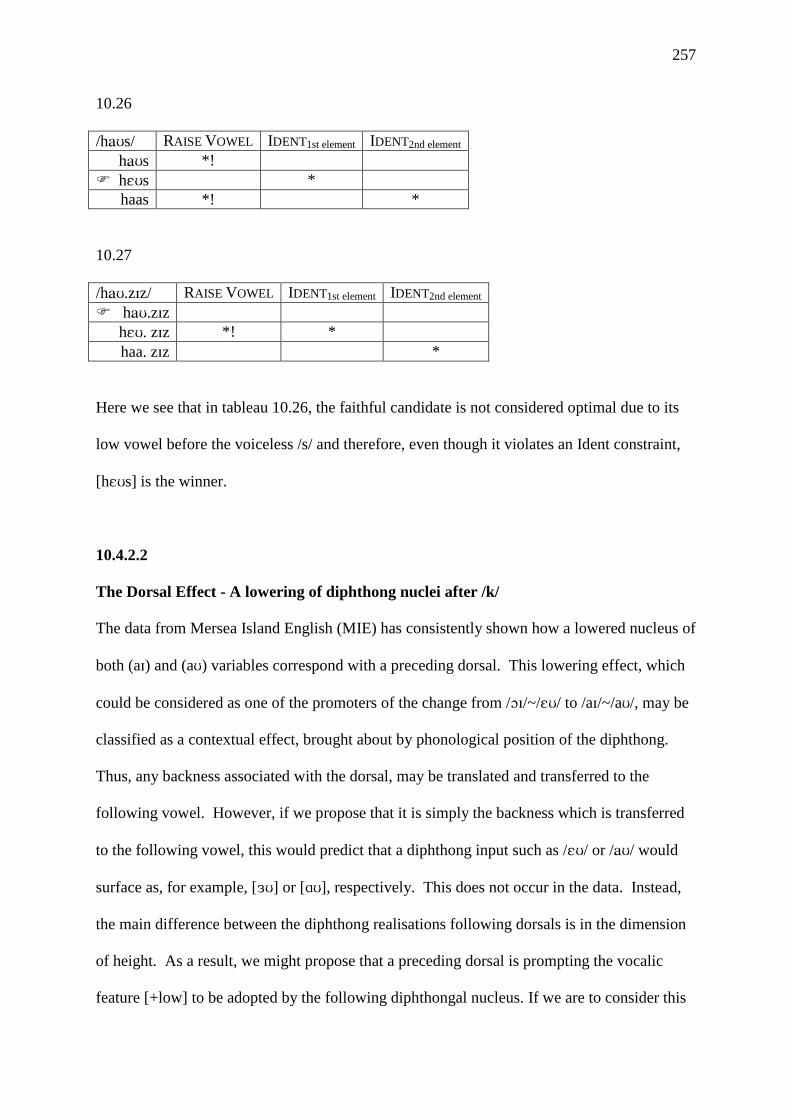
257
10.26
/hs/ RAISE VOWEL IDENT1st element IDENT2nd element
hs *!
hs *
haas *! *
10.27
/h.zz/ RAISE VOWEL IDENT1st element IDENT2nd element
h.zz
h. zz *! *
haa. zz *
Here we see that in tableau 10.26, the faithful candidate is not considered optimal due to its
low vowel before the voiceless /s/ and therefore, even though it violates an Ident constraint,
[hs] is the winner.
10.4.2.2
The Dorsal Effect - A lowering of diphthong nuclei after /k/
The data from Mersea Island English (MIE) has consistently shown how a lowered nucleus of
both (a) and (a) variables correspond with a preceding dorsal. This lowering effect, which
could be considered as one of the promoters of the change from //~// to /a/~/a/, may be
classified as a contextual effect, brought about by phonological position of the diphthong.
Thus, any backness associated with the dorsal, may be translated and transferred to the
following vowel. However, if we propose that it is simply the backness which is transferred
to the following vowel, this would predict that a diphthong input such as // or // would
surface as, for example, [] or [], respectively. This does not occur in the data. Instead,
the main difference between the diphthong realisations following dorsals is in the dimension
of height. As a result, we might propose that a preceding dorsal is prompting the vocalic
feature [+low] to be adopted by the following diphthongal nucleus. If we are to consider this

258
as an effort saving device (as the tongue does not then have to move to a mid-front position),
this may also be strengthened by the nature of constraints which have been applied in order to
minimise articulatory effort on the part of the speaker. For example, Kirchner (2001; 2004)
proposes, through an effort-based approach to the process of lenition, a constraint named
LAZY which aims to minimise the speaker’s articulatory effort during the production of
speech. This type of constraint will, when applied to contextual co-articulation, logically
favour the process since the articulatory precision of phonological segments is compromised
in favour of articulatory fluidity.
However, since the primary constraints used for this model in Realisation are contextual
markedness ones, the constraint introduced here will be LOWER VOWEL, and this will thus
interact with the Ident constraints used in previous tableaux.
LOWER VOWEL – Any vowels following a dorsal consonant must represent the feature
[+low]
The terms of this constraint are general in that it is worded to apply to all dorsal consonants
preceding a vowel. Unfortunately, due to the nature of the real data recorded for MIE, as
well as a general lack of English words with //, // and // sequences, the proposal
here has included both dorsals in this constraint under the assumption that the voiced dorsal
would cause similar effects on the following vowel. However, it must also be acknowledged
that this may not be the case, since any //, // and // sequences are likely to be in
uncommon lexical items and, thus, they may behave differently due to their comparatively
lower frequency.
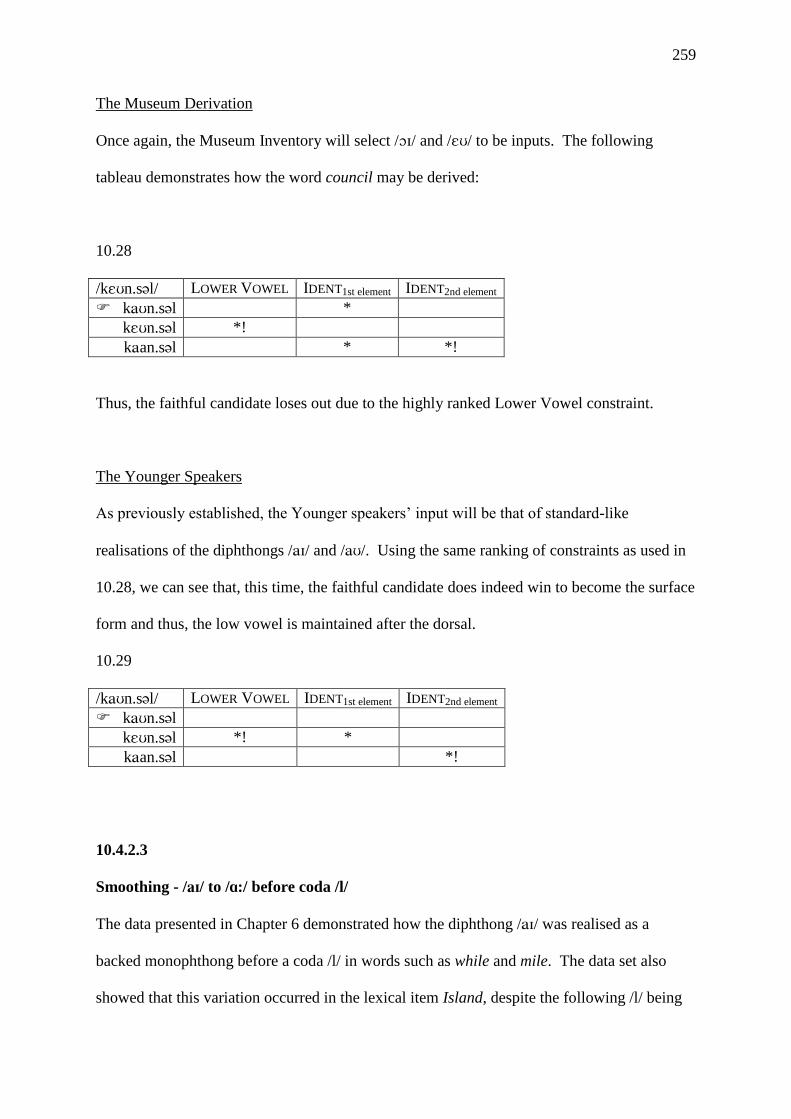
259
The Museum Derivation
Once again, the Museum Inventory will select // and // to be inputs. The following
tableau demonstrates how the word council may be derived:
10.28
/kn.sl/ LOWER VOWEL IDENT1st element IDENT2nd element
kn.sl *
kn.sl *!
kan.sl * *!
Thus, the faithful candidate loses out due to the highly ranked Lower Vowel constraint.
The Younger Speakers
As previously established, the Younger speakers’ input will be that of standard-like
realisations of the diphthongs // and //. Using the same ranking of constraints as used in
10.28, we can see that, this time, the faithful candidate does indeed win to become the surface
form and thus, the low vowel is maintained after the dorsal.
10.29
/kn.sl/ LOWER VOWEL IDENT1st element IDENT2nd element
kn.sl
kn.sl *! *
kan.sl *!
10.4.2.3
Smoothing - // to /:/ before coda /l/
The data presented in Chapter 6 demonstrated how the diphthong // was realised as a
backed monophthong before a coda /l/ in words such as while and mile. The data set also
showed that this variation occurred in the lexical item Island, despite the following /l/ being
260
an onset of the following syllable. However, the special case of Island will be discussed
separately below. Thus, the following tableaux are concerned with // followed by coda /l/.
There are two approaches to the OT representation of // monophthongisation before coda
/l/. The first would only be concerned with the quality of the vowel and not allow for
alternations in the quality of the [l] ~ [] allophones. The second approach would take this
alternation into account and thus not only model the vowel change but also the consonant
change.
10.4.2.3.1
Smoothing - Proposal 1
In order to obtain lengthening before /l/, we could propose the following constraints:
*//before cd /l/ - [] diphthongs are prohibited before coda /l/
*COMPLEX VOWEL before cd /l/ - only simple vowels may precede coda /l/
Though, on the surface, the first of these constraints may appear too specific, since it refers to
a particular diphthong rather than a class of sounds, it could be argued to be part of a wider
group of markedness constraints which construct the overall distribution patterns within our
phonology. For example, the // diphthong is also not found before //, and thus we could
propose that this is due to an inviolable constraint *//before // which does not allow //
forms to surface. This process of monophthongisation before /l/ is also not restricted to the
Mersea Island dialect, and so this constraint is applicable to other dialects of English (see, for
example, Britain (1991) for evidence of // and // monophthongisation before /l/).
The second of these constraints is used here to apply to //, although it may be applicable to
other segments, such as //. For example, we saw in Chapter 7 how lexical items with //
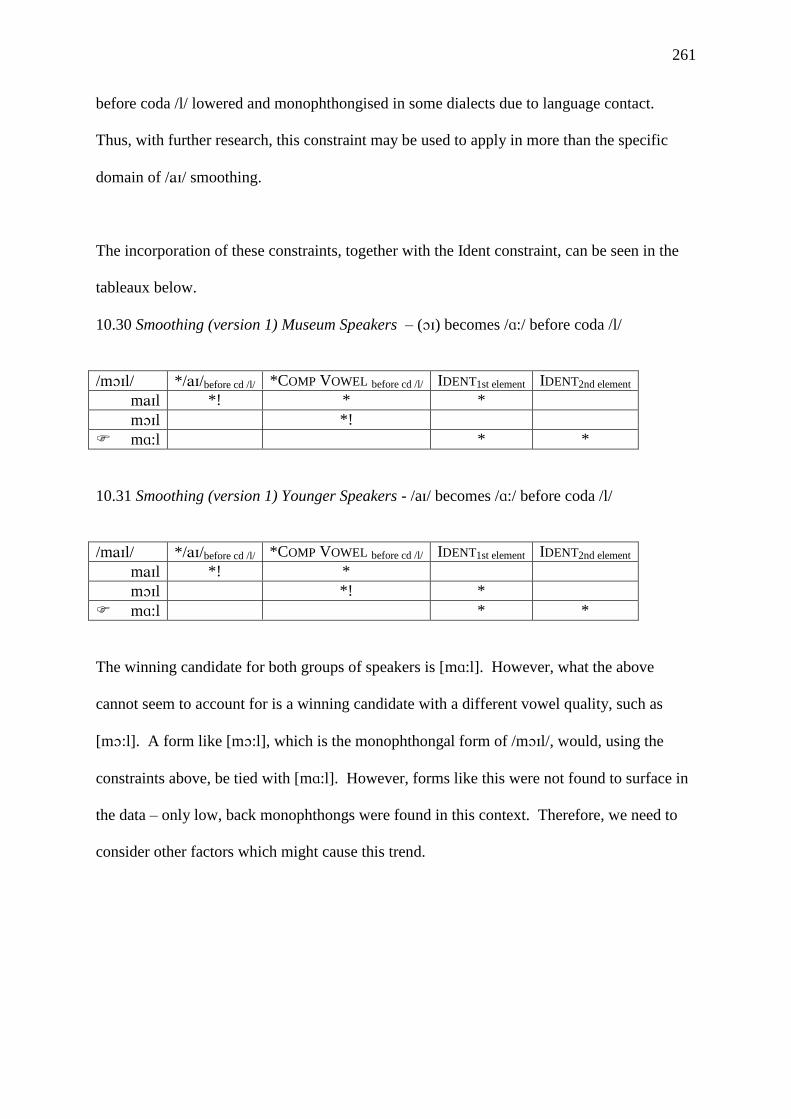
261
before coda /l/ lowered and monophthongised in some dialects due to language contact.
Thus, with further research, this constraint may be used to apply in more than the specific
domain of // smoothing.
The incorporation of these constraints, together with the Ident constraint, can be seen in the
tableaux below.
10.30 Smoothing (version 1) Museum Speakers – () becomes /:/ before coda /l/
/ml/ *//before cd /l/ *COMP VOWEL before cd /l/ IDENT1st element IDENT2nd element
ml *! * *
ml *!
m:l * *
10.31 Smoothing (version 1) Younger Speakers - /a/ becomes /:/ before coda /l/
/ml/ *//before cd /l/ *COMP VOWEL before cd /l/ IDENT1st element IDENT2nd element
ml *! *
ml *! *
m:l * *
The winning candidate for both groups of speakers is [m:l]. However, what the above
cannot seem to account for is a winning candidate with a different vowel quality, such as
[m:l]. A form like [m:l], which is the monophthongal form of /ml/, would, using the
constraints above, be tied with [m:l]. However, forms like this were not found to surface in
the data – only low, back monophthongs were found in this context. Therefore, we need to
consider other factors which might cause this trend.

262
10.4.2.3.2
Smoothing - Proposal 2
The noticeable aspect of the // - [:] alternation is the co-occurrence with coda /l/.
Generally, in dialects of English, when /l/ appears in the coda, it is the allophonic dark []
which is produced52
. Ordinarily, when a clear /l/ is produced, the articulation is one of a
coronal gesture followed by a dorsal gesture. However, in the case of dark [], the dorsal
gesture is articulated first (see, for example, Cruttenden (2001) for further articulatory
information). Therefore, we might propose that a type of regressive assimilation is taking
place as the articulators, while completing the preceding vowel, anticipate this dorsal gesture.
The result would be a lowering effect of the diphthong offglide and a lowering of the
diphthong nucleus.
Thus, following in the path of the set of SPREAD constraints (see Padgett (1995)), which aim
to represent feature spreading by extending a feature’s domain in the output, we could
propose the inclusion of a SPREADDorsal constraint which conspires to regressively lower and
back an adjacent vowel articulation.
SPREADDorsal – Any velar gesture of a dorsal sound segment is spread to the preceding
vocalic segment, if adjacent, resulting in the specification [+low, +back].
This constraint, together with those developed in Proposal 1, results in the following:
52
It is also common in modern dialects of English for the dark [] to vocalise (see Johnson and Britain (2007)).
It loses the tongue-tip contact and resembles a vocalic segment, although, since this vowel typically has a back
quality, it may be suggested to be in keeping with the analysis presented here. However, without a separate
analysis of /l/ vocalisation in the MIE data, no further assertions can be made at this stage.
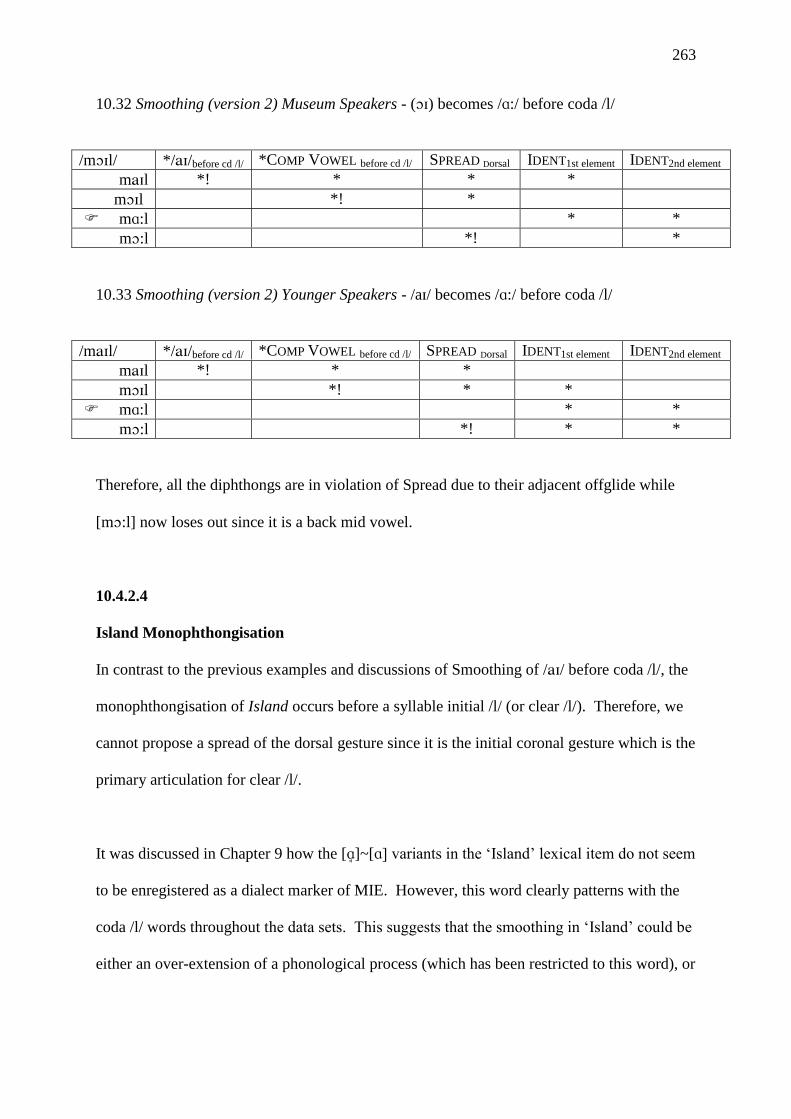
263
10.32 Smoothing (version 2) Museum Speakers - () becomes /:/ before coda /l/
/ml/ *//before cd /l/ *COMP VOWEL before cd /l/ SPREAD Dorsal IDENT1st element IDENT2nd element
ml *! * * *
ml *! *
m:l * *
m:l *! *
10.33 Smoothing (version 2) Younger Speakers - /a/ becomes /:/ before coda /l/
/ml/ *//before cd /l/ *COMP VOWEL before cd /l/ SPREAD Dorsal IDENT1st element IDENT2nd element
ml *! * *
ml *! * *
m:l * *
m:l *! * *
Therefore, all the diphthongs are in violation of Spread due to their adjacent offglide while
[m:l] now loses out since it is a back mid vowel.
10.4.2.4
Island Monophthongisation
In contrast to the previous examples and discussions of Smoothing of // before coda /l/, the
monophthongisation of Island occurs before a syllable initial /l/ (or clear /l/). Therefore, we
cannot propose a spread of the dorsal gesture since it is the initial coronal gesture which is the
primary articulation for clear /l/.
It was discussed in Chapter 9 how the []~[] variants in the ‘Island’ lexical item do not seem
to be enregistered as a dialect marker of MIE. However, this word clearly patterns with the
coda /l/ words throughout the data sets. This suggests that the smoothing in ‘Island’ could be
either an over-extension of a phonological process (which has been restricted to this word), or

264
it is the residue of a more general phonological process now restricted to this item (possibly
through its frequency in the everyday speech of the locals).
Taking these points into account, we cannot therefore propose a set of constraints which will
induce smoothing in non-coda /l/ environments as that would lead to words such as ‘pilot’
and ‘highland’ being realised as [plt] and [hlnd], which never occur in the data.
Instead, by treating this as a type of lexical effect, we could propose that the Realisation level
allows for dialect specific constraints on lexical items to be activated, since all phonetic
information is available at this level and certain segment strings may be identified or
recognised. By allowing lexical effects at this level, it is implied that the
monophthongisation of ‘Island’ is not stipulated by the underlying phonology, and so the
Inventory is allowed to remain stable. Also, by not having the monophthongisation governed
by the sociolinguistic level, it reflects the consistent nature of the data and solidifies it as an
operative phonological process, which is then available for sociolinguistic manipulation (see
10.5 below).
Thus, we can introduce a constraint such as:
PRICE [] / ISLAND : The PRICE diphthong will monophthongise and back in the
lexical item ‘Island’
The use of the lexical set title PRICE in the constraint simply allows us to represent the
diphthong across each speaker group, as, for example, the Museum speakers and the Younger
speakers have different underlying Inventory forms for this diphthong. Even though the form
of this constraint is somewhat ad hoc, the application of it in the Realisation can be illustrated
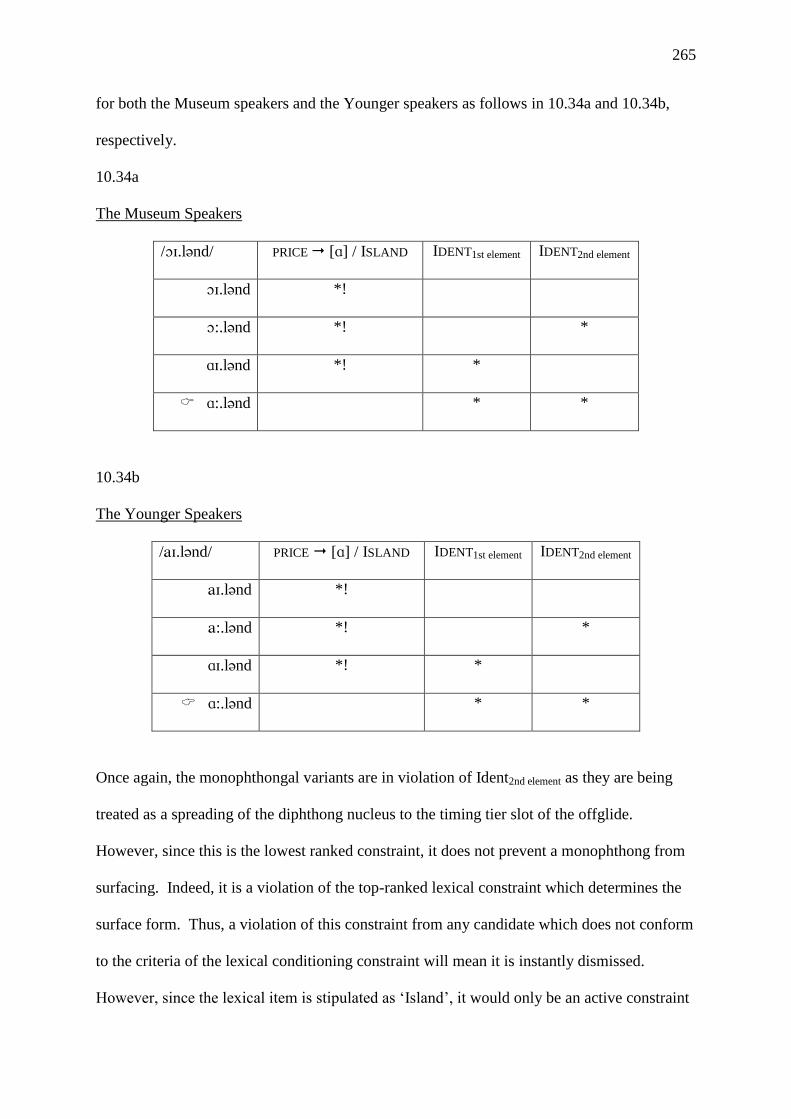
265
for both the Museum speakers and the Younger speakers as follows in 10.34a and 10.34b,
respectively.
10.34a
The Museum Speakers
/.lnd/ PRICE [] / ISLAND IDENT1st element IDENT2nd element
.lnd *!
:.lnd *! *
.lnd *! *
:.lnd * *
10.34b
The Younger Speakers
/.lnd/ PRICE [] / ISLAND IDENT1st element IDENT2nd element
.lnd *!
:.lnd *! *
.lnd *! *
:.lnd * *
Once again, the monophthongal variants are in violation of Ident2nd element as they are being
treated as a spreading of the diphthong nucleus to the timing tier slot of the offglide.
However, since this is the lowest ranked constraint, it does not prevent a monophthong from
surfacing. Indeed, it is a violation of the top-ranked lexical constraint which determines the
surface form. Thus, a violation of this constraint from any candidate which does not conform
to the criteria of the lexical conditioning constraint will mean it is instantly dismissed.
However, since the lexical item is stipulated as ‘Island’, it would only be an active constraint
266
when this phonetic form is provided as the input to the Realisation and not if other lexical
items (such as ‘pilot’) serve as the input. Another approach would be to suggest that the
Realisation phase does not contain types of lexical constraints, and that there is another
derivational level which activates at the lexical level. Therefore, the Realisation phase would
only hold constraints which are built around the phonetic information available at this stage,
while a lexical level would activate constraints according to any lexical considerations, such
as that relating to specific lexical items.
10.4.2.5
BOY
The data presented in Chapter 8 demonstrated how a preceding labial stop, notably /b/,
promoted more traditional centralised [] variants for the () variable in MIE. One
explanation advanced above for the preservation of [] following /b/ was a coarticulatory
labiality effect. Thus, the labiality features associated with the articulation of /b/ spread to
the following vowel causing a rounded vowel to surface.
This centralisation and rounding of // was also found to correlate with the lexeme BOY and
its derived forms (such as the plural form ‘boys’). It has also been noted (in Chapter 9) that
the lexical item ‘boy’ features in a prominent performance phrase ‘My boy’ and thus, this is a
possible factor in the maintenance of [] in this phonological position.
Therefore, two derivational options are available to us:
1) We can propose a type of SPREAD constraint to promote more rounded vowels
following a labial consonant (in this case /b/).
or
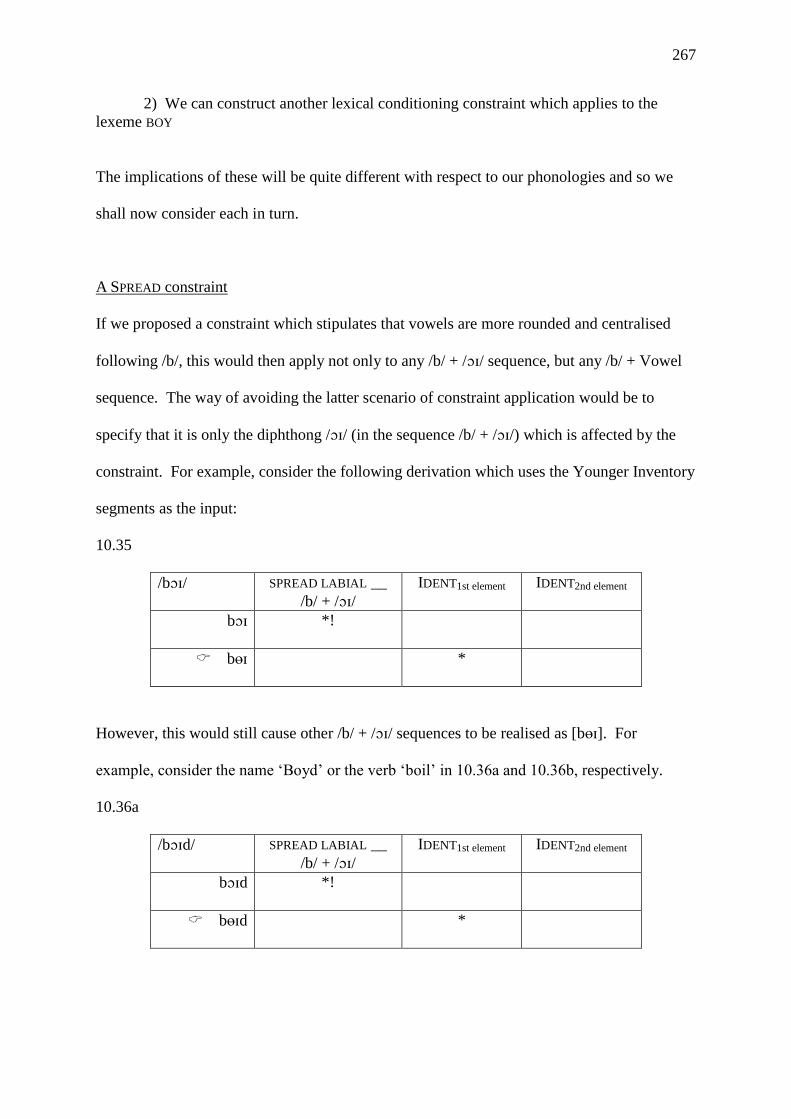
267
2) We can construct another lexical conditioning constraint which applies to the
lexeme BOY
The implications of these will be quite different with respect to our phonologies and so we
shall now consider each in turn.
A SPREAD constraint
If we proposed a constraint which stipulates that vowels are more rounded and centralised
following /b/, this would then apply not only to any /b/ + // sequence, but any /b/ + Vowel
sequence. The way of avoiding the latter scenario of constraint application would be to
specify that it is only the diphthong // (in the sequence /b/ + //) which is affected by the
constraint. For example, consider the following derivation which uses the Younger Inventory
segments as the input:
10.35
/b/ SPREAD LABIAL __
/b/ + // IDENT1st element IDENT2nd element
b *!
b *
However, this would still cause other /b/ + // sequences to be realised as [b]. For
example, consider the name ‘Boyd’ or the verb ‘boil’ in 10.36a and 10.36b, respectively.
10.36a
/bd/ SPREAD LABIAL __
/b/ + // IDENT1st element IDENT2nd element
bd *!
bd *
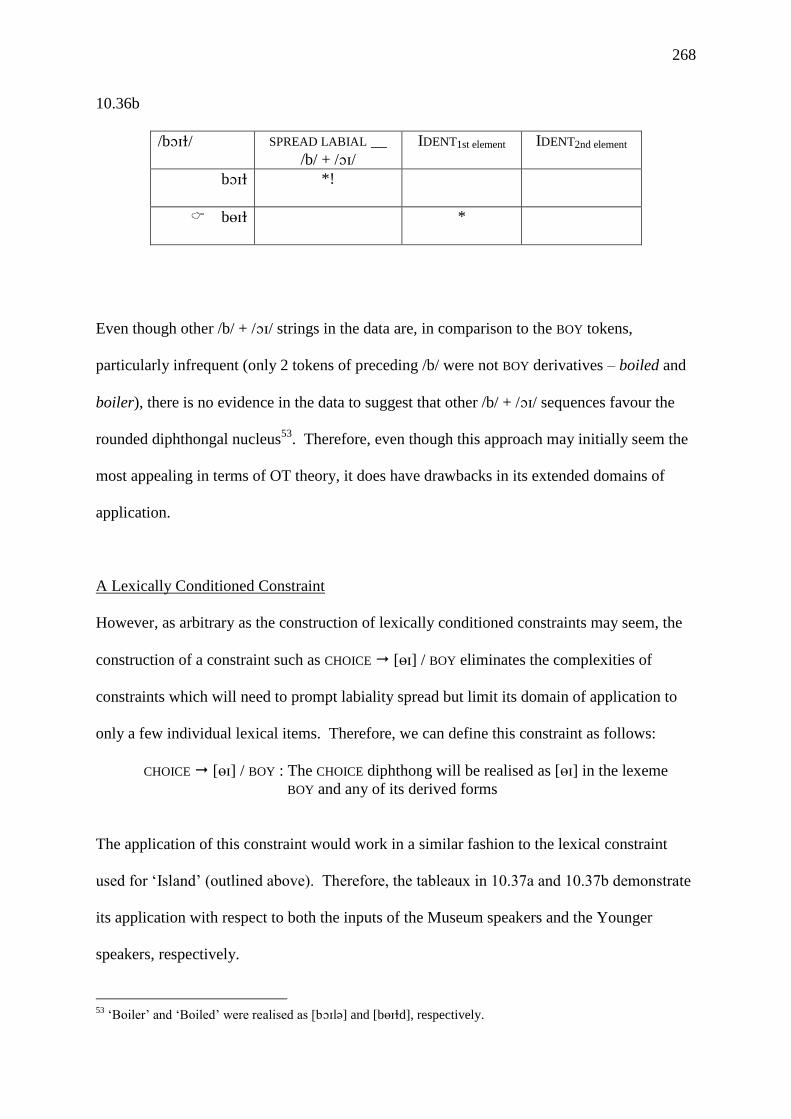
268
10.36b
/b/ SPREAD LABIAL __
/b/ + // IDENT1st element IDENT2nd element
b *!
b *
Even though other /b/ + // strings in the data are, in comparison to the BOY tokens,
particularly infrequent (only 2 tokens of preceding /b/ were not BOY derivatives – boiled and
boiler), there is no evidence in the data to suggest that other /b/ + // sequences favour the
rounded diphthongal nucleus53
. Therefore, even though this approach may initially seem the
most appealing in terms of OT theory, it does have drawbacks in its extended domains of
application.
A Lexically Conditioned Constraint
However, as arbitrary as the construction of lexically conditioned constraints may seem, the
construction of a constraint such as CHOICE [] / BOY eliminates the complexities of
constraints which will need to prompt labiality spread but limit its domain of application to
only a few individual lexical items. Therefore, we can define this constraint as follows:
CHOICE [] / BOY : The CHOICE diphthong will be realised as [] in the lexeme
BOY and any of its derived forms
The application of this constraint would work in a similar fashion to the lexical constraint
used for ‘Island’ (outlined above). Therefore, the tableaux in 10.37a and 10.37b demonstrate
its application with respect to both the inputs of the Museum speakers and the Younger
speakers, respectively.
53
‘Boiler’ and ‘Boiled’ were realised as [bl] and [bd], respectively.

269
10.37a
The Museum Speakers
/b/ CHOICE [] / BOY IDENT1st element IDENT2nd element
b
b *! *
10.37b
The Younger Speakers
/b/ CHOICE [] / BOY IDENT1st element IDENT2nd element
b *!
b *
The exact composition of a constraint like this (as mentioned above) would be open to
interpretation and modification according to the nature of the underlying form to be changed.
Thus, we could not write a transformation constraint such as // [] / __ BOY and include
that in the grammar of the Museum speakers since, as established above, they are unlikely to
have // as the underlying form of the CHOICE diphthong. Instead, the constraint may be re-
written to accommodate any previous variants to which that group of speakers were exposed
(indicating a change situation) or simply to present it as // BOY (which would act as a
maintenance constraint for this variant in this specific context). However, once again, even
though lexically conditioned constraints seem the more practical approach to modelling the
variation of BOY morphemes, one area for future research would be to assess the validity of a
lexical level in the context of this model where constraints such as these are activated.
270
10.4.3
The Older Speakers – multiple grammars or variable ranking?
The transitional nature of the Older speakers’ data for each of the three variables under
investigation suggests that they generate what could be an extremely complex Inventory.
However, the nature of their data may be resolved by one of two means:
1. The activation of two Inventory grammars which, with variable selection, provide the
Realisation with different inputs (Multiple Grammars)
or
2. A variable ranking of the Diphthong Contrast constraints within the same underlying
grammar, or Inventory (Variable Ranking)
We have seen, while deriving the Realisation tableaux, that the ranking of constraints in this
phase is able to remain the same for both the grammars proposed for the Museum and
Younger generations. Thus, for the contextual patterns of variation observed in the data, the
constraint rankings may remain consistent. As a result, we can claim that the differences
between the Museum and Younger grammars are due to the selection of the underlying
inventory, rather than differences created by contrasting evaluations of phonetic forms. The
Older speakers’ grammar, therefore, needs to reflect access to both inventory sets if we are to
maintain that their data represent the intermediate stages of linguistic change – that is, a
change from the Museum Inventory to that of the Younger Inventory.
The multiple grammars approach would thus allow for two separate Inventory grammars to
exist in parallel. These would either feed into separate Realisation phases, or feed into a
singular Realisation phase. These can be illustrated as follows:
271
10.38 A comparison of underlying Grammars for the Older Mersea generation
The deciding factor would be whether we wanted to propose that the Realisation maintains
the same structure during linguistic change (Multiple Grammar 2). However, this appears
improbable as data relating to the sociolinguistic process of linguistic diffusion commonly
suggest that certain linguistic environments promote change more rapidly than others. This
kind of process could only be instigated by changes in contextual constraints which are
activated in Realisation. Therefore, even though the Realisation tableaux so far have
maintained consistent rankings, this may not necessarily be the case during periods of
linguistic change. The change would thus reach completion as fewer and fewer speakers,
over subsequent generations, activate both old and new inventories.
Conversely, the variable ranking approach would retain a singular underlying grammar, but
with a variable re-ranking of constraints which lead to the selection of different candidate sets
(and subsequently, different Realisation inputs). With respect to the dialect under
observation, this would mean a variable ranking between the two Diphthong Contrast
constraints, which determine the wideness of permissible diphthongs in the Inventory, and
produce the Inventories previously proposed in 10.21 and 10.23 above.
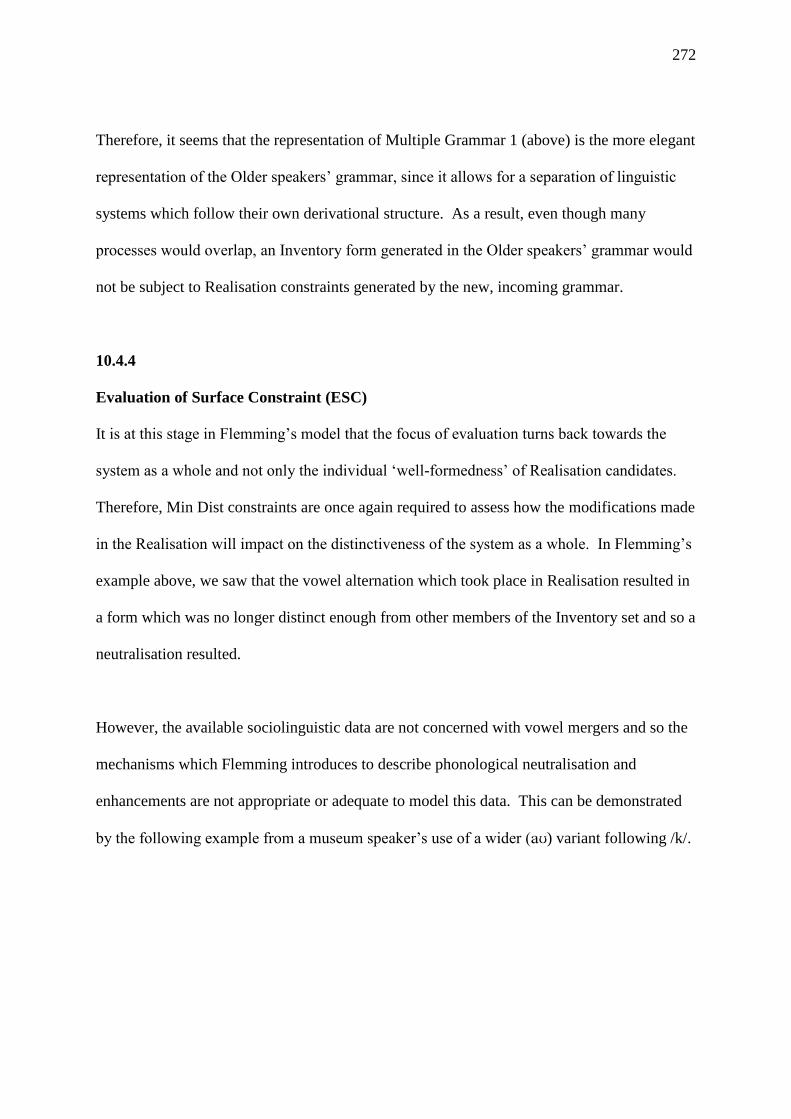
272
Therefore, it seems that the representation of Multiple Grammar 1 (above) is the more elegant
representation of the Older speakers’ grammar, since it allows for a separation of linguistic
systems which follow their own derivational structure. As a result, even though many
processes would overlap, an Inventory form generated in the Older speakers’ grammar would
not be subject to Realisation constraints generated by the new, incoming grammar.
10.4.4
Evaluation of Surface Constraint (ESC)
It is at this stage in Flemming’s model that the focus of evaluation turns back towards the
system as a whole and not only the individual ‘well-formedness’ of Realisation candidates.
Therefore, Min Dist constraints are once again required to assess how the modifications made
in the Realisation will impact on the distinctiveness of the system as a whole. In Flemming’s
example above, we saw that the vowel alternation which took place in Realisation resulted in
a form which was no longer distinct enough from other members of the Inventory set and so a
neutralisation resulted.
However, the available sociolinguistic data are not concerned with vowel mergers and so the
mechanisms which Flemming introduces to describe phonological neutralisation and
enhancements are not appropriate or adequate to model this data. This can be demonstrated
by the following example from a museum speaker’s use of a wider () variant following /k/.
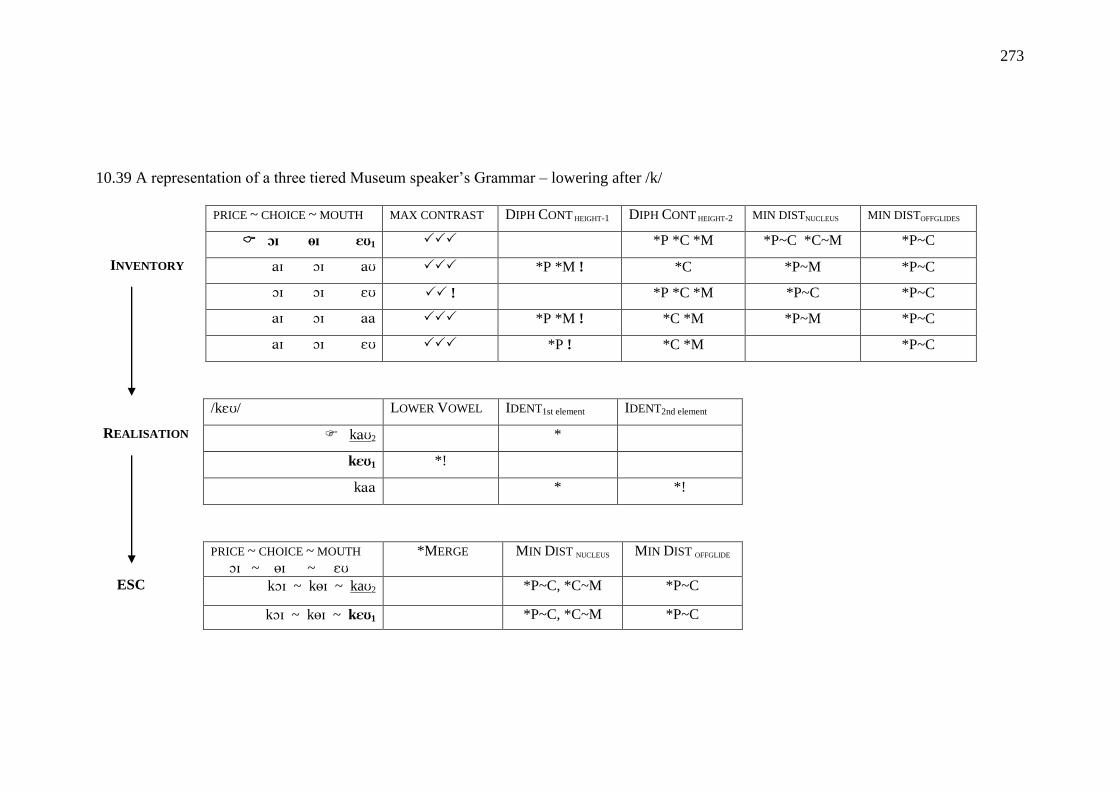
273
10.39 A representation of a three tiered Museum speaker’s Grammar – lowering after /k/
INVENTORY
PRICE ~ CHOICE ~ MOUTH MAX CONTRAST DIPH CONT HEIGHT-1 DIPH CONT HEIGHT-2 MIN DISTNUCLEUS MIN DISTOFFGLIDES
1 *P *C *M *P~C *C~M *P~C
*P *M ! *C *P~M *P~C
! *P *C *M *P~C *P~C
*P *M ! *C *M *P~M *P~C
*P ! *C *M *P~C
REALISATION
/k/ LOWER VOWEL IDENT1st element IDENT2nd element
k2 *
k1 *!
k * *!
ESC
PRICE ~ CHOICE ~ MOUTH
~ ~
*MERGE MIN DIST NUCLEUS MIN DIST OFFGLIDE
k ~ k ~ ka2 *P~C, *C~M *P~C
k ~ k ~ k1 *P~C, *C~M *P~C
274
How to read this tableau – Explanatory points
The winning candidate set in the Inventory is highlighted in bold so that its trace can be
seen in subsequent phases.
The winning candidate in the Realisation is highlighted by underlining so that its trace
can be identified in the following phase.
Thus, when it comes to the Evaluation of Surface Contrasts, we can see two sets
competing against each other – the first includes the modified form [ka], while the
second contains the original inventory form [k].
The *Merge constraint has been included, as Flemming notes that it is required to adopt
the position of Max Contrasts. However, it does not take effect as the newly modified
form does not merge with an existing inventory form. Therefore, it does not provoke a
violation from either candidate set.
As a result, both candidate sets share the same violations. Indeed, if only these phonological
constraints are active, both sets are tied in terms of violations incurred. At this stage we
could claim a tied candidate solution and use that to explain the surface variation which the
empirical data produced (see section 10.1.2.1 above). However, that does not seem a
satisfactory conclusion as there appears to be no mechanism for examining or explaining
which candidate may be picked for any one speech event. For example, studies have
proposed and demonstrated how, when more attention is paid to speech during style tests,
contextual co-articulation effects and variant usage changes (compared to that of speech in
more natural, relaxed contexts – see discussion below). These types of correlations in
sociolinguistic data cannot be accounted for through a purely phonological approach of tied
candidates.
Therefore, if we allow for linguistic contextual constraints to influence phonetic mappings
within our phonology, we must also, by logic, integrate mechanisms which have the power to
manipulate or override these constraints if necessary.
275
10.5
The Sociolinguistic Level of Speech Production
The following section will outline a proposal for an innovative third tier to be included in
the above model, which replaces the ESC and would lead to an integrated socio-
phonological model of variation. The sociolinguistic notion of Audience Design will be
explored alongside phonological theories of exemplars and frequency before attention is
turned to how aspects of these models can work together to provide the basis for an
integrated socio-phonological model.
10.5.1
Introduction
It has been demonstrated above that a faithful application of Flemming’s model is
inappropriate with respect to the sociolinguistic data presented in this study. That is
because, unlike Flemming, these data are reflecting variation and are not representative of
a phonological neutralisation or phonetic merger. Therefore, if the third tier was instead
governed by sociolinguistic constraints, this would give a speaker’s communicative
competence more recognition and the power to override certain linguistic constraints
which have been imposed at the previous level. For example, even though Tatham and
Morton note that co-articulation is not a phenomenon that can be switched on and off at
the will of the speaker, it can be described as “an involuntary process which, like many
others, can be voluntarily influenced”54
(2006:29). Thus, it is possible for a speaker to
limit or enhance co-articulatory effects during speech. In addition, there has been
extensive sociolinguistic research demonstrating style shifts in the speech of individuals
54
Original italics.
276
during interviews and speech production tasks. Thus, with respect to this model, the
Inventory provides the optimal set of sounds in the underlying grammar according to
specific distinctiveness constraints and these are maintained by the correspondence
constraints in the Realisation. However, the Realisation also introduces constraints
which modify the Inventory segments according to their phonetic mapping while the
Sociolinguistic level is able to modify and manipulate the phonological outputs of
Realisation. As a result, the Sociolinguistics level is where knowledge about how to
manipulate the phonology is collected and stored together with the social meaning of the
contending phonological forms.
10.5.2
Communicative Competence
Communicative Competence, a term introduced by and associated with Hymes (1972),
represents our ability to use our linguistic knowledge and our social knowledge together
in order to communicate effectively and appropriately. Thus, communicative
competence, by definition, must take into account any social factors which will influence
linguistic behaviour, such as the relationship between speaker and audience and the time
and place of the speech event. Indeed, Chambers (2002) notes that a speaker’s repertoire
of variants is usually linguistically based. However, in order for social interaction to
work “both the content of speech and its form must be appropriate to the speakers and
their interlocutors in the particular social context” (2002:11).
277
Through the adoption of a more descriptive anthropological approach, Hymes notes that,
when a person acquires linguistic knowledge, it is not only knowledge of what is
grammatical, but also knowledge of what is appropriate. For example, the person must
acquire competence in a wide repertoire of speech acts (see Searle (1979; 1999) for
example) and events, as well as the ability to evaluate others’ ability to demonstrate their
competence in communication. Hymes goes on to say that this communicative
competence “is integrated with attitudes, values, and motivations concerning language,
its features and uses” (2001:60). In addition, Hymes suggests that communication (as
well as language in general) reflects four assessment criteria. Therefore, in the context of
an utterance, this would be whether it is formally or linguistically possible, whether the
rendering of it is feasible in its implementation, whether it is appropriate to the context in
which it will feature and what the entailment of the utterance will be once it is performed.
The role of competence in communication is summed up by Hymes as “the ways in
which the systematically possible, the feasible and the appropriate are linked to produce
and interpret actually occurring cultural behaviour” (2001:67). The role of varying
cultural behaviour is also crucial to identifying and defining communicative competence
between societies since the nature of the acquired communicative competence will vary
according to particular societies and the social expectations as competency is shaped by
social experience.
The observation that people change how they speak has also been validated by empirical
sociolinguistic research. Labov demonstrated through his Attention to Speech model that
speakers changed their use of particular variants according to the type of speech that was
278
elicited from them. Thus, fewer vernacular variants were produced in the reading of
word-lists and minimal pairs, which were considered the most formal of contexts, since
“the speaker’s attention is focused directly on pronunciation” (Labov 1994:157), while a
higher percentage of vernacular variants were elicited in less formal contexts, such as
free-flowing sociolinguistic interview speech. Thus, Labov (and many others since)
demonstrated that the more self-conscious people were (that is, the more attention that
was paid to their speech), the less likely they were to produce vernacular variants. Once
again, therefore, this type of data shows how linguistic outputs may change in accordance
with non-linguistic factors.
This view that language use is a reflection of social structure can be said to be
encapsulated by Bell’s (1984:151) Style Axiom. This states that:
STYLE AXIOM – Variation on the style dimension within the speech of a single speaker
derives from and echoes the variation which exists between the speakers on the “social”
dimension (1984:151)
Thus, Bell demonstrates, through a number of studies, how the range of variation along
the style dimension is always smaller than the range along the dimension of social status.
Bell’s Audience Design Framework thus allows a speaker to draw upon the linguistic
resources which are available within their community. Therefore, as Bell (2001:145)
suggests, the speakers are not passive participants. Instead, they are active in their
exploitation of the linguistic resources at their disposal. In addition, the model allows for
speech modification to occur in response to an absent audience – referee design. Referee
Design, as modified and described by Bell (2001), is “the linguistic expression of
identification with a reference group who are important to the speaker” (2001:163).
279
Therefore, even though representatives of such a group may be absent from the direct
audience, the linguistic forms associated with that group may be projected by a speaker in
order to demonstrate certain social or cultural affiliations.
Building on Bell’s original 1984 work, and the idea of numerous social factors
influencing linguistic choice, Preston (1991) investigated the role of status on speech
through numerous statistical analyses of sociolinguistic data. He explains that, in this
context, status “refers to a number of demographic features having to do with social class,
age, sex and so on” (1991:38) and develops the Status Axiom:
STATUS AXIOM: Variation on the “status” dimension derives from and echoes the
variation which exists within the “linguistic” dimension (1991:36)
Thus, the range of statistical probabilities relating to status will be contained within the
range of probabilities created by some linguistic factor. As a result, Preston presents his
status axiom as a stronger version of Bell’s earlier style axiom. When this is related to
sociolinguistic variation, Preston (1991:52) implies a hierarchy of importance when
linguistic forms are selected:
Strongest Linguistic Environment - Representing universal and language-
specific conditions on features
Mid Status - Represents more or less permanent aspects
of identity
Weakest Style - Controls (through the identity of the register)
only the selection of a point along a
continuum
280
When these approaches and points are taken as a collective, it is indicative that, as a
speaker, we can alter our linguistic output in response to ever changing social contexts, as
well as actively initiate changes in our linguistic forms as a way of dynamically
projecting our self-image. However, if we are to follow Preston’s hierarchical
suggestion, aspects such as the speaker’s own status characteristics will take priority over
style factors in the selection of variants, while linguistic considerations and constraints
will take overall priority.
10.5.3
Where does that leave phonology? Information through exemplars
If the underlying notion that speakers can alter their language outputs in accordance with
social and contextual factors is correct, it is logical, by extension, to propose that
linguistic forms are somehow encoded with social information which enables the speaker
to select appropriately for any given speech event.
The introduction of exemplar theory into phonology (for example, Pierrehumbert (2001))
proposed that detailed phonetic memories of individual linguistic forms can be stored.
These mental representations of phonological targets and patterns are thus added to and
modified each time they are perceived. This leads to the construction of exemplar
‘clouds’. Within these clouds, those exemplars which are activated more frequently are,
as a result, able to be retrieved more quickly when the time comes for production. This
model is therefore able to reflect the behaviour of speaker accommodation since “speech
patterns, which are heard recently and frequently, dominate the set of exemplars for any
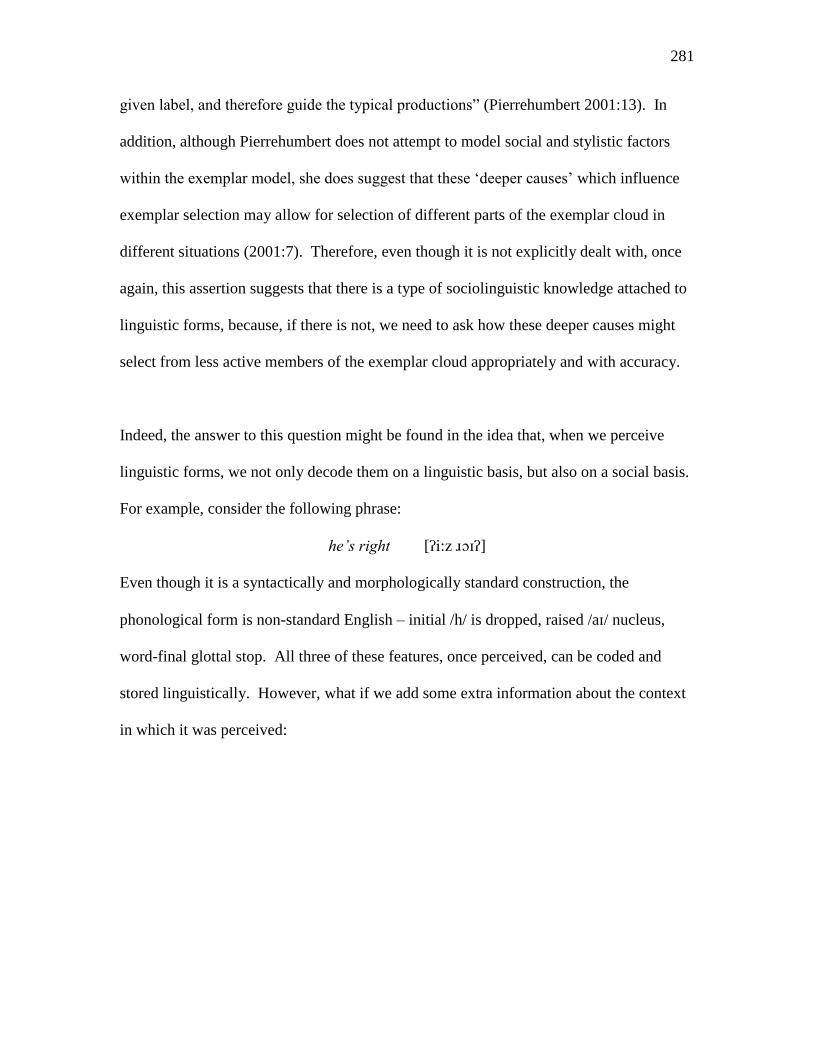
281
given label, and therefore guide the typical productions” (Pierrehumbert 2001:13). In
addition, although Pierrehumbert does not attempt to model social and stylistic factors
within the exemplar model, she does suggest that these ‘deeper causes’ which influence
exemplar selection may allow for selection of different parts of the exemplar cloud in
different situations (2001:7). Therefore, even though it is not explicitly dealt with, once
again, this assertion suggests that there is a type of sociolinguistic knowledge attached to
linguistic forms, because, if there is not, we need to ask how these deeper causes might
select from less active members of the exemplar cloud appropriately and with accuracy.
Indeed, the answer to this question might be found in the idea that, when we perceive
linguistic forms, we not only decode them on a linguistic basis, but also on a social basis.
For example, consider the following phrase:
he’s right [: ]
Even though it is a syntactically and morphologically standard construction, the
phonological form is non-standard English – initial /h/ is dropped, raised /a/ nucleus,
word-final glottal stop. All three of these features, once perceived, can be coded and
stored linguistically. However, what if we add some extra information about the context
in which it was perceived:

282
he’s right [: ] - Speaker Close friend ‘X’
Male
30 years old
Colleague
Cricket fan
- Context
One-on-one chat in ‘X’s
living room
No one else present in room
No one else present in house
- Topic Cricket
Once this information is acknowledged and coded, the linguistic features can be stored
with these social associations. Therefore, [] would be associated with relaxed
conversational exchanges with ‘X’ and a sporting topic.
Now let us consider the same utterance produced by ‘X’ in the same context, but, instead
of a sporting topic, the topic relates to that of a professional, work-related issue.
he’s right [h: ] - Speaker Close friend ‘X’
Male
30 years old
Colleague
Cricket fan
- Context
One-on-one chat in ‘X’s
living room
No one else present in room
No one else present in house
- Topic Work conflict
283
Two changes have been made to the form of the utterance – the initial /h/ of the pronoun
has been retained and the pronounciation of the diphthong has widened so that it is
produced more like the standard form. The associations with ‘X’ as an interlocutor and
the associations with the contextual situation remain the same, but new topic associations
have been established.
By establishing numerous associations between linguistic forms and, for example,
interlocutors, social contexts and topics, the perceiver continually gains experience of
what to expect from each factor. Thus, a speaker can then use this information when it
comes to their own production of appropriate, or indeed inappropriate, linguistic
selection. Therefore, accommodation is possible (not just to a speaker or group of
speakers), but also accommodation to, for example, a situation or topic is possible. As a
result, speakers are able to switch between speech styles and registers dynamically as the
speech event or conversational exchange unfolds in time.
This type of awareness of social factors through linguistic associations may also account
for speaker-initiated variation such as divergence. If a speaker wishes to adopt an image
or persona of a group which holds significant appeal (such as that which Bell discusses
under referee design, see above), the associations can be made through perceptions of
experience (whether direct or indirect) and then linguistic forms can be manipulated
accordingly.
284
However, if we are to follow Preston’s hierarchy, outlined above, certain associations
will take priority over others when it comes to the selection of linguistic forms. Thus,
linguistic forms will be primarily considered on linguistic criteria, such as language
specific criteria. The selection will then be biased towards associations of ‘status’ and,
lastly, surface forms will be chosen according to associations of ‘style’.
10.5.4
How this can be implemented through the three-tiered model
The acknowledgement of linguistic factors as the primary influence on the derivation or
nature of linguistic variants could be said to reflect the first two tiers of the model as
previously discussed (i.e. the Inventory and the Realisation). In the context of this
analysis, language or dialect-specific conditions on diphthong form shape the underlying
inventory and provide the phonemic entries. Then, in the Realisation, additional factors,
such as co-articulatory and contextual effects, are considered as the result of phonetic
mappings of elements in phonemic strings. Therefore, these linguistic phases have
primacy in the shaping of underlying forms before they are produced. However, as
discussed above, surface forms may not always behave in a linguistically consistent way
as variation occurs in, for example, contrasting stylistic and social contexts, and co-
articulatory effects may be enhanced or reduced. In other words, to be truly linguistically
consistent would result in the production of the underlying inventory forms in every
linguistic context. However, allophonic alternations are prompted in the Realisation
which allows for linguistically motivated variation and extra-linguistic factors can lead to
variation between these allophonic structures. Therefore, we need to construct a
285
component which allows the speaker to retain trace memories of the output from both the
Realisation and the Inventory so they too can be evaluated according to real-time
sociolinguistic considerations.
Using the notions of status (this time on the part of the speaker), style and context, we
may construct something like the following matrix:
10.40
Audience Status e.g. who? Style e.g. How? Context e.g. where?
The knowledge about each category is gained from a person’s continuous linguistic
experience. For example, only by experiencing certain speech contexts, either directly or
indirectly (such as speaking in a job interview or a sermon in Church), can a speaker
collect information about which linguistic form is appropriate when. By way of
illustration, consider the lowering of diphthong nuclei after dorsals for a Museum Mersea
Island speaker. Their Inventory produced // while the Realisation generated []. Here
is how we might evaluate both according to context and style:
286
10.41
Style Context
Formal Informal Formal Informal
By using tick marks ‘’, the characteristics of each candidate in terms of social and
stylistic value are mapped. Therefore, rather than acting as a ‘selection through
violation’ process, as in classic OT, the ticks represent the extra-linguistic mapping of,
for example, the social and stylistic attributes of a linguistic form onto a matrix of
categories. As a result, the example above shows how a speaker has categorised [] as
being associated with informal, relaxed speech styles and familiar contexts, while the
reverse is true of []. Furthermore, we can see how these would potentially interact as a
formal unfamiliar situation would prompt the selection of [] while an informal familiar
situation would prompt []. However, this type of binary classification seems
methodologically crude in that we are unlikely to make such clear-cut distinctions for
each interaction in which we are involved. For example, a speaker would find a conflict
in variant selection above if the speech event represented a formal style in an informal
context, such as the reading of a book passage at a friendly, local book club held in a
member’s house. Therefore, we might propose a more individual or tailor-made division
which reflects our personal situation and experience. By way of illustration, as a 28 year
old, PhD researcher, lecturer and speaker of Mersea Island English, I might include the
following in my sociolinguistics matrix:
287
10.42a
Style
Chatting Lecturing Telephone Interview Performance etc.
10.42b
Context
Home Classroom Supervisor’s
Office
Restaurant Friend’s
House
etc.
Thus, the further a classification is to the left of a category, the more salient it is to me.
The inclusion of ‘Performance’ under Style allows for me to perform, or enhance certain
linguistic characteristics. For example, it was mentioned above that certain traditional
dialect features may become entrenched in certain set phrases. These performance
phrases may not be in keeping with the rest of a person’s speech pattern, but they can be
accessed during a speech event if necessary. This could also include aspects such as
mimicry of accents which are not socially related to the speaker – for example, the
performance of an American accent during story telling. In addition, I have advanced
many classifications under ‘Context’ that pertain to working at the University where,
depending on the season, I spend most of my time. This will obviously not be the case
for others who hold different jobs or indeed even for those who partake in similar
activities to my own. Also, allowing for this much detail leads to a particular linguistic
form being associated with more than one cell on the sociolinguistics matrix. However,
if I do not experience any of these classifications for an extended period of time (for
288
example, I move to a different geographic region or change jobs), then I will gradually
lose traces of previous associations and acquire new ones according to my new
experiences. With these new experiences may come new variant exposure, which the
phonological and sociolinguistic system will need to decode and re-classify.
It is a significant implication of this proposal that, since both the Inventory output and the
Realisation output are evaluated at this final stage, the former must have a trace which
can then be retrieved by the production system. However, the model must also be able to
account for surface variants which do not seem to be represented by either the Inventory
or the Realisation outputs.
If we return to Exemplar theory, it was mentioned above that the forms we perceive are
stored in exemplar clouds from which the speaker can pick the strongest when it is time
for production. To accommodate this notion in the current model, it can be proposed that
the perceived exemplar forms in a particular situation are stored before they too present
themselves for evaluation alongside the Realisation and Inventory outputs. Thus, if I, as
a perceiver who has // as an Inventory form, consistently hear at work [] forms used
in all linguistic contexts (not only in those where I would expect lowering), I would
associate that form, in all linguistic contexts with work and the people associated with
that institution. Thus, I would evaluate, for example, [kt] and [st] as permissible and
valid forms in a work context. Then, if I chose to accommodate to this pattern, I too
would use [] in both and not just after the dorsal.
289
This also gives an important role to the people with whom we interact. It is these people
who provide us with the exemplar knowledge and who each have the potential to be an
audience themselves. As a result, our interlocutors provide a great influence over how
we design our speech and must be included in our evaluation of surface candidates. As
we grow up and learn the social rules of language interaction and use, we are
linguistically groomed with respect to how we can say what to whom (leading to much
anecdotal data of parents correcting their children’s pronunciation or apologising for their
children’s often embarrassing breach of interactional conventions).
Once again, therefore, it would not be methodologically appropriate to suggest that we
categorise our interlocutors in a binary way (such as known vs. unknown), but rather as
individuals or, at the very most, a group. The former would allow us to categorise and
respond linguistically to the behaviour of another while a group affiliation (such as that
reported in communities of practice studies - Eckert (1989; 2000), Mendoza-Denton
(2008) and Meyerhoff (2002)) would prompt linguistic behaviour as expected from the
group norm of affiliated members. Indeed, this type of group audience could also be
activated in order to signal membership, even when the speaker is removed from the
vicinity of the other members, in accordance with Bell’s referee design (as previously
discussed). Taking these observations into account, the ‘Sociolinguistic Speaker Matrix’
may be represented generally as follows:
290
10.43
Audience (Direct or Indirect)
Individual A Individual B Individual C Individual D Group 1 Group2
The three aspects of Audience, Style and Context would, therefore, all work together in
the evaluation of potential surface forms.
10.44
Audience Style Context
A1 A2 A3 S1 S2 S3 C1 C2 C3
However, it must be noted at this point that there is a potential clash of terminology. In
the above proposal, the terms ‘style’ is referring to what type of speech is appropriate for
the speech event and, therefore, answers the question How should I speak in situation X?
As a result, this is more in keeping with more traditional Labovian interpretations of style
(such as that used by early sociolinguistic methodologies which would elicit and compare
speech from word lists, reading passages and casual speech). However, a strict adherence
to Bell’s model would lead to the interpretation that ‘style’ is in fact the ‘audience’ and,
therefore, these two should not be separated into individual analytical entities.
291
Therefore, in order to avoid confusion, the term ‘Speech Type’ will be used in place of
‘style’. The incorporation of this term allows for the maintenance of a three-part system
between who is being addressed (Audience), how the speech event is altered to conform
to stylistic factors (Speech Type) and the setting or where the utterance takes place
(Context).
10.5.5
The Activation of the Sociolinguistics Matrix and Evaluative Parameters
The inherent nature of any natural (non-scripted) interaction is that it is an ever-changing,
dynamic process. Even the most mundane exchanges do not remain static with respect
to, for example, audience, topic and context. By way of illustration, a chance meeting
with a friend on the street may include many rapid changes in topic, while a group
interaction may include many changes in the direct and indirect audiences. In addition,
the need for emphasis, and thus clearer articulation may arise, or the need to moderate, or
alter one’s speech in accordance with perceived stereotypes may be desired.
Therefore, any model of speech must allow for the ever-changing dynamics of social
interaction and the influences this will have on the linguistic system. Focussing on
phonology, however, the phonological system may provide the speaker with the optimal
options for production, in accordance with underlying structure, but there must be a
flexible mechanism in place so that the demands of communicative competence can
override the phonological system’s recommendations if necessary. In other words, the
phonological system provides, stores and maintains a number of possible linguistic
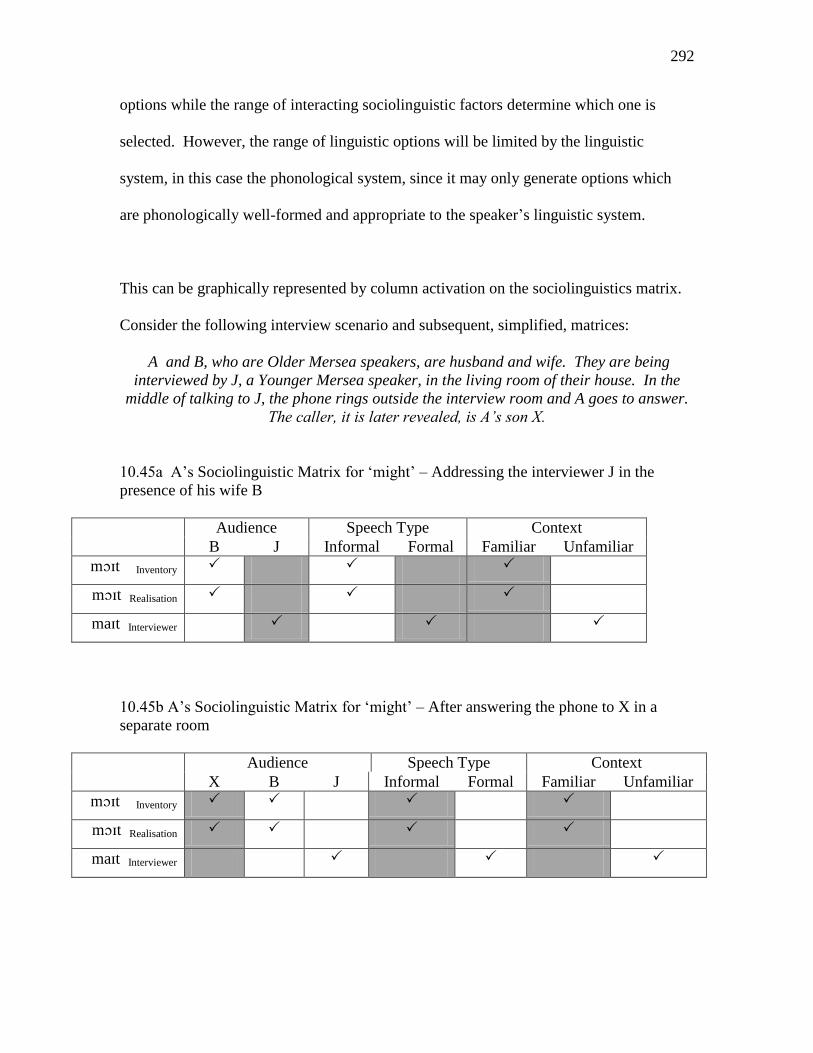
292
options while the range of interacting sociolinguistic factors determine which one is
selected. However, the range of linguistic options will be limited by the linguistic
system, in this case the phonological system, since it may only generate options which
are phonologically well-formed and appropriate to the speaker’s linguistic system.
This can be graphically represented by column activation on the sociolinguistics matrix.
Consider the following interview scenario and subsequent, simplified, matrices:
A and B, who are Older Mersea speakers, are husband and wife. They are being
interviewed by J, a Younger Mersea speaker, in the living room of their house. In the
middle of talking to J, the phone rings outside the interview room and A goes to answer.
The caller, it is later revealed, is A’s son X.
10.45a A’s Sociolinguistic Matrix for ‘might’ – Addressing the interviewer J in the
presence of his wife B
Audience Speech Type Context
B J Informal Formal Familiar Unfamiliar
mt Inventory
mt Realisation
mat Interviewer
10.45b A’s Sociolinguistic Matrix for ‘might’ – After answering the phone to X in a
separate room
Audience Speech Type Context
X B J Informal Formal Familiar Unfamiliar
mt Inventory
mt Realisation
mat Interviewer
293
The subscripts in the far left column indicate the source of the evaluated candidates or
variants. Note how the interviewer’s form acts as an input at this stage since that is the
one being perceived, decoded and stored in association with the relevant social factors.
This allows for new phonetic forms to be interpreted by the phonological system and
evaluated accordingly by the sociolinguistic system so that accommodation to the new
form is possible.
The highlighted columns indicate which social aspects are relevant at the time of the
speech event. Therefore, the context does not change, meaning that both utterances were
carried out in a similarly familiar location, in this case, A’s home. However, both the
interlocutor and the style change, the former due to the shift in addressee, and the latter
due to the break in conversational structure (the phone conversation is not viewed by the
speaker as being part of the recorded interview structure, but rather a separate casual
exchange). Therefore, the parameters for candidate evaluation also change.
In 10.45a, the speaker’s choice is between [], which the interviewer is using and which
is also associated with the current speech style, or [], whose only relevant associations
(in this simplified illustration) are to do with the familiarity of the context. Conversely,
when the audience and style of speech changes, there are no associations of [] in the
activated cells, making [] the likely surface form and accommodation to the interviewer
less likely, even though J maintains the type of status associated with over hearers.
294
The benefit of this approach is that it is able to illustrate surface variation in a dynamic
conversational structure by highlighting what possible factors may have altered as
different variants are used. Indeed, the rather simplified examples above can be adapted
to reflect any number of additional or personalised factors. For example, the only
additional input in the Sociolinguistic Level was from the interviewer. However, in a
group situation or dialect contact situation, there may be a number of new forms added
from speakers, which will work to bolster their respective exemplar clouds and create
numerous new sociolinguistic associations. If the contact with these new forms is
temporary, the associations will remain weak. Conversely, if these associations are
continually activated, they will strengthen as they are used with increased frequency.
Eventually, these strengthened forms will cause a shift or change on the part of the
speaker.
The following section will now discuss how language change may be represented and
reflected by this three-tiered model.
10.6
The Representation of Types of Change
The model outlined above has so far demonstrated how underlying phonological forms
can be generated to provide a structured and optimal phonemic inventory. The members
of this inventory are then passed onto a secondary level which activates and imposes
certain phonetic constraints on their production once placed in certain linguistic contexts.
These two stages, governed by linguistic factors, provide the basis and inputs for the final
295
stage of sociolinguistic evaluation. It is this final stage where the interaction of
phonology and sociolinguistics can be seen and surface variation between linguistic
forms can be illustrated according to various sociolinguistic (or external) demands.
However, it seems that any model of variation would not be complete without the
provision for representing language or dialect change. Chapter 9 has summarised the
characteristics and types of change found in MIE as well as providing explanations for
some of the lexical variation (namely that associated with ‘Island’ and BOY).
Therefore, the following sections will illustrate how we can incorporate and describe the
general theory of language change into the three-tiered model presented so far in this
Chapter.
Minkova and Stockwell (2003), investigating a number of vowel and diphthong shifts,
state that “once phonetically motivated surface changes gather enough momentum, they
percolate into the underlying structure, creating new phonologies” (2003:184).
Therefore, in the early stages of change, contrasts in the underlying structure of the
Inventory would remain unaltered. This can be reflected in both the data and the model
presented so far. Applying the principles of this quote from Minkova and Stockwell, we
can say that ‘phonetically motivated’ changes are those natural changes which arise in the
Realisation stage. With respect to the MIE data, an example of this could be the lowering
of diphthong nuclei after dorsals. This change does not affect the underlying structure of
the Inventory as, in this model, these two stages (Inventory and Realisation) are separate.
296
However, even though the initial domains of application are phonetically restricted (for
example, diphthongal nuclei are only lowered after dorsals), once these patterns are
established, frequently used and reinforced by the speaker and speech community, other
domains of application may emerge until the Realisation stage is altering all or nearly all
inputs from the Inventory. This type of change which allows for certain phonological
environments to change independently of other phonological environments reflects the
principles of Neogrammarian sound changes (see, for example, Labov (1994)). Once the
momentum of the change has gathered, the change may be filtered up to the inventory
and the underlying structure will be reassessed and altered. An immediate advantage
would be that processing in the Realisation would be reduced as less context-specific
constraints would be activated to apply to specific inputs. It is at this point that the
Inventory might need to readjust in order to conform with the constraints active at this
level. In the case of this model, these would be the dispersion constraints which maintain
the structure of the phonemic inventory.
By way of illustration, consider the changes in the PRICE vowel from [] to [] in MIE55
.
The data have shown that this diphthong is subject to processes associated with Canadian
Raising, lowering after dorsals and smoothing before coda /l/. The following represents
these processes with respect to a Museum speaker:
55
Let it be noted that by selecting this variant, I am not proposing that this is where the change in MIE
originated. It is being used only for illustrative purposes.
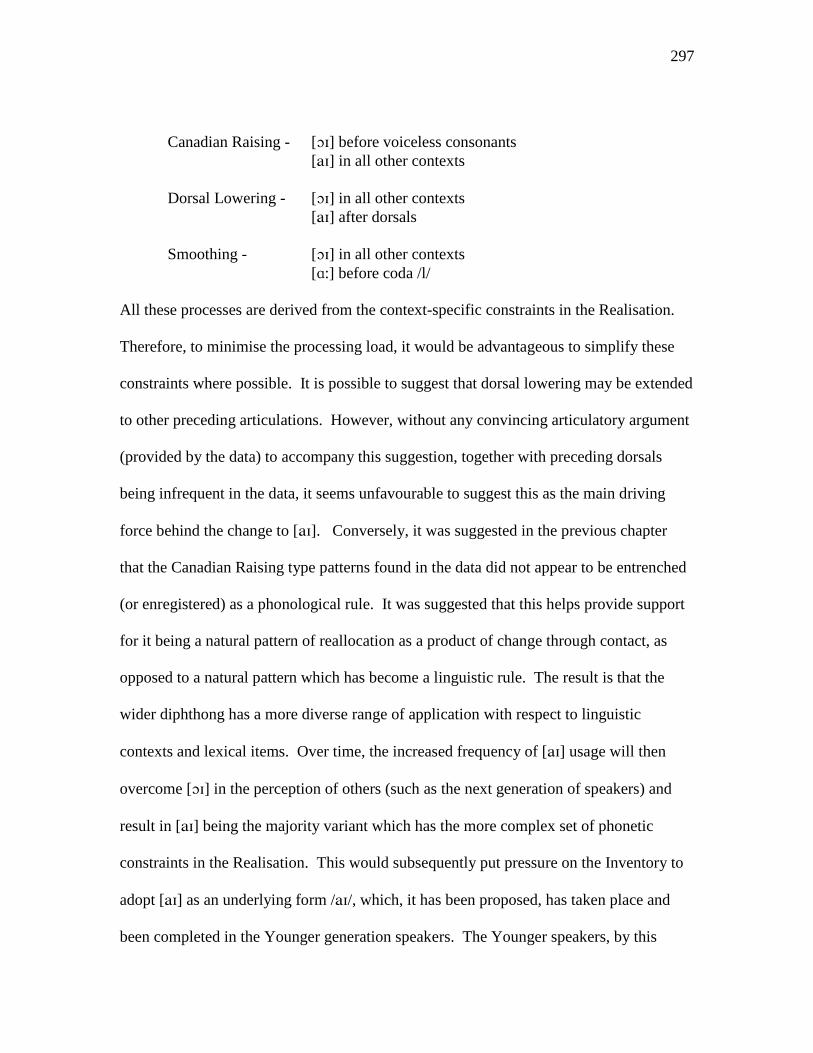
297
Canadian Raising - [] before voiceless consonants
[] in all other contexts
Dorsal Lowering - [] in all other contexts
[] after dorsals
Smoothing - [] in all other contexts
[:] before coda /l/
All these processes are derived from the context-specific constraints in the Realisation.
Therefore, to minimise the processing load, it would be advantageous to simplify these
constraints where possible. It is possible to suggest that dorsal lowering may be extended
to other preceding articulations. However, without any convincing articulatory argument
(provided by the data) to accompany this suggestion, together with preceding dorsals
being infrequent in the data, it seems unfavourable to suggest this as the main driving
force behind the change to []. Conversely, it was suggested in the previous chapter
that the Canadian Raising type patterns found in the data did not appear to be entrenched
(or enregistered) as a phonological rule. It was suggested that this helps provide support
for it being a natural pattern of reallocation as a product of change through contact, as
opposed to a natural pattern which has become a linguistic rule. The result is that the
wider diphthong has a more diverse range of application with respect to linguistic
contexts and lexical items. Over time, the increased frequency of [] usage will then
overcome [] in the perception of others (such as the next generation of speakers) and
result in [] being the majority variant which has the more complex set of phonetic
constraints in the Realisation. This would subsequently put pressure on the Inventory to
adopt [] as an underlying form //, which, it has been proposed, has taken place and
been completed in the Younger generation speakers. The Younger speakers, by this
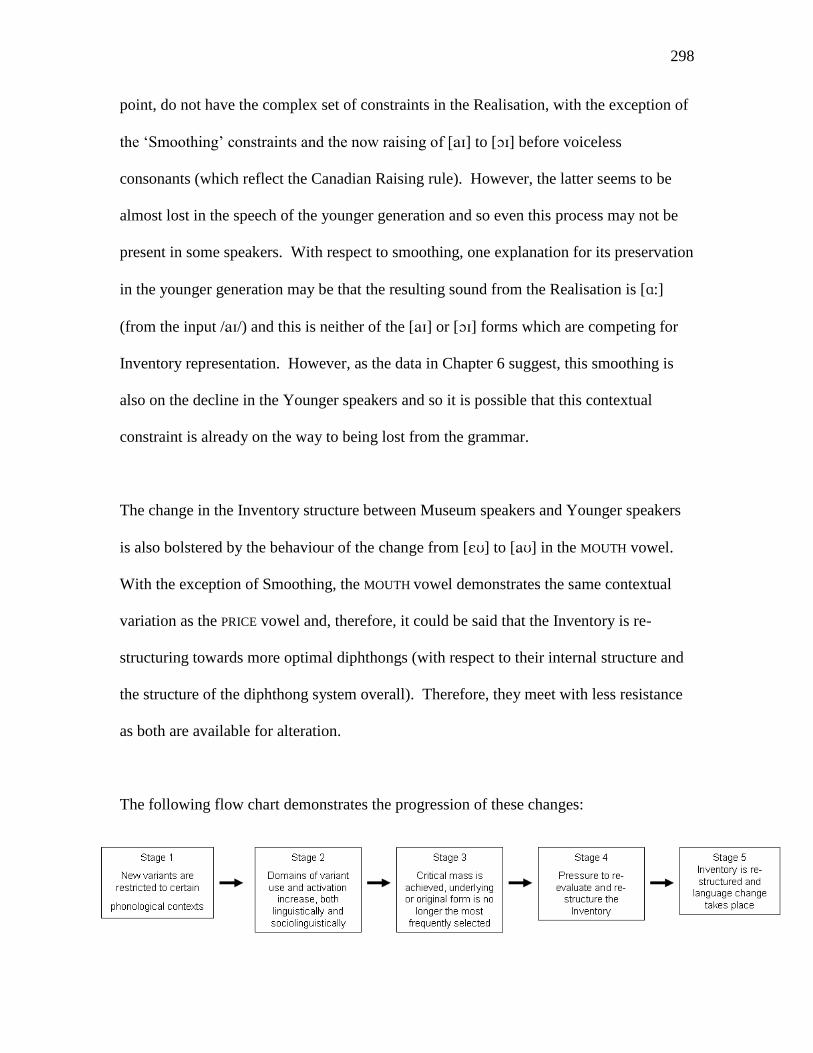
298
point, do not have the complex set of constraints in the Realisation, with the exception of
the ‘Smoothing’ constraints and the now raising of [] to [] before voiceless
consonants (which reflect the Canadian Raising rule). However, the latter seems to be
almost lost in the speech of the younger generation and so even this process may not be
present in some speakers. With respect to smoothing, one explanation for its preservation
in the younger generation may be that the resulting sound from the Realisation is [:]
(from the input //) and this is neither of the [] or [] forms which are competing for
Inventory representation. However, as the data in Chapter 6 suggest, this smoothing is
also on the decline in the Younger speakers and so it is possible that this contextual
constraint is already on the way to being lost from the grammar.
The change in the Inventory structure between Museum speakers and Younger speakers
is also bolstered by the behaviour of the change from [] to [] in the MOUTH vowel.
With the exception of Smoothing, the MOUTH vowel demonstrates the same contextual
variation as the PRICE vowel and, therefore, it could be said that the Inventory is re-
structuring towards more optimal diphthongs (with respect to their internal structure and
the structure of the diphthong system overall). Therefore, they meet with less resistance
as both are available for alteration.
The following flow chart demonstrates the progression of these changes:
299
However, this approach is primarily focussed on linguistic factors (namely naturalness)
as the main driving force of change with sociolinguistic factors there to reinforce and
promote the newly generated variants. Therefore, since the Realisation forms contribute
to the input of the Sociolinguistic level, we need to allow for driving forces of change
which are outside the domain of phonetic motivation.
During an examination of constraint re-ranking in phonological change, Gess (2003)
presents a three level model (primarily based on the methodological approach of Lexical
Phonology), in which he makes the primary distinction between lexical and post-lexical
components. It is the structure of the post-lexical component which is the most relevant
to the model presented here. Gess proposes that this level is split into two levels:
‘register-dependent’ and ‘register-independent’. Importantly, with respect to
phonological change, the register-dependent level is where the new form is developed
due to a novel re-ranking of applicable OT constraints. Gess (2003:76) notes that the
ranking which produces the new form will be a rarity and will be restricted to a minority
of speech styles, a minority of speakers and, maybe, only feature in frequently occurring
words. The ranking which produces these novel forms will then become more frequent
in a speech community and extend its domain of application with respect to speech styles
and lexical items. Finally, Gess suggests that “the spread of change through speech
contexts and speakers is due to sociolinguistic factors [while] the spread of change
through the lexicon (lexical diffusion) is due to both social factors and frequency”
(2003:77). As a result, this proposal does not deny the role of sociolinguistic factors
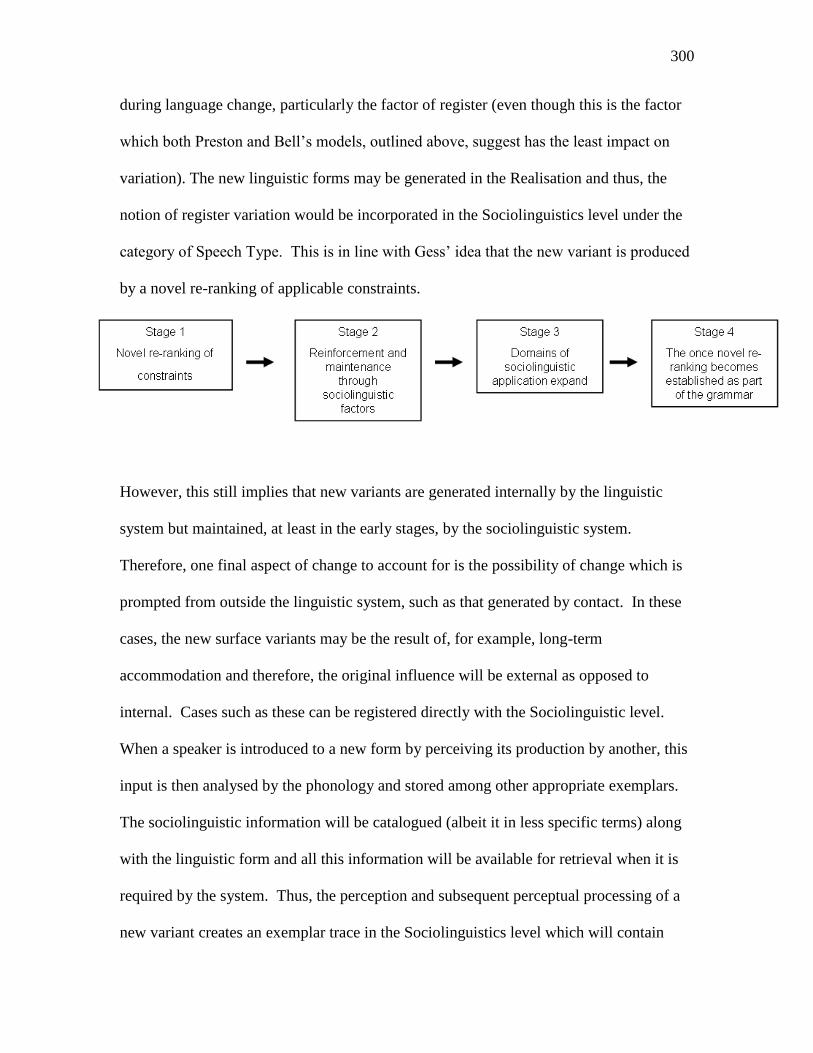
300
during language change, particularly the factor of register (even though this is the factor
which both Preston and Bell’s models, outlined above, suggest has the least impact on
variation). The new linguistic forms may be generated in the Realisation and thus, the
notion of register variation would be incorporated in the Sociolinguistics level under the
category of Speech Type. This is in line with Gess’ idea that the new variant is produced
by a novel re-ranking of applicable constraints.
However, this still implies that new variants are generated internally by the linguistic
system but maintained, at least in the early stages, by the sociolinguistic system.
Therefore, one final aspect of change to account for is the possibility of change which is
prompted from outside the linguistic system, such as that generated by contact. In these
cases, the new surface variants may be the result of, for example, long-term
accommodation and therefore, the original influence will be external as opposed to
internal. Cases such as these can be registered directly with the Sociolinguistic level.
When a speaker is introduced to a new form by perceiving its production by another, this
input is then analysed by the phonology and stored among other appropriate exemplars.
The sociolinguistic information will be catalogued (albeit it in less specific terms) along
with the linguistic form and all this information will be available for retrieval when it is
required by the system. Thus, the perception and subsequent perceptual processing of a
new variant creates an exemplar trace in the Sociolinguistics level which will contain
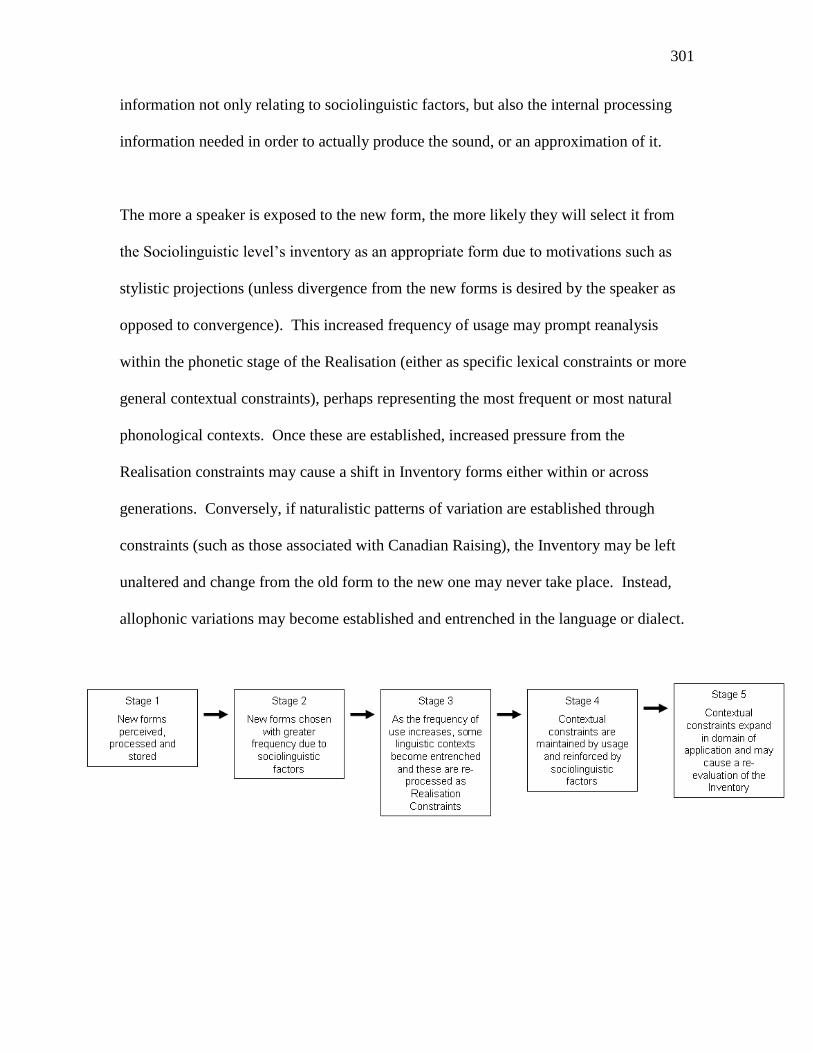
301
information not only relating to sociolinguistic factors, but also the internal processing
information needed in order to actually produce the sound, or an approximation of it.
The more a speaker is exposed to the new form, the more likely they will select it from
the Sociolinguistic level’s inventory as an appropriate form due to motivations such as
stylistic projections (unless divergence from the new forms is desired by the speaker as
opposed to convergence). This increased frequency of usage may prompt reanalysis
within the phonetic stage of the Realisation (either as specific lexical constraints or more
general contextual constraints), perhaps representing the most frequent or most natural
phonological contexts. Once these are established, increased pressure from the
Realisation constraints may cause a shift in Inventory forms either within or across
generations. Conversely, if naturalistic patterns of variation are established through
constraints (such as those associated with Canadian Raising), the Inventory may be left
unaltered and change from the old form to the new one may never take place. Instead,
allophonic variations may become established and entrenched in the language or dialect.
302
As a result, we can propose three types of change:
1. Change which is introduced and maintained by the linguistic system. These
changes will reflect natural processes and motivations.
2. Change which is introduced by the linguistic system, but maintained by the
sociolinguistic system. These changes are the result of novel constraint re-
rankings, which then become established.
3. Change which is introduced externally to the Sociolinguistic level and is
maintained by the sociolinguistic system. These new forms may never become
adopted by the linguistic system in the form of Realisation constraints if, for
example, the contact situation which introduced the innovations diminishes.
Changes of the third type may be the least likely to be adopted by the system since it is
these which need constant exposure, reinforcement and selection in order for contextual
constraints to be established. Therefore, unless they do become established, they
represent only short-term accommodations as opposed to language change through long
term accommodation and contact. In a similar fashion, changes introduced to the system
through novel re-rankings still need to be reinforced by their selection in specific
sociolinguistic contexts. If their application in certain registers, contexts or styles fails to
become established, there is no impetus from the Sociolinguistic level with which to
pressure the linguistic system into maintaining or permanently adopting the ranking.
Finally, change which is motivated and maintained by the linguistic system can be said to
reflect natural motivations within the system as a whole. It is these changes which are
most likely to be stabilised (both linguistically and sociolinguistically), and result in
underlying change, unless they are repeatedly overridden by external sociolinguistic
factors, such as those relating to standardisation and ‘correctness’.
303
This Chapter has discussed how we might represent the interface between phonology and
sociolinguistics. The three-tiered model discussed and presented throughout illustrates
how underlying forms may be selected as part of an optimal underlying system (the
Inventory) through the use of dispersion constraints. These underlying forms are selected
regardless of linguistic context and are used as the input to the second, Realisation, stage.
It is this stage where contextual phonetic information becomes available and allophonic
variation can be generated. This stage has also been shown to accommodate lexically
conditioned as well as articulatory motivated constraints. The final stage is where
sociolinguistic factors, which influence surface variation, are represented (factors such as
the audience and the context of the speech event). Both Inventory and Realisation forms
have trace representations in this level and this is where their sociolinguistic associations
are activated. These units are then evaluated along with any other externally sourced
variants according to sociolinguistic factors.
Finally, the process of language change has been discussed in relation to how types of
change may be reflected in the structure of the three-tiered model. It has been suggested
that three types of change are possible. These changes are sourced either internally or
externally, each with the need for constant reinforcement from internal generation of
constraints and sociolinguistic selection in order to result in change to the underlying
structure.
304
Concluding Remarks
305
CONCLUDING REMARKS
The investigation of Mersea Island English (MIE) has resulted in the discovery of a
number of social and linguistic factors which have influenced the shape and type of
dialect variation present in the data.
We have seen that, as the demographic structure of the Island has developed, there has
been a widening of Islanders’ social network structures. This has resulted in a greater
dependence on the mainland with respect to factors such as education and employment,
as well as more leisurely pursuits, such as shopping and social interaction.
The analysis of life-long Island residents across three generations has demonstrated that it
is not just the socio-demographic characteristics of the Island which have been
susceptible to change, but also the internal structure of the MIE dialect. The diphthongs
//, // and // have been shown to have shifted from their more traditional realisations
of [], [] and [], respectively, which contradict the predictions and generalisations of
both the Diphthong Shift and the Southern Shift. However, these changes are not without
internal complexities.
Canadian Raising type patterns were found for both // and // diphthongs. These
patterns, as discussed in Chapter 9, may be a by-product and highlight the progression of
change from [] to [] and [] to [], as naturalness can account for the initial
preference of lowering the diphthong nuclei before voiced consonants as opposed to
voiceless consonants. Other lowering influences, which help to promote this change
306
were found in the domain of preceding dorsal consonants, and this too was attributed to
contextual influences.
Other patterns highlighted within the overall variation were the preservation of traditional
rounded [] in BOY tokens and the monophthongal variant [] in the lexical item Island.
These were shown, also in Chapter 9, to contrast with respect to performance phrases and
overt dialect comment. Thus, while rounded [] featured in performance phrases and
was open to comments about the characteristics of MIE, Island monophthongisation was
not. This, it was suggested, together with the behaviour of Canadian Raising, helps to
demonstrate different types of social and dialect enregisterment – for example, the
difference between enregistering individual phonological rules or processes and the
realisations of individual lexical items.
The pattern and direction of dialect change and the manipulation of enregistered variants
suggests that phonological conditions and sociolinguistic factors are inter-twined. The
underlying structure of the diphthong system was discussed in Chapter 10 and it was
shown that, when change to the system occurs, dispersion constraints can help illustrate
how perceptual and articulatory distances strive to be maintained. With the integrity of
the underlying system maintained by the phonology (first tier – Inventory), a three-tiered
model of language was presented, which represents the interaction of phonology,
phonetics and sociolinguistics. The second tier (Realisation) allows for phonetic
information to become available for any contextual alternations of underlying forms to
take place. It is here that Canadian Raising, BOY and Island variation can be accounted
307
for and represented. However, neither the Inventory nor Realisation levels allow for
variation influenced by social factors. Therefore, the innovative Sociolinguistic level
retains a trace from the previous levels’ output, as well as any variants in the ambient
speech environment. All these candidates can then be evaluated and selected according
to relevant social factors. The resulting model, thus, equally represents Internal and
External influences on variation, while limiting intra-speaker variation to that only within
the processing capabilities of the phonological system.
The construction of this model also allows for different types of change to be sourced to a
particular level of origin. For example, externally-driven changes (such as that from
long-term accommodation) can be shown to originate in the Sociolinguistic level before it
filters upwards through the system until the underlying structure is prompted to re-
evaluate and adjust itself accordingly. Conversely, changes which may be prompted by
natural linguistic motivations (such as coarticulation or changes towards the unmarked)
can be shown to originate in the Inventory or Realisation levels. If the innovative forms
are selected and used by the Sociolinguistic level, they will become reinforced and
adopted by the system as linguistic change or allophonic variation.
As a result, this model is able to represent phonological change as well as linguistic
variation (both allophonic and sociolinguistic). The implications of such a model allow
for the future re-examination and representation of existing data, as well as the
development of innovative methodologies which can allow for the socio-phonological
interface to be investigated further.

308
Bibliography
309
(2000) The New Penguin Dictionary; Penguin Books
Agha, A. (2003) The Social Life of Cultural Values; Language and Communication 23:
231-273
Altendorf, U. (2003) Estuary English: levelling at the interface of RP and South-Eastern
British English; Gunter Narr Verlag (Germany)
Anttila, A. (2002) Variation and Phonological Theory; in Chambers, J., Trudgill, P. and
Schilling-Estes, N. (eds) The Handbook of Language Variation and Change; Blackwell
(UK)
Anttila, A. (2007) Variation and Optionality; in de Lacey, P. (ed) The Cambridge
Handbook of Phonology; Cambridge University Press (UK)
Beal, J. (2009) Enregisterment, Commodification and Historical Context: “Geordie”
versus “Sheffield”; American Speech 84: 138-156
Bell, A. (1984) Language Style as Audience Design; Language in Society 13: 145-204
Bell, A. (2001) Back in Style: reworking audience design; in Eckert, P. and Rickford, J.
(eds) Style and Sociolinguistic Variation; Cambridge University Press (UK)
Blake, R. and Josey, M. (2003) The /ay/ Diphthong in a Martha’s Vineyard Community:
what can we say 40 years after Labov?; Language and Society 32: 451-485
Boersma, P. and Hayes, B. (1999) Empirical Tests of the Gradual Learning Algorithm;
Rutgers Optimality Archive, ROA 348-1099 (http://roa.rutgers.edu)
Boersma, P. and Hayes, B. (2001) Empirical Tests of the Gradual Learning Device;
Linguistic Inquiry 32: 45-86
Britain, D. (1991) Dialect and Space: a geolinguistic study of speech variables in the
Fens; Unpublished PhD, University of Essex (UK)
Britain, D. (1995) The Sociolinguistic Development of Canadian Raising in the Fens;
Essex Research Reports in Linguistics 6: 1-53, University of Essex (UK)
Britain, D. (1997) Dialect Contact and Phonological Reallocation: ‘Canadian Raising’
in the English Fens; Language in Society 26: 15-46
Britain, D. (2002a) Space and Spatial Diffusion; in Chambers, J., Trudgill, P. and
Schilling-Estes, N. (eds) The Handbook of Language Variation and Change; Blackwell
(UK)
310
Britain, D. (2002b) The British History of New Zealand English; Essex Research Reports
in Linguistics 41: 1-41 (Reprinted as 'Where did New Zealand English come from ?' in
Bell, A., Harlow, R. and Starks, D (eds) (2005) The Languages of New Zealand; Victoria
University Press (NZ))
Britain, D. (2002c) Phoenix from the Ashes: the death, contact and birth of dialects in
England; Essex Research Reports in Linguistics 41: 42-72 (Reprinted as 'One foot in the
grave?: Dialect death, dialect contact and dialect birth in England' (2010) International
Journal of Sociology of Language 196/197: 121-155)
Britain, D. (2008) On the Wrong Track? A non-standard history of non-standard /au/ in
English; Essex Research Reports in Linguistics 57: 79-114
Britain, D. (2010) Supralocal Regional Dialect Levelling; in Llamas, C. and Watt, D.
(eds) Language and Identities; Edinburgh University Press (UK)
Britain, D. (forthcoming) Diffusion; in Bergs, A. and Brinton, L. (eds) Historical
Linguistics of English; Mouton de Gruyter (Germany)
Britain, D. and Sudbury, A. (2010) South Atlantic Ocean: Falkland Island English; in
Schreier, D., Trudgill, P., Schneider, E and Williams, J. (eds) Lesser-Known Varieties of
English; Cambridge University Press (UK)
Bybee, J. (2002) Word Frequency and Context of Use in the Lexical Diffusion of
Phonetically Conditioned Sound Change; Language Variation and Change 14: 261-290
Bybee, J. (2006) From Usage to Grammar: the mind’s response to repetition; Language
82: 711-733
Chambers, J. (1989) Canadian Raising: blocking, fronting etc; American Speech 64:75-
88
Chambers, J. (2002) Studying Language Variation: an informal epistemology; in
Chambers, J., Trudgill, P. and Schilling-Estes, N. (eds) The Handbook of Language
Variation and Change; Blackwell (UK)
Cheshire, J. and Fox, S. (2007) Innovation in the Quotative System of London
Adolescents; Paper presented at NWAV 36, University of Pennsylvania (USA) -
(Available at:
http://www.lancs.ac.uk/fss/projects/linguistics/innovators/documents/NWAV_36_Fox_C
heshire_000.pdf)
311
Cheshire, J., Gillett, A., Kerswill, P. and Williams, A. (1999) The Role of Adolescents in
Dialect Levelling; Final report submitted to the ESRC, June 1999 (ESRC Ref.
R000236180)
Chirrey, D. (1999) Edinburgh: descriptive material; in Foulkes, P. and Docherty, G.
Urban Voices; Arnold (UK)
Chomsky, N. and Halle, M. (1968) The Sound Pattern of English; Harper and Row
(USA)
Clarke, J., Yallop, C. and Fletcher, J. (2007) An Introduction to Phonetics and
Phonology; Blackwell (UK)
Coates, J. (2004) Women, Men and Language – 3rd
Edition; Pearson Education Ltd (UK)
Collins, B. and Mees, I. (1990) The Phonetics of Cardiff English; in Coupland, N. (ed)
English in Wales; Multilingual Matters (UK)
Cruttenden, A. (2001) Gimson’s Pronunciation of English: 6th
Edition; Arnold (UK)
D’Arcy, A. (2007) Like and Language Ideology: disentangling fact from fiction;
American Speech 82: 386-419
Docherty, G. and Foulkes, P. (1999) Derby and Newcastle: instrumental phonetics and
variationist studies; in Foulkes, P. and Docherty, G. Urban Voices; Arnold (UK)
Docherty, G., Foulkes, P., Milroy, J., Milroy, L. and Walshaw, D. (1997) Descriptive
Adequacy in Phonology: a variationist perspective; Journal of Linguistics 33: 275-310
Drager, K. (2009) A Sociophonetic Ethnography of Selwyn Girls’ High; Unpublished
PhD, University of Canterbury (NZ)
Eckert, P. (1989) Jocks and Burnouts: social categories and identity in the high school;
Teachers College Press (USA)
Eckert, P. (1997) Age as a Sociolinguistic Variable; in Coulmas, F. (ed) The Handbook of
Sociolinguistics; Blackwell (UK)
Eckert, P. (1998) Gender as a Sociolinguistic Variable; in Coates, J. (ed) Language and
Gender: a reader; Blackwell (UK)
Eckert, P. (2000) Linguistic Variation as Social Practice: the linguistic construction of
identity in Belton High; Blackwell (UK)
312
Ellis, A. (1889) On Early English Pronunciation, Part V – the existing phonology of
English Dialects compared to that of West Saxon speech; English Text Society [unaltered
re-print 1999] Woodbridge (UK)
Eustace, S. (1969) The Meaning of the Palaeotype in A J Ellis’ ‘On Early English
Pronunciation’; Transactions of the Philological Society 67: 31-79
Flemming, E. (2004) Contrast and Perceptual Distinctiveness; in Hayes, B., Kirchner, R.
and Steriade, D. (eds) Phonetically Based Phonology; Cambridge University Press (UK)
Flemming, E. (2006) The Role of Distinctiveness Constraints in Phonology;
(http://web.mit.edu/flemming/www/paper/inventories.pdf last accessed September 2011)
Foulkes, P. and Docherty, G. (eds) (1999) Urban Voices; Arnold (UK)
Fox, S. (2000) Estuary English’: Fact or Fiction?; Paper presented at SociolinguistEssex
V, University of Essex (UK)
Fox, S. (2007) The Demise of Cockneys? Language Change in London's 'Traditional'
East End; Unpublished PhD, University of Essex (UK)
Gess, R. (2003) On Re-Ranking and Explanatory Adequacy and a Constraint-Based
Theory of Phonological Change; in Holt, D. (ed) Optimality Theory and Language
Change; Kluwer Academic Publishers (Netherlands)
Hammond, M. (1994) An OT Account of Variability in Walmatjari Stress; Rutgers
Optimality Archive, ROA-20-0794 (http://roa.rutgers.edu)
Hammond, M. (1999) The Phonology of English; a prosodic optimality-theoretic
approach; Oxford University Press (UK)
Hymes, D. (1972) On Communicative Competence; in Pride, J. and Holmes, J. (eds)
Sociolinguistics: selected readings; Penguin (UK)
Hymes, D. (2001) On Communicative Competence; Duranti, A. (ed) Linguistic
Anthropology; a reader; Blackwell (UK)
Jay, B. (1996) Business as Usual; Mersea Island Museum Publications (UK)
Jay, B. (2005) Isle of Mersea; B.M. Jay, Personal Publication
Johnson, W. and Britain, D. (2007) L-vocalisation as a natural phenomenon:
Explorations in Sociophonology; Language Sciences 29: 294-315
Johnstone, B., Andrus, J. and Danielson, A. (2006) Mobility, Indexicality and the
Enregisterment of “Pittsburghese”; Journal of English Linguistics 34: 77-104
313
Karbacz, E. (1999) A Short History of Mersea; Mersea Island Museum Publications (UK)
Kerswill, P. (2004) Koineization and Accommodation; in Chambers, J., Trudgill, P. and
Schilling-Estes, N. (eds) The Handbook of Language Variation and Change; Blackwell
(UK)
Kerswill, P., Torgersen, E. and Fox, S. (2006) Innovation in Inner-London Teenage
Speech; Paper presented at NWAV 35 (USA)
Kerswill, P. and Williams, A. (2000) Creating a New Town Koine: children and
language change in Milton Keynes; Language and Society 29: 65-115
Kiparsky, P. (1968) Linguistic Universals and Linguistic Change; in Bach, E. and Harms,
R. (eds) Universals in Linguistic Theory; Holt, Rinehart and Winston (USA)
Kiparsky, P. (1993) An OT Perspective on Phonological Variation; Rutgers Optimality
Workshop 1 (1993), (http://www.stanford.edu/~kiparsky/Papers/nwave94.pdf last
accessed September 2011)
Kiparsky, P. (2000) Opacity and Cyclicity; The Linguistic Review 17:315-376
Kiparsky, (2008) Fenno-Swedish Quantity: contrast in Stratal OT; in Nevins, A. and
Vaux, B. (ed) Rules, Constraints and Phonological Phenomena; Oxford University Press
(UK)
Kirchner, R. (2001) Phonological Contrast and Articulatory Effort; in Lombardi, L. (ed)
Segmental Phonology in Optimality Theory; Cambridge University Press (UK)
Kirchner, R. (2004) Consonant Lenition; in Hayes, B., Kirchner, R. and Steriade, D. (eds)
Phonetically Based Phonology; Cambridge University Press (UK)
Kokeritz, H. (1932) The Phonology of the Suffolk Dialect, descriptive and historical;
Inaugural Dissertation, Philosophical Faculty of the University of Uppsala (Sweden)
Kurath, H. and Lowman, G. (1970) The Dialect Structure of Southern England;
University of Alabama Press (USA)
Labov, W. (1972) Sociolinguistic Patterns; Blackwell (UK)
Labov, W. (1994) Principles of Linguistic Change: Internal Factors; Blackwell (UK)
Ladefoged, P. (2006) A Course in Phonetics: 5th
Edition; Thomson Wadsworth (USA)
Lass, R. (1987) The Shape of English; J.M. Dent and Sons Ltd (UK)
314
Laver, J. (1994) Principles of Phonetics; Cambridge University Press (UK)
Macaulay, R. (2001) You’re like why not: the quotative expressions in Glasgow
adolescents; Journal of Sociolinguistics 5: 3-21
Mathisen, A. (1999) Sandwell, West Midlands: ambiguous perspectives on gender
patterns and models of change; in Foulkes, P. and Docherty, G. Urban Voices; Arnold
(UK)
McCarthy, J. (2002) A Thematic Guide to Optimality Theory; Cambridge University
Press (UK)
McCarthy, J. (2006) GEN, EVAL and Phonological Opacity;
http://people.umass.edu/jjmccart/phonologyfest/mccarthy-phonologyfest.pdf - last
accessed September 2011
McCarthy, J. (2007) Hidden Generalisations: phonological opacity in optimality theory;
Equinox (UK)
McCarthy, J. (2008) Doing Optimality Theory: applying theory to data; Blackwell (UK)
McCarthy, J. and Prince, A. (1995) Faithfulness and Reduplicative Identity; Rutgers
Optimality Archive, ROA-60 (http://roa.rutgers.edu)
McMahon, A. (2007) Who’s Afraid of the Vowel Shift Rule?; Linguistic Science 29: 341-
359
Mees, I. and Collins, B. (1999) Cardiff: a real-time study of glottalisation; in Foulkes, P.
and Docherty, G. (eds) Urban Voices; Arnold (UK)
Mendoza-Denton, N. (2008) Homegirls; Blackwell (UK)
Meyerhoff, M. (2002) Communities of Practice; in Chambers, J., Trudgill, P. and
Schilling-Estes, N. (eds) The Handbook of Language Variation and Change; Blackwell
(UK)
Milroy, J. (1992) Linguistic Variation and Change: on the historical sociolinguistics of
English; Blackwell (UK)
Milroy, J., Milroy, L., Hartley, S. and Walshaw, D. (1994) Glottal Stops and Tyneside
Glottalisation: competing patterns of variation and change in British English; Language
Variation and Change 6: 327-357
Milroy, L. (1987) Language and Social Networks; 2nd
Edition; Blackwell (UK)

315
Milroy, L. and Gordon, M. (2003) Sociolinguistics: methods and interpretations;
Blackwell (UK)
Minkova, D. and Stockwell, R. (2003) English Vowel Shifts and ‘Optimal’ Diphthongs:
is there a logical link?; in Holt, D. (ed) Optimality Theory and Language Change; Kluwer
Academic Publishers (Netherlands)
Ogura, M. (1987) Historical English Phonology; Kenkysha (Tokyo)
Orton, H. (1962) Survey of English Dialects – Introduction; Arnold (UK)
Orton, H. and Tilling, P. (1969) Survey of English Dialects, Volume 3 – The East
Midland Counties and East Anglia, Part 1; Arnold (UK)
Orton, H. and Tilling, P. (1969) Survey of English Dialects, Volume 3 – The East
Midland Counties and East Anglia, Part 2; Arnold (UK)
Orton, H. and Tilling, P. (1969) Survey of English Dialects, Volume 3 – The East
Midland Counties and East Anglia, Part 3; Arnold (UK)
Padgett, J. (1995) Partial Class Behavior and Nasal Place Assimilation; Proceedings of
the Arizona Phonology Conference: Workshop on Features in Optimality Theory, Coyote
Working Papers, University of Arizona (USA)
Pierrehumbert, J. (2001) Exemplar Dynamics: word frequency, lenition and contrast; in
Bybee, J. and Hopper, P. (eds) Frequency and the Emergence of Linguistic Structure;
John Benjamins (USA)
Pope, J., Meyerhoff, M. and Ladd, R. (2007) Forty Years of Change on Martha’s
Vineyard; Journal of Linguistic Society of America 83: 615-627
Preston, D. (1991) Sorting out the Variables in Sociolinguistic Theory; American Speech
66: 33-56
Prince, A. and Smolensky, P. (1993) Optimality Theory: constraint interaction in
generative grammar; Rutgers Optimality Archive, ROA-537 (http://roa.rutgers.edu)
Prince, A. and Smolensky, P. (2004) Optimality Theory: constraint interaction in
generative grammar; Blackwell (UK)

316
Przedlacka, J. (2001) Estuary English and RP: some recent findings; Studia Anglica
Posnaniensia 36: 35-50
Ryfa, J. (2005) Chavs and Grungers: the creation of distinct speech styles by two hostile
communities of practice in Colchester, Essex; Unpublished MA Dissertation, University
of Essex (UK)
Ryfa, J. (forthcoming) Englishes of London and the Southeast of England; in Hopkins, T.
and McKenny, J. (eds) World Englishes: Volume 1; Continuum International (UK)
Schilling-Estes, N. (1998) Investigating “self-conscious” speech: the performance
register in Ocracoke English; Language in Society 27: 53-83
Schilling-Estes, N. (2002) On the Nature of Isolated and Post-Isolated Dialects:
innovation, variation and differentiation; Journal of Sociolinguistics 6: 64-85
Schilling-Estes, N. and Wolfram, W. (1999) Alternative Models of Dialect Death:
dissipation vs. concentration; Language 75: 486-521
Schreier, D. (2008) St Helenian English: origins, evolution and variation; John
Benjamins (USA)
Schreier, D. (2010a) St Helenian English; in Schreier, D., Trudgill, P., Schneider, E. and
Williams, J. (eds) The Lesser-Known Varieties of English; Cambridge University Press
(UK)
Schreier, D. (2010b) Tristan da Cunha English; in Schreier, D., Trudgill, P., Schneider, E.
and Williams, J. (eds) The Lesser-Known Varieties of English; Cambridge University
Press (UK)
Searle, J. (1979) Expression and Meaning; Cambridge University Press (UK)
Searle, J. (1999) Mind, Language and Society; Weidenfeld and Nicolson (UK)
Sivertsen, E. (1960) Cockney Phonology; Humanities Press (USA)
317
Stockwell, R. (1975) Problems in the Interpretation of the Great English Vowel Shift; in
Goyvaerts, D. and Pullum, G. Essays on the Sound Pattern of English; E. Story-Scientia
(Belgium)
Stoddard, J., Upton, C. and Widdowson, J. (1999) Sheffield in the 1990s:revisiting the
concept of NORMs; in Foulkes, P. and Docherty, G. (eds) Urban Voices; Arnold (UK)
Strang, B. (1970) A History of English; Methuen and Co. Ltd (UK)
Stuart-Smith, J. (1999) Glasgow: accent and voice quality; in Foulkes, P. and Docherty,
G. (eds) Urban Voices; Arnold (UK)
Sudbury, A. (2000) Dialect Contact and Koineisation in the Falkland Islands;
Unpublished PhD, University of Essex (UK)
Sudbury, A. and Britain, D. (2000) Is Falkland Island English Linguistically a Southern
Hemisphere Variety?; Essex Research Reports in Linguistics 28: 33-59 (Reprinted as
Sudbury, A. (2001) ‘Is Falkland Island English a southern hemisphere variety?’; English
Worldwide 22: 55-80).
Tagliamonte, S. and Hudson, R. (1999) Be like et al. beyond America: the quotative
system in British and Canadian Youth; Journal of Sociolinguistics 3:147-172
Tatham, M. and Morton, K. (2006) Speech Production and Perception; Palgrave
MacMillan (UK)
Tollfree, L. (1999) South East London English: discrete versus continuous modelling of
consonantal reduction; in Foulkes, P. and Docherty, G. (eds) Urban Voices; Arnold (UK)
Torgersen, E. and Kerswill, P. (2004) Internal and External Motivation in Phonetic
Change: dialect levelling outcomes for an English Vowel shift; Journal of
Sociolinguistics 8: 23-53
Trudgill, P. (1974) The Social Differentiation of English in Norwich; Cambridge
University Press (UK)
Trudgill, P. (1986) Dialects and Contact; Blackwell (UK)
Trudgill, P. (1988) Norwich Revisited: recent linguistic changes in an English urban
dialect; English World-Wide 9: 33-49
Trudgill, P. (1999) Norwich: endogenous and exogenous linguistic change; in Foulkes, P.
and Docherty, G. (eds) Urban Voices; Arnold (UK)
Wakelin, M. (1977) English Accents: an introduction (revised addition); Athlone Press
(UK)
318
Weinreich, U., Labov, W. and Herzog, M. (1968) Empirical Foundations for a Theory of
Language Change; in Lehman, W. P. and Malkiel, Y. (eds) Directions for Historical
Linguistics; University of Texas Press (USA)
Wells, J. (1982a) Accents of English: an introduction; Cambridge University Press (UK)
Wells, J. (1982b) Accents of English: the British Isles; Cambridge University Press (UK)
Wells, J. (1982c) Accents of English: Beyond the British Isles; Cambridge University
Press (UK)
Williams, A. and Kerswill, P. (1999) Dialect Levelling: change and continuity in Milton
Keynes, Reading and Hull; in Foulkes, P. and Docherty, G. (eds) Urban Voices; Arnold
(UK)
Wolfram, W. (2008) When Islands lose Dialects; the case of the Ocracoke Brogue;
Shima: The International Journal of Research into Island Cultures 2: 1-13
Wolfram, W. and Schilling-Estes, N. (2006) American English: 2nd
Edition; Blackwell
(UK)
Wright, J. (1968) The English Dialect Grammar; Oxford University Press (UK)
Yamada, N. (1984) On Characterising the English Great Vowel Shift; Lingua 62: 43-69
319
Appendix A
320
Appendix A
In this appendix, you will find the complete numerical data sets pertaining to the analysis
of the variable () (see Chapter 4).
A.3a
Number of () tokens according to age and gender
Total
Young
Male 1 4 257 105 367
Female 2 288 73 363
Old
Male 18 8 579 217 200 14 1036
Female 1 283 195 346 35 860
Museum
Male 16 16 241 27 15 1 316
A.3b
Percentage of () variants according to age and gender
Young
Male 0.27 1.09 70.03 28.61
Female 0.55 79.34 20.11
Old
Male 1.74 0.77 55.89 20.95 19.31 1.35
Female 0.12 32.91 22.67 40.23 4.07
Museum
Male 5.06 5.06 76.27 8.54 4.75 0.32
321
A.4a
Overall number of () tokens according to syllable type
Total
Open 1 4 233 24 125 9 233 65 55 749
Closed 13 16 25 668 179 265 46 506 302 173 2193
A.4b
Overall percentage of () tokens according to syllable type
Open 0.13 0.53 31.11 3.20 16.69 1.20 31.11 8.68 7.34
Closed 0.59 0.73 1.14 30.46 8.16 12.08 2.10 23.07 13.77 7.89
A.5a
Overall number of () tokens according to offglide duration and syllable type
Full Short aa Total
Open 596 98 55 749
Closed 1468 552 173 2193
Total 2064 650 228 2942
A.5b
Overall percentage of () variants according to offglide duration and syllable type
Full Short aa
Open 79.57 13.08 7.34
Closed 66.94 25.17 7.89
322
A.6a
Number of () tokens according to age, syllable type and offglide duration
Full Short aa Total
Young
Open 124 39 43 206
Closed 243 146 135 524
Old
Open 415 56 12 483
Closed 1035 341 37 1413
Museum
Open 57 3 0 60
Closed 190 65 1 256
A.6b
Percentage of () variants according to age, syllable type and offglide duration
Full Short aa
Young
Open 60.19 18.93 20.87
Closed 46.37 27.86 25.76
Old
Open 85.92 11.59 2.48
Closed 73.25 24.13 2.62
Museum
Open 95.00 5.00 0.00
Closed 74.22 25.39 0.39
323
A.7a
Overall number of () tokens according to preceding manner of articulation
Total
Stop 29 19 461 153 308 79 1049
Fricative 1 173 99 274 34 581
Nasal 5 144 88 173 33 443
Approximant 58 29 159 26 272
/sk/ 2 2 4
Vowel 1 1
None 5 265 76 190 56 592
A.7b
Overall percentage of () variants according to preceding manner of articulation
Stop 2.76 1.81 43.95 14.59 29.36 7.53
Fricative 0.17 29.78 17.04 47.16 5.85
Nasal 1.13 32.51 19.86 39.05 7.45
Approximant 21.32 10.66 58.46 9.56
/sk/ 50.00 50.00
Vowel 100
None 0.84 44.76 12.84 32.09 9.46
A.8a
Overall number of () tokens according to preceding place of articulation
Total
Labial 1 15 246 66 186 59 573
Coronal 31 4 441 207 476 93 1252
Dorsal 2 14 11 39 3 69
/h/ 1 135 85 213 17 451
None 5 265 76 190 56 592
A.8b
Overall percentage of () variants according to preceding place of articulation
Labial 0.17 2.62 42.93 11.52 32.46 10.30
Coronal 2.48 0.32 35.22 16.53 38.02 7.43
Dorsal 2.90 20.29 15.94 56.52 4.35
/h/ 0.22 29.93 18.85 47.23 3.77
None 0.84 44.76 12.84 32.09 9.46
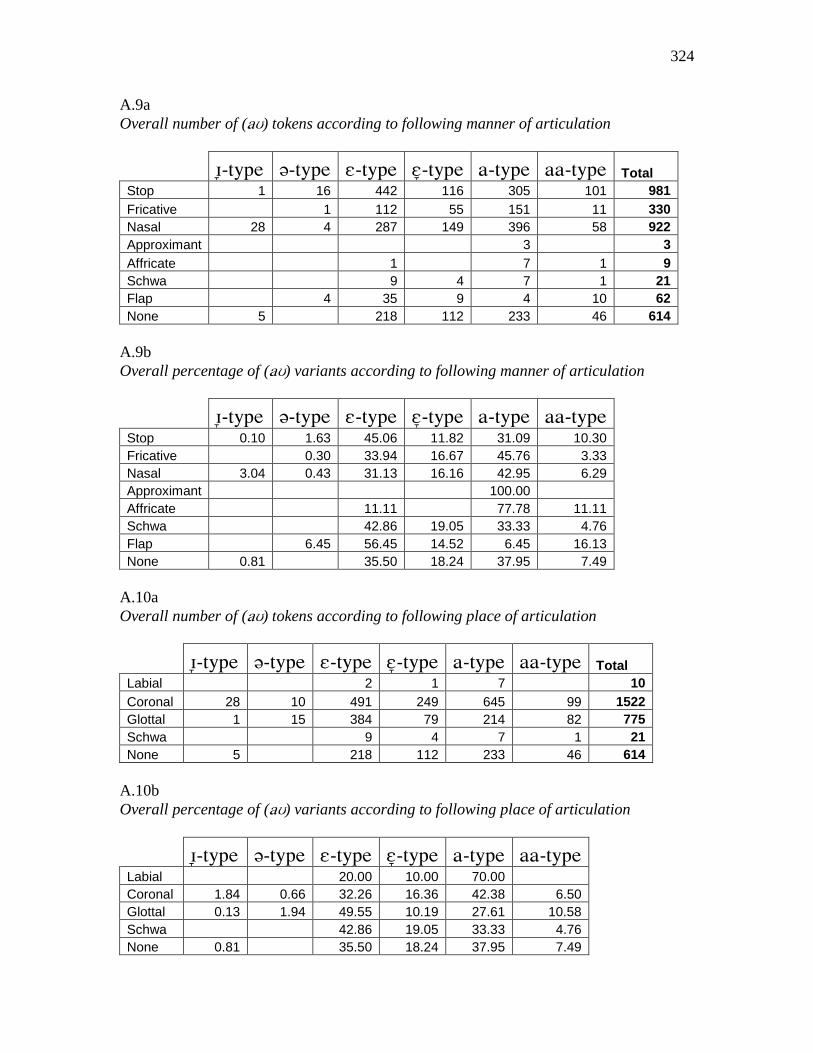
324
A.9a
Overall number of () tokens according to following manner of articulation
Total
Stop 1 16 442 116 305 101 981
Fricative 1 112 55 151 11 330
Nasal 28 4 287 149 396 58 922
Approximant 3 3
Affricate 1 7 1 9
Schwa 9 4 7 1 21
Flap 4 35 9 4 10 62
None 5 218 112 233 46 614
A.9b
Overall percentage of () variants according to following manner of articulation
Stop 0.10 1.63 45.06 11.82 31.09 10.30
Fricative 0.30 33.94 16.67 45.76 3.33
Nasal 3.04 0.43 31.13 16.16 42.95 6.29
Approximant 100.00
Affricate 11.11 77.78 11.11
Schwa 42.86 19.05 33.33 4.76
Flap 6.45 56.45 14.52 6.45 16.13
None 0.81 35.50 18.24 37.95 7.49
A.10a
Overall number of () tokens according to following place of articulation
Total
Labial 2 1 7 10
Coronal 28 10 491 249 645 99 1522
Glottal 1 15 384 79 214 82 775
Schwa 9 4 7 1 21
None 5 218 112 233 46 614
A.10b
Overall percentage of () variants according to following place of articulation
Labial 20.00 10.00 70.00
Coronal 1.84 0.66 32.26 16.36 42.38 6.50
Glottal 0.13 1.94 49.55 10.19 27.61 10.58
Schwa 42.86 19.05 33.33 4.76
None 0.81 35.50 18.24 37.95 7.49
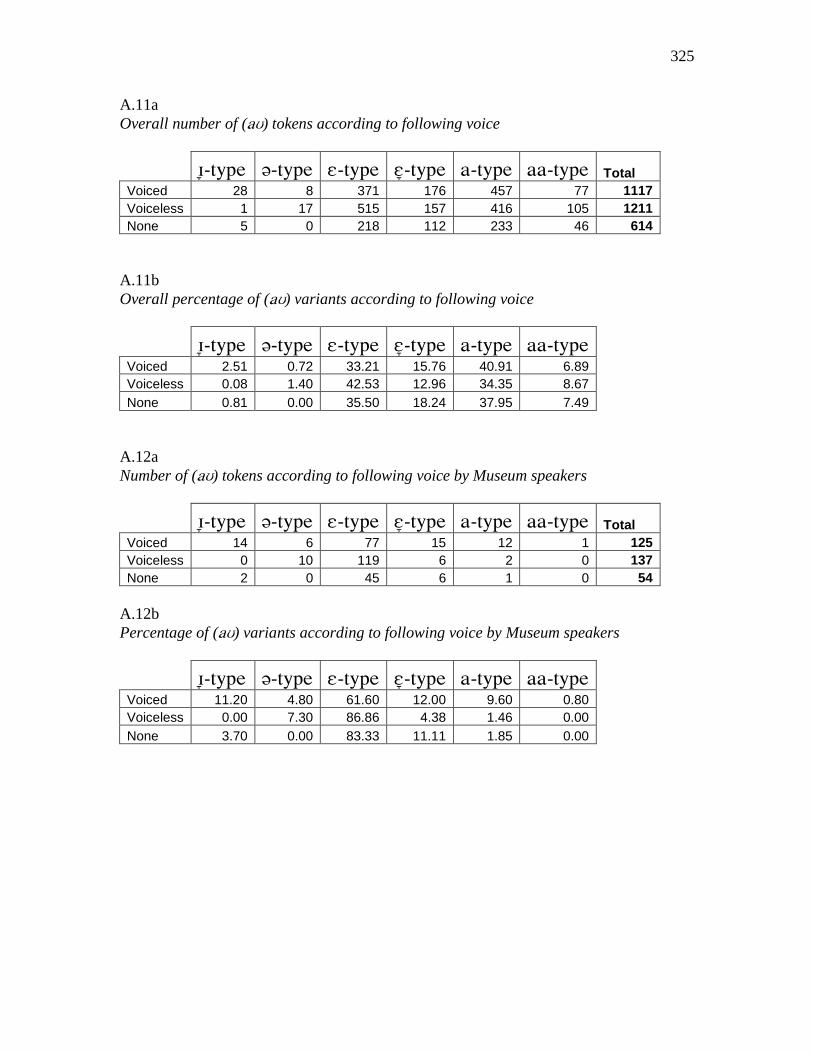
325
A.11a
Overall number of () tokens according to following voice
Total
Voiced 28 8 371 176 457 77 1117
Voiceless 1 17 515 157 416 105 1211
None 5 0 218 112 233 46 614
A.11b
Overall percentage of () variants according to following voice
Voiced 2.51 0.72 33.21 15.76 40.91 6.89
Voiceless 0.08 1.40 42.53 12.96 34.35 8.67
None 0.81 0.00 35.50 18.24 37.95 7.49
A.12a
Number of () tokens according to following voice by Museum speakers
Total
Voiced 14 6 77 15 12 1 125
Voiceless 0 10 119 6 2 0 137
None 2 0 45 6 1 0 54
A.12b
Percentage of () variants according to following voice by Museum speakers
Voiced 11.20 4.80 61.60 12.00 9.60 0.80
Voiceless 0.00 7.30 86.86 4.38 1.46 0.00
None 3.70 0.00 83.33 11.11 1.85 0.00
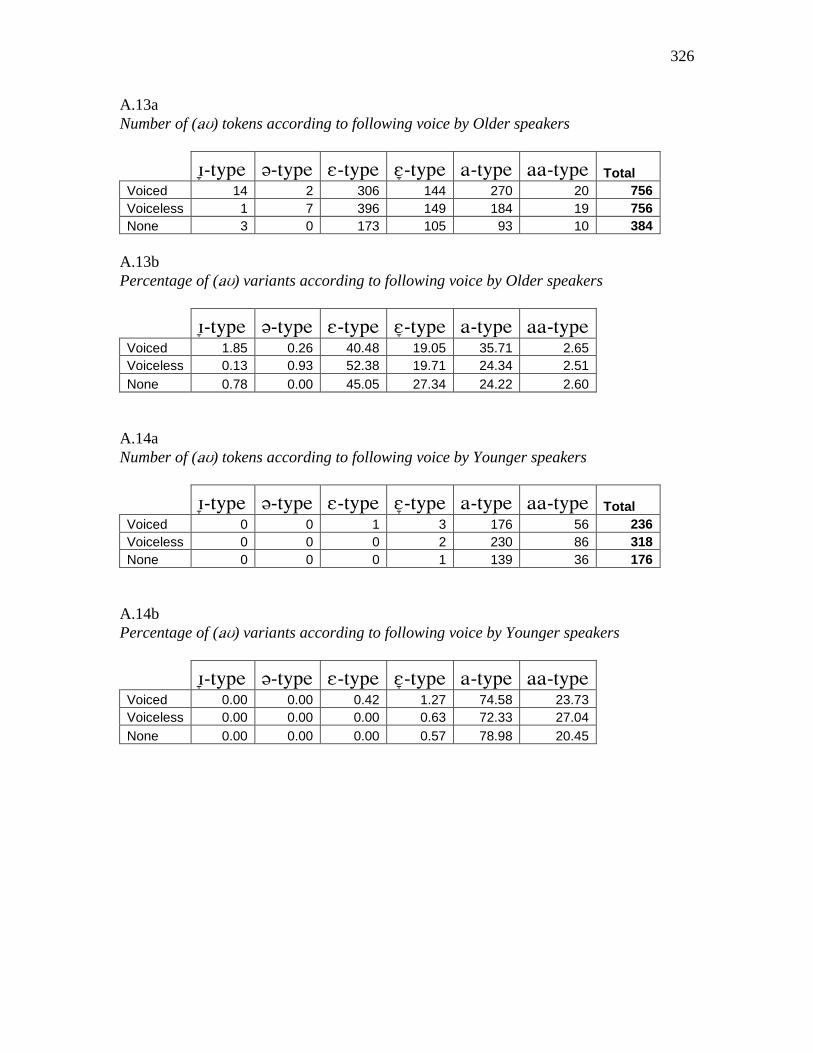
326
A.13a
Number of () tokens according to following voice by Older speakers
Total
Voiced 14 2 306 144 270 20 756
Voiceless 1 7 396 149 184 19 756
None 3 0 173 105 93 10 384
A.13b
Percentage of () variants according to following voice by Older speakers
Voiced 1.85 0.26 40.48 19.05 35.71 2.65
Voiceless 0.13 0.93 52.38 19.71 24.34 2.51
None 0.78 0.00 45.05 27.34 24.22 2.60
A.14a
Number of () tokens according to following voice by Younger speakers
Total
Voiced 0 0 1 3 176 56 236
Voiceless 0 0 0 2 230 86 318
None 0 0 0 1 139 36 176
A.14b
Percentage of () variants according to following voice by Younger speakers
Voiced 0.00 0.00 0.42 1.27 74.58 23.73
Voiceless 0.00 0.00 0.00 0.63 72.33 27.04
None 0.00 0.00 0.00 0.57 78.98 20.45
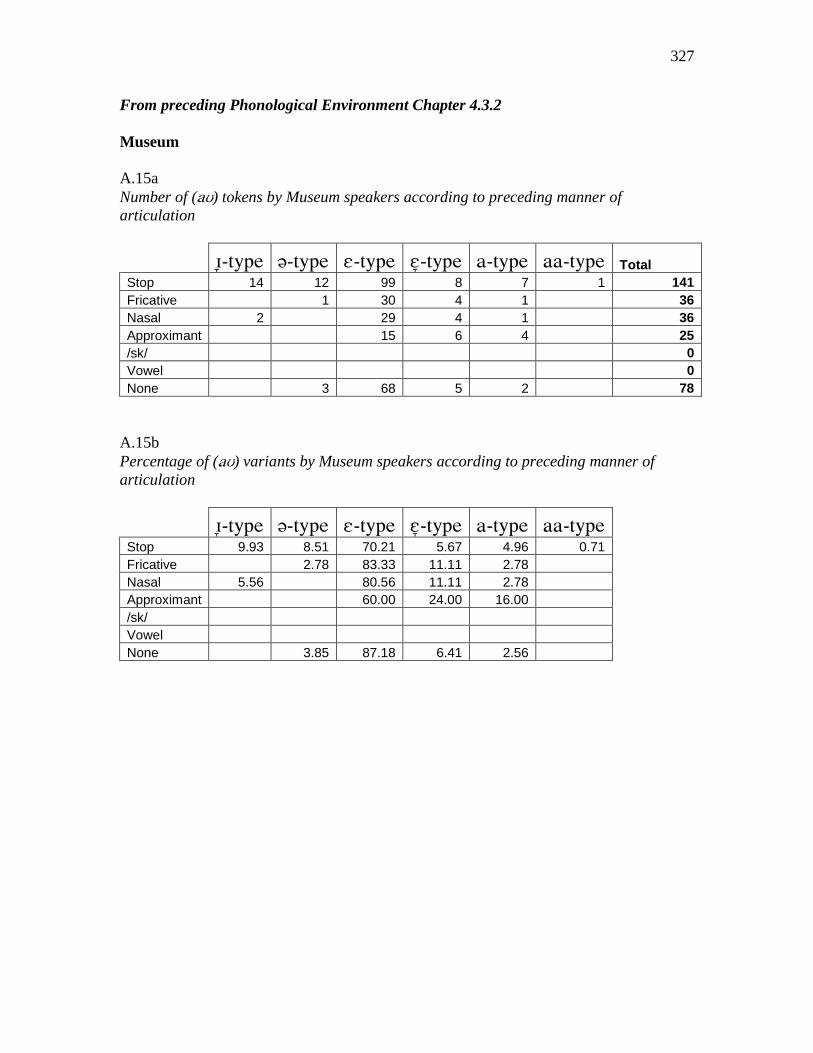
327
From preceding Phonological Environment Chapter 4.3.2
Museum
A.15a
Number of () tokens by Museum speakers according to preceding manner of
articulation
Total
Stop 14 12 99 8 7 1 141
Fricative 1 30 4 1 36
Nasal 2 29 4 1 36
Approximant 15 6 4 25
/sk/ 0
Vowel 0
None 3 68 5 2 78
A.15b
Percentage of () variants by Museum speakers according to preceding manner of
articulation
Stop 9.93 8.51 70.21 5.67 4.96 0.71
Fricative 2.78 83.33 11.11 2.78
Nasal 5.56 80.56 11.11 2.78
Approximant 60.00 24.00 16.00
/sk/
Vowel
None 3.85 87.18 6.41 2.56

328
Old
A.16a
Number of () tokens by Older speakers according to preceding manner of articulation
Total
Stop 15 7 361 141 166 24 714
Fricative 143 93 106 6 348
Nasal 3 115 84 89 7 298
Approximant 43 23 97 5 168
/sk/ 2 2 4
Vowel 1 1
None 2 197 71 86 7 363
A.16.b
Percentage of () variants by Older speakers according to preceding manner of
articulation
Stop 2.10 0.98 50.56 19.75 23.25 3.36
Fricative 41.09 26.72 30.46 1.72
Nasal 1.01 38.59 28.19 29.87 2.35
Approximant 25.60 13.69 57.74 2.98
/sk/ 50.00 50.00
Vowel 100.00
None 0.55 54.27 19.56 23.69 1.93

329
Young
A.17a
Number of () tokens by Younger speakers according to preceding manner of
articulation
Total
Stop 1 4 135 54 194
Fricative 2 167 28 197
Nasal 83 26 109
Approximant 58 21 79
/sk/ 0
Vowel 0
None 102 49 151
A.17b
Percentage of () variants by Younger speakers according to preceding manner of
articulation
Stop 0.52 2.06 69.59 27.84
Fricative 1.02 84.77 14.21
Nasal 76.15 23.85
Approximant 73.42 26.58
/sk/
Vowel
None 67.55 32.45

330
Museum
A.18a
Number of () tokens by Museum speakers according to preceding place of articulation
Total
Labial 9 63 5 3 80
Coronal 14 3 84 12 7 120
Dorsal 2 4 2 3 1 12
/h/ 1 22 3 26
None 3 68 5 2 78
A.18b
Percentage of () variants by Museum speakers according to preceding place of
articulation
Labial 11.25 78.75 6.25 3.75
Coronal 11.67 2.50 70.00 10.00 5.83
Dorsal 16.67 33.33 16.67 25.00 8.33
/h/ 3.85 84.62 11.54
None 3.85 87.18 6.41 2.56
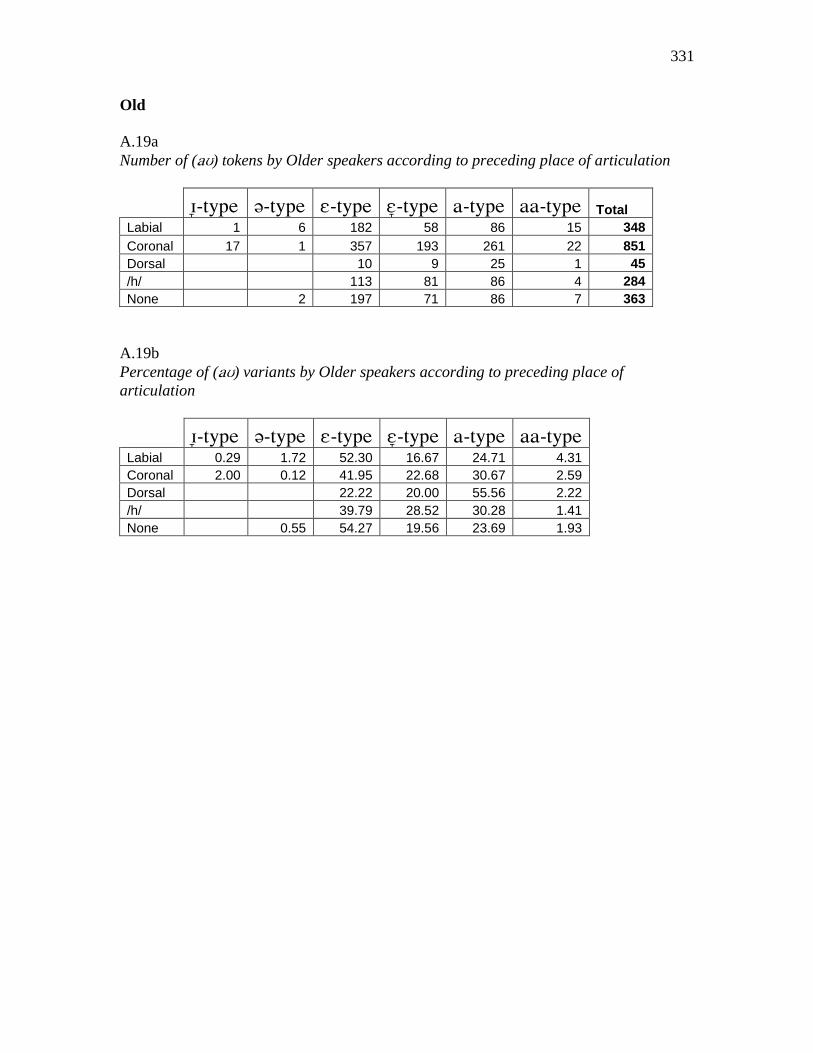
331
Old
A.19a
Number of () tokens by Older speakers according to preceding place of articulation
Total
Labial 1 6 182 58 86 15 348
Coronal 17 1 357 193 261 22 851
Dorsal 10 9 25 1 45
/h/ 113 81 86 4 284
None 2 197 71 86 7 363
A.19b
Percentage of () variants by Older speakers according to preceding place of
articulation
Labial 0.29 1.72 52.30 16.67 24.71 4.31
Coronal 2.00 0.12 41.95 22.68 30.67 2.59
Dorsal 22.22 20.00 55.56 2.22
/h/ 39.79 28.52 30.28 1.41
None 0.55 54.27 19.56 23.69 1.93

332
Young
A.20a
Number of () tokens by Younger speakers according to preceding place of articulation
Total
Labial 1 3 97 44 145
Coronal 2 208 71 281
Dorsal 11 1 12
/h/ 1 127 13 141
None 102 49 151
A.20b
Percentage of () variants by Younger speakers according to preceding place of
articulation
Labial 0.69 2.07 66.90 30.34
Coronal 0.71 74.02 25.27
Dorsal 91.67 8.33
/h/ 0.71 90.07 9.22
None 67.55 32.45
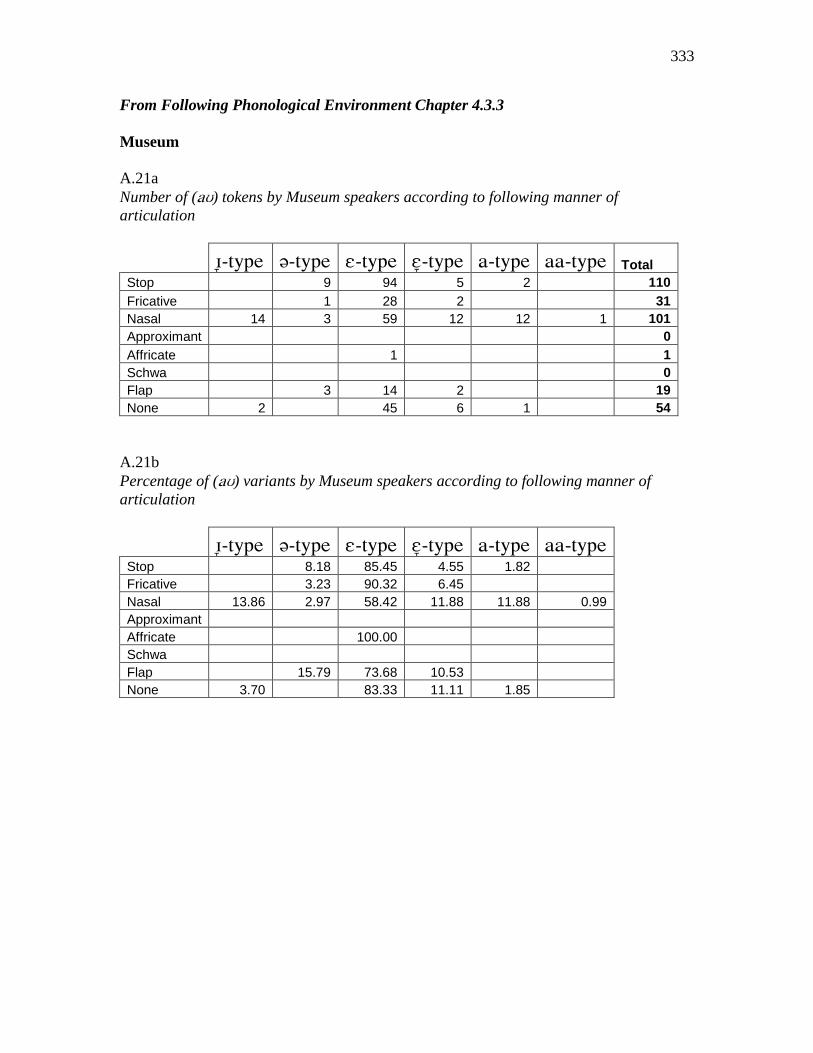
333
From Following Phonological Environment Chapter 4.3.3
Museum
A.21a
Number of () tokens by Museum speakers according to following manner of
articulation
Total
Stop 9 94 5 2 110
Fricative 1 28 2 31
Nasal 14 3 59 12 12 1 101
Approximant 0
Affricate 1 1
Schwa 0
Flap 3 14 2 19
None 2 45 6 1 54
A.21b
Percentage of () variants by Museum speakers according to following manner of
articulation
Stop 8.18 85.45 4.55 1.82
Fricative 3.23 90.32 6.45
Nasal 13.86 2.97 58.42 11.88 11.88 0.99
Approximant
Affricate 100.00
Schwa
Flap 15.79 73.68 10.53
None 3.70 83.33 11.11 1.85
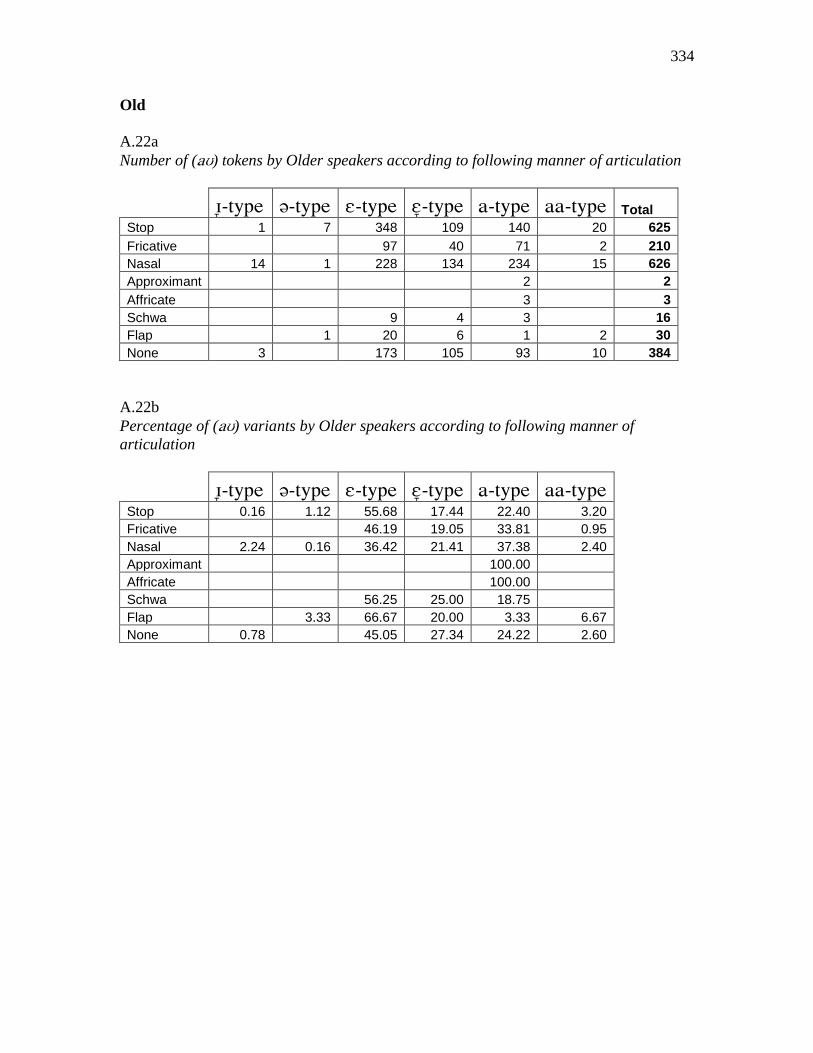
334
Old
A.22a
Number of () tokens by Older speakers according to following manner of articulation
Total
Stop 1 7 348 109 140 20 625
Fricative 97 40 71 2 210
Nasal 14 1 228 134 234 15 626
Approximant 2 2
Affricate 3 3
Schwa 9 4 3 16
Flap 1 20 6 1 2 30
None 3 173 105 93 10 384
A.22b
Percentage of () variants by Older speakers according to following manner of
articulation
Stop 0.16 1.12 55.68 17.44 22.40 3.20
Fricative 46.19 19.05 33.81 0.95
Nasal 2.24 0.16 36.42 21.41 37.38 2.40
Approximant 100.00
Affricate 100.00
Schwa 56.25 25.00 18.75
Flap 3.33 66.67 20.00 3.33 6.67
None 0.78 45.05 27.34 24.22 2.60

335
Young
A.23a
Number of () tokens by Younger speakers according to following manner of
articulation
Total
Stop 2 163 81 246
Fricative 80 9 89
Nasal 2 151 42 195
Approximant 1 1
Affricate 4 1 5
Schwa 4 1 5
Flap 1 1 3 8 13
None 1 139 36 176
A.23b
Percentage of () variants by Younger speakers according to following manner of
articulation
Stop 0.81 66.26 32.93
Fricative 89.89 10.11
Nasal 1.03 77.44 21.54
Approximant 100.00
Affricate 80.00 20.00
Schwa 80.00 20.00
Flap 7.69 7.69 23.08 61.54
None 0.57 78.98 20.45

336
Museum
A.24a
Number of () tokens by Museum speakers according to following place of articulation
Total
Labial 2 2
Coronal 14 7 109 17 13 1 161
Glottal 9 85 4 1 99
Schwa 0
None 2 45 6 1 54
A.24b
Percentage of () variants by Museum speakers according to following place of
articulation
Labial 100.00
Coronal 8.70 4.35 67.70 10.56 8.07 0.62
Glottal 9.09 85.86 4.04 1.01
Schwa
None 3.70 83.33 11.11 1.85
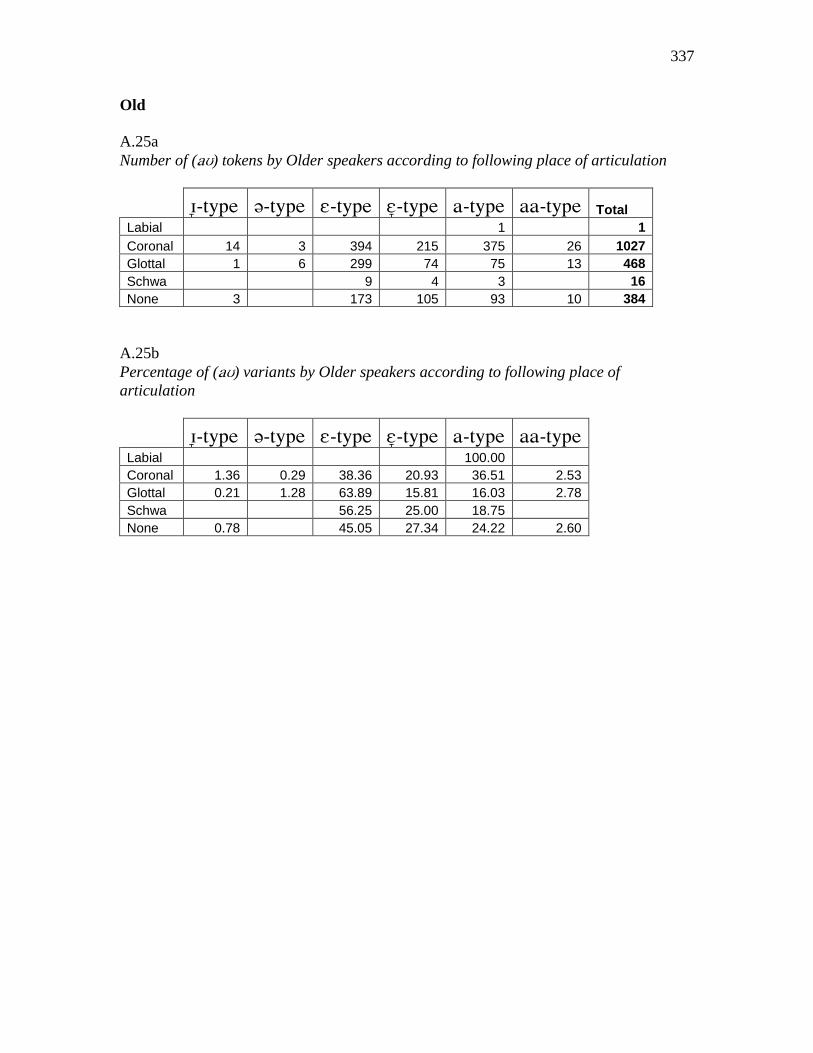
337
Old
A.25a
Number of () tokens by Older speakers according to following place of articulation
Total
Labial 1 1
Coronal 14 3 394 215 375 26 1027
Glottal 1 6 299 74 75 13 468
Schwa 9 4 3 16
None 3 173 105 93 10 384
A.25b
Percentage of () variants by Older speakers according to following place of
articulation
Labial 100.00
Coronal 1.36 0.29 38.36 20.93 36.51 2.53
Glottal 0.21 1.28 63.89 15.81 16.03 2.78
Schwa 56.25 25.00 18.75
None 0.78 45.05 27.34 24.22 2.60

338
Young
A.26a
Number of () tokens by Younger speakers according to following place of articulation
Total
Labial 7 7
Coronal 1 4 257 72 334
Glottal 1 138 69 208
Schwa 4 1 5
None 1 139 36 176
A.26b
Percentage of () variants by Younger speakers according to following place of
articulation
Labial 100.00
Coronal 0.30 1.20 76.95 21.56
Glottal 0.48 66.35 33.17
Schwa 80.00 20.00
None 0.57 78.98 20.45

339
Appendix B

340
Appendix B
In this appendix, you will find the complete numerical data sets pertaining to the analysis
of the variable () (see Chapter 6).
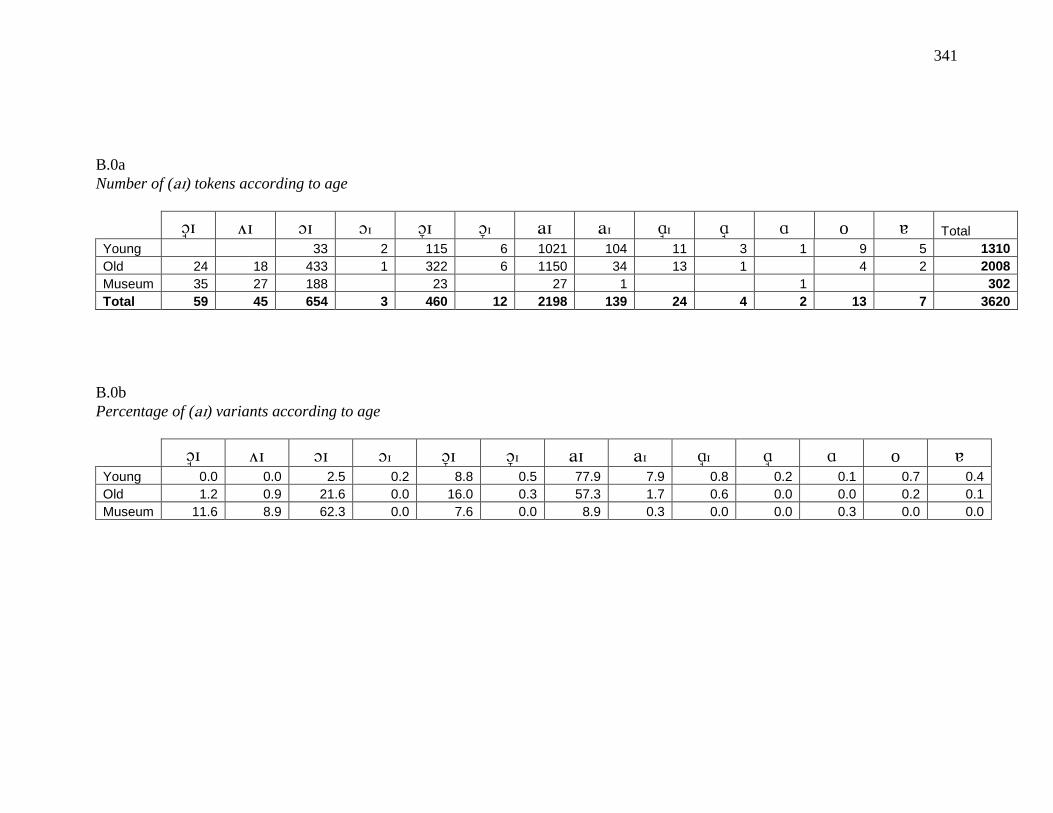
341
B.0a
Number of () tokens according to age
o Total
Young 33 2 115 6 1021 104 11 3 1 9 5 1310
Old 24 18 433 1 322 6 1150 34 13 1 4 2 2008
Museum 35 27 188 23 27 1 1 302
Total 59 45 654 3 460 12 2198 139 24 4 2 13 7 3620
B.0b
Percentage of () variants according to age
o Young 0.0 0.0 2.5 0.2 8.8 0.5 77.9 7.9 0.8 0.2 0.1 0.7 0.4
Old 1.2 0.9 21.6 0.0 16.0 0.3 57.3 1.7 0.6 0.0 0.0 0.2 0.1
Museum 11.6 8.9 62.3 0.0 7.6 0.0 8.9 0.3 0.0 0.0 0.3 0.0 0.0

342
B.1
Number of () tokens according to diphthong type and age
Total
Young 0 0 35 121 1125 11 4 14 1310
Old 24 18 434 328 1184 13 1 6 2008
Museum 35 27 188 23 28 0 1 0 302
Total 59 45 657 472 2337 24 6 20 3620
B.2a
Number of () tokens according to age and gender
Total
Young
Male 0 0 19 91 505 9 2 14 640
Female 0 0 16 30 620 2 2 0 670
Old
Male 21 11 371 185 435 0 0 5 1028
Female 3 7 63 143 749 13 1 1 980
Museum
Male 35 27 188 23 28 0 1 0 302
B.2b
Percentage of () variants according to age and gender
Young
Male 0.0 0.0 3.0 14.2 78.9 1.4 0.3 2.2
Female 0.0 0.0 2.4 4.5 92.5 0.3 0.3 0.0
Old
Male 2.0 1.1 36.1 18.0 42.3 0.0 0.0 0.5
Female 0.3 0.7 6.4 14.6 76.4 1.3 0.1 0.1
Museum
Male 11.6 8.9 62.3 7.6 9.3 0.0 0.3 0.0
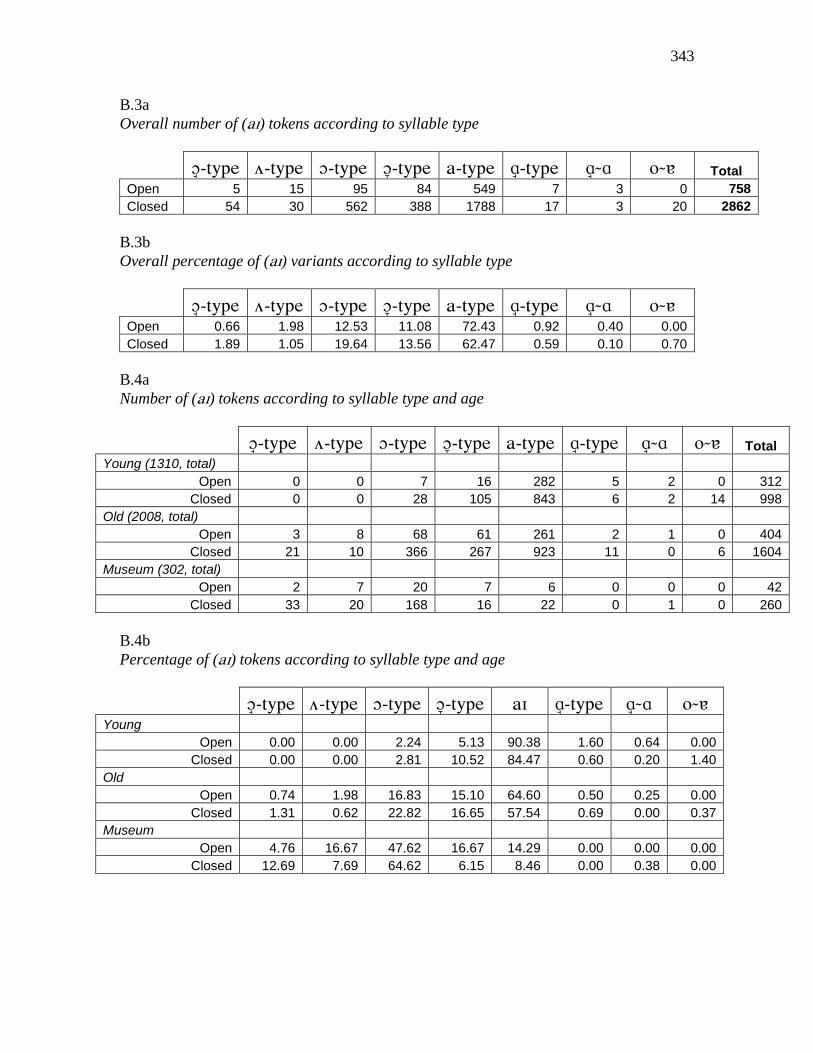
343
B.3a
Overall number of () tokens according to syllable type
Total
Open 5 15 95 84 549 7 3 0 758
Closed 54 30 562 388 1788 17 3 20 2862
B.3b
Overall percentage of () variants according to syllable type
Open 0.66 1.98 12.53 11.08 72.43 0.92 0.40 0.00
Closed 1.89 1.05 19.64 13.56 62.47 0.59 0.10 0.70
B.4a
Number of () tokens according to syllable type and age
Total
Young (1310, total)
Open 0 0 7 16 282 5 2 0 312
Closed 0 0 28 105 843 6 2 14 998
Old (2008, total)
Open 3 8 68 61 261 2 1 0 404
Closed 21 10 366 267 923 11 0 6 1604
Museum (302, total)
Open 2 7 20 7 6 0 0 0 42
Closed 33 20 168 16 22 0 1 0 260
B.4b
Percentage of () tokens according to syllable type and age
Young
Open 0.00 0.00 2.24 5.13 90.38 1.60 0.64 0.00
Closed 0.00 0.00 2.81 10.52 84.47 0.60 0.20 1.40
Old
Open 0.74 1.98 16.83 15.10 64.60 0.50 0.25 0.00
Closed 1.31 0.62 22.82 16.65 57.54 0.69 0.00 0.37
Museum
Open 4.76 16.67 47.62 16.67 14.29 0.00 0.00 0.00
Closed 12.69 7.69 64.62 6.15 8.46 0.00 0.38 0.00
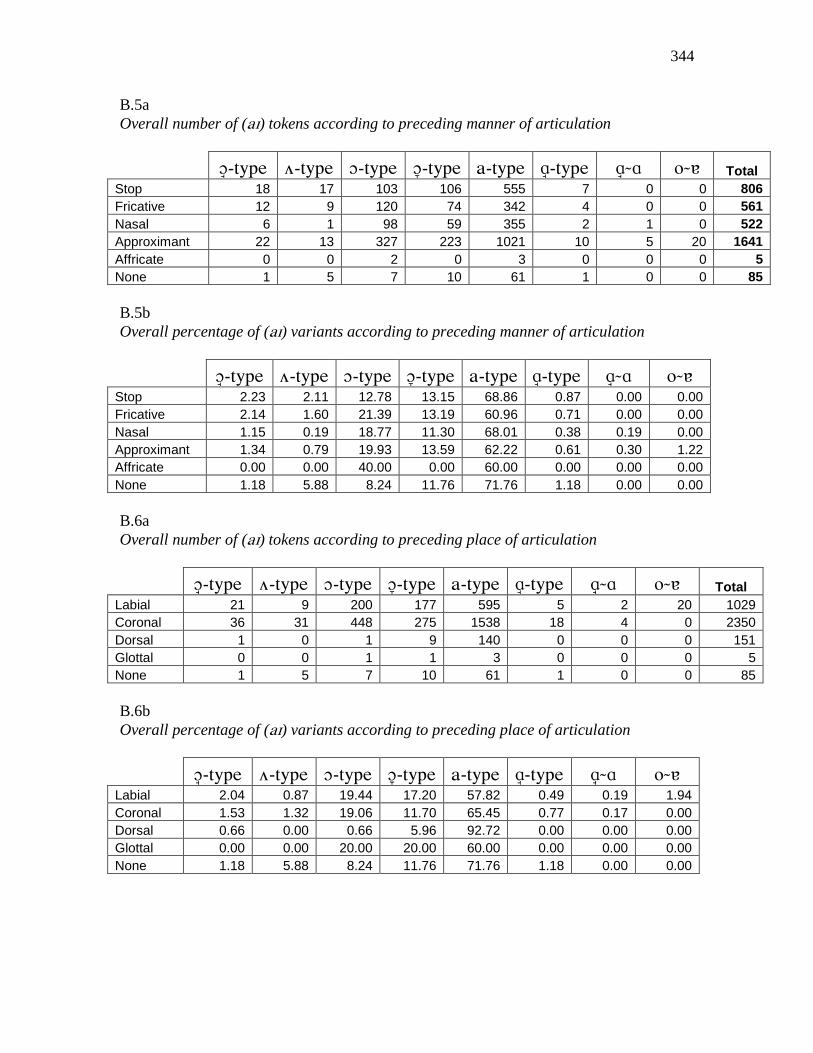
344
B.5a
Overall number of () tokens according to preceding manner of articulation
Total
Stop 18 17 103 106 555 7 0 0 806
Fricative 12 9 120 74 342 4 0 0 561
Nasal 6 1 98 59 355 2 1 0 522
Approximant 22 13 327 223 1021 10 5 20 1641
Affricate 0 0 2 0 3 0 0 0 5
None 1 5 7 10 61 1 0 0 85
B.5b
Overall percentage of () variants according to preceding manner of articulation
Stop 2.23 2.11 12.78 13.15 68.86 0.87 0.00 0.00
Fricative 2.14 1.60 21.39 13.19 60.96 0.71 0.00 0.00
Nasal 1.15 0.19 18.77 11.30 68.01 0.38 0.19 0.00
Approximant 1.34 0.79 19.93 13.59 62.22 0.61 0.30 1.22
Affricate 0.00 0.00 40.00 0.00 60.00 0.00 0.00 0.00
None 1.18 5.88 8.24 11.76 71.76 1.18 0.00 0.00
B.6a
Overall number of () tokens according to preceding place of articulation
Total
Labial 21 9 200 177 595 5 2 20 1029
Coronal 36 31 448 275 1538 18 4 0 2350
Dorsal 1 0 1 9 140 0 0 0 151
Glottal 0 0 1 1 3 0 0 0 5
None 1 5 7 10 61 1 0 0 85
B.6b
Overall percentage of () variants according to preceding place of articulation
Labial 2.04 0.87 19.44 17.20 57.82 0.49 0.19 1.94
Coronal 1.53 1.32 19.06 11.70 65.45 0.77 0.17 0.00
Dorsal 0.66 0.00 0.66 5.96 92.72 0.00 0.00 0.00
Glottal 0.00 0.00 20.00 20.00 60.00 0.00 0.00 0.00
None 1.18 5.88 8.24 11.76 71.76 1.18 0.00 0.00

345
B.7a
Overall number of () tokens according to following voice
Total
Voiced 37 28 288 228 1138 17 5 0 1741
Voiceless 19 12 327 210 990 7 1 20 1586
None 3 5 42 34 209 0 0 0 293
B.7b
Overall percentage of () variants according to following voice
Voiced 2.13 1.61 16.54 13.10 65.36 0.98 0.29 0.00
Voiceless 1.20 0.76 20.62 13.24 62.42 0.44 0.06 1.26
None 1.02 1.71 14.33 11.60 71.33 0.00 0.00 0.00
B.8a
Number of () tokens according to following voice by Museum speakers
Total
Voiced 17 17 99 19 18 0 1 0 171
Voiceless 17 8 80 2 8 0 0 0 115
None 1 2 9 2 2 0 0 0 16
B.8b
Percentage of () variants according to following voice by Museum speakers
Voiced 9.94 9.94 57.89 11.11 10.53 0.00 0.58 0.00
Voiceless 14.78 6.96 69.57 1.74 6.96 0.00 0.00 0.00
None 6.25 12.50 56.25 12.50 12.50 0.00 0.00 0.00

346
B.9a
Number of () tokens according to following voice by Older speakers
Total
Voiced 20 11 180 154 596 8 1 0 970
Voiceless 2 4 225 149 508 5 0 6 899
None 2 3 29 25 80 0 0 0 139
B.9b
Percentage of () variants according to following voice by Older speakers
Voiced 2.06 1.13 18.56 15.88 61.44 0.82 0.10 0.00
Voiceless 0.22 0.44 25.03 16.57 56.51 0.56 0.00 0.67
None 1.44 2.16 20.86 17.99 57.55 0.00 0.00 0.00
B.10a
Number of () tokens according to following voice by Younger speakers
Total
Voiced 0 0 9 55 524 9 3 0 600
Voiceless 0 0 22 59 474 2 1 14 572
None 0 0 4 7 127 0 0 0 138
B.10b
Percentage of () variants according to following voice by Younger speakers
Voiced 0.00 0.00 1.50 9.17 87.33 1.50 0.50 0.00
Voiceless 0.00 0.00 3.85 10.31 82.87 0.35 0.17 2.45
None 0.00 0.00 2.90 5.07 92.03 0.00 0.00 0.00
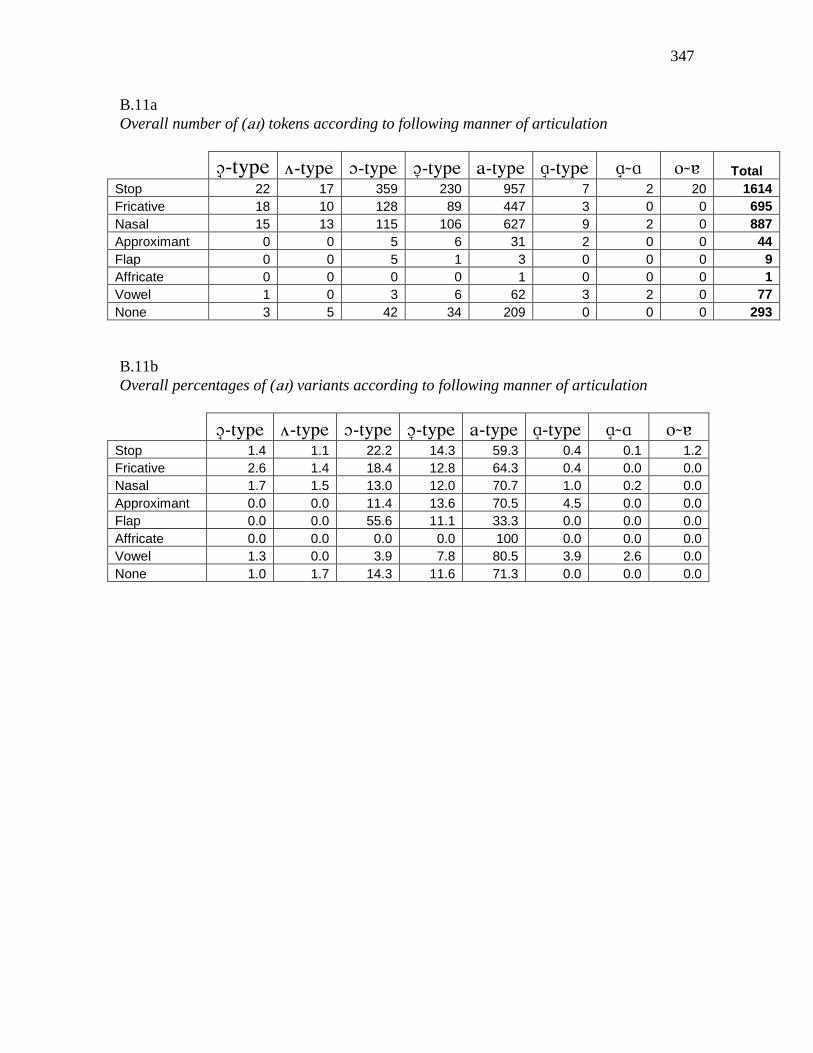
347
B.11a
Overall number of () tokens according to following manner of articulation
Total
Stop 22 17 359 230 957 7 2 20 1614
Fricative 18 10 128 89 447 3 0 0 695
Nasal 15 13 115 106 627 9 2 0 887
Approximant 0 0 5 6 31 2 0 0 44
Flap 0 0 5 1 3 0 0 0 9
Affricate 0 0 0 0 1 0 0 0 1
Vowel 1 0 3 6 62 3 2 0 77
None 3 5 42 34 209 0 0 0 293
B.11b
Overall percentages of () variants according to following manner of articulation
Stop 1.4 1.1 22.2 14.3 59.3 0.4 0.1 1.2
Fricative 2.6 1.4 18.4 12.8 64.3 0.4 0.0 0.0
Nasal 1.7 1.5 13.0 12.0 70.7 1.0 0.2 0.0
Approximant 0.0 0.0 11.4 13.6 70.5 4.5 0.0 0.0
Flap 0.0 0.0 55.6 11.1 33.3 0.0 0.0 0.0
Affricate 0.0 0.0 0.0 0.0 100 0.0 0.0 0.0
Vowel 1.3 0.0 3.9 7.8 80.5 3.9 2.6 0.0
None 1.0 1.7 14.3 11.6 71.3 0.0 0.0 0.0
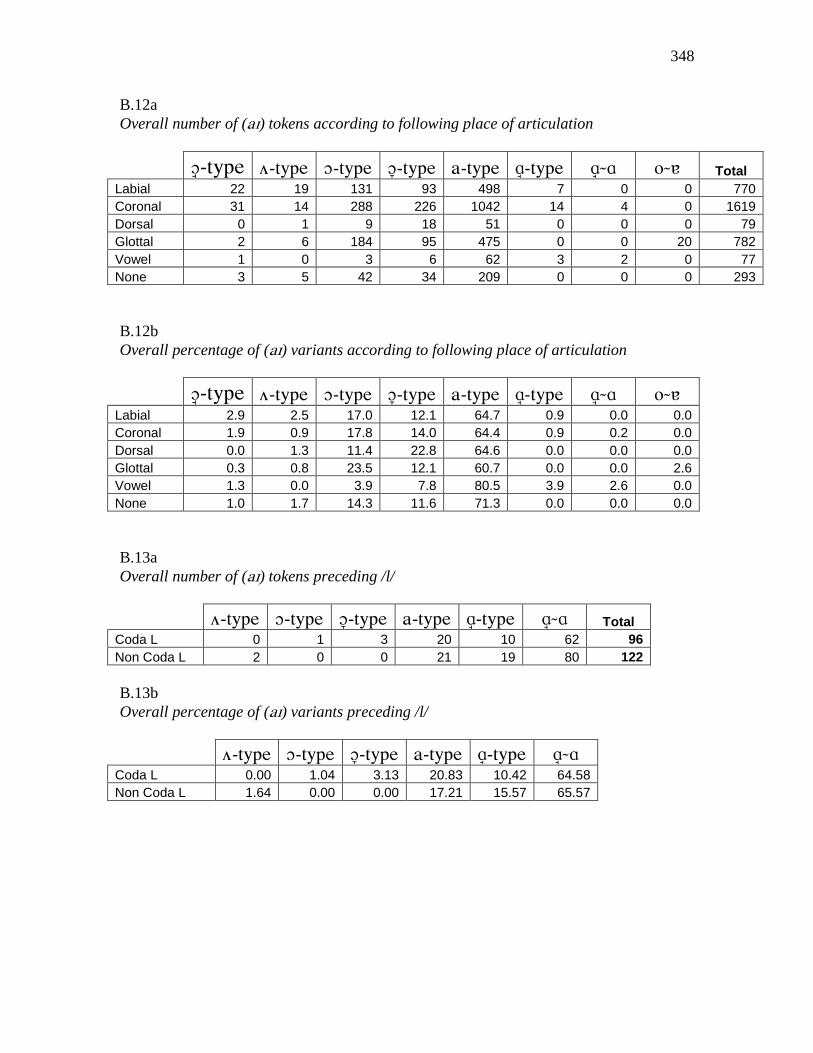
348
B.12a
Overall number of () tokens according to following place of articulation
Total
Labial 22 19 131 93 498 7 0 0 770
Coronal 31 14 288 226 1042 14 4 0 1619
Dorsal 0 1 9 18 51 0 0 0 79
Glottal 2 6 184 95 475 0 0 20 782
Vowel 1 0 3 6 62 3 2 0 77
None 3 5 42 34 209 0 0 0 293
B.12b
Overall percentage of () variants according to following place of articulation
Labial 2.9 2.5 17.0 12.1 64.7 0.9 0.0 0.0
Coronal 1.9 0.9 17.8 14.0 64.4 0.9 0.2 0.0
Dorsal 0.0 1.3 11.4 22.8 64.6 0.0 0.0 0.0
Glottal 0.3 0.8 23.5 12.1 60.7 0.0 0.0 2.6
Vowel 1.3 0.0 3.9 7.8 80.5 3.9 2.6 0.0
None 1.0 1.7 14.3 11.6 71.3 0.0 0.0 0.0
B.13a
Overall number of () tokens preceding /l/
Total
Coda L 0 1 3 20 10 62 96
Non Coda L 2 0 0 21 19 80 122
B.13b
Overall percentage of () variants preceding /l/
Coda L 0.00 1.04 3.13 20.83 10.42 64.58
Non Coda L 1.64 0.00 0.00 17.21 15.57 65.57
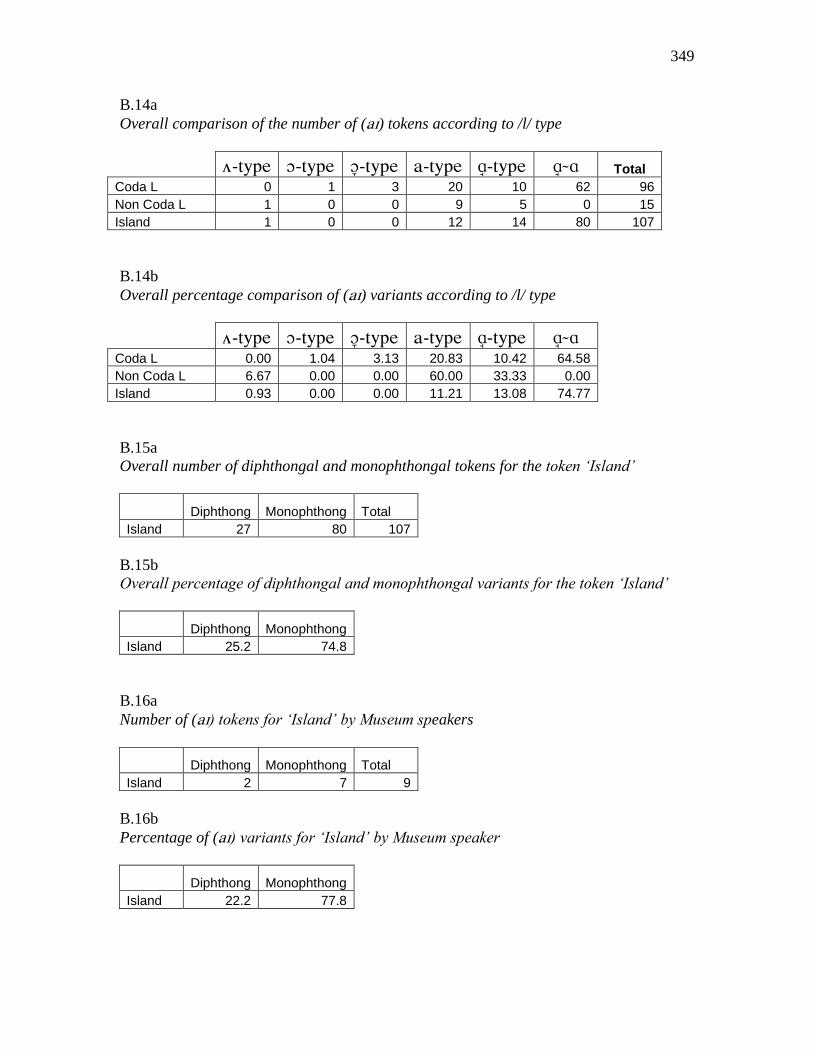
349
B.14a
Overall comparison of the number of () tokens according to /l/ type
Total
Coda L 0 1 3 20 10 62 96
Non Coda L 1 0 0 9 5 0 15
Island 1 0 0 12 14 80 107
B.14b
Overall percentage comparison of () variants according to /l/ type
Coda L 0.00 1.04 3.13 20.83 10.42 64.58
Non Coda L 6.67 0.00 0.00 60.00 33.33 0.00
Island 0.93 0.00 0.00 11.21 13.08 74.77
B.15a
Overall number of diphthongal and monophthongal tokens for the token ‘Island’
Diphthong Monophthong Total
Island 27 80 107
B.15b
Overall percentage of diphthongal and monophthongal variants for the token ‘Island’
Diphthong Monophthong
Island 25.2 74.8
B.16a
Number of () tokens for ‘Island’ by Museum speakers
Diphthong Monophthong Total
Island 2 7 9
B.16b
Percentage of () variants for ‘Island’ by Museum speaker
Diphthong Monophthong
Island 22.2 77.8
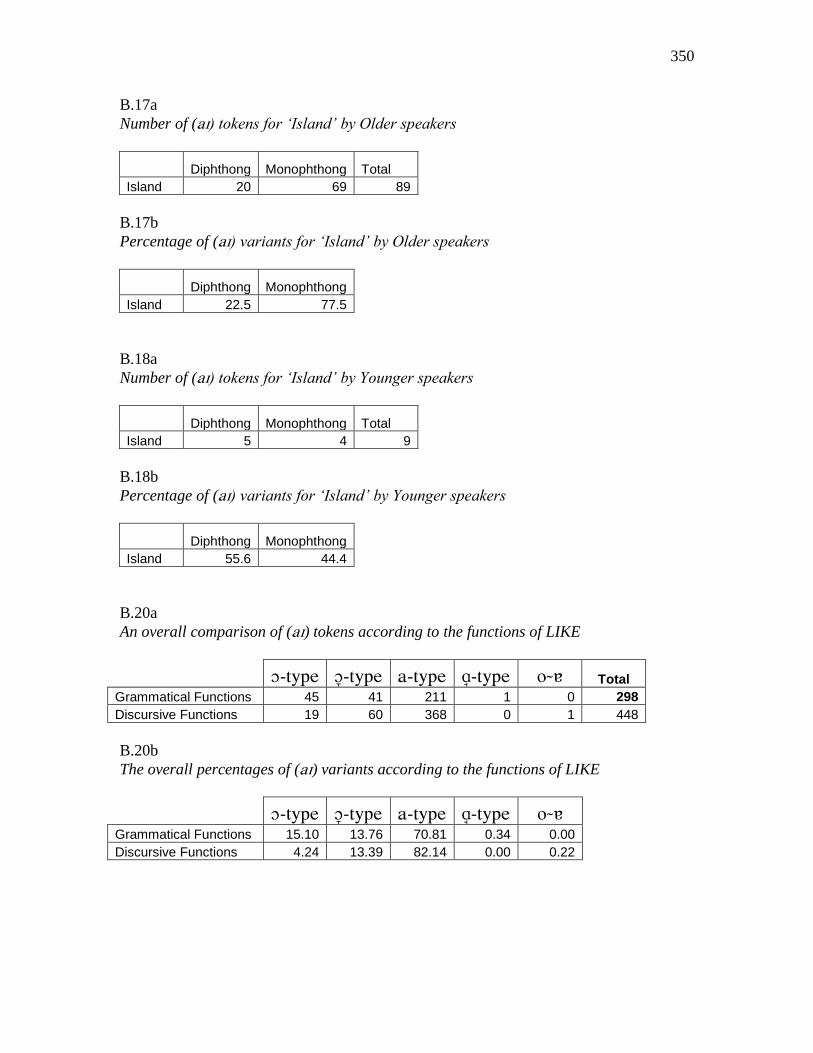
350
B.17a
Number of () tokens for ‘Island’ by Older speakers
Diphthong Monophthong Total
Island 20 69 89
B.17b
Percentage of () variants for ‘Island’ by Older speakers
Diphthong Monophthong
Island 22.5 77.5
B.18a
Number of () tokens for ‘Island’ by Younger speakers
Diphthong Monophthong Total
Island 5 4 9
B.18b
Percentage of () variants for ‘Island’ by Younger speakers
Diphthong Monophthong
Island 55.6 44.4
B.20a
An overall comparison of () tokens according to the functions of LIKE
Total
Grammatical Functions 45 41 211 1 0 298
Discursive Functions 19 60 368 0 1 448
B.20b
The overall percentages of () variants according to the functions of LIKE
Grammatical Functions 15.10 13.76 70.81 0.34 0.00
Discursive Functions 4.24 13.39 82.14 0.00 0.22
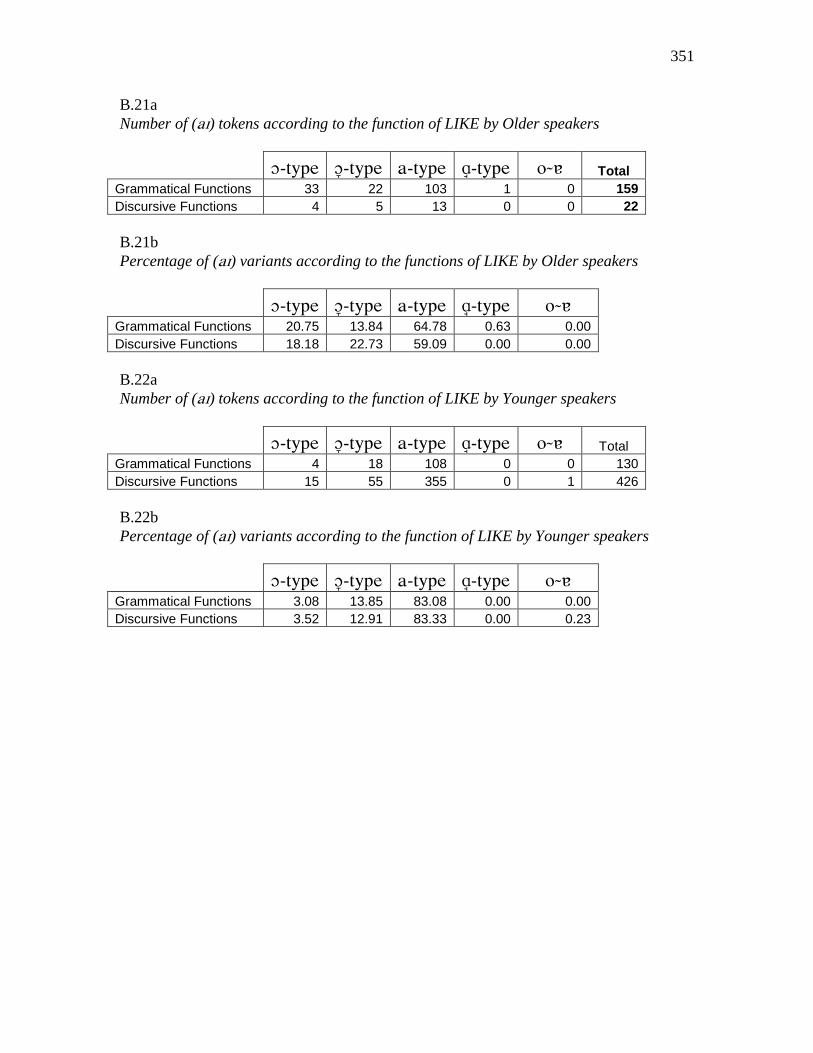
351
B.21a
Number of () tokens according to the function of LIKE by Older speakers
Total
Grammatical Functions 33 22 103 1 0 159
Discursive Functions 4 5 13 0 0 22
B.21b
Percentage of () variants according to the functions of LIKE by Older speakers
Grammatical Functions 20.75 13.84 64.78 0.63 0.00
Discursive Functions 18.18 22.73 59.09 0.00 0.00
B.22a
Number of () tokens according to the function of LIKE by Younger speakers
Total
Grammatical Functions 4 18 108 0 0 130
Discursive Functions 15 55 355 0 1 426
B.22b
Percentage of () variants according to the function of LIKE by Younger speakers
Grammatical Functions 3.08 13.85 83.08 0.00 0.00
Discursive Functions 3.52 12.91 83.33 0.00 0.23
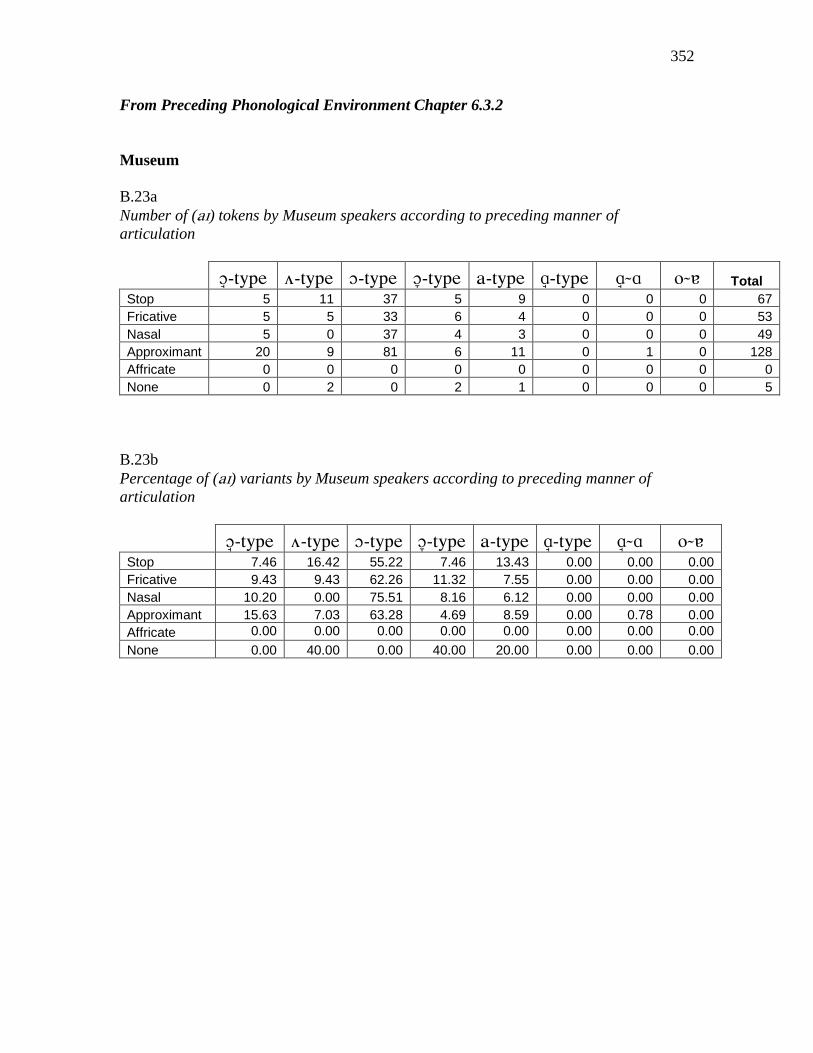
352
From Preceding Phonological Environment Chapter 6.3.2
Museum
B.23a
Number of () tokens by Museum speakers according to preceding manner of
articulation
Total
Stop 5 11 37 5 9 0 0 0 67
Fricative 5 5 33 6 4 0 0 0 53
Nasal 5 0 37 4 3 0 0 0 49
Approximant 20 9 81 6 11 0 1 0 128
Affricate 0 0 0 0 0 0 0 0 0
None 0 2 0 2 1 0 0 0 5
B.23b
Percentage of () variants by Museum speakers according to preceding manner of
articulation
Stop 7.46 16.42 55.22 7.46 13.43 0.00 0.00 0.00
Fricative 9.43 9.43 62.26 11.32 7.55 0.00 0.00 0.00
Nasal 10.20 0.00 75.51 8.16 6.12 0.00 0.00 0.00
Approximant 15.63 7.03 63.28 4.69 8.59 0.00 0.78 0.00
Affricate 0.00 0.00 0.00 0.00 0.00 0.00 0.00 0.00
None 0.00 40.00 0.00 40.00 20.00 0.00 0.00 0.00

353
Older
B.24a
Number of () tokens by Older speakers according to preceding manner of articulation
Total
Stop 13 6 64 77 286 5 0 0 451
Fricative 7 4 84 48 165 2 0 0 310
Nasal 1 1 51 41 207 2 0 0 303
Approximant 2 4 226 155 495 4 1 6 893
Affricate 0 0 2 0 1 0 0 0 3
None 1 3 7 7 30 0 0 0 48
B.24b
Percentage of () variants by Older speakers according to preceding manner of
articulation
Stop 2.88 1.33 14.19 17.07 63.41 1.11 0.00 0.00
Fricative 2.26 1.29 27.10 15.48 53.23 0.65 0.00 0.00
Nasal 0.33 0.33 16.83 13.53 68.32 0.66 0.00 0.00
Approximant 0.22 0.45 25.31 17.36 55.43 0.45 0.11 0.67
Affricate 0.00 0.00 66.67 0.00 33.33 0.00 0.00 0.00
None 2.08 6.25 14.58 14.58 62.50 0.00 0.00 0.00

354
Younger
B.25a
Number of () tokens by Younger speakers according to preceding manner of
articulation
Total
Stop 0 0 2 24 260 2 0 0 288
Fricative 0 0 3 20 173 2 0 0 198
Nasal 0 0 10 14 145 0 1 0 170
Approximant 0 0 20 62 515 6 3 14 620
Affricate 0 0 0 0 2 0 0 0 2
None 0 0 0 1 30 1 0 0 32
B.25b
Percentage of () variants by Younger speakers according to preceding manner of
articulation
Stop 0.00 0.00 0.69 8.33 90.28 0.69 0.00 0.00
Fricative 0.00 0.00 1.52 10.10 87.37 1.01 0.00 0.00
Nasal 0.00 0.00 5.88 8.24 85.29 0.00 0.59 0.00
Approximant 0.00 0.00 3.23 10.00 83.06 0.97 0.48 2.26
Affricate 0.00 0.00 0.00 0.00 100.00 0.00 0.00 0.00
None 0.00 0.00 0.00 3.13 93.75 3.13 0.00 0.00
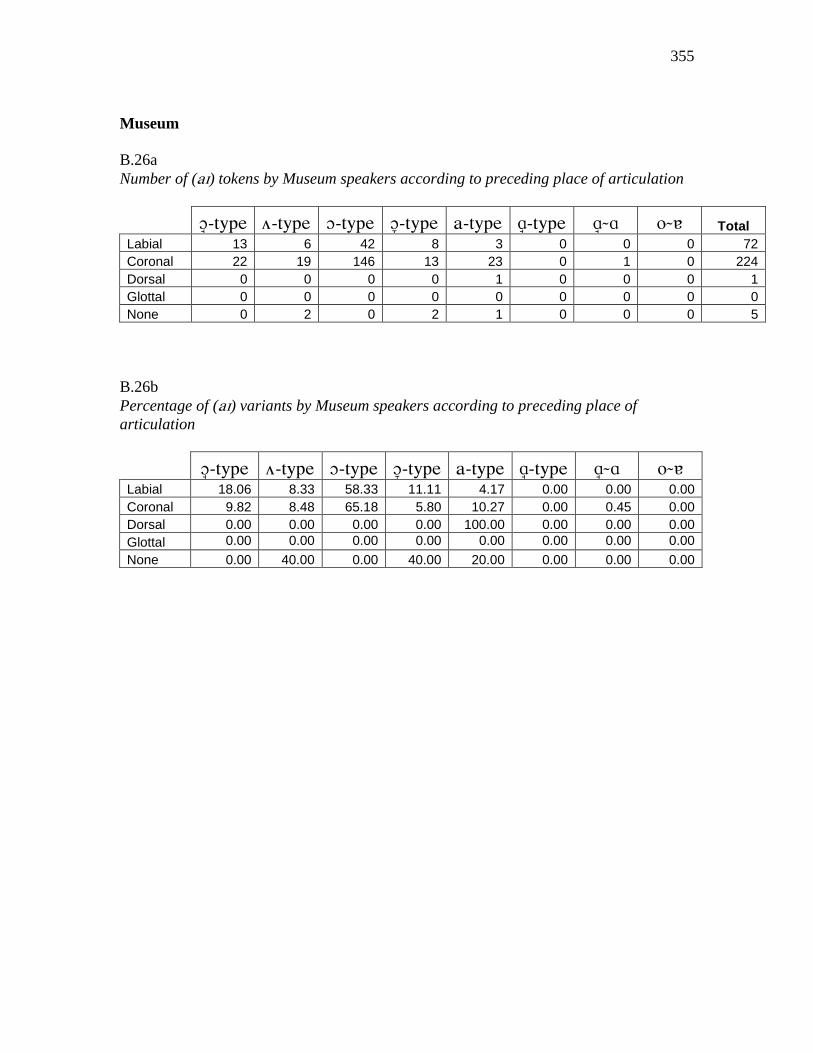
355
Museum
B.26a
Number of () tokens by Museum speakers according to preceding place of articulation
Total
Labial 13 6 42 8 3 0 0 0 72
Coronal 22 19 146 13 23 0 1 0 224
Dorsal 0 0 0 0 1 0 0 0 1
Glottal 0 0 0 0 0 0 0 0 0
None 0 2 0 2 1 0 0 0 5
B.26b
Percentage of () variants by Museum speakers according to preceding place of
articulation
Labial 18.06 8.33 58.33 11.11 4.17 0.00 0.00 0.00
Coronal 9.82 8.48 65.18 5.80 10.27 0.00 0.45 0.00
Dorsal 0.00 0.00 0.00 0.00 100.00 0.00 0.00 0.00
Glottal 0.00 0.00 0.00 0.00 0.00 0.00 0.00 0.00
None 0.00 40.00 0.00 40.00 20.00 0.00 0.00 0.00
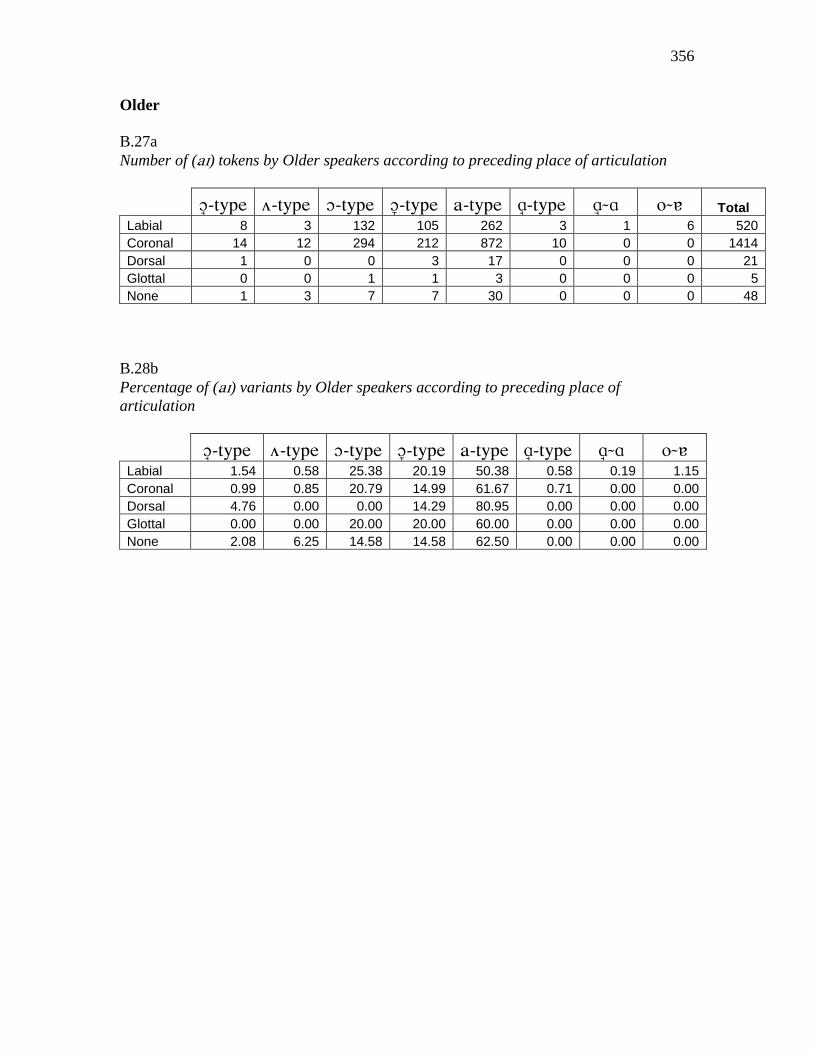
356
Older
B.27a
Number of () tokens by Older speakers according to preceding place of articulation
Total
Labial 8 3 132 105 262 3 1 6 520
Coronal 14 12 294 212 872 10 0 0 1414
Dorsal 1 0 0 3 17 0 0 0 21
Glottal 0 0 1 1 3 0 0 0 5
None 1 3 7 7 30 0 0 0 48
B.28b
Percentage of () variants by Older speakers according to preceding place of
articulation
Labial 1.54 0.58 25.38 20.19 50.38 0.58 0.19 1.15
Coronal 0.99 0.85 20.79 14.99 61.67 0.71 0.00 0.00
Dorsal 4.76 0.00 0.00 14.29 80.95 0.00 0.00 0.00
Glottal 0.00 0.00 20.00 20.00 60.00 0.00 0.00 0.00
None 2.08 6.25 14.58 14.58 62.50 0.00 0.00 0.00
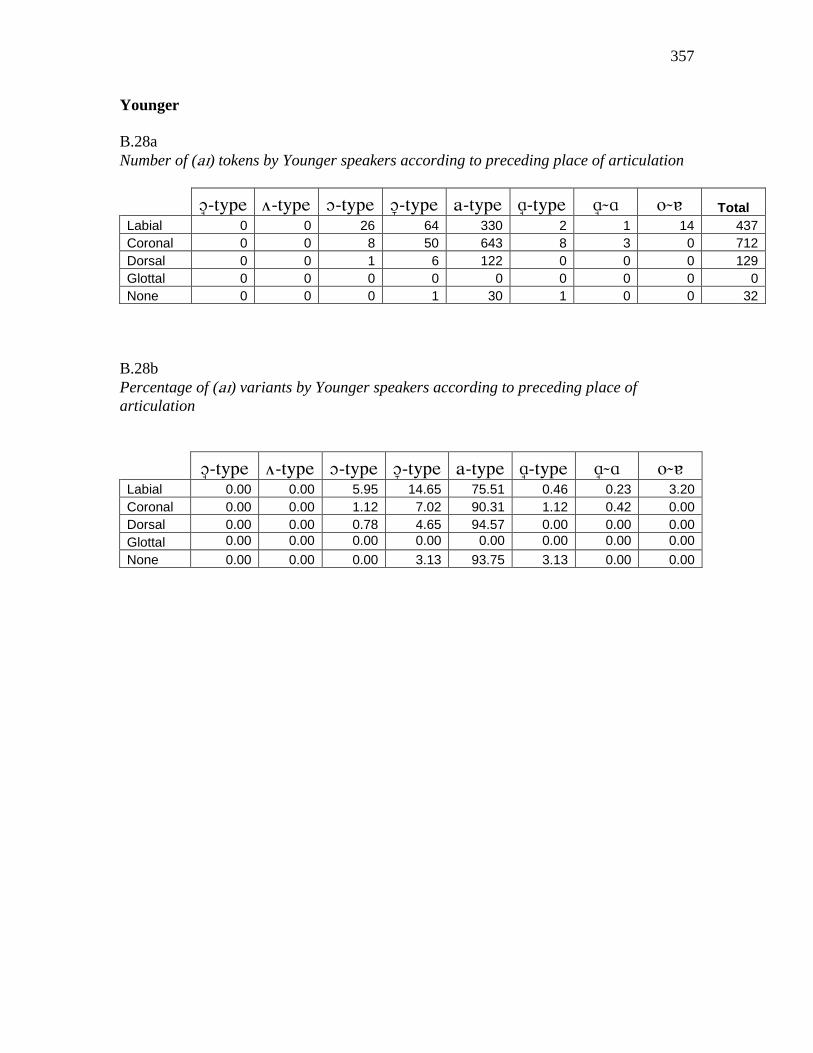
357
Younger
B.28a
Number of () tokens by Younger speakers according to preceding place of articulation
Total
Labial 0 0 26 64 330 2 1 14 437
Coronal 0 0 8 50 643 8 3 0 712
Dorsal 0 0 1 6 122 0 0 0 129
Glottal 0 0 0 0 0 0 0 0 0
None 0 0 0 1 30 1 0 0 32
B.28b
Percentage of () variants by Younger speakers according to preceding place of
articulation
Labial 0.00 0.00 5.95 14.65 75.51 0.46 0.23 3.20
Coronal 0.00 0.00 1.12 7.02 90.31 1.12 0.42 0.00
Dorsal 0.00 0.00 0.78 4.65 94.57 0.00 0.00 0.00
Glottal 0.00 0.00 0.00 0.00 0.00 0.00 0.00 0.00
None 0.00 0.00 0.00 3.13 93.75 3.13 0.00 0.00
358
Appendix C

359
Appendix C
In this appendix, you will find the complete numerical data sets pertaining to the analysis
of the variable () (see Chapter 8)
C.1
Number of () tokens according to age
Total
Young 0 4 80 0 84
Old 44 23 103 5 175
Museum 8 1 18 0 27
Total 52 28 201 5 286
C.2a
Number of () tokens according to age and gender
Total
Young
Male 0 2 43 0 45
Female 0 2 37 0 39
Old
Male 15 7 62 5 89
Female 29 16 41 0 86
Museum
Male 8 1 18 0 27
C.2b
Percentage of () variants according to age and gender
Young
Male 0.00 4.44 95.56 0.00
Female 0.00 5.13 94.87 0.00
Old
Male 16.85 7.87 69.66 5.62
Female 33.72 18.60 47.67 0.00
Museum
Male 29.63 3.70 66.67 0.00
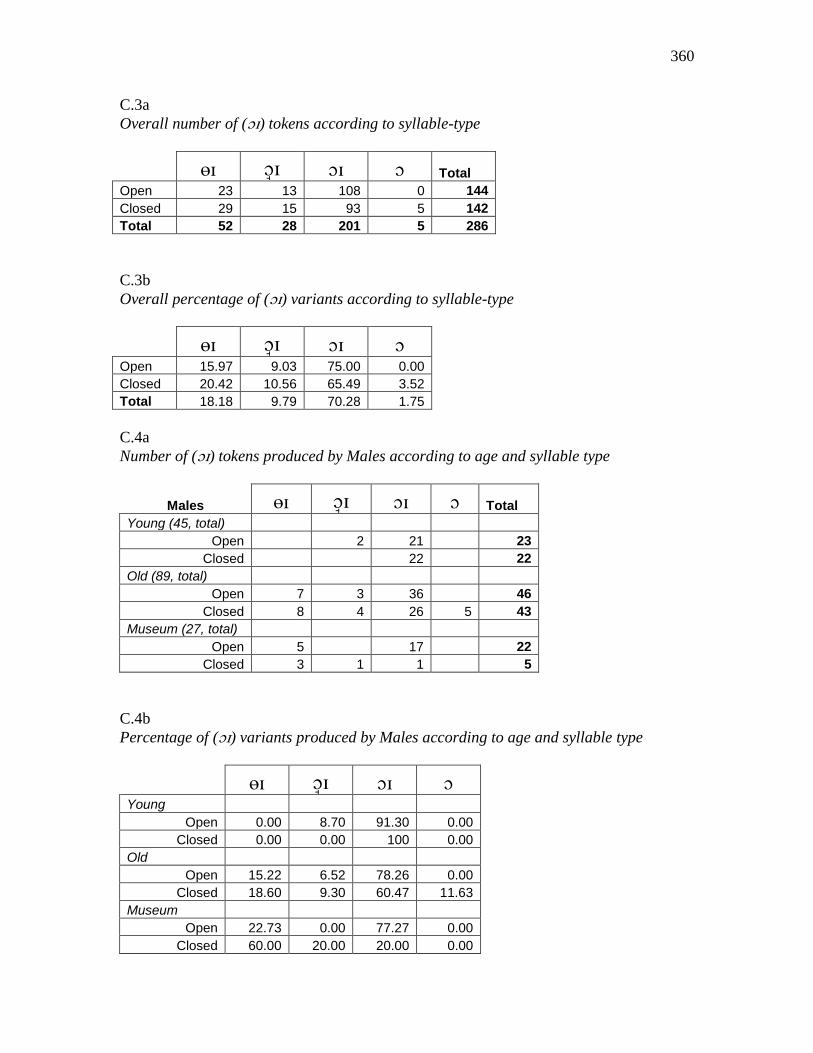
360
C.3a
Overall number of () tokens according to syllable-type
Total
Open 23 13 108 0 144
Closed 29 15 93 5 142
Total 52 28 201 5 286
C.3b
Overall percentage of () variants according to syllable-type
Open 15.97 9.03 75.00 0.00
Closed 20.42 10.56 65.49 3.52
Total 18.18 9.79 70.28 1.75
C.4a
Number of () tokens produced by Males according to age and syllable type
Males TotalYoung (45, total)
Open 2 21 23
Closed 22 22
Old (89, total)
Open 7 3 36 46
Closed 8 4 26 5 43
Museum (27, total)
Open 5 17 22
Closed 3 1 1 5
C.4b
Percentage of () variants produced by Males according to age and syllable type
Young
Open 0.00 8.70 91.30 0.00
Closed 0.00 0.00 100 0.00
Old
Open 15.22 6.52 78.26 0.00
Closed 18.60 9.30 60.47 11.63
Museum
Open 22.73 0.00 77.27 0.00
Closed 60.00 20.00 20.00 0.00
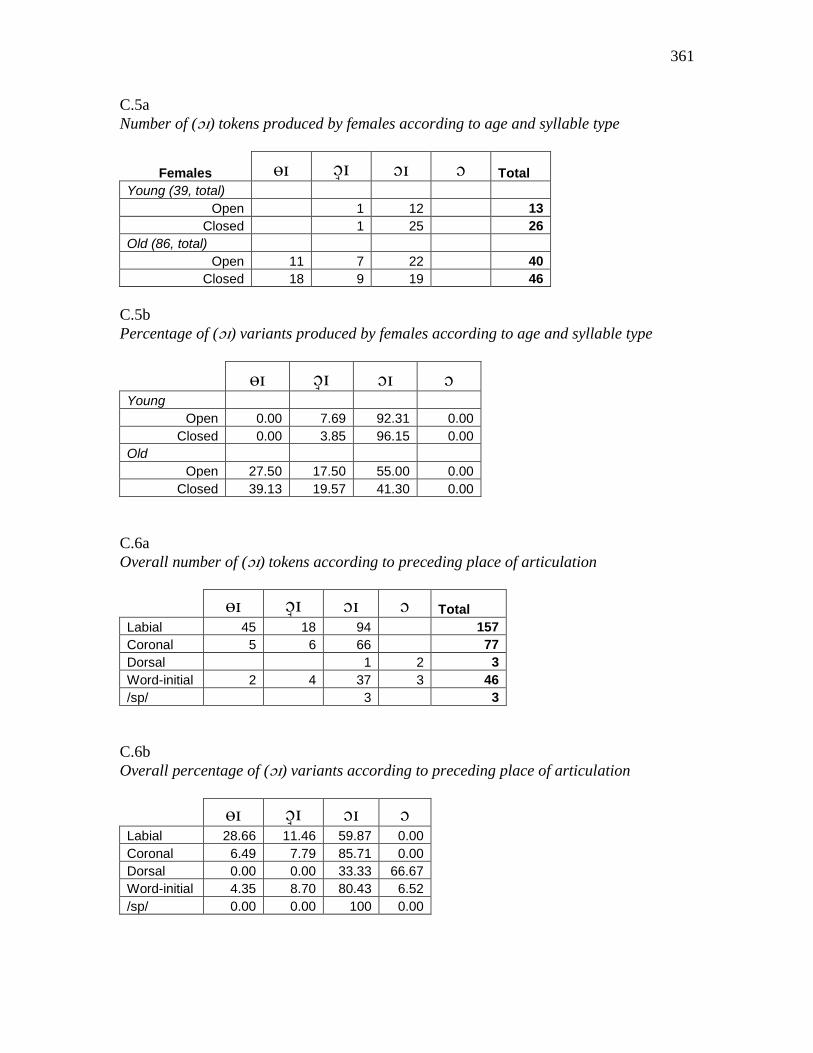
361
C.5a
Number of () tokens produced by females according to age and syllable type
Females TotalYoung (39, total)
Open 1 12 13
Closed 1 25 26
Old (86, total)
Open 11 7 22 40
Closed 18 9 19 46
C.5b
Percentage of () variants produced by females according to age and syllable type
Young
Open 0.00 7.69 92.31 0.00
Closed 0.00 3.85 96.15 0.00
Old
Open 27.50 17.50 55.00 0.00
Closed 39.13 19.57 41.30 0.00
C.6a
Overall number of () tokens according to preceding place of articulation
TotalLabial 45 18 94 157
Coronal 5 6 66 77
Dorsal 1 2 3
Word-initial 2 4 37 3 46
/sp/ 3 3
C.6b
Overall percentage of () variants according to preceding place of articulation
Labial 28.66 11.46 59.87 0.00
Coronal 6.49 7.79 85.71 0.00
Dorsal 0.00 0.00 33.33 66.67
Word-initial 4.35 8.70 80.43 6.52
/sp/ 0.00 0.00 100 0.00
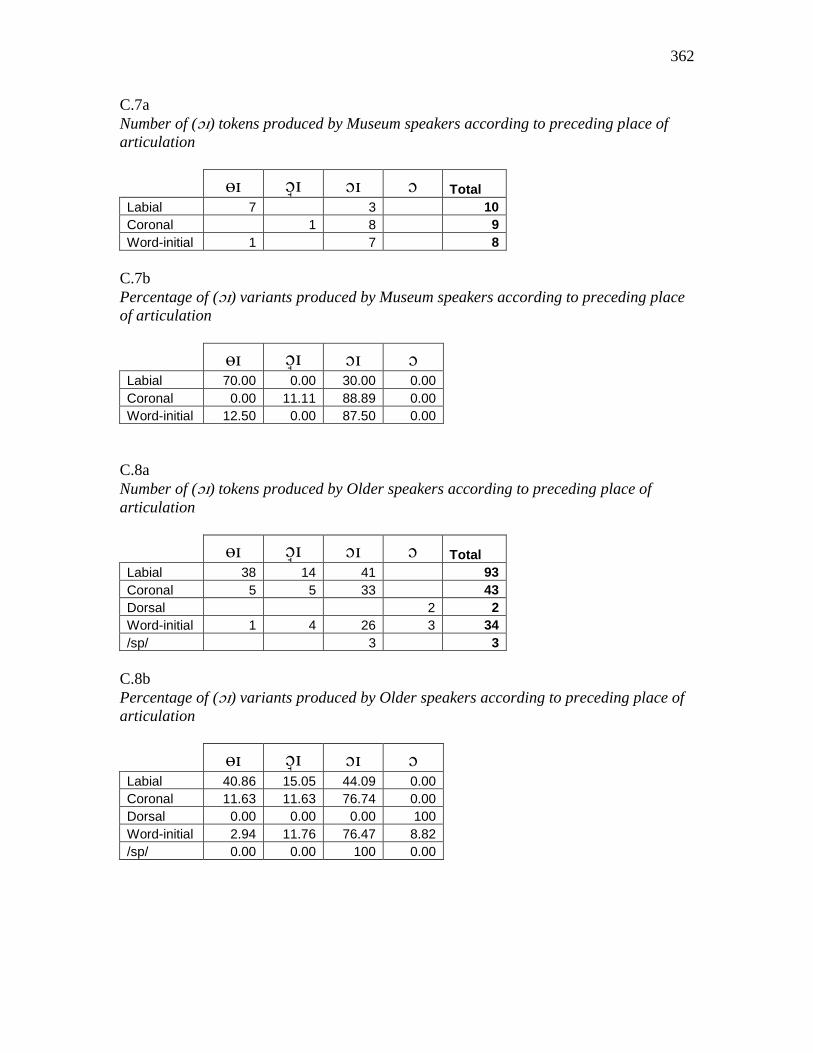
362
C.7a
Number of () tokens produced by Museum speakers according to preceding place of
articulation
TotalLabial 7 3 10
Coronal 1 8 9
Word-initial 1 7 8
C.7b
Percentage of () variants produced by Museum speakers according to preceding place
of articulation
Labial 70.00 0.00 30.00 0.00
Coronal 0.00 11.11 88.89 0.00
Word-initial 12.50 0.00 87.50 0.00
C.8a
Number of () tokens produced by Older speakers according to preceding place of
articulation
TotalLabial 38 14 41 93
Coronal 5 5 33 43
Dorsal 2 2
Word-initial 1 4 26 3 34
/sp/ 3 3
C.8b
Percentage of () variants produced by Older speakers according to preceding place of
articulation
Labial 40.86 15.05 44.09 0.00
Coronal 11.63 11.63 76.74 0.00
Dorsal 0.00 0.00 0.00 100
Word-initial 2.94 11.76 76.47 8.82
/sp/ 0.00 0.00 100 0.00
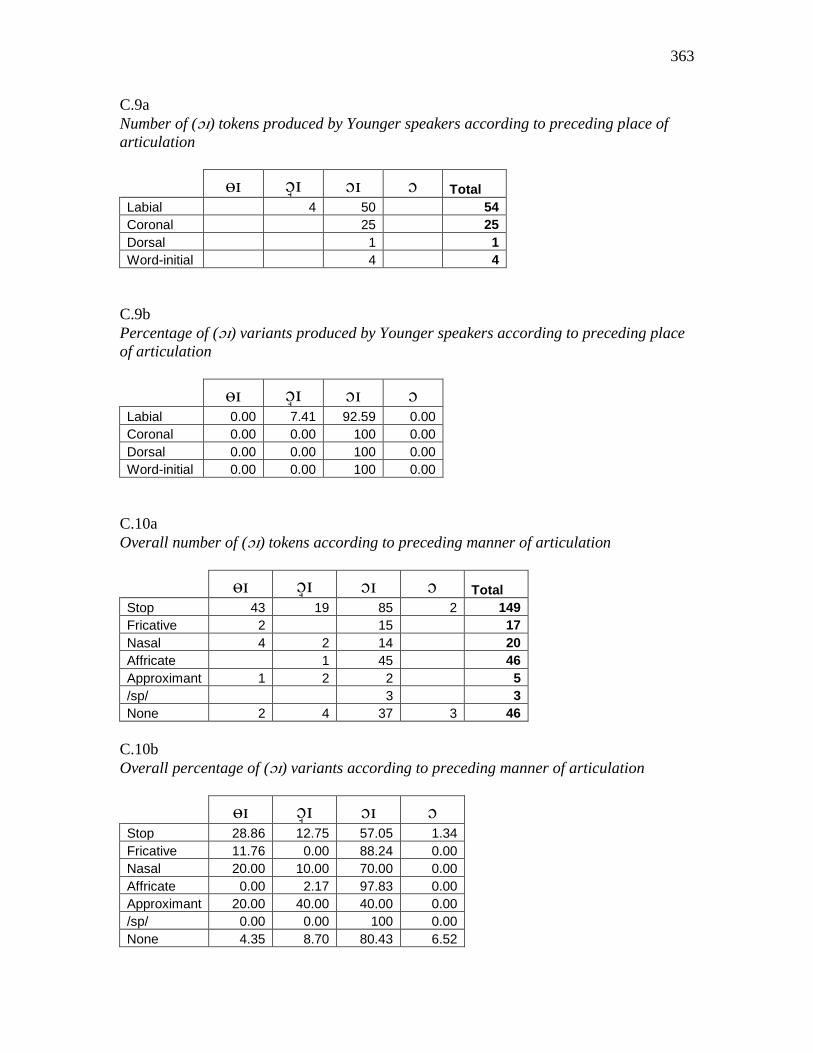
363
C.9a
Number of () tokens produced by Younger speakers according to preceding place of
articulation
TotalLabial 4 50 54
Coronal 25 25
Dorsal 1 1
Word-initial 4 4
C.9b
Percentage of () variants produced by Younger speakers according to preceding place
of articulation
Labial 0.00 7.41 92.59 0.00
Coronal 0.00 0.00 100 0.00
Dorsal 0.00 0.00 100 0.00
Word-initial 0.00 0.00 100 0.00
C.10a
Overall number of () tokens according to preceding manner of articulation
TotalStop 43 19 85 2 149
Fricative 2 15 17
Nasal 4 2 14 20
Affricate 1 45 46
Approximant 1 2 2 5
/sp/ 3 3
None 2 4 37 3 46
C.10b
Overall percentage of () variants according to preceding manner of articulation
Stop 28.86 12.75 57.05 1.34
Fricative 11.76 0.00 88.24 0.00
Nasal 20.00 10.00 70.00 0.00
Affricate 0.00 2.17 97.83 0.00
Approximant 20.00 40.00 40.00 0.00
/sp/ 0.00 0.00 100 0.00
None 4.35 8.70 80.43 6.52
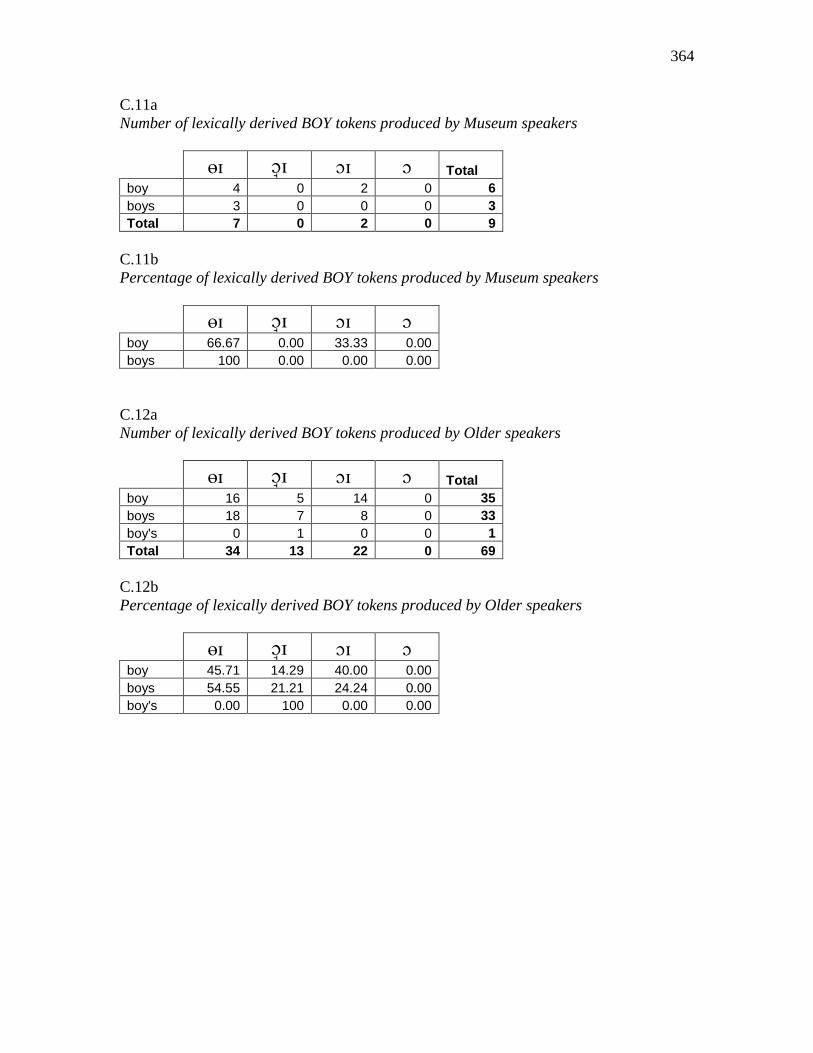
364
C.11a
Number of lexically derived BOY tokens produced by Museum speakers
Totalboy 4 0 2 0 6
boys 3 0 0 0 3
Total 7 0 2 0 9
C.11b
Percentage of lexically derived BOY tokens produced by Museum speakers
boy 66.67 0.00 33.33 0.00
boys 100 0.00 0.00 0.00
C.12a
Number of lexically derived BOY tokens produced by Older speakers
Totalboy 16 5 14 0 35
boys 18 7 8 0 33
boy's 0 1 0 0 1
Total 34 13 22 0 69
C.12b
Percentage of lexically derived BOY tokens produced by Older speakers
boy 45.71 14.29 40.00 0.00
boys 54.55 21.21 24.24 0.00
boy's 0.00 100 0.00 0.00
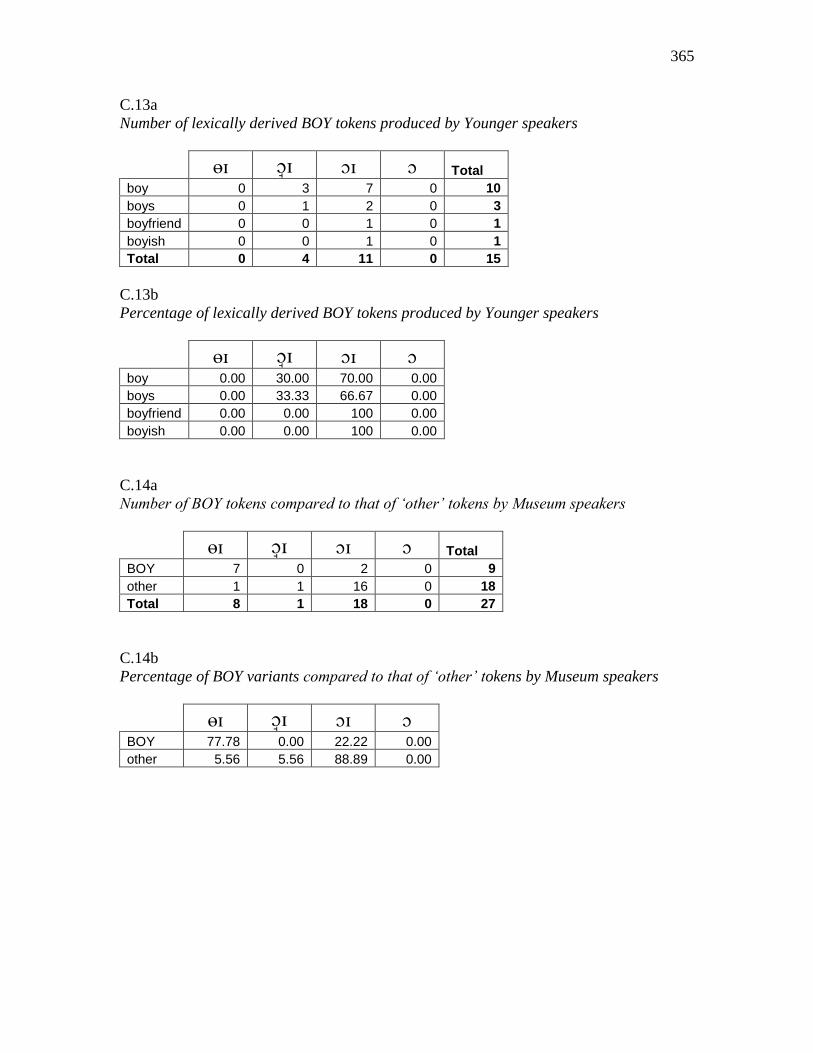
365
C.13a
Number of lexically derived BOY tokens produced by Younger speakers
Totalboy 0 3 7 0 10
boys 0 1 2 0 3
boyfriend 0 0 1 0 1
boyish 0 0 1 0 1
Total 0 4 11 0 15
C.13b
Percentage of lexically derived BOY tokens produced by Younger speakers
boy 0.00 30.00 70.00 0.00
boys 0.00 33.33 66.67 0.00
boyfriend 0.00 0.00 100 0.00
boyish 0.00 0.00 100 0.00
C.14a
Number of BOY tokens compared to that of ‘other’ tokens by Museum speakers
TotalBOY 7 0 2 0 9
other 1 1 16 0 18
Total 8 1 18 0 27
C.14b
Percentage of BOY variants compared to that of ‘other’ tokens by Museum speakers
BOY 77.78 0.00 22.22 0.00
other 5.56 5.56 88.89 0.00
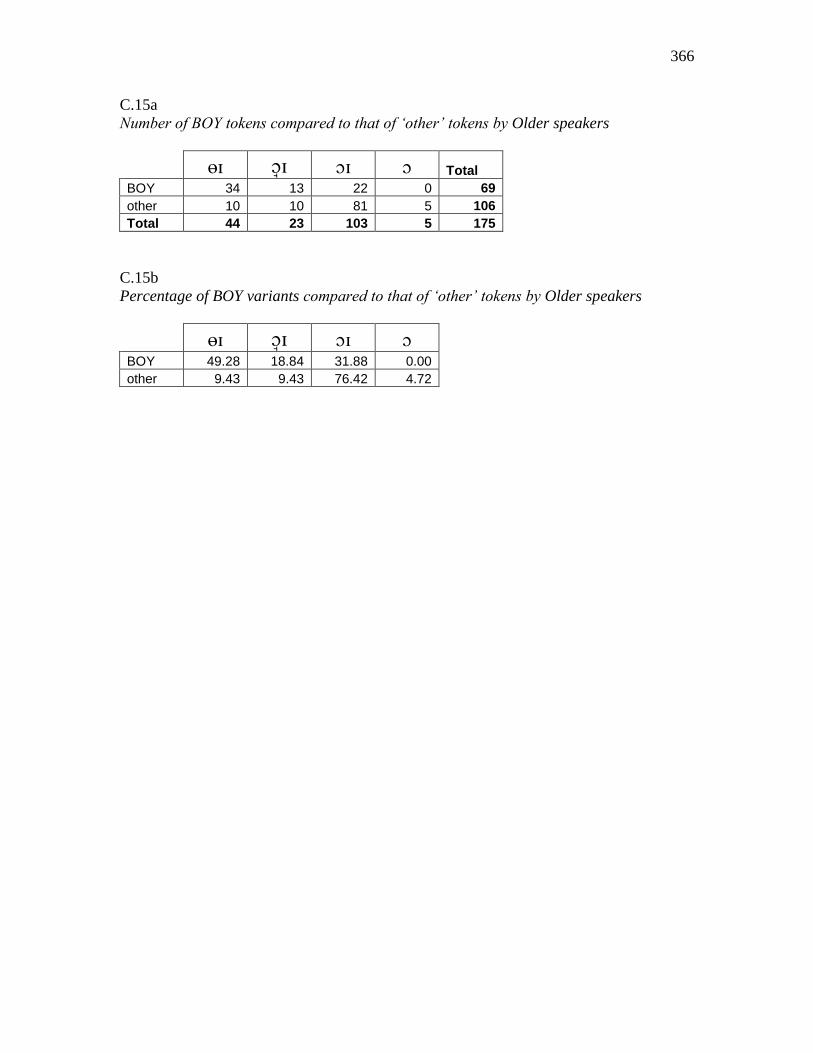
366
C.15a
Number of BOY tokens compared to that of ‘other’ tokens by Older speakers
TotalBOY 34 13 22 0 69
other 10 10 81 5 106
Total 44 23 103 5 175
C.15b
Percentage of BOY variants compared to that of ‘other’ tokens by Older speakers
BOY 49.28 18.84 31.88 0.00
other 9.43 9.43 76.42 4.72
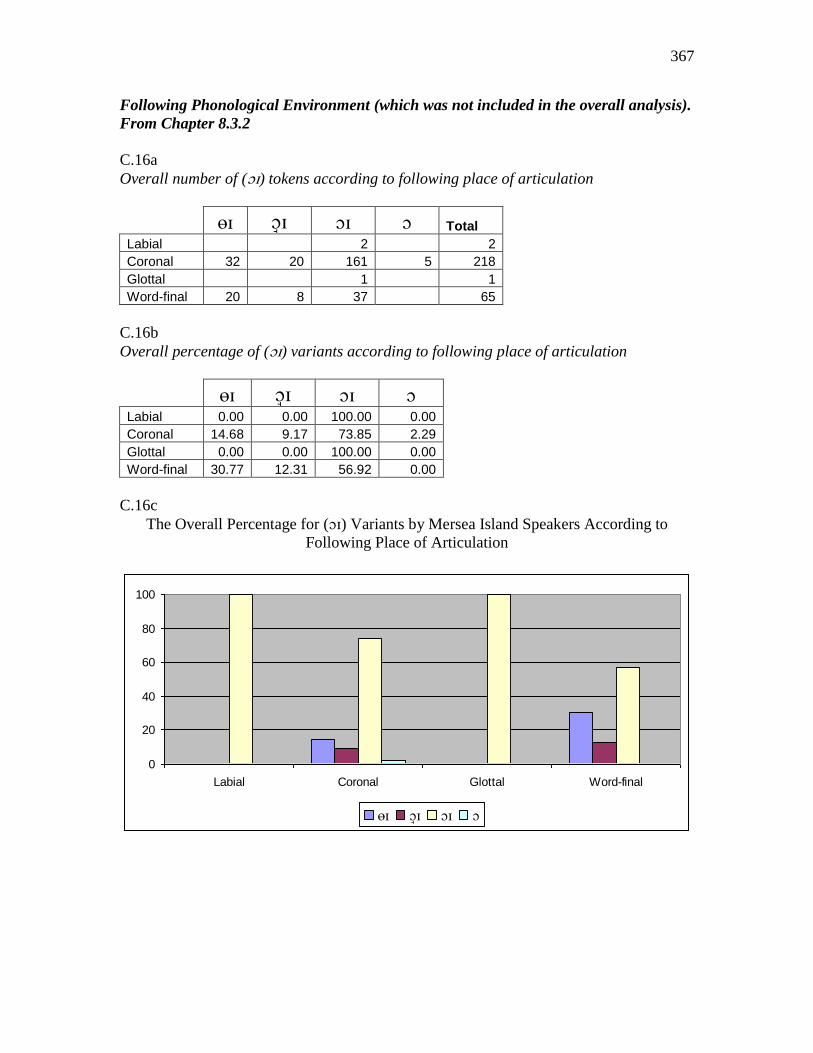
367
Following Phonological Environment (which was not included in the overall analysis).
From Chapter 8.3.2
C.16a
Overall number of () tokens according to following place of articulation
TotalLabial 2 2
Coronal 32 20 161 5 218
Glottal 1 1
Word-final 20 8 37 65
C.16b
Overall percentage of () variants according to following place of articulation
Labial 0.00 0.00 100.00 0.00
Coronal 14.68 9.17 73.85 2.29
Glottal 0.00 0.00 100.00 0.00
Word-final 30.77 12.31 56.92 0.00
C.16c
The Overall Percentage for () Variants by Mersea Island Speakers According to
Following Place of Articulation
0
20
40
60
80
100
Labial Coronal Glottal Word-final
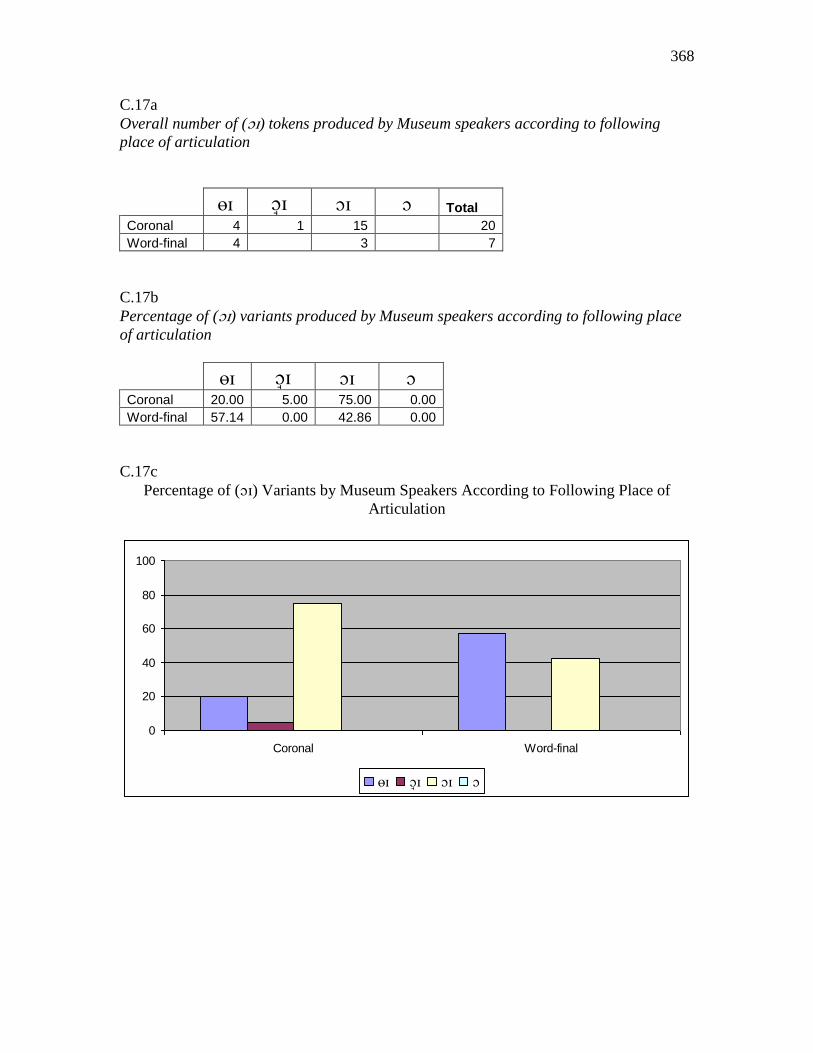
368
C.17a
Overall number of () tokens produced by Museum speakers according to following
place of articulation
Total
Coronal 4 1 15 20
Word-final 4 3 7
C.17b
Percentage of () variants produced by Museum speakers according to following place
of articulation
Coronal 20.00 5.00 75.00 0.00
Word-final 57.14 0.00 42.86 0.00
C.17c
Percentage of () Variants by Museum Speakers According to Following Place of
Articulation
0
20
40
60
80
100
Coronal Word-final
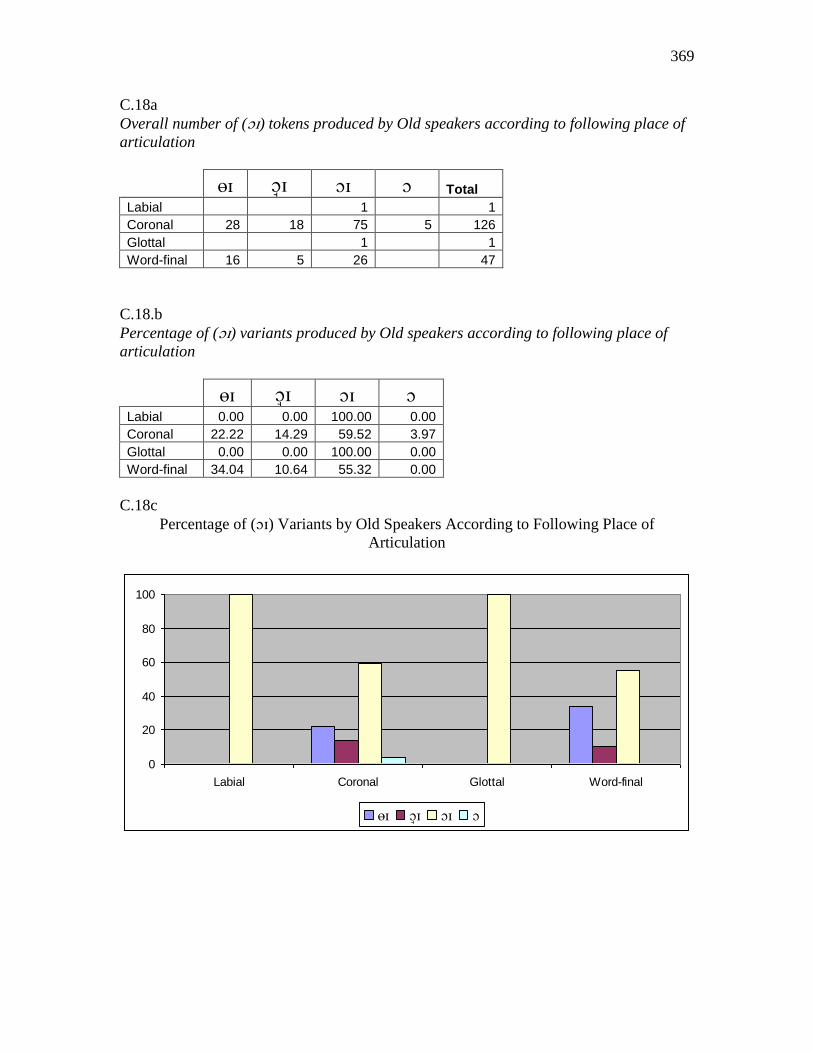
369
C.18a
Overall number of () tokens produced by Old speakers according to following place of
articulation
TotalLabial 1 1
Coronal 28 18 75 5 126
Glottal 1 1
Word-final 16 5 26 47
C.18.b
Percentage of () variants produced by Old speakers according to following place of
articulation
Labial 0.00 0.00 100.00 0.00
Coronal 22.22 14.29 59.52 3.97
Glottal 0.00 0.00 100.00 0.00
Word-final 34.04 10.64 55.32 0.00
C.18c
Percentage of () Variants by Old Speakers According to Following Place of
Articulation
0
20
40
60
80
100
Labial Coronal Glottal Word-final
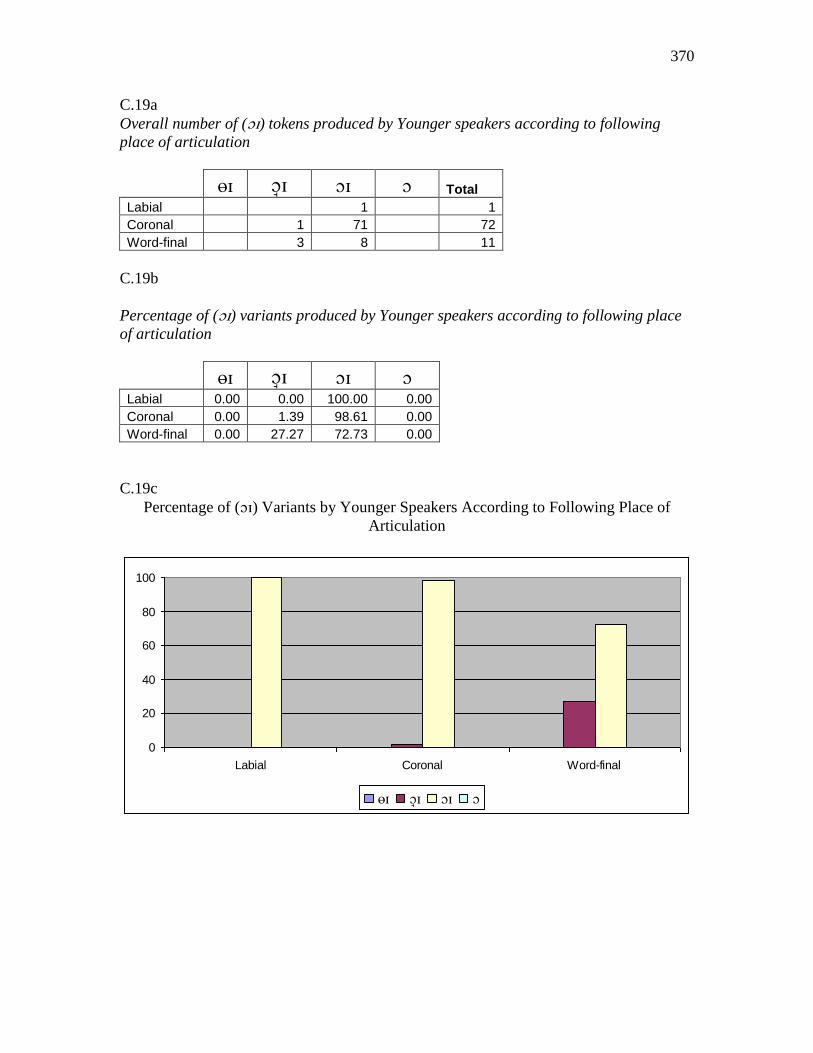
370
C.19a
Overall number of () tokens produced by Younger speakers according to following
place of articulation
TotalLabial 1 1
Coronal 1 71 72
Word-final 3 8 11
C.19b
Percentage of () variants produced by Younger speakers according to following place
of articulation
Labial 0.00 0.00 100.00 0.00
Coronal 0.00 1.39 98.61 0.00
Word-final 0.00 27.27 72.73 0.00
C.19c
Percentage of () Variants by Younger Speakers According to Following Place of
Articulation
0
20
40
60
80
100
Labial Coronal Word-final
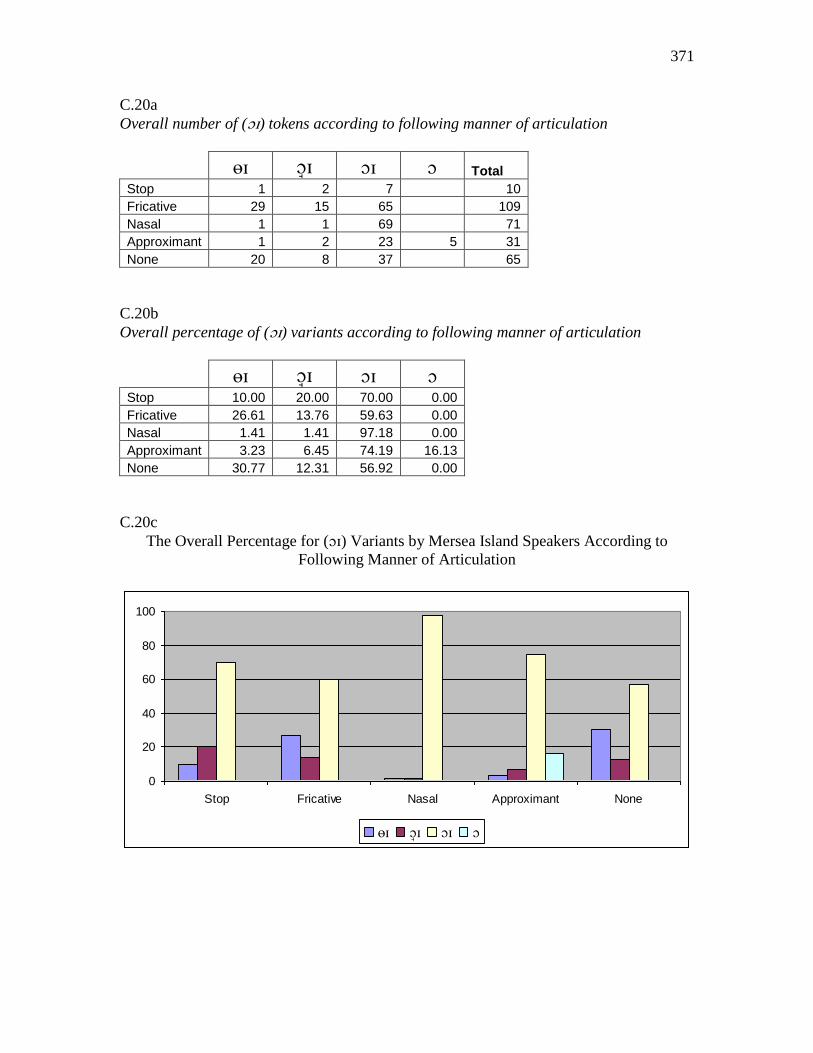
371
C.20a
Overall number of () tokens according to following manner of articulation
TotalStop 1 2 7 10
Fricative 29 15 65 109
Nasal 1 1 69 71
Approximant 1 2 23 5 31
None 20 8 37 65
C.20b
Overall percentage of () variants according to following manner of articulation
Stop 10.00 20.00 70.00 0.00
Fricative 26.61 13.76 59.63 0.00
Nasal 1.41 1.41 97.18 0.00
Approximant 3.23 6.45 74.19 16.13
None 30.77 12.31 56.92 0.00
C.20c
The Overall Percentage for () Variants by Mersea Island Speakers According to
Following Manner of Articulation
0
20
40
60
80
100
Stop Fricative Nasal Approximant None

372
C.21a
Overall number of () tokens produced by Museum speakers according to following
manner of articulation
TotalFricative 4 7 11
Nasal 1 8 9
None 4 3 7
C.21b
Percentage of () variants produced by Museum speakers according to following
manner of articulation
Fricative 36.36 0.00 63.64 0.00
Nasal 0.00 11.11 88.89 0.00
None 57.14 0.00 42.86 0.00
C.21c
Percentage of () Variants by Museum Speakers According to Following Manner of
Articulation
0
20
40
60
80
100
Fricative Nasal None
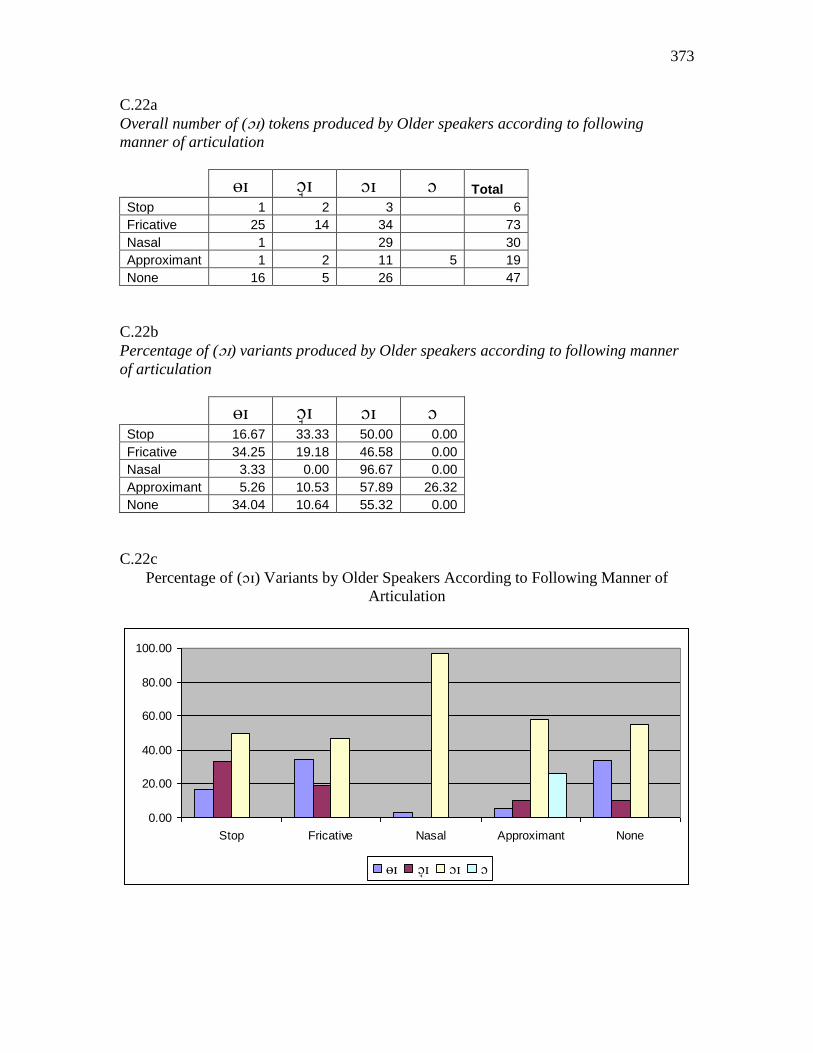
373
C.22a
Overall number of () tokens produced by Older speakers according to following
manner of articulation
TotalStop 1 2 3 6
Fricative 25 14 34 73
Nasal 1 29 30
Approximant 1 2 11 5 19
None 16 5 26 47
C.22b
Percentage of () variants produced by Older speakers according to following manner
of articulation
Stop 16.67 33.33 50.00 0.00
Fricative 34.25 19.18 46.58 0.00
Nasal 3.33 0.00 96.67 0.00
Approximant 5.26 10.53 57.89 26.32
None 34.04 10.64 55.32 0.00
C.22c
Percentage of () Variants by Older Speakers According to Following Manner of
Articulation
0.00
20.00
40.00
60.00
80.00
100.00
Stop Fricative Nasal Approximant None
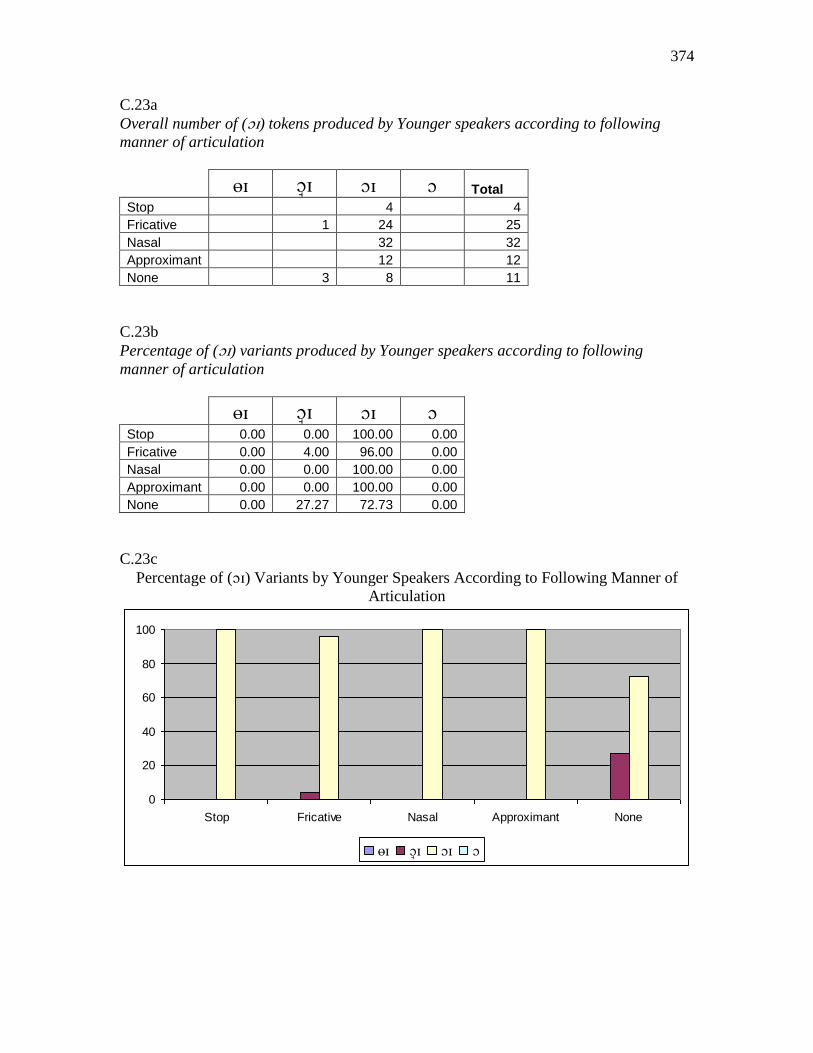
374
C.23a
Overall number of () tokens produced by Younger speakers according to following
manner of articulation
TotalStop 4 4
Fricative 1 24 25
Nasal 32 32
Approximant 12 12
None 3 8 11
C.23b
Percentage of () variants produced by Younger speakers according to following
manner of articulation
Stop 0.00 0.00 100.00 0.00
Fricative 0.00 4.00 96.00 0.00
Nasal 0.00 0.00 100.00 0.00
Approximant 0.00 0.00 100.00 0.00
None 0.00 27.27 72.73 0.00
C.23c
Percentage of () Variants by Younger Speakers According to Following Manner of
Articulation
0
20
40
60
80
100
Stop Fricative Nasal Approximant None
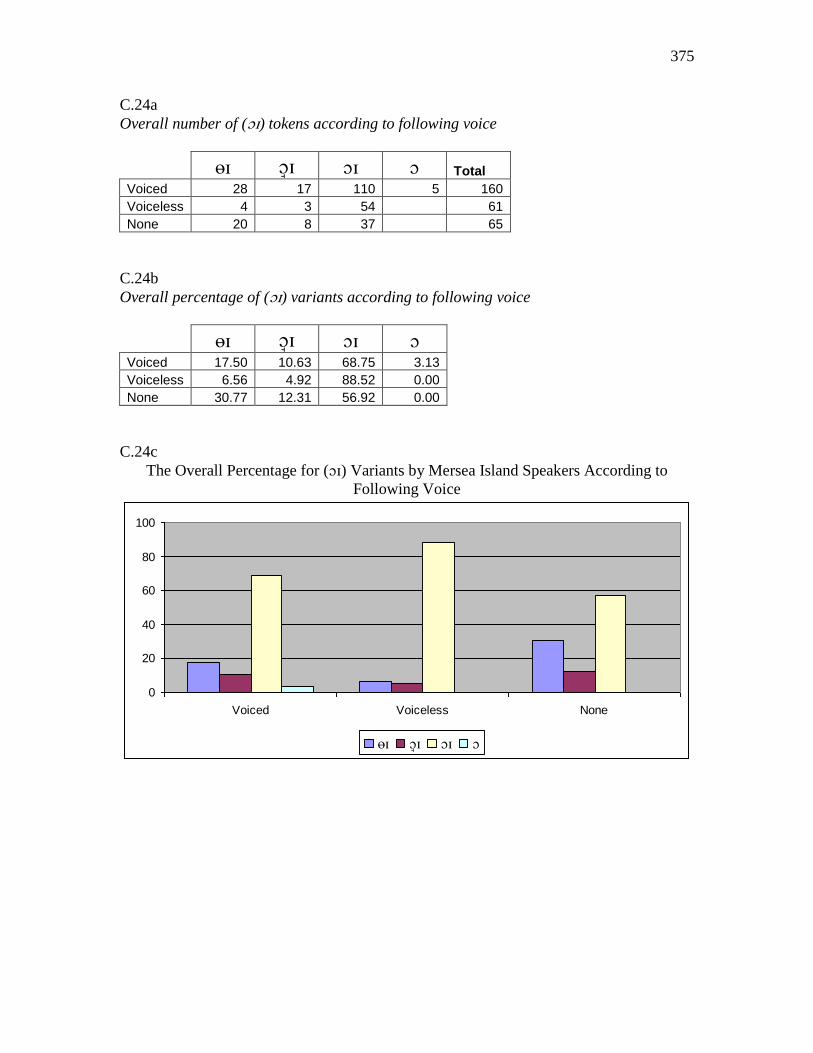
375
C.24a
Overall number of () tokens according to following voice
TotalVoiced 28 17 110 5 160
Voiceless 4 3 54 61
None 20 8 37 65
C.24b
Overall percentage of () variants according to following voice
Voiced 17.50 10.63 68.75 3.13
Voiceless 6.56 4.92 88.52 0.00
None 30.77 12.31 56.92 0.00
C.24c
The Overall Percentage for () Variants by Mersea Island Speakers According to
Following Voice
0
20
40
60
80
100
Voiced Voiceless None
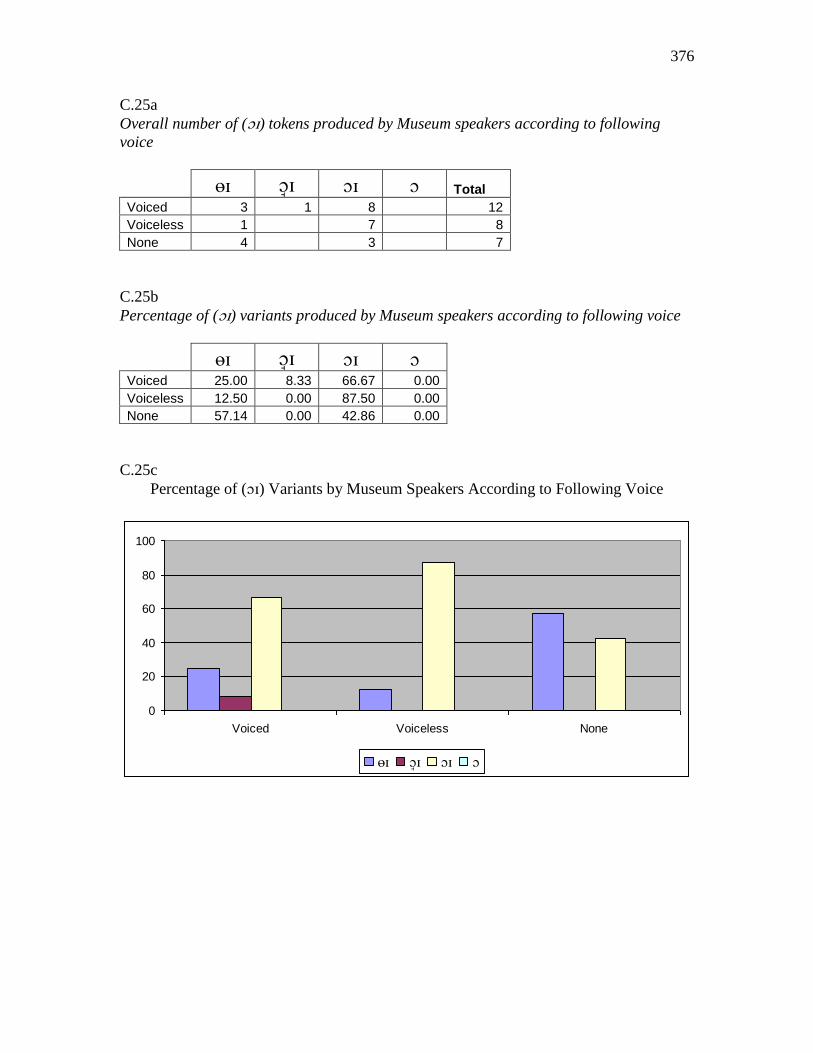
376
C.25a
Overall number of () tokens produced by Museum speakers according to following
voice
TotalVoiced 3 1 8 12
Voiceless 1 7 8
None 4 3 7
C.25b
Percentage of () variants produced by Museum speakers according to following voice
Voiced 25.00 8.33 66.67 0.00
Voiceless 12.50 0.00 87.50 0.00
None 57.14 0.00 42.86 0.00
C.25c
Percentage of () Variants by Museum Speakers According to Following Voice
0
20
40
60
80
100
Voiced Voiceless None
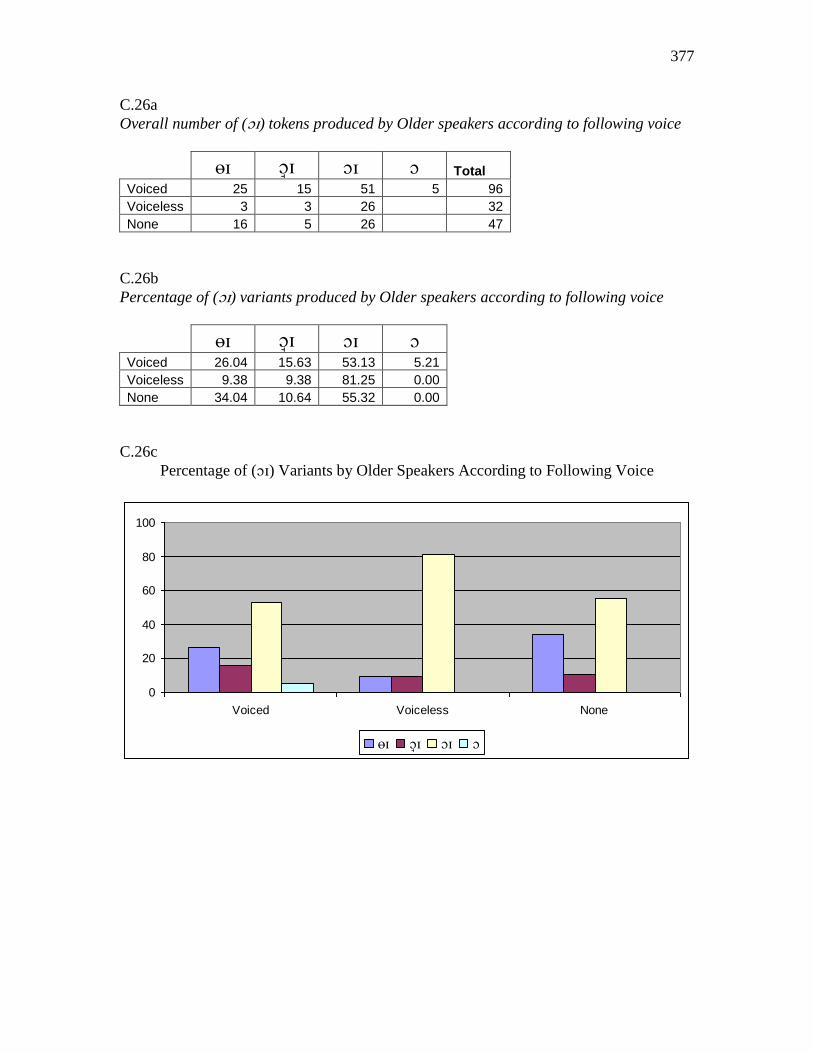
377
C.26a
Overall number of () tokens produced by Older speakers according to following voice
TotalVoiced 25 15 51 5 96
Voiceless 3 3 26 32
None 16 5 26 47
C.26b
Percentage of () variants produced by Older speakers according to following voice
Voiced 26.04 15.63 53.13 5.21
Voiceless 9.38 9.38 81.25 0.00
None 34.04 10.64 55.32 0.00
C.26c
Percentage of () Variants by Older Speakers According to Following Voice
0
20
40
60
80
100
Voiced Voiceless None

378
C.27a
Overall number of () tokens produced by Younger speakers according to following
voice
TotalVoiced 1 51 52
Voiceless 21 21
None 3 8 11
C.27b
Percentage of () variants produced by Younger speakers according to following voice
Voiced 0.00 1.92 98.08 0.00
Voiceless 0.00 0.00 100.00 0.00
None 0.00 27.27 72.73 0.00
C.27c
Percentage of () Variants by Younger Speakers According to Following Voice
0
20
40
60
80
100
Voiced Voiceless None
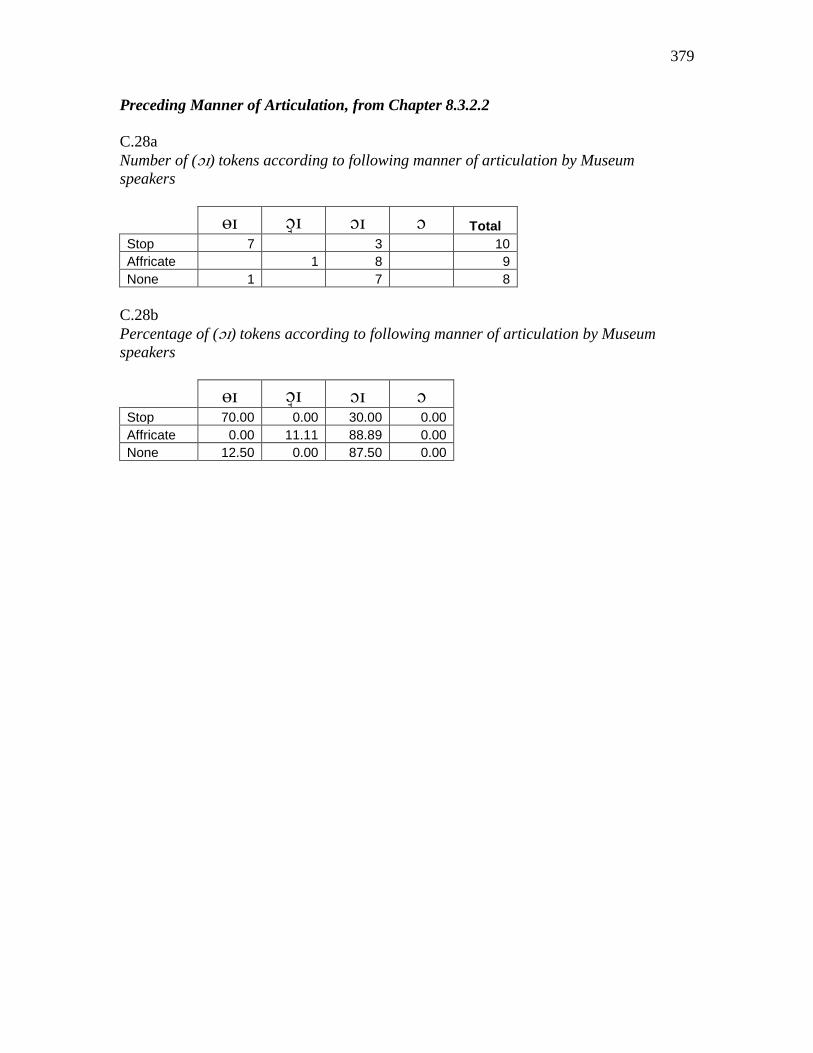
379
Preceding Manner of Articulation, from Chapter 8.3.2.2
C.28a
Number of () tokens according to following manner of articulation by Museum
speakers
Total
Stop 7 3 10
Affricate 1 8 9
None 1 7 8
C.28b
Percentage of () tokens according to following manner of articulation by Museum
speakers
Stop 70.00 0.00 30.00 0.00
Affricate 0.00 11.11 88.89 0.00
None 12.50 0.00 87.50 0.00
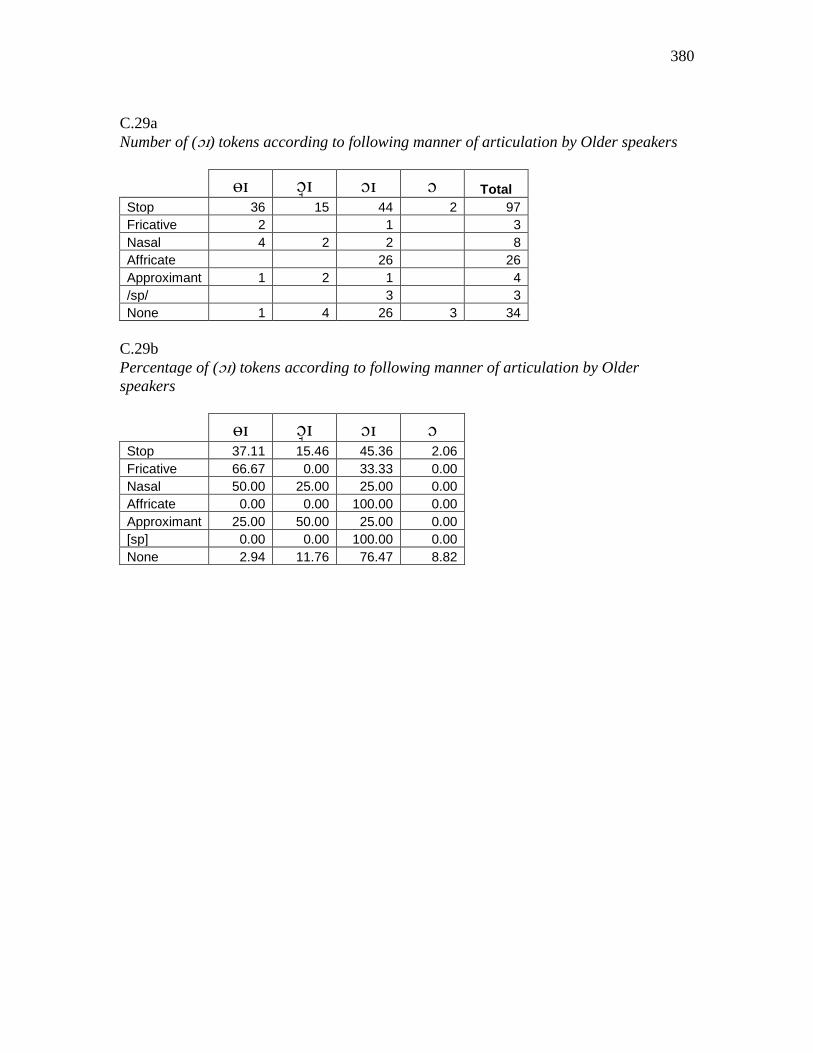
380
C.29a
Number of () tokens according to following manner of articulation by Older speakers
Total
Stop 36 15 44 2 97
Fricative 2 1 3
Nasal 4 2 2 8
Affricate 26 26
Approximant 1 2 1 4
/sp/ 3 3
None 1 4 26 3 34
C.29b
Percentage of () tokens according to following manner of articulation by Older
speakers
Stop 37.11 15.46 45.36 2.06
Fricative 66.67 0.00 33.33 0.00
Nasal 50.00 25.00 25.00 0.00
Affricate 0.00 0.00 100.00 0.00
Approximant 25.00 50.00 25.00 0.00
[sp] 0.00 0.00 100.00 0.00
None 2.94 11.76 76.47 8.82
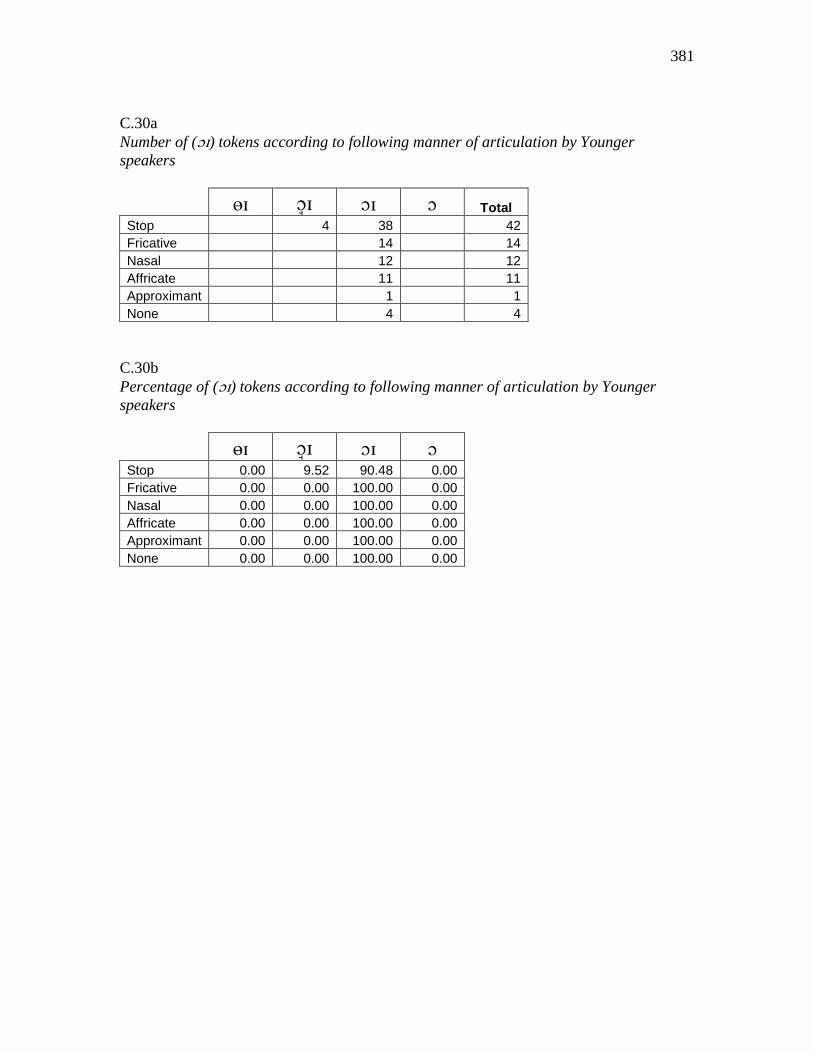
381
C.30a
Number of () tokens according to following manner of articulation by Younger
speakers
Total
Stop 4 38 42
Fricative 14 14
Nasal 12 12
Affricate 11 11
Approximant 1 1
None 4 4
C.30b
Percentage of () tokens according to following manner of articulation by Younger
speakers
Stop 0.00 9.52 90.48 0.00
Fricative 0.00 0.00 100.00 0.00
Nasal 0.00 0.00 100.00 0.00
Affricate 0.00 0.00 100.00 0.00
Approximant 0.00 0.00 100.00 0.00
None 0.00 0.00 100.00 0.00
382
Appendix D

383
Appendix D
In this appendix, you will find the examples from the Mersea data for each of the
variables examined in this thesis with respect to preceding and following environments.
1. The variable (a)
a) Preceding Phonological Environment
Preceding Consonant Examples
[p] pound, pounding, pounce, pouncing
[b] about, bounce, bound, boundary
[m] amount, mouth, mouse, mountains
[w] wound-up
[f] foundation, found, fowl
[v] voucher
[t] town, towns
[d] down, doubt, endowment
[n] now, announce, pronounce
[] thousand, without
[s] sound, sounded, south, Southend,
[] shout, shouted, shouting
[l] loud, lounge, allow, plough
[r] round, around, ground, brown
[k] cows, count, council, accounting
[] dug-outs
[h] house, house how, hound
[sk] scout, scouts
Word Initial out, outings, ounce
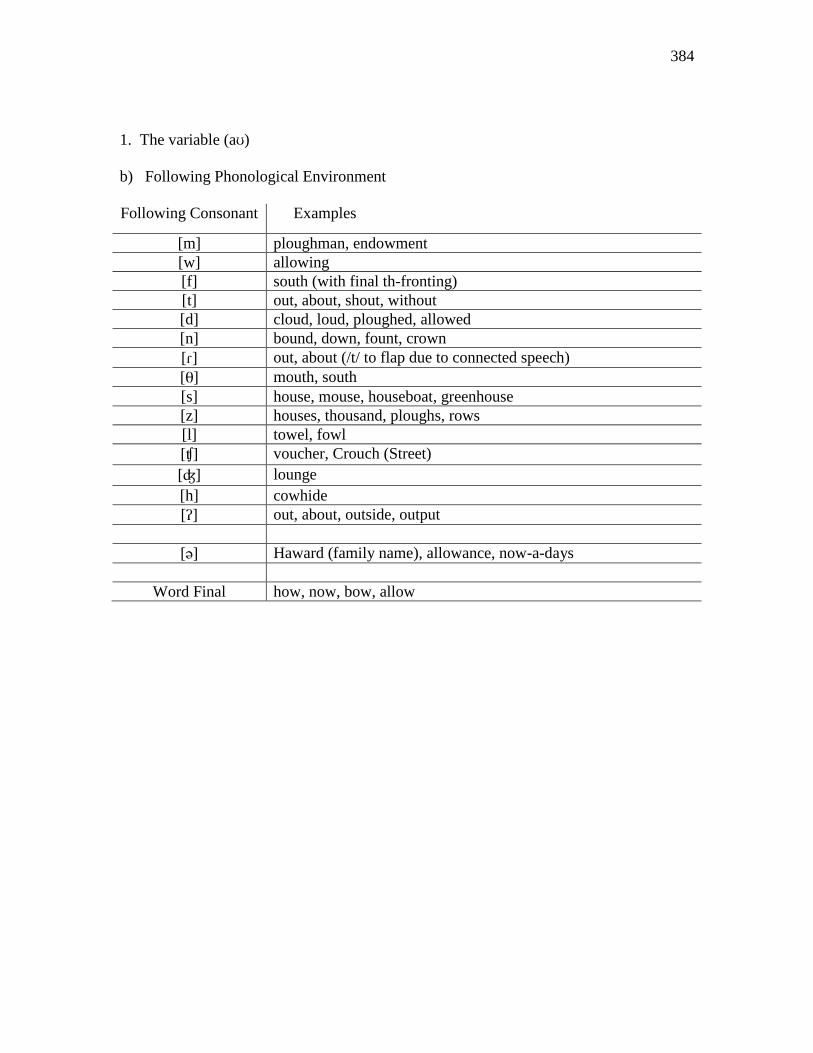
384
1. The variable (a)
b) Following Phonological Environment
Following Consonant Examples
[m] ploughman, endowment
[w] allowing
[f] south (with final th-fronting)
[t] out, about, shout, without
[d] cloud, loud, ploughed, allowed
[n] bound, down, fount, crown
[] out, about (/t/ to flap due to connected speech)
[] mouth, south
[s] house, mouse, houseboat, greenhouse
[z] houses, thousand, ploughs, rows
[l] towel, fowl
[] voucher, Crouch (Street)
[] lounge
[h] cowhide
[] out, about, outside, output
[] Haward (family name), allowance, now-a-days
Word Final how, now, bow, allow
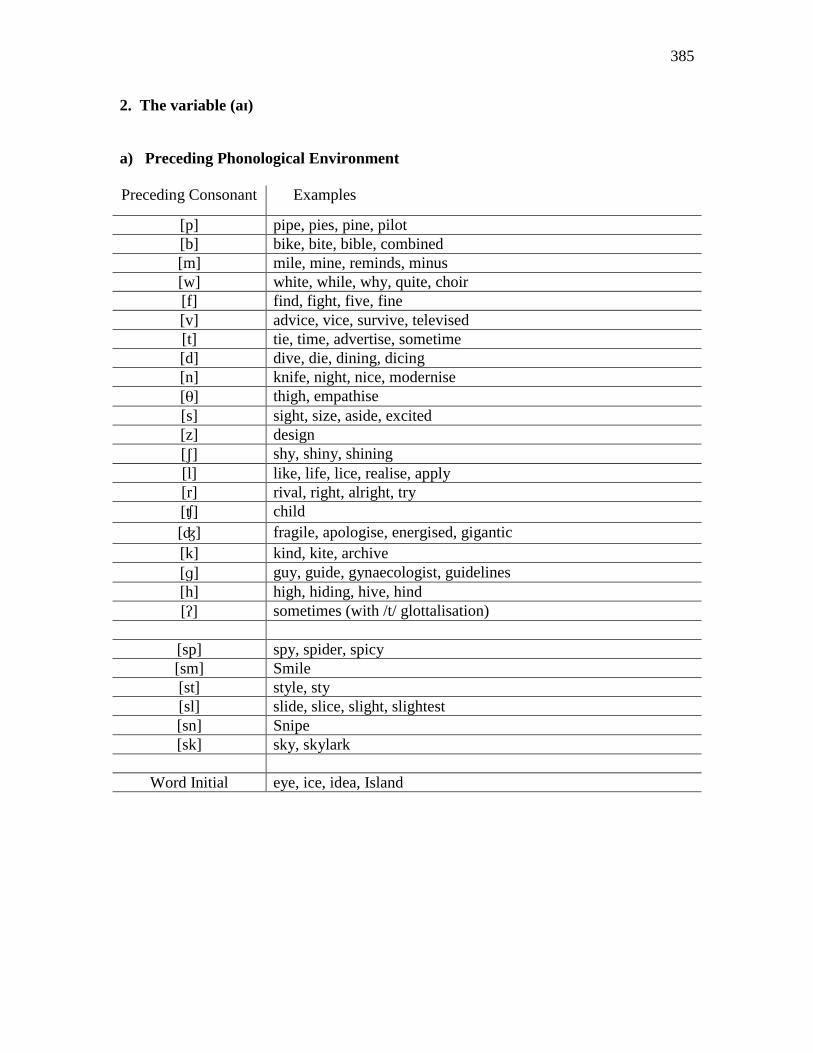
385
2. The variable (a)
a) Preceding Phonological Environment
Preceding Consonant Examples
[p] pipe, pies, pine, pilot
[b] bike, bite, bible, combined
[m] mile, mine, reminds, minus
[w] white, while, why, quite, choir
[f] find, fight, five, fine
[v] advice, vice, survive, televised
[t] tie, time, advertise, sometime
[d] dive, die, dining, dicing
[n] knife, night, nice, modernise
[] thigh, empathise
[s] sight, size, aside, excited
[z] design
[] shy, shiny, shining
[l] like, life, lice, realise, apply
[r] rival, right, alright, try
[] child
[] fragile, apologise, energised, gigantic
[k] kind, kite, archive
[] guy, guide, gynaecologist, guidelines
[h] high, hiding, hive, hind
[] sometimes (with /t/ glottalisation)
[sp] spy, spider, spicy
[sm] Smile
[st] style, sty
[sl] slide, slice, slight, slightest
[sn] Snipe
[sk] sky, skylark
Word Initial eye, ice, idea, Island
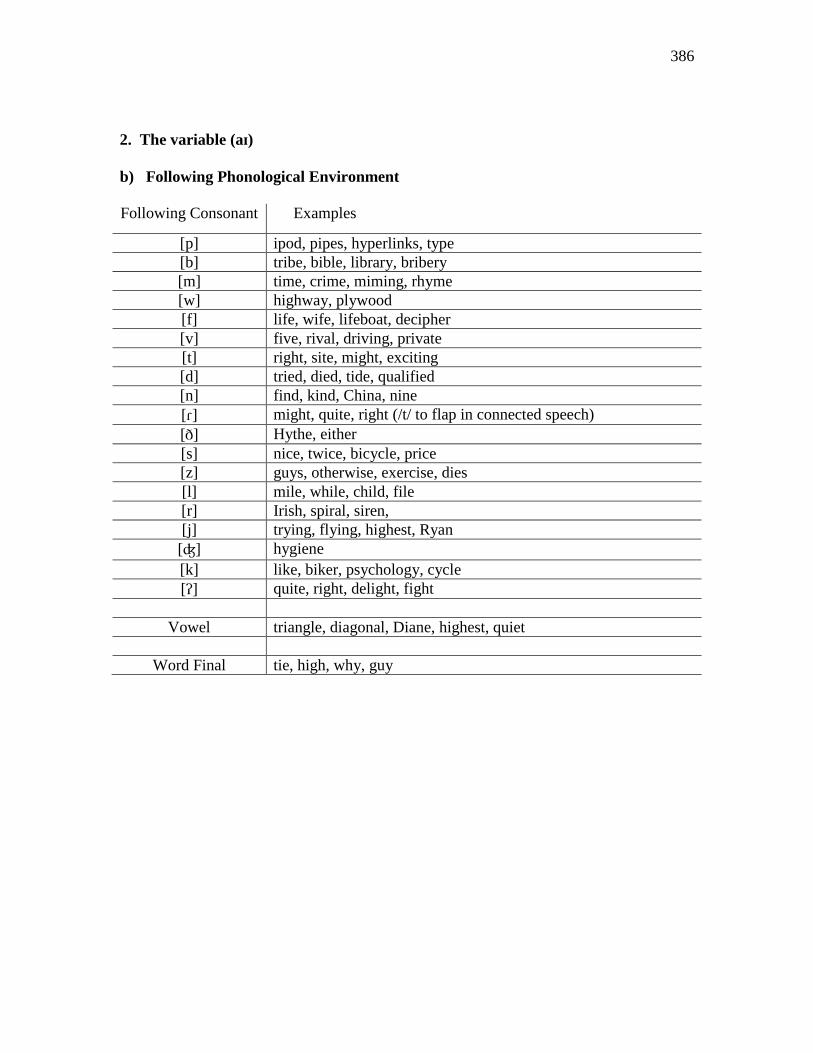
386
2. The variable (a)
b) Following Phonological Environment
Following Consonant Examples
[p] ipod, pipes, hyperlinks, type
[b] tribe, bible, library, bribery
[m] time, crime, miming, rhyme
[w] highway, plywood
[f] life, wife, lifeboat, decipher
[v] five, rival, driving, private
[t] right, site, might, exciting
[d] tried, died, tide, qualified
[n] find, kind, China, nine
[] might, quite, right (/t/ to flap in connected speech)
[] Hythe, either
[s] nice, twice, bicycle, price
[z] guys, otherwise, exercise, dies
[l] mile, while, child, file
[r] Irish, spiral, siren,
[j] trying, flying, highest, Ryan
[] hygiene
[k] like, biker, psychology, cycle
[] quite, right, delight, fight
Vowel triangle, diagonal, Diane, highest, quiet
Word Final tie, high, why, guy
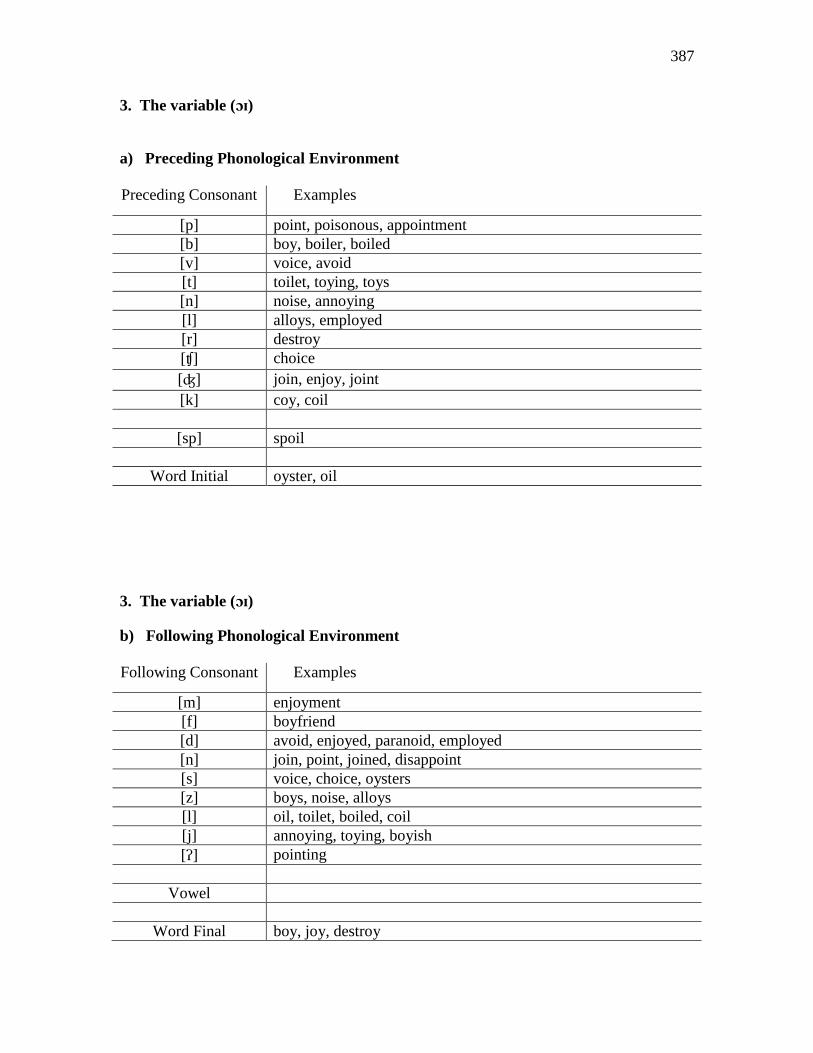
387
3. The variable ()
a) Preceding Phonological Environment
Preceding Consonant Examples
[p] point, poisonous, appointment
[b] boy, boiler, boiled
[v] voice, avoid
[t] toilet, toying, toys
[n] noise, annoying
[l] alloys, employed
[r] destroy
[] choice
[] join, enjoy, joint
[k] coy, coil
[sp] spoil
Word Initial oyster, oil
3. The variable ()
b) Following Phonological Environment
Following Consonant Examples
[m] enjoyment
[f] boyfriend
[d] avoid, enjoyed, paranoid, employed
[n] join, point, joined, disappoint
[s] voice, choice, oysters
[z] boys, noise, alloys
[l] oil, toilet, boiled, coil
[j] annoying, toying, boyish
[] pointing
Vowel
Word Final boy, joy, destroy
388
Appendix E
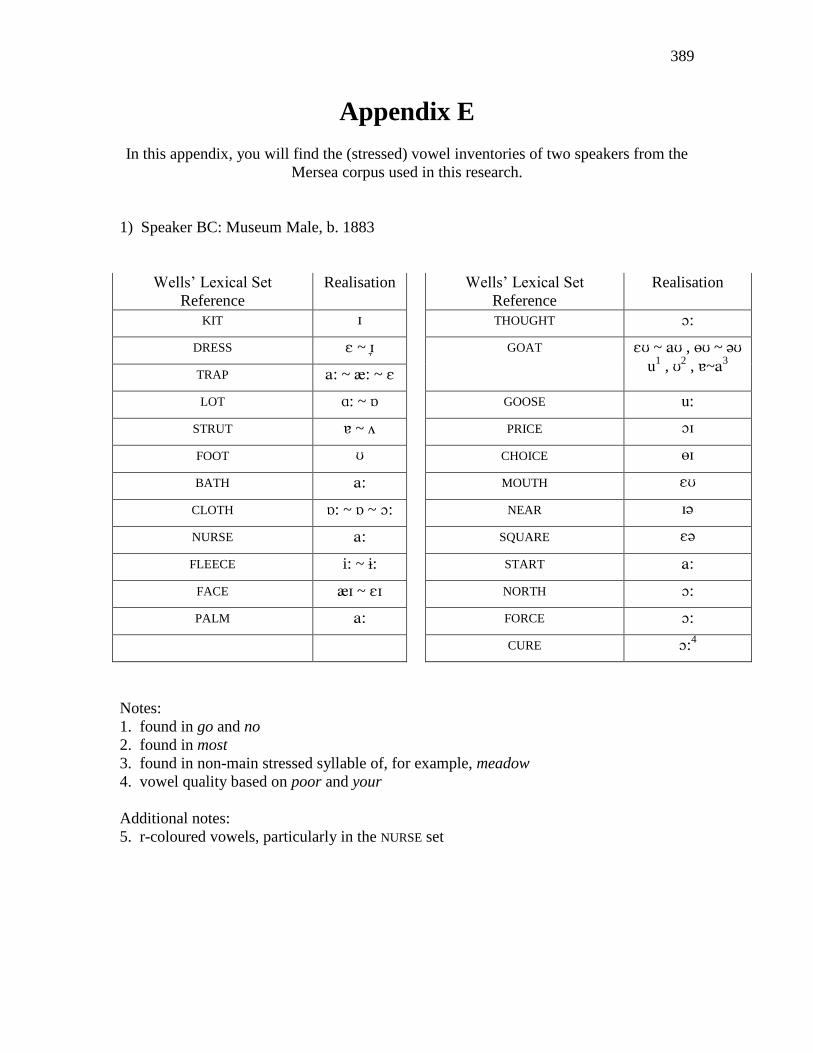
389
Appendix E
In this appendix, you will find the (stressed) vowel inventories of two speakers from the
Mersea corpus used in this research.
1) Speaker BC: Museum Male, b. 1883
Wells’ Lexical Set
Reference
Realisation Wells’ Lexical Set
Reference
Realisation
KIT THOUGHT :
DRESS ~ GOAT ~ , ~
1 , 2
, ~3
TRAP : ~ : ~
LOT : ~ GOOSE :
STRUT ~ PRICE
FOOT CHOICE
BATH : MOUTH
CLOTH : ~ ~ : NEAR
NURSE : SQUARE
FLEECE i: ~ i: START :
FACE ~ NORTH :
PALM : FORCE :
CURE :4
Notes:
1. found in go and no
2. found in most
3. found in non-main stressed syllable of, for example, meadow
4. vowel quality based on poor and your
Additional notes:
5. r-coloured vowels, particularly in the NURSE set
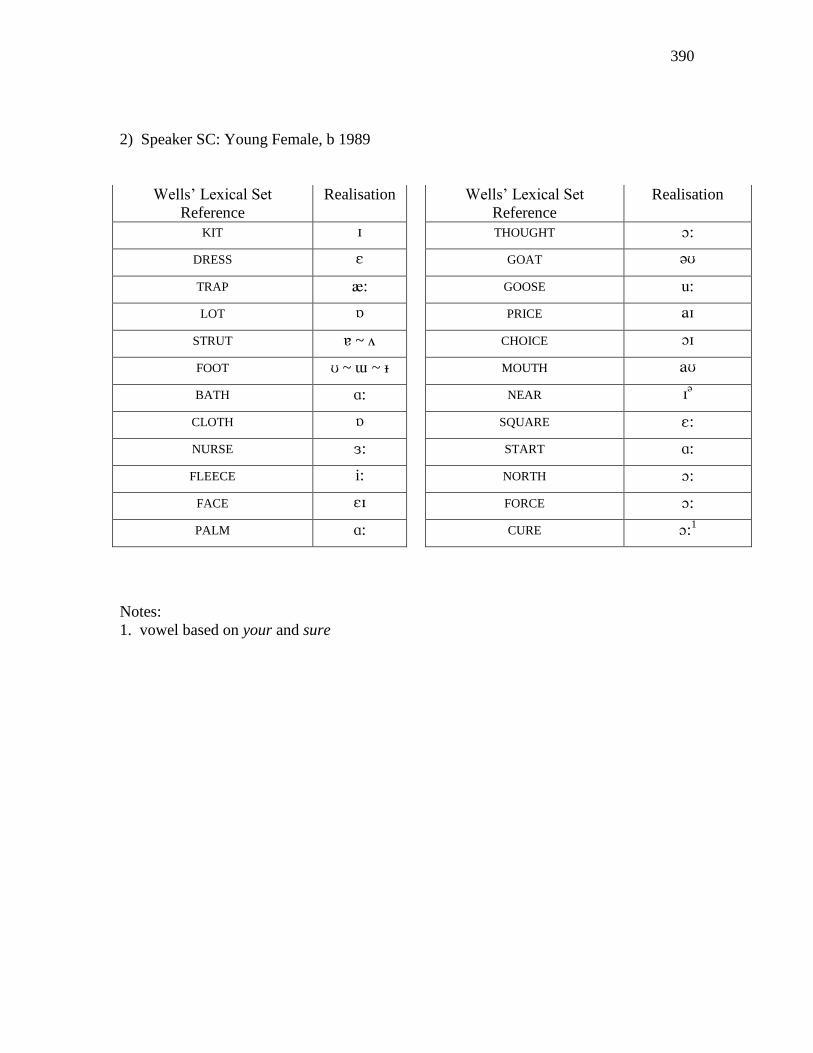
390
2) Speaker SC: Young Female, b 1989
Wells’ Lexical Set
Reference
Realisation Wells’ Lexical Set
Reference
Realisation
KIT THOUGHT :
DRESS GOAT
TRAP : GOOSE :
LOT PRICE
STRUT ~ CHOICE
FOOT ~ ~ MOUTH
BATH : NEAR
CLOTH SQUARE :
NURSE : START :
FLEECE i: NORTH :
FACE FORCE :
PALM : CURE :1
Notes:
1. vowel based on your and sure