Embed Size (px)
Citation preview

A Social Policy Framework for
A L B E R T A : FAIRNESS AND JUSTICE FOR ALL
O C T O B E R 2 0 1 2
P a r k l a n d I n s t i t u t e A l b e r t a C o l l e g e o f S o c i a l W o r k e r s
D I A N A G I B S O N

Parkland Institute, Edmonton O!ce11045 Saskatchewan Drive, Edmonton, T6G 2E1t: (780) 492-8558 e: [email protected]
Alberta College of Social Workers, Edmonton O!ce#550 10707 100 Avenue NW, Edmonton, T5J 3M1t: (780) 421-1167 e: [email protected]
ISBN 978-1-894949-33-0
Acknowledgements 5
About the ACSW 6
About Parkland Institute 6
Executive summary 7
1.0 INTRODUCTION 10
2.0 INEQUALITY HURTS US ALL 12
2.1 Inequality is bad for the economy 12
2.2 Inequality is bad for wellbeing 14
3.0 INEQUALITY IN ALBERTA 16
3.1 Share of earnings in Alberta 17
3.2 Share of income after taxes 17
3.3 Income inequality on the rise 18
3.4 The rise of the top 1 percent 21
3.5 CEO salaries 23
3.6 Gender gap 23
4.0 POVERTY INTENSITY 24
4.1 2008 recession: unequal impact 24
4.2 Why is poverty intensifying? 26
5.0 FAMILIES ON A TREADMILL 28
5.1 Alberta families vulnerable 28
5.2 Working is not a ticket out of poverty 29
5.3 Social disparity and inequality of wellbeing 30
6.0 ALBERTA’S TAX AND TRANSFERS MINIMALLY REDUCE INEQUALITY 34
6.1 Alberta’s low taxes 36
6.2 Corporate taxes 37
6.3 Royalties giveaway 38
6.4 Social spending decreasing 39
7.0 CONCLUSIONS AND RECOMMENDATIONS 40
Contents

4 A Social Policy Framework for Alberta: Fairness and Justice for All
TABLE 1 | GDP in Millions adjusted for inflation, 1995 to 2010 16
TABLE 2 | Alberta median and mean income (after tax), 1995-2009 (2009 constant dollars) 20
TABLE 3 | Alberta recession impacts on average after tax income, by decile 25
FIGURE 1 | Share of earnings, top and bottom half of households, Alberta 2009 17
FIGURE 2 | Share of after tax incomes, Alberta 2009 18
FIGURE 3 | Alberta Gini coefficient, 1995 to 2009 19
FIGURE 4 | Median income top and bottom 10 percent of Alberta Households (2009 constant dollars) 19
FIGURE 5 | Top 1 percent share of pre-tax income 21
FIGURE 6 | Threshold for entering and average income of the top 1 percent, Provinces and Canada, 2009 22
FIGURE 7 | Alberta CEO and average incomes, 2009 23
FIGURE 8 | Welfare incomes as a percentage of Market Basket Measure, lone parent with one child, Alberta and Canada, 2000 to 2009 26
FIGURE 9 | Hours per day of paid and unpaid work or study, OECD, 2011 31
FIGURE 10 | Average total leisure time, by province 32
FIGURE 11 | Sense of belonging to community 33
FIGURE 12 | Provincial/territorial tax bracket comparison 35
FIGURE 13 | Alberta’s tax gap 36
FIGURE 14 | Corporate taxes and profits in Alberta 37
FIGURE 15 | Alberta social spending per capita 39
Tables and Figures

October 2012 5
A C K N O W L E D G E M E N T S
The author would like to acknowledge Armine Yalnizyan, Hugh Mackenzie, Michael Veall and Tim Berrett for con-tributing data for the report and Lori Sigurdson for extensive input. Also thanks to the advisory committee mem-bers, Trish Henessey, Barbara McPherson, Trevor Harrison, Joe Ceci, Maureen Wilson, and Anne Marie McLaughlin. Thanks to Nadene Rehnby at Hands on Publications for editing and Jes Elliott for layout. Finally, the author would like to thank all of the participants and presenters at the symposium.

6 A Social Policy Framework for Alberta: Fairness and Justice for All
A B O U T T H E A S C W
The Alberta College of Social Workers regulates social work practice in Alberta. Its primary focus is to serve and protect the public interest by promoting skilled and ethical social work. Social Workers work with people across the lifespan from infants to seniors. The fields of practice of the profession range from direct service delivery and community development to advocacy and policy development. To complement its legislated obliga-tions, ACSW advocates for policies, programs, and services that serve the public interest. Across the province, much of the work Registered Social Workers do is with those who are vulnerable and marginalized.
A B O U T PA R K L A N D I N S T I T U T E
Parkland Institute is an Alberta research network that examines public policy issues. It is based in the Faculty of Arts at the University of Alberta and its research network includes members from most of Alberta’s academic institutions as well as other organizations involved in public policy research. Parkland Institute was founded in 1996 and its mandate is to:
Conduct research on economic, social, cultural, and political issues facing Albertans and Canadians;
Publish research and provide informed comment on current policy issues to the media and the public;
Sponsor conferences and public forums on issues facing Albertans; and
Bring together academic and non-academic communities.
All Parkland Institute reports are academically peer reviewed to ensure the integrity and accuracy of the research. For more information visit www.parklandinstitute.ca

October 2012 7
Executive Summary
Alberta is blessed with abundant lucrative natural resources. The province is uniquely positioned to lead the nation in quality of life and wellbeing. It is time to ensure that all Albertans share in the province’s wealth. Albertans from across the income spectrum benefit from efforts to reduce disparity.
Disparity erodes social and economic wellbeing for everyone across the income spectrum. Prominent national and international institutions such as the International Monetary Fund, the World Bank and the Conference Board of Canada agree that pronounced inequality has a negative impact on the economy. Recent research has made clear that reduced income inequality improves the efficiency and duration of economic growth. Other research clearly shows that inequality is correlated with numerous social chal-lenges and negatively affects the quality of life of all Albertans.
This report uses a disparity approach that encom-passes both poverty and inequality and makes clear how all Albertans are affected. All Albertans stand to gain from reduced inequality. The report reveals that Alberta’s social programs and income transfer systems
have not kept up with growing disparity and have failed to address the structural causes of Alberta’s social and economic disparity.
This report is an update of an Alberta College of Social Workers (ACSW) discussion paper, Social Policy Frame-work 2010: Visioning a More Equitable and Just Alberta, which mapped the disparity gap and its effects on low-income and middle-income Albertans. As a com-ponent of ACSW’s Closing the Disparity Gap Project, it analyzed the causes of Alberta’s social and economic disparities and offered concrete recommendations for policy choices geared to reducing social and economic disparities in Alberta.
The 2012 update builds on this earlier work by exam-ining new research on the causes, consequences and impacts of inequality, exploring how the recession and recent recovery have affected disparity, and by illustrating the need for change in Alberta’s system of taxes and transfers.
This study finds that Alberta’s top 1 percent are by far the wealthiest in the nation, while at the bottom Alberta has the most intense poverty. Disparity in

8 A Social Policy Framework for Alberta: Fairness and Justice for All
Alberta is characterized by factors including:
A boom and bust economy;An inequality of income, with the vast majority of earnings ending up in the hands of the top half of earners;A deteriorating situation, with inequality in Al-berta worsening since the mid-1990s; A rapid growth in incomes at the very top of the income spectrum. Alberta’s top 1 percent are both much wealthier than the rest of Canada and hold one of the highest share of income in the nation; andAn intensification of poverty.
Poverty is one of the drivers of inequality in Alberta. The poverty gap is a measure of the distance between the average income of a person in low income to the poverty line. In 2010 Alberta had the highest poverty gap in the country. The situation was exacerbated dur-ing the recent recession: the poorer the Albertan, the more severe the reduction in income. Other factors implicated in the intensification of poverty in Alberta include: limited protection for unemployed workers, high poverty rates for single-parent households, low social assistance rates, the lowest rate of unionization in the country and a meagre minimum wage.
Inequality has had a negative effect on the wellbe-ing of many Alberta families. As indicated by debt to income ratios, many families are economically vulner-able. Due to the low educational attainment and self-employment of many Albertans, working offers little protection from vulnerability. Given the province’s low minimum wage, working is not a ticket out of poverty.
For Alberta families, economic disparity is paralleled by broader inequality of wellbeing. Low- and middle- income families endure longer working hours without adequate compensation in the form of increased incomes. As a result, many families lack both time and money.
Recent research indicates Canadians work longer hours and get less paid vacation than their European
counterparts. Alberta is one of the hardest work-ing provinces in one of the hardest working nations. Albertans average five hours of leisure per day com-pared to a national average of 5.5 hours. Working harder comes at significant cost to the province, as Albertans struggle to find time to invest in individual, family, and community wellbeing.
The system of federal and provincial income transfers has failed to effectively address inequality. Canada compares poorly with Nordic nations in terms of the successful stabilization of inequality through income transfer programs. The situation is particularly bad in Alberta, where the flat tax limits the province’s ability to respond to inequality through income redistribu-tion. Indeed, the flat tax means that lower-income Albertans pay higher income tax rates than other Canadians, while those at the top of the income spec-trum pay by far the lowest rates in the nation.
Along with the wealthy, corporations are given a big tax advantage in Alberta. Alberta’s general corporate tax rate is tied for lowest in the nation at 10 percent – and Canada has some of the lowest tax rates in the developed world. Because of low corporate taxes, the meteoric rise in profits experienced by Alberta corpo-rations has brought relatively few benefits for most Albertans.
Low royalty rates have meant that Albertans have been deprived of significant oil and gas revenues. In 1971 Premier Lougheed’s cabinet established that 35 percent of revenues were to be captured through royalties. The government has failed to meet this target, which has deprived Albertans of the benefits of billions of dollars in provincial revenue. These fore-gone royalties might have been used to support key programs such as health care, education, and social supports, all of which may have reduced poverty and inequality while increasing social wellbeing.
Alberta is enormously prosperous – but the province’s prosperity is distributed in a drastically uneven man-ner. Economic growth has occurred in the context of widening inequality, intensified poverty and an erosion of social wellbeing. Not only have the rich

October 2012 9
benefited far more than the average Albertan house-hold, but also many Albertans are becoming worse off. Alberta’s growth has been characterized by both a high concentration of wealth at the top of the eco-nomic spectrum and intense poverty at the bottom. The recent recession has only exacerbated this pat-tern. Alberta’s social and economic disparity is more pronounced for women and Indigenous people.
In its 2010 Social Policy Framework, the ACSW aimed to narrow the gap between wealthy and other Alber-tans in terms of both income and quality of life by developing a new policy paradigm that emphasized collective benefit over individual gain. The frame-work provides an excellent basis for future provincial government efforts to develop new social policies to address poverty and inequality in Alberta. As the 2012 update demonstrates, provincial government action to reduce disparity and improve the lives of all Alber-tans is needed now more than ever.
The key elements of the ACSW social policy framework are:
1: Improve quality of life;
2: Ensure dignity and an adequate income for the most vulnerable;
3: Implement progressive revenue reform;
4: Protect workers;
5. Strengthen democracy and good gover- nance;
6. Invest in housing affordability; and
7. Strengthen community services.

10 A Social Policy Framework for Alberta: Fairness and Justice for All
The level of equality within a society is a key driver of wellbeing for the whole society. Though poverty is part of the wellbeing puzzle, relative income plays a critical role. 1 In fact, studies have shown that as income inequality increases, so too does poverty.2 The two are faces of the same coin. Equality of opportunity or, on the flip side, social and economic disparity mat-ters for the quality of life of all, from the less fortunate to the wealthiest.
This report was initiated to explore how Alberta’s growth is being distributed and how it is impacting economic and social wellbeing. It updates the March 2010 report by the Alberta College of Social Work-ers (ACSW) and Parkland Institute titled Social Policy
1 Wellbeing is used as defined by the Canadian Index of Wellbeing. See Canadian Index of Wellbeing. 2011. “How are Canadians Really Doing? Highlights: Canadian Index of Well-being” Waterloo, Ontario: Canadian Index of Wellbeing and University of Waterloo.
2 Raphael, Dennis. 2002. “Poverty, Income Inequality, and Health in Canada.” Toronto, Ontario: School of Health Policy and Management, York University and The CSJ Foundation for Research and Education. June.
Framework 2010: Visioning a More Equitable and Just Alberta.3 These reports are part of the Closing the Disparity Gap Project launched by the Alberta College of Social Workers. That project includes a multi-sector stakeholder process to generate ideas and develop practical solutions to the problem of economic and social disparity in Alberta. The research process for both reports included numerous symposia to engage community leaders as well as academics in discussions on the key causes of disparity and to workshop policy recommendations.
The 2010 report proposed a broad policy agenda for reducing disparity in Alberta, premised on six core principles: dignity and respect; equality; equity; com-prehensiveness; quality services; and social dialogue.4
3 Alberta College of Social Work. 2010. “ACSW Social Policy Framework 2010: Visioning a More Equitable and Just Alberta.” ACSW. March.
4 The principles are drawn from the Canadian Association of Social Workers. 2005. “Social Policy Principles and CASW Code of Ethics.”
1.0 Introduction

October 2012 11
This report uses the disparity approach because it encompasses both poverty and inequality. A poverty reduction approach alone is too narrow in that it does not address the social costs and consequences of inequality, which range from poorer health outcomes to higher rates of violent crime. Additionally, the dis-parity approach makes sense because the structural drivers of inequality are also the drivers of poverty. The disparity gap refers to the economic and social distance between the richest and poorest households. Social disparities include quality of life measures such as leisure time and freedom from violence. Income inequality is the biggest driver of social exclusion.
The disparity approach describes how all Albertans are impacted by inequality. As this report shows, disparity erodes social and economic wellbeing for everyone across the income spectrum. All Albertans, including the wealthiest, have both a social and an economic stake in reducing inequality. The disparity approach identifies the structural problems driving both pov-erty and inequality in a manner that truly engages all Albertans.
Despite the recession dip, Alberta’s economy has shown tremendous growth over the past two decades. Compared to other Canadian provinces, Alberta has the highest average incomes, low unemployment rates and relatively low rates of poverty. However, this report will show that Alberta had both the least improvement in economic wellbeing in the nation between 1981 and 2010 and the steepest decline in economic wellbeing over the course of the recession.
Alberta middle- and lower- income families have benefited from the province’s economic growth in that fewer are unemployed, fewer live in poverty, and incomes have risen. However, this report explores how the province’s meteoric rise in economic growth has happened against a backdrop of widening inequality, intensified poverty and an erosion of social wellbeing.
Not only have the rich benefited far more than the average Alberta household, but many Albertans are worse off, as witnessed by data in this report on pov-erty, work hours, and economic vulnerability.
The Government of Alberta has taken some steps forward, such as protecting health care and K–12 education spending, increasing incomes for social assistance recipients with disabilities through the Assured Income for the Severely Handicapped (AISH) programme, and slightly increasing the minimum wage. While some of these initiatives have been help-ful, others have excluded citizens based on definitions of deserving and undeserving poor. Additionally, for some of these measures, there have been unintended negative consequences. For example, increasing AISH payments can encourage landlords to increase rent, or mean a loss of eligibility for other means-tested programs such as subsidized bus passes. As this report sets out, Alberta’s social programs and transfer system have failed to keep up with rising inequality and have not addressed the broader structural causes of Al-berta’s ever-widening inequality and poverty intensity.
The first Disparity Gap Project report illustrated two decades of trends that included reduced investments in the public sector, changing tax structures that privi-lege corporations and the wealthiest among us, and the weakening of labour rights. The report also docu-mented how this led to an unprecedented increase in income inequality and social exclusion, with people of colour, newcomers, people with disabilities, women, and especially Alberta’s Indigenous peoples suffering the highest levels of economic and social exclusion.
This report is an update of key aspects of the March 2010 report, exploring new research and analysis on the causes, consequences and impacts of inequality, how the recession and recent recovery have impacted disparity, and the need for change in Alberta’s system of taxes and transfers. The report focuses on both eco-nomic and social disparity and how Albertans’ wellbe-ing is jeopardized.
Much has changed in public discourse around inequal-ity since the Occupy Wall Street movement took the international stage by storm. Inequality has become a household word and the concentration of wealth at the top has been put under a microscope. This report documents and expands on that analysis.

12 A Social Policy Framework for Alberta: Fairness and Justice for All
There is a growing convergence in international eco-nomic opinion that high levels of inequality can have a negative impact on the economy. This represents a departure for many mainstream institutions, such as the International Monetary Fund (IMF), the World Bank and the Conference Board of Canada.
Previously, mainstream economic institutions such as the IMF had assumed that inequality of income distribution was a necessary part of economic growth, enabling a surplus of income at the top for invest-ment and efficiency. This new research has turned that on its head, instead indicating that reduced income inequality may in fact improve efficiency and duration of growth.
Recent work by researchers at the IMF examining factors in the duration of growth identified that the factor most significantly correlated with longer-term economic growth is equality of income distribution. Levels of income equality showed a higher correla-tion with economic growth than stability of political institutions, trade openness, exchange rate competi-tiveness, external debt, or foreign direct investment.
The IMF’s conclusion was that: “...income distribution survives as one of the most robust and important fac-tors associated with growth duration.” The researchers added, “To borrow a marine analogy: a rising tide lifts all boats, and our analysis indicates that helping raise the smallest boats may help keep the tide rising for all craft, big and small.”5
According to the Conference Board of Canada, when asking the question, what is the impact of inequality on the economic wellbeing of a country, “The answer is that high inequality can diminish economic growth if it means that the country is not fully using the skills and capabilities of all its citizens or if it undermines social cohesion, leading to increased social tensions.” 6
Nobel Prize winner Joseph Stiglitz, author of The Price of Inequality and a former chief economist at the World
5 Berg, Andrew G. and Jonathan D. Ostry. 2011. “Inequal-ity and Efficiency: Is there a trade-off between the two or do they go hand in hand?” International Monetary Fund, Finance & Development , September 2011, Vol. 48, No. 3 http://www.imf.org/external/pubs/ft/fandd/2011/09/Berg.htm
6 Conference Board of Canada. 2011. Canadian Income Inequality, Is Canada Becoming More Unequal? July.
2.0 Inequality Hurts Us All2.1 I N E Q U A L I T Y I S B A D F O R T H E E C O N O M Y
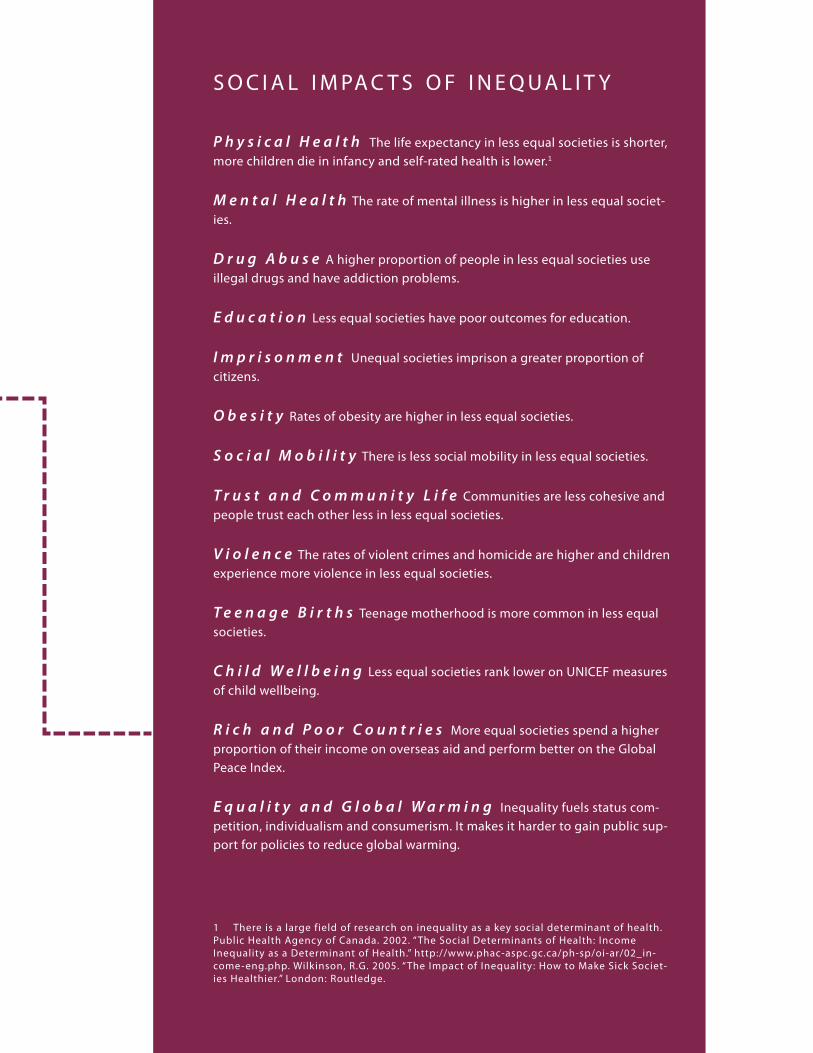
S O C I A L I M PA C T S O F I N E Q U A L I T Y
P h y s i c a l H e a l t h The life expectancy in less equal societies is shorter, more children die in infancy and self-rated health is lower.1
M e n t a l H e a l t h The rate of mental illness is higher in less equal societ-ies.
D r u g A b u s e A higher proportion of people in less equal societies use illegal drugs and have addiction problems.
E d u c a t i o n Less equal societies have poor outcomes for education.
I m p r i s o n m e n t Unequal societies imprison a greater proportion of citizens.
O b e s i t y Rates of obesity are higher in less equal societies.
S o c i a l M o b i l i t y There is less social mobility in less equal societies.
T r u s t a n d C o m m u n i t y L i f e Communities are less cohesive and people trust each other less in less equal societies.
V i o l e n c e The rates of violent crimes and homicide are higher and children experience more violence in less equal societies.
T e e n a g e B i r t h s Teenage motherhood is more common in less equal societies.
C h i l d W e l l b e i n g Less equal societies rank lower on UNICEF measures of child wellbeing.
R i c h a n d P o o r C o u n t r i e s More equal societies spend a higher proportion of their income on overseas aid and perform better on the Global Peace Index.
E q u a l i t y a n d G l o b a l W a r m i n g Inequality fuels status com-petition, individualism and consumerism. It makes it harder to gain public sup-port for policies to reduce global warming.
1 There is a large field of research on inequality as a key social determinant of health. Public Health Agency of Canada. 2002. “ The Social Determinants of Health: Income Inequality as a Determinant of Health.” http://www.phac-aspc.gc.ca/ph-sp/oi-ar/02_in-come-eng.php. Wilkinson, R.G. 2005. “ The Impact of Inequality : How to Make Sick Societ-ies Healthier.” London: Routledge.

14 A Social Policy Framework for Alberta: Fairness and Justice for All
Bank, has also reported on the risks to the economy of high levels of inequality. According to Stiglitz, inequal-ity results in more instability, lower economic growth, less efficiency, and less productivity; it is bad for the economy. Further, he reports that the structures that have increased inequality have been part of the system becoming increasingly unfair – the cards are perceived as stacked against some people. It has thus undermined democracy, moving from “one person one vote” to “one dollar one vote” and has undermined a well-functioning democracy. There is a myth that the wealth accumulation at the top is merit-based. However, it is the society we have created that enables people’s hard work to be translated into wealth. Sti-glitz writes: “Paying attention to everyone else’s self-interest – in other words to the common welfare – is in fact a precondition for one’s own ultimate wellbeing… it isn’t just good for the soul; it’s good for business.”7
The Commission of Experts of the President of the United Nations General Assembly on Reforms of the International Monetary and Financial System also re-ported that the origins of the financial crisis included growing levels of inequality.8
In summary, as Joseph Stiglitz said: “The top 1 percent have the best houses, the best educations, the best doctors, and the best lifestyles, but there is one thing that money doesn’t seem to have bought: an under-standing that their fate is bound up with how the other 99 percent live.”9
7 Stiglitz, J.E. 2012. “ The Price of Inequality : How Today’s Divided Society Endangers Our Future.” W.W. Norton & Com-pany.
8 Commission of Experts of the President of the United Nations General Assembly. 2009. “Report of the Commission of Experts of the President of the United Nations General Assembly on Reforms of the International Monetary and Financial System.” September.
9 Stiglitz. 2012. Op. cit.
2.2 I N E Q U A L I T Y I S B A D F O R W E L L B E I N G
There is a broad and robust body of research on the impacts of inequality on social and economic wellbeing. At the forefront of this work are Richard Wilkinson and Kate Pickett with The Spirit Level. 10 Based on data from scores of countries and studies, this research looked at inequality both between and within countries, rich and poor. What has emerged is a convergence of opinion that disparity is strongly correlated with a broad range of social ills and that it is harmful not only to social wellbeing, but to the very foundation of the economy. Key findings on the social impacts of inequality, outlined in the summary of Wilkinson and Pickett’s work, are set out on page 13.
Disparity jeopardizes the fabric of the social relation-ships that make our communities good places to live, work, raise children and grow old. The social impacts identified by Wilkinson and Pickett are critical ele-ments in the quality of life for all Albertans. Some measures – violence rates, trust, community life, and addictions incidence– impact on all individuals direct-ly, in their homes and communities. Others – obesity, incarceration rates and poor education and health outcomes – are expensive, and result in higher costs across society. Some of these costs are quantified in the recent study Poverty Costs, An Economic Case for a Preventative Poverty Reduction Strategy in Alberta.11 According to that study, poverty alone costs Alberta between $7.1 and $9.5 billion per year.
10 Wilkinson, Richard and Kate Pickett. 2010. “ The Spirit Level: Why Inequality Makes Societies Stronger.” New York: Bloomsbury Press.
11 Briggs, A. and C.R. Lee. 2012. “Poverty Costs, An Eco-nomic Case for a Preventative Poverty ReductionStrategy in Alberta.” Calgary: Vibrant Communities Calgary and Action to End Poverty in Alberta.
TITLE HERESeptember 2012

October 2012 15
Inequality also has a racist face. Disparity is most ex-treme for Indigenous peoples:
Income disparities are severe, with Indigenous incomes at two thirds the average income for men and one half for women;
Levels of unemployment are double and even triple the average;
Indigenous children are significantly over-repre-sented in children in care;
There is disproportionate representation of Indig-enous people at all stages of the justice system, both as victims and offenders;
Levels of educational attainment are much lower;
Health outcomes are much poorer;
Housing quality is lower; and
There is less food security amongst Indigenous Canadians.12
Inequality also has a sexist side. Gender inequalities can be seen in the persistent gap between women’s and men’s wages. Women also face greater barriers to employment than men due to lack of quality childcare, poorer access to training and skills-development pro-grams, and discriminatory wage ceilings.13
12 Data sources: Statistics Canada, Aboriginal Population Profile, 2006 Census, Aboriginal Children’s Survey (ACS): Tables 5.1-5.3. Charlotte Loppie Reading and Fred Wien, Health Inequalities and Social Determinants of Aboriginal People’s Health (National Collaborating Centre for Aboriginal Health), 2009.
13 For more information on Alberta’s gender gap, see: Parkland Institute. 2012 “Alberta’s Wage Gap Still Highest in Canada.” March.
TITLE HERESeptember 2012

16 A Social Policy Framework for Alberta: Fairness and Justice for All
The backdrop for any conversation about income dis-tribution in Alberta is the boom and bust rollercoaster the economy continues to ride. Alberta’s economy has recovered from the brief recessionary dip and tipped back into growth. Table 1 shows real growth in the size of Alberta’s economy as measured by Gross Domestic Product (GDP). Table 1 also shows that despite the booms and busts historically, and the recent recession, Alberta has experienced a general trend of extraor-dinary economic growth since the 1990s. Indications from investment levels in the oil and gas sector are that the province is on the cusp of another boom, if not already in it. The provincial government estimates real growth levels of GDP in the 3 to 3.8 percent range between 2011 and 2015.14
14 Government of Alberta. 2012. “Budget 2012: Investing in People.” Economic Outlook. p. 66. http://www.finance.alberta.ca/publications/budget/budget2012/fiscal-plan-economic-outlook.pdf
3.0 Inequality in Alberta
T A B L E 1 | G D P i n M i l l i o n s a d j u s t e d f o r i n f l a t i o n , 1 9 9 5 t o 2 0 1 0
Source: CANSIM, Table 3840013, Alberta; Gross domestic product,
chained (2002) dollars, V3839827, Statistics Canada.

October 2012 17
3.1 S H A R E O F E A R N I N G S I N A L B E R TA
In the context of how Alberta’s booms and busts are being shared across incomes, this section ex-plores earnings to see how equally effort is rewarded through work. Earning equality is a large factor in self-esteem and perception of fairness. This section also
F I G U R E 1 | S h a r e o f e a r n i n g s , t o p a n d b o t t o m h a l f o f h o u s e h o l d s , A l b e r t a 2 0 0 9
looks at how the pie is divided after tax to illustrate how well the tax system is redistributing income.
A glance at the distribution of earnings in Alberta reveals that the vast majority of earnings end up in the hands of the top half of earners. Figure 1 illustrates the share of earnings going to the top half and bottom half of households. A full 87 percent of earnings goes to the top half of households, leaving the other half with just under 13 percent.
3.2 S H A R E O F I N C O M E A F T E R TA X E S
Taking a look at how income is shared after taxes, redistribution of income shows a similar though less dramatic picture of inequality to that of earnings. Figure 2 looks at what income is left after tax and how that income pie is divided. With Albertans divided into 10 income groups (deciles), one can see that the top 10 percent of households has almost one third of the pie while the bottom group has 1.7 percent. The figure shows that the only groups with even close to a pro-portionate amount of income are the fourth and fifth from the top which actually have close to 10 percent of the pie to match their 10 percent of the population. Whether before or after tax, a large share of Alberta’s income is going to a relatively small number of Alber-tans.
Source: Statistics Canada, Survey of Labour and Income Dynamics
(SLID) data, household earnings, all family types based on custom tab-
ulations from the Canadian Centre for Policy Alternatives, unpublished.
Bottom 50% Top 50%
Share ofearnings
2009, 13%
Share ofearnings
2009, 87%

18 A Social Policy Framework for Alberta: Fairness and Justice for All
3.3 I N C O M E I N E Q U A L I T Y O N T H E R I S E
Income inequality is rising across Canada. Like most developed economies, Canada was on a path of con-tinuous decline in both inequality and poverty rates for 20 years, but these have turned around dramatical-ly and increased rapidly in the past 10 years. By 2011, Canada had reached levels above the average of other countries in the Organization for Economic Coopera-tion and Development (OECD), ranking 12th out of 17 peer countries for poverty and inequality.
Alberta is also one of the nation’s leaders in inequality. A number of measures can be used to reflect changes in economic inequality – this section uses three: the Gini coefficient; the ratio of those with incomes over $100,000 to those with incomes under $40,000; and the gap between median and mean income. All three measures reflect increased inequality in Alberta since
the mid-1990s and place Alberta above the Canadian average for economic disparity.
Gini coefficientThe Gini coefficient is the standard measure of in-come inequality internationally. The index measures how much income distribution deviates from equal-ity within a defined region on a scale of 0 to 1. A Gini coefficient of zero indicates perfect equality (every-one’s income in a society is the same), while a Gini coefficient of one corresponds to a situation in which all income in a society is held in the hands of one individual.
The trend line in Figure 3 shows that the distribution of income in Alberta has become less equal. Alberta’s Gini coefficient increased from .298 in 1995 to .339 in 2009; this is above the Canadian average. By com-parison, Scandinavian countries and much of Central Europe had a Gini coefficient of less than .30 in 2009.
F I G U R E 2 | S h a r e o f a f t e r t a x i n c o m e s , A l b e r t a 2 0 0 9
Source: Statistics Canada, Survey of Labour and Income Dynamics (SLID) data, shares of after tax income, (2009 $) by decile 1976–2009; economic
households; Alberta. Based on custom tabulations from the Canadian Centre for Policy Alternatives, unpublished.

October 2012 19
F I G U R E 3 | A l b e r t a G i n i c o e f f i c i e n t , 1 9 9 5 t o 2 0 0 9
Source: Statistics Canada, CANSIM Table v21152846 Alberta; Gini coefficient, After-tax income; Economic families, two persons or more.
GINI
0 - complete equality (everyone has the same income)
1- radical inequality (one person has all the income)
F I G U R E 4 | M e d i a n i n c o m e t o p a n d b o t t o m 1 0 p e r c e n t o f A l b e r t a H o u s e h o l d s ( 2 0 0 9 c o n s t a n t d o l l a r s )
Source: Statistics Canada, Survey of Labour and Income Dynamics (SLID) data, shares of after tax income, (2009 $) by decile 1976–2009; economic
households – non-senior; Alberta. Based on custom tabulations from the Canadian Centre for Policy Alternatives, unpublished.
Top Ten PercentBottom Ten Percent
2009
0.35
0.34
0.33
0.32
0.31
0.30
0.29
0.28
0.27
1995
1996
1997
1998
1999
2000
2001
2002
2003
2004
2005
2006
2007
2008
2009
1976
1978
1980
1982
1984
1986
1990
1992
1994
1996
1998
2000
2002
2004
2006
2008
2009
250000
200000
150000
100000
50000
0

20 A Social Policy Framework for Alberta: Fairness and Justice for All
T A B L E 2 | A l b e r t a m e d i a n a n d m e a n i n c o m e ( a f t e r t a x ) , 1 9 9 5 – 2 0 0 9 ( $ 2 0 0 9 c o n s t a n t d o l l a r s )
Source: Statistics Canada, CANSIM Table 202-‐0401 Distribution of total income, by economic family type, all family types, V1552607
and V1552608.
Alberta’s trend line shows significant volatility, likely due to the resource revenues and the boom and bust path the province has been on.
Alberta’s widening gap in median incomeFigure 4 shows the changes in median after tax income for the highest and lowest ten percent of households (non-senior) between 1976 and 2009. The image shows a steep increase in income at the top end, which is not mirrored at all at the lowest income level. The median income of the lowest ten percent of Albertans actually fell from $9200 in 1976, to $7500 in 1999, after which it slowly rose to $12600 in 2009. The income of the top ten percent, on the other hand, rose from $147,100 to $216,600, with a small dip in the mid 1990s. The trend lines in Figure 4 reveal the dramatic divergence in the fortunes of the highest and lowest deciles of Alberta households and the widen-ing gap in the province.
Gap between median and mean incomeThe gap between median and mean income also is an indicator of changes in inequality. Mean income can be distorted by a small number of high earners that pull the average up. Median income – the middle line at which half the households earn more and half earn less – controls for some of that distortion, providing a more accurate figure of average income. The gap between the two indicates incomes are unequally distributed, and a growing gap means disparity is on the rise.
While the median income in Alberta has grown modestly, the mean income has increased much more dramatically, driven by excessive wealth at the top of the income spectrum. In 1995 the median income was $49,500 while the mean was $59,100, with a difference of 16 percent. In 2009 the median had increased to $68,100 while the mean had grown to $85,900, with a difference of 21 percent. The gap between the me-dian and the mean has grown, showing that disparity has grown.

October 2012 21
F I G U R E 5 | T o p 1 p e r c e n t s h a r e o f p r e - t a x i n c o m e
Source: Statistics Canada Longitudinal Administrative Data (LAD) database, based on a 20 per cent sample of tax files. Based on custom tabulations by Mike Veall, McMaster University. (Veall. Op. cit. With data updated to 2009, provided in May 2012, unpublished.)
3.4 T H E R I S E O F T H E T O P 1 P E R C E N T
The widening gap in income distribution, both in Alberta and across Canada, is being driven predomi-nantly by rapid growth in incomes at the top. Accord-ing to OECD figures, the richest 1 percent of Canadi-ans saw their share of total income increase from 8.1 percent in 1980 to 13.3 percent in 2007. Moreover, the income share of the richest 0.1 percent more than doubled, from 2 percent to 5.3 percent.15 The decade from 1997 to 2007 was Canada’s fastest economic growth period, with the richest 1 percent taking 32 percent of all income growth.16
Alberta followed suit, but the trend has been more extreme. Recent data on the top 1 percent reveal that Alberta remains significantly above the Canadian figures.
The recession has moderated the top 1 percent share of wealth slightly both at the national and the pro-vincial levels. However, indications are that the share of income will again increase as Alberta’s economy continues to heat up.
Figure 5 shows that in 2009 the top 1 percent had 14.4 percent of the income share compared to 10.9 percent across Canada. Figure 5 also illustrates the growth in inequality with the top 1 percent increasing their share of income from 8.1 percent in 1982 to 14.4 percent in 2009.
To get a more detailed picture of the top 1 percent in Alberta, one can look at the threshold an individual needs to earn to get into the top 1 percent bracket and the average income for earners in that bracket.
15 OECD (2008), Growing Unequal?: Income Distribution and Pover ty in OECD Countries . Country Note: Canada.
16 Yalnizyan, Armine. 2010. “ The Rise of Canada’s Rich-est 1 %.” Canadian Centre for Policy Alternatives. December. p.3. www.policyalternatives.ca/sites/default/files/uploads/publications/National%20Office/2010/12/Richest%201%20Per cent.pdf
1982 2009

22 A Social Policy Framework for Alberta: Fairness and Justice for All
Figure 6 shows that to enter the top 1 percent in 2009 an Albertan needed to earn over $273,400, while the average income for the top 1 percent is $672,100. Alberta’s top 1 percent stands out as having by far the highest average salary in the nation. By comparison, according to Veall’s data, in 2009 the national average income for the top 1 percent was $422,400 and the threshold to enter the top 1 percent across Canada was $196,500.
F I G U R E 6 | T h r e s h o l d f o r e n t e r i n g a n d a v e r a g e i n c o m e o f t h e t o p 1 p e r c e n t , P r o v i n c e s , 2 0 0 9
Source: Top fractile income level excluding capital gains, Statistics Canada Longitudinal Administrative Data (LAD) database, based on a 20 percent sample of tax files. Based on custom tabulations by Mike Veall, McMaster University.
Alberta’s wealthy are both much wealthier than the rest of Canada and hold among the highest share of income in the nation.
AB ON BC SK YT PQ MB NWT NS NL NB PEI
Average
Threshold
$800,000.00
$700,000.00
$600,000.00
$500,000.00
$400,000.00
$300,000.00
$200,000.00
$100,000.00
$0.00
October 2012 23
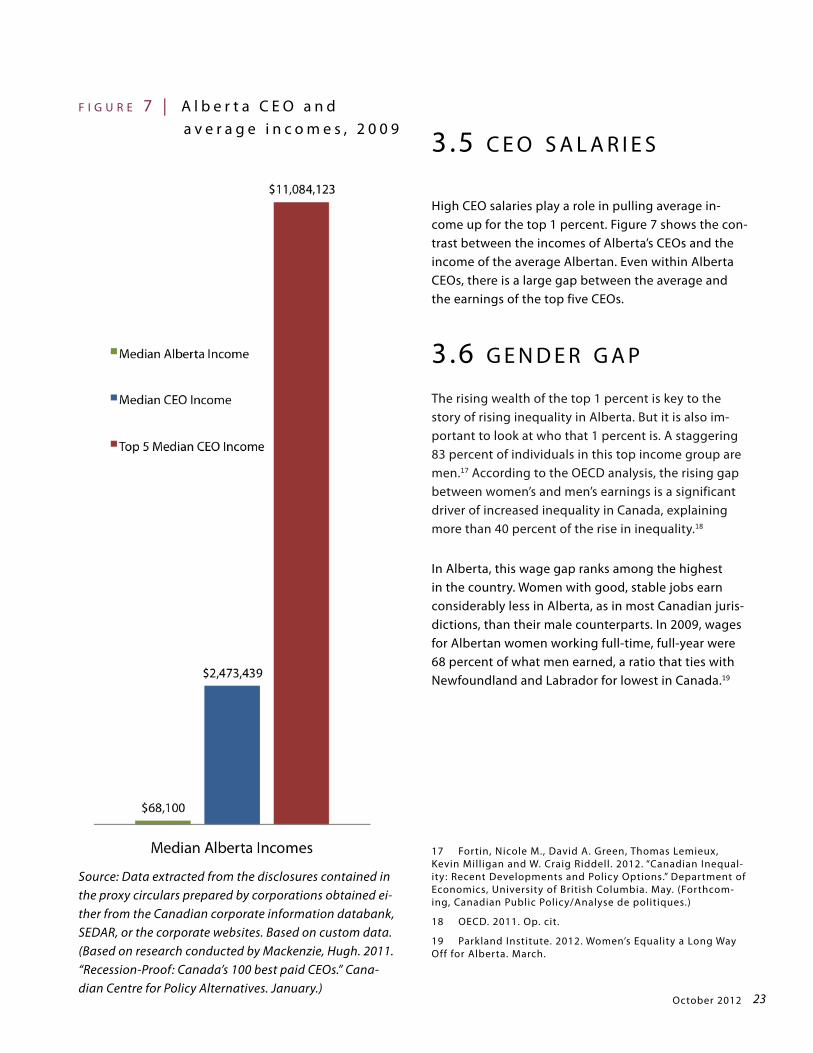
F I G U R E 7 | A l b e r t a C E O a n d a v e r a g e i n c o m e s , 2 0 0 9
Source: Data extracted from the disclosures contained in the proxy circulars prepared by corporations obtained ei-ther from the Canadian corporate information databank, SEDAR, or the corporate websites. Based on custom data. (Based on research conducted by Mackenzie, Hugh. 2011. “Recession-Proof: Canada’s 100 best paid CEOs.” Cana-dian Centre for Policy Alternatives. January.)
3.5 C E O S A L A R I E S
High CEO salaries play a role in pulling average in-come up for the top 1 percent. Figure 7 shows the con-trast between the incomes of Alberta’s CEOs and the income of the average Albertan. Even within Alberta CEOs, there is a large gap between the average and the earnings of the top five CEOs.
3.6 G E N D E R G A P The rising wealth of the top 1 percent is key to the story of rising inequality in Alberta. But it is also im-portant to look at who that 1 percent is. A staggering 83 percent of individuals in this top income group are men.17 According to the OECD analysis, the rising gap between women’s and men’s earnings is a significant driver of increased inequality in Canada, explaining more than 40 percent of the rise in inequality.18
In Alberta, this wage gap ranks among the highest in the country. Women with good, stable jobs earn considerably less in Alberta, as in most Canadian juris-dictions, than their male counterparts. In 2009, wages for Albertan women working full-time, full-year were 68 percent of what men earned, a ratio that ties with Newfoundland and Labrador for lowest in Canada.19
17 Fortin, Nicole M., David A. Green, Thomas Lemieux, Kevin Milligan and W. Craig Riddell. 2012. “Canadian Inequal-ity : Recent Developments and Policy Options.” Department of Economics, University of British Columbia. May. (Forthcom-ing, Canadian Public Policy/Analyse de politiques.)
18 OECD. 2011. Op. cit.
19 Parkland Institute. 2012. Women’s Equality a Long Way Off for Alberta. March.

24 A Social Policy Framework for Alberta: Fairness and Justice for All
Inequality in Alberta has largely been driven by wealth at the top; however, the gap has also been driven by downward pressure at the bottom.
Alberta’s dramatic economic growth has resulted in both the highest median and mean income in Canada, and absolute poverty has been reduced. However, poverty intensity increased in Alberta between 1981 and 2010. By 2010, Alberta had the highest poverty gap in the country.
The poverty gap is a measure of the distance between the average income of a person in low income to the poverty line. In 2010, Alberta’s poverty rate was 9.1 percent, the lowest in the nation, but the poverty gap was 22.7 percent – the highest. 20 Those who remained poor in Alberta were further below the poverty line than in any other province. According to the Cana-dian Index of Wellbeing, inequality and the increase in poverty intensity in Alberta has undermined the
20 Osberg, Lars and Andrew Sharpe. 2011. “Beyond GDP: Measuring Economic Wellbeing in Canada and the Provinces.” Centre for the Study of Living Standards. CSLS Research Repor t 2011-11 . September. http://www.csls.ca/reports/csls2011-11.pdf
4.0 Poverty intensity
province’s economic wellbeing.21 As mentioned earlier in this report, studies by the International Monetary Fund reveal that these trends undermine the economy and weaken economic growth, impacting everyone.
4.1 2008 R E C E S S I O N : U N E Q U A L I M PA C T
Poverty intensity in Alberta was impacted by the recession. The poorer an Albertan was, the worse the recession impacted their income. Data show a clear inverse relationship between income level and reces-sion impact by income decile (see Table 3). Though the wealthy were not immune to recession impacts, their incomes were only slightly affected; impacts increase significantly as one moves down the income scale. The top four income brackets were negligibly affected, if at all, while the bottom three income brackets saw losses of between 10 and 19 percent.
21 Osberg and Sharpe. 2011. Op cit.

October 2012 25
T A B L E 3 | A l b e r t a r e c e s s i o n i m p a c t s o n a v e r a g e a f t e r t a x i n c o m e , b y d e c i l e
Source: Statistics Canada, Survey of Labour and Income Dynamics (SLID) data, after tax household earnings, non-senior, based on custom tabulations from the Canadian Centre for Policy Alternatives.

26 A Social Policy Framework for Alberta: Fairness and Justice for All
As shown in Table 3, lower-income Albertans were sig-nificantly challenged by the last recession. As a result, there was a dramatic increase in income support and social assistance caseloads. Though these numbers have begun to decline, food bank usage remained high in 2010. According to the Alberta HungerCount 2011:
Food bank use was 75 percent higher in 2010 than in 2008, before the start of the recent reces-sion; and
The province experienced the second highest level of food bank use on record in 2011.22
22 Alberta Food Bank Network Association. 2011. “Hun-gerCount 2011 – Alberta Provincial Report.” Alberta Food Bank Network Association. http://www.foodbankscanada.ca/getmedia/02f0677c-2edf-4124-aa19-76d5edb7183e/Hunger-Count-2011-Alberta-provincial-report-final.pdf.aspx?ext=.pdf
4.2 W H Y I S P O V E R T Y I N T E N S I F Y I N G ?
Alberta’s poverty intensity is explained by a variety of factors. Disproportionate recession losses described above are part of the story. Other factors include low protection for unemployed workers, high poverty rates for single-parent households, low social as-sistance rates, and a meagre minimum wage. As the economy continues to heat up, inflation rates will increasingly erode wages and fixed incomes, and exac-erbate the shortage of affordable housing.23
23 For a discussion of the impacts of the boom on incomes and affordability, see: Gibson, Diana. 2007. “Spoils of the Boom.” Parkland Institute, University of Alberta.
F I G U R E 8 | W e l f a r e i n c o m e s a s a p e r c e n t a g e o f M a r k e t B a s k e t M e a s u r e , l o n e p a r e n t w i t h o n e c h i l d , A l b e r t a a n d C a n a d a , 2 0 0 0 t o 2 0 0 9
Source: National Council on Welfare, Welfare incomes 2009, update as of March 2011. http://www.ncw.gc.ca/[email protected]?lid=386&fid=1#Part per cent202
85%
80%
75%
70%
65%
60%2000 2001 2002 2003 2004 2005 2006 2007 2008 2009

October 2012 27
Alberta has both the highest divorce rate and the highest poverty gap for single-parent households, the majority headed by women. As mentioned earlier, Alberta also has the largest gap between women’s and men’s earnings.24
Though employment is high, making the risk of unem-ployment lower than in other provinces, employment security is marred by the poor Employment Insurance (EI) coverage for those who do lose their jobs. Be-tween 1981 and 2010, Alberta had the lowest average proportion of earnings replaced by EI in the nation.25 Alberta’s workers have the least access and the lowest benefits in the nation and are thus more vulnerable if employment is lost.
Low social assistance rates are another factor in Al-berta’s poverty intensity. The province’s rates consis-tently sit the furthest from the poverty line in Canada (see Figure 8).
Unlike many places in North America, Alberta’s eco-nomic growth has benefited middle-income families in that overall income levels have risen, fewer are un-employed, and fewer live in poverty. However, 40 per-cent of Alberta households still get by on an income of $45,000 or less, and lower- and middle-income families have been hit hardest by the recession. In the next section we will outline the significant challenges faced by families in Alberta.
24 Parkland Institute and Alberta College of Social Work-ers. 2012. “Alberta’s Wage Gap Still Highest in Canada.” Park-land Institute, University of Alberta. March.
25 Osberg and Sharpe. 2011. Op. cit.

28 A Social Policy Framework for Alberta: Fairness and Justice for All
This section looks at economic vulnerability and reces-sion impacts, as well as measures of wellbeing such as leisure time, work hours and other supports for fami-lies. These measures draw a picture of negative trends in social wellbeing that occur with rising economic inequality.
5.1 A L B E R TA FA M I L I E S V U L N E R A B L E
The economic vulnerability of households is a function of many factors. Toronto Dominion economists have constructed an index of financial vulnerability that takes into account six key metrics of household finan-cial position.26 Their study found growing vulnerability across regions in Canada, but especially in Alberta and British Columbia. The Canadian General Accountants Association of Canada (CGAA) also studied economic vulnerability in Alberta.
26 TD Economics. 2011. “Assessing the Financial Vulnerabil-ity of Households Across Canadian Regions.” Special Repor t . February 9.
These studies identified the following:
Can’t make the mortgage payment – Higher and more sharply rising 90-day mortgage delinquency rates. Rates actually jumped at the height of the boom (2007). This suggests that as the new boom heats up, this vulnerability may get worse – not better. Alberta is one of three provinces in which mortgage arrears continued to rise in 2010, when Alberta registered the highest proportion of mortgage arrears since 1990. 27
Bankruptcy rates – The rate of Albertans declaring bankruptcy is more than twice that of the average Canadian.
Household debt – A total of 43 percent of Albertans reported their debt increased, com-
27 Certified General Accountants Association of Canada (CGAA). 2011. “A Driving Force No More: Have Canadian Con-sumers Reached Their Limits?” Certified General Accountants Association of Canada. June. http://www.cga-canada.org/en-ca/ResearchReports/ca_rep_2011-06_debt-consumption.pdf
5.0 Families on aTreadmill

October 2012 29
pared to a Canadian average of 35 percent. The biggest reported reason for debt increases given was day-to-day living expenses. This marks a de-parture from past surveys, where more diversity was seen in reasons for debt (i.e. mortgages, car purchases, etc.)
This vulnerability is not distributed evenly across in-come levels. One of the key measures of vulnerability – debt to income ratios – shows significant disparity across income levels. The CGAA study revealed that increasing debt was not associated with an increase in income or wealth, but in fact, the opposite.28 In 2011, those whose income increased over the past three years and those who felt wealthier today were more likely to say their debt decreased rather than increased. The opposite was also true: individuals who reported decreased income and/or did not feel wealthier today were also more likely to report their debt increased.
5.2 W O R K I N G I S N O T A T I C K E T O U T O F P O V E R T Y
In Alberta working is not necessarily a ticket out of poverty or vulnerability. Alberta exceeds the Canadian average for factors that make workers vulnerable, for example, low educational attainment and self-employ-ment.29
When they do go to school, Albertans perform well, and the province ranked third for educational attain-ment. However, Alberta ranks tenth out of 13 prov-inces and territories for expected years of schooling.30 Workers with lower educational levels have elevated risk of being in lower-income households for which the reliance on employment income is much higher
28 CGAA. 2011. Op. cit.
29 CGAA. 2011. Op. cit.
30 Elspeth Hazell, Kar-Fai Gee and Andrew Sharpe. 2012 “ The Human Development Index in Canada.” Ottawa: Ontario: Centre for the Study of Living Standards: Research Report 2012-02.
than for other income groups, while the likelihood of experiencing longer-term unemployment is elevated. Alberta has the lowest rates of post-secondary enroll-ment in Canada. According to Statistics Canada data, in 2009/2010 Alberta’s enrollment was 4.95 percent compared to a national average of 5.56 percent.31
Alberta’s workers are also vulnerable due to low wages at the bottom. Alberta’s minimum wage has lan-guished at the lowest or close to the lowest in the na-tion for the better part of the past decade. As of March 31, 2012, Alberta had the lowest minimum wage in the country at $9.40. Alberta’s minimum wage is also two-tiered. Liquor servers are paid a lower minimum wage, $9.05 as of March, 2012. It is intended that the server minimum will be pegged to a dollar less than the gen-eral minimum, meaning it will not increase until the general minimum wage reaches $10.05.
The proportion of working Albertans relying on food banks shows that employment is not a ticket out of poverty. In 2009, 47 percent of children living in poverty resided in a household where one or more persons were working full-time, full-year.32 The prov-ince leads the nation for the percentage of households with employment income served by a food bank. According to the Alberta HungerCount 2011, one in three households helped had income from current or recent employment.33
31 Statistics Canada. The Daily. March 19, 2012.
32 Kolkman, John and Joseph Ahorro. 2011. “In This To-gether: Ending Poverty in Alberta.” Edmonton Social Planning Council, Public Interest Alberta and Alberta College of Social Workers. November.
33 Alberta Food Bank Network Association. 2011. Op. cit.

30 A Social Policy Framework for Alberta: Fairness and Justice for All
5.3 S O C I A L D I S PA R I T Y A N D I N E Q U A L I T Y O F W E L L B E I N G
The economic disparity experienced by Alberta families is paralleled by social disparity and broader inequality of wellbeing. Some key indicators in which Alberta compares poorly nationally and international-ly on family wellbeing include work hours and leisure time. There is disparity across income brackets for these indicators as well.
Work hours and stress not equalResearch indicates there is inequality in work hours and intensity. National research by economists from Dalhousie University found increases in fam-ily incomes at the top of the distribution since the mid-1990s have taken place without any significant increases in total family hours of paid work, whereas stagnation in the middle of the income distribution has occurred despite significantly higher paid hours of work.34 Data for Alberta on work hours bear this out. Work hours increased across most income brackets, but less at the top than in the middle. The top income bracket had a smaller increase in work hours but the highest increase in income, whereas the middle had a larger increase in work hours for a much smaller increase in income.35
The Dalhousie study also finds gender inequality in hours of work. Increases in real incomes have not been enough to compensate for the increased participation
34 Burton, Peter and Shelley Phipps. 2011. “Families, Time, and Wellbeing in Canada.” Canadian Public Policy . Vol. XXXVII, No. 3. pp. 395-423.
35 Statistics Canada, Survey of Labour and Income Dy-namics (SLID) data, household earning, non-senior, based on custom tabulations from the Canadian Centre for Policy Alternatives, unpublished.
of mothers, and that the wellbeing of low-middle and middle-income Canadian mothers has fallen relative to the wellbeing of high-income mothers.
According to the same study, low- and middle-income parents have less time and not much more money than they had in the past and, not surprisingly, there is some evidence that they are relatively worse off. The authors conclude that, “To the extent that both time and money are valuable resources for the production of wellbeing for family members, these findings sug-gest that inequality in wellbeing has increased even more than inequality of income since the mid-1990s.”36
Not surprisingly, the study also found increasing dis-parity in family stress. In 1992 there was no significant difference between high- and low-income families for time stress, but by 2005 low-income families were significantly more time-stressed than high-income families.
A L B E R TA N S W O R K LO N G E R H O U R S
Alberta is one of the hardest working provinces in one of the hardest working nations. An April 2011 report by the OECD places Canada fourth out of 29 developed countries for work hours (see Figure 9). This figure shows the number of hours worked per day. Though the differences may look slight in the figure, a difference of 90 minutes per day amounts to 450 min-utes or 7.5 hours per week and 390 hours or roughly 10 weeks per year. According to OECD data, Albertans worked 7.5 weeks more in 2010 than the average worker in the top 15 developed countries.
Across Canada there has been a growing tendency of parents to work more than 80 paid minutes per week. Overall, this grew from just 7 percent of all two-parent families with children in 1971 to 19 percent by 2006.37 According to the same study, one in 10 Canadians
36 Burton and Phipps. 2011. Op cit.
37 Burton and Phipps. 2011. Op. cit.

October 2012 31
worked 50 or more hours per week in 1991, and one in four did so in 2010.
Albertans and the rest of the provinces and territories in Canada get significantly less paid time off than their European counterparts. This is partially due to a combination of the shorter work week and higher number of paid holidays and vacations in other countries. Alberta’s vacation minimum is two weeks or 10 days, and there are nine paid holidays per year. This vacation minimum increases to three weeks after five years of employment. By contrast, the average vacation in Europe is six weeks. The European Union’s Working Time Directive (1993) sets the minimum paid leave for all EU member countries at four weeks or 20 days per year. Several EU member countries require substantially more: for example, France mandates 30 days of paid annual leave, and Finland and Sweden, 25 days. Developed countries outside the EU also have generous minimum requirements for paid leave: Norway requires employers to provide 25 days of paid annual leave, while workers in Australia and New Zealand have four weeks of paid leave and seven paid public holidays.38
38 OECD. 2011. “Society at a Glance 2011 – OECD Social Indicators.” www.oecd.org/els/social/indicators/SAG
F I G U R E 9 | H o u r s p e r d a y o f p a i d a n d u n p a i d w o r k o r s t u d y , O E C D , 2 0 1 1
Source: OECD (2011), Society at a Glance 2011, Social Indicators (www.oecd.org/els/social/indicators/SAG)
Unpaid Work or Study
Paid Work or Study

32 A Social Policy Framework for Alberta: Fairness and Justice for All
The 2010 Vacation Deprivation Survey found that 47 percent of Canadian workers surveyed say they need a vacation more than they’ve needed one in the past four years.39
L E S S L E I S U R E T I M E
Working this hard comes at a cost. Working harder means less time for family and community as well as personal health and activity. It means less time for young workers to spend on social and community activities or studying. It means more stress and poorer health.
Given the high work hours, it is not surprising that Albertans have the lowest leisure time in the na-
39 Canadian News Wire. 2011. Vacation Deprivation Contin-ues Despite Economic Rebound, Expedia.ca. Toronto, June 14.
tion. Albertans average five hours of leisure per day compared to a national average of 5.5 hours. Other provinces range up to 5.9 hours. This means that an Albertan has 182 fewer hours of leisure in a year than the average Canadian (see Figure 10).
W O R K I N G H A R D AT W H AT C O S T ?
Studies have linked longer work hours to health risks such as depression, unhealthy weight gain, increases in smoking and drinking, and higher risks of injury at
Source: Human Resources and Skills Development Canada, Indicators of Well-Being Canada, http://www4.hrsdc.gc.ca/[email protected]?iid-52, accessed February 16, 2012.
F I G U R E 1 0 | A v e r a g e t o t a l l e i s u r e t i m e , b y p r o v i n c e
Hours
CANADA
NL
PEI
NS
NB
QUE
ONT
MAN
SASK
AB
BC

October 2012 33
work.40 Studies have also found that longer work hours can reduce time available to unwind when away from work, nurture family relationships, parent effectively, provide non-financial support to extended family members, and engage in voluntary community activi-ties. Long work hours can also be detrimental for com-munities, by limiting the time and energy people have
40 For a good overview of the research on the health and broader social implications of excessive work hours, see: “Working Conditions as a Determinant of Health,” Public Health Agency of Canada, based on papers and presentations by Andrew Jackson, Senior Economist, Canadian Labour Con-gress, and Michael Polanyi, Assistant Professor, Saskatchewan Population Health Research and Evaluation Unit, and Faculty of Kinesiology and Health Studies, University of Regina. The presentations were prepared for The Social Determinants of Health Across the Life-Span conference, held in Toronto in November 2002.
for community engagement. This undermines and weakens neighbourhood social networks and trust.41 It is therefore understandable that Albertans rank among the lowest in the nation for sense of belonging to their communities (see Figure 11).
41 Milkie, Melissa A., Sarah M. Kendig, Kei M. Nomaguchi, Kathleen E. Denny. 2010. “ Time With Children, Children’s Wellbeing, and Work-Family Balance Among Employed Par-ent.” Journal of Marriage and Family . Volume 72, Issue 5, pp. 1329–1343. October.
F I G U R E 1 1 | S e n s e o f b e l o n g i n g t o c o m m u n i t y
Source: Canada Community Health Survey, 2008 http://www.statcan.gc.ca/pub/82-229-x/2009001/envir/cob-eng.htm
Percent %
CANADA
NL
PEI
NS
NB
QUE
ONT
MAN
SASK
AB
BC
YT
NWT
NU
0 10 20 30 40 50 60 70 80 90 100

34 A Social Policy Framework for Alberta: Fairness and Justice for All
In Alberta, the effectiveness of federal and provincial government income transfers in lifting children above the poverty line has increased over the years. In 1989, only about 25 percent of children were lifted above the poverty line. By 2009, this had increased to 44 percent.42
However, the tax and transfer system is less effective at addressing inequality. Recent data show that taxes and social program transfers reduce inequality less in Canada than in most OECD countries.43 According to the OECD, Canada spends less on cash benefits such as unemployment and family benefits than most OECD countries. OECD researchers conclude that, partly as a result, taxes and transfers do not reduce inequality by as much as in many other countries. Furthermore, their effect on inequality has been declining over time.
42 Kolkman and Ahorro. 2011. Op. cit.
43 Luebker, Malte. 2012. “A Tide of Inequality : What Can Taxes and Transfers Achieve?” Social Europe . February 16, 2012. www.social-europe.eu/2012/02/a-tide-of-inequality-what-can-taxes-and-transfers-achieve/
Generally, the Gini coefficient for market income is similar in Canada to Europe. The key difference lies in the tax and transfer system, which reduces the Gini coefficient for disposable incomes in Europe to 0.278, whereas it is left at an average of 0.343 in non-Europe-an developed economies, including Canada.44
Prior to the mid-1990s, the Canadian tax benefit sys-tem was as effective as those in the Nordic countries in stabilising inequality, offsetting more than 70 percent of the rise in market income inequality. The effect of redistribution has since declined,45 driven by a combi-nation of the reduced role of means-tested transfers and changes in taxation rates.
Alberta’s tax and transfer system is significantly less effective than Canada’s overall system at redistributing wealth. Canada’s tax and transfer system reduced the income of the top 1 percent by almost 20 percent in 2009, while Alberta’s reduced the income of the top 1
44 Luebker. 2012. Op. cit.
45 OECD. 2011. Op. cit.
6.0 Alberta’s tax and transfers minimally reduce inequality

October 2012 35
percent by only 13 percent.46
One of society’s most important tools for economic equality is a progressive income tax. With tax rates increasing as income increases, a higher proportion of revenues is raised from those at the top, while a higher proportion of the proceeds is shared by those in the lower income levels.
Alberta has a flat tax, one of the only jurisdictions in the world to have abandoned progressive income taxes. This flat tax, introduced in 2001, is a big factor limiting the redistribution of wealth in Alberta. Figure 12 shows that while Alberta has the highest personal exemption rate, the flat tax means that lower-income
46 Veall. 2010. Op. cit.
Albertans pay higher income tax rates than most other Canadians, while those at the top pay the lowest rates in the nation.
Reinstating progressive income taxes could bring in about $1 billion in additional revenue each year while retaining the current (high) personal exemptions, and reducing current taxes to lower income groups.47
According to researchers on inequality at Yale Univer-sity, this should be taken a step further; the income tax system could be structured with the key goal of addressing inequality. This could be done by index-ing the tax system to inequality. Under such a system,
47 Flanagan, Greg. 2011. “Fixing What’s Broken: Fair and Sustainable Solutions to Alberta’s Revenue Problems.” Park-land Institute, University of Alberta. May.
Source: Government of Canada, Provincial/territorial tax rates for 2012, http://www.cra-‐arc.gc.ca/tx/ndvdls/fq/txrts-‐eng.html#provincial.
NLPEI
NS NB ON MB SK AB BC YTNW
T NU
F I G U R E 1 2 | P r o v i n c i a l / t e r r i t o r i a l t a x b r a c k e t c o m p a r i s o n
25
20
15
10
5
0
Perc
ent

36 A Social Policy Framework for Alberta: Fairness and Justice for All
the government would not legislate fixed income tax rates for each tax bracket, but would instead prescribe a formula that tied tax rates to statistical measures of pre-tax inequality. If income inequal-ity were to increase, tax rates would automatically become more progressive. Inequality indexation could be considered a kind of insurance against worsening inequality.48
6.1 A L B E R TA ’ S LO W TA X E S
The flat tax is not the only area where Alberta com-pares poorly on taxes. Across Canada and within Alberta, governments have been reducing tax rates across the board. Federally, the top marginal income tax rate dropped from 43 percent in 1981 to 29 percent in 2010.49 Albertans have one of the most spare tax systems in North America: low per-sonal and corporate income taxes, the lowest fuel taxes among provinces, no capital tax, no payroll tax, and no sales tax.
Alberta’s total taxes constitute just over 6 percent of provincial GDP, compared to a range of 8 to over 14 percent for other provinces.50 According to the Alberta government, “If Alberta had any other provincial tax system, Albertans and Alberta businesses would pay at least $10.7 billion more in taxes each year.”51
Figure 13 illustrates this difference. Each red and grey bar indicates how much additional revenue Alberta would collect in taxes if it had the same tax structure as that province. The figure reveals that Alberta could collect this $10 billion and still be the lowest tax jurisdiction in Canada, and one of the
48 Shiller, Robert. 2012. “Don’t Resent the Rich; Fix the Tax Code.” Bloomberg Businessweek . March 06. Excerpted from Finance and the Good Society, to be published April 4 by Princeton University Press.
49 OECD. 2011. Op cit.
50 Flanagan. 2011. Op. cit.
51 Government of Alberta. 2012. “Budget 2012 - Tax Plan.” p. 97.
lowest in the developed world. It also shows that Al-berta could charge between $7 and $9 billion more in taxes even without introducing a sales tax, by moving to the tax structures other provinces have.
F I G U R E 1 3 | A l b e r t a ’ s t a x g a p
Source: Government of Alberta. 2012. “Budget 2012 - Tax Plan.” p. 97.
Sales Tax
Other Taxes

October 2012 37
6.2 C O R P O R AT E TA X E S
While wealthy Albertans pay by far the least income tax in the nation, corporations are also being given a big tax advantage in Alberta. Alberta’s general cor-porate tax rate is tied for lowest in the nation at 10 percent, and Canada has some of the lowest corporate tax rates in the developed world.
Across Canada, corporate tax rates have been on the chopping block. The combined federal/provincial gen-
F I G U R E 1 4 | C o r p o r a t e t a x e s a n d p r o f i t s i n A l b e r t a
Sources: CANSIM Table 3850001 - Consolidated federal, provincial, territorial and local government revenue and expen-ditures, annually (Dollars) - *Terminated* v645751 Alberta; Provincial and territorial governments; Corporation income taxes *Terminated* 2010 and 2011 based on http://www.finance.alberta.ca/publications/budget/budget2011/fiscal-plan-revenue.pdf.
eral corporate income tax rate fell from 33.6 percent in 2005 to 28 percent in 2010, and is set to decline fur-ther to 25 percent. For comparison, the US combined rate in 2011 was 39.2 percent.52
These tax cuts have meant that relatively little of the meteoric rise in profits that were seen by Alberta
52 Flanagan. 2011. Op. cit.
60
50
40
30
20
10
0
$ Bi
llion
(20
02)
1990
1991
1992
1993
1994
1995
1996
1997
1998
1999
2000
2001
2002
2003
2004
2005
2006
2007
2008
2009
2010
e
2011
e
Corporate Profits
Corporate Tax Revenues
38 A Social Policy Framework for Alberta: Fairness and Justice for All
corporate owners, but out of the province and out of the country.54
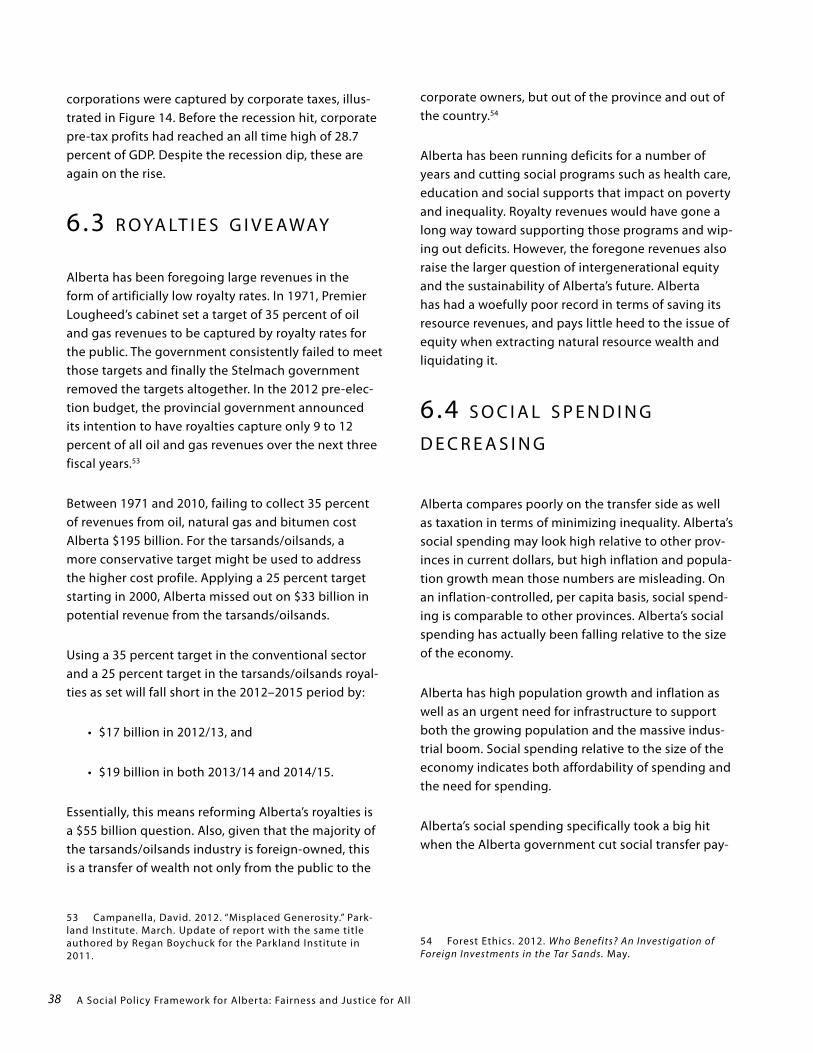
Alberta has been running deficits for a number of years and cutting social programs such as health care, education and social supports that impact on poverty and inequality. Royalty revenues would have gone a long way toward supporting those programs and wip-ing out deficits. However, the foregone revenues also raise the larger question of intergenerational equity and the sustainability of Alberta’s future. Alberta has had a woefully poor record in terms of saving its resource revenues, and pays little heed to the issue of equity when extracting natural resource wealth and liquidating it.
6.4 S O C I A L S P E N D I N G D E C R E A S I N G
Alberta compares poorly on the transfer side as well as taxation in terms of minimizing inequality. Alberta’s social spending may look high relative to other prov-inces in current dollars, but high inflation and popula-tion growth mean those numbers are misleading. On an inflation-controlled, per capita basis, social spend-ing is comparable to other provinces. Alberta’s social spending has actually been falling relative to the size of the economy.
Alberta has high population growth and inflation as well as an urgent need for infrastructure to support both the growing population and the massive indus-trial boom. Social spending relative to the size of the economy indicates both affordability of spending and the need for spending.
Alberta’s social spending specifically took a big hit when the Alberta government cut social transfer pay-
54 Forest Ethics. 2012. Who Benefits? An Investigation of Foreign Investments in the Tar Sands. May.
corporations were captured by corporate taxes, illus-trated in Figure 14. Before the recession hit, corporate pre-tax profits had reached an all time high of 28.7 percent of GDP. Despite the recession dip, these are again on the rise.
6.3 R O YA LT I E S G I V E AWAY
Alberta has been foregoing large revenues in the form of artificially low royalty rates. In 1971, Premier Lougheed’s cabinet set a target of 35 percent of oil and gas revenues to be captured by royalty rates for the public. The government consistently failed to meet those targets and finally the Stelmach government removed the targets altogether. In the 2012 pre-elec-tion budget, the provincial government announced its intention to have royalties capture only 9 to 12 percent of all oil and gas revenues over the next three fiscal years.53
Between 1971 and 2010, failing to collect 35 percent of revenues from oil, natural gas and bitumen cost Alberta $195 billion. For the tarsands/oilsands, a more conservative target might be used to address the higher cost profile. Applying a 25 percent target starting in 2000, Alberta missed out on $33 billion in potential revenue from the tarsands/oilsands.
Using a 35 percent target in the conventional sector and a 25 percent target in the tarsands/oilsands royal-ties as set will fall short in the 2012–2015 period by:
$17 billion in 2012/13, and
$19 billion in both 2013/14 and 2014/15.
Essentially, this means reforming Alberta’s royalties is a $55 billion question. Also, given that the majority of the tarsands/oilsands industry is foreign-owned, this is a transfer of wealth not only from the public to the
53 Campanella, David. 2012. “Misplaced Generosity.” Park-land Institute. March. Update of report with the same title authored by Regan Boychuck for the Parkland Institute in 2011.
October 2012 39
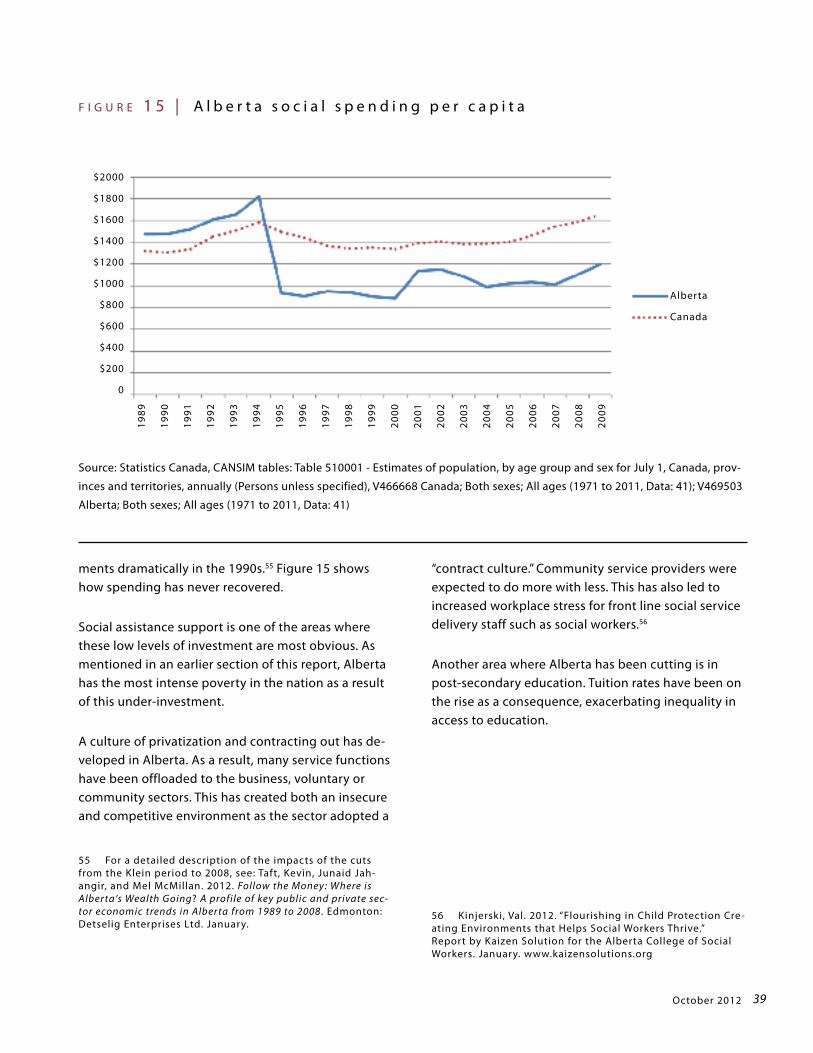
ments dramatically in the 1990s.55 Figure 15 shows how spending has never recovered.
Social assistance support is one of the areas where these low levels of investment are most obvious. As mentioned in an earlier section of this report, Alberta has the most intense poverty in the nation as a result of this under-investment.
A culture of privatization and contracting out has de-veloped in Alberta. As a result, many service functions have been offloaded to the business, voluntary or community sectors. This has created both an insecure and competitive environment as the sector adopted a
55 For a detailed description of the impacts of the cuts from the Klein period to 2008, see: Taft, Kevin, Junaid Jah-angir, and Mel McMillan. 2012. Follow the Money: Where is Alber ta‘s Wealth Going? A profile of key public and private sec-tor economic trends in Alber ta from 1989 to 2008 . Edmonton: Detselig Enterprises Ltd. January.
“contract culture.” Community service providers were expected to do more with less. This has also led to increased workplace stress for front line social service delivery staff such as social workers.56
Another area where Alberta has been cutting is in post-secondary education. Tuition rates have been on the rise as a consequence, exacerbating inequality in access to education.
56 Kinjerski, Val. 2012. “Flourishing in Child Protection Cre-ating Environments that Helps Social Workers Thrive.”Report by Kaizen Solution for the Alberta College of Social Workers. January. www.kaizensolutions.org
F I G U R E 1 5 | A l b e r t a s o c i a l s p e n d i n g p e r c a p i t a
Source: Statistics Canada, CANSIM tables: Table 510001 - Estimates of population, by age group and sex for July 1, Canada, prov-inces and territories, annually (Persons unless specified), V466668 Canada; Both sexes; All ages (1971 to 2011, Data: 41); V469503 Alberta; Both sexes; All ages (1971 to 2011, Data: 41)
$2000
$1800
$1600
$1400
$1200
$1000
$800
$600
$400
$200
0
1989
1990
1991
1992
1993
1994
1995
1996
1997
1998
1999
2000
2001
2002
2003
2004
2005
2006
2007
2008
2009
Alberta
Canada

40 A Social Policy Framework for Alberta: Fairness and Justice for All
It is time to recognize the broader consequences of concentrating efforts at supporting the wealthiest citizens, and take concerted steps to ensure that all Albertans benefit from the province’s wealth. Alberta has both the wealthiest and the poorest citizens in the nation. We have growing inequality. Political deci-sions taken in the early 1990s to shift to a more market -based approach to public services exposed Albertans to economic insecurity and social vulnerability. As this report has shown, inequality costs, not only in terms of its impact on economic growth, but more broadly in terms of its impact on all citizens through higher violence rates, addictions problems, poorer health, and lower social cohesion. Both economic and social disparity have been increasing, and the wellbeing of Albertans has been jeopardized. The new boom will only exacerbate these trends unless concerted steps are taken to reverse them.
Alberta must follow other advanced industrial coun-tries and many provinces within Canada and move ahead with dedicated policy actions that address inequality and poverty.
Alberta is at a crossroads. We need a new vision of society, one that promotes quality of life, wellbeing, and community over individualism. Alberta needs to rebuild the foundation of collective commitment and caring for each other that this province was built on and was known for across the country. An aging popu-lation, decreasing birth rates, increasing population diversity, and dwindling resources represent challeng-es that must be addressed to ensure economic growth and social cohesion in the future. Reducing economic and social disparity in Alberta requires a multifaceted set of solutions.
In the first report in this series, the Parkland Institute and Alberta College of Social Workers developed an extensive framework for social policy reform aimed at reducing disparity. That framework was developed in conjunction with front line workers, policy analysts and academics. This report updates the inequality data and emphasizes the role of the tax and transfer systems. Broader study also identifies labour market policies and the social service delivery models as other factors in Alberta’s disparity gap. The broad framework provides an excellent basis for the provincial govern-
7.0. Conclusions and Recommendations

October 2012 41
ment to use in developing a social policy framework for Alberta.
The key elements of this social policy framework fol-low.
I M P R O V E Q U A L I T Y O F L I F E
Improve access to quality social programs, in-crease leisure time, and reduce stress on families through: increased spending on culture and lei-sure, childcare and early learning, education, and healthcare; reduced working hours; increased vacations; and expanded community-based public health and other services for Indigenous communities.
E N S U R E D I G N I T Y A N D A N A D E Q U AT E I N C O M E F O R T H E M O S T V U L N E R A B L E
Strengthen the province’s social safety net through the development of programs that pro-vide a liveable income, are universal, accessible and delivered in a non-stigmatizing manner.
I M P L E M E N T P R O G R E S S I V E R E V E N U E R E F O R M
Return to progressive taxes and raise corporate and other taxes to levels that allow continued support for public goods like health care, educa-tion and social programs that Albertans need and
value.
P R O T E C T W O R K E R S
Improve income security, equality and quality of life through expanded worker protections such as labour policy and regulatory change that bet-ter supports unionization. Ensure an adequate minimum wage and improve unemployment insurance.
S T R E N G T H E N D E M O C R A C Y A N D G O O D G O V E R N A N C E
Continue to stregthen the democratic process to promote the accurate representation of Alberta’s diversity, especially of Alberta’s Indigenous peoples.
I N V E S T I N H O U S I N G A F F O R D A B I L I T Y
Fulfill the promise to eradicate homelessness by 2019, including $3.3 billion in spending.
S T R E N G T H E N C O M M U N I T Y S E R V I C E S
Shift away from a business model to one based on core service delivery and away from the reliance on charity to a model based on rights. Provide more stable and long-term funding, sala-ries equal to the public sector and appropriate accountability measures.
Alberta has significant resource riches and is in a unique position to be a national leader in quality of life and wellbeing. There are examples to look to in Europe where resource development has not been ac-companied by rampant inequality and where govern-ments have used tax and transfer systems to ensure redistribution of that wealth for current and future generations.
Few provinces or territories are as wealthy as Alberta. We have a golden opportunity to develop an inclusive society where all benefit from our riches. Let’s make this happen in Alberta.

42 A Social Policy Framework for Alberta: Fairness and Justice for All

University of Alberta
11045 Saskatchewan Drive
Edmonton, Alberta T6G 2E1
t (780) 492-8558
f (780) 492-8738
www.parklandinstitute.ca
Alberta College of Social Workers, Edmonton Office
#550 10707 100 Avenue NW, Edmonton, T5J 3M1
t: {780) 421-1167
f: (780) 421-1168
www.ascw.ab.ca
ISBN 978-1-894949-33-0