Embed Size (px)
Citation preview
A SOCIAL NETWORK ANALYSIS OF
TEXAS ALLIANCE FOR WATER CONSERVATION PRODUCERS
By
NELLIE HILL, B.S.
A THESIS
IN
AGRICULTURAL COMMUNICATIONS
Submitted to the Graduate Faculty
of Texas Tech University in
Partial Fulfillment of
the Requirements for
the Degree of
MASTER OF SCIENCE
Approved
David Doerfert
Chairperson of Committee
Courtney Meyers
Cindy Akers
Dominick Casadonte
Interim Dean of the Graduate School
December, 2013

© Copyright 2013, Nellie Hill
Texas Tech University, Nellie Hill, December 2013
ii
ACKNOWLEDGEMENTS
When I decided to pursue a master’s degree, my intentions were to challenge
myself to risk more boldly and learn more deeply. Moving away from the beloved
sunflowers, Kansas State Wildcats, and trees of Kansas for life in West Texas has caused
me to grow in ways I never imagined. Completing this thesis has been a challenge that
made me more thankful for education and the amazing people who helped make mine
possible.
To my family: Your encouragement and support has never wavered; even when
you weren’t sure of what I was getting myself into. Whenever I am in need of an attitude
adjustment or pep talk, Dad is my very first phone call. If I need help with the particulars
of living away from home, Mom always knows the answer. I continue to be amazed by
the perseverance and achievements of Heath and Cassidy, my younger siblings.
To my friends, near and far: Thank you for allowing me to escape from my reality
when it became too much to keep writing. Road trips, concerts, long chats, and notes of
love helped more than each of you will ever know.
To my committee: I appreciate the trust and time you invested in me as I explored
this research with a methodology that we each equally knew little about. Thank you to
Dr. Doerfert for well-timed words of encouragement and challenges to my love of
learning. When I was at my wits end, I turned to Dr. Meyers, knowing we would hash it
out with sarcasm and a few laughs. Thank you, Dr. Akers for always sharing a kind
smile and an excitement for this research.

Texas Tech University, Nellie Hill, December 2013
iii
Finally, to the Texas Alliance for Water Conservation and the involved producers
of West Texas: Without the support of the TAWC and the willingness of the producers to
be interviewed, this research would not have been possible.
Texas Tech University, Nellie Hill, December 2013
iv
TABLE OF CONTENTS
ACKNOWLEDGEMENTS…………...…………………………………………………..ii
ABSTRACT…………………………………………………..…………………………vii
LIST OF TABLES…….……………………………...………………………………...viii
LIST OF FIGURES………………………………………………………………………ix
I. INTRODUCTION…………….………....……………………………………………...1
Overview…………………………...……………………………………………...1
Interpersonal Communication……………...……………………...………………2
Texas Alliance for Water Conservation…………...………………………..……..4
Social Network Analysis…………...……………………………………….……..7
Statement of the Problem…………...……………………………………………10
Purpose and Objectives…………...……………………..……………………….11
Definition of Terms…………...……………...…………………………………..12
Limitations………….……………………………………………………………15
Basic Assumptions…………...………..…………………………………………15
II. LITERATURE REVIEW…….…………………………………………………….16
Overview………….……………………………………………………………...16
Theoretical Framework…...………………………………………………….......16
Diffusion of Innovations…......…………………...………………….......16
Relation to Study……..…………………………...………………….......26
Conceptual Framework…...………………………………………………….......27
Producer as an Individual Entrepreneur..……..…………………….........27
Interpersonal Communication……………………....……............27
Social Exchange Theory……………………………...…….........35
Social Comparison Theory………………………...…..…...........38
Producer as an Agricultural Professional……….……..………...……….44
Communities of Practice……………………………………...….44
Uncertainty Reduction Theory…………………………...………46
Texas Tech University, Nellie Hill, December 2013
v
Relation to Study…...…………………….....………………………........51
Operational Framework…...………………………..…………….………….......51
Social Network Analysis…...………………...…..……….………….......51
Relation to Study…...………………………..……………………….......58
Summary…...………...………..…………….……………………………….......58
III. METHODOLOGY…..…………….………………….……………...………….......60
Overview……………………..…………………………………...………….......60
Research Design……….…………………...……………………………….........61
Population……...…………………...………………………………....................63
Data Collection……………………...………………………………...................64
Data Analysis..…………….....………………………………..............................65
Variable Analysis…………………....………………...............................65
Network Analysis………………...……..…………..................................65
Typological Analysis…………...………………………..........................69
IV. RESULTS………..……...……………………..…….................................................72
Overview………..……...……………………………….......................................72
Research Objective One…………….....………………........................................72
Research Objective Two…………….………………….......................................76
Cohesion………….………………….......................................................77
Structural Equivalence………………………….......................................80
Prominence………...……………….........................................................88
Range………...……….…….....................................................................88
Brokerage…...….……………...................................................................89
Research Objective Three……………..…………………....................................90
V. IMPLICATIONS…………....…................................................................................101
Overview…………... ….….................................................................................101
Conclusions…………... ….….............................................................................102
Research Objective One...........................................................................102
Research Objective Two……..................................................................104

Texas Tech University, Nellie Hill, December 2013
vi
Cohesion......................................................................................104
Structural Equivalence.................................................................105
Prominence..................................................................................107
Range...........................................................................................108
Brokerage.....................................................................................109
Summary..................................................................................................110
Research Objective Three........................................................................111
Discussion............................................................................................................113
Recommendations................................................................................................120
Practitioners.............................................................................................120
Researchers..............................................................................................122
REFERENCES................................................................................................................125
A. HUMAN RESEARCH PROTECTION PROGRAM APPROVAL LETTER………145
B. TAWC PRODUCER TELEPHONE SCRIPT……………..………………………...146
C. TAWC PRODUCER INFORMATION SHEET……………...……………………..147
D. TAWC PRODUCER INTERVIEW INSTRUMENT……..………………………...148
Texas Tech University, Nellie Hill, December 2013
vii
ABSTRACT
Networks of relationships form the foundation of our social lives. Understanding
and utilizing these connections can help practitioners and researchers more effectively
and efficiently disseminate information and innovations within a group. The Texas
Alliance for Water Conservation is concerned with identifying the best practices and new
technologies for water management in West Texas. The project also desires to share
knowledge beyond the currently involved members to other producers in the region. This
study sought to describe the interpersonal relations of the TAWC Demonstration Project
producers through social network analysis.
Semi-structured interviews were conducted with TAWC producers in order to
describe producers and their interpersonal connections in terms of relations and typology.
NodeXL for Microsoft Excel, QDA Miner, and WordStat software tools were used for
data analysis. Results indicated TAWC producers are diverse in their attributes, both
personally and in their farming operations. Analysis revealed a change agent and several
opinion leaders within the TAWC producer network. Furthermore, the knowledge
developed through the TAWC has reach beyond the TAWC producers. The study results
will facilitate further social network analysis of the population and guide further
information and innovation dissemination to the TAWC producer network.
Texas Tech University, Nellie Hill, December 2013
viii
LIST OF TABLES
4.1 Summary of TAWC Demonstration Project Producers………………………….75
4.2 Individual Network Measures for TAWC Producers……………………………78
4.3 Word Frequency and Phrase Frequency of Cluster One…………………………91
4.4 Word Frequency and Phrase Frequency of Cluster Two………………………...92
4.5 Word Frequency and Phrase Frequency of Cluster Three……………………….93
4.6 Word Frequency and Phrase Frequency of Cluster Four………...………………94
4.7 Word Frequency and Phrase Frequency of Cluster Five………...………………95
4.8 Word Frequency and Phrase Frequency of Cluster Six………...………………..95
4.9 Word Frequency and Phrase Frequency of Cluster Seven………...……………..96
4.10 Word Frequency of Change Agent and Cluster Opinion Leaders………….……97
4.11 Phrase Frequency of Change Agent and Cluster Opinion Leaders………….…...99
Texas Tech University, Nellie Hill, December 2013
ix
LIST OF FIGURES
1.1 Mathematical Model of Communication……………..…………………………...3
1.2 Example of a Sociogram……..……………………………………...………….....9
2.1 Model of Five Stages in the Innovation-Decision Process………………..…......18
2.2 Adopter Categorization on the Basis of Innovativeness…………...……….........23
2.3 Methods of Gathering Data…………………………………..…..........................25
2.4 Mathematical Model of Communication……………………………...................29
2.5 Convergence Model of Communication……………………………....................31
2.6 Basic Components of the Convergence Model…………………..........................33
2.7 Model of Uncertainty Reduction………………………………………………...47
2.8 Directed Sociogram and the Affiliated Adjacency Matrix………………………53
2.9 Types of Social Network Data and Analysis……...………..................................57
3.1 Node Classifications…....………………………..................................................68
4.1 Sociogram of TAWC Producer Network……..…...…..........................................79
4.2 Cluster One within TAWC Producer Network……………..................................81
4.3 Cluster Two within TAWC Producer Network…….............................................82
4.4 Cluster Three within TAWC Producer Network……...........................................83
4.5 Cluster Four within TAWC Producer Network...……..........................................84
4.6 Cluster Five within TAWC Producer Network…………….................................85
4.7 Cluster Six within TAWC Producer Network……………...................................86
4.8 Cluster Seven within TAWC Producer Network……………...............................87
Texas Tech University, Nellie Hill, December 2013
1
CHAPTER I
INTRODUCTION
Overview
Social networks are the core of human society (Kadushin, 2012). We share a vast
array of relationships with people, ranging from acquaintances to close family bonds.
What is exchanged through these relationships is as diverse as the type of connections.
Friendship, ideas, goods, power, and information are just a few examples of what is given
and taken in these relationships. Communities are formed through the connections of
relationships. These communities are complex, dynamic, and influence the attitudes and
beliefs of those within the network (Giuffre, 2013).
For universities and organizations involved with projects and programs that seek
to address the challenges facing society and a growing global community, there is a
growing need to share information, best practices, and lessons learned efficiently and
effectively. To that end, social network analysis has emerged as a research methodology
and data analysis technique that increases understanding of the vast and complex
relationships among people (Scott, 2013).
The Texas Alliance for Water Conservation Demonstration Project (hereafter
referred to as TAWC) personnel are interested in understanding how producers interact
with other producers. Agricultural communicators and conservationists are challenged to
understand how the community of producers involved in the TAWC share and receive
information related to irrigation water management. Social network analysis can give
researchers and practitioners a new perspective and a deeper understanding of the
Texas Tech University, Nellie Hill, December 2013
2
characteristics, relationships, and beliefs within the social structure composed of TAWC
producers.
Interpersonal Communication
The TAWC is primarily concerned with how to best to share information with the
involved producers and encourage the information to spread beyond the boundaries of the
project. Diffusion of information requires interpersonal communication between
producers to complete the social process (Rogers, 2003). Ryan and Gross (1943) found
the primary influence on hybrid corn seed adoption by producers was interpersonal
communication. More recent studies support Ryan and Gross’ findings that producers
principally prefer interpersonal communication methods (Gamon, Bounaga, & Miller,
1992; Lasley, Padgitt, & Hanson, 2001; Licht & Martin, 2007a; Richardson & Mustian,
1994; Riesenberg & Gor, 1989; Suvedi, Lapinski, & Campo, 2000; Vergot III, Israel, &
Mayo, 2005).
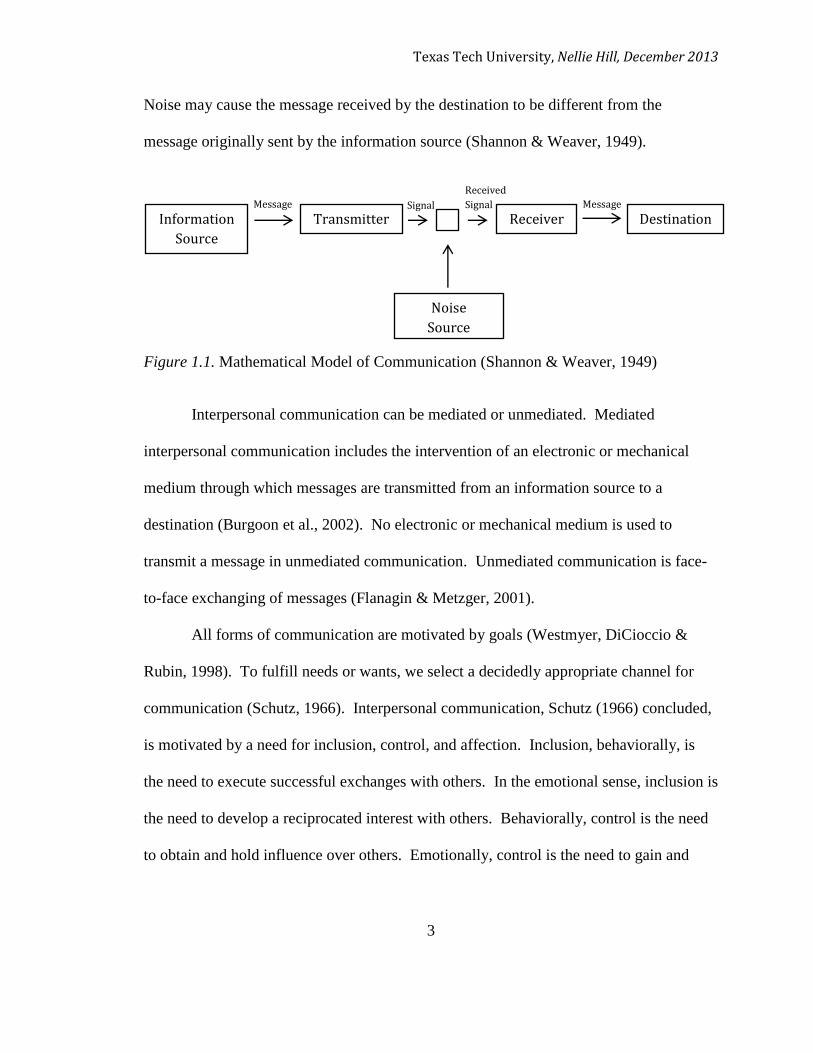
Shannon and Weaver (1949) developed the mathematical model of
communication (Figure 1.1). This linear model describes the process and units necessary
for communication. The information source sends message(s) of various types intended
for the destination. The transmitter influences the message in some way so that it is
appropriate for the channel used for communication. The channel is the platform used to
get the message(s) from the information source to the destination. The receiver does the
opposite of the transmitter, reconstructing the message sent by the information source to a
suitable medium to be understood by the destination. The destination is the intended
recipient of the message(s). Noise is any interruption to the communicated message(s).
Texas Tech University, Nellie Hill, December 2013
3
Noise may cause the message received by the destination to be different from the
message originally sent by the information source (Shannon & Weaver, 1949).
Figure 1.1. Mathematical Model of Communication (Shannon & Weaver, 1949)
Interpersonal communication can be mediated or unmediated. Mediated
interpersonal communication includes the intervention of an electronic or mechanical
medium through which messages are transmitted from an information source to a
destination (Burgoon et al., 2002). No electronic or mechanical medium is used to
transmit a message in unmediated communication. Unmediated communication is face-
to-face exchanging of messages (Flanagin & Metzger, 2001).
All forms of communication are motivated by goals (Westmyer, DiCioccio &
Rubin, 1998). To fulfill needs or wants, we select a decidedly appropriate channel for
communication (Schutz, 1966). Interpersonal communication, Schutz (1966) concluded,
is motivated by a need for inclusion, control, and affection. Inclusion, behaviorally, is
the need to execute successful exchanges with others. In the emotional sense, inclusion is
the need to develop a reciprocated interest with others. Behaviorally, control is the need
to obtain and hold influence over others. Emotionally, control is the need to gain and
Message
Received
Signal Signal Message
Information
Source
Transmitter Receiver Destination
Noise
Source
Texas Tech University, Nellie Hill, December 2013
4
maintain mutual respect with others. Affection, behaviorally, is the need to establish and
preserve relationships based on appreciation, loyalty, and admiration (Schutz, 1966).
Interpersonal communication is the primary way producers within the TAWC
communicate. Given the desire of TAWC stakeholders to effectively communicate and
share information with producers internal and external of the demonstration project, there
is a need to understand the relationships and communication channels within the network
of producers.
Texas Alliance for Water Conservation
The High Plains region, located in the northern Panhandle of Texas, northeastern
New Mexico, eastern Colorado, and western Kansas (Encyclopedia Britannica, 2013) is
economically dependent on the exhaustible water source, the Ogallala Aquifer (TAWC,
n.d.b). Water determines success for producers in the region (TAWC, n.d.b). Certain
counties use more water for crop irrigation purposes than others. Wheeler (2005)
identified nine counties expected, over the next 60 years, to drawdown the aquifer to less
than 30 feet of saturated thickness. Two of these high-use counties, Hale and Floyd, are a
part of the TAWC’s effort to identify practices and technologies that will conserve water
for many years to come.
The TAWC was established in 2005 with the mission to “conserve water for
future generations by collaborating to identify those agricultural production practices and
technologies that, when integrated across farms and landscapes, will reduce the depletion
of ground water while maintaining or improving agricultural production and economic
opportunities” (TAWC, 2011, para. 1). A grant from the Texas Water Development
Texas Tech University, Nellie Hill, December 2013
5
Board made the project possible and funded through 2019. One of the major goals of the
TAWC is to extend the life of the Ogallala Aquifer with respect for upholding the
viability of local farms and communities. The collaboration of area producers, data
collection technologies, as well as industry, university, and government agency partners
makes the TAWC unique.
The National Research Council (1996) stated irrigation must evolve to continue to
be an asset to the country. In order to maintain farm operation profitability while
improving water use, and irrigation efficiency, the TAWC uses on-farm demonstrations
of cropping and livestock systems. The demonstration project is overseen by a Water
Conservation Demonstration Producer Board made up of Hale and Floyd county
producers in cooperation with personnel from Texas Tech University College of
Agricultural Sciences and Natural Resources, Texas A&M AgriLife Research and
Extension, USDA Agricultural Research Service and Natural Resources Conservation
Service, and the High Plains Underground Water District No. 1 (TAWC, 2013b).
Across 4,300 acres in 29 TAWC field sites owned by producers in Hale and Floyd
counties, practices, technologies, and systems are compared (TAWC, 2013b). The field
sites represent a range of agricultural practices. Practices include fully integrated crop
and livestock systems, monoculture cropping systems, no-till and conventional tillage
practices, crop rotations and a variety of irrigation practices. These practices are applied
to a variety of crops including cotton, corn, sorghum, wheat, and specialty crops (TAWC,
n.d.b).
Texas Tech University, Nellie Hill, December 2013
6
To monitor the water use, soil moisture depletion, crop productivity and economic
return, each site is equipped with an instrument. The instrument calculates total water
applied from the Ogallala Aquifer, solar radiation, temperature, rainfall, timing, irrigation
events, and soil moisture. A single database stores this data, transmitted by an integrated
central processing controller (TAWC, n.d.a).
The unique data set spanning all eight years of the project thus far is just one of
the major accomplishments of the TAWC. In addition, the use of irrigation management
tools (Resource Allocation Analyzer and Irrigation Scheduling Tool) have aided
producers in maximizing profitability and making irrigation scheduling decisions to use
water more efficiently. Producers within the TAWC have elected to adopt more efficient
irrigation equipment, schedule irrigation based on evapotranspiration, and diversify the
crops they plant. These changes combine to allow more water to reach the root zone,
decreased evaporation and increased crop yields. Based upon these successes, the
TAWC and the producers involved have developed new best management practices to
implement. Producers in the project also test emerging technologies on their field sites.
TAWC has studied the effectiveness of these new technologies to aid producers in
making the best purchasing decisions for their operations. Each producer in the project
has also benefited from field site-specific and whole-farm financial analyses (TAWC,
2013a).
In order to share these major accomplishments and unique findings, the TAWC
holds field days and workshops to showcase producers’ experiences with new water
conservation technologies. Results of the project have been presented in journals and
Texas Tech University, Nellie Hill, December 2013
7
conferences, attracting interest from producers and agricultural water-related stakeholders
from across the nation. The project has been awarded grants in order to continue to
expand the influence of the TAWC demonstrations and test sites beyond Hale and Floyd
counties (TAWC, 2013). Little is known about how best to share the successes and
findings of the project within and beyond those involved in the TAWC. It is critical to
the continuance and effectiveness of the project to better understand and utilize the
established network of producers within the TAWC and beyond.
Social Network Analysis
“In short, who you know has a significant impact on what you come to know”
(Cross, Parker, & Borgatti, 2002, p. 3). Human society is based on social networks. In
the language of social network analysis, individuals, also known as nodes, are connected
by one or more relationships, or ties (Marin & Wellman, 2011; Scott, 2013; Wasserman
& Faust, 1994). People have always lived within social and professional networks. We
are tied together by relationships and are dependent on each other (Kadushin, 2012).
Mentally, people keep network maps of people they know. There are people we see or
talk to daily. There are people who we count on for different tasks in a variety of
situations. There are people we know, who know each other. Some of the people we
know get along with each other, while others do not connect (Chua, Madej, & Wellman,
2011).
New technology has changed the way we think about networks or communities.
According to Chua et al. (2011), there are three perspectives of communities. First,
communities can be bound by geography. Connected people can take a walk or short
Texas Tech University, Nellie Hill, December 2013
8
drive to visit each other. Second, communities can be bound by shared interests. For
example, there are people who connect to create a community because of their affinity for
sports. Finally, communities can consist of all connections from any level of bond; from
acquaintances to close family members. These communities are composed of local and
distant ties. Connections are often bound to each other. Communities have shifted from
being spatially defined by geography to being relationally defined by connections (Chua
et al.).
No longer are communities strictly based on geography. The physical connection
of households being connected by telephone lines or the need to see a person face-to-face
to communicate is not the determining factor in creating a connection, then developing
into a community. Online and offline networks now exist. Physical linkages have given
way to direct personal linkages through the use of mobile phones, email, and social media
(Chua et al., 2011). These individualized and specialized interactions between people are
referred to as networked individualism, the contemporary form of community (Wellman,
2001).
As humans are social beings, we strive to build relationships, creating communities, or
networks, online and offline. Therefore, understanding networks of connections is
essential to understanding how we share information, ideas, and other resources. Human
networks are complicated by conflict and cooperation, belonging and alienation, or
distance and closeness. Social network analysis allows researchers to untangle networks
by examining social relationships to see a new perspective on connections (Giuffre,
2013). The resulting data analysis creates a map, referred to as a sociogram, illustrating
Texas Tech University, Nellie Hill, December 2013
9
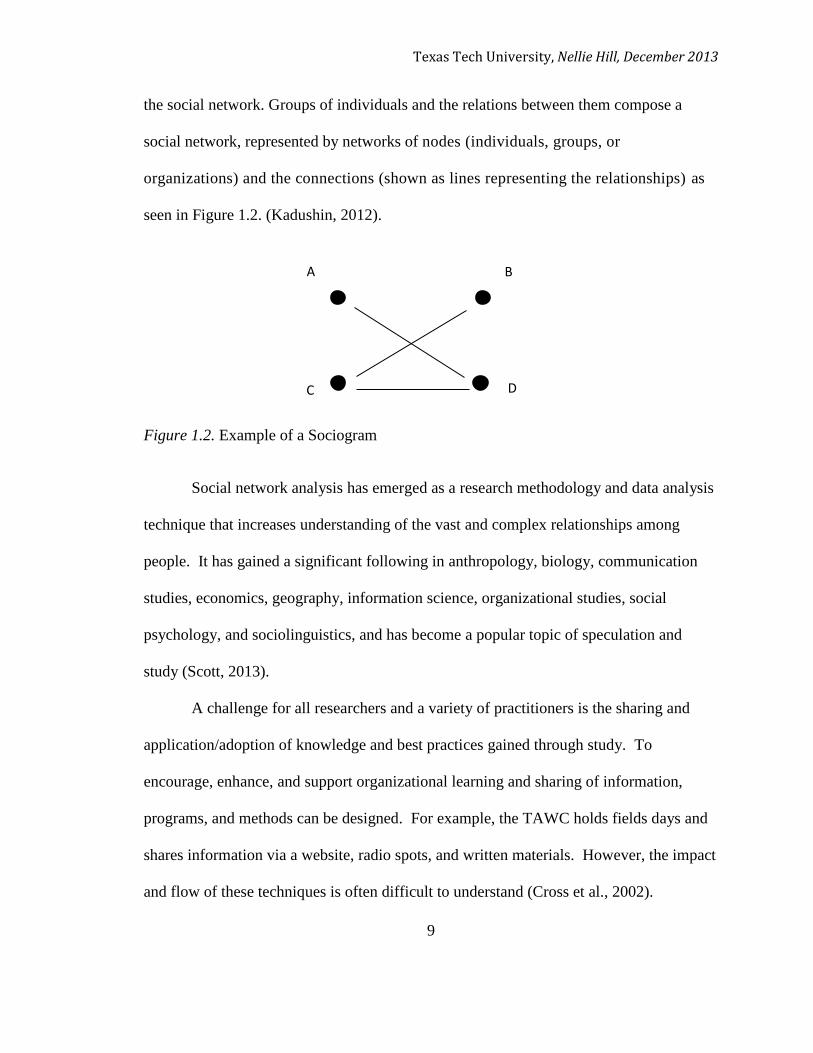
the social network. Groups of individuals and the relations between them compose a
social network, represented by networks of nodes (individuals, groups, or
organizations) and the connections (shown as lines representing the relationships) as
seen in Figure 1.2. (Kadushin, 2012).
Figure 1.2. Example of a Sociogram
Social network analysis has emerged as a research methodology and data analysis
technique that increases understanding of the vast and complex relationships among
people. It has gained a significant following in anthropology, biology, communication
studies, economics, geography, information science, organizational studies, social
psychology, and sociolinguistics, and has become a popular topic of speculation and
study (Scott, 2013).
A challenge for all researchers and a variety of practitioners is the sharing and
application/adoption of knowledge and best practices gained through study. To
encourage, enhance, and support organizational learning and sharing of information,
programs, and methods can be designed. For example, the TAWC holds fields days and
shares information via a website, radio spots, and written materials. However, the impact
and flow of these techniques is often difficult to understand (Cross et al., 2002).
A
C
B
D
Texas Tech University, Nellie Hill, December 2013
10
Social network analysis allows stakeholders to understand the complex
relationships among a group that can either help or hinder diffusion of information and
innovations. To find out, researchers can seek to answer some simple questions. How
does information flow within an organization? To whom do people go to for advice or
information? What subgroups have emerged? Are they sharing information effectively?
When the answers to these questions are mapped into a social network sociogram, new
insight is gained about patterns in relationships and individual relativity (Cross et al.,
2002).
Statement of the Problem
The networks humans are engaged in have become increasingly vast and complex
(Chua et al., 2011). As the basis for human life, networks are an essential area of study to
understand how people communicate (Giuffre, 2013). What is the purpose of sharing
information, ideas, and other resources with a network if it is not being shared
effectively? Social network analysis gives researchers a new perspective that might not
otherwise be realized about networks of relationships.
Water conservation continues to be a pressing issue for everyone, but especially
agriculturalists in areas with quickly depleting resources that their life’s work depends
upon. It is essential that researchers and producers collaborate to implement new
technologies and methods. Producers do not necessarily have to sacrifice profitability for
water conservation, as the TAWC is working to prove.
This study examines the relationships of producers in the TAWC in order to better
understand how to more effectively and efficiently share water management information
Texas Tech University, Nellie Hill, December 2013
11
with the network. Producers have many different resources they can use to seek
information and advice about their operation. Interpersonal communication has been
proven to be their primary source of information gathering.
Purpose and Objectives
The National Research Agenda: American Association for Agricultural
Education’s Research Priority Areas 2011-2015 (Doerfert, 2011) places an emphasis on
understanding adoption decision processes regarding new technologies, practices, and
products.
The findings of this study provide stakeholders of the TAWC insight into how
information is diffused among the network of producers and beyond. In addition, this
study provides an improved understanding of how to apply social network analysis to
networks within the agricultural industry.
The purpose of this research was to describe the TAWC producers and analyze their
interpersonal network in terms of attributes, ideations, and relationships with others as it
relates to sharing farming and water management information.
The following research objectives were used to guide this study:
1. Describe TAWC producers in terms of age, years in the project, acres in the
project, board member status, who initiated their involvement in the project, type
of irrigation used on their acres in the project, crops grown on their acres in the
project, and if livestock are raised on their acres in the project
2. Describe the interpersonal connections of the producers in the TAWC in terms of
relations
Texas Tech University, Nellie Hill, December 2013
12
3. Describe the interpersonal connections of the producers in the TAWC in terms of
typology
Definition of Terms
Actor – Social unit of the network which can represent one individual, group or
organization. Also called a node (Carolan, 2014).
Betweenness centrality – Measures the extent to which a node lies between various other
nodes in a network. A high betweenness centrality value indicates a node plays an
important intermediary role in sharing information throughout a network (Scott, 2013).
Brokerage – Principle of social network analysis fulfilled by identifying relations that
serve important intermediary roles within a network (Haythornthwaite, 1996; Scott,
2013).
Carrier – A node with an equal number of relations directed towards (indegrees) and
away (outdegrees) from it. This node shares and receives information with an equal
number of other nodes (Wasserman, 1994).
Centralization – Measure which identifies the node(s) the sociogram is focused around
(Scott, 2013).
Cohesion – Principle of social network analysis concerned with the likelihood that actors
with present relations have equal access to information (Haythornwaite, 1996).
Density – Ratio of number of present, reported links in a network to the maximum
number of potential links in a network. Low-density networks are less interconnected
than high-density networks (Haythornwaite, 1996; Scott, 2013).
Texas Tech University, Nellie Hill, December 2013
13
Eigenvector centrality – Determines the influence or power of a node by measuring the
node’s total degrees and the total degrees of the node’s relations. An actor with a high
Eigenvector centrality value would have relatively few relations with other actors, but
these relations have strong, powerful, or otherwise strategic relations to other actors
throughout the rest of the network (Hansen, Schneiderman, & Smith, 2011).
Indegree – Total number of other social relations that terminate at, or are directed
towards, a node (Scott, 2013). The total number of people who go to the actor for
information or advice.
Isolate – A node that has no relations with any other nodes in the network (Wasserman,
1994).
Prominence – Identify actors in a network who have influence or power over other actors
in the network to fulfill this principal of social network analysis (Haythornthwaite, 1996).
Ordinary - A node with relations directed towards (indegrees) and away (outdegrees)
from it. This node has a greater number of indegrees than outdegrees or vice versa
(Wasserman, 1994).
Outdegree – Total number of social relations that originate at, or are directed away from,
a node (Scott, 2013). The total number of people who the actor goes to for information
or advice.
Range – Principle of social network analysis which states that the more relations an actor
possesses, the more information they will have access to, and the more diverse the
information (Haythornthwaite, 1996).
Texas Tech University, Nellie Hill, December 2013
14
Receiver – A node that only collects relations, possesses only indegrees, only obtains
information from other nodes in the network (Wasserman, 1994).
Relation – The relationship between two actors within a network. Also called a link
(Carolan, 2014).
Social network – A group of individuals and the relations between them (Wasserman &
Faust, 1994).
Social network analysis – The exploration of patterns of relationships through mapping
an illustration of all relations among actors in a given social network (Marin & Wellman,
2011).
Sociogram – A diagram or graph used to visualize social networks in which actors are
represented by points and lines represent relations. The graph can be directed or
undirected. These graphs can also be valued, if the appropriate data is collected (Scott,
2013).
Structural equivalence – Principle of social network analysis, which requires
identification of actors that hold similar roles within a social network (Haythornthwaite,
1996; Wasserman & Faust, 1994).
Transmitter – A node that only has relations originating from it, possesses only
outdegrees, or only shares information with other nodes in the network (Wasserman,
1994).
Typology – Grouping items according to how they are similar. Analysis based on types
or classification (Merriam-Webster, 2013).
Texas Tech University, Nellie Hill, December 2013
15
Limitations
The following limitations of this study should be considered:
1. The study is limited to the social network of producers who are members of the
TAWC.
2. Three members of the population are missing from the analysis due to their
unwillingness to participate.
3. The generalizability of the findings is limited to the producers of the TAWC.
Basic Assumptions
The following basic assumptions were made about this study:
1. All interview answers and data reported were given honestly.
2. The respondents fully understood each question being asked.
3. Individuals being interviewed had direct and continuing experience with the
TAWC.
Texas Tech University, Nellie Hill, December 2013
16
CHAPTER II
LITERATURE REVIEW
Overview
This review of literature sought to identify and explain research studies and
theories with relevance to describing the TAWC producers and examining their
interpersonal relationships through social network analysis. To expand the current body
of knowledge, it was important to examine previous studies and theories. The theoretical
framework of this study focused on the diffusion of innovations. The conceptual
framework describes producers as an individual entrepreneur and as an agricultural
professional. Interpersonal communication, Social Exchange Theory, and Social
Comparison Theory are discussed with relation to the producer as an individual
entrepreneur. With regards to the producer as an agricultural professional, communities
of practice and Uncertainty Reduction Theory are examined. Social network analysis is
explored in the operational framework of the study.
Theoretical Framework
Diffusion of Innovations
The adoption of new ideas, technologies, and practices takes time. Many
organizations want to know how to accelerate the adoption process. To do so, it is
important to understand how innovations diffuse through social systems. Rogers (2003)
defined diffusion as a process characterized by communicating an innovation through
various channels over time to a group of people.
Texas Tech University, Nellie Hill, December 2013
17
In the 1930s, the seminal study described diffusion and created the foundation for
future studies of new technology adoption in rural, farming communities involved in the
agricultural industry. Ryan and Gross (1943), rural sociologists, explored the rapid
diffusion of hybrid seed corn in two Iowa farming communities. They investigated the
differences between impulsive decisions and those made based on a process. Over a six-
year period, hybrid seed corn acreage increased around these communities from 40,000 to
24 million acres. Five factors were found to impact the diffusion: (a) the quality of the
seed, (b) the economy, (c) weather conditions, (d) information shared by the Extension
Service, and (e) ease of adoption (Ryan & Gross, 1943).
Ryan and Gross (1943) determined that a typical farmer would use different
channels to gather information. The information influenced the decision of whether or
not to adopt a new hybrid seed corn. Most of the farmers had knowledge of the
innovation prior to adoption of the hybrid seed by a small number of their peers. Early
adopters most often chose not to exclusively plant the hybrid seed. By comparison, late
adopters took less time to decide to plant only the hybrid seed, once they made the
decision to adopt. Ryan and Gross (1943) also found late adopters relied more on the
experience and knowledge of their peers to reach a decision to adopt. This reliance did
not elevate peer influence to cause earlier adoption. Therefore, the researchers suggested
farmers do not completely trust opinions or information from peers (Ryan & Gross,
1943).
Texas Tech University, Nellie Hill, December 2013
18
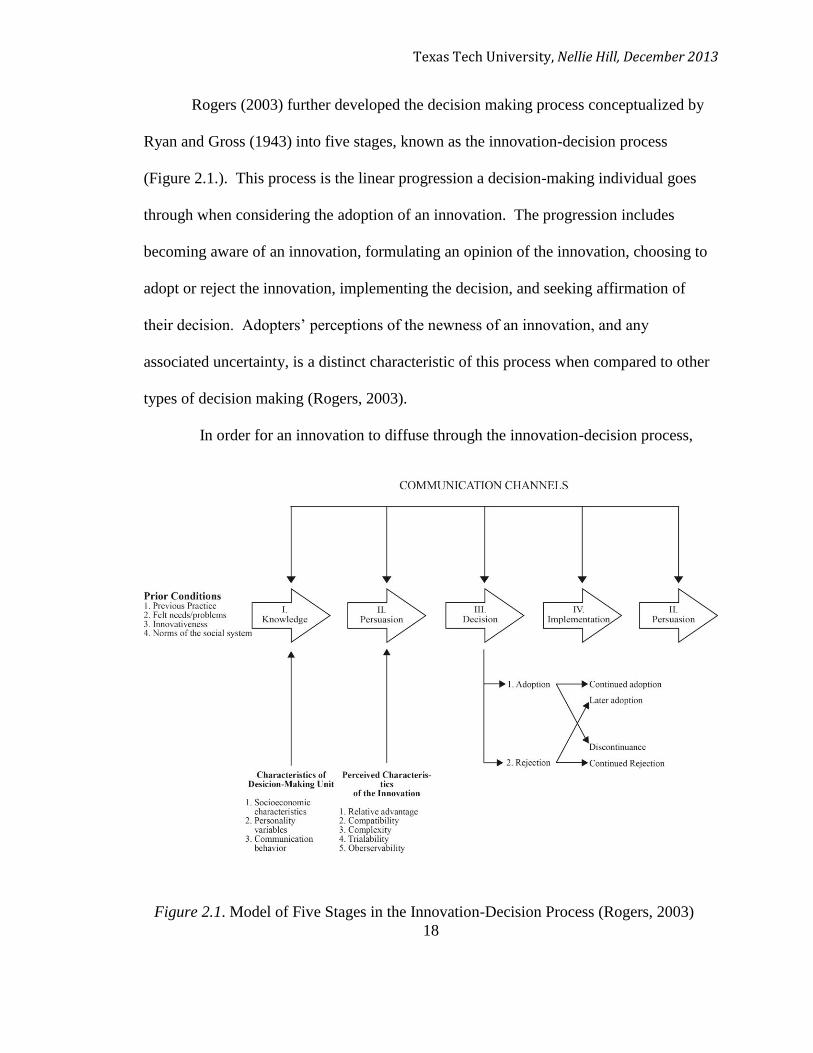
Rogers (2003) further developed the decision making process conceptualized by
Ryan and Gross (1943) into five stages, known as the innovation-decision process
(Figure 2.1.). This process is the linear progression a decision-making individual goes
through when considering the adoption of an innovation. The progression includes
becoming aware of an innovation, formulating an opinion of the innovation, choosing to
adopt or reject the innovation, implementing the decision, and seeking affirmation of
their decision. Adopters’ perceptions of the newness of an innovation, and any
associated uncertainty, is a distinct characteristic of this process when compared to other
types of decision making (Rogers, 2003).
In order for an innovation to diffuse through the innovation-decision process,
Figure 2.1. Model of Five Stages in the Innovation-Decision Process (Rogers, 2003)
Texas Tech University, Nellie Hill, December 2013
19
Rogers (2003) stated four elements must be present. The process requires an
innovation, communication channels, time, and a social system. An innovation is any
new concept, process, or material object that an individual perceives as new.
Communication channels are the mediums through which the message is spread. Time is
a factor in three different aspects of diffusion: “(a) the innovation-decision process, (b)
communication channels, (c) and an innovations rate of adoption” (Rogers, 2003, p.37).
The final element, the social system, is a body of affiliated units with the common
purpose of accomplishing a specific goal.
Rogers (2003) defined each of the five sequential stages in the innovation-
decision process:
1. Knowledge occurs when an individual (or other decision-making unit) is
exposed to an innovation’s existence and gains and understanding of how it
functions.
2. Persuasion occurs when an individual (or other decision-making unit) forms a
favorable or unfavorable attitude toward the innovation.
3. Decision takes place when an individual (or other decision-making unit)
engages in activities that lead to a choice to adopt or reject the innovation.
4. Implementation occurs when an individual (or other decision-making unit)
puts a new idea into use.
5. Confirmation takes place when an individual seeks reinforcement of an
innovation-decision already made, but he or she may reverse this previous
decision if exposed to conflicting messages about the innovation (p. 169).
Texas Tech University, Nellie Hill, December 2013
20
When an innovation, communicational channel, time, and a social system are
present, the information-decision process begins. During the knowledge stage, three
types of knowledge can be gained. Awareness-knowledge is present first, when an
individual has information that an innovation is available. The rate of this knowledge for
an innovation is more rapid that its rate of adoption. Rogers (2003) recommended
change agents focus on creating awareness-knowledge through mass media
communication channels to maximize their influence on the innovation-decision process.
For some individuals, this level of knowledge is enough to move them to the next stages
of the process. For others, awareness-knowledge motivates them to seek how-to
knowledge and, perhaps, principles knowledge to facilitate their decision-making process
(Rogers, 2003).
How-to knowledge is information regarding the proper uses of an innovation.
Rogers (2003) stated this type of knowledge is essential to individuals who are trialing
the innovation during the decision stage. Innovations that are more complex, or difficult
to understand, require more how-to knowledge than innovations that are less complex.
Therefore, the perceived complexity of an innovation by an individual negatively affects
the rate of adoption. If an individual is seeking how-to information and understanding,
an adequate level of knowledge must be reached prior to advancing in the innovation-
decision process (Rogers, 2003).
The foundational functioning principles of an innovation characterize the final
type of knowledge about an innovation, principles-knowledge. These principles are the
theories and fundamental elements that the innovation is built upon. Possessing
Texas Tech University, Nellie Hill, December 2013
21
principles-knowledge is not essential for all innovations. Change agents often regard
creating this knowledge to be outside the scope of their responsibilities, and instead is the
obligation of the formally educated. There is a greater risk of a potential adopter
misunderstanding a new idea, practice or object, which could result in rejection or
discontinuance (Rogers, 2003).
No matter when an individual enters into the innovation-decision process, they
can achieve each type of knowledge. However, there are differences between what
Rogers (2003) referred to as earlier knowers and later knowers. Rogers described seven
generalizations about early knowing of an innovation. Early knowers of an innovation
have: (a) more education, (b) higher social status, (c) more exposure to mass media
channels, (d) more exposure to interpersonal channels, (e) more contact with change
agents, (f) more social participation, and (g) are more cosmopolite, all than later knowers.
Early knowers are aware of innovations, but do not always decide to adopt them (Rogers,
2003).
The persuasion stage of the innovation-decision process only occurs if an
individual does not gain adequate knowledge or decides the innovation would not aide in
their situation. When a person reaches the persuasion stage, they consider five perceived
characteristics of the innovation to decide their attitude toward the innovation. Those
characteristics are (a) relative advantage, (b) compatibility, (c) complexity, (d)
trialability, and (e) observability (Rogers, 2003).
During the persuasion stage, individuals seek to reduce their uncertainty about the
advantages and disadvantages of the innovation as a part of their situation. Interpersonal
Texas Tech University, Nellie Hill, December 2013
22
communication channels are more important during this stage for all adopters, except
innovators, who are the first to adopt. Most individuals will turn to their peers for this
information. Peers offer subjective opinions, developed from personal experience with
the innovation, that are more accessible and convincing. The individual is unsure of his
or her attitude and therefore seeks social support of their thinking from peers. This type
of reinforcement cannot be provided by mass media messages, which are too general
(Rogers, 2003). Diffusion of innovations continues to be dependent on informal personal
networks (Allen, 1977; Cross, Laseter, Parker & Velasquez, 2006; Rogers, 2003).
Communication channels get messages from sources to receivers during each
stage of the innovation-decision process, but may have the greatest influence during the
knowledge and persuasion stages. Mass media channels are commonly the quickest,
most far reaching, and efficient ways to share information. However, interpersonal
channels are more effective in decision making due to face-to-face, two-way information
exchange between individuals. In addition, this channel has the greatest ability to help an
individual persuade another person to change a strongly held attitude. Interpersonal
channels become more effective when individuals have common characteristics, such as
socioeconomic status, interpersonal connections, or education. Later adopters rely even
more heavily on localite, interpersonal channels because by the time they are deciding
whether or not to adopt, local experience has accumulated in the social system (Rogers,
2003).
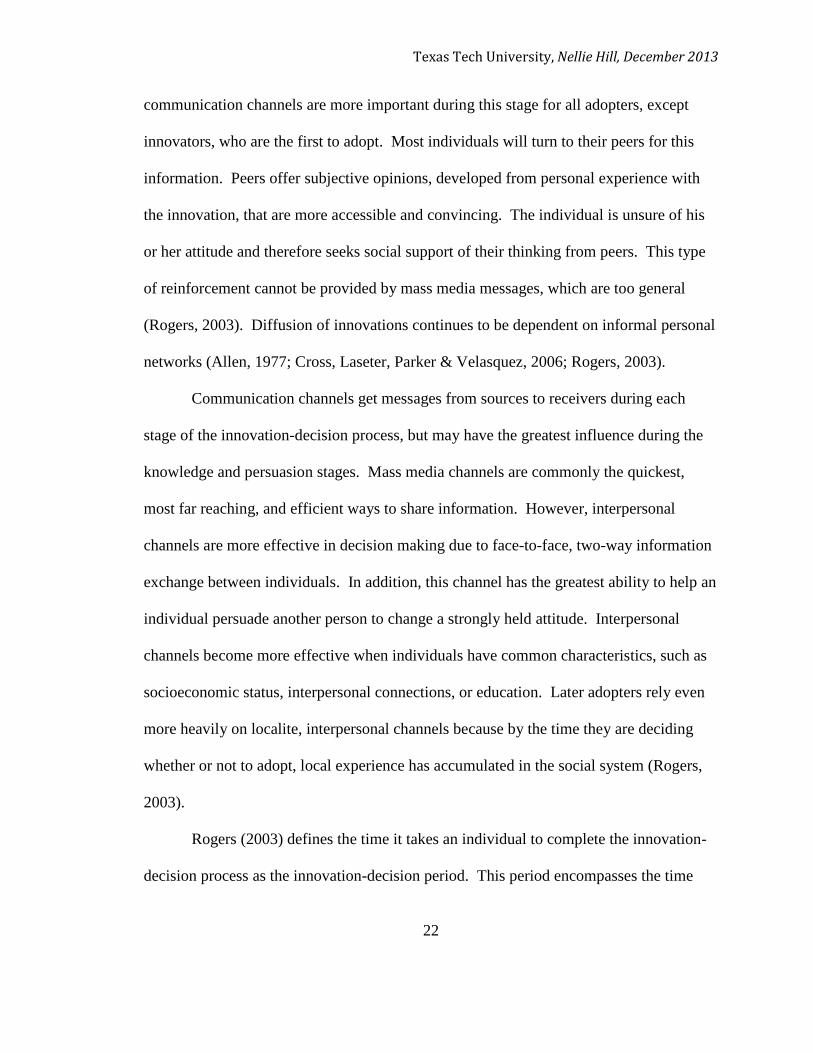
Rogers (2003) defines the time it takes an individual to complete the innovation-
decision process as the innovation-decision period. This period encompasses the time
Texas Tech University, Nellie Hill, December 2013
23
Figure 2.2. Adopter Categorization on the Basis of Innovativeness (Rogers, 2003)
during which an innovation is considered for adoption, taking days, months, or years.
The measure is taken from first awareness of the innovation to the decision to adopt or
reject.
Rogers (2003) developed a model to categorize adopters based on their
innovativeness (Figure 2.2.). Adopters are divided into five categories along a normal
frequency distribution: (a) innovators, (b) early adopters, (c) early majority, (d) late
majority, and (e) laggards. The innovation-decision period is shorter for earlier adopters
when compared to late adopters. Earlier adopters also possess more innovativeness, the
likelihood of adopting a new innovation. Innovativeness is influenced by socioeconomic
status, personality values, and communication behavior (Rogers, 2003). With varying
levels of innovativeness among individuals comes a variance in the length of the
innovation-decision period.
Members of an adoption category usually have similar traits. The ideal innovator
seeks ideas and possesses relationships outside the local network, therefore able to be a
gatekeeper and introduce innovations to the social system. Early adopters are well
respected and have the most opinion leadership of any other type of adopter. They make
Texas Tech University, Nellie Hill, December 2013
24
judicious decisions to adopt an innovation and then share a subjective evaluation through
interpersonal networks. The early majority is an important link in the diffusion process
and bridge connections in the social system’s interpersonal networks. Adopters in the
late majority category are cautious and skeptical of innovations. For these individuals,
adoption must be motivated by peer pressure. Laggards are the last in a social system to
adopt an innovation or may never adopt. They are usually very traditional and rely
heavily on past experiences to make future decisions (Rogers, 2003).
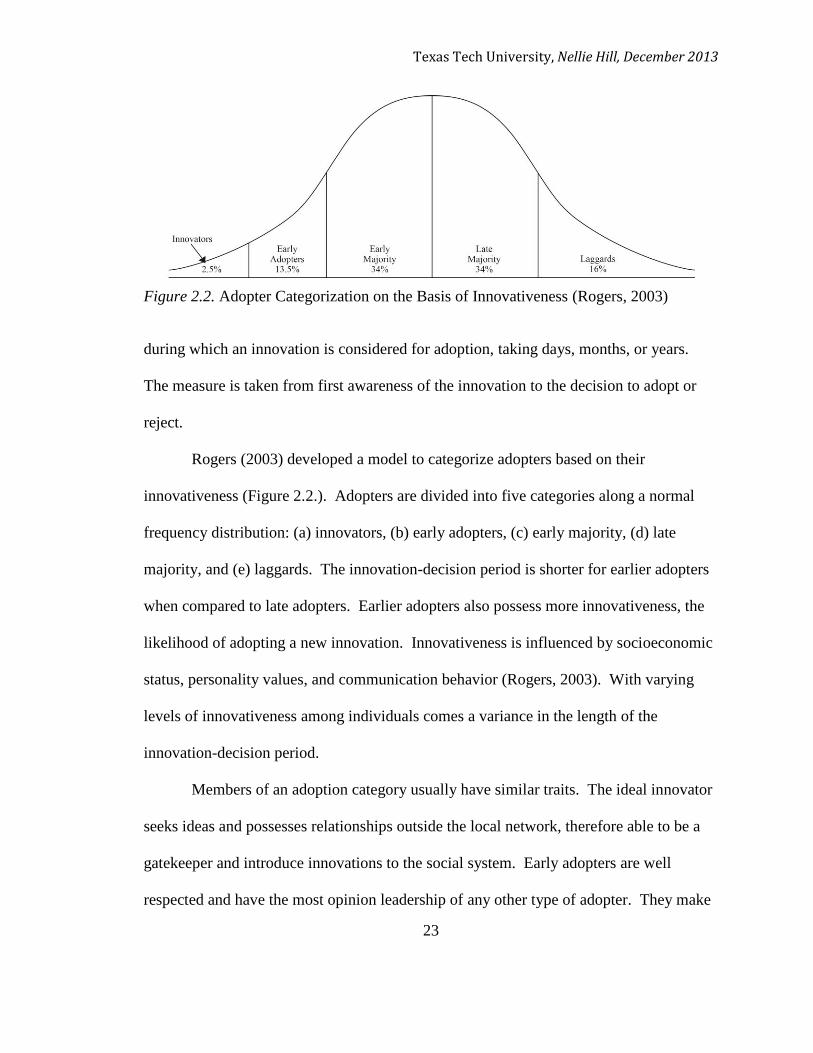
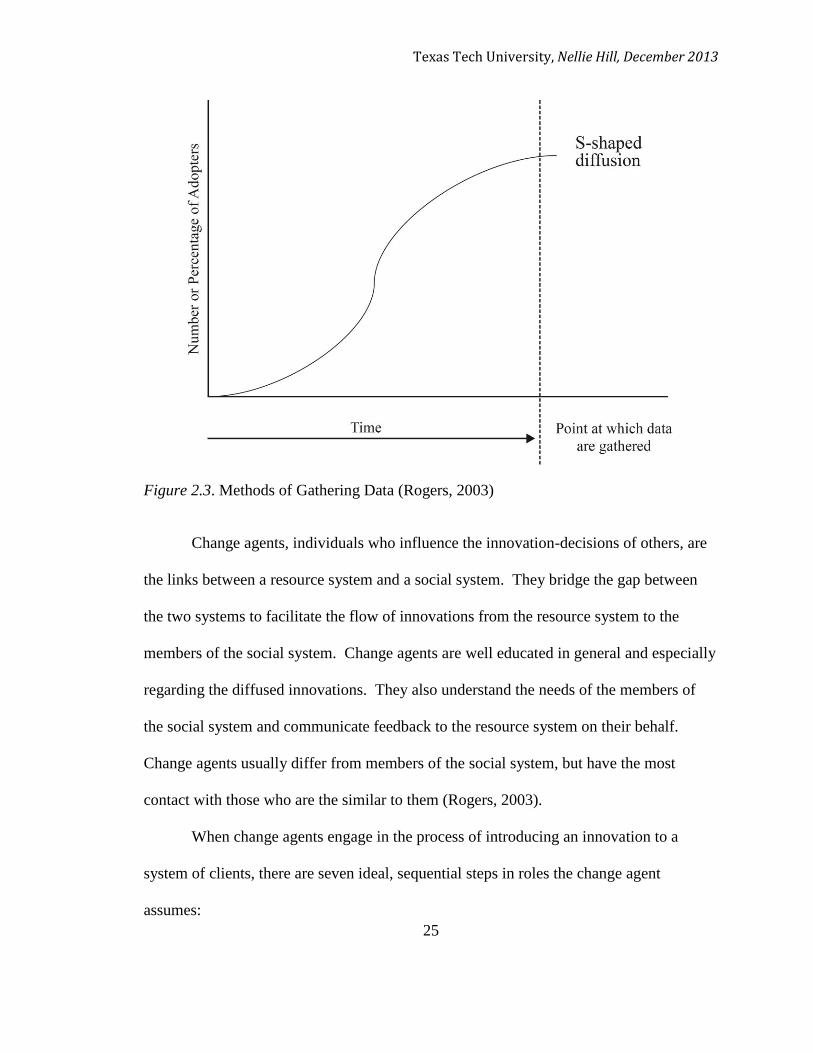
The rate of adoption is the speed with which an innovation is adopted in a social
system. Rogers (2003) recognized that interpersonal networks within a social system
increase the rate of adoption for innovations. The first diffusion network study,
conducted by Coleman, Katz, and Menzel (1966), explored the spread of a new drug
among medical doctors. When the doctors became aware of the new drug, they asked
their peers for information to help make the adoption decision. An early adopter shared
his or her opinion and personal experience with two or more doctors, who might adopt
and then interpersonally share their opinion and personal experience with more doctors,
and so on. The chain-reaction contagion process caused an S-shaped rate of adoption
curve (Figure 2.3.). This study established network links as important predictors of
innovation adoption (Rogers, 2003).
Texas Tech University, Nellie Hill, December 2013
25
Figure 2.3. Methods of Gathering Data (Rogers, 2003)
Change agents, individuals who influence the innovation-decisions of others, are
the links between a resource system and a social system. They bridge the gap between
the two systems to facilitate the flow of innovations from the resource system to the
members of the social system. Change agents are well educated in general and especially
regarding the diffused innovations. They also understand the needs of the members of
the social system and communicate feedback to the resource system on their behalf.
Change agents usually differ from members of the social system, but have the most
contact with those who are the similar to them (Rogers, 2003).
When change agents engage in the process of introducing an innovation to a
system of clients, there are seven ideal, sequential steps in roles the change agent
assumes:
Texas Tech University, Nellie Hill, December 2013
26
1. To develop a need for change.
2. To establish an information exchange relationship.
3. To diagnose problems.
4. To create an intent to change in the client.
5. To translate an intent into action.
6. To stabilize adoption and prevent discontinuance.
7. To achieve a terminal relationship (Rogers, 2003, pp. 369-370).
When change agents identify and mobilize opinion leaders, the adoption of an
innovation is likely to be higher within a social system. Opinion leaders influence other
individuals’ attitudes or behaviors. Opinion leaders are innovators who have high
exposure to mass media, are cosmopolite, participate socially, and have elevated
socioeconomic status. Change agents should use opinion leaders for communication
activities to more effectively use resources of time and energy. Messages to the network
from near peers, including opinion leaders, are credible in convincing an individual to
adopt an innovation (Rogers & Kincaid, 1981; Rogers, 2003).
Relation to Study
The researcher is concerned with the diffusion of innovations through the network
of TAWC producers under study. The innovations are best practices, new technologies,
and information from project coordinators. The relationships between producers are the
interpersonal communication channels that the innovations pass through. These
relationships will be mapped using social network analysis. Diffusions through networks
Texas Tech University, Nellie Hill, December 2013
27
take varying amounts of time, depending on each TAWC producer’s adopter
categorization. The TAWC producers serve as the social system for this study.
Information is sought from a variety of sources in order to gain knowledge about
an innovation. Change agents and opinion leaders play a key role in the diffusion of
innovations. Therefore, the researcher is interested in identifying who those people are in
the studied social system. The interpersonal relationships of producers with each other,
change agents, and opinion leaders will have great impact, according to theory, on
producer’s decision to adopt or reject an innovation. The Diffusion of Innovations
framework will be an important guide to the execution of this research.
Conceptual Framework
Producers of agricultural products, farmers and ranchers, operate as both an
individual and a professional. In order to describe the communications of producers as a
single unit and as an organization, the conceptual framework is divided into two parts,
discussing the producer as an individual entrepreneur and the producer as an agricultural
professional.
Producer as an Individual Entrepreneur
Interpersonal communication.
Interpersonal communication occurs when two connected people exchange
informational messages that are sent, received, encoded, and decoded (Berko, Aitkey, &
Wolvin, 2010; DeVito, 2007). Diffusion of information is dependent on interpersonal
communication to complete the social process (Rogers, 2003). Interpersonal
communication is critical in the process of change, especially changes in strongly held
Texas Tech University, Nellie Hill, December 2013
28
attitudes (Rogers, 2003; Rogers & Kincaid, 1981). Interpersonal communication
channels can be used as a decision-making aid to facilitate two-way exchange of
information, with the opportunity to clarify or request further details. These channels can
either be localized, within a network, or cosmopolite, connecting individuals to others
who are outside the defined network. Localite, interpersonal channels involve face-to-
face communication between peers. Cosmopolite, interpersonal channels include change
agents, tours outside the local community, and visitors from outside the community
(Rogers, 2003).
The three primary models of communication are the linear, interactional, and
transactional models. Each model represents a different perspective on the process of
sharing information to reach shared meaning (Fujishin, 2012). Most communication
research has been conducted within the context of these models (Rogers & Kincaid,
1981).
The linear model of communication represents left-to-right, one-way
communication (Rogers & Kincaid, 1981). A source encodes and sends a message
through sensory channels to a receiver who decodes the message (Berko et al., 2010).
Shannon and Weaver (1949) developed the mathematical model of communication, a
linear model (Figure 2.4.).
Texas Tech University, Nellie Hill, December 2013
29
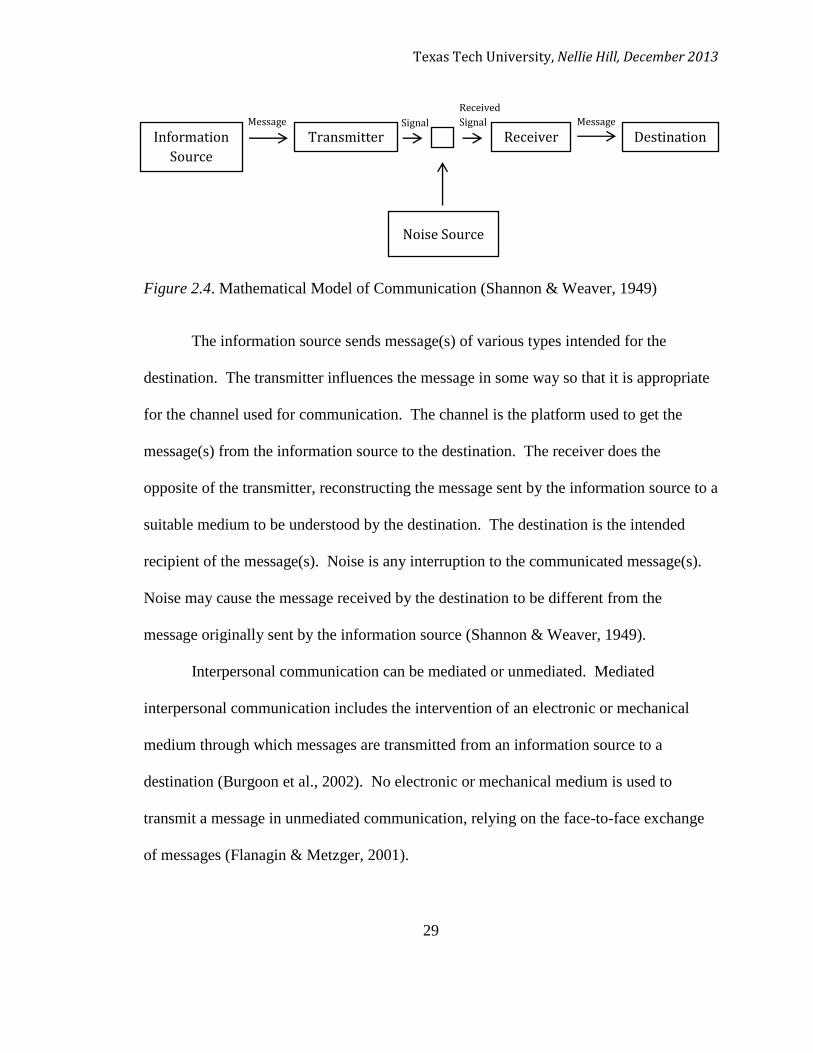
Figure 2.4. Mathematical Model of Communication (Shannon & Weaver, 1949)
The information source sends message(s) of various types intended for the
destination. The transmitter influences the message in some way so that it is appropriate
for the channel used for communication. The channel is the platform used to get the
message(s) from the information source to the destination. The receiver does the
opposite of the transmitter, reconstructing the message sent by the information source to a
suitable medium to be understood by the destination. The destination is the intended
recipient of the message(s). Noise is any interruption to the communicated message(s).
Noise may cause the message received by the destination to be different from the
message originally sent by the information source (Shannon & Weaver, 1949).
Interpersonal communication can be mediated or unmediated. Mediated
interpersonal communication includes the intervention of an electronic or mechanical
medium through which messages are transmitted from an information source to a
destination (Burgoon et al., 2002). No electronic or mechanical medium is used to
transmit a message in unmediated communication, relying on the face-to-face exchange
of messages (Flanagin & Metzger, 2001).
Message
Received
Signal Signal Message
Information
Source
Transmitter Receiver Destination
Noise Source
Texas Tech University, Nellie Hill, December 2013
30
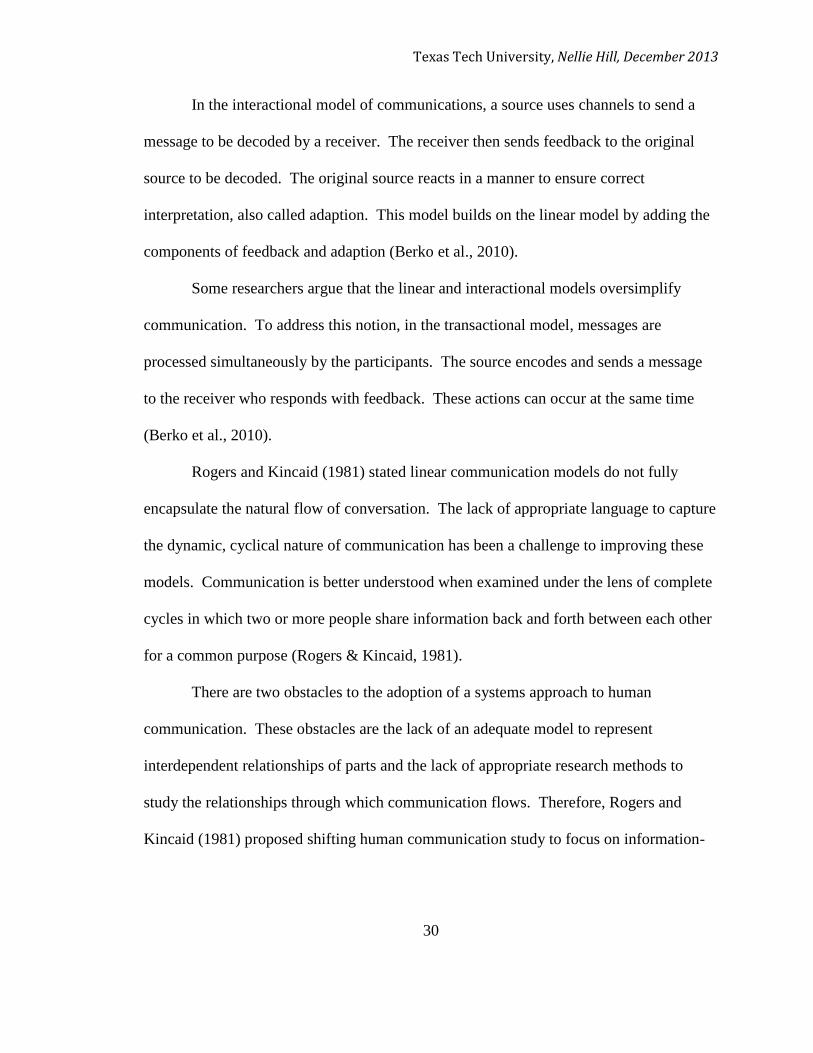
In the interactional model of communications, a source uses channels to send a
message to be decoded by a receiver. The receiver then sends feedback to the original
source to be decoded. The original source reacts in a manner to ensure correct
interpretation, also called adaption. This model builds on the linear model by adding the
components of feedback and adaption (Berko et al., 2010).
Some researchers argue that the linear and interactional models oversimplify
communication. To address this notion, in the transactional model, messages are
processed simultaneously by the participants. The source encodes and sends a message
to the receiver who responds with feedback. These actions can occur at the same time
(Berko et al., 2010).
Rogers and Kincaid (1981) stated linear communication models do not fully
encapsulate the natural flow of conversation. The lack of appropriate language to capture
the dynamic, cyclical nature of communication has been a challenge to improving these
models. Communication is better understood when examined under the lens of complete
cycles in which two or more people share information back and forth between each other
for a common purpose (Rogers & Kincaid, 1981).
There are two obstacles to the adoption of a systems approach to human
communication. These obstacles are the lack of an adequate model to represent
interdependent relationships of parts and the lack of appropriate research methods to
study the relationships through which communication flows. Therefore, Rogers and
Kincaid (1981) proposed shifting human communication study to focus on information-

Texas Tech University, Nellie Hill, December 2013
31
exchange relationships through the intellectual paradigm of network analysis and the
convergence model of communication (Figure 2.5.).
Figure 2.5. Convergence Model of Communication (Kincaid, 1979; Kincaid & Schramm,
1975)
The model shows the cyclical process of communication where participants
exchange information to converge upon mutual understanding. Convergence implies
movement and encapsulates the dynamic nature of communication. This model takes a
relational perspective on human communication, examining mutual causation and the
interdependent relationships between participants (Rogers & Kincaid, 1981).
Convergence toward mutual understanding beings with “and then…”, which
implies that something has occurred before the process began to be observed. Each
participant has a history that influences the information shared by that individual, which
the other communication process participant(s) may or may not consider. Participant A
Texas Tech University, Nellie Hill, December 2013
32
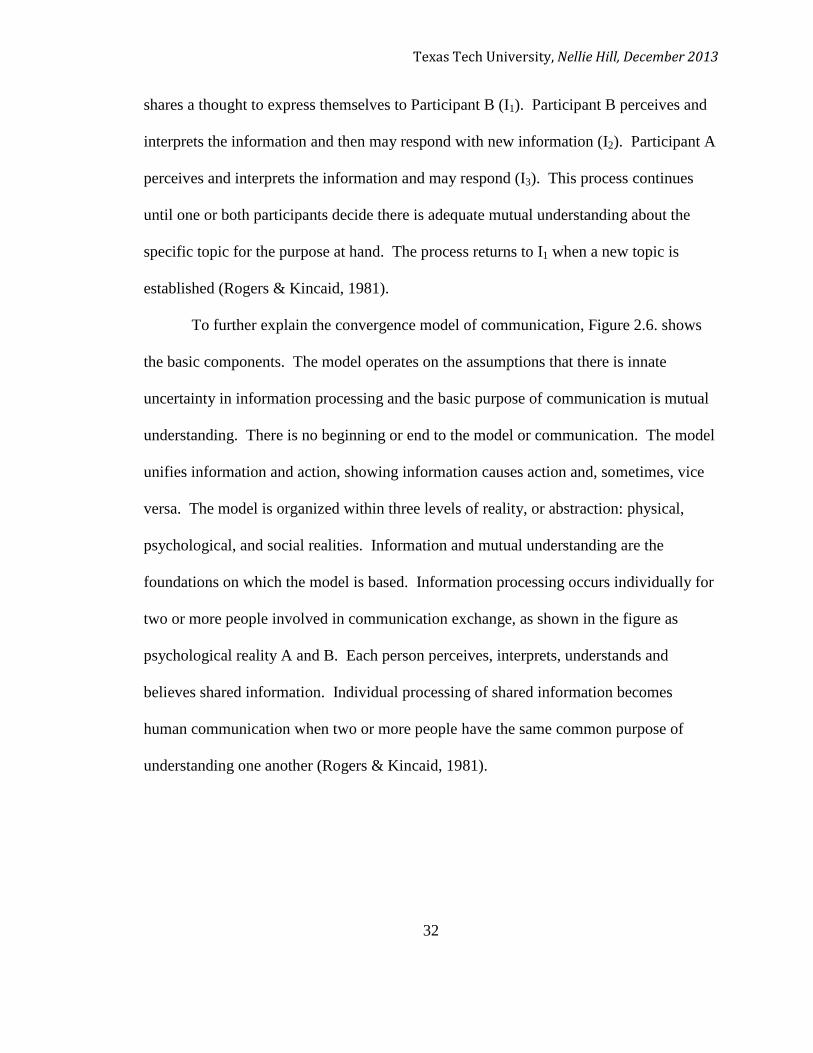
shares a thought to express themselves to Participant B (I1). Participant B perceives and
interprets the information and then may respond with new information (I2). Participant A
perceives and interprets the information and may respond (I3). This process continues
until one or both participants decide there is adequate mutual understanding about the
specific topic for the purpose at hand. The process returns to I1 when a new topic is
established (Rogers & Kincaid, 1981).
To further explain the convergence model of communication, Figure 2.6. shows
the basic components. The model operates on the assumptions that there is innate
uncertainty in information processing and the basic purpose of communication is mutual
understanding. There is no beginning or end to the model or communication. The model
unifies information and action, showing information causes action and, sometimes, vice
versa. The model is organized within three levels of reality, or abstraction: physical,
psychological, and social realities. Information and mutual understanding are the
foundations on which the model is based. Information processing occurs individually for
two or more people involved in communication exchange, as shown in the figure as
psychological reality A and B. Each person perceives, interprets, understands and
believes shared information. Individual processing of shared information becomes
human communication when two or more people have the same common purpose of
understanding one another (Rogers & Kincaid, 1981).
Texas Tech University, Nellie Hill, December 2013
33
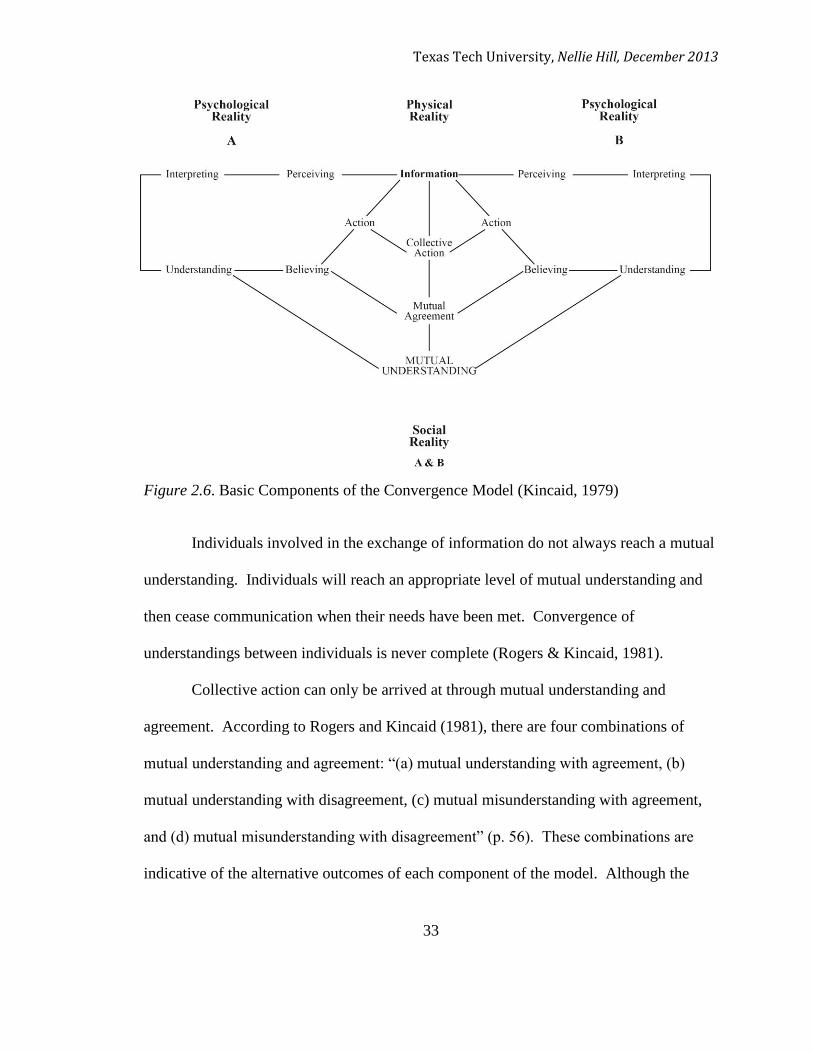
Figure 2.6. Basic Components of the Convergence Model (Kincaid, 1979)
Individuals involved in the exchange of information do not always reach a mutual
understanding. Individuals will reach an appropriate level of mutual understanding and
then cease communication when their needs have been met. Convergence of
understandings between individuals is never complete (Rogers & Kincaid, 1981).
Collective action can only be arrived at through mutual understanding and
agreement. According to Rogers and Kincaid (1981), there are four combinations of
mutual understanding and agreement: “(a) mutual understanding with agreement, (b)
mutual understanding with disagreement, (c) mutual misunderstanding with agreement,
and (d) mutual misunderstanding with disagreement” (p. 56). These combinations are
indicative of the alternative outcomes of each component of the model. Although the
Texas Tech University, Nellie Hill, December 2013
34
terms imply positive outcomes, the opposite may also result, such as misconception,
misunderstanding, or disbelief.
Rogers and Kincaid (1981) challenged researchers to use the convergence model
of communication as a platform to study relationships as well as the differences and
similarities between people. The smallest unit of analysis should be two connected
people and then extending analysis out into cliques, personal networks, and large, intact
networks.
Agricultural producers principally prefer interpersonal communication methods
(Gamon, Bounaga, & Miller, 1992; Lasley et al., 2001; Licht & Martin, 2007a;
Richardson & Mustian, 1994; Riesenberg & Gor, 1989; Suvedi, Lapinski, & Campo,
2000; Vergott et al., 2005). Ryan and Gross (1943) found demonstration of this notion;
concluding interpersonal communication was the primary influence on hybrid corn seed
adoption. Nearly half (45.5%) of farmers selected neighbors as the most influential. The
greatest percentage (49%) of first knowledge of the innovation was acquired from
salesmen.
In addition, Riesenberg and Gor (1989) found on-farm demonstrations and tours,
as well as field trips were the most effective means of communicating with producers in
Idaho. A study of North Carolina farmers conducted by Maddox, Mustain, and Jenkins
(2003) supported Risenberg and Gor’s (1989) findings. In addition, they found fellow
producers are a major source of information.
Texas Tech University, Nellie Hill, December 2013
35
Social Exchange Theory.
Social Exchange Theory proposes that a series of interactions between people
generates transactions that are mutually contingent and rewarding to produce
interpersonal attachment (Emerson, 1976). The theory studies the relationship of
exchange between two actors in an environment. People will make utility comparisons to
decide whether or not to exchange resources with another person (Emerson, 1987).
When one person shares a useful resource with another person, an obligation is created to
return a useful resource (Blau, 1964). The ability to compare interpersonal processes is
what sets Social Exchange Theory apart from economic theory (Emerson, 1987).
The seminal studies of social exchange were conducted in the 1920s by
Malinowski (1922) and Mauss (1925). Contributions by four central figures in sociology
and social psychology laid the foundation for modern Social Exchange Theory (Emerson,
1976). George C. Homans (1950, 1958, 1974) expressed social exchange as behaviorism
through individual transactions of information or material resources. This general
exchange approach was supported by the work of Thibaut and Kelly (1959) in their
construction of the compact conceptual scheme. Blau (1964) warned of too much
attention to psychology and instead put an emphasis on technical, economic analysis of
social exchange.
These early studies sought to use an individual’s supply and demand of resources
to explain the likelihood that a dyadic relationship would form (Monge & Contractor,
2001). Emerson (1972a) mixed the styles of Homans and Blau in his development of a
formal theory of exchange behavior. In addition, he used analysis of dyadic exchange
Texas Tech University, Nellie Hill, December 2013
36
relationships as a framework for analyzing exchange network structures (Emerson,
1972b; Cook & Rice, 2003). Emerson (1976) contended that Social Exchange Theory is
a frame of reference with a focus on the movement of resources through social processes.
These resources will only be transacted if there is a contingent valued return, called
reinforcement or exchange.
The interpersonal exchange of resources develops relationships that evolve into
trusting, loyal, and reciprocal commitments. To build these relationships, two people
develop and abide my guidelines of exchange processes, also known as rules or norms of
exchange (Cropanzano & Mitchell, 2005). Relationships with well-established norms
have a deep, mutual understanding gained by great investments of time and energy
(Granovetter, 1973). As relationships progress, people will prefer to work more closely
with established, strong ties. Once mutual trust and understanding is established, one
party in the relationship can request resources from strong, direct ties without
reciprocation being immediately necessary (Blau, 1964; Ekeh, 1974; Lévi-Strauss, 1969;
Kim, 2006).
Six types of resources can be exchanged across interpersonal relationships: love,
status, information, money, goods, and services (Foa & Foa, 1974, 1980). A two-
dimensional matrix organizes these types of resources. The particularism of a resource,
or variance of worth based on source, is held in one dimension. For example, money is
relatively low in particularism because monetary value is constant regardless of the
source. The second dimension holds concreteness of a resource, also referred to as
tangibility. Many types of goods are high in concreteness because they are material.
Texas Tech University, Nellie Hill, December 2013
37
Less concrete resources are symbolic, holding meaning beyond objective worth or value
(Cropanzano & Mitchell, 2005).
These resources are likely to be exchanged in various ways, depending on the
nature of the resource. Foa and Foa (1974, 1980) theorized that generally, the less
particularistic and more concrete a resource is, the more likely it is to be exchanged in a
short-term, reciprocated manner. Contrastingly, highly particularistic and symbolic
resources are exchanged in a way that reciprocation is not required. For example, money
is often exchanged for a good, but investment in love or status does not require or
guarantee a return (Cropanzano & Mitchell, 2005).
Social Exchange Theory has been used to explain such diverse areas as social
power (Molm, Peterson, & Takahashim, 1999), networks (Brass, Galaskiewicz, Greve, &
Tsai, 2004; Cook, Molm, & Yamagishi, 1993), board interdependence (Westphal &
Zajac, 1997), psychological contracts (Rousseau, 1995), and leadership (Liden,
Sparrowe, & Wayne, 1997).
The investigation of Social Exchange Theory within the context of agriculture
dates back to the earliest studies of the framework. Malinowski (1932) studied the social
trade relations between farming and fishing communities. The anthropologist explored
the social and economic order of the Trobriand Islanders, located off the coast of New
Guinea. More recently, Jussila, Goel, and Tuominen (2012) employed Social Exchange
Theory as a framework to better understand the management of co-operative
organizations. The researchers found this theory explains the incentives for activity
among co-operative members. In addition, there is a connection between member
Texas Tech University, Nellie Hill, December 2013
38
motivations for exchange and the sustainability and success of co-operative member
exchange relationships.
Social Comparison Theory.
People actively seek to evaluate their own opinions, abilities, and life situations.
They do so by making comparisons with other people, when objective standards are not
available. Moreover, people are more likely to make comparisons with people who are
similar to them (Festinger, 1954). Based on a range of social comparisons with others
whom are perceived to be relevantly similar, people determine a level of satisfaction with
themselves and their life (Goethals & Klein, 2000).
Although the broad concept of self-identity and comparison for self-
understanding has been present since the first social philosophers and scientists, it was
not until the beginning of the 19th
century that research greatly expanded (Suls &
Wheeler, 2000). The essential role of social comparisons for subjective well-being was
established with the studies of Sherif (1936), Asch (1956), Hyman (1942), and Merton
and Kitt (1950). These research efforts, in combination with his own earlier studies,
influenced the theorizing of Festinger (1954). He was the first to introduce the term
“social comparison” and the first to propose a systematic theory.
Festinger (1954) emphasized how individuals use social groups to get the
information they need to assess their abilities and opinions. People need to know if their
opinions are correct and what they are capable of accomplishing through the use of their
abilities. To compare, people will choose others who they perceive as having similar
attributes related to the opinion or ability at hand. Pressures of uniformity are created to
Texas Tech University, Nellie Hill, December 2013
39
reduce divergence in the group if discrepancies surrounding an issue are discovered
through comparisons. These pressures vary in strength with the relevance, importance,
and attraction to the group the person feels pertaining to the opinion or ability in need of
evaluation.
Social Comparison Theory contends that through comparison, people can satisfy
an array of personal motives. These include self-evaluation, common bond, self-
improvement, self-enhancement, altruism, and self-destruction. Self-esteem, comparison
target, and the usage of the comparison are considered influences on the comparison
process (Helgeson & Mickelson, 1995). People can reduce or eliminate uncertainty by
comparing their opinions and abilities with others (Festinger, 1954). Reassurance is
granted when social comparisons are made with someone who is involved, but not
worried about a particular issue (Affleck & Tennen, 1991).
Social comparison is rooted in the assessment of peer opinions, as evidenced by
informal social communication theory, which Festinger (1950) published four years prior
to Social Comparison Theory. The major difference between the two theories is the
individual’s need to compare abilities in addition to opinions (Suls, 2000). According to
Suls (2000) model, there are three types of opinion comparisons: preference assessment,
belief assessment, and preference prediction. Preference assessments judge if something
is presently right, appropriate, or favorable for a person by asking, “Do I like X?” Belief
assessments are potentially verifiable by judging the facts or correctness of a claim by
asking, “Is X true?” Preference predictions determine a person’s likely reaction to an
anticipated object or situation by asking, “Will I like X?” This model builds on the
Texas Tech University, Nellie Hill, December 2013
40
previous work of Jones and Gerard (1967), Goethals and Darley (1977), and Gerard and
Orive (1987) to understand if people always seek similar individuals to compare
opinions, no matter the type of opinion.
Suls (2000) found comparisons with others who are similar is preferred and has
the strongest impact on opinions of preference assessment and preference prediction. In
contrast, when assessing beliefs for truth or correctness, comparisons with others who are
dissimilar and experts in the field to be evaluated should be preferred. This agrees with
the exception Festinger (1954) recognized in his hypothesis, stating that people have a
tendency to compare with similar others, but comparisons with others who have
somewhat different opinions will lead to reevaluation of one’s own opinion. In addition,
objective sources of information are preferred above social comparisons (Festinger,
1954). Therefore, the higher the level of expertise available to assess an opinion, the
stronger the belief assessment (Suls, 2000).
Abilities must also be accurately assessed to satisfy motivations of self-
evaluation. When confronted with a task, a person asks, “Can I do X?” Social
comparison is used to attempt to accurately determine if a person has the necessary level
of ability before investing in a potentially costly task (Martin, 2000). Performance
similarity between individuals under comparison is a foundation for accurate self-
evaluation (Festinger, 1954). Similarity of related attributes builds upon this to
strengthen comparisons (Martin, 2000).
The proxy comparison model developed by Wheeler, Martin, and Suls (1997) was
inspired and supported by the studies of Jones and Regan (1974); Kulik, Mahler, and
Texas Tech University, Nellie Hill, December 2013
41
Earnest (1994); Kulik, Mahler, and Moore (1996); and Smith and Sachs (1997). The
proxy model follows the social comparison process, but with emphasis on the necessary
combination of performance and attribute similarities to accurately compare and assess
ability (Martin, 2000).
Another person who has already completed the considered task, under certain
conditions, may serve as a substitute of self when assessing personal ability. This proxy
provides the strongest comparison when both parties have completed a similar and
relevant task (task A) and the proxy has completed the novel task under appraisal (task
B). The performance of both parties on task A is one determining factor to consider
when predicting the self’s performance on task B. If the proxy and self performed
similarly on task A and proxy performed satisfactorily on task B, it may suggest that self
would perform the same way in task B. More information about the proxy regarding
other important variables is needed to make an accurate assessment of ability (Martin,
2000).
Proxies who share more information strengthen ability comparisons. Wheeler et
al. (1997) introduced, within the proxy model, maximum potential effort as a key
indicator of performance similarity usefulness to comparison. If it is known that the
proxy put forth maximum possible effort in both tasks, the self can more accurately make
a performance prediction. Maximum possible effort is often vague and difficult to
determine. When this is the case, related attribute similarity between proxy and self, in
combination with any knowledge of the proxy’s maximum potential effort, builds a more
accurate comparison of ability. If maximum potential effort is known with certainly,
Texas Tech University, Nellie Hill, December 2013
42
related attributes are irrelevant in determining accurate performance predictions. The
process encapsulated by the proxy model is a systematic explication of how a person can
predict what one has the ability to accomplish (Martin, 2000).
To explore an ideal, hypothetical example at work in the context of this study,
TAWC producer A enters into the proxy model. TAWC producer A seeks to assess if his
operation will be successful in planting a new drought tolerate corn seed variety. In the
past, TAWC producer and TAWC producer B, the proxy, have both planted a drought
tolerant cotton variety, with similar, successful results. TAWC producer B planted the
new drought tolerant corn seed variety last year with high yields. The producers have a
longstanding relationship, so TAWC producer A knows TAWC producer B takes
changes to his operation very seriously and always puts forth maximum potential effort
when trying new seed varieties. Therefore, using the proxy model, TAWC producer A
can predict that he will be successful in planting the new drought tolerant corn seed
variety.
Social Comparison Theory research historically focused on the comparison
purposes of individualistic, psychological needs, while the theory is grounded in group
processes (Forsyth, 2000). Festinger (1954) employed the theory to investigate
homogeneity in groups, opinion debates, group members with higher levels of motivation
and competition, rejection of protestors, and shifts in group member opinions.
When confronted with confounding behavior or irregular findings in the study of
groups, researchers often use explanations that refer to the principle of comparison,
making Social Comparison Theory the second most favored explanation of group
Texas Tech University, Nellie Hill, December 2013
43
processes. However, few studies directly assess the theory’s assumptions (Arrowood,
1978; Forsyth, 2000). Studies of group formation, affiliation, social identity, majority
and minority influence, social loafing, and the transmission of values and beliefs from
groups to individuals have used the principle of comparison to explain the behavior of
individuals in group contexts (Forsyth, 2000).
In the process of determining the accuracy of opinions and quality of abilities,
people are shaped by the very people in the very groups with whom they are engaging in
comparison. Changes are slow and subtle as people in a group make comparisons that
lead to revision of their opinions and identification of personal strengths, weaknesses,
assets, and liabilities (Forsyth, 2000). Groups serve as standards or frames of reference
when people evaluate their abilities, attitudes, beliefs, and life situations (Hyman, 1960).
Social comparisons within groups also influence the transmission of religious, economic,
moral, political, and interpersonal beliefs in groups (Forsyth, 2000).
People need to accurately assess their opinions and abilities in order to make
informed choices about dealing with the world. Inaccurate assessments can have
negative consequences that are punishing or even fatal (Festinger, 1954).
Social Comparison Theory has been used in agricultural research to better
understand the people within the industry. Bajema, Miller, and Williams (2002) studied
the aspirations of rural youth to identify perceived opportunities and barriers to achieving
their goals. The researchers found that most of the students had set educational and
occupational goals that were supported by their school environment. Vindigni, Janssen,
and Jager (2002) used Social Comparison Theory to explore consumer behavior with
Texas Tech University, Nellie Hill, December 2013
44
regards to the diffusion of organic food consumption. Janssen (2001) investigated
management of nutrient dense lakes within a theoretical framework that included Social
Comparison Theory. The researcher found that if returns are low and personal
uncertainty is high, people will adopt the behaviors of other, similar people.
Producer as an Agricultural Professional
Communities of practice.
Lave and Wenger (1991) first formed the concept of communities of practice, but
the definition of the term varies from scholar to scholar (Cox, 2005). Wenger,
McDermott, and Snyder (2002) established communities of practice as “groups of people
who share a concern, a set of problems, or a passion about a topic, and who deepen their
knowledge and expertise in this area by interacting on an ongoing basis” (p. 4). Learning
happens through informal collaborative means. The network is bound together by a
shared professional identity (Wenger, 1998). The values of the community are a
determinate for prospective members (Hara, 2009).
Wenger et al. (2002) described actions to cultivate communities of practice:
1. “Design for evolution.
2. Open a dialogue between inside and outside perspectives.
3. Invite different levels of participation.
4. Develop both public and private community spaces.
5. Focus on value.
6. Combine familiarity and excitement.
7. Create a rhythm for the community” (p. 51).
Texas Tech University, Nellie Hill, December 2013
45
Cultivated communities of practice are loose-knit and value-driven (McDermott,
1999). Members fully commit to the community’s work when they believe they can
extract benefits in return for their investment (McDermott, 2004; Wenger & Snyder,
2000). These benefits are most often related to improved knowledge sharing among
members of the community as well as people outside of the community who share a
common expertise with the community (Wenger & Snyder, 2000).
Knowledge sharing develops best practices, which are focused on new skills,
products, ideas, and more efficient practices. These practices do not exist inside or
outside of the community prior to development (Probst, Raub, & Romhardt, 1999).
However, knowledge sharing and the development of best practices amongst
communities of practice is complex. Members are faced with obstacles of indecision on
what, if, when, and to what extent to share information with the community (Hara, 2009).
While communities of practice are undoubtedly valuable to organizations, the
measurement of that value is difficult to assess. There remains the question as to if
communities of practice truly cultivate meaningful collaborations and organization value.
Researchers have recommended using various methods to assess value. Suggested
nontraditional methods include individual and focus group interviews (Millen, Fontaine,
& Muller, 2002), surveys (Millen & Fontaine, 2003), and social network analysis (Cross
et al., 2006; Wasko & Faraj, 2005).
Researchers have applied Wenger’s (1998) work to agricultural contexts. Morgan
(2011) explored social learning processes within communities of practice formed by
organic farmers. The researcher found that farmers engaged in social learning more often

Texas Tech University, Nellie Hill, December 2013
46
when farming operation style and knowledge align. Knowledge is generated in the
context of the community’s professional focus. Attwater and Derry (2005) employed a
mix of methods to engage several communities of practice somehow invested in the
Hawkesbury Water Recycling Scheme. Oreszczyn and Lane (2006) studied the impacts
of new technologies on farmer communities of practice. The researchers found
knowledge creation and sharing was a strong feature of the communities. Unlike
members of other industries, farmers are not as wary of sharing information because of
the importance of sharing formal and informal knowledge. Farmers are adaptive and are
open to new ideas and technologies to improve their operation. The adoption of new
technologies by some members of the community, but not others, has an affect on the
dynamics of the community of practice.
Uncertainty Reduction Theory.
Berger and Calabrese (1975) originated uncertainty reduction as a theoretical
perspective by building on the work of Heider (1958). The Uncertainty Reduction
Theory states that people seek to reduce the uncomfortable feelings of uncertainty and
unpredictability through communication when faced with the unknown. People
communicate in all contexts, interpersonal, organizational, and mediated, to gather and
share information. There is a human desire to predict outcomes, both positive and
negative, resulting from actions and judgments. People communicate to reduce
uncertainty, but they also communicate in ways that create uncertainty. They may
mislead, distort, and withhold information just as they can create, share, lead, and protect
information (Heath & Bryant, 2000).
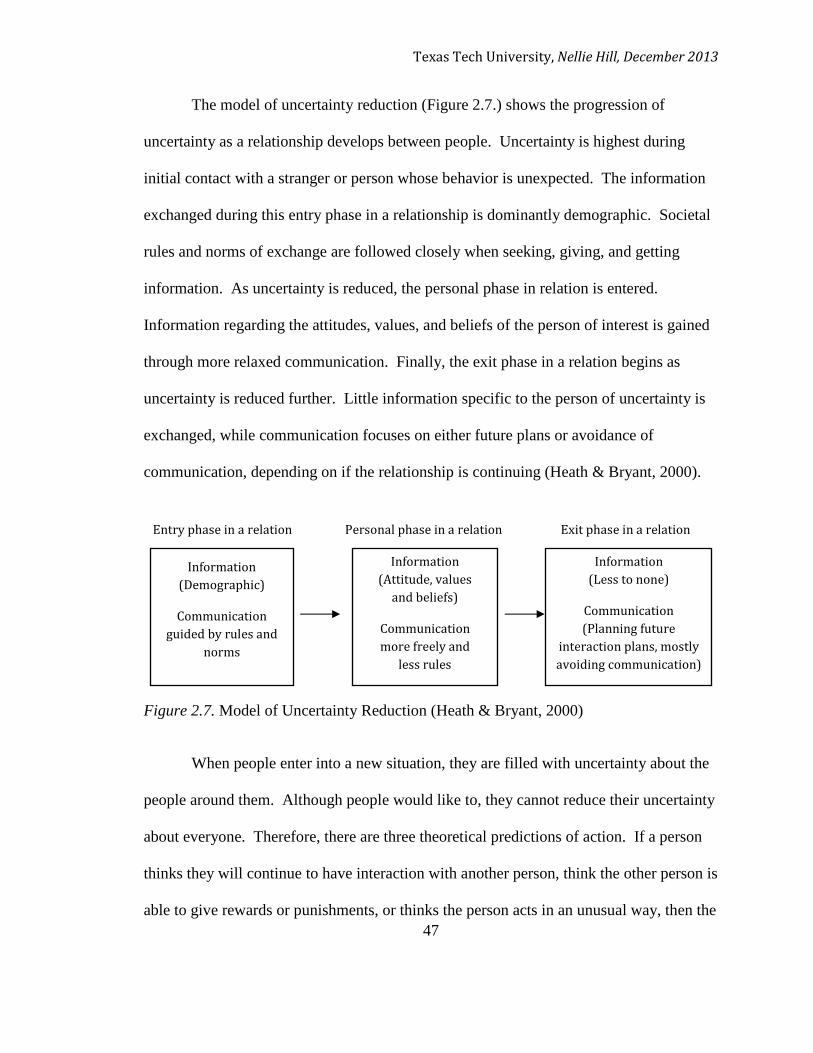
Texas Tech University, Nellie Hill, December 2013
47
The model of uncertainty reduction (Figure 2.7.) shows the progression of
uncertainty as a relationship develops between people. Uncertainty is highest during
initial contact with a stranger or person whose behavior is unexpected. The information
exchanged during this entry phase in a relationship is dominantly demographic. Societal
rules and norms of exchange are followed closely when seeking, giving, and getting
information. As uncertainty is reduced, the personal phase in relation is entered.
Information regarding the attitudes, values, and beliefs of the person of interest is gained
through more relaxed communication. Finally, the exit phase in a relation begins as
uncertainty is reduced further. Little information specific to the person of uncertainty is
exchanged, while communication focuses on either future plans or avoidance of
communication, depending on if the relationship is continuing (Heath & Bryant, 2000).
Figure 2.7. Model of Uncertainty Reduction (Heath & Bryant, 2000)
When people enter into a new situation, they are filled with uncertainty about the
people around them. Although people would like to, they cannot reduce their uncertainty
about everyone. Therefore, there are three theoretical predictions of action. If a person
thinks they will continue to have interaction with another person, think the other person is
able to give rewards or punishments, or thinks the person acts in an unusual way, then the
Entry phase in a relation Personal phase in a relation Exit phase in a relation
Information
(Demographic)
Communication
guided by rules and
norms
Information
(Attitude, values
and beliefs)
Communication
more freely and
less rules
Information
(Less to none)
Communication
(Planning future
interaction plans, mostly
avoiding communication)
Texas Tech University, Nellie Hill, December 2013
48
person will be motivated to take actions to reduce uncertainty (Baldwin, Perry, & Moffitt,
2004).
Once driven to reduce uncertainty, people employ one of three basic strategies to
acquire information. The passive strategy uses observation from a distance to better be
able to predict the observed person’s behavior. Informal settings, where the observed is
interacting with others in a casual environment, are commonly the most conducive to
using this strategy. The active strategy requires the person seeking to reduce uncertainty
to purposefully manipulate the environment or seek information about the person about
whom they are uncertain. The final strategy is interactive, meaning the person engages in
direct, face-to-face interaction with the person they are uncertain of to acquire
information (Berger, 1995). Each of these strategies allows a person to better understand
another and their behaviors, developing a relationship (Berger & Calabrese, 1975).
According to Berger (2006), relationship development relies on eight variables as
axioms: (a) verbal communication, (b) nonverbal warmth, (c) information seeking, (d)
self-disclosure, (e) reciprocity, (f) similarity, (g) liking, and (h) shared networks. High
levels of uncertainty will increase a person’s use of verbal communication, nonverbal
warmth, information seeking, and reciprocity to gain knowledge and increase
understanding of another person. Low levels of uncertainty will cause a person to
disclose more about themselves and appreciate the person of interest more. Similarities
and shared networks among two people will cause uncertainty to be reduced (Berger,
2006).
Texas Tech University, Nellie Hill, December 2013
49
Uncertainty causes great personal discomfort. This emotional and cognitive
unease can be remedied with information. Information allows people to gain
understanding and make decisions regarding themselves, their environment, and other
people. Information exchange is argued to be a basic communication paradigm. People
give and take information to reduce their uncertainty, which leads to the creation of
relationships between the sender and the receiver of information (Heath & Bryant, 2000).
When two people talk with one another, display nonverbal warmth, or perceive
similarities in opinions and attributes, uncertainty is reduced. As uncertainty decreases,
communication and nonverbal warmth increase between two people. The higher a
person’s uncertainty of another person’s behavior, the more inquisitive they will be
(Baldwin et al., 2004).
Interpersonal communication can be used to reduce uncertainty felt by a person.
People select communication strategies they believe will most likely allow them to
reduce their feeling of uncomfortable uncertainty. Interpersonal communication is
defined by Heath and Bryant (2000) as interactions during which people develop
relationships through differing communication styles and strategies to reduce uncertainty,
be personally effective, and maximize interaction rewards. What one person says or does
affects another person; this is interpersonal communication (Heath & Bryant, 2000).
When people interact through interpersonal communication, they want to reduce
their uncertainty with information about the subject as well as the person they are
communicating with. Therefore, people will assume they know who the person they are
communicating with is, which is called attribution, or the process of characterizing others
Texas Tech University, Nellie Hill, December 2013
50
and self. This is the basic process of social cognition. The desire to reduce uncertainty
can cause people to falsely characterize the person they are communicating with (Heath
& Bryant, 2000).
When information exchange in organizations becomes complex, turbulent, or
organization members become overwhelmed with information, there is an increase in
uncertainty (Heath & Bryant, 2000). Complexity is measured by the number of factors
that must be considered when processing information to make a decision. Turbulence is
the degree of stability or instability in the environment. When people are overwhelmed
with information, they have a high information load, referring to the degree of difficulty
of obtaining and processing information in efficient and effective ways. When these
three elements are present, organization members are likely to modify messages they
receive (Huber & Daft, 1987).
In short, uncertainty is motivational. It causes people to seek and process
information. Whether information is gathered aggressively or passively, it can increase
or decrease certainty. Heath and Bryant (1992) summated the theory by stating,
“Uncertainty Reduction Theory is a powerful explanation for communication behavior
because it operates in all communication contexts – to help explain why people
communicate the way they do” (p. 207).
The model of uncertainty reduction is applicable to all aspects of organizations
and the systems therein. Uncertainty motivates information seeking behavior to regain
control in the contexts of interpersonal interaction, networks, public relations, marketing,
and advertising (Heath & Bryant, 2000). Fisher (1978) argued that applying Uncertainty
Texas Tech University, Nellie Hill, December 2013
51
Reduction Theory to network research expanded communication studies from exploring
message-exchange channels to the broader concept of relationships.
Relation to Study
TAWC producers operate as an individual entrepreneur and as an agricultural
professional. They may engage with others to gain information and make decisions for
both roles. Interpersonal communications plays a core role in the relations of TAWC
producers. They will engage in information exchange with other producers, inside and
outside of the TAWC project, to meet their needs to assess their opinions and abilities.
The researcher was interested in who the producer exchanges information with and what
opinions or abilities might the producer be in need of comparing.
The TAWC producers also engage in a community of practice once they join the
project. The researcher was interested in describing this community as a whole and the
characteristics of the producers therein. Once in the community of practice, what do
producers do to reduce their uncertainty about the other members of the group or their
own role in the community? The researcher investigated the relationships built through
uncertainty reduction.
Operational Framework
Social Network Analysis
A social network is a set of members that are connected by one or more types of
relations (Wasserman & Faust, 1994). The social world is completely composed of
interconnected social networks. These dynamic networks develop from individuals
interacting with one another (Kadushin, 2012).
Texas Tech University, Nellie Hill, December 2013
52
Everyone has their own personal network, consisting of connections to other
individuals. Members of the network have an influence on the behavior of the focal
individual. Interlocking networks consist of individuals who are all connected to one
another. Members of radical networks do not all interact with one another, making the
network less dense and more open. Therefore, members of the radical network exchange
information with a wider environment and aiding in diffusion of innovations (Rogers,
2003).
Network members, also known as actors, nodes, or points, represent individuals
or organizations. Relations, also known as ties or lines, represent relationships between
network members and connect nodes. These relationships are reciprocal, involving
exchange between two parties. The more similar two nodes are, the more information
will flow back and forth between them (Kadushin, 2012).
When nodes are tied together, they form social structures. The basic unit of
analysis is the dyad, a pair of nodes and their tie. When three nodes are tied together, a
subset called a triad is formed. Building further, subgroups are any subset of nodes and
their ties. Subgroups, also known as clusters or cliques, possess characteristics that are
different from other subgroups located in the social network (Wasserman & Faust, 1994).
The visualization of social network connections is a sociogram. This map gives
insight into the relationships between nodes in a network (Scott, 2013). Sociograms can
be directed or undirected, indicating the direction of the relationship. In addition, value
can be assigned to the tie to indicate the strength of the relationship (Scott, 2013).
Moreno (1934) stated that sociograms allow researchers to identify leaders as well as
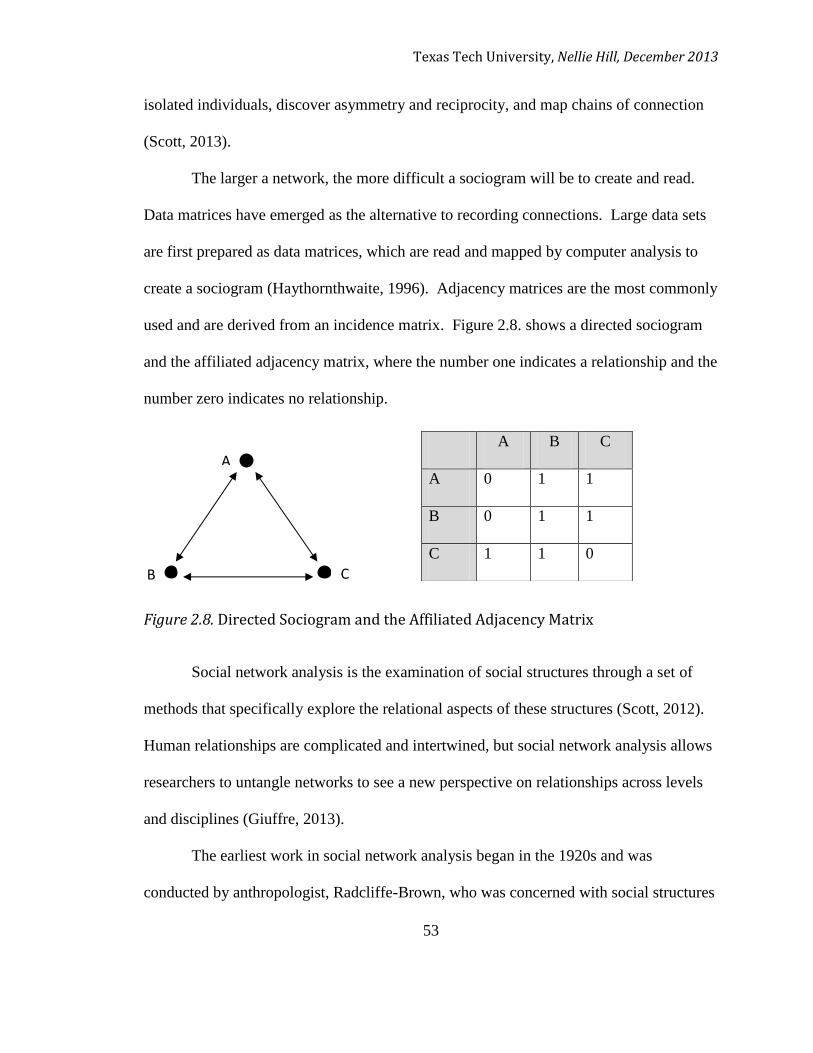
Texas Tech University, Nellie Hill, December 2013
53
isolated individuals, discover asymmetry and reciprocity, and map chains of connection
(Scott, 2013).
The larger a network, the more difficult a sociogram will be to create and read.
Data matrices have emerged as the alternative to recording connections. Large data sets
are first prepared as data matrices, which are read and mapped by computer analysis to
create a sociogram (Haythornthwaite, 1996). Adjacency matrices are the most commonly
used and are derived from an incidence matrix. Figure 2.8. shows a directed sociogram
and the affiliated adjacency matrix, where the number one indicates a relationship and the
number zero indicates no relationship.
Figure 2.8. Directed Sociogram and the Affiliated Adjacency Matrix
Social network analysis is the examination of social structures through a set of
methods that specifically explore the relational aspects of these structures (Scott, 2012).
Human relationships are complicated and intertwined, but social network analysis allows
researchers to untangle networks to see a new perspective on relationships across levels
and disciplines (Giuffre, 2013).
The earliest work in social network analysis began in the 1920s and was
conducted by anthropologist, Radcliffe-Brown, who was concerned with social structures
A B C
A 0 1 1
B 0 1 1
C 1 1 0
A
C B
Texas Tech University, Nellie Hill, December 2013
54
(Radcliffe-Brown, 1940, 1957). Social anthropologists built upon his work from the
1930s through the 1970s, developing descriptors for the organization of social networks.
Contemporary social network analysis was established by Harvard University
structuralists and Manchester University anthropologists (Scott, 2013).
Freeman (2004, 2011) has extensively researched and reviewed the history of
social network analysis. Through his research, we come to understand the modern field
of social network analysis emerged in the 1930’s through the work of researchers in
psychology (Lewin & Lippit, 1938; Moreno, 1932, 1934) and business (Warner & Lunt,
1941). All of this work in the field was done independently of one another and no central
approach to structural research was accepted across the social sciences.
Between the 1940s and 1970s, 16 centers of social network research were
established at universities across the country. Each applied social network analysis
differently to a variety of fields from a diverse array of countries. While the work of
these centers certainly developed knowledge and acceptance of social network analysis,
still no accepted paradigm for the structural approach to social science research was
agreed upon (Freeman, 2011).
Then, in the 1970s, Harrison C. White of Harvard and his students established a
17th center of social network research. The broad, generalizable structural approach they
took captured social scientists across social science disciplines around the world (White,
Boorman, & Breiger, 1976). The work of the Harvard group, led by White, led to social
network analysis becoming widely recognized as a field of research (Freeman, 2011).
Texas Tech University, Nellie Hill, December 2013
55
Researchers in the field of physics and biology began to publish works on social
networks in the 1990s, a revolutionary change. An influx of data from the Internet and
genome research, data from very large networks, caused researchers in the two fields to
find a way to analyze these new network data sets. Physicists and biologists joined forces
with computer scientists. They were primarily concerned with cohesive groups or
communities, for which many models have been developed, and the positions occupied
by individuals in a network (Borgatti & Everett, 1999; Everett & Borgatti, 2000). Their
work contributed to the field of social network analysis through refining existing tools
and creating their own while contributing new perspectives and new ways to analyze data
(Freeman, 2011).
Today, social network analysis has emerged as a research methodology and data
analysis technique that increases understanding of the vast and complex relationships
among people. It has gained a significant following in anthropology, biology,
communication studies, economics, geography, information science, organizational
studies, social psychology, and sociolinguistics, and has become a popular topic of
speculation and study (Scott, 2013).
All modern social network analysis follows four defining properties (Freeman,
2004):
1. The belief that relational links between social individuals are important.
2. It is based on the collection and analysis of empirical data.
3. Relies on graphic imagery to visualize patterns of those relations.
Texas Tech University, Nellie Hill, December 2013
56
4. To describe and explain those patterns, it develops mathematical and
computational models.
In addition, Knoke and Yang (2008) and Carolan (2014) outline three key
assumptions of social network analysis:
1. Understanding behaviors, attitudes and beliefs is more reliant on social
relations than fixed attributes.
2. Structural mechanisms of a social system affect behaviors, attitudes and
beliefs.
3. Relationships are dynamic, which required the application of theory and
method to study.
Social scientists have formulated distinct types of data and the appropriate,
coordinating method of analysis given that all social science data involves some process
of interpretation. Figure 2.9. displays these types of data and analysis methods (Scott,
2013).
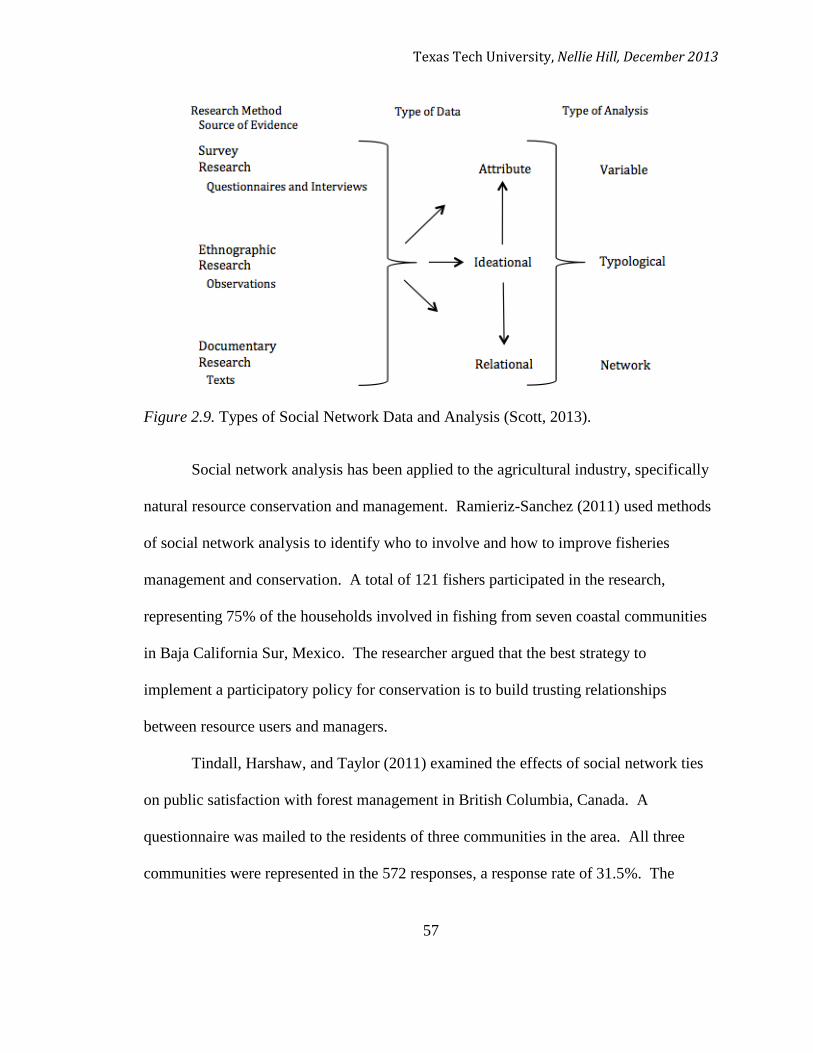
Texas Tech University, Nellie Hill, December 2013
57
Figure 2.9. Types of Social Network Data and Analysis (Scott, 2013).
Social network analysis has been applied to the agricultural industry, specifically
natural resource conservation and management. Ramieriz-Sanchez (2011) used methods
of social network analysis to identify who to involve and how to improve fisheries
management and conservation. A total of 121 fishers participated in the research,
representing 75% of the households involved in fishing from seven coastal communities
in Baja California Sur, Mexico. The researcher argued that the best strategy to
implement a participatory policy for conservation is to build trusting relationships
between resource users and managers.
Tindall, Harshaw, and Taylor (2011) examined the effects of social network ties
on public satisfaction with forest management in British Columbia, Canada. A
questionnaire was mailed to the residents of three communities in the area. All three
communities were represented in the 572 responses, a response rate of 31.5%. The
Texas Tech University, Nellie Hill, December 2013
58
researchers found social network ties to environmental organization members are
associated with the level of satisfaction the public has with forest management.
To examine the relations between political institutions and policy networks,
Scholz and Wang (2006) investigated the impact of local water policy networks on
political culture regarding the Clean Water Act. For one year, the researchers monitored
the enforcement and compliance of 1,648 major private National Pollutant Discharge
Elimination System permit holders. The empirical study found effective local networks
can enhance enforcement and compliance with regulations, even in conservative areas
prone to undermining such efforts.
Relation to Study
Social network analysis will be the driving force behind data collection and
analysis. This method will allow the researcher to meet the objectives of describing
TAWC project producers and analyzing their interpersonal connections in terms of
attributes, relations, and typology.
Summary
The review of literature established the need for research, through social network
analysis, into how social networks aid in the adoption of innovations. Producers were
discussed as both individual entrepreneurs and as agricultural professionals to better
reflect the reality of their connections, communications, and decision making. The linear
mathematical model and the convergence model of communication were identified as
conceptual frameworks in which individuals in networks exchange information. Social
Exchange Theory and Social Comparison Theory were argued as guides for the
Texas Tech University, Nellie Hill, December 2013
59
interpersonal communications of producers. Also within the conceptual framework,
communities of practice were described and a need to further examine them through
social network analysis was established. Uncertainty reduction was posited as a
theoretical concept, which drives communications in the context of producers as
agricultural professionals. The operational framework outlined social network analysis
and further confirmed the need to examine interpersonal relationships within the purpose
and objectives of this study.
Through the process of collecting and analyzing literature, the researcher
identified a connection between communication networks and social networks. The two
types of networks are discussed separately, but often use similar language. However,
convergence of communication networks and social networks in literature was not found.
Texas Tech University, Nellie Hill, December 2013
60
CHAPTER III
METHODOLOGY
Overview
The methodology for this study follows a quantitative research design in order to
collect data from TAWC producers and the TAWC project director to be analyzed. A
semi-structured questionnaire was administered through interviews with each willing
participant. The interviews were transcribed, cleaned, and analyzed for attribute data,
relational data, and typological ideology data.
The purpose of this research was to describe the TAWC producers and analyze their
interpersonal network in terms of attributes, relationships, and ideology with others as it
relates to sharing farming and water management information.
The following research objectives were used to guide this study:
1. Describe TAWC producers in terms of age, years in the project, acres in the
project, board member status, who imitated their involvement in the project, type
of irrigation used on their acres in the project, crops grown on their acres in the
project, and if livestock are raised on their acres in the project
2. Describe the interpersonal connections of the producers in the TAWC in terms of
relations
3. Describe the interpersonal connections of the producers in the TAWC in terms of
typology
Texas Tech University, Nellie Hill, December 2013
61
Research Design
A quantitative social network analysis research design was executed to reach the
objectives of this study. To begin collecting data for the study of a social network,
researchers must consider what kind of network will be studied. Two dimensions
encapsulate the many different kinds of network data: whole versus ego networks and
one-mode versus two-mode networks (Marin & Wellman, 2011). Whole network
analysis examines the presence or absence of a relationship between all nodes within a
network. Every actor in a network is asked about his or her relationship with every other
actor in the network. Ego network analysis examines the relations individuals maintain
with undefined others (Marin & Wellman, 2011). The focus on the network surrounding
one node, or ego, allows described relations to extend beyond the confines of the
formally defined group of TAWC producers. Therefore, the ego network analysis
approach allows the researcher to describe the TAWC producers and their interpersonal
connections with people both inclusive and exclusive to the project.
The inclusion of a node, or person, in network analysis should be decided upon by
way of the position-based approach, event-based approach, or relation-based approach to
defining the target population (Laumann, Marsden, & Prensky, 1983). The position-
based approach considers those who have a formally defined position or are a member of
an organization. The event-based approach defines a network by who participated in a
population-defining event. The relation-based approach begins with a small set of nodes
within the population of interest and then expands by including those who share a
particular type of relation with the original or previously added nodes (Marin &
Texas Tech University, Nellie Hill, December 2013
62
Wellman, 2011). The researcher chose the position-based approach as the population of
interest has formally defined membership in the TAWC.
To study a network, the relation of interest between nodes must be defined.
Borgatti, Mehra, Brass, and Labianca (2009) established four broad categories of
relations: (1) similarities, (2) social relations, (3) interactions, and (4) flows. Similarities
include shared demographic characteristics, attitudes, locations, or group memberships.
Social relations refer to affective ties, cognitive awareness, and commonly defined role
relations such as friend, coworker, or parent. Interactions are behavior-based ties such as
speaking with or helping another person. Flows are the exchange or transfer of
knowledge, resources, or influence between nodes and through networks (Marin &
Wellman, 2011). For the purpose of this study, the researcher was concerned with the
similarities of the producer in terms of demographic characteristics and attitudes about
water management best practices and technologies. In addition, the study is interested in
the social relations and interactions each producer has with other producers, internal or
external of the TAWC, with regards to information pertaining to farming and water
management.
In order to gain information regarding TAWC producer relations, a semi-
structured interview format was employed. Through this format, also known as the
interview guide approach, a predetermined list of questions guides the interviewer
(Patton, 2002). This ensures the same basic questions are asked at some point during
each interview. The interviewer is free to explore these questions in conversation with
additional probing questions to gain additional information. Data collected benefits from
Texas Tech University, Nellie Hill, December 2013
63
this approach in that it is somewhat systematic and possesses increased
comprehensiveness. Interviews are conversational and tailored to each situation. Given
the semi-structured format, logical gaps in data are anticipated and can be closed. There
are limitations to the interview guide approach. These limitations may include the
unintentional omission of topics. In addition, the flexibility of word choice and question
sequence may result in differing responses from differing perspectives, reducing the
comparability of answers (Patton, 2002).
The researcher-developed, semi-structured, interview questionnaire was based on
the name generator instrument recommended for egocentric networks by Marsden
(2011). This instrument includes questions that elicit a list of people with whom the
respondent is connected. Oftentimes, rosters of eligible connections for each respondent
are not available, so the answers to these questions establish the boundaries for the
studied network. Name generator questions must identify a particular type of
relationship. For this study, the researcher was concerned with the exchange of farming
operation and water management advice and information between TAWC producers and
their connections (Marsden, 2011). Dr. David Doerfert, Texas Tech University Professor
of Agricultural Communications and Graduate Studies Coordinator, reviewed the
instrument for validity. Dr. Doerfert has previous experience with the TAWC and
interacting with TAWC producers.
Population
The population for this study was all of the producers in the TAWC who reported
data for the 2012 season and the TAWC project director. The 18 producers own and
Texas Tech University, Nellie Hill, December 2013
64
operate farmland in Hale or Floyd counties, located in the High Plains region of Texas.
They voluntarily joined the TAWC and enrolled some of their operations acres in the
demonstration project. Annually, the producers voluntarily report operational
information pertaining to those acres, such as crops grown, irrigation types used, yields,
and irrigation water usage to the TAWC leadership. Of the 18 TAWC producers, 15
were interviewed. The other three declined to be interviewed. In addition, a leadership
figure, the project director, within the TAWC was interviewed because the TAWC values
him as an important figure in disseminating information to the TAWC producers.
Data Collection
Texas Tech University’s Human Research Protection Program approved this
research and all corresponding communications with the TAWC producers (Appendix
A). Each TAWC producer was contacted via telephone by the researcher to ask for their
participation by using the approved telephone script (see Appendix B). The personal
interviews were conducted over a three-month period at a time and place of most
convenience to the producer. Oftentimes, the location was the producer’s home, barn, or
local cotton gin. Immediately prior to the start of the interview, producers were informed
that their names would be changed to report the results and they were provided with the
information sheet (see Appendix C) upon request. The semi-structured format instrument
guided each interview. Probing questions were used to elicit further information from
each producer. Each interview lasted between 10 to 45 minutes, depending on the
TAWC producer. The interviews were audio-recorded to be transcribed and analyzed.
Each producer was asked questions regarding demographic information, TAWC project
Texas Tech University, Nellie Hill, December 2013
65
participation and outcomes, their social network, and their view for the future of the
project (see Appendix D). In addition to the interviews, the annual TAWC report is
public information and was used to gather attribute data of the producers for analysis.
Data Analysis
After all of the interviews were conducted, the audio-recordings were saved to a
computer. The audio files were sent to Verbal Ink, a U.S. based transcription service, to
be transcribed in full. From the transcriptions, the names of the relations provided by the
producers were gleaned and recorded into a data matrix in Microsoft Excel for further
analysis. All recorded names were replaced with assigned pseudonyms. The
transcriptions and the data matrix provide the data for variable, network, and typological
analysis.
Variable Analysis
In order to describe the producers in the TAWC, data were extracted from the
2012 TAWC Annual Report and the interviews conducted with the producers. This
information included age, year the producer entered the project, board member status,
who initiated their involvement with the project, how many acres they have in the project,
tillage practices, irrigation methods, planted crops, and if they raise livestock on their
acres in the project.
Network Analysis
The data matrix in Microsoft Excel, created from the producer interviews, was
imported into NodeXL 1.0.1.238 for Microsoft Excel. NodeXL was chosen from an
array of social network analysis software options because it is an inexpensive extension
Texas Tech University, Nellie Hill, December 2013
66
to Microsoft Excel, a commonly used and available program, and it provides a wide
range of network analysis and visualization features. In addition, Hansen, Schneiderman,
and Smith (2011) provide step-by-step directions for using NodeXL for social network
analysis.
In NodeXL, each relationship is referred to as an edge. Vertices are each
individual person, or actor. Once the matrix was imported into the program, ‘show
graph’ was selected to begin the analysis process. The visualization created helped the
researcher to gain a better understanding of the data. Further measurements are found on
the metrics tab of the program (Hansen et al., 2011).
The analysis of an actor’s network follows five principles, defined by
Haythornthwaite (1996), Burt (1992), and Nohria (1992): (1) cohesion, (2) structural
equivalence, (3) prominence, (4) range, and (5) brokerage. Social network analysts use
these principles to study the relational and positional properties of networks (Alba, 1982;
Monge & Eisenberg, 1987). The measurement techniques of these five principles are
rooted in principles of graph theory. Sets of mathematical formulae and concepts for the
study of patterns and lines compose this theory (Alba, 1982; Scott, 2013; Wasserman &
Faust 1994).
Cohesion is the presence of social relationships among actors in a network and
their likelihood of possessing equal access to information (Haythornthwaite, 1996). To
examine cohesion with respect to the objectives of this study, density and centralization
of the network was measured. Density is the ratio of the number of present, recorded
links in a network to the maximum number of potential links in a network. It expresses
Texas Tech University, Nellie Hill, December 2013
67
the general degree of linkage between all members of a network. Actors of a high-
density network are more connected to other actors of the network than are actors of a
low-density network (Haythornthwaite, 1996; Scott, 2013).
Density describes the general degree of cohesion in a network, while
centralization examines the extent to which a network is organized around a central point
(Scott, 2013). To calculate centralization, the indegrees and outdegrees of individual
actors were compared. The focus of the network is determined by defining the actors
with the highest number of degrees, or point centrality, as the center of the graph. This is
also known as nuclear centralization (Scott, 2013; Stokman, Ziegler, & Scott, 1985).
The principle of structural equivalence calls for identifying actors that hold
similar roles with the network. Structurally equivalent actors have “identical ties to and
from all other actors in the network” (Wasserman & Faust, 1994, p. 356). This principle
helps identify actors in important informational roles who shape their surrounding
network. To reach the objectives of this study, the researcher used the Girvan-Newman
algorithm built into NodeXL to conduct group clustering.
Prominence is concerned with which actors in a network have influence or power
over other actors. Certain measures of centrality assess this influence (Haythornthwaite,
1996). NodeXL calculates the Eigenvector centrality for each actor in the network. This
measure describes the importance of a node by factoring the node’s total degree and the
total degree of the nodes to which it is connected (Hansen et al., 2011).
Another measure of prominence is derived from the indegrees and outdegrees of a
node. Indegrees are denoted by dI(ni), outdegrees are denoted by dO(ni), and nodes are
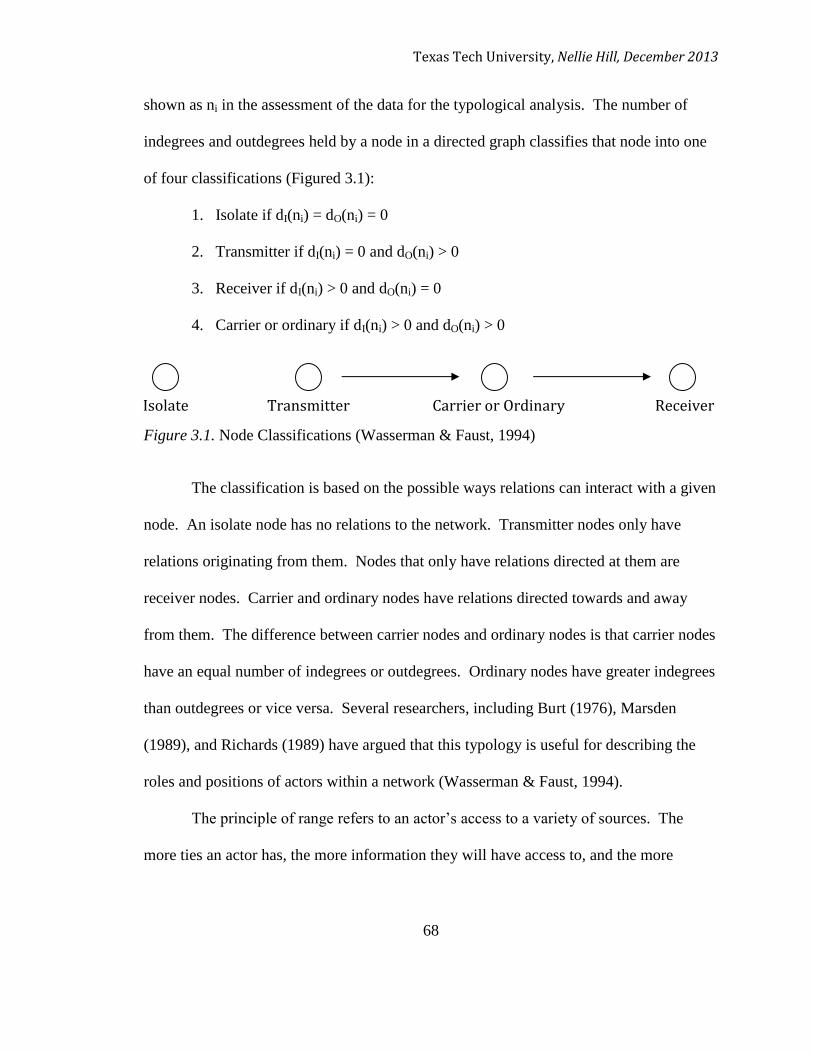
Texas Tech University, Nellie Hill, December 2013
68
shown as ni in the assessment of the data for the typological analysis. The number of
indegrees and outdegrees held by a node in a directed graph classifies that node into one
of four classifications (Figured 3.1):
1. Isolate if dI(ni) = dO(ni) = 0
2. Transmitter if dI(ni) = 0 and dO(ni) > 0
3. Receiver if dI(ni) > 0 and dO(ni) = 0
4. Carrier or ordinary if dI(ni) > 0 and dO(ni) > 0
Figure 3.1. Node Classifications (Wasserman & Faust, 1994)
The classification is based on the possible ways relations can interact with a given
node. An isolate node has no relations to the network. Transmitter nodes only have
relations originating from them. Nodes that only have relations directed at them are
receiver nodes. Carrier and ordinary nodes have relations directed towards and away
from them. The difference between carrier nodes and ordinary nodes is that carrier nodes
have an equal number of indegrees or outdegrees. Ordinary nodes have greater indegrees
than outdegrees or vice versa. Several researchers, including Burt (1976), Marsden
(1989), and Richards (1989) have argued that this typology is useful for describing the
roles and positions of actors within a network (Wasserman & Faust, 1994).
The principle of range refers to an actor’s access to a variety of sources. The
more ties an actor has, the more information they will have access to, and the more
Transmitter Carrier or Ordinary Receiver Isolate
Texas Tech University, Nellie Hill, December 2013
69
diverse the information (Haythornthwaite, 1996). The indegrees and outdegrees of an
actor will determine their range in this research.
The final principle, brokerage, examines relations that serve intermediary roles
within a network. In order to reach the objectives of the study, betweenness centrality
was calculated to measure the extent to which a node lies between various other nodes in
a network. Actors with high betweenness centrality scores play important intermediary
roles in sharing information throughout a network. In addition, they serve as important
brokers or gatekeepers with potential to influence others in the network (Scott, 2013).
Typological Analysis
QDA Miner and WordStat, members of the Provalis Research suite, were chosen
as the software to conduct the typological analysis for this study. These two text analysis
software programs were chosen so as to explore other software options beyond those
typically used in the discipline. Furthermore, these programs allow for more efficient,
coding, cleaning, and analysis due to their automated nature.
The interview transcriptions were uploaded into a new project file on QDAMiner
4.0.13 for cleaning and coding. Each transcription is called a case. Each case belongs to
a producer. Variables were added to describe each case. These included the pseudonym,
age, board member status, year the producer entered the project, who got the producer
involved in the project, number of acres the producer has in the project, type of tillage
used, irrigation system, crops planted, and if the producer raises livestock on their acres
in the project.
Texas Tech University, Nellie Hill, December 2013
70
To clean the transcriptions, all interviewer questions were removed. Then, the
lemmatization process commenced by substituting plurals with their single forms and all
past-tense verbs were replaced with the correlated present-tense versions (Provalis
Research, 2010). All hyphenations were also removed. The transcriptions were coded by
the corresponding interview instrument question. Once the codes were established and
assigned, all responses to questions pertaining to TAWC producer’s past experiences
with the project or recommendations for the future were removed as this analysis is only
concerned with the present state of the network.
In order to determine the sequence of analysis, node classifications recommended
by Wasserman and Faust (1994) were assigned to each producer by assessing their
indegrees and outdegrees. These assignments were made as part of the network analysis,
fulfilling research objective two, conducted in NodeXL. Several researchers, including
Burt (1976), Marsden (1989), and Richards (1989) have argued that this typology is
useful for describing the roles and positions of actors within a network (Wasserman &
Faust, 1994).
TAWC producers classified as ordinary nodes were then identified as the change
agent or an opinion leader. Identification was guided by Rogers’ (2003) definition and
explanation of change agents and opinion leaders within the context of the Diffusion of
Innovations framework. Rogers and Kincaid (1981) further describe opinion leadership
in the context of networks. Strongly considering knowledge and understanding of change
agents and opinion leaders, the researcher conducted a visual assessment of each cluster,
Texas Tech University, Nellie Hill, December 2013
71
produced through network analysis, to identify the TAWC producers fulfilling the
aforementioned roles.
A word frequency and phrase frequency analysis was conducted, using WordStat
6.1.13 software, on the transcripts of the producers who were classified as either the
change agent or an opinion leader. In the past, researchers have used language analyses,
such as these, to better understand connections between people (Huffaker, 2010;
McArthur & Bruza, 2003). The top words and phrases are selected by the program and
displayed with a count. All words and phrases appear in order of number of occurrences.
For this analysis, words must have been stated at least five times, phrases at least three
times. The researcher did not predetermine words of importance. The results reflect the
nature of the TAWC producer or project director’s responses to questions. The same
analysis was done on the TAWC producers who were connected to the opinion leaders in
order to fulfill the objectives of the research. From this analysis, the researcher seeks to
learn the common themes discussed by the TAWC producers and the project director.
Texas Tech University, Nellie Hill, December 2013
72
CHAPTER IV
RESULTS
Overview
The results of this research are organized by the attribute, network, and
typological analyses conducted to reach the objectives of this study. The order of
analyses is important as each analysis helped the researcher better formulate and
understand the results of the next analyses.
The purpose of this research was to describe the TAWC producers and analyze
their interpersonal network in terms of attributes, ideations, and relationships with others
as it relates to sharing farming and water management information.
The following research objectives were used to guide this study:
1. Describe TAWC producers in terms of age, years in the project, acres in the
project, board member status, who initiated their involvement in the project,
type of irrigation used on their acres in the project, crops grown on their acres
in the project, and if livestock are raised on their acres in the project
2. Describe the interpersonal connections of the producers in the TAWC in terms
of relations
3. Describe the interpersonal connections of the producers in the TAWC in terms
of typology
Research Objective One
Research objective one sought to describe TAWC producers in terms of age,
years in the project, acres in the project, board member status, who initiated their
Texas Tech University, Nellie Hill, December 2013
73
involvement in the project, type of irrigation used on their acres in the project, crops
grown on their acres in the project, and if livestock are raised on their acres in the project.
The transcripts from 15 TAWC producer interviews and information voluntarily
shared and collected by the annual TAWC report (Texas Alliance for Water
Conservation, 2013b) were used to acquire the attribute data necessary to reach objective
one. Therefore, most attribute data was able to be collected for all TAWC producers,
while other data, including age and project involvement initiation, could not be collected
for all TAWC producers as three declined to be interviewed.
TAWC producers (n = 15) ranged in age by 36 years, from a minimum of 35 to a
maximum of 71; the mean was 53 (SD = 10.04). The ages of three TAWC producers
were not reported because they were not interviewed. Most TAWC producers (n = 14,
77%) have been involved since the establishment of the project I 2005, compared to
newer members of the TAWC who have been involved with the project between two and
four years (n = 4, 22%). Some TAWC producers are members of the TAWC
Demonstration Producer Board (n = 7, 39%). The TAWC Producer Board consists of 10
members, seven of which were 2012 TAWC producers. When asked who got the
producer involved with the TAWC, 58% (n = 11) reported TAWC project director, Rick
Kellison. Other names reported were Jeff Pate, Extension Economist – Risk
Management with the Texas A&M AgriLife Extension Service, (n = 2, 11%), Glenn
Schur, a TAWC Demonstration Producer Board member, (n = 1, 5%), and informational
meetings (n = 1, 5%).
Texas Tech University, Nellie Hill, December 2013
74
The range of acres a TAWC producer had in the project was 383 acres, with a
minimum of 70 and a maximum of 453; the mean was 197.33 (SD = 109.66). A majority
of TAWC producers (n = 15, 80%) do not raise livestock on their acres in the TAWC.
Three TAWC producers (18%) use their acres in the project for raising livestock.
Producers annually report the types of irrigation they use on their acres in the
TAWC. They can report more than one type of irrigation being used on some or all of
their acres in the project. More than half of the TAWC producers strictly use pivot
irrigation (n = 10, 55%). TAWC producers also use a combination of pivot and
subsurface drip irrigation (n = 5, 28%). Individual producers have also chosen to use
dryland or no irrigation (n = 1, 5%), furrow irrigation (n = 1, 5%), or dryland, pivot, or
subsurface drip irrigation (n = 1, 5%).
In 2012, producers planted a variety of crops on their acres in the TAWC project.
Crops grown were various grasses, corn, cotton, oats, sideoats, sorghum, sunflowers, and
wheat. One producer’s acres were left to fallow. The most common crop to plant on
TAWC acres was cotton, as 12 of the 18 respondents reported (67%). The majority of
producers (n = 10, 56%) grew two or more crops. Some producers chose to grow just one
crop (n = 8, 45%). Table 4.1 summarizes the attribute data gathered for each TAWC
producer.
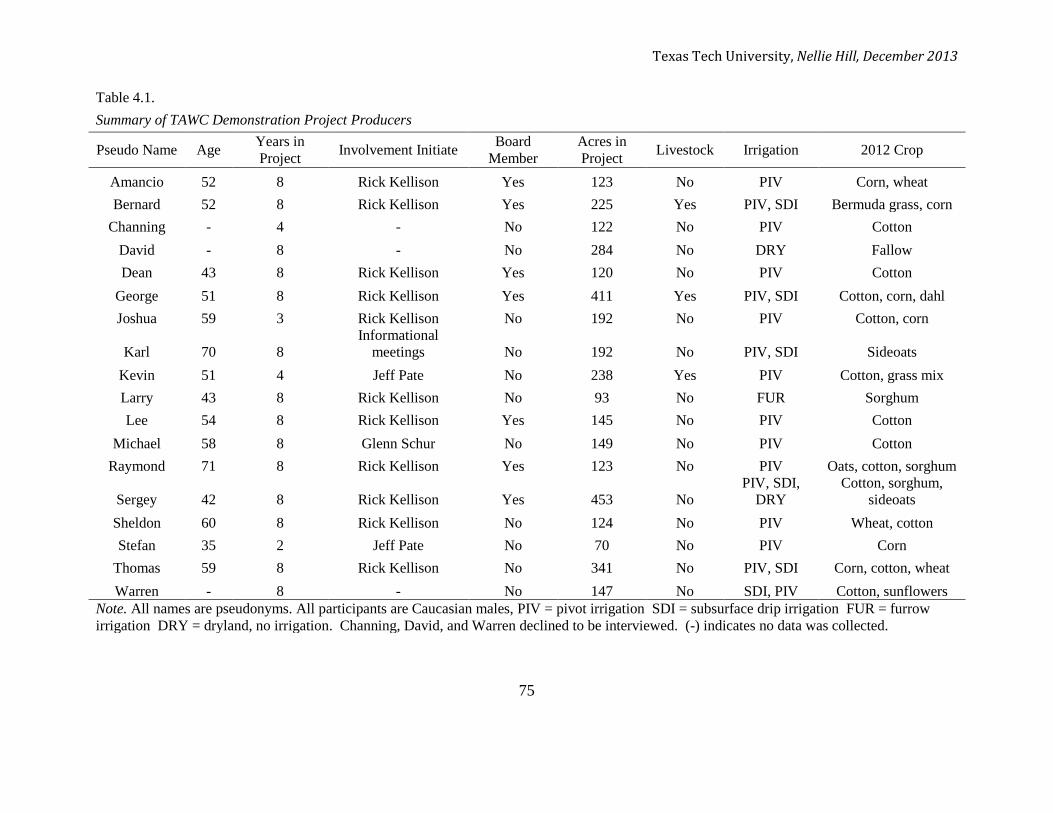
Texas Tech University, Nellie Hill, December 2013
75
Table 4.1.
Summary of TAWC Demonstration Project Producers
Pseudo Name Age Years in
Project Involvement Initiate
Board
Member
Acres in
Project Livestock Irrigation 2012 Crop
Amancio 52 8 Rick Kellison Yes 123 No PIV Corn, wheat
Bernard 52 8 Rick Kellison Yes 225 Yes PIV, SDI Bermuda grass, corn
Channing - 4 - No 122 No PIV Cotton
David - 8 - No 284 No DRY Fallow
Dean 43 8 Rick Kellison Yes 120 No PIV Cotton
George 51 8 Rick Kellison Yes 411 Yes PIV, SDI Cotton, corn, dahl
Joshua 59 3 Rick Kellison No 192 No PIV Cotton, corn
Karl 70 8
Informational
meetings No 192 No PIV, SDI Sideoats
Kevin 51 4 Jeff Pate No 238 Yes PIV Cotton, grass mix
Larry 43 8 Rick Kellison No 93 No FUR Sorghum
Lee 54 8 Rick Kellison Yes 145 No PIV Cotton
Michael 58 8 Glenn Schur No 149 No PIV Cotton
Raymond 71 8 Rick Kellison Yes 123 No PIV Oats, cotton, sorghum
Sergey 42 8 Rick Kellison Yes 453 No
PIV, SDI,
DRY
Cotton, sorghum,
sideoats
Sheldon 60 8 Rick Kellison No 124 No PIV Wheat, cotton
Stefan 35 2 Jeff Pate No 70 No PIV Corn
Thomas 59 8 Rick Kellison No 341 No PIV, SDI Corn, cotton, wheat
Warren - 8 - No 147 No SDI, PIV Cotton, sunflowers
Note. All names are pseudonyms. All participants are Caucasian males, PIV = pivot irrigation SDI = subsurface drip irrigation FUR = furrow
irrigation DRY = dryland, no irrigation. Channing, David, and Warren declined to be interviewed. (-) indicates no data was collected.
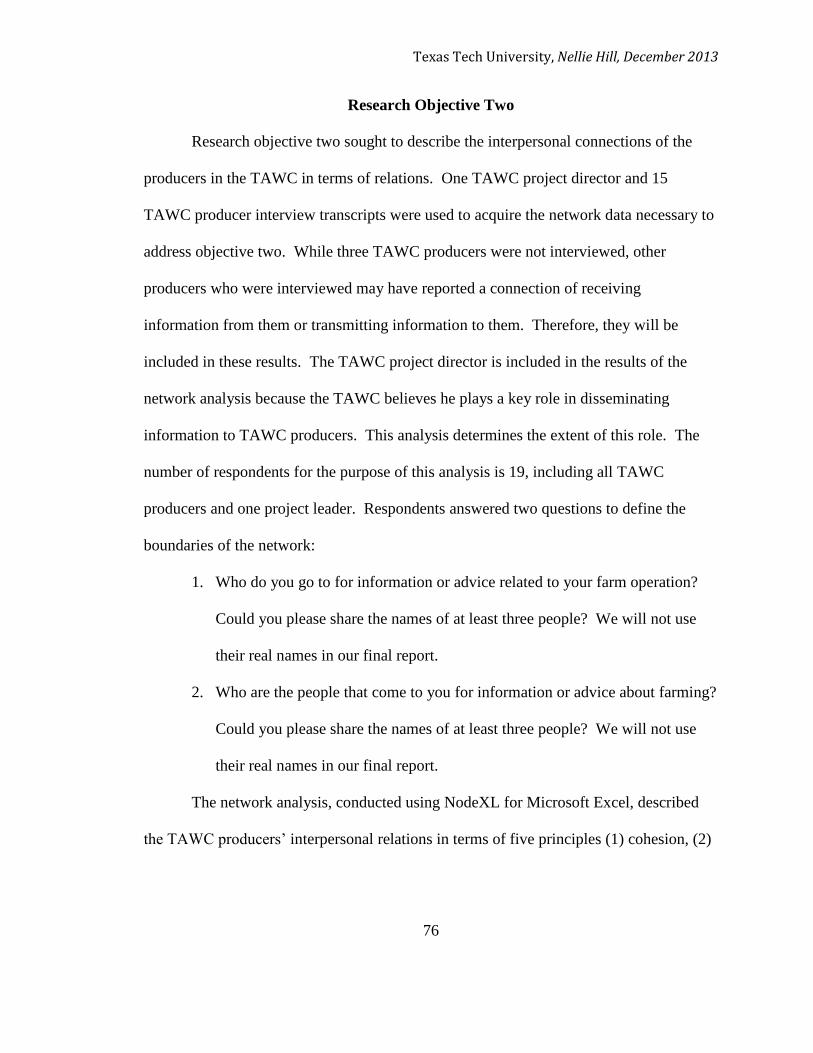
Texas Tech University, Nellie Hill, December 2013
76
Research Objective Two
Research objective two sought to describe the interpersonal connections of the
producers in the TAWC in terms of relations. One TAWC project director and 15
TAWC producer interview transcripts were used to acquire the network data necessary to
address objective two. While three TAWC producers were not interviewed, other
producers who were interviewed may have reported a connection of receiving
information from them or transmitting information to them. Therefore, they will be
included in these results. The TAWC project director is included in the results of the
network analysis because the TAWC believes he plays a key role in disseminating
information to TAWC producers. This analysis determines the extent of this role. The
number of respondents for the purpose of this analysis is 19, including all TAWC
producers and one project leader. Respondents answered two questions to define the
boundaries of the network:
1. Who do you go to for information or advice related to your farm operation?
Could you please share the names of at least three people? We will not use
their real names in our final report.
2. Who are the people that come to you for information or advice about farming?
Could you please share the names of at least three people? We will not use
their real names in our final report.
The network analysis, conducted using NodeXL for Microsoft Excel, described
the TAWC producers’ interpersonal relations in terms of five principles (1) cohesion, (2)
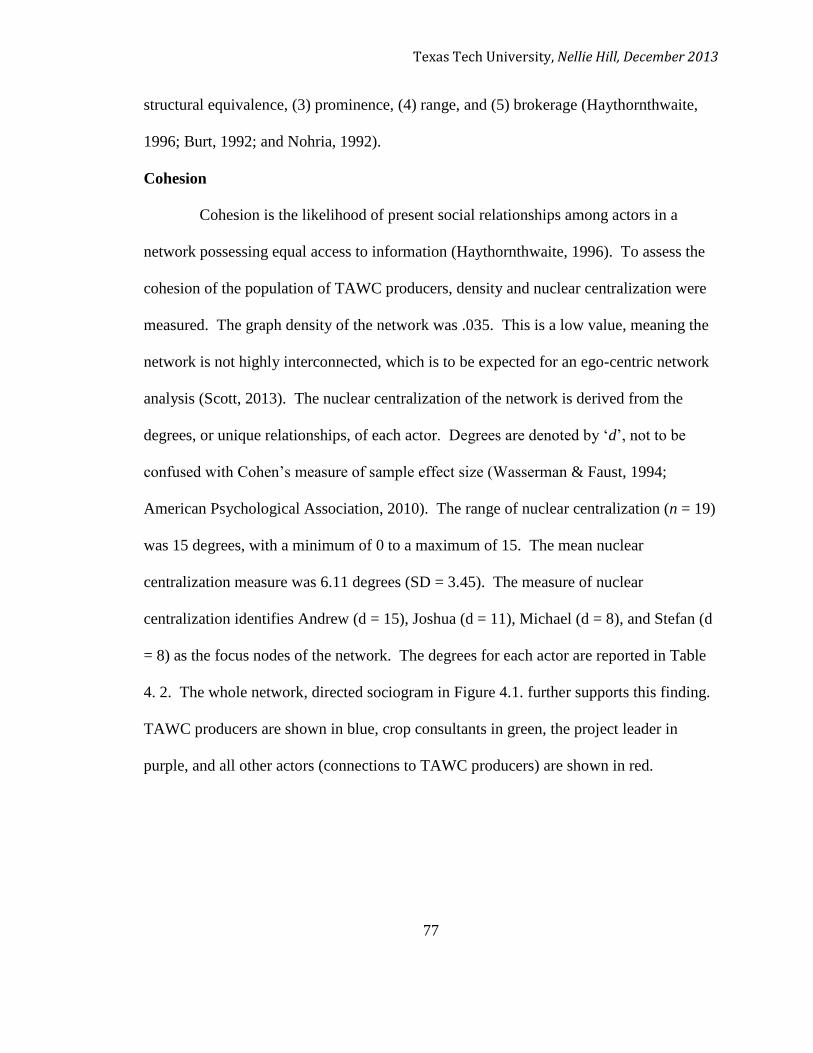
Texas Tech University, Nellie Hill, December 2013
77
structural equivalence, (3) prominence, (4) range, and (5) brokerage (Haythornthwaite,
1996; Burt, 1992; and Nohria, 1992).
Cohesion
Cohesion is the likelihood of present social relationships among actors in a
network possessing equal access to information (Haythornthwaite, 1996). To assess the
cohesion of the population of TAWC producers, density and nuclear centralization were
measured. The graph density of the network was .035. This is a low value, meaning the
network is not highly interconnected, which is to be expected for an ego-centric network
analysis (Scott, 2013). The nuclear centralization of the network is derived from the
degrees, or unique relationships, of each actor. Degrees are denoted by ‘d’, not to be
confused with Cohen’s measure of sample effect size (Wasserman & Faust, 1994;
American Psychological Association, 2010). The range of nuclear centralization (n = 19)
was 15 degrees, with a minimum of 0 to a maximum of 15. The mean nuclear
centralization measure was 6.11 degrees (SD = 3.45). The measure of nuclear
centralization identifies Andrew (d = 15), Joshua (d = 11), Michael (d = 8), and Stefan (d
= 8) as the focus nodes of the network. The degrees for each actor are reported in Table
4. 2. The whole network, directed sociogram in Figure 4.1. further supports this finding.
TAWC producers are shown in blue, crop consultants in green, the project leader in
purple, and all other actors (connections to TAWC producers) are shown in red.
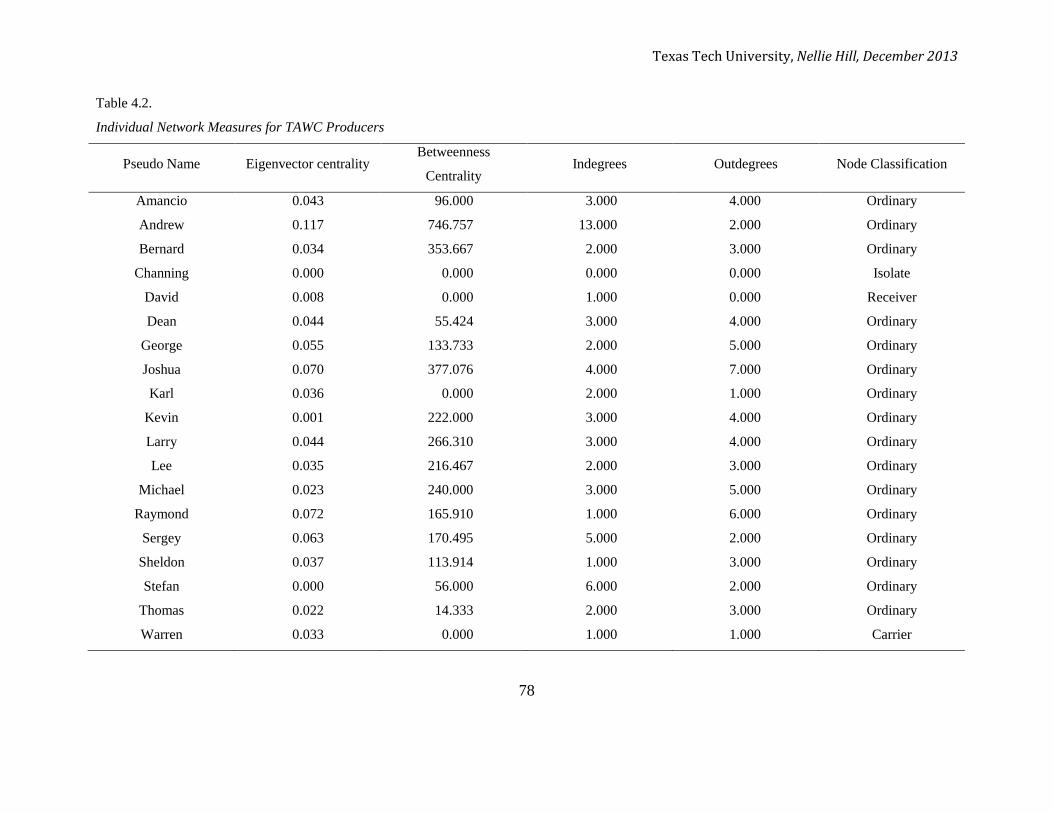
Texas Tech University, Nellie Hill, December 2013
78
Table 4.2.
Individual Network Measures for TAWC Producers
Pseudo Name Eigenvector centrality Betweenness
Centrality Indegrees Outdegrees Node Classification
Amancio 0.043 96.000 3.000 4.000 Ordinary
Andrew 0.117 746.757 13.000 2.000 Ordinary
Bernard 0.034 353.667 2.000 3.000 Ordinary
Channing 0.000 0.000 0.000 0.000 Isolate
David 0.008 0.000 1.000 0.000 Receiver
Dean 0.044 55.424 3.000 4.000 Ordinary
George 0.055 133.733 2.000 5.000 Ordinary
Joshua 0.070 377.076 4.000 7.000 Ordinary
Karl 0.036 0.000 2.000 1.000 Ordinary
Kevin 0.001 222.000 3.000 4.000 Ordinary
Larry 0.044 266.310 3.000 4.000 Ordinary
Lee 0.035 216.467 2.000 3.000 Ordinary
Michael 0.023 240.000 3.000 5.000 Ordinary
Raymond 0.072 165.910 1.000 6.000 Ordinary
Sergey 0.063 170.495 5.000 2.000 Ordinary
Sheldon 0.037 113.914 1.000 3.000 Ordinary
Stefan 0.000 56.000 6.000 2.000 Ordinary
Thomas 0.022 14.333 2.000 3.000 Ordinary
Warren 0.033 0.000 1.000 1.000 Carrier
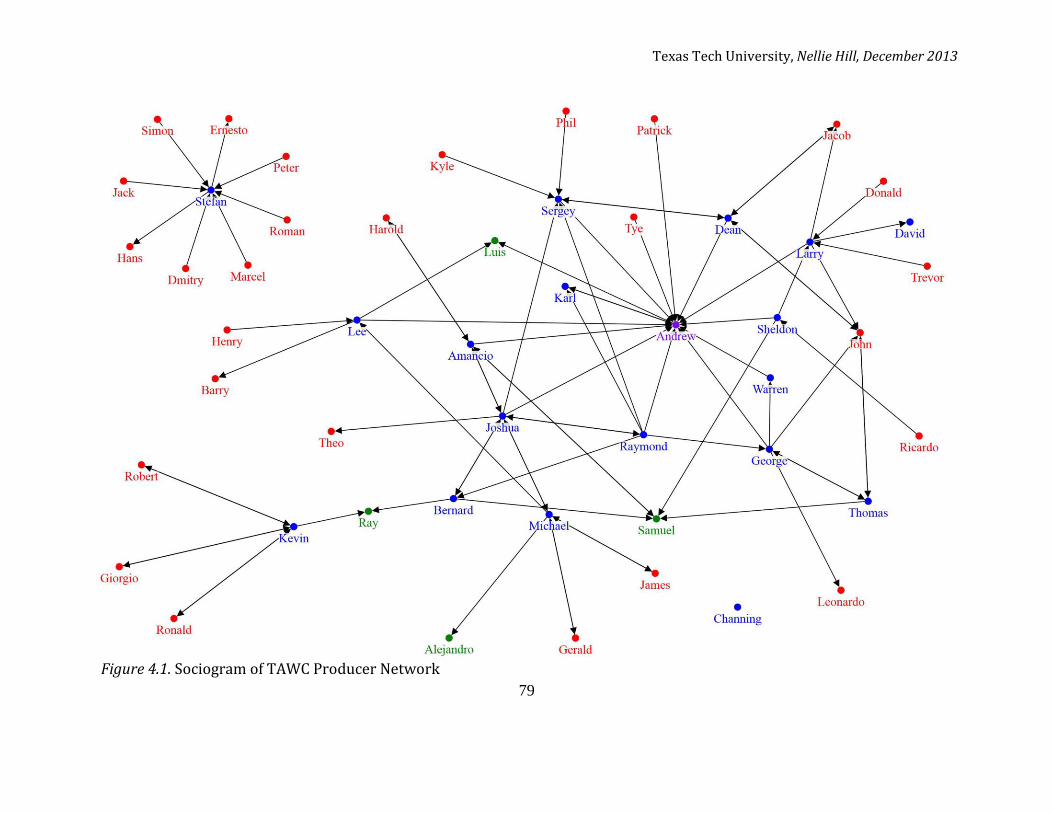
Texas Tech University, Nellie Hill, December 2013
79
Figure 4.1. Sociogram of TAWC Producer Network
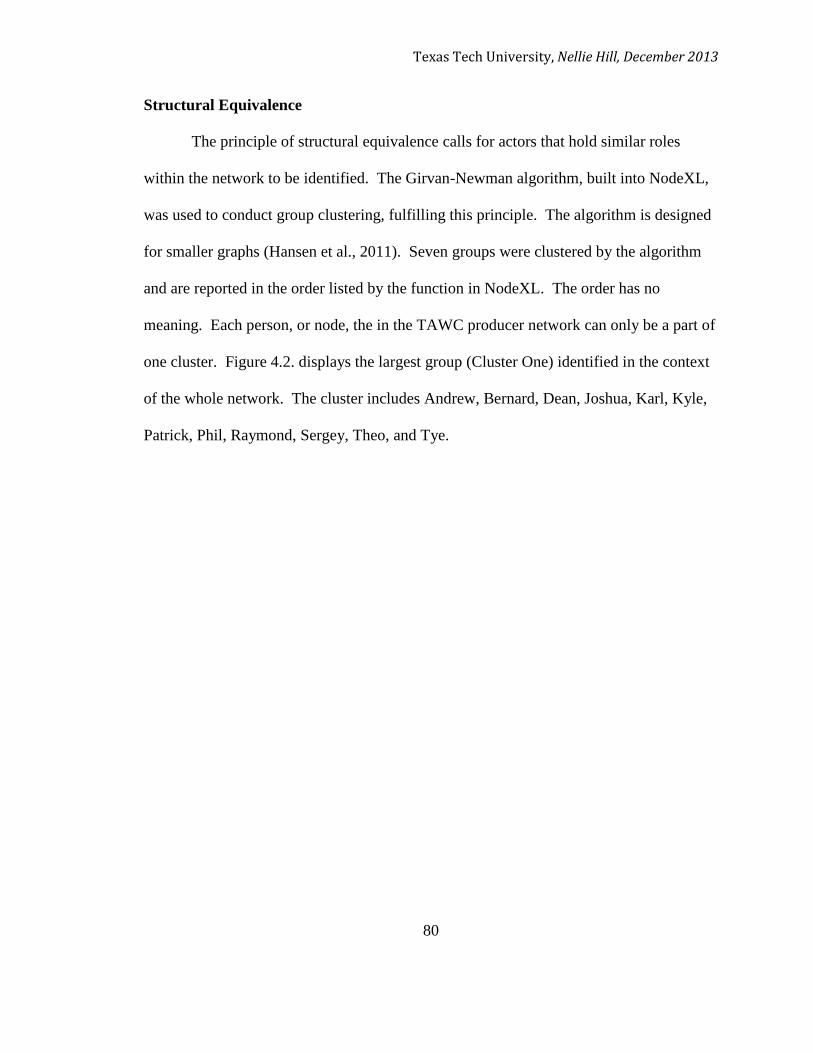
Texas Tech University, Nellie Hill, December 2013
80
Structural Equivalence
The principle of structural equivalence calls for actors that hold similar roles
within the network to be identified. The Girvan-Newman algorithm, built into NodeXL,
was used to conduct group clustering, fulfilling this principle. The algorithm is designed
for smaller graphs (Hansen et al., 2011). Seven groups were clustered by the algorithm
and are reported in the order listed by the function in NodeXL. The order has no
meaning. Each person, or node, the in the TAWC producer network can only be a part of
one cluster. Figure 4.2. displays the largest group (Cluster One) identified in the context
of the whole network. The cluster includes Andrew, Bernard, Dean, Joshua, Karl, Kyle,
Patrick, Phil, Raymond, Sergey, Theo, and Tye.

Texas Tech University, Nellie Hill, December 2013
81
Figure 4.2. Cluster One within TAWC producer network
Figure 4.2. Cluster One of TAWC Producer Network
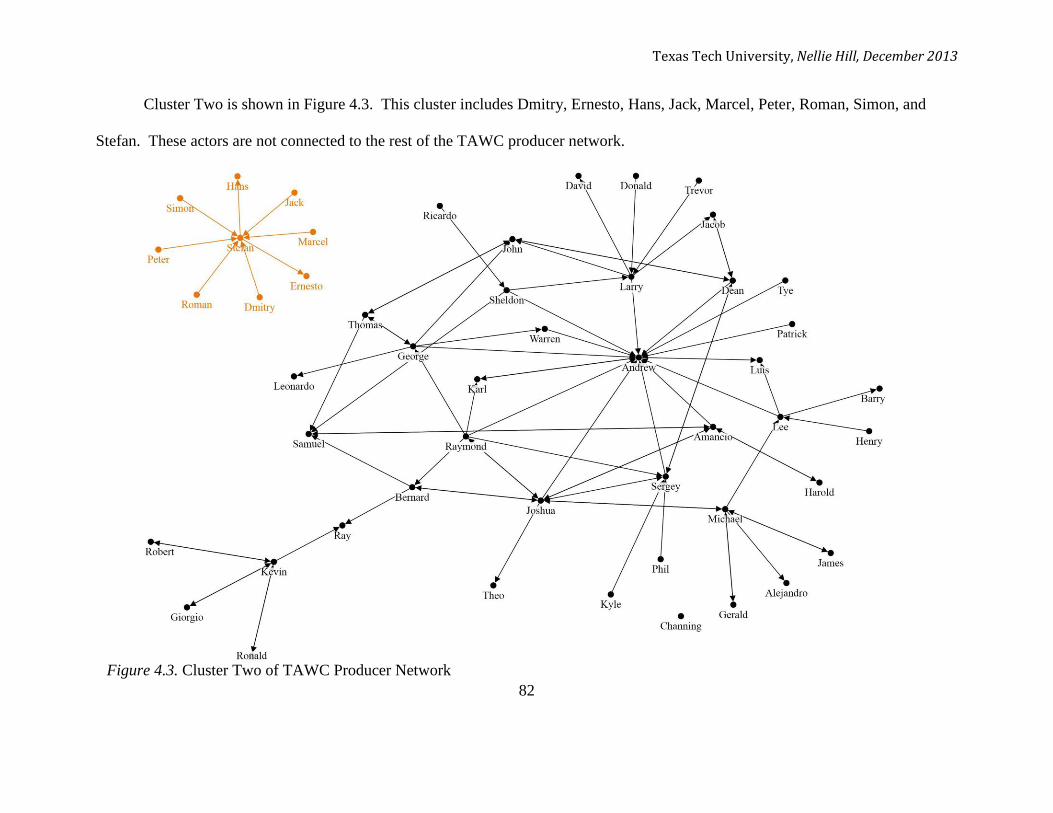
Texas Tech University, Nellie Hill, December 2013
82
Cluster Two is shown in Figure 4.3. This cluster includes Dmitry, Ernesto, Hans, Jack, Marcel, Peter, Roman, Simon, and
Stefan. These actors are not connected to the rest of the TAWC producer network.
Figure 4.3. Cluster Two of TAWC Producer Network
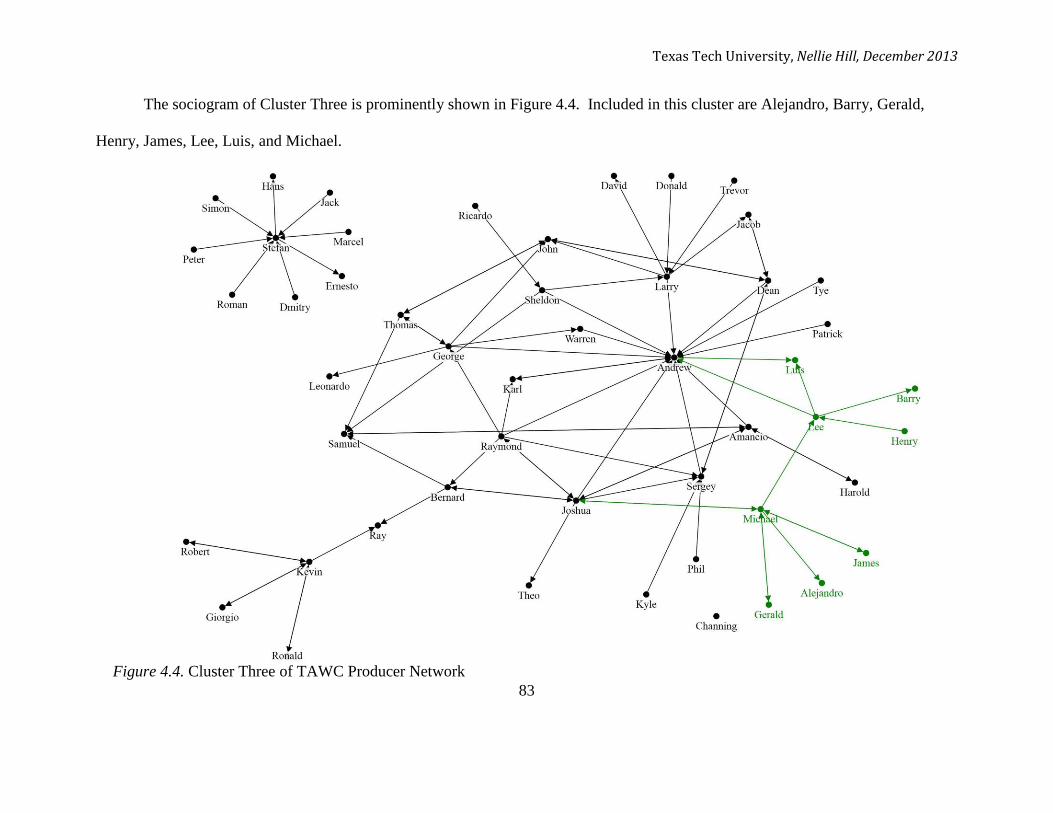
Texas Tech University, Nellie Hill, December 2013
83
The sociogram of Cluster Three is prominently shown in Figure 4.4. Included in this cluster are Alejandro, Barry, Gerald,
Henry, James, Lee, Luis, and Michael.
Figure 4.3. Cluster Two within TAWC producer network
Figure 4.4. Cluster Three of TAWC Producer Network
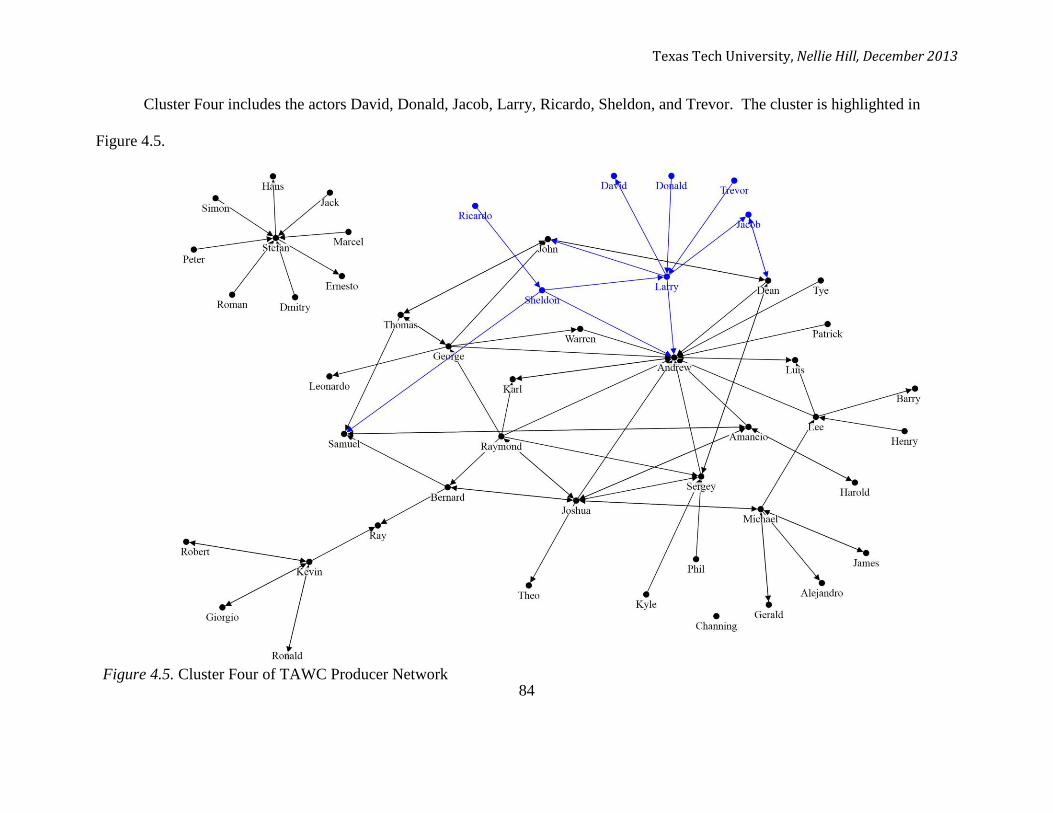
Texas Tech University, Nellie Hill, December 2013
84
Cluster Four includes the actors David, Donald, Jacob, Larry, Ricardo, Sheldon, and Trevor. The cluster is highlighted in
Figure 4.5.
Figure 4.5. Cluster Four of TAWC Producer Network
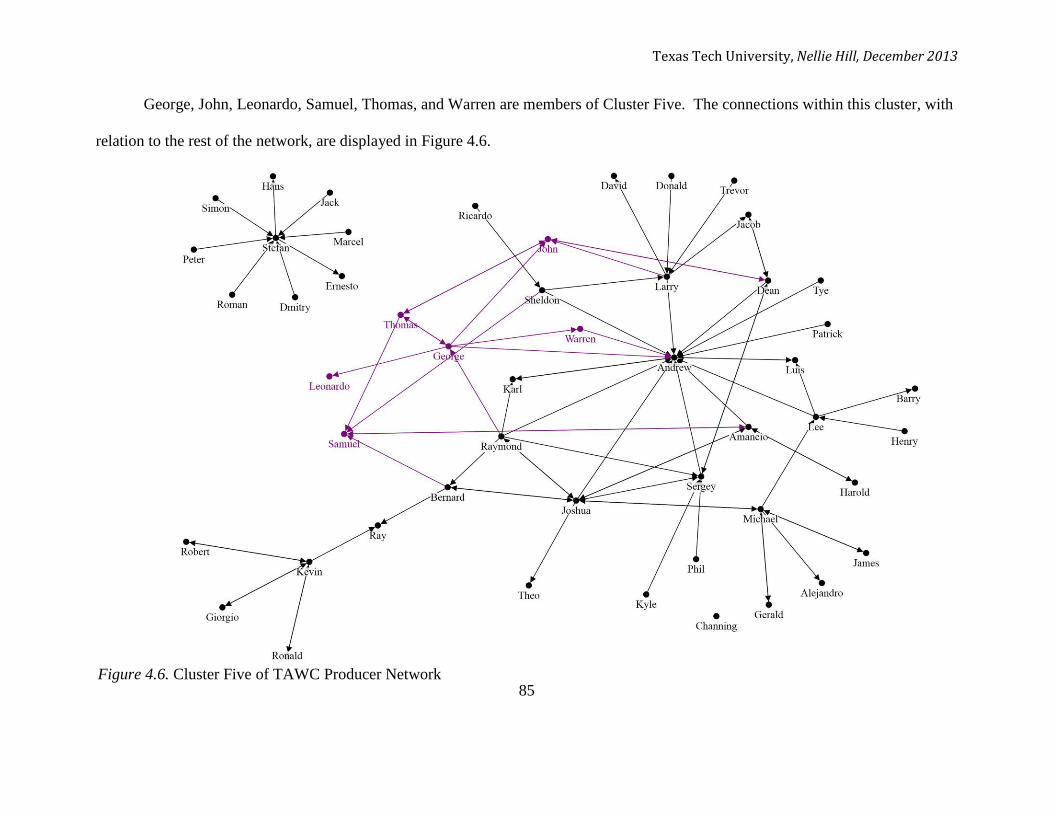
Texas Tech University, Nellie Hill, December 2013
85
George, John, Leonardo, Samuel, Thomas, and Warren are members of Cluster Five. The connections within this cluster, with
relation to the rest of the network, are displayed in Figure 4.6.
Figure 4.6. Cluster Five of TAWC Producer Network
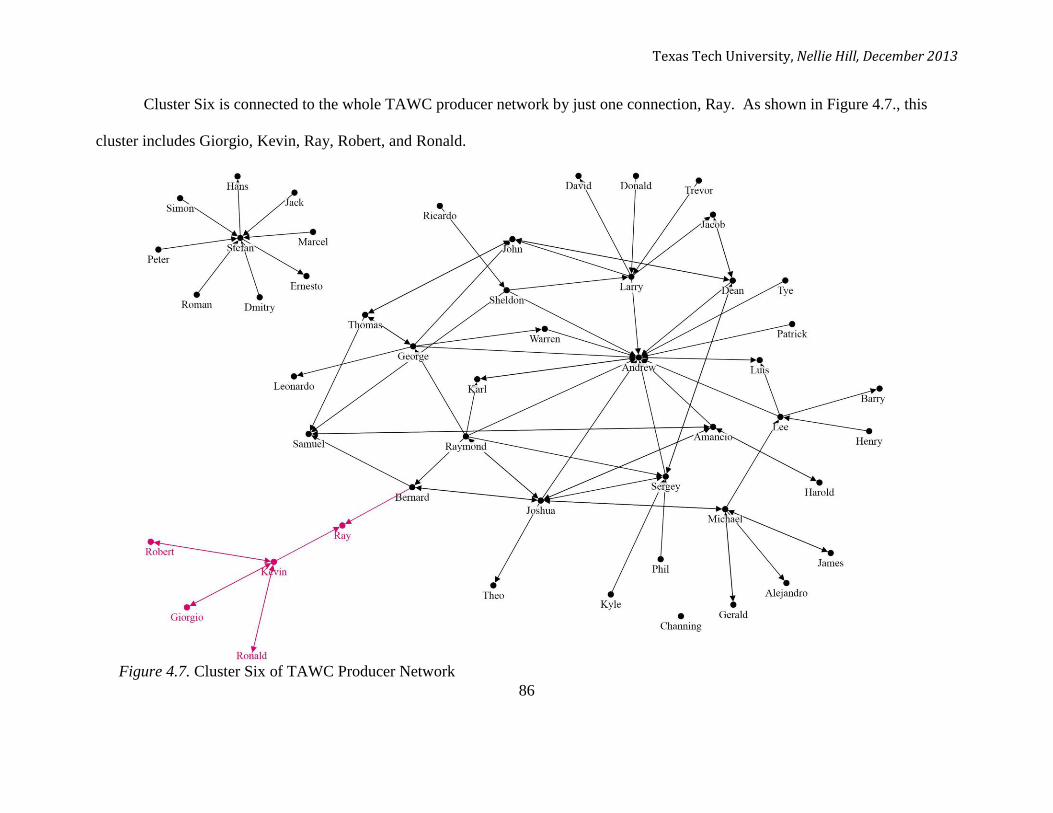
Texas Tech University, Nellie Hill, December 2013
86
Cluster Six is connected to the whole TAWC producer network by just one connection, Ray. As shown in Figure 4.7., this
cluster includes Giorgio, Kevin, Ray, Robert, and Ronald.
Figure 4.7. Cluster Six of TAWC Producer Network
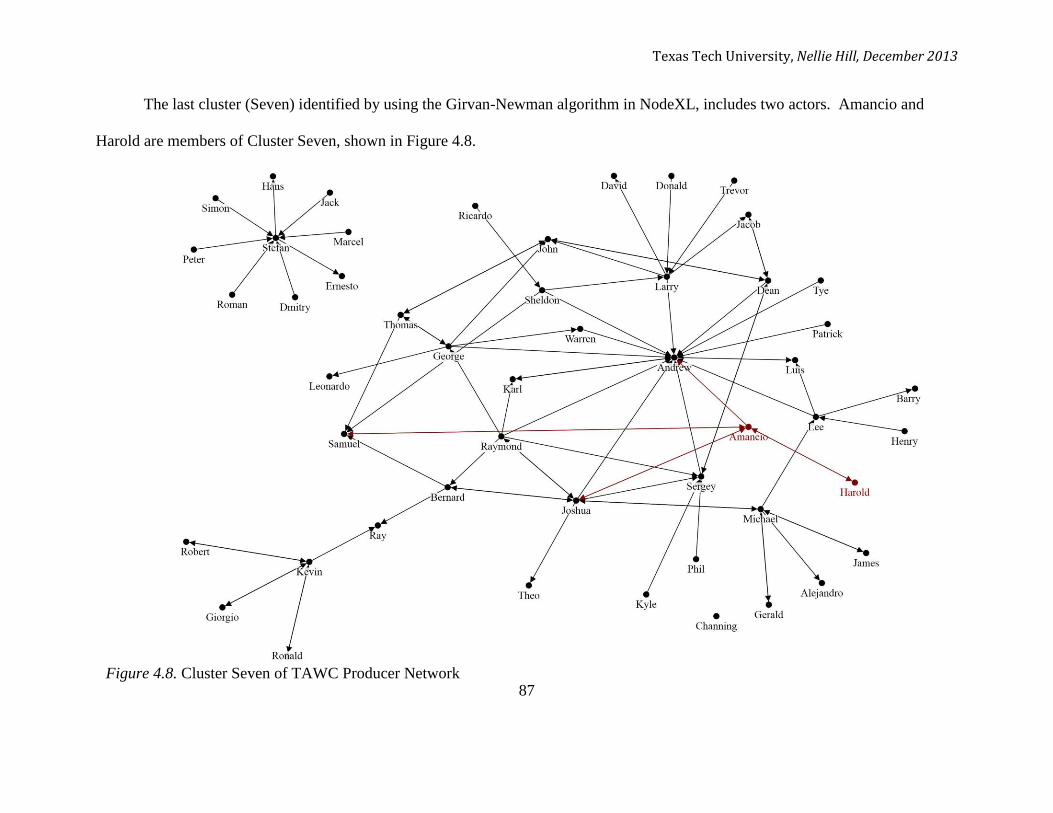
Texas Tech University, Nellie Hill, December 2013
87
The last cluster (Seven) identified by using the Girvan-Newman algorithm in NodeXL, includes two actors. Amancio and
Harold are members of Cluster Seven, shown in Figure 4.8.
Figure 4.8. Cluster Seven of TAWC Producer Network
Texas Tech University, Nellie Hill, December 2013
88
Prominence
To find the actors in a network who have influence or power over other actors,
satisfying the principle of prominence, Eigenvector centrality (CE) was measured and
node classification, according to the system established by Wasserman and Faust (1994),
was conducted. TAWC producers and the project leader (n = 18) range in Eigenvector
centrality by 0.117, with a minimum of 0 to a maximum of 0.117; mean value was 0.041
(SD = 0.028). No relationships, indegrees or outdegrees, were reported for one producer,
so their Eigenvector centrality was not calculated. Andrew (CE=0.117), Raymond (CE =
0.072), Joshua (CE = 0.070), and Sergey (CE = 0.063) are the most important, or
prominent, actors in the network based on individual Eigenvector centrality values.
Table 4.2. displays the node classifications of the TAWC producers. The TAWC
producers are dominantly classified as ordinary nodes (n = 16, 84%). One producer,
Channing, is classified as an isolate. David is the only producer classified as a receiver.
The only producer classified as a carrier is Warren. The most prominent ordinaries,
based on each actor’s total degrees, are Andrew (d = 15), Joshua (d = 11), Michael (d =
8), and Stefan (d = 8).
Range
An actor’s access to a variety of sources, or other actors, determines his range.
The indegrees and outdegrees of each actor are displayed in Table 4.2. These measures
satisfy the principle of range. The range of degrees for TAWC producers (n = 19) was
15, with a minimum of 0 to a maximum of 15. The mean number of degrees was 6.11
Texas Tech University, Nellie Hill, December 2013
89
(SD = 3.45). Andrew (d = 15), Joshua (d = 11), Michael (d = 8), and Stefan (d = 8) have
the most overall range in the network.
The maximum number of indegrees of the TAWC producers (n = 19) was 13.
The minimum number of indegrees was 0, establishing a range of 13 degrees with a mean
of 3 (SD = 2.83). The actors with the most indegrees, or other actors using them as a
resource, are Andrew (dI = 13), Stefan (dI = 6), Sergey (dI = 5), and Joshua (dI = 4).
The number of outdegrees reported by TAWC producers (n = 19) ranges by 7,
from a maximum of 7 to a minimum of 0. The mean is 3.11 outdegrees (SD = 1.92). The
actors with the most outdegrees, or who used the greatest number of other actors as
resources, are Joshua (dO = 7), Raymond (dO = 6), Michael (dO = 5), and George (dO = 5).
Brokerage
The principle of brokerage seeks to identify relations that serve intermediary roles
within a network. In order to establish brokerage, betweenness centrality (CB) was
calculated for each actor. The results are displayed in Table 4.2. The range of
betweenness centrality for TAWC producers (n = 15) was 732.43, with a minimum of
14.33 to a maximum of 746.76. The mean betweenness centrality was 215.21 (SD =
180.86). Betweenness centrality was not calculated for four producers because the
relationships reported did not put them in any intermediary roles. The actors who play
the greatest intermediary roles in the network are Andrew (CB = 746.76), Joshua (CB =
377.08), and Bernard (CB = 353.67).
Texas Tech University, Nellie Hill, December 2013
90
Research Objective Three
Research objective three sought to describe the interpersonal connections of the
TAWC producers in terms of typology. One TAWC project director and fifteen TAWC
producer interview transcripts were cleaned and analyzed to acquire the typological data
necessary to reach objective three. Three TAWC producers declined to be interviewed.
Andrew, the project director, is held in an important role in the TAWC to disseminate
information to the TAWC producers, therefore he is included in this analysis.
To begin the typological analysis, TAWC producers, previously classified as
ordinary nodes, were identified as a change agent or opinion leader based on the
explanations of Rogers (2003) and Rogers and Kincaid (1981) as well as a visual
assessment by the researcher of the seven cluster sociograms created in pursuit of
research objective two. The change agent is Andrew, the TAWC project director. All of
the opinion leaders are TAWC producers.
Table 4.3 displays the word and phrase frequencies of the Cluster One change
agent, Andrew, opinion leader, Sergey, and five TAWC producers connected to Sergey.
Those producers are Bernard, Dean, Joshua, Karl, and Raymond. The theme of water
carries through from the change agent to the opinion leader and on to the TAWC
producer connections in words and phrases. While not all parties specifically use the
word “water”, the opinion leader mentions “drip” which refers to a type of irrigation.
The TAWC producer connections use water, LEPA, pivot, and probe frequently. In
addition, the change agent frequently states the phrase “amount of water”. The TAWC
producer connections use “drip system,” “gypsum blocks,” and “water usage” frequently.
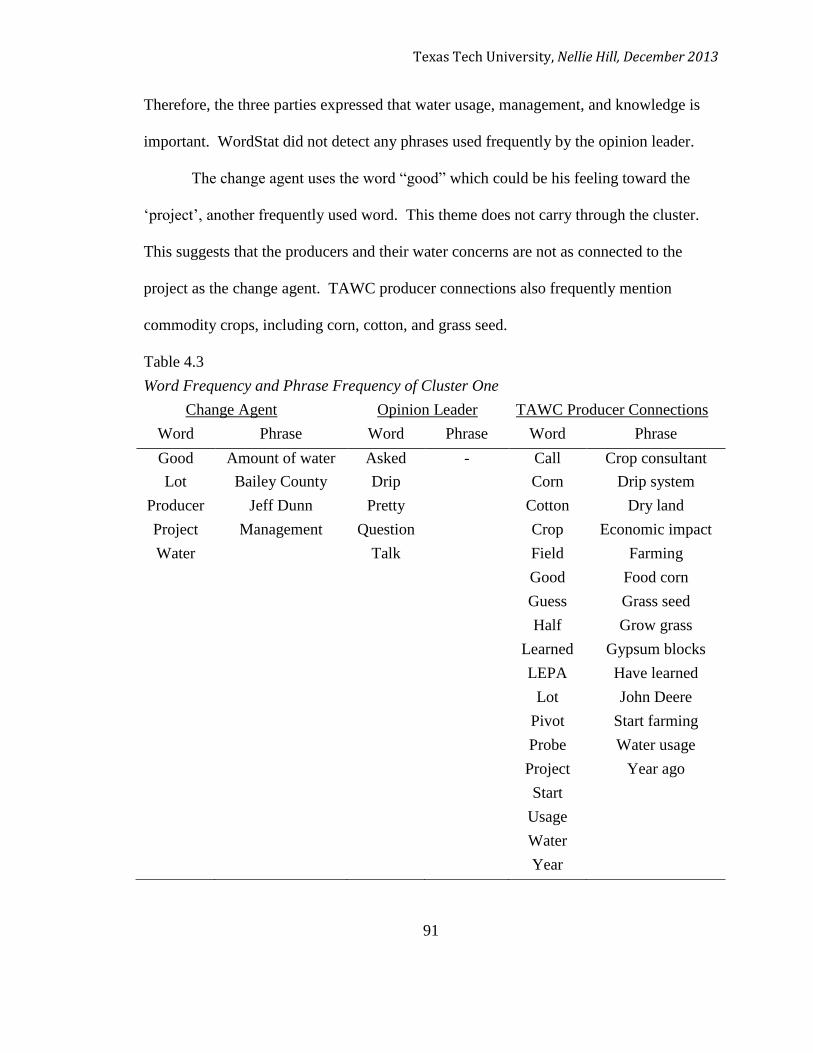
Texas Tech University, Nellie Hill, December 2013
91
Therefore, the three parties expressed that water usage, management, and knowledge is
important. WordStat did not detect any phrases used frequently by the opinion leader.
The change agent uses the word “good” which could be his feeling toward the
‘project’, another frequently used word. This theme does not carry through the cluster.
This suggests that the producers and their water concerns are not as connected to the
project as the change agent. TAWC producer connections also frequently mention
commodity crops, including corn, cotton, and grass seed.
Table 4.3
Word Frequency and Phrase Frequency of Cluster One
Change Agent Opinion Leader TAWC Producer Connections
Word Phrase Word Phrase Word Phrase
Good Amount of water Asked - Call Crop consultant
Lot Bailey County Drip Corn Drip system
Producer Jeff Dunn Pretty Cotton Dry land
Project Management
team
Question
s
Crop Economic impact
Water Talk Field Farming
techniquesGood Food corn
Guess Grass seed
Half Grow grass
Learned Gypsum blocks
LEPA Have learned
Lot John Deere
Pivot Start farming
Probe Water usage
Project Year ago
Start
Usage
Water
Year
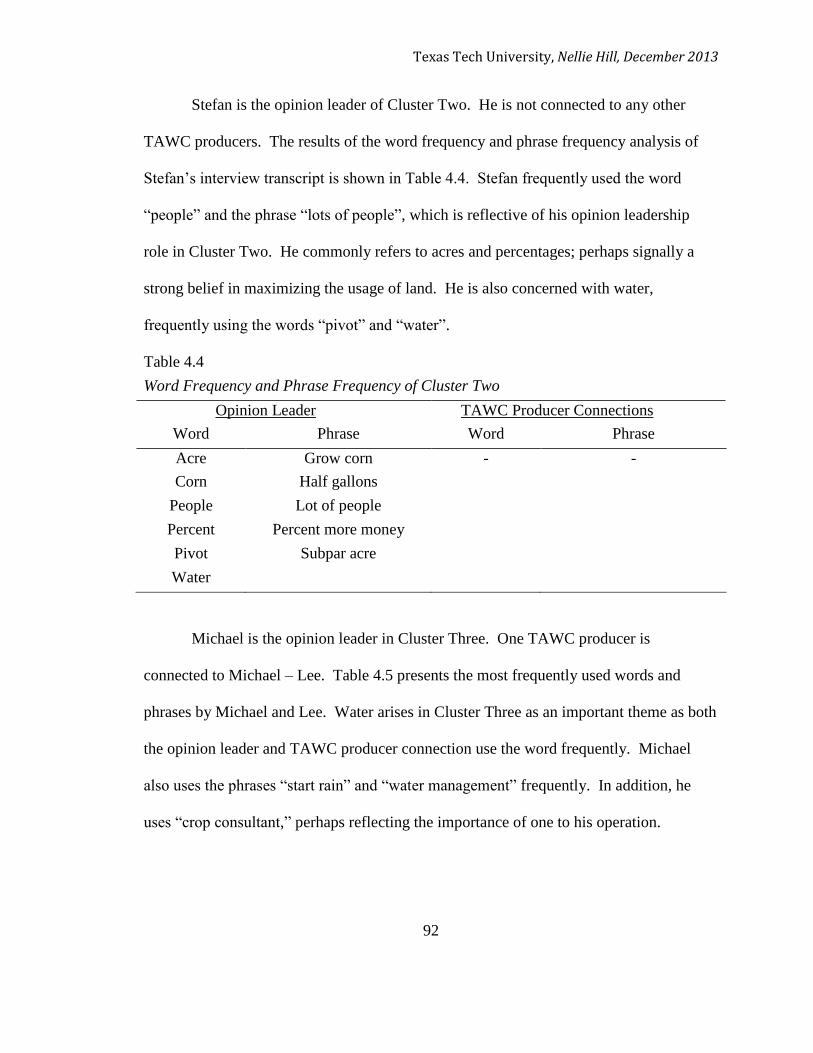
Texas Tech University, Nellie Hill, December 2013
92
Stefan is the opinion leader of Cluster Two. He is not connected to any other
TAWC producers. The results of the word frequency and phrase frequency analysis of
Stefan’s interview transcript is shown in Table 4.4. Stefan frequently used the word
“people” and the phrase “lots of people”, which is reflective of his opinion leadership
role in Cluster Two. He commonly refers to acres and percentages; perhaps signally a
strong belief in maximizing the usage of land. He is also concerned with water,
frequently using the words “pivot” and “water”.
Table 4.4
Word Frequency and Phrase Frequency of Cluster Two
Opinion Leader TAWC Producer Connections
Word Phrase Word Phrase
Acre Grow corn - -
Corn Half gallons
People Lot of people
Percent Percent more money
Pivot Subpar acre
Water
Michael is the opinion leader in Cluster Three. One TAWC producer is
connected to Michael – Lee. Table 4.5 presents the most frequently used words and
phrases by Michael and Lee. Water arises in Cluster Three as an important theme as both
the opinion leader and TAWC producer connection use the word frequently. Michael
also uses the phrases “start rain” and “water management” frequently. In addition, he
uses “crop consultant,” perhaps reflecting the importance of one to his operation.

Texas Tech University, Nellie Hill, December 2013
93
Table 4.5
Word Frequency and Phrase Frequency of Cluster Three
Opinion Leader TAWC Producer Connection
Word Phrase Word Phrase
Buy Crop consultant Feel Real good
Call Start rain Kind
Farmers Water management Water
Guy
Information
Lot
People
Talk
Water
Year
Cluster Four includes Larry, the opinion leader, and the TAWC producers
connected to Larry – Sheldon and David. Table 4.6 exhibits the outcomes of the word
and phrase frequency analyses conducted for Larry and Sheldon. These analyses were
not executed for David because, although he is a TAWC producer, he was not
interviewed. The word frequency analysis identified water as an important theme to the
opinion leader and the TAWC producer connection. The opinion leader frequently uses
the phrases “pay attention” and “really been interested.” These phrases might suggest
Larry is producer who is interested in and curious about new farming and water
management practices and technologies. His frequent use of the word “SmartCrop”
further supports this notion as the word refers to a water management technology. The
TAWC producer connection, Sheldon, emphasizes his use of a crop consultant as
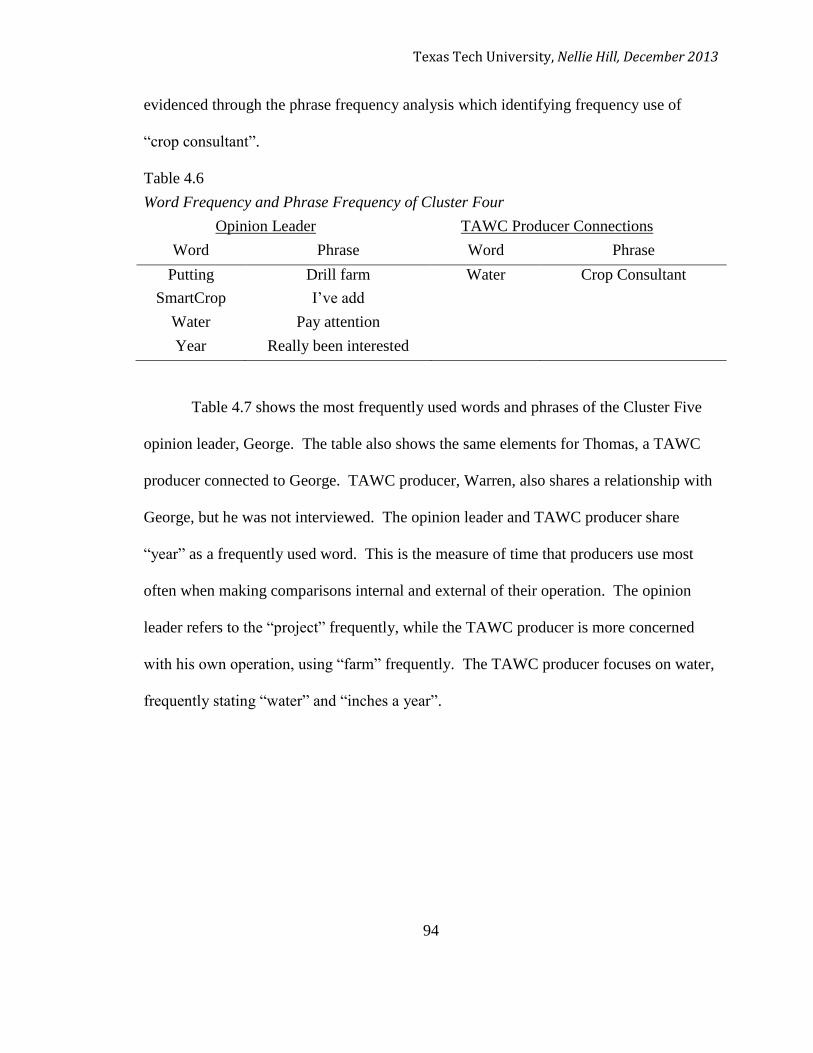
Texas Tech University, Nellie Hill, December 2013
94
evidenced through the phrase frequency analysis which identifying frequency use of
“crop consultant”.
Table 4.6
Word Frequency and Phrase Frequency of Cluster Four
Opinion Leader TAWC Producer Connections
Word Phrase Word Phrase
Putting Drill farm Water Crop Consultant
SmartCrop I’ve add
Water Pay attention
Year Really been interested
Table 4.7 shows the most frequently used words and phrases of the Cluster Five
opinion leader, George. The table also shows the same elements for Thomas, a TAWC
producer connected to George. TAWC producer, Warren, also shares a relationship with
George, but he was not interviewed. The opinion leader and TAWC producer share
“year” as a frequently used word. This is the measure of time that producers use most
often when making comparisons internal and external of their operation. The opinion
leader refers to the “project” frequently, while the TAWC producer is more concerned
with his own operation, using “farm” frequently. The TAWC producer focuses on water,
frequently stating “water” and “inches a year”.
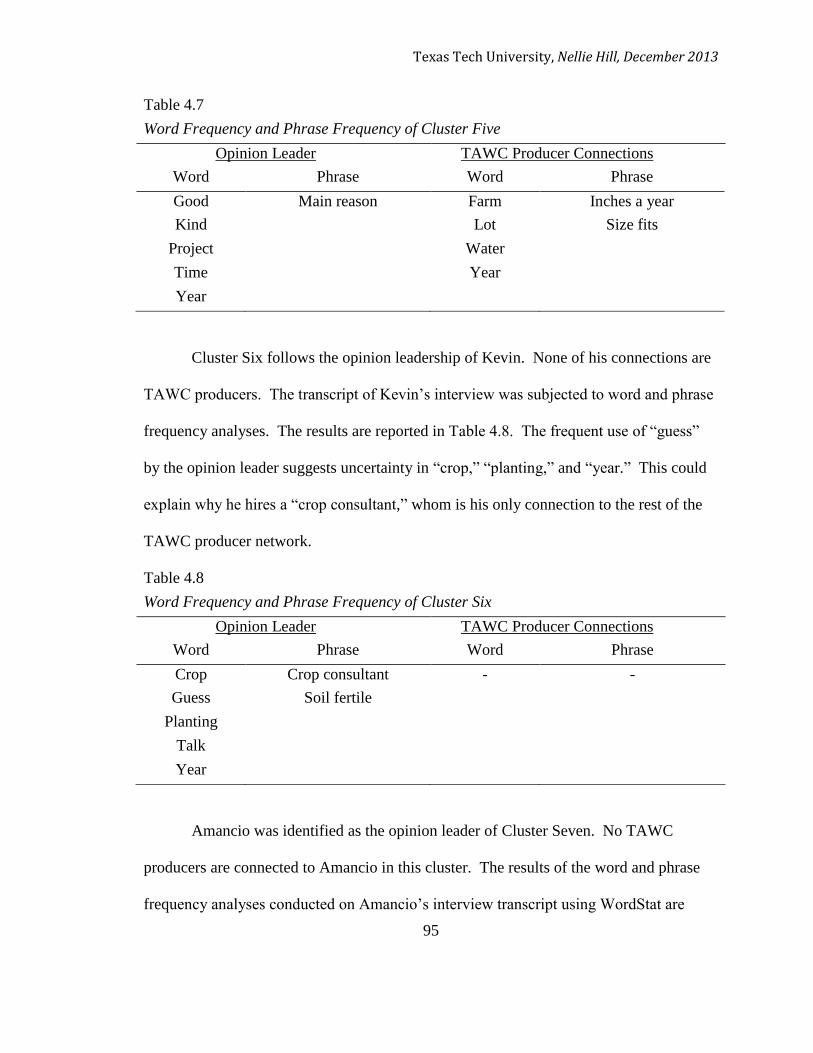
Texas Tech University, Nellie Hill, December 2013
95
Table 4.7
Word Frequency and Phrase Frequency of Cluster Five
Opinion Leader TAWC Producer Connections
Word Phrase Word Phrase
Good Main reason Farm Inches a year
Kind Lot Size fits
Project Water
Time Year
Year
Cluster Six follows the opinion leadership of Kevin. None of his connections are
TAWC producers. The transcript of Kevin’s interview was subjected to word and phrase
frequency analyses. The results are reported in Table 4.8. The frequent use of “guess”
by the opinion leader suggests uncertainty in “crop,” “planting,” and “year.” This could
explain why he hires a “crop consultant,” whom is his only connection to the rest of the
TAWC producer network.
Table 4.8
Word Frequency and Phrase Frequency of Cluster Six
Opinion Leader TAWC Producer Connections
Word Phrase Word Phrase
Crop Crop consultant - -
Guess Soil fertile
Planting
Talk
Year
Amancio was identified as the opinion leader of Cluster Seven. No TAWC
producers are connected to Amancio in this cluster. The results of the word and phrase
frequency analyses conducted on Amancio’s interview transcript using WordStat are
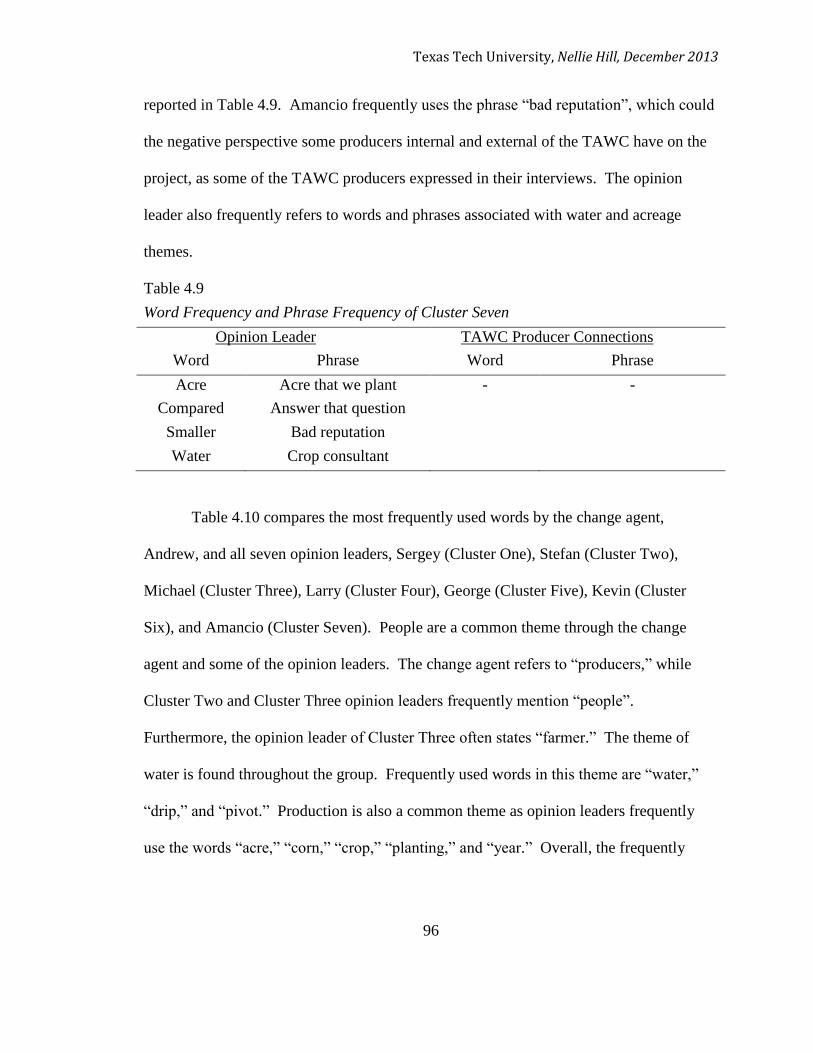
Texas Tech University, Nellie Hill, December 2013
96
reported in Table 4.9. Amancio frequently uses the phrase “bad reputation”, which could
the negative perspective some producers internal and external of the TAWC have on the
project, as some of the TAWC producers expressed in their interviews. The opinion
leader also frequently refers to words and phrases associated with water and acreage
themes.
Table 4.9
Word Frequency and Phrase Frequency of Cluster Seven
Opinion Leader TAWC Producer Connections
Word Phrase Word Phrase
Acre Acre that we plant - -
Compared Answer that question
Smaller Bad reputation
Water Crop consultant
Table 4.10 compares the most frequently used words by the change agent,
Andrew, and all seven opinion leaders, Sergey (Cluster One), Stefan (Cluster Two),
Michael (Cluster Three), Larry (Cluster Four), George (Cluster Five), Kevin (Cluster
Six), and Amancio (Cluster Seven). People are a common theme through the change
agent and some of the opinion leaders. The change agent refers to “producers,” while
Cluster Two and Cluster Three opinion leaders frequently mention “people”.
Furthermore, the opinion leader of Cluster Three often states “farmer.” The theme of
water is found throughout the group. Frequently used words in this theme are “water,”
“drip,” and “pivot.” Production is also a common theme as opinion leaders frequently
use the words “acre,” “corn,” “crop,” “planting,” and “year.” Overall, the frequently

Texas Tech University, Nellie Hill, December 2013
97
used words of the change agent do not permeate throughout the entire group of opinion
leaders.
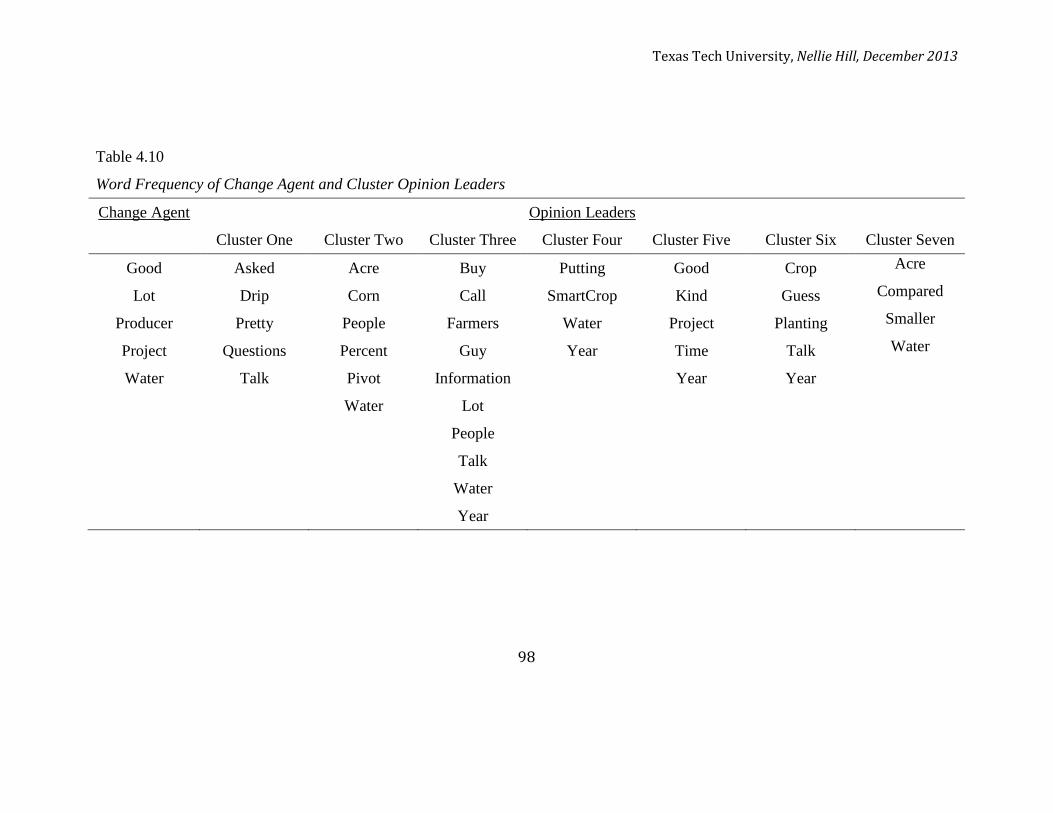
Texas Tech University, Nellie Hill, December 2013
98
Table 4.10
Word Frequency of Change Agent and Cluster Opinion Leaders
Change Agent Opinion Leaders
Cluster One Cluster Two Cluster Three Cluster Four Cluster Five Cluster Six Cluster Seven
Good Asked Acre Buy Putting Good Crop Acre
Lot Drip Corn Call SmartCrop Kind Guess Compared
Producer Pretty People Farmers Water Project Planting Smaller
Project Questions Percent Guy Year Time Talk Water
Water Talk Pivot Information Year Year
Water Lot
People
Talk
Water
Year
Texas Tech University, Nellie Hill, December 2013
99
Table 4.11 compares the most frequently used phrases by the change agent,
Andrew, and all seven opinion leaders, Sergey (Cluster One), Stefan (Cluster Two),
Michael (Cluster Three), Larry (Cluster Four), George (Cluster Five), Kevin (Cluster
Six), and Amancio (Cluster Seven). The analysis did not detect any phrases frequently
used by Sergey. The phrase frequency analysis demonstrates the diversity of the TAWC
producers. Each has their own take on farming, water management and the TAWC. The
lack of common themes demonstrates a need for more cohesiveness and communication
within the TAWC amongst the change agent and the opinion leaders.
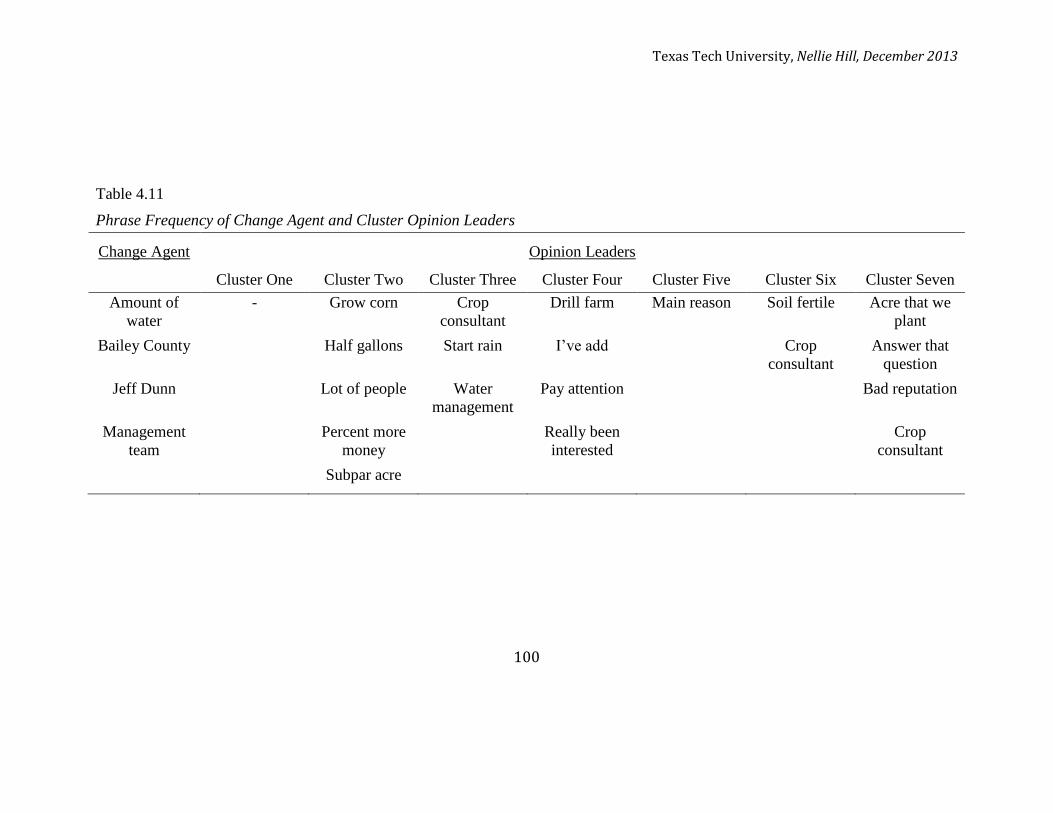
Texas Tech University, Nellie Hill, December 2013
100
Table 4.11
Phrase Frequency of Change Agent and Cluster Opinion Leaders
Change Agent Opinion Leaders
Cluster One Cluster Two Cluster Three Cluster Four Cluster Five Cluster Six Cluster Seven
Amount of
water
- Grow corn Crop
consultant
Drill farm Main reason Soil fertile Acre that we
plant
Bailey County Half gallons Start rain I’ve add Crop
consultant
Answer that
question
Jeff Dunn Lot of people Water
management
Pay attention Bad reputation
Management
team
Percent more
money
Really been
interested
Crop
consultant
Subpar acre
Texas Tech University, Nellie Hill, December 2013
101
CHAPTER V
IMPLICATIONS
Overview
The implications of this study are first discussed by concluding the findings of
each objective. The discussion of the findings with regards to the literature review
follows. Recommendations for future application and research for practitioners and
researchers is presented in order to continue to grow the body of knowledge pertaining to
social network analysis and the social network of the TAWC.
The purpose of this research was to describe the TAWC producers and analyze
their interpersonal network in terms of attributes, ideations, and relationships with others
as it relates to sharing farming and water management information.
The following research objectives were used to guide this study:
1. Describe TAWC producers in terms of age, years in the project, acres in the
project, board member status, who initiated their involvement in the project, type
of irrigation used on their acres in the project, crops grown on their acres in the
project, and if livestock are raised on their acres in the project
2. Describe the interpersonal connections of the producers in the TAWC in terms of
relations
3. Describe the interpersonal connections of the producers in the TAWC in terms of
typology

Texas Tech University, Nellie Hill, December 2013
102
Conclusions
Research Objective One
The variable analysis fulfilled research objective one by describing 18 TAWC
producers in terms of age, years in the project, acres in the project, board member status,
who initiated their involvement in the project, type of irrigation used on their acres in the
project, crops grown on their acres in the project, and if livestock are raised on their acres
in the project.
The 36-year range in ages of the TAWC producers represented beginning and
experienced producers. No matter their age, the producers operations and involvement
with the TAWC are similar. Of the 15 who reported involvement information, 12
reported being involved with the project since establishment in 2005. The other four
producers had between two and four years of experience as members of the TAWC.
Therefore, the producers who participated in the study were, overall, highly qualified to
provide informed feedback about the TAWC. Rick Kellison, director of the TAWC, is
the primary person responsible for initiating the original producers into the demonstration
project. Producers who joined the TAWC later, since 2009, were more likely to report
Jeff Pate, of Texas A&M AgriLife Extension, as the person responsible for getting them
involved.
Seven of the ten TAWC Demonstration Producer Board members were 2012
TAWC producers and were interviewed for this study. Those eight producers were
involved with the TAWC since 2005, when the demonstration project began. The
operations of these producers are diverse in acres involved in the project, irrigation
Texas Tech University, Nellie Hill, December 2013
103
techniques, and crops planted in 2012. Therefore, TAWC Demonstration Producer Board
members can relate to other producers within the TAWC.
The amount of acres a producer has involved in the TAWC depends largely on the
types of farmland the producer owns and what land a demonstration project leader asked
them to enroll in the project, according to the TAWC producer interviews. There appears
to be no correlations between the number of acres a producer has in the TAWC and any
other reported attribute data.
Most producers did not use their acres in the TAWC to raise livestock in 2012.
The three producers that did, Bernard, George, and Kevin, also used their acres to grow
more than one crop. This finding suggests that these three producers put even greater
value on diversifying their operations than their peers.
TAWC producers strongly favor pivot irrigation over subsurface and furrow
irrigation or dryland. If a producer uses subsurface irrigation on some of their acres in
the demonstration project, they use pivot irrigation on their other demonstration project
acres.
The TAWC producers represented several different types of agricultural
production. They produced Bermuda grass, corn, cotton, Dahl grass, oats, sorghum,
sunflowers, and wheat. Most producers grow more than one type of crop on their acres in
the TAWC, usually favoring cotton. This finding further supports the conclusion that
TAWC producers are diverse in experience and practice.
Texas Tech University, Nellie Hill, December 2013
104
Research Objective Two
The interpersonal connections of the 18 TAWC producers and project leader were
described in terms of relations by the network analysis, satisfying research objective two.
To define the boundaries of the TAWC producer network, respondents answered two
questions:
1. Who do you go to for information or advice related to your farm operation?
Could you please share the names of at least three people? We will not use their
real names in our final report.
2. Who are the people that come to you for information or advice about farming?
Could you please share the names of at least three people? We will not use their
real names in our final report.
Five principles of network analysis were used to describe the interpersonal
relations of the TAWC producers. Those principles were: (1) cohesion, (2) structural
equivalence, (3) prominence, (4) range, and (5) brokerage (Haythornthwaite, 1996; Burt,
1992; and Nohria, 1992).
Cohesion.
Graph density and centralization were measured to assess the principle of
cohesion in the network. The graph density of a network ranges from 0 to 1, describing
the overall connection of all of the points in a network. All of the nodes within a network
with a graph density of 1, or a complete graph, are directly connected to all other nodes in
the network. This is very rare. As more nodes are connected to one another in a
network, the higher the graph density will be (Scott, 2013).
Texas Tech University, Nellie Hill, December 2013
105
The graph density of the TAWC producer network was .035. Therefore, this
network is low-density, meaning the nodes are not well connected. This is common for a
directed graph in an ego-centric network in which relationships are not assumed to be
reciprocated and each individual was not questioned about their relationship with every
other individual in the network (Scott, 2013). Figure 4.1 visually displays the density of
the network, where many isolates are shown, driving down the graph density.
Centralization builds on density. Where density describes the overall cohesion
of the network, centralization describes the focal points of the cohesion. Nuclear
centralization, derived from the indegrees and outdegrees of each individual, was
measured to examine the centralized structure of the network (Scott, 2013).
The range of nuclear centralization for the TAWC producers was 15. Producers
had a minimum of zero connections to the network to a maximum of 15 connections
within the network. The average TAWC producer had 6.11 connections within the
network. The questions asked in the interview could have limited the number of
connections producers reported because respondents were asked to name three people
who the go to for information and three people who come to them for information. The
measure of nuclear centralization identified Andrew, Joshua, Michael, and Stefan as the
focal nodes of the network. With these nodes identified, the structure of the relations
between these points and all others in the network can be compared using Figure 4.1.
Structural equivalence.
The Girvan-Newman algorithm was used to conduct group clustering for
establishing structural equivalence. The seven clusters produced each included actors that
Texas Tech University, Nellie Hill, December 2013
106
held similar roles within the network. Cluster One includes 12 individuals, seven of
whom are TAWC producers. The other individuals are crop consultants or undefined
connections outside of the TAWC. This is the largest of the clusters. Figure 4.2. displays
Cluster One so it can be seen that these producers are the most interconnected of the
network and share similar connections. If Andrew, the focal node, would ever leave the
TAWC producer network, one of the other nodes in this network could be a replacement
as they share similar connections with Andrew.
Cluster Two includes just one TAWC producer, Stefan. This cluster is
completely removed from the rest of the TAWC producer network. Figure 4.3. clearly
displays Stefan as the focal node of this cluster. While Stefan would be a good resource
for sharing water management knowledge gained through the TAWC with those outside
the project, his disconnection from the rest of the producers could skew the information
being shared. The TAWC needs to reconnect Stefan with the network.
Two TAWC producers, Michael and Lee, are included in Cluster Three, along
with two crop consultants, Alejandro and Luis, as well as three other undefined
connections. Michael is the focal node in this cluster. Alejandro and Luis play important
roles in the TAWC producer network. Crop consultants are often sought out for advice,
even beyond the scope of their formal job description, as explained during the TAWC
producer interviews.
Sheldon and Larry are the two TAWC producers in Cluster Four. Both producers
have been in the project since 2005 and have differing operations. Yet, Sheldon goes to
Larry for information and advice. Other connections outside the TAWC come to Larry

Texas Tech University, Nellie Hill, December 2013
107
for information and advice as well. Larry has potential to be a key resource inside and
outside of the demonstration project for water management information.
Cluster Five includes three TAWC producers, George, Thomas, and Warren.
Samuel, a crop consultant, is also included. This cluster includes two other connections
outside of the TAWC. Based on their connections, these producers share the role of
information seekers. Fewer people come to them for information than they ask for
information or advice.
Ray, a crop consultant, is the only connection Cluster Six has to the rest of the
TAWC producer network. Kevin, a TAWC producer, extends the network to three other
connections outside of the project. Kevin’s disconnection from other TAWC producers
in the network could be a consequence of joining the project in 2008, whereas many of
the other producers joined in 2005. To ensure he is receiving and sharing the same water
management information as the rest of the TAWC producers, he needs to find a TAWC
producer to connect with for knowledge.
The smallest of the clusters generated by the Girvan-Newman algorithm in
NodeXL is Cluster Seven. This cluster includes one TAWC producer, Amancio, and one
connection outside of the TAWC, Harold. Amancio has connections that extend to and
from Cluster One and Cluster Five.
Prominence.
Values of Eigenvector centrality were paired with node classifications
(Wasserman & Faust, 1994) to distinguish the actors within the TAWC network who had
Texas Tech University, Nellie Hill, December 2013
108
influence or power over other actors. These measures satisfy the network analysis
principle of prominence.
Eigenvector centrality gives value to nodes whose direct connections are highly
connected to other nodes (Hansen et al., 2011). The measure of Eigenvector centrality
identified Andrew, Raymond, Joshua, and Sergey as individuals with great influence over
the network, given their strategic connections with other highly connected members of
the TAWC producer network. Through these four TAWC producers, the most other
nodes, or actors, can be reached.
Most of the TAWC producers were classified as ordinary nodes by the system
developed by Wasserman and Faust (1994). This indicates that TAWC producers receive
and share information and advice, but with an unequal number of other people. They
desire to learn from others and are also willing to share what they know. The three
TAWC producers who were not interviewed for the study (Channing, David, and
Warren) were classified as an isolate, receiver, or carrier, respectively. These node
classifications are limited to the connections reported by other TAWC producers. If
Channing, David, and Warren were interviewed, they would likely report more relations
than collected and available for analysis in this study. These connections would give the
researcher a more complete picture of the connections interior and exterior of the TAWC.
Range.
Those who seek information from a TAWC producer, indegrees, and those whom
a TAWC producer goes to for information, outdegrees, together determine an
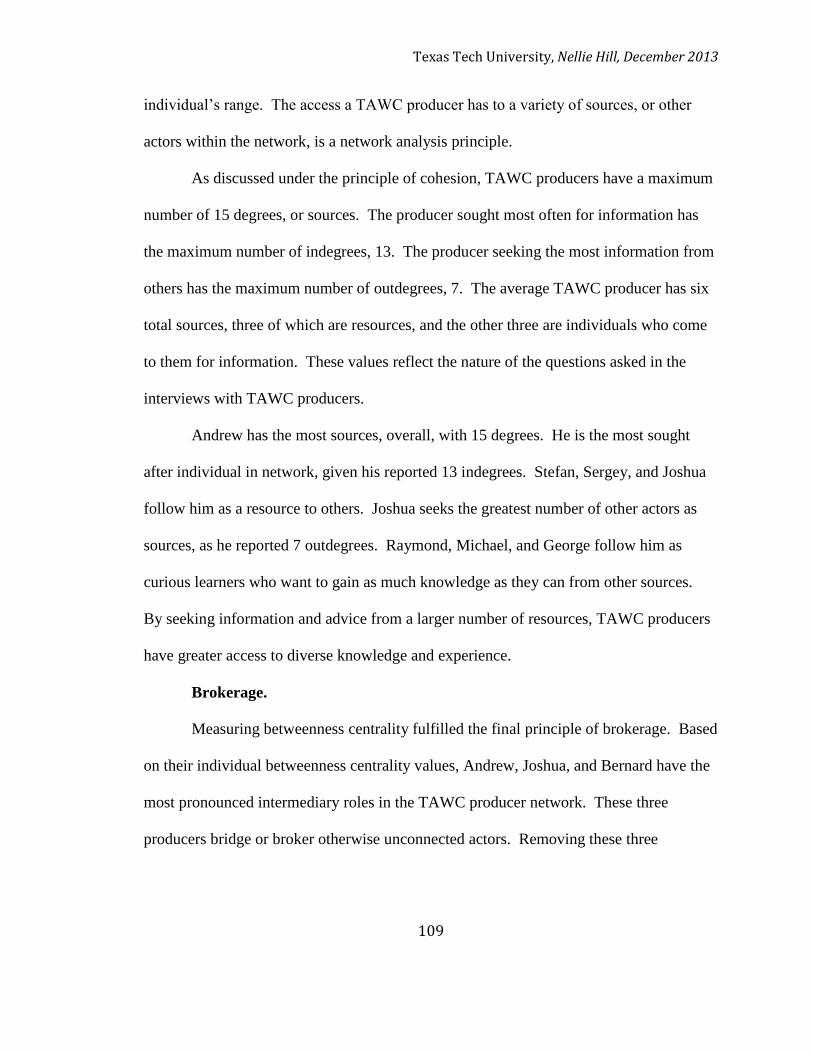
Texas Tech University, Nellie Hill, December 2013
109
individual’s range. The access a TAWC producer has to a variety of sources, or other
actors within the network, is a network analysis principle.
As discussed under the principle of cohesion, TAWC producers have a maximum
number of 15 degrees, or sources. The producer sought most often for information has
the maximum number of indegrees, 13. The producer seeking the most information from
others has the maximum number of outdegrees, 7. The average TAWC producer has six
total sources, three of which are resources, and the other three are individuals who come
to them for information. These values reflect the nature of the questions asked in the
interviews with TAWC producers.
Andrew has the most sources, overall, with 15 degrees. He is the most sought
after individual in network, given his reported 13 indegrees. Stefan, Sergey, and Joshua
follow him as a resource to others. Joshua seeks the greatest number of other actors as
sources, as he reported 7 outdegrees. Raymond, Michael, and George follow him as
curious learners who want to gain as much knowledge as they can from other sources.
By seeking information and advice from a larger number of resources, TAWC producers
have greater access to diverse knowledge and experience.
Brokerage.
Measuring betweenness centrality fulfilled the final principle of brokerage. Based
on their individual betweenness centrality values, Andrew, Joshua, and Bernard have the
most pronounced intermediary roles in the TAWC producer network. These three
producers bridge or broker otherwise unconnected actors. Removing these three
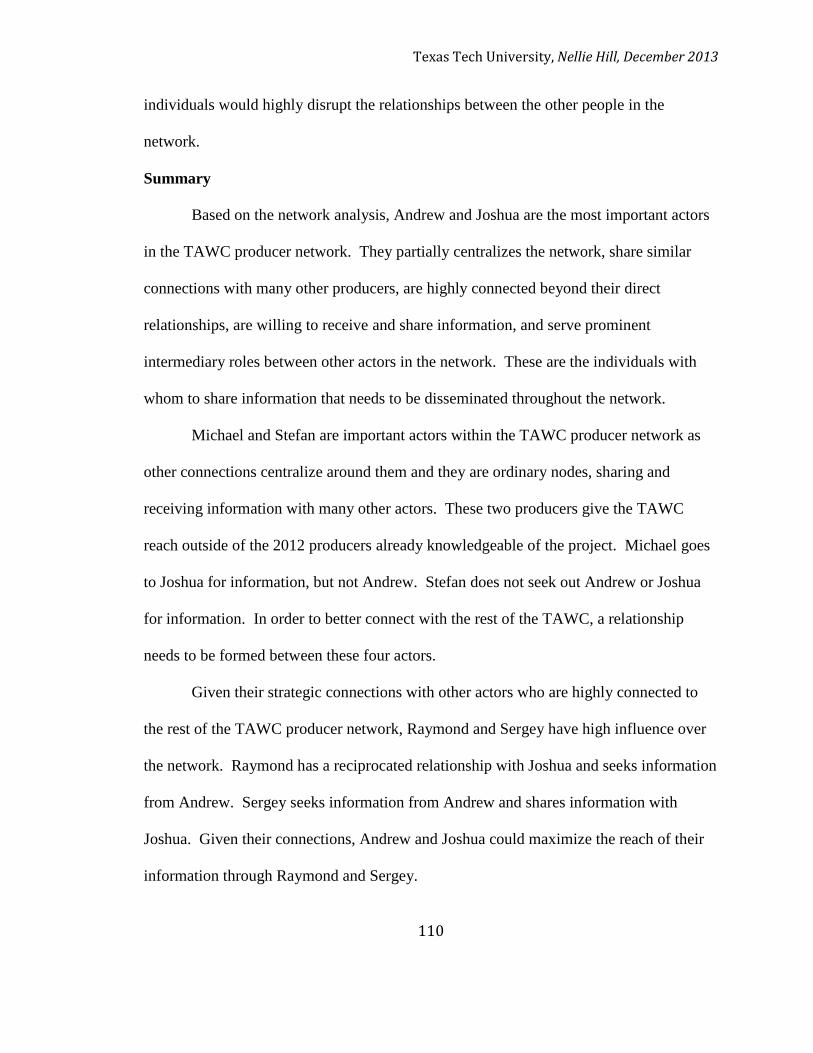
Texas Tech University, Nellie Hill, December 2013
110
individuals would highly disrupt the relationships between the other people in the
network.
Summary
Based on the network analysis, Andrew and Joshua are the most important actors
in the TAWC producer network. They partially centralizes the network, share similar
connections with many other producers, are highly connected beyond their direct
relationships, are willing to receive and share information, and serve prominent
intermediary roles between other actors in the network. These are the individuals with
whom to share information that needs to be disseminated throughout the network.
Michael and Stefan are important actors within the TAWC producer network as
other connections centralize around them and they are ordinary nodes, sharing and
receiving information with many other actors. These two producers give the TAWC
reach outside of the 2012 producers already knowledgeable of the project. Michael goes
to Joshua for information, but not Andrew. Stefan does not seek out Andrew or Joshua
for information. In order to better connect with the rest of the TAWC, a relationship
needs to be formed between these four actors.
Given their strategic connections with other actors who are highly connected to
the rest of the TAWC producer network, Raymond and Sergey have high influence over
the network. Raymond has a reciprocated relationship with Joshua and seeks information
from Andrew. Sergey seeks information from Andrew and shares information with
Joshua. Given their connections, Andrew and Joshua could maximize the reach of their
information through Raymond and Sergey.
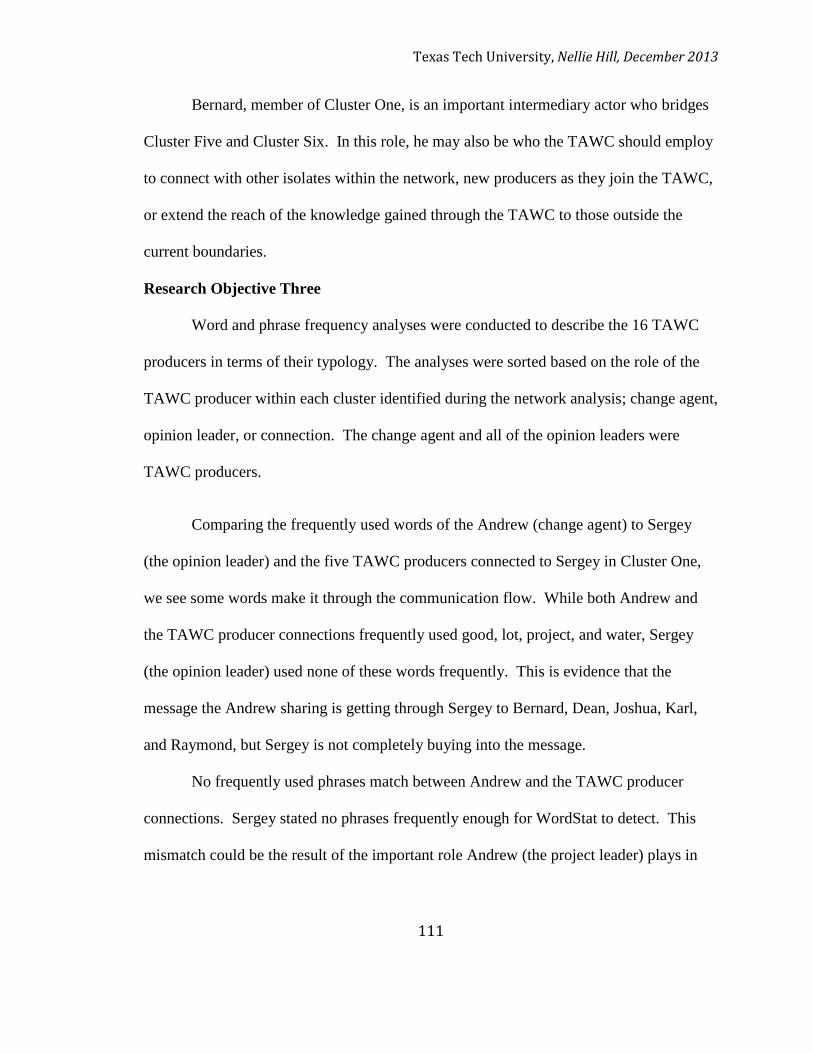
Texas Tech University, Nellie Hill, December 2013
111
Bernard, member of Cluster One, is an important intermediary actor who bridges
Cluster Five and Cluster Six. In this role, he may also be who the TAWC should employ
to connect with other isolates within the network, new producers as they join the TAWC,
or extend the reach of the knowledge gained through the TAWC to those outside the
current boundaries.
Research Objective Three
Word and phrase frequency analyses were conducted to describe the 16 TAWC
producers in terms of their typology. The analyses were sorted based on the role of the
TAWC producer within each cluster identified during the network analysis; change agent,
opinion leader, or connection. The change agent and all of the opinion leaders were
TAWC producers.
Comparing the frequently used words of the Andrew (change agent) to Sergey
(the opinion leader) and the five TAWC producers connected to Sergey in Cluster One,
we see some words make it through the communication flow. While both Andrew and
the TAWC producer connections frequently used good, lot, project, and water, Sergey
(the opinion leader) used none of these words frequently. This is evidence that the
message the Andrew sharing is getting through Sergey to Bernard, Dean, Joshua, Karl,
and Raymond, but Sergey is not completely buying into the message.
No frequently used phrases match between Andrew and the TAWC producer
connections. Sergey stated no phrases frequently enough for WordStat to detect. This
mismatch could be the result of the important role Andrew (the project leader) plays in

Texas Tech University, Nellie Hill, December 2013
112
the network, described in the conclusions of research objective two. He thinks and
speaks differently about the TAWC than Bernard, Dean, Joshua, Karl, and Raymond.
Cluster Two is represented by Stefan (the opinion leader) who is not connected to
any other TAWC producers. Therefore, the extent of the effectiveness of his message to
his connections outside the TAWC is unknown.
Cluster Three includes Michael (the opinion leader) and Lee, Michael’s only
TAWC producer connection. Water was the only word used frequently by Michael and
Lee. This is to be expected, as the purpose of the TAWC is to develop water
management knowledge. There were no phrases identified as frequently used by both
individuals.
The word and phrase frequency analyses for the members of Cluster Four were
limited to Larry (the opinion leader) and Sheldon, as David was not interviewed for the
study, even though he is a TAWC producer. Larry and Sheldon used the word ‘water’
frequently in their individual interviews. Sheldon frequently referred to crop consultants
in his interview, while Larry did not. Therefore, Sheldon puts a larger emphasis on the
knowledge and impact of the crop consultant than Larry. Phrases frequently used by
Larry and Sheldon were not found. An interview with David would help determine if the
communications Larry is sending are getting though and resonating with his TAWC
producer connections.
The opinion leader of Cluster Five was George, who was connected to Thomas
and Warren, TAWC producers. Warren was not interviewed, so no word or phrases
frequencies are available. George and Thomas frequently stated the word ‘year’ during

Texas Tech University, Nellie Hill, December 2013
113
their respective interviews. This commonly refers to what each has done in past years on
their operation or the status of a crop or technology in the current year. George and
Thomas did not share any frequently used phrases. Given the low number of matching
words used frequently and the lack of matching phrases, it is unlikely that George’s
communications are having an impact on Cluster Five. However, an interview with
Warren would provide further information to make a determination.
Cluster Six and Cluster Seven are represented by opinion leaders Kevin and
Amancio, respectively. They are not connected to any other TAWC producers.
Therefore, the extent the effectiveness of their messages to their connections outside the
TAWC is unknown.
The word and phrase frequency analyses of Andrew (the change agent) and the
opinion leaders of all seven clusters (Sergey, Stefan, Michael, Larry, George, Kevin and
Amancio) were compared. No words or phrases were used frequently by all individuals.
This may indicate that the messages being communicated by Andrew to the TAWC
producers are either not being received or not well accepted by the opinion leaders.
Discussion
This study supported the findings in the literature regarding social network
analysis as an aid for gaining insight into interpersonal relations and the adoption of
innovations. A three-part social network analysis identified the attributes of TAWC
producers, their interpersonal relations, as well as general beliefs and attitudes about the
TAWC. Producers are early knowers who have been triggered to investigate water
management practices, causing a preventative innovation adoption (Rogers, 2003).
Texas Tech University, Nellie Hill, December 2013
114
TAWC producers receive and share information and advice with project peers, crop
consultants, and other producers outside of the TAWC. This study identified the change
agent and opinion leaders of the TAWC using social network analysis. The leaders of the
TAWC can use this information to more effectively and efficiently disseminate
information throughout the TAWC producer network and beyond.
The Diffusion of Innovations theoretical framework can be applied to this study to
describe the attributes and roles of TAWC producers and the relationships through which
information is transferred. TAWC producers have exposure to a variety of interpersonal
channels, contact with a change agent, engage in social participation, and are aware of
water management innovations but do not always adopt them. Therefore, TAWC
producers are early knowers (Rogers, 2003).
Based on the interviews conducted with the TAWC producers, potential water use
governance and declining water availability were driving factors in a producer’s choice to
join the TAWC. To try to avoid these undesirable, potential issues, TAWC producers
chose to join in pursuit of preventative innovation adoption. Not all TAWC producers
have adopted water management best practices or technologies suggested by the leaders
of the TAWC. This aligns with Rogers’ (2003) assertion that motivations to adopt
preventative innovations are generally weak because the unwanted event may or may not
occur and the desired innovation consequences are unknown to the producer.
A change agent and seven opinion leaders were identified by this study. Andrew
is the change agent; one who influences the innovation-decisions of the TAWC producers
in way that is intended by the leadership of the TAWC. He has completed some of the
Texas Tech University, Nellie Hill, December 2013
115
seven sequential steps of change agent roles (Rogers, 2003). During the interviews,
TAWC producers often cited Andrew as someone who gave them an awareness of the
demonstration project and further amplified the need for change in water management
practices. During the knowledge stage of the innovation-decision process, Andrew
helped TAWC producers gain awareness-knowledge and how-to knowledge. Given the
number of connections Andrew has in the TAWC producer network, he has already
established information exchange relationships. Some TAWC produces have adopted
new water management best practices and technologies, while others have either adopted
them and discontinued or never adopted at all. This finding indicates Andrew needs to
work on diagnosing TAWC producer problems, creating intent in producers to adopt,
transforming intent into action, and stabilizing adoption to prevent discontinuance.
Rogers (2003) stated that using his interpersonal network influences, especially opinion
leaders, would be the most effective in achieving these steps in the persuasion and
decision stages of the innovation-decision process. Finally, as Andrew nears the end of
his time as project director, and therefore change agent, he should seek to find another
person, perhaps an opinion leader, to fill his future absence (Rogers, 2003).
Sergey, Stefan, Michael, Larry, George, Kevin, and Amancio are opinion leaders
in the TAWC producer network; those who have earned the ability to informally
influence the behavior and attitudes of others in a desirable way. Opinion leaders are not
uniform, which is reflected in the variety of ages, acres in the TAWC, irrigation practices,
and crops produced by the seven TAWC producers identified as opinion leaders. They
each express the unique attributes of the TAWC system structure. Furthermore, they are
Texas Tech University, Nellie Hill, December 2013
116
the focal point of their system’s interpersonal communication network. There is often a
breakdown, demonstrated in the typological analysis, between the opinion leader and his
followers. Rogers (2003) asserted that other members of the network should imitate the
innovative behavior and attitudes of the opinion leader. This study found this not to be
the case within the TAWC producer network. Strengthening opinion leaders’ technical
competence, social accessibility, or conformity to the norms of the network could aid in
their opinion leadership relations with other TAWC producers (Rogers, 2003). As
Sergey, Stefan, Michael, Larry, George, Kevin, and Amancio build their opinion
leadership capabilities, Andrew should be able to increasingly rely on them to secure
adoption of innovations (i.e. water management best practices and technologies) (Rogers,
2003).
The relationships between TAWC producers are the communication channels
that innovations pass through from the TAWC leadership to the change agent, the opinion
leader, and finally their other TAWC producer connections and those outside the
demonstration project. The social network analysis produced a sociogram and many
measures that described these communication channels. It is evident that the water
management knowledge developed by the TAWC has reached beyond the directly
involved producers. In addition, the analysis indicated that TAWC producers seek a
variety of sources to gain information of advice, including fellow TAWC members, crop
consultants, and people who are not members of the TAWC. These communication
channels are very important to the diffusion of an innovation, as it is a social process that
relies on interpersonal relationships for success (Rogers, 2003).
Texas Tech University, Nellie Hill, December 2013
117
This study assumes producers of agricultural products (farmers and ranchers)
operate as both an individual entrepreneur and as an agricultural professional. In the
context of a producer as an individual, the concept of interpersonal communication is
useful in describing the ways TAWC producers share information. This study supports
the findings of previous research (Gamon et al., 1992; Lasley et al., 2001; Licht &
Martin, 2007; Richardson & Mustian, 1994; Riesenberg & Gor, 1989; Ryan & Gross,
1943; Suvedi et al., 2000; Vergot et al., 2005) that agricultural producers prefer
interpersonal communication methods. During the interviews, TAWC producers
commonly referred to receiving or making phone calls as well as visiting with other
producers at a coffee shop or cotton gin as the primary ways they shared and received
information.
The interpersonal relationships of TAWC producers formed as a result of
mutually contingent and rewarding transactions of information exchange in agreement
with Social Exchange Theory (Emerson, 1976). Some of these relationships within the
TAWC producer network are reciprocated. Blau (1964) stated this is due to an obligation
to return the favor, which forms when one person shares a useful resource with another
person. However, Foa and Foa (1974, 1980) explained that highly particularistic and
symbolic resources, such as knowledge, are exchanged in a way that reciprocation is not
required. This explains why other interpersonal relations are not reciprocated within the
TAWC producer network. The TAWC producer must deem the information shared by
another person useful in order to feel an obligation to reciprocate (Emerson, 1987).
Texas Tech University, Nellie Hill, December 2013
118
Therefore, relationships that are not reciprocated, especially with opinion leaders, may be
due to the TAWC producer connection devaluing the information shared.
TAWC producers made comparisons with others similar to them (members of the
same cluster) in order to evaluate their own opinions, abilities, and life situations
(Festinger, 1954). Social Comparison Theory is useful in further explaining the seven
clusters identified through social network analysis. The TAWC producers chose to form
relationships with people who they perceived as having similar attributes related to water
management or agriculture. These relationships have the strongest impact on opinions of
preference assessment and preference prediction (Suls, 2000).
During the interviews, some TAWC producers stated they sought information or
advice from other producers who had tried a new practice or technology prior to their
own adoption. Social Comparison Theory and the proxy comparison model states a
producer can look to a peer, who has already completed a considered task, to predict what
they have the ability to accomplish (Martin, 2000).
In the context of the producer as a corporation, once producers become members
of the TAWC, they become a part of a community or practice. The TAWC is a
community of practice because it follows Wenger et al.’s (2002) definition: “groups of
people who share a concern, a set of problems, or a passion about a topic, and who
deepen their knowledge and expertise in this area by interacting on an ongoing basis” (p.
4). The TAWC producers share a concern for water management and issues regarding
water conservation. These producers deepen their knowledge and expertise by
Texas Tech University, Nellie Hill, December 2013
119
interacting with other TAWC producers on a regular basis in order to gain information or
advice on the topics.
TAWC producers reported they seek out others for information or advice. The
Uncertainty Reduction Theory states people will seek to reduce uncomfortable feelings of
the unknown through communication. This supports a human desire to predict the
outcomes, both positive and negative, resulting from actions and judgments (Heath &
Bryant, 2000). The nature of the interview questions described TAWC producers as
engaging in interactive strategy of acquiring information to reduce uncertainty about the
topic and the person they are communicating with through interpersonal communication
(Berger, 1995; Heath & Bryant, 2000).
This study operated under the four defining principles of social network analysis
(Freeman, 2004). The researcher found value in relations between individuals, studied
those connections by gathering and analyzing relational data, and relied on sociograms of
the TAWC producer network to visualize patterns in the network. Furthermore,
mathematical and computational methods were used to describe and explain those
patterns.
To conduct the social network analysis, the researcher referred to the types of data
and appropriate means of analysis detailed by Scott (2013). Through the survey research
method, a semi-structured interview was conducted with each accessible TAWC
producer. Through these interviews, attribute, ideational, and relational data was
collected. Each of the three research objectives of this study was fulfilled by using one of
the three types of data analysis: variable, typological, or network.
Texas Tech University, Nellie Hill, December 2013
120
Social network analysis was used as a research methodology and data analysis
technique to increase understanding of the vast and complex relationships among TAWC
producers. Human relationships are complicated and intertwined, but social network
analysis allowed the researcher to untangle networks to see a new perspective on
relationships.
Recommendations
Practitioners
The results of the social network analysis revealed there are smaller communities,
or clusters, that exist within the TAWC project. Based on the results, the TAWC should
utilize these communities and the individuals identified as the change agent or opinion
leaders within the project.
As the social network analysis illustrated, the project has reach beyond the 18
2012 producers. The TAWC should utilize producers connected to individuals outside of
the project to share best practices, encourage the use of irrigation monitoring and decision
tools, and expand the project beyond its current boundaries.
Based on word frequency and phrases frequency analyses, the messages shared by
the change agent with the rest of the network did not resonate with the opinion leaders
and did not flow to the subsequent TAWC producer connections. The TAWC should
ensure that important messages are being clearly and concisely shared with the change
agent. Furthermore, the change agent must share the same, uniform message equally
with all opinion. Consequently, more TAWC producers should have the same
Texas Tech University, Nellie Hill, December 2013
121
information and knowledge of the TAWC and the water management knowledge it has
developed.
As the TAWC moves forward, they should consider encouraging TAWC
producers to take greater, informal leadership roles within the project. The change agent,
Andrew, can help the TAWC find producers who are interested in providing further
support and resources of information to other producers. In addition, identify and
encourage producers who naturally reach out to producers outside of the TAWC in order
to further disseminate the best practices and water management technology information
gained by the project. Finally, as Andrew nears the end of his time as project leader, the
TAWC should encourage him to work with a successor to take over for him when he
retires. This person should be someone who already has similar connections, is willing to
share and receive information, is invested in water management, and has a similar
farming operation to other TAWC producers.
Crop consultants were found, using network analysis, to be important
intermediary figures in the TAWC producer network. When a TAWC producer seeks
information or advice, they sometimes turn to a hired crop consultant. The TAWC
should share pertinent water management technology and best practices information with
crop consultants who serve producers in the project. Therefore, when a TAWC producer
seeks a crop consultant as a resource, the crop consultant is prepared to answer questions
and relay important messages shared by the TAWC.
For professionals involved in outreach efforts designed to influence the adoption
process, understanding and subsequently utilizing established networks and potential
Texas Tech University, Nellie Hill, December 2013
122
opinion leaders could increase the effectiveness and efficiency of those efforts. The
results of social network analysis may allow practitioners to more effectively plan
information dissemination and education efforts towards a goal of maximizing
effectiveness while reducing the use of valuable resources (including time).
Researchers
Throughout the social network analysis, the researcher learned lessons pertaining
to the process future researchers should benefit from. Before collecting any data, define
the type of network (whole or egocentric) that will be studied. In addition, decide on the
types of ties, or relationships, to be studied. Based upon the known characteristics of the
population, determine the research method – survey, ethnographic, or documentary.
This research studied the TAWC producers as an egocentric network, interested in
producer relationships that share information regarding their operation or water
management knowledge. A survey research method was used through semi-structured
interviews. Given that no commonalities were found in this study’s typological analysis,
enhancements to the interview are recommended. The interviewer should closely follow
the same semi-structured interview guidelines for every interview, so as to get similar
types of answers from each respondent. Furthermore, the questions should be specific
and probing after each structured question is encouraged.
When asking the questions pertaining to the network analysis, do not limit the
number of people the respondent can list as resources or who comes to them as a
resource. The TAWC producer network in this study is limited due to asking the
Texas Tech University, Nellie Hill, December 2013
123
respondents to list three of each type of connection. While some respondents answered
with more than three each, others limited themselves to the number requested.
NodeXL for Microsoft Excel, QDA Miner, and WordStat are recommended for
data analysis. For this study, each software tool was learned through application. It is
recommended that future researchers gather relational data from a local, easily accessed
group to create the edge list in Microsoft Excel imported into NodeXL to create a
sociogram and begin an analysis. Transcribe the interviews, clean the documents, and
make substitutions in Microsoft Word. Then, import the interview documents for coding
and analysis into QDA Miner. Once these steps are complete, a content analysis should
be conducted with WordStat. Practicing with a data set prior to a more extensive study
will help the researcher more deeply learn the process and tool.
The results of this study encourage several other research opportunities. The
TAWC producer network should be explored through a whole network, directed, and
valued analysis. This will tell researchers and TAWC leadership how strongly each
producer is connected, if at all, with every other TAWC producer and if that relationship
is reciprocated. This is the strongest social network analysis technique (Scott, 2013).
Furthermore, this study should be expanded beyond the 15 farmers interviewed to
begin creating sociograms of farmer networks within selected counties in West Texas to
determine if different network patterns exist based on the agriculture topic/issue being
discussed. Further analysis should seek to determine if network variations are present
based on individual and county-level factors. This research would build understanding of
how information flows through interpersonal networks among farmers. In addition,
Texas Tech University, Nellie Hill, December 2013
124
further research could ask farmers about their communication preferences to facilitate the
study of message development and channel mix as they relate to information assimilation
and adoption of practices/technologies disseminated.
This study could serve as baseline data for annual social network analyses of the
TAWC producers. A future longitudinal study should assess how connections between
TAWC producers change over time and due to what influences.
The typological analysis revealed the interview themes of the change agent,
opinion leaders, and their TAWC producer connections did not align. The work of the
TAWC would be more effective in disseminating best practices and new technologies
throughout the network and beyond if the themes aligned more closely. Future
researchers should investigate the barriers currently hindering effective and efficient
communications between the change agent, opinion leaders, and TAWC producer
connections.
While conducting the review of literature, the researcher noticed similarities in
language between communication networks and social networks. However, no research
was found that discussed the similarities of these two types of networks. Further research
should explore the similarities between communication networks and social networks and
examine the historical timeline of both to decide if convergence of the two is appropriate.
Texas Tech University, Nellie Hill, December 2013
125
REFERENCES
Alba, R. D. (1982). Taking stock of network analysis: A decade’s results. Research in
Sociology of Organizations, 1, 39-74.
Affleck, G., & Tennen, H. (1991). Social comparison and coping with major medical
problems. In J. Suls & T. A. Willis (Eds.), Social comparison: Contemporary
theory and research (pp. 369-394). Hillsdale, NJ: Lawrence Erlbaum.
Allen, T. J. (1977). Managing the flow of technology: Technology transfer and the
dissemination of technological information within the R&D organization.
Cambridge, MA: MIT Press.
American Psychological Association. (2010). Publication manual of the American
Psychological Association. (6th ed.). Washington D.C.: American Psychological
Association.
Arrowood, A. J. (1978). Social comparison theory: Revived from neglect. Contemporary
Psychology, 23, 490-491.
Asch, S. E. (1956). Studies of independence and conformity: I. A minority of one against
a unanimous majority. Psychological Monographs: General and Applied, 70(9),
1-70. doi: 10.1037/h0093718
Attwater, R., & Derry, C. (2005). Engaging communities of practice for risk
communication in the Hawkesbury Water Recycling Scheme. Action Research,
3(2), 193-209. doi: 10.1177/1476750305052144
Baldwin , J. R., Perry , S. D., & Moffitt, M. A. (2004). Communication theories for
everyday life. Boston, MA: Pearson .
Texas Tech University, Nellie Hill, December 2013
126
Bajema, D. H., Miller, W. W., & Williams, D. L. (2002). Aspirations of rural youth.
Journal of Agricultural Education, 43(3), 61-71. doi: 10.5032/jae.2002.03061
Berger, C. R. (1995). A plan-based approach to strategic communication. In D. E. Hewes
(Ed.), The cognitive bases of interpersonal communication (pp. 141-179).
Hillsdale, NJ: Lawrence Erlbaum.
Berger, C. R. (2006). Uncertainty reduction theory. In E. Griffin (Ed.), A first look at
communication theory (pp. 130-141). New York, NY: McGraw-Hill.
Berger, C. R. & Calabrese, R. J. (1975). Some exploration in the initial interaction and
beyond: Toward a developmental theory of interpersonal communication. Human
Communication Research, 1(2), 99-112. doi: 10.111/j.1468-2958.1975.tb00258.x
Berko, R., Aitken, J. E., & Wolvin, A. (2010). ICOMM: Interpersonal concepts and
competencies: Foundations of interpersonal communication. Lanham, MD:
Rowman & Littlefield.
Blau, P. M. (1964). Exchange and power in social life. New York, NY: Wiley.
Borgatti, S., & Everett, M. G. (1999). Models of core/ periphery structures. Social
Networks, 21(4), 375-395. doi: 10.1016/S0378-8733(99)00019-2
Borgatti, S., Mehra, A., Brass, D., & Labianca, G. (2009). Network analysis in the social
sciences. Science, 323(5916), 892-95. doi: 10.1126/science.1165821
Brass, D. J., Galaskiewicz, J., Greve, H. R., & Tsai, W. (2004). Taking stock of networks
and organizations: A multilevel perspective. Academy of Management Journal,
47(6), 795-817. doi: 10.2307/20159624
Texas Tech University, Nellie Hill, December 2013
127
Burgoon, J. K., Bonito, J. A., Ramirez, A., Jr., Dunbar, N. E., Kam, K., & Fischer, J.
(2002). Testing the interactivity principle: Effects of mediation, propinquity, and
verbal and nonverbal modalities in interpersonal interaction. Journal of
Communication, 52(3), 657-677. doi: 10.1111/j.1460-2466.2002.tb02567.x
Burt, R. S. (1976). Positions in networks. Social Forces, 55(1), 93-122. doi:
10.2307/2577097
Burt, R. S. (1992). The social structure of competition. In N. Nohria & R. G. Eccles
(Eds.), Networks and organizations: Structure, form, and action (pp. 57-91).
Boston, MA: Harvard Business School Press.
Carolan, B. V. (2014). Social network analysis and education: Theory, methods &
applications. Thousand Oaks, CA: Sage.
Chua, V., Madej, J., & Wellman, B. (2011). Personal communities: The world according
to me. In J. Scott & P. Carrington (Eds.), The Sage handbook of social network
analysis (pp. 101-115). London, England: Sage.
Coleman, J. S., Katz, E., & Menzel, H. (1966). Mediated innovation: A diffusion study.
New York, NY: Bobbs-Merrill.
Cook, K. S., Molm, L. D., & Yamagishi, T. (1993). Exchange relations and exchange
networks: Recent developments in social exchange theory. In J. Berger & M.
Zelditch (Eds.), Theoretical research programs: Studies in the growth of theory
(pp. 296-322). Stanford, CA: Stanford University Press.
Cook, K. S., & Rice, E. (2003). Social exchange theory. In J. Delamater (Ed.), Handbook
of social psychology (pp. 53-76). New York, NY: Kluwer Academic/Plenum.
Texas Tech University, Nellie Hill, December 2013
128
Cox, A. (2005). What are communities of practice? A comparative review of four
seminal works. Journal of Information Science, 31(6), 527-540. doi:
10.1177/0165551505057016
Cropanzano, R., & Mitchell, M. S. (2005). Social exchange theory: An interdisciplinary
review. Journal of Management, 31(6), 874-900. doi:
10.1177/0149206305279602
Cross, R., Laseter, T., Parker, A., & Velasquez, G. (2006). Using social network analysis
to improve communities of practice. California Management Review, 49(1), 32-
60. doi: 10.2307/41166370
Cross, R., Parker, A., & Borgatti, S. P. (2002). A bird’s-eye view: Using social network
analysis to improve knowledge creation and sharing. Retrieved from IBM Global
Services website: http://www-
07.ibm.com/services/hk/strategy/pdf/a_birds_eye_view.pdf
DeVito, J. A. (2007). The interpersonal communication book (11th ed.). Boston, MA:
Pearson.
Doerfert, D. L. (Ed.) (2011). National research agenda: American Association for
Agricultural Education’s research priority areas for 2011-2015. Lubbock, TX:
Texas Tech University, Department of Agricultural Education and
Communications.
Ekeh, P. P. (1974). Social exchange theory: The two traditions. Cambridge, MA: Harvard
University Press.
Texas Tech University, Nellie Hill, December 2013
129
Emerson, R. M. (1972a). Exchange theory, part I: A psychological basis for social
exchange. In J. Berger, M. Zelditch Jr., & B. Anderson (Eds.), Sociological
theories in progress (pp. 38-57). Boston, MA: Houghton Mifflin.
Emerson, R. M. (1972b). Exchange theory, part II: Exchange relations and networks. In J.
Berger, M. Zelditch Jr., & B. Anderson (Eds.), Sociological theories in progress
(pp. 58-87). Boston, MA: Houghton Mifflin.
Emerson, R. M. (1976). Social exchange theory. Annual Review of Sociology, 2, 335-362.
doi: 10.1146/annurev.so.02.080176.002003
Emerson, R. M. (1987). Toward a theory of value in social exchange. In K. S. Cook
(Ed.), Social exchange theory (pp. 11-46). Newbury Park, CA: Sage.
Encyclopedia Britannica. (2013). High plains. Retrieved from
http://www.britannica.com/EBchecked/topic/265298/High-Plains
Everett, M. & Borgatti, S. R. (2000). Peripheries of cohesion subsets. Social Networks,
21(4), 397-407. doi: 10.1016/S0378-8733(99)00020-9
Festinger, L. (1950). Informal social communication. Psychological Review, 57(5), 271-
282. doi: 10.1037/h0056932
Festinger, L., (1954). A theory of social comparison processes. Human Relations, 7(2),
117-140. doi: 10.1177/001872675400700202
Fisher, B. A. (1978). Information systems theory and research: An overview. In B. D.
Ruben (Ed.), Communication yearbook 2 (pp. 263-275). New Brunswick, NJ:
Transaction Books.
Texas Tech University, Nellie Hill, December 2013
130
Flanagin, A. J., & Metzger, M. J. (2001). Internet use in the contemporary media
environment. Human Communication Research, 27(1), 153-181. doi:
10.1111/j.1468-2958.2001.tb00779.x
Foa, U. G., & Foa, E. B. (1974). Societal structures of the mind. Springfield, IL: Charles
C. Thomas.
Foa, U. G., & Foa, E. B. (1980). Resource theory: Interpersonal behavior as exchange. In
K. J. Gergen, M. S. Greenberg, & R. H. Willis (Eds.), Social exchange: Advances
in theory and research (pp. 77-94). New York, NY: Plenum.
Forsyth, D. R. (2000). Social comparison and influence in groups. In J. Suls & L.
Wheeler (Eds.), Handbook of social comparison: Theory and research (pp. 81-
103). New York, NY: Kluwer Academic/ Plenum.
Freeman, L. C. (2004). The development of social network analysis: A study in the
sociology of science. Vancouver, Canada: Empirical Press.
Freeman, L.C. (2011). The development of social network analysis. In J. Scott & P.
Carrington (Eds.), The sage handbook of social network analysis (pp. 26-39).
London, England: Sage.
Fujishin, R. (2012). Natural bridges: A guide to interpersonal communication. Boston,
MA: Pearson.
Gamon, J., Bounaga, L., & Miller, W. W. (1992). Identifying information sources and
educational methods for soil conservation information used by landowners of
highly erodible fields. Journal of Applied Communications, 76(1), 1-5.
Texas Tech University, Nellie Hill, December 2013
131
Gerard, H., & Orive, R. (1987). The dynamics of opinion formation. In L. Berkowitz
(Ed.), Advances in experimental social psychology, Vol. 20 (pp. 171-202). New
York, NY: Academy Press.
Giuffre, K. (2013). Communities and networks: Using social network analysis to rethink
urban and community studies. Cambridge, England: Polity Press.
Goethals, G. R., & Darley, J. (1977). Social comparison theory: An attributional
approach. In J. Suls & R. L. Miller (Eds.), Social comparison processes:
Theoretical and empirical perspectives (pp. 259-278). Washington, DC:
Hemisphere.
Goethals, G. R., & Klein, W. M. P., (2000). Interpreting and inventing social reality:
Attributional and constructive elements in social comparison. In J. Suls & L.
Wheeler (Eds.), Handbook of social comparison: Theory and research (pp. 23-
44). New York, NY: Kluwer Academic/ Plenum.
Granovetter, M. S. (1973). The strength of weak ties. American Journal of Sociology,
78(6): 1360-1380. doi: 10.1086/225469
Hansen, D. L., Schneiderman, B., & Smith, M. A. (2011). Analyzing social media
networks with NodeXL: Insights from a connected world. Burlington, MA:
Elsevier.
Hara, N. (2009). Communities of practice: Fostering peer-to-peer learning and informal
knowledge sharing in the work place. New York, NY: Springer.

Texas Tech University, Nellie Hill, December 2013
132
Haythornthwaite, C. (1996). Social network analysis: An approach and technique for the
study of information exchange. Library & Information Science Research. 18(4),
323-342. doi: S0740818896900031
Heath, R. L. & Bryant, J. (1992). Human communication theory and research: Concept,
context and challenges. Mahwah, NJ: Erlbaum.
Heath, R. L. & Bryant, J. (2000). Human communication theory and research: Concept,
context and challenges (2nd ed.). Mahwah, NJ: Erlbaum.
Heider, F. (1958). The psychology of interpersonal relations. New York, NY: Wiley.
Helgeson, V. S., & Mickelson, K. D. (1995). Motives for social comparison. Personality
and Social Psychology Bulletin, 21(11), 1200-1209. doi:
10.1177/01461672952111008
Homans, G. C. (1950). The human group. New York, NY: Harcourt Brace.
Homans, G. C. (1958). Social behavior as exchange. American Journal of Sociology,
63(6), 597-606. doi: 10.1086/222355
Homans, G. C. (1974). Social behavior and its elementary forms. New York, NY:
Harcourt, Brace, and World.
Huber, G. P., & Daft, R. L. (1987). The information environments of organizations. In F.
M. Jablin, L. L. Putnam, K. H. Roberts, & L. W. Porter (Eds.), Handbook of
organizational communication (pp. 130-164). Newbury Park, CA: Sage.
Huffaker, D. (2010). Dimensions of leadership and social influence in online
communities. Human Communication Research, 36(4), 593-617. doi:
10.1111/j.1468-2958.2010.01390.x
Texas Tech University, Nellie Hill, December 2013
133
Hyman, H. H. (1942). The psychology of status. New York, NY: Columbia University.
Hyman, H. H. (1960). Reflections on reference groups. Public Opinion Quarterly, 24(3),
383-396. doi: 10.1086/266959
Janssen, M. A., (2001). An exploratory integrated model to assess management of lake
eutrophication. Ecological Modeling, 140(1-2), 111-124. doi: 10.1016/S0304-
3800(01)00260-5
Jones, E. E., & Gerard, H. B. (1967). Foundations of social psychology. New York, NY:
John Wiley.
Jones, S. C., & Regan, D. (1974). Ability evaluation through social comparison. Journal
of Experimental Social Psychology, 10(2), 133-146. doi: 10.1016/0022-
1031(74)90062-6
Jussila, I., Goel, S., & Tuominen, P. (2012). Governance of co-operative organizations: A
social exchange perspective. Business and Management Research, 1(2), 14-25.
doi: 10.5430/bmr.v1n2p14
Kadushin, C. (2012). Understanding social networks: Theories, concepts, and findings.
New York, NY: Oxford University Press.
Kim, P. H. (2006). Organizing activities and founding processes of new ventures
(Doctoral dissertation). Retrieved from University of North Carolina Thesis and
Dissertations Collection.
Kincaid, D. L. (1979). The convergence model of communication. Paper 18. Honolulu:
East-West Communication Institute.
Texas Tech University, Nellie Hill, December 2013
134
Kincaid, D. L., & Schramm, W. L. (1975). Fundamental human communication: Module
text (Vol. 1). East-West Center, East-West Communication Institute.
Knoke, D. & Yang, S. (2008). Network analysis (2nd ed.). Thousand Oaks, CA: Sage.
Kulik, J. A., Mahler, H. I. M., & Earnest, A. (1994). Social comparison and affiliation
under threat: Going beyond the affiliate-choice paradigm. Journal of Personality
and Social Psychology, 66(2), 301-309. doi: 10.1037/0022-3514.66.2.301
Kulik, J. A., Mahler, H. I. M., & Moore, P. J. (1996). Social comparison and affiliation
under threat: Effects on recovery from major surgery. Journal of Personality and
Social Psychology, 71(5), 967-979. doi: 10.1037/0022-3514.71.5.967
Lasley, P., Padgitt, S., & Hanson, M. (2001). Telecommunication technology and its
implications for producers and Extension Services. Technology in Society, 23(1),
109-120. doi: 10.1016/S0160-791X(00)00039-7
Laumann, E. O., Marsden, P. V., & Prensky, D. (1983). The boundary specification
problem in network analysis. In R. S. Burt & M. J. Minor (Eds.), Applied network
analysis: A methodological introduction (pp. 18-34). Beverly Hills, CA: Sage.
Lave, J., & Wenger, E. (1991). Situated learning: Legitimate peripheral participation.
Cambridge, MA: University Press.
Lévi-Strauss, C. (1969). The elementary structures of kinship. Boston, MA: Beacon
Press.
Lewin, K., & Lippit, R. (1938). An experimental approach to the study of autocracy and
democracy: A preliminary note. Sociometry, 1(3/4), 292-200. doi:
10.2307/2785585
Texas Tech University, Nellie Hill, December 2013
135
Licht, M. A. R., & Martin, R. A. (2007). Agricultural issues of significance to Iowa crop
producers and their educational implications. Journal of Agricultural Education,
48(3), 57-66. doi: 10.5032/jae.2007.03057
Liden, R. C., Sparrowe, R. T., & Wayne, S. J. (1997). Leader-member exchange theory:
The past and potential for the future. In G. R. Ferris (Ed.) Research in personnel
and human resources management, Vol. 15 (pp. 47-119). Greenwich, CT: JAI.
Maddox, S. J., Mustian, R. D., & Jenkins, D. M. (2003, February). Agricultural
information preferences of North Carolina farmers. Paper presented at the
Southern Association of Agricultural Scientists Annual Meeting and Conference,
Mobile, AL. Abstract retrieved from
http://agnews.tamu.edu/saas/2003/maddox.htm
Malinowski, B. (1922). Argonauts of the Western Pacific: An account of native
enterprise and adventure in the archipelagoes of Melansian, New Guinea.
London, England: Routledge.
Malinowski, B. (1932). Crime and custom in savage society. London, England: Paul,
Trench, Trubner.
Marin, A., & Wellman, B. (2011). Social network analysis: An introduction. In J. Scott &
P. Carrington (Eds.), The Sage handbook of social network analysis (pp. 11-25).
London, England: Sage.
Texas Tech University, Nellie Hill, December 2013
136
Marsden, P. V. (1989). Methods for the characterization of role structures in network
analysis. In L. C. Freeman, D. R. White, and A. K. Romney (Eds.) Research
methods in social network analysis (pp. 489-530). Fairfax, VA: George Mason
University Press.
Marsden, P. V. (2011). Survey methods for network data. In J. Scott and P. Carrington
(Eds.) The Sage handbook of social network analysis (pp. 370-403). London,
England: Sage.
Martin, R. (2000). “Can I do X?”: Using the proxy comparison model to predict
performance. In J. Suls & L. Wheeler (Eds.), Handbook of social comparison:
Theory and research (pp. 67-80). New York, NY: Kluwer Academic/ Plenum.
Mauss, M. (1925). The gift: Forms and functions of exchange in archaic societies. New
York, NY: The Norton Library.
McArthur, R. & Bruza, P.(2003). Discover of implicit and explicit connections between
people using email utterance. In K. Kuutti, E. H. Karsten, G. Fitzpatrick, P.
Dourish, & K. Schmidt (Eds.), Proceedings of the Eighth European Conference
on Computer-Supported Cooperative Work. Retrieved from
http://www.ecscw.org/2003/002McArthur_ecscw03.pdf
McDermott, R. (1999). Learning across teams: The role of communities of practices in
team organizations. Knowledge Management Review, (8), 32-36. Retrieved from
http://www.mcdermottconsulting.com/index.php?option=com_publications&Item
id=57
Texas Tech University, Nellie Hill, December 2013
137
McDermott, R. (2004). How to avoid a mid-life crisis in your CoPs: Uncovering six keys
to sustaining communities. Knowledge Management Review, 7(2), 10-13.
Merriam-Webster. (n.d.). Typology. http://www.merriam-
webster.com/dictionary/typology.
Merton, R. K., & Kitt, A. (1950). Contributions to the theory of reference group behavior.
In R. K. Merton & P. F. Lazarfield (Eds.), Continuities in social research: Studies
in the scope and method of “The American Soldier” (pp. 40-105). Glencoe, IL:
Free Press.
Millen , D. R., & Fontaine, M. A. (2003, November). Improving individual and
organizational performance through communities of practice. In Group '03:
Proceedings of the 2003 international ACM SIGGROUP conference on
supporting group work (pp. 205-211). New York, NY: ACM.
Millen, D. R., Fontaine, M. A., & Muller, M. J. (2002). Understanding the benefit and
costs of communities of practice. Communications of the ACM, 45(4), 69-73. doi:
10.1145/505248.505276
Molm, L. D., Peterson, G., & Takahashi, N. (1999). Power in negotiated and reciprocal
exchange. American Sociological Review, 64(6), 876-890. doi: 10.2307/2657408
Monge, P. R., & Contractor, N. S. (2001). Emergence of communication networks. In F.
M. Jablin & L. L. Putnam (Eds.), The new handbook of organizational
communication: Advances in theory, research, and methods (pp. 440-502).
Thousand Oaks, CA: Sage.
Texas Tech University, Nellie Hill, December 2013
138
Monge, P. R., & Eisenberg, E. M. (1987). Emergent communication networks. In F. M.
Jablin, L. L. Putnam, K. H. Roberts, & L. W. Porter (Eds.), Handbook of
organizational communication: An interdisciplinary perspective (pp. 304-342).
Newbury, CA: Sage.
Moreno, J. L. (1932). Application of the group method to classification. New York, NY:
National Committee on Prisons and Prison Labor.
Moreno, J. L. (1934). Who shall survive? A new approach to the problem of human
interactions. Washington, DC: Nervous and Mental Disease.
Morgan, S. L. (2011). Social learning among organic farmers and the application of the
communities of practice framework. Journal of Agricultural Education and
Extension, 17(1), 99-112. doi: 10.1080/1389224X.2011.536362
National Research Council (1996). A new era for irrigation. Washington, DC: National
Academy Press.
Nohria, N. (1992). Introduction: Is a network perspective a useful way of studying
organizations? In N. Nohria & R. G. Eccles (Eds.), Networks and organizations:
Structure, form, and action (pp. 1-22). Boston, MA: Harvard Business School
Press.
Oreszczyn, S., & Lane, A. (2006, April). Farmer communities of practice and high tech
futures. In Plymouth Rural Futures Conference: The rural citizen: Governance,
culture and wellbeing in the 21st century. Symposium conducted at meeting of
University of Plymouth, Plymouth, England.
Texas Tech University, Nellie Hill, December 2013
139
Patton, M. Q. (2002). Qualitative research and evaluation methods. (3rd ed.) Thousand
Oaks, CA: Sage.
Probst, G., Raub, S., & Rombhardt, K. (1999). Managing knowledge: Building blocks for
success. Chichester, England: John Wiley & Sons.
Provalis Research. (2010). WordStat 6: Content analysis module for QDA Minder &
SimStat: User’s Guide. Montreal, Canada.
Radcliffe-Brown, A. R. (1940). On social structure. The Journal of the Royal
Anthrological Institute of Great Britain and Ireland, 70(1), 1-12. doi:
10.2307/2844197
Radcliffe-Brown, A. R. (1957). A natural science of society. Chicago, IL: University
Press.
Ramieriz-Sanchez, S. (2011). Who and how: Engaging well-connected fishers in social
networks to improve fisheries management and conservation. In Ö. Bodin & C.
Prell (Eds.), Social networks and natural resource management: Uncovering the
social fabric of environmental governance (pp. 119-146). New York, NY:
Cambridge University Press.
Richards, W. D. (1989). The NEGOPY analysis program. Unpublished manuscript,
Department of Communications, Simon Fraser University, Burnaby, Canada.
Richardson, J. G., & Mustian, R. D. (1994). Delivery methods preferred by targeted
Extension clientele for receiving specific information. Journal of Applied
Communications, 78(1), 22-32.
Texas Tech University, Nellie Hill, December 2013
140
Riesenberg, L. E., & Gor, C. O. (1989). Farmers’ preferences for methods of receiving
information on new or innovative farming practices. Journal of Agricultural
Education, 30(3), 7-13. doi: 10.5032/jae.1989.03007
Rogers, E. (2003). Diffusion of innovations (5th ed.). New York, NY: Free Press.
Rogers, E. M., & Kincaid, D. L. (1981). Communication networks: Toward a new
paradigm for research. New York, NY: Free Press.
Rousseau, D. M. (1995). Psychological contracts in organizations: Understanding
written and unwritten agreements. Thousand Oaks, CA: Sage.
Ryan, B., & Gross, N. C. (1943). The diffusion of hybrid seed corn in two Iowa
communities. Rural Sociology, 8(1), 15-24.
Scholz, J. T., & Wang, C. L. (2006). Cooptation or transformation? Local policy
networks and federal regulatory enforcement. American Journal of Political
Science, 50(1), 81-97. doi: 10.1111/j.1540-5907.2006.00171.x
Schutz, W. C. (1966). The interpersonal underworld. Palo Alto, CA: Science & Behavior
Books.
Scott, J. (2013). Social network analysis (3rd ed.). London, England: Sage.
Shannon, C., & Weaver, W. (1949). Mathematical theory of communication. Champaign,
IL: University Press.
Sherif, M. (1936). The psychology of social norms. New York, NY: Harper.
Smith, W. P., & Sachs, P. R. (1997). Social comparison and task prediction: Ability and
similarity and the use of a proxy. British Journal of Social Psychology, 36(4),
587-602. doi: 10.1111/j.2044-8309.1997.tb01151.x
Texas Tech University, Nellie Hill, December 2013
141
Stokman, F. N., Ziegler, R., and Scott, J. (1985). Networks of corporate power: A
comparative analysis of ten countries. Cambridge, England: Polity Press.
Suls, J. (2000). Opinion comparison: The role of the corroborator, expert, and proxy in
social influence. In J. Suls & L. Wheeler (Eds.), Handbook of social comparison:
Theory and research (pp. 105-122). New York, NY: Kluwer Academic/ Plenum.
Suls, J., & Wheeler, L. (2000). A selective history of classic and neo-social comparison
theory. In J. Suls & L. Wheeler (Eds.), Handbook of social comparison: Theory
and research, (pp. 3-19). New York, NY: Kluwer Academic/ Plenum.
Suvedi, M., Lapinski, M. K., & Campo, S. (2000). Producers’ perspectives of Michigan
State University Extension: Trends and lessons from 1996 and 1999. Journal of
Extension, 38(1). Retrieved from http://www.joe.org/index.php
Texas Alliance for Water Conservation. (n.d.a). Water is our future. Retrieved from
http://www.depts.ttu.edu/tawc/documents/Project%20Overview.pdf
Texas Alliance for Water Conservation. (n.d.b). When water determines your success:
Observed cotton, grain sorghum and grain corn fields in the Texas High Plains
2005-2011. Retrieved from
http://www.depts.ttu.edu/tawc/documents/Water_determines%20success.pdf
Texas Alliance for Water Conservation. (2011). About us. Retrieved from
http://www.depts.ttu.edu/tawc/aboutus.html
Texas Alliance for Water Conservation. (2013a). Texas Alliance for Water Conservation
project summary 2005-2012.
Texas Tech University, Nellie Hill, December 2013
142
Texas Alliance for Water Conservation. (2013b). 8th
annual report to the Texas Water
Development Board.
Thibaut, J. W., & Kelley, H. H. (1959). The social psychology of groups. New York, NY:
Wiley.
Tindall, D. B., Harshaw, H., & Taylor, J. M. (2011). The effects of social network ties on
the public’s satisfaction with forest management in British Columbia, Canada. In
Ö. Bodin & C. Prell (Eds.), Social networks and natural resource management:
Uncovering the social fabric of environmental governance (pp. 147-179). New
York, NY: Cambridge University Press.
Vergot III, P., Israel, G., & Mayo, D. E. (2005). Sources and channels of information
used by beef cattle producers in 12 counties of the Northwest Florida Extension
district. Journal of Extension, 43(2). Retrieved from http://www.joe.org/index.php
Vindigni, G., Janssen, M. A., & Jager, W. (2002). Organic food consumption: A multi-
theoretical framework of consumer decision making. British Food Journal,
104(8), 624-642. doi: 10.1108/00070700210425949
Warner, W. L., & Lunt, P. S. (1941). The social life of a modern community. New Haven,
CT: Yale University Press.
Wasko, M. M., & Faraj, S. (2005). Why should I share? Examining social capital and
knowledge contribution in electronic networks of practice. MIS Quarterly, 29(1),
35-57.
Wasserman, S., & Faust, K. (1994). Social network analysis: Methods and applications.
New York, NY: Cambridge University Press.
Texas Tech University, Nellie Hill, December 2013
143
Wellman, B. (2001). The persistence and transformation of community: From
neighborhood groups to social networks. Retrieved from
http://homes.chass.utoronto.ca/~wellman/publications/lawcomm/lawcomm7.PDF
Wenger, E. (1998). Communities of practice: Learning, meaning, and identity.
Cambridge, England: University Press.
Wenger, E., McDermott, R., & Snyder, W. M. (2002). Cultivating communities of
practice: A guide to managing knowledge. Boston, MA: Harvard Business School
Press.
Wenger, E. C., & Snyder, W. M. (2000, January). Communities of practice: The
organizational frontier. Harvard Business Review, 78(1), 139-146.
Westmyer, S. A., DiCioccio, R. L., & Rubin, R. B. (1998). Appropriateness and
effectiveness of communication channels in competent interpersonal
communication. Journal of Communication, 48(3), 27-48. doi: 10.1111/j.1460-
2466.1998.tb02758.x
Westphal, J. D., & Zajac, E. J. (1997). Defections from the inner circle: Social exchange,
reciprocity, and the diffusion of board independence in U.S. corporations.
Administrative Science Quarterly, 42(1), 161-183. doi: 10.2307/2393812
Wheeler, A. (2005). Policy alternatives for the southern Ogallala Aquifer: Economic and
hydrologic implications (Master's thesis). Retrieved from Texas Tech University
Theses and Dissertations Collection.

Texas Tech University, Nellie Hill, December 2013
144
Wheeler, L., Martin, R., & Suls, J. (1997). The proxy model of social comparison for
self-assessment of ability. Personality and Social Psychology Review, 1(1), 54-61.
doi: 10.1207/s15327957pspr0101_4
White, H. C., Boorman, S. A., and Breiger, R. L. (1976). Social structure from multiple
networks i: Blockmodels of roles and positions. American Journal of Sociology,
81(4), 730-781. doi: 10.1086/226141
Texas Tech University, Nellie Hill, December 2013
145
APPENDIX A
HUMAN RESEARCH PROTECTION PROGRAM APPROVAL LETTER
Rosemary Cogan, Ph.D., ABPPProtection of Human Subjects Committee
Box 41075 | Lubbock, Texas 79409-1075 | T 806.742.3905 | F 806.742.3947 | www.vpr.ttu.edu An EEO/Affirmative Action Institution
July 10, 2013
Dr. David Doerfert Ag Ed & Communications Mail Stop: 2131
Regarding: 504025 Social Network Analysis of Texas Alliance for Water Conservation Producers
Dr. David Doerfert:
The Texas Tech University Protection of Human Subjects Committee approved your claim for anexemption for the protocol referenced above on July 10, 2013.
Exempt research is not subject to continuing review. However, any modifications that (a) changethe research in a substantial way, (b) might change the basis for exemption, or (c) might introduceany additional risk to subjects must be reported to the Human Research Protection Program (HRPP) before they are implemented.
To report such changes, you must send a new claim for exemption or a proposal for expedited or full board review to the HRPP. Extension of exempt status for exempt protocols that have not changed is automatic.
The HRPP staff will send annual reminders that ask you to update the status of your researchprotocol. Once you have completed your research, you must inform the HRPP office by responding to the annual reminder so that the protocol file can be closed.
Sincerely,
Texas Tech University, Nellie Hill, December 2013
146
APPENDIX B
TAWC PRODUCER TELEPHONE SCRIPT
Hello, may I please speak with (name of TAWC producer)?
This is Nellie Hill, a master’s graduate student in the Department of Agricultural
Education and Communication at Texas Tech University. Dr. David Doerfert has asked
me to contact you about conducting an interview regarding your involvement with the
TAWC Demonstration Project. We are speaking with each producer involved in the
project for our annual TAWC report and for further research. Your name will not be
reported in the report or further research.
I would like to schedule a meeting with you at a time and place of your choosing to talk
about your experiences with the project and your operation.
Would you be willing to meet with me for this discussion?
If yes:
When is a good time within the next couple of weeks for you to meet with me?
Where would you like to meet?
Proceed with script.
If no:
Proceed with script.
Thank you for your time and consideration. Information collected will help the TAWC
better serve producers and aid in water conservation practices.
If you have questions about the interview or the TAWC Demonstration Project, you can
contact my major professor, Dr. David Doerfert at [email protected] or call (806)
742-2816. Thank you again.
Goodbye.
Texas Tech University, Nellie Hill, December 2013
147
APPENDIX C
TAWC PRODUCER INFORMATION SHEET
Please share your thoughts in our research project.
What is this project studying?
The intention of this project is to describe the characteristics of TAWC producers and
gain a better understanding of the relationships among them. We want to find out how
producers share information related to water management.
What would I do if I participate?
To participate in this study, you will agree to be interviewed. During the interview, you
will be asked questions related to your participation in the TAWC Demonstration Project.
How will I benefit from participating?
You will be contributing to the study with valuable information and insights.
Furthermore, the results of this study will help TAWC members better understand how to
successfully communicate and share information with producers.
Can I quit if I become uncomfortable?
Yes, absolutely. Your participation is completely voluntary. Dr. Doerfert and the
Human Resource Protection Program have reviewed the interview questions and think
can comfortably answer them. You may also skip questions or stop answering questions
altogether at any time. You are free to stop the interview at any time. Participating is
your choice.
How long will participation take?
We are asking for 20-30 minutes of your time.
How are you protecting privacy?
You will remain anonymous. Your name will be changed for data analysis and reporting.
I have some questions about this study. Who can I ask?
This study is being conducted by Nellie Hill under the supervision of Dr. David Doerfert
from the Department of Agricultural Education & Communications at Texas Tech
University. If you have questions, you can call him at 806-742-2816 or email him at
[email protected]. TTU also has a Board that protects the rights of people who
participate. You can call to ask them questions at 806-742-2064. You can mail your
questions to the Human Research Protection Program, Office of the Vice President for
Research, Texas Tech University, Lubbock, Texas 79409, or you can email your
questions to www.hrpp.ttu.edu.

Texas Tech University, Nellie Hill, December 2013
148
APPENDIX D
TAWC PRODUCER INTERVIEW INSTRUMENT
Thank you for meeting with me today. As we discussed on the phone, I’m interviewing
all of the producers in the TAWC Demonstration Project about their experiences. I am
going to record our discussion. Your name will not be associated with any information
reported in the annual report or further research. We will assign you a pseudo name, so
all of your responses will remain confidential. If there is a question you prefer not to
answer, please just say so.
1. How old are you?
2. When did you become involved in the TAWC project?
3. What interested you in becoming a part of it?
4. Who did you speak to, to get involved with the TAWC project?
5. What did they tell you about the project?
6. Why did you choose the particular fields that you have in the project?
7. What technologies have you implemented on these fields during your time with
the project?
8. Have you implemented any technologies from the project on any of your other
fields?
9. What have you learned as a result of being involved in the project, based on your
individual field site(s)?
10. How do you decide on the changes that you make within your operation?
11. Do you use the annual TAWC reports that are published each year? If yes, how
do you use them?

Texas Tech University, Nellie Hill, December 2013
149
12. Do you use a crop consultant as part of your operation? If yes, what services do
they provide for you?
13. Who do you go to for information or advice related to your farm operation?
Could you please share the names of at least three people? We will not use their
real names in our final report.
14. Who are the people that come to you for information or advice about farming?
Could you please share the names of at least three people? We will not use their
real names in our final report.
15. What have been the major advantages to your operation from this project? What
have you gained?
16. Have you experienced frustrations with the project? What should have been done
differently?
17. Going forward, five years from now, what should the project be doing? Is there
anything that you have heard about that we haven’t tested yet that you think the
project should try?