Embed Size (px)
Citation preview
INTERNATIONAL JOURNAL OF SCIENTIFIC PROGRESS AND RESEARCH (IJSPR) ISSN: 2349-4689
Issue 132, Volume 45, Number 04, March 2018
doi - 10.46338/IJSPR224 IJSPR | 223
Abstract - Global terrorist activities with different Instagram,
Facebook, etc., are on the rise. Different organizations use
various social media network resources to distribute
information and propaganda and communicate their strategic
goals. So, by analyzing such growing terrorist activity over
Online social media using mining and analysis, various
valuable insights can be predicted. This paper approaches an
effective way of analyzing such activities by identifying the
nearest nodes in the network. The terrorist network mining
algorithm has assisted by successfully achieving terrorist
activities and their behaviour on nodes of Social networks using
the Centrality algorithm. The algorithm works in three phases
1) Fuzzification of data to measure centrality between nodes in
the network 2) Applying a Community detection approach to
optimize data and increase the searching capability for
appropriate cluster centers. 3) Finally, applied fuzzy centrality
to determine the potential node(s). For the effective
optimization of terrorist networks in the terrorist nodes, a
centrality measure based on node network is suitable, which can
be achieved using the Fuzzy approach. During optimization,
non-terrorist nodes are removed from the network, and only the
optimized graph containing possible nodes is reduced by
performance.The Experimental results are performed on the
9/11 hijackers dataset, and the approach successfully
measuresdegree, betweenness and closeness centrality, and page
ranks, so is the performance in measuring such activities on the
static network.
Keywords: Social Network Analysis(SNA), Social network
location based mining , analysis of social media , Terrorist
Network, Centrality Measures, 9/11hijacking (Dataset),
community detection algorithm, Fuzzy Logic,and Centrality.
I. INTRODUCTION
Terrorism is an extremely complex worldwide issue,
includingthe social economy, governmental issues, society,
etc. A few fear-monger occurrences have happened, for
instance, 9/11 capturing and Terrorist Attack as of late,
which not just purpose awful effect on the global group's
adjacency issues and security, yet also bring results harm
and to calamity to the general population and the nation.
These occasions have propelled the investigation of fear-
based oppressor systems. Furthermore, a considerable
measure of researchers regards militant psychological
associations as fear monger arranges to look. They
generally concentrate on psychological oppressors' conduct
to choose the pioneers, guardians, or colleagues. The
informal organization is an extremely convoluted
framework, including numerous relational connections, for
example, blood relationship, promoting relationship,
companion relationship, business relationship et cetera.
The informal organisation is the arrangement of social
performing artists and the connection between many
eachother. The main purpose of social system surveys is to
outline, determine the link between individuals, collections
and associations or other data, to process materials and
dismantle the effect on associations.Psychological
oppressors organize a unique sort of informal organization
with an accentuation on both mystery and productivity. A
psychological appraiser organization is demonstrated as a
general informal organization comprising hubs and
connections between performing artists. The nodes speak
to individuals, gatherings, and associations, while the
connections demonstrate the relationship included family,
companions, relatives and partners and so on. In this
research project, we use information from the 9/11 hijacker
and consider whether or not there is a rim between hubs.
We use contiguous grids to achieve a few results. Social
Network Analysis (SNA) systems and diagram assumption
can be used to identify the system's entry hubs, which help
organize destabilization objectives and reduce the system's
efficiency and power. In the recent past, more and more
researchers are thinking about the focus person in a system
and who is the key to managing the whole action in an
organized fear-based oppressor. Specialists and
researchers, therefore, take careful account of the centrality
of the systems.
In this paper we study a static network. Existing tools
Application for discovering certain information is mainly
SNA on the static network. We create a graph based on
composed data; social network analysis mainly examines
the following key challenges.
• Individual vital, event, organization.
• The connection between each node.
• Identification of leaders.
• Nearness of the node.
• Network vulnerabilities.
• The network's central actor.
Effectiveness of n/w and network defence.SNA is the
utilization of the system hypothesis to interpersonal;
organization breaks down as far as social contacts. It
A Social Media Approach to Determine The
Potential Nodes in The Terrorist Social Network Amit Kumar Mishra1, Nisheeth Joshi2, Iti Mathur3
Computer Science & Engineering, Banasthali Vidyapeeth University, Tonk-304022, Rajasthan, India
INTERNATIONAL JOURNAL OF SCIENTIFIC PROGRESS AND RESEARCH (IJSPR) ISSN: 2349-4689
Issue 132, Volume 45, Number 04, March 2018
doi - 10.46338/IJSPR224 IJSPR | 224
contains hubs in the system of connections between the
hubs. Social connections powerfully are as genuine
disconnected I organizations or are informal online
communities. Several SNA measures are utilized for an
idiom to collaborate among performers, identifying key
players and subgroups, discovering topology, and the
quality of a system. As of late,SNA has given training in
diverse areas. It is connected to Information Science,
Political Science, Biology, Business Analysis, Economics,
Communication Studies, and Intelligence
Analysis.Concentrated on the opinion of SNA on counter-
terrorism, which became popular straight after 9/11
aggression, SNA has the aim of the insights and law-
making organizations to take on the structure of the
psychological systems of conflict and to take procedures to
deceive them by observing examples which pioneers and
covered the criminal systems. A natural part of SNA in
counter-terrorism is key player detection, node discovery,
complex network analysis etc.[1].
1.1 Social Network Analysis (SNA) and Measures
Social network research and measures have been
developed considerably longer for informal organizations
to examine key players in terms of identification and
design, the discovery of hub and link revealing etc.
Centrality is usually taken into account in analysing
informal organizations for key actors distinguishing
facts.Three different natural ideas of centrality, suggested
by Freeman, are used to enter players recognized in the
interpersonal organization. Centrality suggested the degree
to look at the graduation hub's relative value, often used to
describe the hub's effect on the neighbouring nodes. Their
work has expanded the degree of centrality, proximity, and
openness to meetings, classes, and individuals. UCINET is
a system that discharges informal organizational
knowledge from Everett and with only a few standard SNA
centrality steps implied for analysis. Borgatti's suggestion
is a typology of n/w streams based on various
measurements. Everett read about informal societies with
negative links, for example. Disdain and suggested a
centrality test, PN centrality for both positive and negative
links[2].
1.2 Analysis of the terrorist network
For examining the militant psychological system, the
system finds from the web by utilizing methodologies, for
example, the content-construct discovery of fear-based
oppressors concerning the web. At whatever point a fear-
based oppressor organization is recognized, the system
persuasive parts and the system pecking order are revealed
utilizing an Investigative Data Mining plan.One solution to
oppressors' psychological operation on the Internet is to
spy on all web destinations associated with fear-based
oppressing connections to differentiate between customers
in the light of their IP address[3]. The arrangement was
hardly any persuading as these clients don't utilize settled
IP locations or URLs. Thus the law authorization
organizations endeavoured to distinguish the psychological
militants by observing all ISPs movement. After activity
examination, the system is preparatory contemplated
utilizing Social Network Analysis (SNA) drawing nearer.
The recognized fear monger organizes then concentrated
on evaluating good parts.Every customer is investigated in
the framework, and the core steps are decided separately
for each center. Primary centrality indicators include
grades (number of direct connections a hub has),
intervention (the central role of an individual in connection
with strong voting demographics), and proximity[4].
1.3 Destabilization of the Terrorist Network
In order to understand the dynamics of N/W and the
network, we needed to get the basic processes that the
networks can create. As a consequence, terrorist n/w
functions are discovered, and destabilization is achieved.
They are destabilizing active roles within the network. This
is generally due to an understanding of networking's
efficacy with nodes and extreme network components, the
" Position Role Index" (PRI), and the central dependence.
• Network reliability, which explains how qualified
information is shared through the network nodes.
• Vital network elements for measurement centrality
discovery of a node.
• When a node of this sort is disabled from the network,
n/w effectiveness is calculated.
• PRI (Position Function Index) is also recognized and
shows a strong distinction between gatekeepers and is
based on network performance.
• Dependence Center for detecting node reliance on other
network nodes
II. SNA COUNTER-TERRORISM TOOLS AND
STRATEGIES
A social network is a development that comprises a
collection of nodes and links between these nodes. These
can be offline in nature and online. Social networks,
mainly insocial networking sites, allow users to connect to
other users by sending messages, publishing information,
videos, likes, and notes. On the other hand, social networks
are offline, are real-life, social networks generated by
relationships, contact, events, etc.
2.1 Data Collection Methods
Social network data collection involves extracting formal
and informal information, users, networks, and pages that
contain messages, posts, views, opinions, photos, visuals,
and so on. APIs and methods can be derived from a variety
of data in the social network. YouTube and many others.
INTERNATIONAL JOURNAL OF SCIENTIFIC PROGRESS AND RESEARCH (IJSPR) ISSN: 2349-4689
Issue 132, Volume 45, Number 04, March 2018
doi - 10.46338/IJSPR224 IJSPR | 225
NodeXL, SNA, UCINET6 are methods used to collect data
from social networks and analyze most criminal and
terrorist activity using social networks online [5].
2.1.1UCINET Tool
Notational Conventions - UCINET is a menu-driven
Windows program. This implies you pick what you need to
do by choosing things from a menu. Menus might be
settled, so picking a thing from a menu may call up a
submenu with extra decisions, which may call up a
submenu of their own. Thus, to get to specific decisions,
you may need to choose through various menus en route.
To speak to the alternatives you should take for a given
decision, we utilize edge sections. To reword an old
melody (and turn around the significance), UCINET 6.0 is
working for speed, not comfort. Frequently amid the
programming of UCINET, we needed to pick between
utilizing a quick calculation that utilized a great deal of
memory (and in this way lessened the most extreme size of
the system it could deal with) and a moderate calculation
that spared memory and could deal with substantially
bigger data sets. This product contains a bundle of
programming pajek, net draw. Some highlights of this
product are: Clustering coefficient, ascertaining the factual
measure, computing clicks, figuring confusion - numerous
modes and collaboration of the charts, making symmetric
lattice, representation by utilizing Net programming draw
and E-Net, including Excel manager, network and content.
The product arranges h##. The motivation behind making
this product is for understudy and business looks into, and
is presented 2006 [6].
2.1.2 SNA Tool
Social Network Analysis (SNA) has become a research
technique and social process using networks and diagrams'
hypotheses. It depicts organized systems and nodes
(individual performers, individuals, or objects in the
system) and their relations, boundaries, or related
interactions (connections or cooperation). Social structure
cases are routinely deemed to include web-based social
networking systems, images distributed, companionships
and related systems, collective effort diagrams,
connections, sickness transmission, and sexual connections
through informal organizational analysis.
III. CENTRALITY
Social network analysis is usually objective to identify and
describe the node aspirant rules in the network. Each node
is evaluated for the other nodes. Core steps and priorities
related to the cracking importance of the network nodes. In
order to do this, the centrality of the node explains how
other nodes in the network are linked to the node through
direct or undirected relationships. There are various central
steps to control a Node's objective in n/w, considering
connections, various aspects of the central calculation n/w
nodes.
Centrality is the network characteristics that have often
been allowed to teach the actors involved in terrorist social
networks. The highest centrality behaviour in this
circumstance is centrality and centrality of proximity, the
centrality of focus, and page rank. The Section below
presents common core events and a particular measurement
centrality, which we refer to as closeness central.
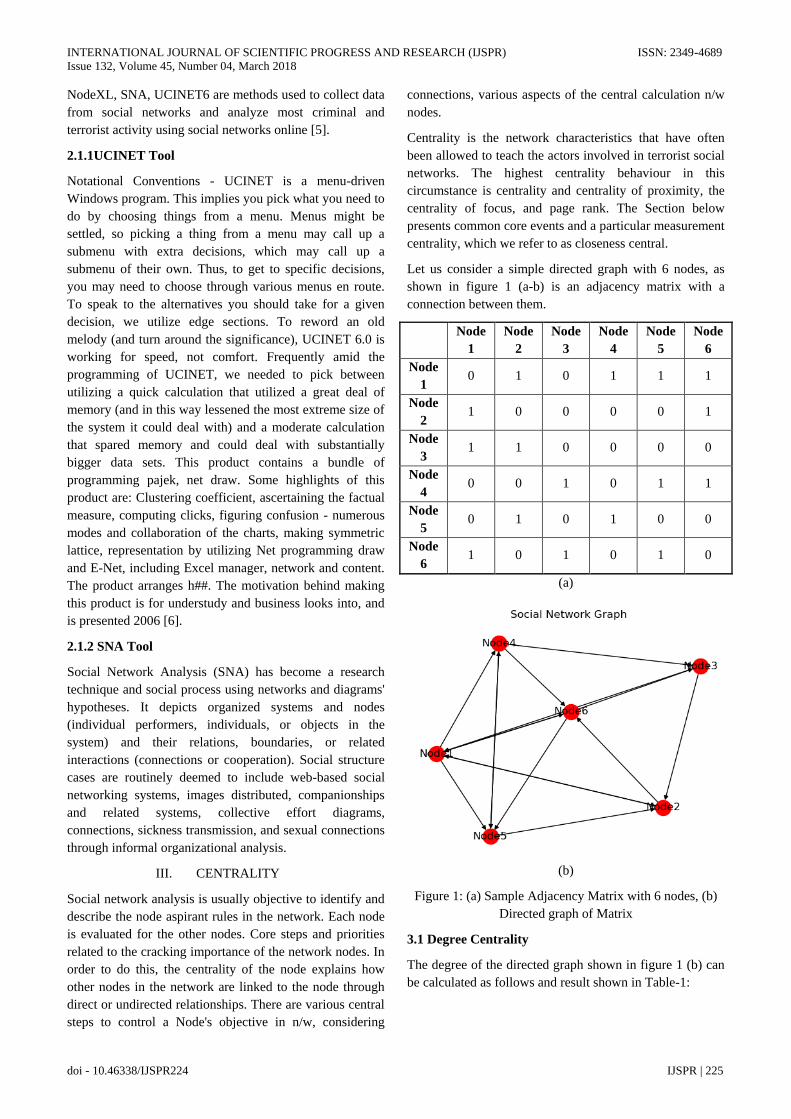
Let us consider a simple directed graph with 6 nodes, as
shown in figure 1 (a-b) is an adjacency matrix with a
connection between them.
Node
1
Node
2
Node
3
Node
4
Node
5
Node
6
Node
1 0 1 0 1 1 1
Node
2 1 0 0 0 0 1
Node
3 1 1 0 0 0 0
Node
4 0 0 1 0 1 1
Node
5 0 1 0 1 0 0
Node
6 1 0 1 0 1 0
(a)
(b)
Figure 1: (a) Sample Adjacency Matrix with 6 nodes, (b)
Directed graph of Matrix
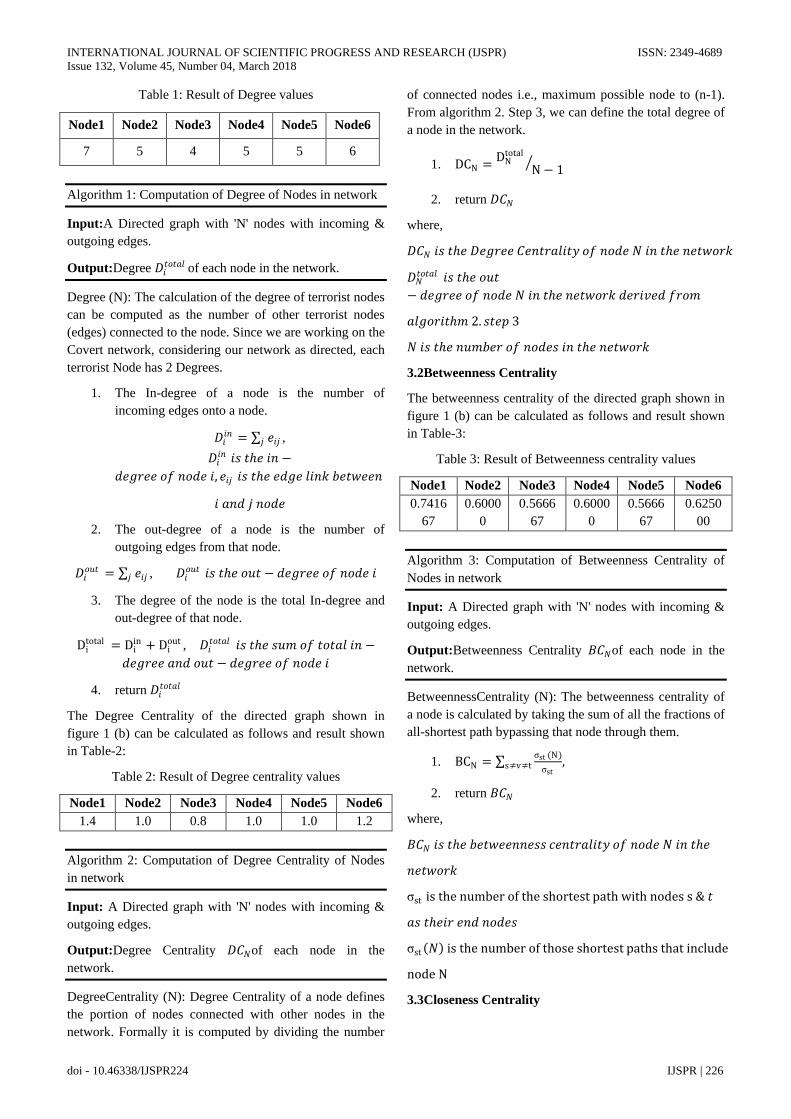
3.1 Degree Centrality
The degree of the directed graph shown in figure 1 (b) can
be calculated as follows and result shown in Table-1:
INTERNATIONAL JOURNAL OF SCIENTIFIC PROGRESS AND RESEARCH (IJSPR) ISSN: 2349-4689
Issue 132, Volume 45, Number 04, March 2018
doi - 10.46338/IJSPR224 IJSPR | 226
Table 1: Result of Degree values
Node1 Node2 Node3 Node4 Node5 Node6
7 5 4 5 5 6
Algorithm 1: Computation of Degree of Nodes in network
Input:A Directed graph with 'N' nodes with incoming &
outgoing edges.
Output:Degree 𝐷𝑖𝑡𝑜𝑡𝑎𝑙 of each node in the network.
Degree (N): The calculation of the degree of terrorist nodes
can be computed as the number of other terrorist nodes
(edges) connected to the node. Since we are working on the
Covert network, considering our network as directed, each
terrorist Node has 2 Degrees.
1. The In-degree of a node is the number of
incoming edges onto a node.
𝐷𝑖𝑖𝑛 = 𝑒𝑖𝑗𝑗 ,
𝐷𝑖𝑖𝑛 𝑖𝑠 𝑡𝑒 𝑖𝑛 −
𝑑𝑒𝑔𝑟𝑒𝑒 𝑜𝑓 𝑛𝑜𝑑𝑒 𝑖, 𝑒𝑖𝑗 𝑖𝑠 𝑡𝑒 𝑒𝑑𝑔𝑒 𝑙𝑖𝑛𝑘 𝑏𝑒𝑡𝑤𝑒𝑒𝑛
𝑖 𝑎𝑛𝑑 𝑗 𝑛𝑜𝑑𝑒
2. The out-degree of a node is the number of
outgoing edges from that node.
𝐷𝑖𝑜𝑢𝑡 = 𝑒𝑖𝑗𝑗 , 𝐷𝑖
𝑜𝑢𝑡 𝑖𝑠 𝑡𝑒 𝑜𝑢𝑡 − 𝑑𝑒𝑔𝑟𝑒𝑒 𝑜𝑓 𝑛𝑜𝑑𝑒 𝑖
3. The degree of the node is the total In-degree and
out-degree of that node.
Ditotal = Di
in + Diout , 𝐷𝑖
𝑡𝑜𝑡𝑎𝑙 𝑖𝑠 𝑡𝑒 𝑠𝑢𝑚 𝑜𝑓 𝑡𝑜𝑡𝑎𝑙 𝑖𝑛 −
𝑑𝑒𝑔𝑟𝑒𝑒 𝑎𝑛𝑑 𝑜𝑢𝑡 − 𝑑𝑒𝑔𝑟𝑒𝑒 𝑜𝑓 𝑛𝑜𝑑𝑒 𝑖
4. return 𝐷𝑖𝑡𝑜𝑡𝑎𝑙
The Degree Centrality of the directed graph shown in
figure 1 (b) can be calculated as follows and result shown
in Table-2:
Table 2: Result of Degree centrality values
Node1 Node2 Node3 Node4 Node5 Node6
1.4 1.0 0.8 1.0 1.0 1.2
Algorithm 2: Computation of Degree Centrality of Nodes
in network
Input: A Directed graph with 'N' nodes with incoming &
outgoing edges.
Output:Degree Centrality 𝐷𝐶𝑁of each node in the
network.
DegreeCentrality (N): Degree Centrality of a node defines
the portion of nodes connected with other nodes in the
network. Formally it is computed by dividing the number
of connected nodes i.e., maximum possible node to (n-1).
From algorithm 2. Step 3, we can define the total degree of
a node in the network.
1. DCN =DN
total
N − 1
2. return 𝐷𝐶𝑁
where,
𝐷𝐶𝑁 𝑖𝑠 𝑡𝑒 𝐷𝑒𝑔𝑟𝑒𝑒 𝐶𝑒𝑛𝑡𝑟𝑎𝑙𝑖𝑡𝑦 𝑜𝑓 𝑛𝑜𝑑𝑒 𝑁 𝑖𝑛 𝑡𝑒 𝑛𝑒𝑡𝑤𝑜𝑟𝑘
𝐷𝑁𝑡𝑜𝑡𝑎𝑙 𝑖𝑠 𝑡𝑒 𝑜𝑢𝑡
− 𝑑𝑒𝑔𝑟𝑒𝑒 𝑜𝑓 𝑛𝑜𝑑𝑒 𝑁 𝑖𝑛 𝑡𝑒 𝑛𝑒𝑡𝑤𝑜𝑟𝑘 𝑑𝑒𝑟𝑖𝑣𝑒𝑑 𝑓𝑟𝑜𝑚
𝑎𝑙𝑔𝑜𝑟𝑖𝑡𝑚 2. 𝑠𝑡𝑒𝑝 3
𝑁 𝑖𝑠 𝑡𝑒 𝑛𝑢𝑚𝑏𝑒𝑟 𝑜𝑓 𝑛𝑜𝑑𝑒𝑠 𝑖𝑛 𝑡𝑒 𝑛𝑒𝑡𝑤𝑜𝑟𝑘
3.2Betweenness Centrality
The betweenness centrality of the directed graph shown in
figure 1 (b) can be calculated as follows and result shown
in Table-3:
Table 3: Result of Betweenness centrality values
Node1 Node2 Node3 Node4 Node5 Node6
0.7416
67
0.6000
0
0.5666
67
0.6000
0
0.5666
67
0.6250
00
Algorithm 3: Computation of Betweenness Centrality of
Nodes in network
Input: A Directed graph with 'N' nodes with incoming &
outgoing edges.
Output:Betweenness Centrality 𝐵𝐶𝑁of each node in the
network.
BetweennessCentrality (N): The betweenness centrality of
a node is calculated by taking the sum of all the fractions of
all-shortest path bypassing that node through them.
1. BCN = σst (N)
σsts≠v≠t ,
2. return 𝐵𝐶𝑁
where,
𝐵𝐶𝑁 𝑖𝑠 𝑡𝑒 𝑏𝑒𝑡𝑤𝑒𝑒𝑛𝑛𝑒𝑠𝑠 𝑐𝑒𝑛𝑡𝑟𝑎𝑙𝑖𝑡𝑦 𝑜𝑓 𝑛𝑜𝑑𝑒 𝑁 𝑖𝑛 𝑡𝑒
𝑛𝑒𝑡𝑤𝑜𝑟𝑘
σst is the number of the shortest path with nodes s & 𝑡
𝑎𝑠 𝑡𝑒𝑖𝑟 𝑒𝑛𝑑 𝑛𝑜𝑑𝑒𝑠
σst 𝑁 is the number of those shortest paths that include
node N
3.3Closeness Centrality
INTERNATIONAL JOURNAL OF SCIENTIFIC PROGRESS AND RESEARCH (IJSPR) ISSN: 2349-4689
Issue 132, Volume 45, Number 04, March 2018
doi - 10.46338/IJSPR224 IJSPR | 227
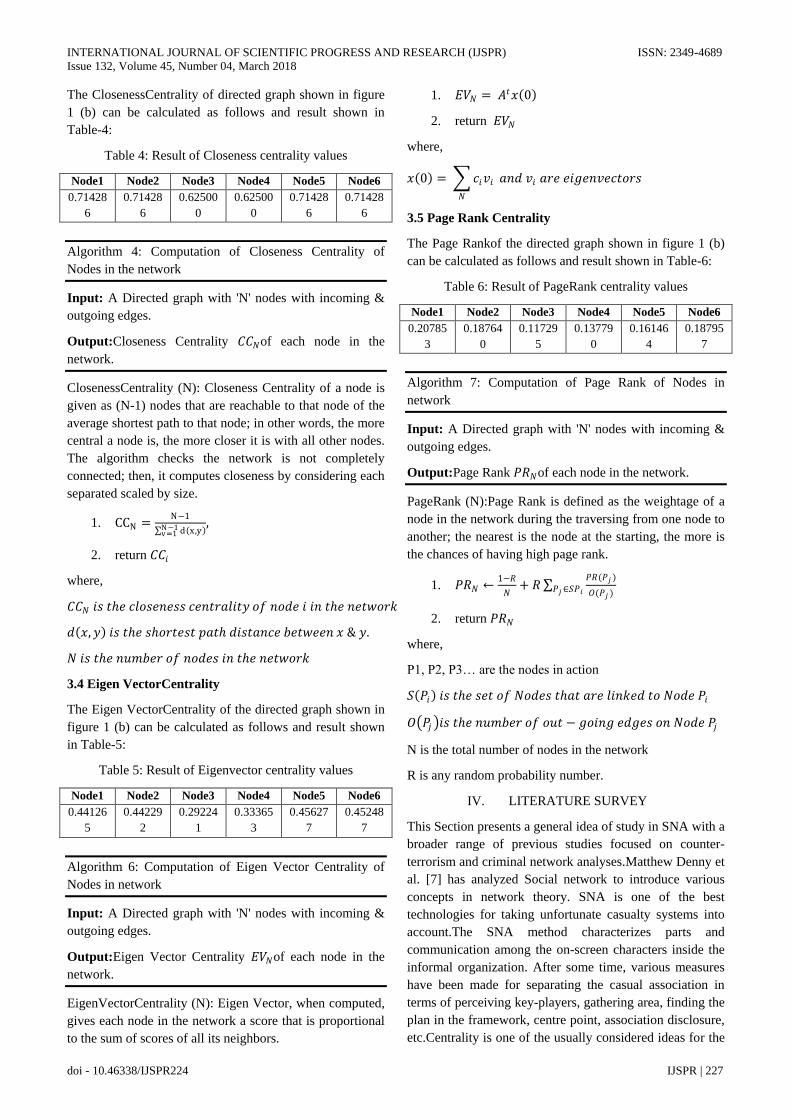
The ClosenessCentrality of directed graph shown in figure
1 (b) can be calculated as follows and result shown in
Table-4:
Table 4: Result of Closeness centrality values
Node1 Node2 Node3 Node4 Node5 Node6
0.71428
6
0.71428
6
0.62500
0
0.62500
0
0.71428
6
0.71428
6
Algorithm 4: Computation of Closeness Centrality of
Nodes in the network
Input: A Directed graph with 'N' nodes with incoming &
outgoing edges.
Output:Closeness Centrality 𝐶𝐶𝑁of each node in the
network.
ClosenessCentrality (N): Closeness Centrality of a node is
given as (N-1) nodes that are reachable to that node of the
average shortest path to that node; in other words, the more
central a node is, the more closer it is with all other nodes.
The algorithm checks the network is not completely
connected; then, it computes closeness by considering each
separated scaled by size.
1. CCN =N−1
d x,y N−1v =1
,
2. return 𝐶𝐶𝑖
where,
𝐶𝐶𝑁 𝑖𝑠 𝑡𝑒 𝑐𝑙𝑜𝑠𝑒𝑛𝑒𝑠𝑠 𝑐𝑒𝑛𝑡𝑟𝑎𝑙𝑖𝑡𝑦 𝑜𝑓 𝑛𝑜𝑑𝑒 𝑖 𝑖𝑛 𝑡𝑒 𝑛𝑒𝑡𝑤𝑜𝑟𝑘
𝑑 𝑥, 𝑦 𝑖𝑠 𝑡𝑒 𝑠𝑜𝑟𝑡𝑒𝑠𝑡 𝑝𝑎𝑡 𝑑𝑖𝑠𝑡𝑎𝑛𝑐𝑒 𝑏𝑒𝑡𝑤𝑒𝑒𝑛 𝑥 & 𝑦.
𝑁 𝑖𝑠 𝑡𝑒 𝑛𝑢𝑚𝑏𝑒𝑟 𝑜𝑓 𝑛𝑜𝑑𝑒𝑠 𝑖𝑛 𝑡𝑒 𝑛𝑒𝑡𝑤𝑜𝑟𝑘
3.4 Eigen VectorCentrality
The Eigen VectorCentrality of the directed graph shown in
figure 1 (b) can be calculated as follows and result shown
in Table-5:
Table 5: Result of Eigenvector centrality values
Node1 Node2 Node3 Node4 Node5 Node6
0.44126
5
0.44229
2
0.29224
1
0.33365
3
0.45627
7
0.45248
7
Algorithm 6: Computation of Eigen Vector Centrality of
Nodes in network
Input: A Directed graph with 'N' nodes with incoming &
outgoing edges.
Output:Eigen Vector Centrality 𝐸𝑉𝑁of each node in the
network.
EigenVectorCentrality (N): Eigen Vector, when computed,
gives each node in the network a score that is proportional
to the sum of scores of all its neighbors.
1. 𝐸𝑉𝑁 = 𝐴𝑡𝑥 0
2. return 𝐸𝑉𝑁
where,
𝑥 0 = 𝑐𝑖𝑣𝑖
𝑁
𝑎𝑛𝑑 𝑣𝑖 𝑎𝑟𝑒 𝑒𝑖𝑔𝑒𝑛𝑣𝑒𝑐𝑡𝑜𝑟𝑠
3.5 Page Rank Centrality
The Page Rankof the directed graph shown in figure 1 (b)
can be calculated as follows and result shown in Table-6:
Table 6: Result of PageRank centrality values
Node1 Node2 Node3 Node4 Node5 Node6
0.20785
3
0.18764
0
0.11729
5
0.13779
0
0.16146
4
0.18795
7
Algorithm 7: Computation of Page Rank of Nodes in
network
Input: A Directed graph with 'N' nodes with incoming &
outgoing edges.
Output:Page Rank 𝑃𝑅𝑁of each node in the network.
PageRank (N):Page Rank is defined as the weightage of a
node in the network during the traversing from one node to
another; the nearest is the node at the starting, the more is
the chances of having high page rank.
1. 𝑃𝑅𝑁 ←1−𝑅
𝑁+ 𝑅
𝑃𝑅(𝑃𝑗 )
𝑂(𝑃𝑗 )𝑃𝑗∈𝑆𝑃𝑖
2. return 𝑃𝑅𝑁
where,
P1, P2, P3… are the nodes in action
𝑆 𝑃𝑖 𝑖𝑠 𝑡𝑒 𝑠𝑒𝑡 𝑜𝑓 𝑁𝑜𝑑𝑒𝑠 𝑡𝑎𝑡 𝑎𝑟𝑒 𝑙𝑖𝑛𝑘𝑒𝑑 𝑡𝑜 𝑁𝑜𝑑𝑒 𝑃𝑖
𝑂 𝑃𝑗 𝑖𝑠 𝑡𝑒 𝑛𝑢𝑚𝑏𝑒𝑟 𝑜𝑓 𝑜𝑢𝑡 − 𝑔𝑜𝑖𝑛𝑔 𝑒𝑑𝑔𝑒𝑠 𝑜𝑛 𝑁𝑜𝑑𝑒 𝑃𝑗
N is the total number of nodes in the network
R is any random probability number.
IV. LITERATURE SURVEY
This Section presents a general idea of study in SNA with a
broader range of previous studies focused on counter-
terrorism and criminal network analyses.Matthew Denny et
al. [7] has analyzed Social network to introduce various
concepts in network theory. SNA is one of the best
technologies for taking unfortunate casualty systems into
account.The SNA method characterizes parts and
communication among the on-screen characters inside the
informal organization. After some time, various measures
have been made for separating the casual association in
terms of perceiving key-players, gathering area, finding the
plan in the framework, centre point, association disclosure,
etc.Centrality is one of the usually considered ideas for the
INTERNATIONAL JOURNAL OF SCIENTIFIC PROGRESS AND RESEARCH (IJSPR) ISSN: 2349-4689
Issue 132, Volume 45, Number 04, March 2018
doi - 10.46338/IJSPR224 IJSPR | 228
identification of key players in casual association exams. A
few centrality measures were developed, including degree,
proximity, knowledge centrality, entwinning[8]. Centrality
metrics and clustering algorithms are used for the structural
study of Brazilian science researchers from educational
establishments.
Felipe Grando et al. [9] measures some of the complex
networks by analyzing the networks' vertex centrality. The
analysis measures vertex centrality based on information
and subgraphs and eigenvector and gives granularity
performance at about 95%. Also, the analysis of Socio-
spatial data by considering network as bimodal for the user
performance at distributed events. The main focus of the
participants by the measure of matching preference and
reality [10]. There are various computational methods used
for the analysis of social networks, such as search
algorithms. A depth-first search algorithm is used to
analyze social network implemented used singly and
double linked lists to measure social networks'
connectivity. It also measures connectivity for the
identification of structural properties of networks [11].
Narotam and Singh. etal. [12] tests centrality as individual
lengths of adolescent women's closed category character
with their affiliation. In this paper, the author attempts to
find the high centrality steps taken by a group of teenage
women in the social network to find the relationship
between people with the highest centrality and power. The
character intensity can be measured with the highest
centrality. However, the person may be prepared for the
specific strength of character by seeking correlation
support for certain particular positions within the
organization or society.
Siddharth et al. [13] used a dark network to examine crime
networks and terrorist networks. This paper analyses and
uses a more sophisticated hierarchical network in a large
network of drugs in the real world. Multivariate Cox
regression allows the network to classify and forecast
potential crimes.
Feng Xu et al. [14] used online social networks to analyze
specific terrorist organizations to obtain various structural
features by measuring the members' centrality and prestige.
The analysis also reveals for the small groups by clustering
subgroups, and by using 3-core degree-based methods in
the online community specific structure can be identified.
The structure analysis here has higher cohesion and vitality
when compared with other network structures.
George Kalpakis et al. [15] used online social networksto
understand various terrorist activities by predicting
terrorism-related contents and posts. The paper implements
some analysis of textual and spatial, and temporal
investigation in the social network data by identifying
various network features and metadata, which helps gather
suspicious activities over Twitter content and compare it
with non-suspended content. It is one of the automation for
the early detection and various terrorist activities
performed via social networks.
Ala Mr. Al-Zoubi et al. [16] used Span profile
identification based on a collection of features accessible to
the public. The prediction model is analyzed by applying
feature selection by using ReliefF and knowledge gain on
the dataset of 82 Twitter profiles. There are four
classification algorithms for the classification of spam
profiles using a decision tree, a multilayer perceptron and
k-close neighbour, and a Naïve Bayes approach.
Cristina Sanchez-Rebollo et al. [17] used Big data to detect
jihadism using Graphs and Fuzzy clustering. This paper
focuses on all leaders and their followers by analyzing
Twitter messages for the prediction of terrorist activities in
the network. The architectural model used for the
prediction and Big data for the analysis of various public
features such as level of activity and the ability to influence
others andthe content of Twitter messages. The algorithm
implemented in the paper works in two phases, first by
Graphs to analyze various messages propagate in the
network and then Fuzzy extraction methods, and the
algorithm successfully detects terrorism activism.
The Weighted Formal Concept Analysis (WFCA) was used
to identify the terrorist network with the most impact. They
first established a formal matrix adjacent to the 26/11
Mumbai Terrorist Attack network. Next, all possible
formal sense definitions have been established. Each
terrorist node's weight was then determined and classified
accordingly. Compared to other renowned central
algorithms, such as the Close Center, the Central Node,
PageRank, Katz, Reach centrality, and the central PN
central location.
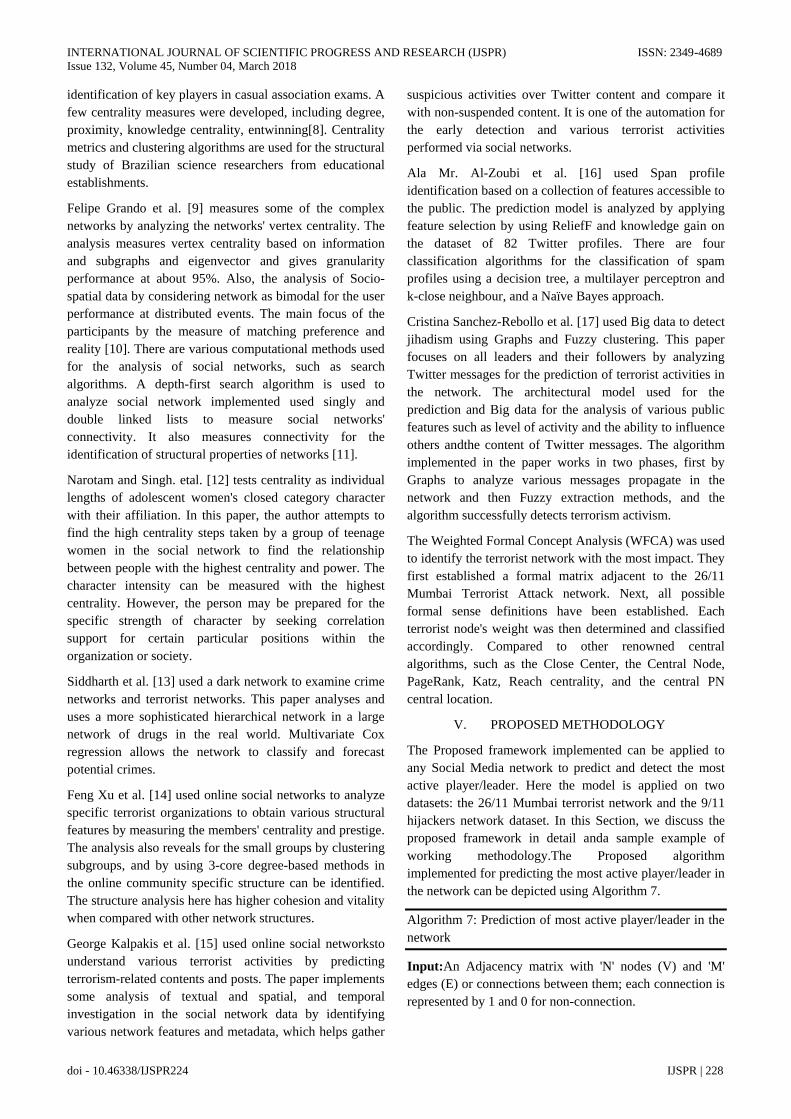
V. PROPOSED METHODOLOGY
The Proposed framework implemented can be applied to
any Social Media network to predict and detect the most
active player/leader. Here the model is applied on two
datasets: the 26/11 Mumbai terrorist network and the 9/11
hijackers network dataset. In this Section, we discuss the
proposed framework in detail anda sample example of
working methodology.The Proposed algorithm
implemented for predicting the most active player/leader in
the network can be depicted using Algorithm 7.
Algorithm 7: Prediction of most active player/leader in the
network
Input:An Adjacency matrix with 'N' nodes (V) and 'M'
edges (E) or connections between them; each connection is
represented by 1 and 0 for non-connection.
INTERNATIONAL JOURNAL OF SCIENTIFIC PROGRESS AND RESEARCH (IJSPR) ISSN: 2349-4689
Issue 132, Volume 45, Number 04, March 2018
doi - 10.46338/IJSPR224 IJSPR | 229
Output:Most active node / node of attraction (NOA) in the
network.
1. Take an input Dataset 'D' with 'N' nodes and 'M'
connections between nodes.
2. Construct Digraph 'DG' from the given nodes and
edges.
a. Starting with an empty graph model with
no nodes and edges.
b. For each Node 'N' in Dataset' D':
c. Add link from one node to next node, if
matrix contains 1
d. Add small segment of graph to Digraph'
DG'.
e. End
f. return Digraph 'DG'
3. for each node in the network:
4. Compute Degree (𝐷𝑁) in algorithm 1
5. Compute DegreeCentrality (𝐷𝐶𝑁) in algorithm 2
6. Compute BetweennessCentrality (𝐵𝐶𝑁) in
algorithm 3
7. Compute ClosenessCentrality (𝐶𝐶𝑁) in algorithm
4
8. Compute EigenVectorCentrality (𝐸𝑉𝑁) in
algorithm 5
9. Compute PageRank (𝑃𝑅𝑁) in algorithm 6
10. End
11. 𝑁𝑂𝐴𝐶𝑒𝑛𝑡𝑟𝑎𝑙𝑖𝑡𝑦 Rank
(𝐷𝑁 , 𝐷𝐶𝑁 , 𝐶𝐶𝑁 , 𝐵𝐶𝑁 , 𝐸𝑉𝑁 , 𝑃𝑅𝑁), Store most active
node based on ranking of various centrality
measures.
12. 𝐺CommuniytDetection (N) in algorithm 8,
compute community detection of each node.
13. for each group 𝑔𝑖nodes in G:
14. 𝐷𝐶𝑡𝑜𝑡𝑎𝑙𝑔𝑖 DegreeCentrality (𝑔𝑖), total degree
centrality of all nodes that are in group i
15. 𝑅𝑎𝑛𝑘(𝑔𝑖)Max (𝐷𝐶𝑡𝑜𝑡𝑎𝑙𝑔𝑖
), select group with the
highest degree centrality from Group G
16. repeat step 14 & 15 for ClosenessCentrality,
BetweennessCentrality, EigenVector & PageRank
17. end
18. Selection of most active node groups from count
of Rank (𝑔𝑖)
19. 𝐹𝐶𝑔𝑖FuzzyCentrality(𝑔𝑖), calculate Fuzzy
Centrality of most active node groups in algorithm
9
20. Sort 𝐹𝐶𝑔𝑖 in ascending and assign Rank from
Lowest to highest Fuzzy centrality
21. 𝑁𝑂𝐴 ← 𝑀𝑖𝑛 (𝐹𝐶𝑔𝑖), node with the lowest Fuzzy
centrality is considered as the most active
player/leader
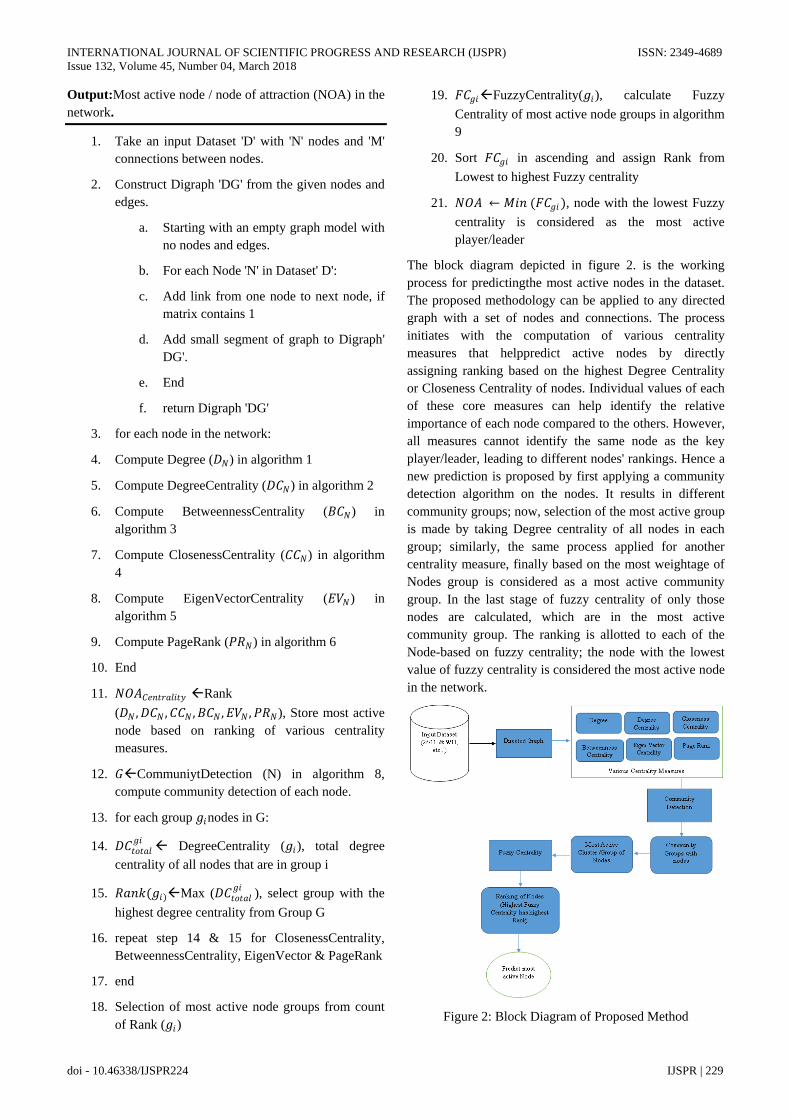
The block diagram depicted in figure 2. is the working
process for predictingthe most active nodes in the dataset.
The proposed methodology can be applied to any directed
graph with a set of nodes and connections. The process
initiates with the computation of various centrality
measures that helppredict active nodes by directly
assigning ranking based on the highest Degree Centrality
or Closeness Centrality of nodes. Individual values of each
of these core measures can help identify the relative
importance of each node compared to the others. However,
all measures cannot identify the same node as the key
player/leader, leading to different nodes' rankings. Hence a
new prediction is proposed by first applying a community
detection algorithm on the nodes. It results in different
community groups; now, selection of the most active group
is made by taking Degree centrality of all nodes in each
group; similarly, the same process applied for another
centrality measure, finally based on the most weightage of
Nodes group is considered as a most active community
group. In the last stage of fuzzy centrality of only those
nodes are calculated, which are in the most active
community group. The ranking is allotted to each of the
Node-based on fuzzy centrality; the node with the lowest
value of fuzzy centrality is considered the most active node
in the network.
Figure 2: Block Diagram of Proposed Method
INTERNATIONAL JOURNAL OF SCIENTIFIC PROGRESS AND RESEARCH (IJSPR) ISSN: 2349-4689
Issue 132, Volume 45, Number 04, March 2018
doi - 10.46338/IJSPR224 IJSPR | 230
When applied to the directed graph shown in figure 1 (b),
the community detection algorithm(Algorithm-8) gives
various community groups represented in Table-7.
Table 7: Various community groups identified
Community
Groups
Nodes in Community
Group
Ranking of
most Active
Group
0 Node1, Node3, Node4,
Node5, Node6 1
1 Node2 2
Algorithm 8: Computation of Community Detection of
Nodes in network
Input: A Directed graph with 'N’ nodes with In-coming &
out-going edges.
Output:Community Group(G) of Nodes with same or
similar properties
CommunityDetection (N): Community detection is a
technique of grouping or detecting different communities
in network. Girvan –A Newman-based community
detection algorithm is used to group nodes in the network
in the proposed framework.
1. for each edge 𝑒𝑁 in directed graph ‘DG’:
2. 𝐵𝑒𝑁 ← 𝜎𝑠𝑡(𝑒𝑁)s≠v≠t Computebetweenness
of𝑒𝑁, 𝜎𝑠𝑡(𝑒𝑁) is the number of the shortest path
that can be traversed through edge 𝑒𝑁 in-network.
3. end
4. The highest betweenness from the edges is then
removed.
5. The remaining betweenness of the edges which
are removed is then recalculated
6. repeat 4 & 5 until no edge is remaining.
7. return G
The Fuzzy Centrality of the nodes in the most active group
and the ranking can be given as follows and result shown
in Table-8:
Table 8: Fuzzy Centrality of the nodes
Node1 Node3 Node4 Node5 Node6
0.0094 0.0239 0.0197 0.0170 0.01353
1st Rank 5th Rank 4th Rank 3rd Rank 2nd Rank
Algorithm 9: Computation of Fuzzy Centrality of Nodes in
network
Input: A Directed graph with ‘N’ nodes with In-coming &
out-going edges.
Output:Fuzzy Centrality 𝐹𝐶𝑁of Nodes
FuzzyCentrality (N):Here, a new algorithm is proposed for
the computation of Fuzzy Centrality, which is used to
predict the most active player/leader in the network. The
existing technique of predicting most active nodes using
the Centrality measure fails to predict the correct ranking
of nodes, hence by using the weightage factor each of the
centrality measure, a new proposed model for the centrality
measure is proposed. Here more weightage for Degree
Centrality, Betweenness Centrality, and Closeness
Centrality is given since three factors are more involved in
predicting the most active nodes. The weightage factor
should not be greater than 1; when more weightage is given
to the Eigenvector or page rank, it may affect the network's
most active player.
1. 𝐹𝐶𝑁 ←
2 +
log
{0.2 ∗ 𝐷𝑒𝑔𝑟𝑒𝑒𝐶𝑒𝑛𝑡𝑟𝑎𝑙𝑖𝑡𝑦 𝑁 +
0.3 ∗ 𝐵𝑒𝑡𝑤𝑒𝑒𝑛𝑛𝑒𝑠𝑠𝐶𝑒𝑛𝑡𝑟𝑎𝑙𝑖𝑡𝑦 𝑁
+0.3 ∗ 𝐶𝑙𝑜𝑠𝑒𝑛𝑒𝑠𝑠𝐶𝑒𝑛𝑡𝑟𝑎𝑙𝑖𝑡𝑦 𝑁 +
0.1 ∗ 𝐸𝑖𝑔𝑒𝑛𝑉𝑒𝑐𝑡𝑜𝑟𝐶𝑒𝑛𝑡𝑟𝑎𝑙𝑖𝑡𝑦 𝑁
+0.1 ∗ 𝑃𝑎𝑔𝑒𝑅𝑎𝑛𝑘 (𝑁)}10
2. return 𝐹𝐶𝑁
VI. SIMULATION AND RESULT ANALYSIS
In this Section, We provide and compare the Fuzzy
Centrality algorithm's performance with other techniques
for the prediction of Key Players / leadersinCovert
networks, including the 26/11 Mumbai Attacks and 9/11
hijackers network. In the below Segments, we will describe
Data Sets, Various Performance Evaluations, and
experimental setup in detail.
A. Data Sets
For the Fuzzy Centrality algorithm's performance
evaluation, only 2 datasets are used, although the algorithm
can be performed on any Covert Networks.
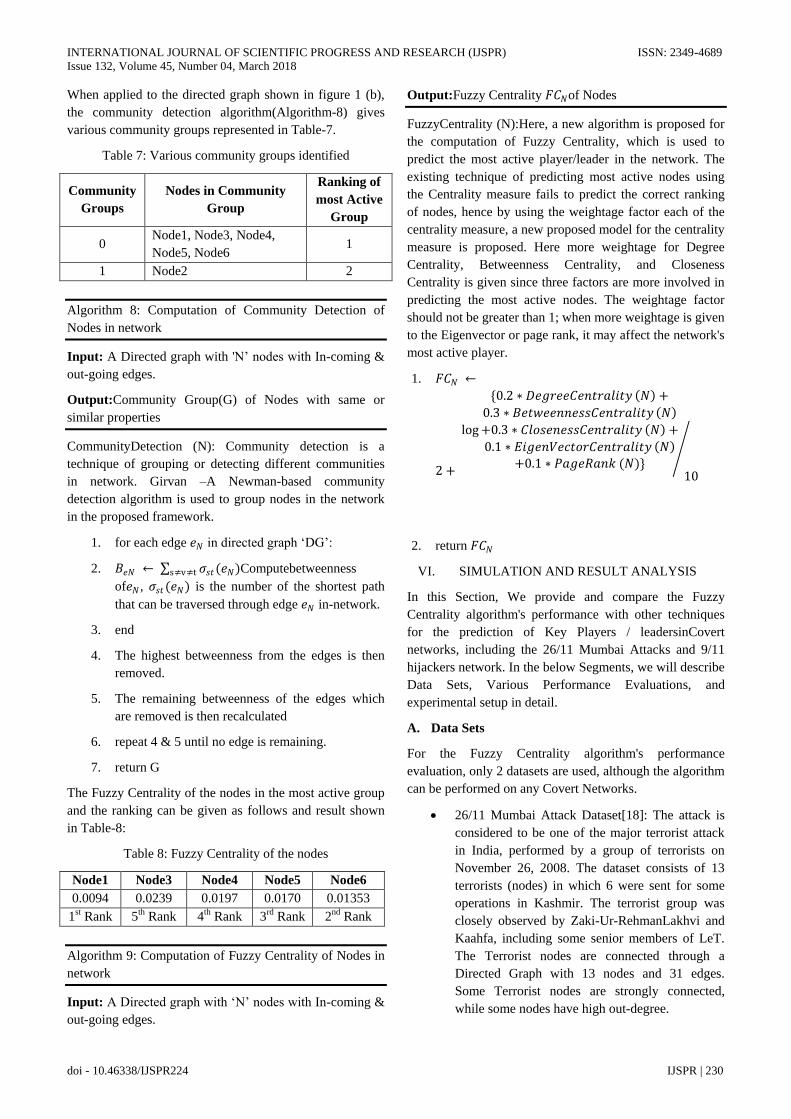
26/11 Mumbai Attack Dataset[18]: The attack is
considered to be one of the major terrorist attack
in India, performed by a group of terrorists on
November 26, 2008. The dataset consists of 13
terrorists (nodes) in which 6 were sent for some
operations in Kashmir. The terrorist group was
closely observed by Zaki-Ur-RehmanLakhvi and
Kaahfa, including some senior members of LeT.
The Terrorist nodes are connected through a
Directed Graph with 13 nodes and 31 edges.
Some Terrorist nodes are strongly connected,
while some nodes have high out-degree.
INTERNATIONAL JOURNAL OF SCIENTIFIC PROGRESS AND RESEARCH (IJSPR) ISSN: 2349-4689
Issue 132, Volume 45, Number 04, March 2018
doi - 10.46338/IJSPR224 IJSPR | 231
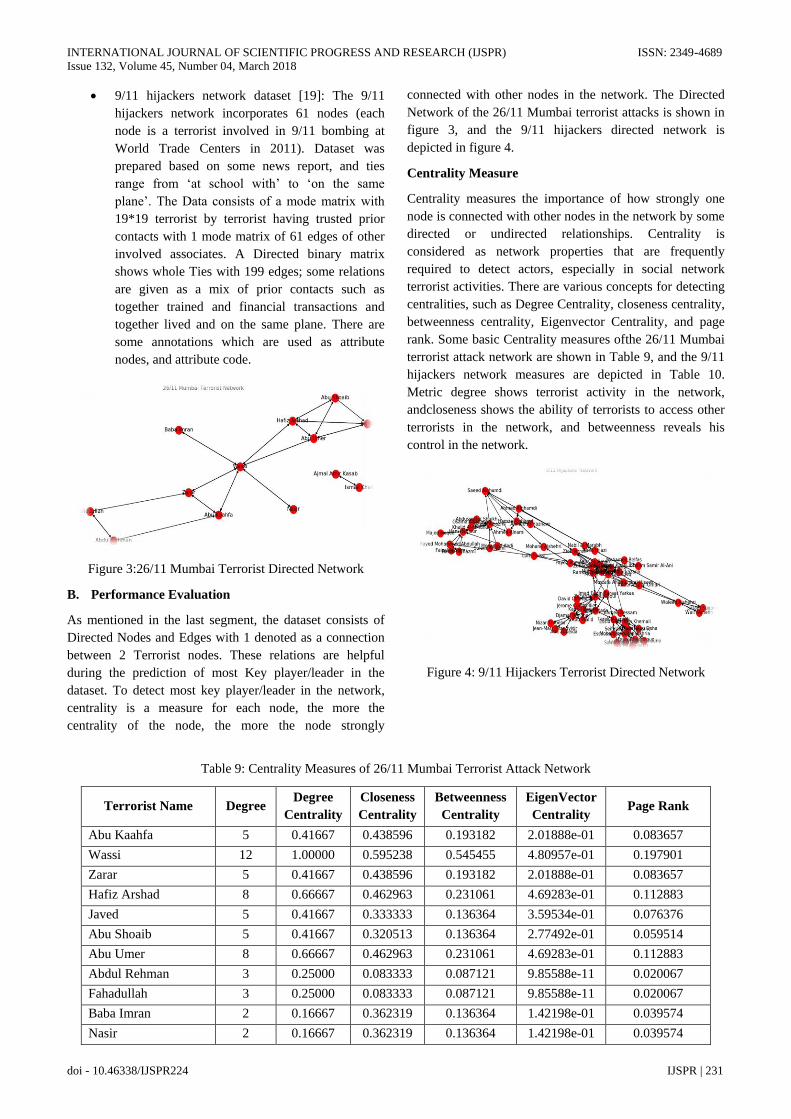
9/11 hijackers network dataset [19]: The 9/11
hijackers network incorporates 61 nodes (each
node is a terrorist involved in 9/11 bombing at
World Trade Centers in 2011). Dataset was
prepared based on some news report, and ties
range from ‘at school with’ to ‘on the same
plane’. The Data consists of a mode matrix with
19*19 terrorist by terrorist having trusted prior
contacts with 1 mode matrix of 61 edges of other
involved associates. A Directed binary matrix
shows whole Ties with 199 edges; some relations
are given as a mix of prior contacts such as
together trained and financial transactions and
together lived and on the same plane. There are
some annotations which are used as attribute
nodes, and attribute code.
Figure 3:26/11 Mumbai Terrorist Directed Network
B. Performance Evaluation
As mentioned in the last segment, the dataset consists of
Directed Nodes and Edges with 1 denoted as a connection
between 2 Terrorist nodes. These relations are helpful
during the prediction of most Key player/leader in the
dataset. To detect most key player/leader in the network,
centrality is a measure for each node, the more the
centrality of the node, the more the node strongly
connected with other nodes in the network. The Directed
Network of the 26/11 Mumbai terrorist attacks is shown in
figure 3, and the 9/11 hijackers directed network is
depicted in figure 4.
Centrality Measure
Centrality measures the importance of how strongly one
node is connected with other nodes in the network by some
directed or undirected relationships. Centrality is
considered as network properties that are frequently
required to detect actors, especially in social network
terrorist activities. There are various concepts for detecting
centralities, such as Degree Centrality, closeness centrality,
betweenness centrality, Eigenvector Centrality, and page
rank. Some basic Centrality measures ofthe 26/11 Mumbai
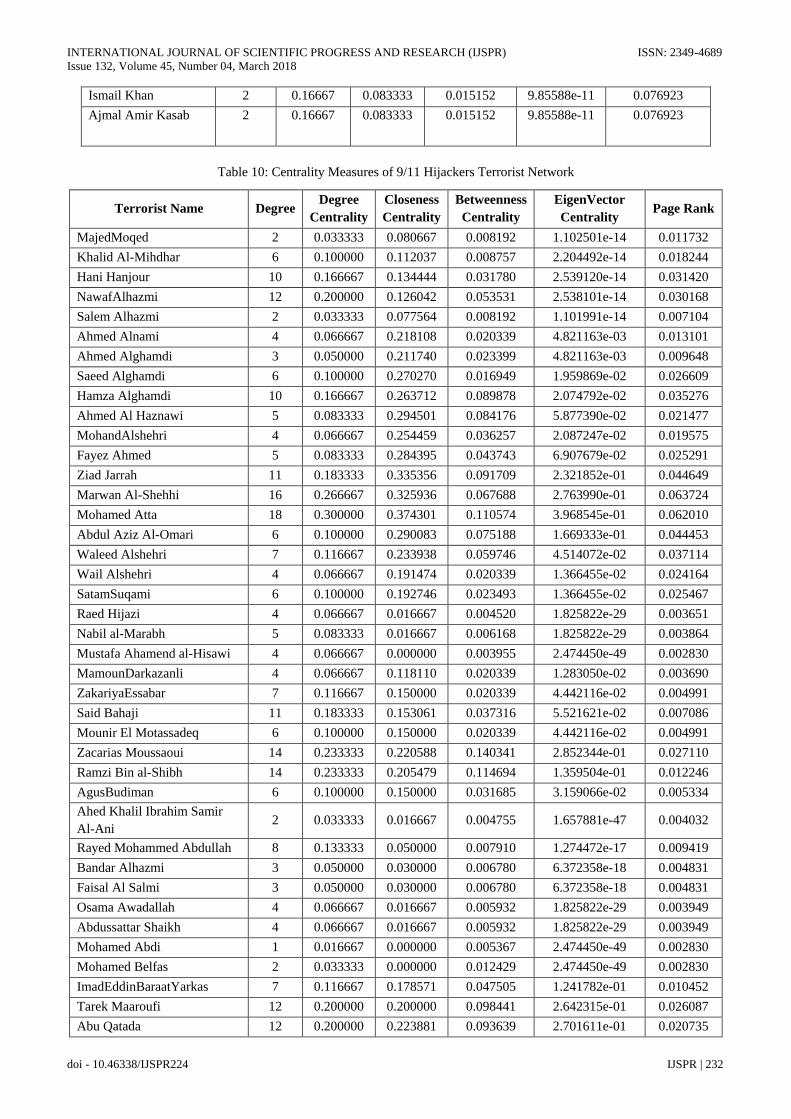
terrorist attack network are shown in Table 9, and the 9/11
hijackers network measures are depicted in Table 10.
Metric degree shows terrorist activity in the network,
andcloseness shows the ability of terrorists to access other
terrorists in the network, and betweenness reveals his
control in the network.
Figure 4: 9/11 Hijackers Terrorist Directed Network
Table 9: Centrality Measures of 26/11 Mumbai Terrorist Attack Network
Terrorist Name Degree Degree
Centrality
Closeness
Centrality
Betweenness
Centrality
EigenVector
Centrality Page Rank
Abu Kaahfa 5 0.41667 0.438596 0.193182 2.01888e-01 0.083657
Wassi 12 1.00000 0.595238 0.545455 4.80957e-01 0.197901
Zarar 5 0.41667 0.438596 0.193182 2.01888e-01 0.083657
Hafiz Arshad 8 0.66667 0.462963 0.231061 4.69283e-01 0.112883
Javed 5 0.41667 0.333333 0.136364 3.59534e-01 0.076376
Abu Shoaib 5 0.41667 0.320513 0.136364 2.77492e-01 0.059514
Abu Umer 8 0.66667 0.462963 0.231061 4.69283e-01 0.112883
Abdul Rehman 3 0.25000 0.083333 0.087121 9.85588e-11 0.020067
Fahadullah 3 0.25000 0.083333 0.087121 9.85588e-11 0.020067
Baba Imran 2 0.16667 0.362319 0.136364 1.42198e-01 0.039574
Nasir 2 0.16667 0.362319 0.136364 1.42198e-01 0.039574
INTERNATIONAL JOURNAL OF SCIENTIFIC PROGRESS AND RESEARCH (IJSPR) ISSN: 2349-4689
Issue 132, Volume 45, Number 04, March 2018
doi - 10.46338/IJSPR224 IJSPR | 232
Ismail Khan 2 0.16667 0.083333 0.015152 9.85588e-11 0.076923
Ajmal Amir Kasab 2 0.16667 0.083333 0.015152 9.85588e-11 0.076923
Table 10: Centrality Measures of 9/11 Hijackers Terrorist Network
Terrorist Name Degree Degree
Centrality
Closeness
Centrality
Betweenness
Centrality
EigenVector
Centrality Page Rank
MajedMoqed 2 0.033333 0.080667 0.008192 1.102501e-14 0.011732
Khalid Al-Mihdhar 6 0.100000 0.112037 0.008757 2.204492e-14 0.018244
Hani Hanjour 10 0.166667 0.134444 0.031780 2.539120e-14 0.031420
NawafAlhazmi 12 0.200000 0.126042 0.053531 2.538101e-14 0.030168
Salem Alhazmi 2 0.033333 0.077564 0.008192 1.101991e-14 0.007104
Ahmed Alnami 4 0.066667 0.218108 0.020339 4.821163e-03 0.013101
Ahmed Alghamdi 3 0.050000 0.211740 0.023399 4.821163e-03 0.009648
Saeed Alghamdi 6 0.100000 0.270270 0.016949 1.959869e-02 0.026609
Hamza Alghamdi 10 0.166667 0.263712 0.089878 2.074792e-02 0.035276
Ahmed Al Haznawi 5 0.083333 0.294501 0.084176 5.877390e-02 0.021477
MohandAlshehri 4 0.066667 0.254459 0.036257 2.087247e-02 0.019575
Fayez Ahmed 5 0.083333 0.284395 0.043743 6.907679e-02 0.025291
Ziad Jarrah 11 0.183333 0.335356 0.091709 2.321852e-01 0.044649
Marwan Al-Shehhi 16 0.266667 0.325936 0.067688 2.763990e-01 0.063724
Mohamed Atta 18 0.300000 0.374301 0.110574 3.968545e-01 0.062010
Abdul Aziz Al-Omari 6 0.100000 0.290083 0.075188 1.669333e-01 0.044453
Waleed Alshehri 7 0.116667 0.233938 0.059746 4.514072e-02 0.037114
Wail Alshehri 4 0.066667 0.191474 0.020339 1.366455e-02 0.024164
SatamSuqami 6 0.100000 0.192746 0.023493 1.366455e-02 0.025467
Raed Hijazi 4 0.066667 0.016667 0.004520 1.825822e-29 0.003651
Nabil al-Marabh 5 0.083333 0.016667 0.006168 1.825822e-29 0.003864
Mustafa Ahamend al-Hisawi 4 0.066667 0.000000 0.003955 2.474450e-49 0.002830
MamounDarkazanli 4 0.066667 0.118110 0.020339 1.283050e-02 0.003690
ZakariyaEssabar 7 0.116667 0.150000 0.020339 4.442116e-02 0.004991
Said Bahaji 11 0.183333 0.153061 0.037316 5.521621e-02 0.007086
Mounir El Motassadeq 6 0.100000 0.150000 0.020339 4.442116e-02 0.004991
Zacarias Moussaoui 14 0.233333 0.220588 0.140341 2.852344e-01 0.027110
Ramzi Bin al-Shibh 14 0.233333 0.205479 0.114694 1.359504e-01 0.012246
AgusBudiman 6 0.100000 0.150000 0.031685 3.159066e-02 0.005334
Ahed Khalil Ibrahim Samir
Al-Ani 2 0.033333 0.016667 0.004755 1.657881e-47 0.004032
Rayed Mohammed Abdullah 8 0.133333 0.050000 0.007910 1.274472e-17 0.009419
Bandar Alhazmi 3 0.050000 0.030000 0.006780 6.372358e-18 0.004831
Faisal Al Salmi 3 0.050000 0.030000 0.006780 6.372358e-18 0.004831
Osama Awadallah 4 0.066667 0.016667 0.005932 1.825822e-29 0.003949
Abdussattar Shaikh 4 0.066667 0.016667 0.005932 1.825822e-29 0.003949
Mohamed Abdi 1 0.016667 0.000000 0.005367 2.474450e-49 0.002830
Mohamed Belfas 2 0.033333 0.000000 0.012429 2.474450e-49 0.002830
ImadEddinBaraatYarkas 7 0.116667 0.178571 0.047505 1.241782e-01 0.010452
Tarek Maaroufi 12 0.200000 0.200000 0.098441 2.642315e-01 0.026087
Abu Qatada 12 0.200000 0.223881 0.093639 2.701611e-01 0.020735
INTERNATIONAL JOURNAL OF SCIENTIFIC PROGRESS AND RESEARCH (IJSPR) ISSN: 2349-4689
Issue 132, Volume 45, Number 04, March 2018
doi - 10.46338/IJSPR224 IJSPR | 233
DjamalBenghal 16 0.266667 0.200000 0.085369 2.681953e-01 0.034577
Jerome Courtaillier 8 0.133333 0.166667 0.024812 1.910330e-01 0.017518
David Courtaillier 6 0.100000 0.166667 0.020339 1.910330e-01 0.014905
AhmenRessam 4 0.066667 0.187500 0.041955 9.348402e-02 0.010199
Abu Walid 6 0.100000 0.166667 0.024482 1.431411e-01 0.011416
Jean-Marc Grandvisir 2 0.033333 0.144231 0.020339 6.232003e-02 0.006504
Abu Zubeida 2 0.033333 0.144231 0.020339 6.232003e-02 0.006504
Nizar Trabelsi 2 0.033333 0.144231 0.020339 6.232003e-02 0.006504
Haydar Abu Doha 6 0.100000 0.174419 0.038729 1.170711e-01 0.014389
Mehdi Khammoun 5 0.083333 0.132743 0.020621 1.118258e-01 0.010948
Mohammed Bensakhria 9 0.150000 0.163043 0.029470 1.827349e-01 0.018804
Lased Ben Heni 4 0.066667 0.132743 0.020339 1.118258e-01 0.010948
Essid Sami Ben Khemail 22 0.366667 0.176471 0.121872 2.984898e-01 0.053342
Seifallah ben Hassine 5 0.083333 0.159574 0.020386 1.307632e-01 0.011049
EssoussiLaaroussi 5 0.083333 0.159574 0.020386 1.307632e-01 0.011049
Tarek Maaroufi1 6 0.100000 0.000000 0.012147 2.474450e-49 0.002830
Fahid al Shakri 2 0.033333 0.131579 0.020339 6.936232e-02 0.006952
MadjidSahoune 3 0.050000 0.147059 0.020339 9.656691e-02 0.011029
Samir Kishk 2 0.033333 0.131579 0.020339 6.936232e-02 0.006952
KamelDaoudi 8 0.133333 0.142857 0.023443 7.765136e-02 0.009787
The individual values of each of these core measures will
help assess each node's relative significance in comparison
with others. However, all the metrics cannot classify the
same node as the main player/leader, resulting in different
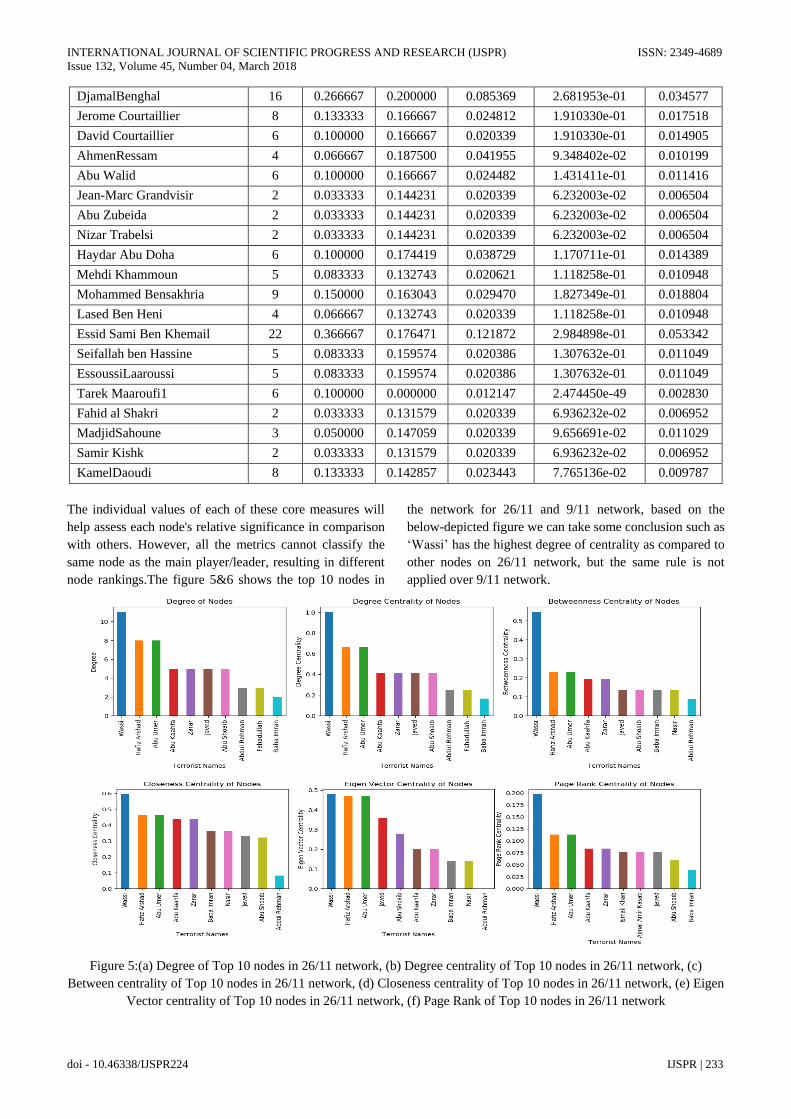
node rankings.The figure 5&6 shows the top 10 nodes in
the network for 26/11 and 9/11 network, based on the
below-depicted figure we can take some conclusion such as
‘Wassi’ has the highest degree of centrality as compared to
other nodes on 26/11 network, but the same rule is not
applied over 9/11 network.
Figure 5:(a) Degree of Top 10 nodes in 26/11 network, (b) Degree centrality of Top 10 nodes in 26/11 network, (c)
Between centrality of Top 10 nodes in 26/11 network, (d) Closeness centrality of Top 10 nodes in 26/11 network, (e) Eigen
Vector centrality of Top 10 nodes in 26/11 network, (f) Page Rank of Top 10 nodes in 26/11 network
INTERNATIONAL JOURNAL OF SCIENTIFIC PROGRESS AND RESEARCH (IJSPR) ISSN: 2349-4689
Issue 132, Volume 45, Number 04, March 2018
doi - 10.46338/IJSPR224 IJSPR | 234
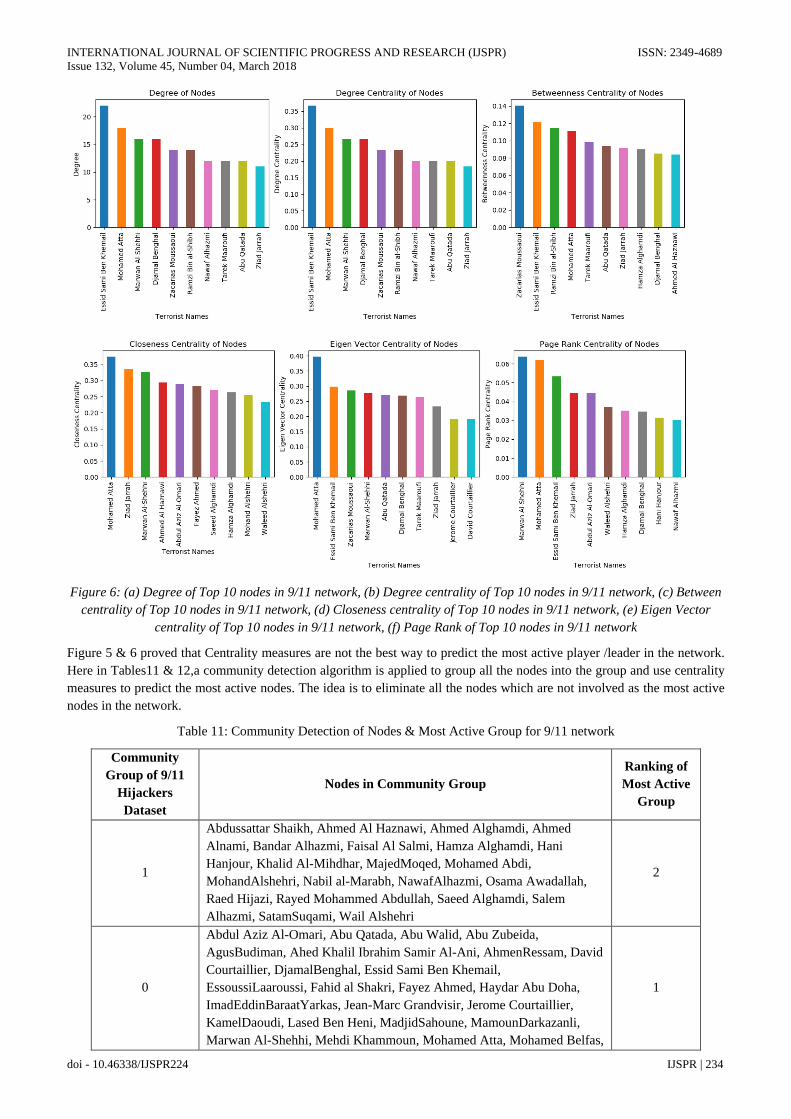
Figure 6: (a) Degree of Top 10 nodes in 9/11 network, (b) Degree centrality of Top 10 nodes in 9/11 network, (c) Between
centrality of Top 10 nodes in 9/11 network, (d) Closeness centrality of Top 10 nodes in 9/11 network, (e) Eigen Vector
centrality of Top 10 nodes in 9/11 network, (f) Page Rank of Top 10 nodes in 9/11 network
Figure 5 & 6 proved that Centrality measures are not the best way to predict the most active player /leader in the network.
Here in Tables11 & 12,a community detection algorithm is applied to group all the nodes into the group and use centrality
measures to predict the most active nodes. The idea is to eliminate all the nodes which are not involved as the most active
nodes in the network.
Table 11: Community Detection of Nodes & Most Active Group for 9/11 network
Community
Group of 9/11
Hijackers
Dataset
Nodes in Community Group
Ranking of
Most Active
Group
1
Abdussattar Shaikh, Ahmed Al Haznawi, Ahmed Alghamdi, Ahmed
Alnami, Bandar Alhazmi, Faisal Al Salmi, Hamza Alghamdi, Hani
Hanjour, Khalid Al-Mihdhar, MajedMoqed, Mohamed Abdi,
MohandAlshehri, Nabil al-Marabh, NawafAlhazmi, Osama Awadallah,
Raed Hijazi, Rayed Mohammed Abdullah, Saeed Alghamdi, Salem
Alhazmi, SatamSuqami, Wail Alshehri
2
0
Abdul Aziz Al-Omari, Abu Qatada, Abu Walid, Abu Zubeida,
AgusBudiman, Ahed Khalil Ibrahim Samir Al-Ani, AhmenRessam, David
Courtaillier, DjamalBenghal, Essid Sami Ben Khemail,
EssoussiLaaroussi, Fahid al Shakri, Fayez Ahmed, Haydar Abu Doha,
ImadEddinBaraatYarkas, Jean-Marc Grandvisir, Jerome Courtaillier,
KamelDaoudi, Lased Ben Heni, MadjidSahoune, MamounDarkazanli,
Marwan Al-Shehhi, Mehdi Khammoun, Mohamed Atta, Mohamed Belfas,
1
INTERNATIONAL JOURNAL OF SCIENTIFIC PROGRESS AND RESEARCH (IJSPR) ISSN: 2349-4689
Issue 132, Volume 45, Number 04, March 2018
doi - 10.46338/IJSPR224 IJSPR | 235
Mohammed Bensakhria, Mounir El Motassadeq, Mustafa Ahamend al-
Hisawi, Nizar Trabelsi, Ramzi Bin al-Shibh, Said Bahaji, Samir Kishk,
Seifallah ben Hassine, Tarek Maaroufi, Waleed Alshehri, Zacarias
Moussaoui, ZakariyaEssabar, Ziad Jarrah
Table 12: Community Detection of Nodes & Most Active Group for 26/11 network
Community
Group of 26/11
Mumbai
Terrorist
Dataset
Nodes in Community Group
Ranking of
Most
Active
Group
1 Abu Shoaib, Abu Umer, Baba Imran, Hafiz Arshad, Javed, Nasir, Wassi 1
0 Abdul Rehman, Abu Kaahfa, Fahadullah, Zarar 2
2 Ajmal Amir Kasab, Ismail Khan 3
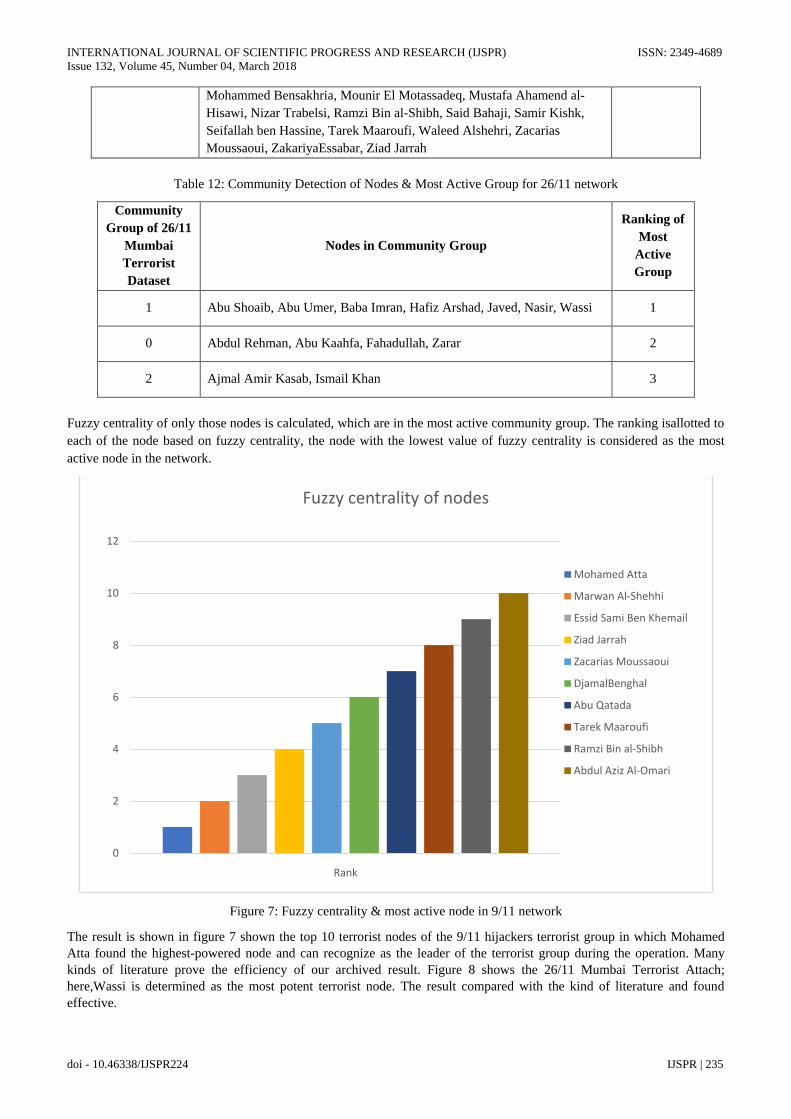
Fuzzy centrality of only those nodes is calculated, which are in the most active community group. The ranking isallotted to
each of the node based on fuzzy centrality, the node with the lowest value of fuzzy centrality is considered as the most
active node in the network.
Figure 7: Fuzzy centrality & most active node in 9/11 network
The result is shown in figure 7 shown the top 10 terrorist nodes of the 9/11 hijackers terrorist group in which Mohamed
Atta found the highest-powered node and can recognize as the leader of the terrorist group during the operation. Many
kinds of literature prove the efficiency of our archived result. Figure 8 shows the 26/11 Mumbai Terrorist Attach;
here,Wassi is determined as the most potent terrorist node. The result compared with the kind of literature and found
effective.
0
2
4
6
8
10
12
Rank
Fuzzy centrality of nodes
Mohamed Atta
Marwan Al-Shehhi
Essid Sami Ben Khemail
Ziad Jarrah
Zacarias Moussaoui
DjamalBenghal
Abu Qatada
Tarek Maaroufi
Ramzi Bin al-Shibh
Abdul Aziz Al-Omari

INTERNATIONAL JOURNAL OF SCIENTIFIC PROGRESS AND RESEARCH (IJSPR) ISSN: 2349-4689
Issue 132, Volume 45, Number 04, March 2018
doi - 10.46338/IJSPR224 IJSPR | 236
Figure 8: Fuzzy centrality & most active node in 26/11 network
VII. EXPERIMENTAL EVALUATION
This Section reviews the method and results with other common algorithms such as Degree Centrality, Closeness
Centrality, Betweenness Center, Eigenvector, and PageRank. Tables 13 & 14 display the core values for the top 10 nodes
within a given network, i.e.,the 9/11 hijacker dataset and 26/11 Mumbai Attack dataset.
Table 13: Centrality values of the existing algorithms and proposed method for 9/11 hijackers
Terrorist Name Degree Closeness Betweenness EigenVector Page Rank Proposed
Mohamed Atta 0.3 0.374301 0.110574 3.9685E-01 0.06201 1.9400
Marwan Al-Shehhi 0.266667 0.325936 0.067688 2.7640E-01 0.063724 1.9313
Essid Sami Ben Khemail 0.366667 0.176471 0.121872 2.9849E-01 0.053342 1.9297
Ziad Jarrah 0.183333 0.335356 0.091709 2.3219E-01 0.044649 1.9284
Zacarias Moussaoui 0.233333 0.220588 0.140341 2.8523E-01 0.02711 1.9270
DjamalBenghal 0.266667 0.2 0.085369 2.6820E-01 0.034577 1.9228
Abu Qatada 0.2 0.223881 0.093639 2.7016E-01 0.020735 1.9216
Tarek Maaroufi 0.2 0.2 0.098441 2.6423E-01 0.026087 1.9200
Ramzi Bin al-Shibh 0.233333 0.205479 0.114694 1.3595E-01 0.012246 1.9197
Abdul Aziz Al-Omari 0.1 0.290083 0.075188 1.6693E-01 0.044453 1.9178
Table 14: Centrality values of the existing algorithms and proposed method for 26/11 Mumbai attack
Terrorist Name Degree Closeness Betweenness EigenVector Page Rank Proposed
Wassi 1 0.595238 0.545455 4.81E-01 0.197901 1.9785
Hafiz Arshad 0.66667 0.462963 0.231061 4.69E-01 0.112883 1.9602
Abu Umer 0.66667 0.462963 0.231061 4.69E-01 0.112883 1.9602
Javed 0.41667 0.333333 0.136364 3.60E-01 0.076376 1.9428
Abu Shoaib 0.41667 0.320513 0.136364 2.77E-01 0.059514 1.9405
Baba Imran 0.16667 0.362319 0.136364 1.42E-01 0.039574 1.9303
Nasir 0.16667 0.362319 0.136364 1.42E-01 0.039574 1.9303
0
1
2
3
4
5
6
7
Rank
Fuzzy centrality of nodes
Wassi
Hafiz Arshad
Abu Umer
Javed
Abu Shoaib
Baba Imran
Nasir
INTERNATIONAL JOURNAL OF SCIENTIFIC PROGRESS AND RESEARCH (IJSPR) ISSN: 2349-4689
Issue 132, Volume 45, Number 04, March 2018
doi - 10.46338/IJSPR224 IJSPR | 237
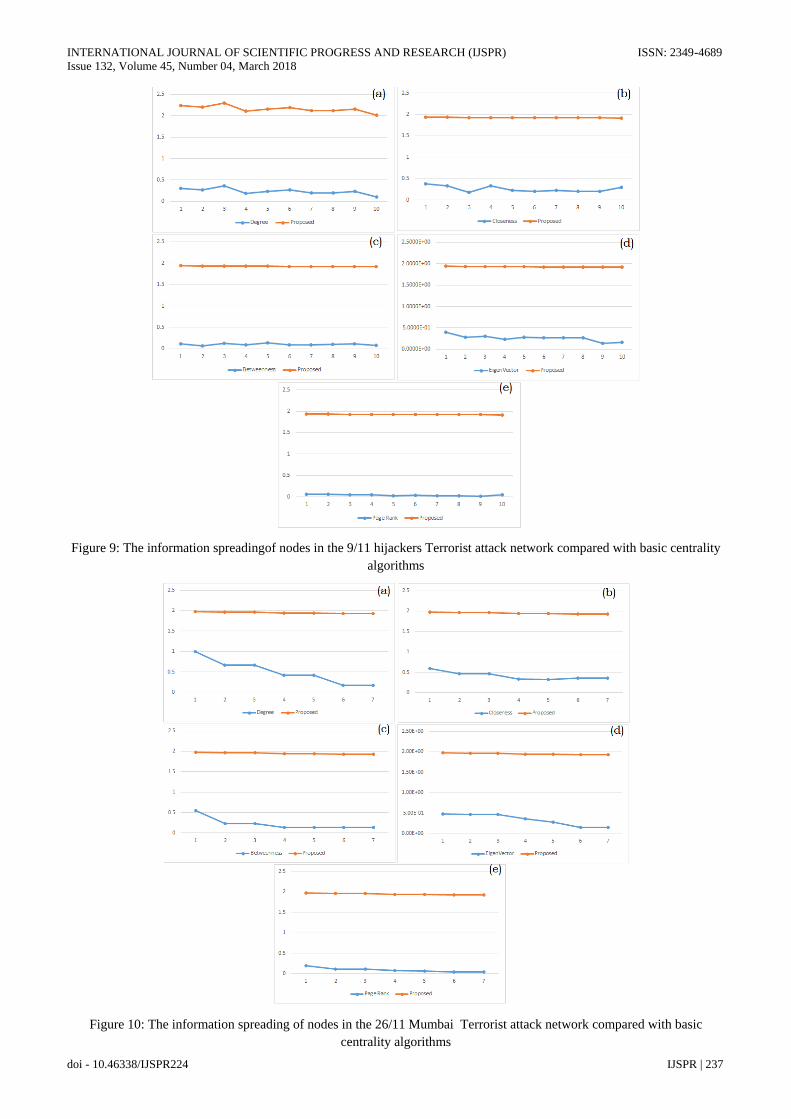
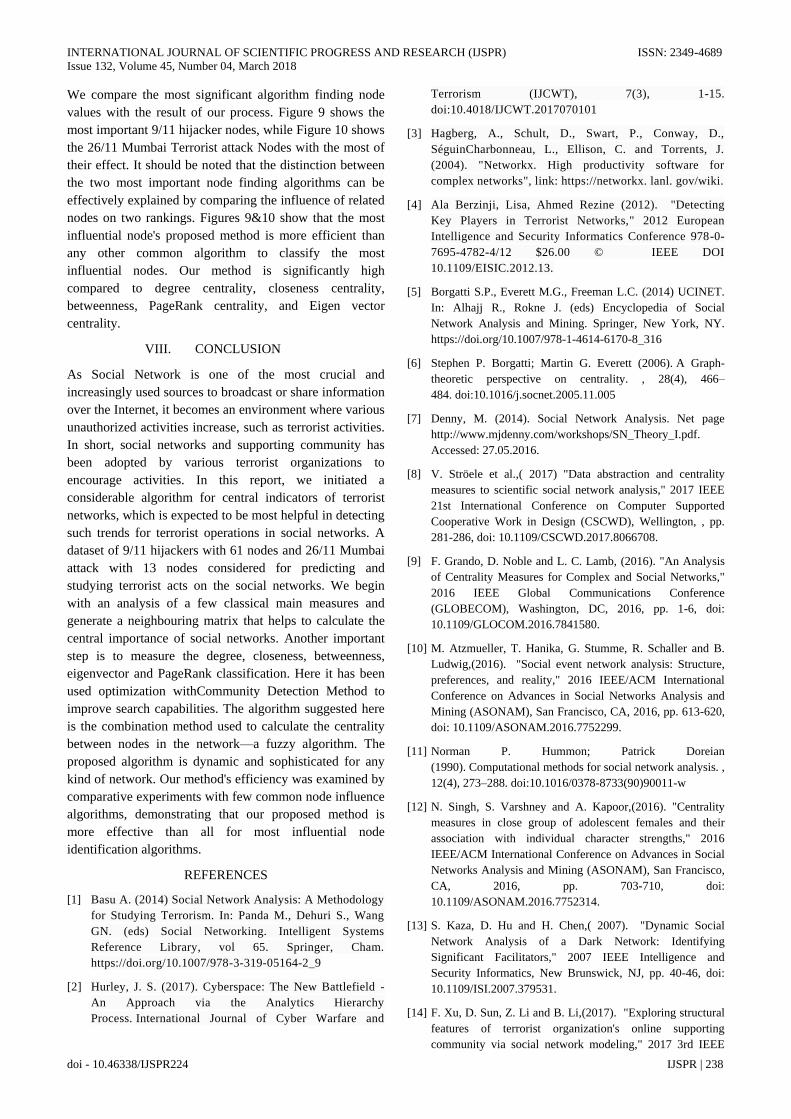
Figure 9: The information spreadingof nodes in the 9/11 hijackers Terrorist attack network compared with basic centrality
algorithms
Figure 10: The information spreading of nodes in the 26/11 Mumbai Terrorist attack network compared with basic
centrality algorithms
INTERNATIONAL JOURNAL OF SCIENTIFIC PROGRESS AND RESEARCH (IJSPR) ISSN: 2349-4689
Issue 132, Volume 45, Number 04, March 2018
doi - 10.46338/IJSPR224 IJSPR | 238
We compare the most significant algorithm finding node
values with the result of our process. Figure 9 shows the
most important 9/11 hijacker nodes, while Figure 10 shows
the 26/11 Mumbai Terrorist attack Nodes with the most of
their effect. It should be noted that the distinction between
the two most important node finding algorithms can be
effectively explained by comparing the influence of related
nodes on two rankings. Figures 9&10 show that the most
influential node's proposed method is more efficient than
any other common algorithm to classify the most
influential nodes. Our method is significantly high
compared to degree centrality, closeness centrality,
betweenness, PageRank centrality, and Eigen vector
centrality.
VIII. CONCLUSION
As Social Network is one of the most crucial and
increasingly used sources to broadcast or share information
over the Internet, it becomes an environment where various
unauthorized activities increase, such as terrorist activities.
In short, social networks and supporting community has
been adopted by various terrorist organizations to
encourage activities. In this report, we initiated a
considerable algorithm for central indicators of terrorist
networks, which is expected to be most helpful in detecting
such trends for terrorist operations in social networks. A
dataset of 9/11 hijackers with 61 nodes and 26/11 Mumbai
attack with 13 nodes considered for predicting and
studying terrorist acts on the social networks. We begin
with an analysis of a few classical main measures and
generate a neighbouring matrix that helps to calculate the
central importance of social networks. Another important
step is to measure the degree, closeness, betweenness,
eigenvector and PageRank classification. Here it has been
used optimization withCommunity Detection Method to
improve search capabilities. The algorithm suggested here
is the combination method used to calculate the centrality
between nodes in the network—a fuzzy algorithm. The
proposed algorithm is dynamic and sophisticated for any
kind of network. Our method's efficiency was examined by
comparative experiments with few common node influence
algorithms, demonstrating that our proposed method is
more effective than all for most influential node
identification algorithms.
REFERENCES
[1] Basu A. (2014) Social Network Analysis: A Methodology
for Studying Terrorism. In: Panda M., Dehuri S., Wang
GN. (eds) Social Networking. Intelligent Systems
Reference Library, vol 65. Springer, Cham.
https://doi.org/10.1007/978-3-319-05164-2_9
[2] Hurley, J. S. (2017). Cyberspace: The New Battlefield -
An Approach via the Analytics Hierarchy
Process. International Journal of Cyber Warfare and
Terrorism (IJCWT), 7(3), 1-15.
doi:10.4018/IJCWT.2017070101
[3] Hagberg, A., Schult, D., Swart, P., Conway, D.,
SéguinCharbonneau, L., Ellison, C. and Torrents, J.
(2004). "Networkx. High productivity software for
complex networks", link: https://networkx. lanl. gov/wiki.
[4] Ala Berzinji, Lisa, Ahmed Rezine (2012). "Detecting
Key Players in Terrorist Networks," 2012 European
Intelligence and Security Informatics Conference 978-0-
7695-4782-4/12 $26.00 © IEEE DOI
10.1109/EISIC.2012.13.
[5] Borgatti S.P., Everett M.G., Freeman L.C. (2014) UCINET.
In: Alhajj R., Rokne J. (eds) Encyclopedia of Social
Network Analysis and Mining. Springer, New York, NY.
https://doi.org/10.1007/978-1-4614-6170-8_316
[6] Stephen P. Borgatti; Martin G. Everett (2006). A Graph-
theoretic perspective on centrality. , 28(4), 466–
484. doi:10.1016/j.socnet.2005.11.005
[7] Denny, M. (2014). Social Network Analysis. Net page
http://www.mjdenny.com/workshops/SN_Theory_I.pdf.
Accessed: 27.05.2016.
[8] V. Ströele et al.,( 2017) "Data abstraction and centrality
measures to scientific social network analysis," 2017 IEEE
21st International Conference on Computer Supported
Cooperative Work in Design (CSCWD), Wellington, , pp.
281-286, doi: 10.1109/CSCWD.2017.8066708.
[9] F. Grando, D. Noble and L. C. Lamb, (2016). "An Analysis
of Centrality Measures for Complex and Social Networks,"
2016 IEEE Global Communications Conference
(GLOBECOM), Washington, DC, 2016, pp. 1-6, doi:
10.1109/GLOCOM.2016.7841580.
[10] M. Atzmueller, T. Hanika, G. Stumme, R. Schaller and B.
Ludwig,(2016). "Social event network analysis: Structure,
preferences, and reality," 2016 IEEE/ACM International
Conference on Advances in Social Networks Analysis and
Mining (ASONAM), San Francisco, CA, 2016, pp. 613-620,
doi: 10.1109/ASONAM.2016.7752299.
[11] Norman P. Hummon; Patrick Doreian
(1990). Computational methods for social network analysis. ,
12(4), 273–288. doi:10.1016/0378-8733(90)90011-w
[12] N. Singh, S. Varshney and A. Kapoor,(2016). "Centrality
measures in close group of adolescent females and their
association with individual character strengths," 2016
IEEE/ACM International Conference on Advances in Social
Networks Analysis and Mining (ASONAM), San Francisco,
CA, 2016, pp. 703-710, doi:
10.1109/ASONAM.2016.7752314.
[13] S. Kaza, D. Hu and H. Chen,( 2007). "Dynamic Social
Network Analysis of a Dark Network: Identifying
Significant Facilitators," 2007 IEEE Intelligence and
Security Informatics, New Brunswick, NJ, pp. 40-46, doi:
10.1109/ISI.2007.379531.
[14] F. Xu, D. Sun, Z. Li and B. Li,(2017). "Exploring structural
features of terrorist organization's online supporting
community via social network modeling," 2017 3rd IEEE
INTERNATIONAL JOURNAL OF SCIENTIFIC PROGRESS AND RESEARCH (IJSPR) ISSN: 2349-4689
Issue 132, Volume 45, Number 04, March 2018
doi - 10.46338/IJSPR224 IJSPR | 239
International Conference on Computer and Communications
(ICCC), Chengdu, pp. 274-278, doi:
10.1109/CompComm.2017.8322555.
[15] Kalpakis G., Tsikrika T., Gialampoukidis I., Papadopoulos
S., Vrochidis S., Kompatsiaris I. (2018) Analysis of
Suspended Terrorism-Related Content on Social Media. In:
Leventakis G., Haberfeld M. (eds) Community-Oriented
Policing and Technological Innovations. SpringerBriefs in
Criminology. Springer, Cham. https://doi.org/10.1007/978-
3-319-89294-8_11
[16] Al-Zoubi, A. M., Alqatawna, J., Faris, H., & Hassonah, M.
A. (2019). Spam profiles detection on social networks using
computational intelligence methods: The effect of the lingual
context. Journal of Information
Science. https://doi.org/10.1177/0165551519861599
[17] Cristina Sánchez-Rebollo, Cristina Puente, Rafael Palacios,
Claudia Piriz, Juan P. Fuentes, Javier Jarauta,
(2019) "Detection of Jihadism in Social Networks Using Big
Data Techniques Supported by Graphs and Fuzzy
Clustering", Complexity, vol. 2019, Article
ID 1238780, 13 pages. https://doi.org/10.1155/2019/123878
0
[18] Azad, S., Gupta, A. (2011): A quantitative assessment on
26/11 mumbai attack using social network analysis. Journal
of Terrorism Research 2(2), .4-1-4
[19] Krebs, V. (2002) Mapping Terrorist Networks, Connections
24(3)