Embed Size (px)
Citation preview
1
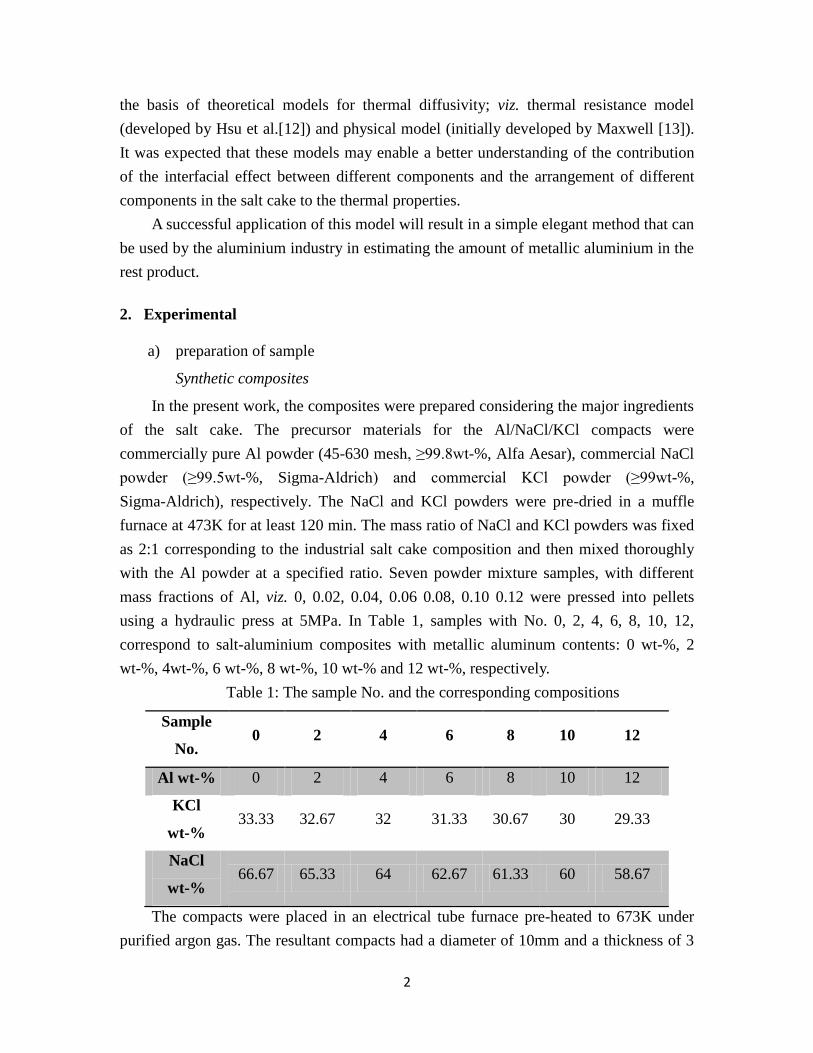
Thermal conductivity of Al-Salt composites
Peng Li1,2
, Lijun Wang2, Seshadri Seetharaman
1,3
1Department of Materials Science and Engineering, Royal Institute of Technology, SE-10044
Stockholm, Sweden
2State key Laboratory of Advanced Metallurgy, University of Science and Technology Beijing,
Beijing 100083, PR. China
3Institute of Iron and Steel Technology, TU-Bergakademy,
Freiberg, D-09599, Germany
1. Introduction
The present work was initiated with a view to examine the possibilities of
determining the amount of entrapped aluminium metal in the salt – slag mixture, which is
a mixture of chlorides of alkali metals mixed with Al2O3, AlN and other compounds[1-2],
a rest product after the secondary melting of aluminium. Basically, the way to judge the
value of aluminum dross depends upon its amount of metallic aluminum and chlorides.
“Skimming”, white dross, black dross and salt cake are the terms used depending on the
amount of metallic Al [3]. The entrapped metal, which can be as high as 5 % of the salt
cake is valuable from an economic view point. The present work has a wider objective of
total recycling of the entire rest product from secondary aluminium smelting, which,
apart from the economic advantage has a considerable positive effect on the environment.
A number of methods have been developed to ensure the accuracy of analytical
measurements based on the relationship between porosity and density with the amount of
metallic aluminum. [4–10]. However, such procedures require a higher level of
sophistication and may not be suitable in practical situations [11].
In this paper, an attempt is made by measuring the thermal diffusivity of composites
of the salts with metallic aluminium as a function of Al metal in the composite at room
temperature in order to examine the applicability of this method to salt cake from
aluminium remelting. The work was primarily directed to synthetic mixtures of the
chlorides with aluminium powder, mixed in various proportions with a view to see if the
results could be used as calibration values. One set of measurements were carried out as
well with salt cake from the industry. Attempts were also made to interpret the results on
2
the basis of theoretical models for thermal diffusivity; viz. thermal resistance model
(developed by Hsu et al.[12]) and physical model (initially developed by Maxwell [13]).
It was expected that these models may enable a better understanding of the contribution
of the interfacial effect between different components and the arrangement of different
components in the salt cake to the thermal properties.
A successful application of this model will result in a simple elegant method that can
be used by the aluminium industry in estimating the amount of metallic aluminium in the
rest product.
2. Experimental
a) preparation of sample
Synthetic composites
In the present work, the composites were prepared considering the major ingredients
of the salt cake. The precursor materials for the Al/NaCl/KCl compacts were
commercially pure Al powder (45-630 mesh, ≥99.8wt-%, Alfa Aesar), commercial NaCl
powder (≥99.5wt-%, Sigma-Aldrich) and commercial KCl powder (≥99wt-%,
Sigma-Aldrich), respectively. The NaCl and KCl powders were pre-dried in a muffle
furnace at 473K for at least 120 min. The mass ratio of NaCl and KCl powders was fixed
as 2:1 corresponding to the industrial salt cake composition and then mixed thoroughly
with the Al powder at a specified ratio. Seven powder mixture samples, with different
mass fractions of Al, viz. 0, 0.02, 0.04, 0.06 0.08, 0.10 0.12 were pressed into pellets
using a hydraulic press at 5MPa. In Table 1, samples with No. 0, 2, 4, 6, 8, 10, 12,
correspond to salt-aluminium composites with metallic aluminum contents: 0 wt-%, 2
wt-%, 4wt-%, 6 wt-%, 8 wt-%, 10 wt-% and 12 wt-%, respectively.
Table 1: The sample No. and the corresponding compositions
Sample
No. 0 2 4 6 8 10 12
Al wt-% 0 2 4 6 8 10 12
KCl
wt-% 33.33 32.67 32 31.33 30.67 30 29.33
NaCl
wt-% 66.67 65.33 64 62.67 61.33 60 58.67
The compacts were placed in an electrical tube furnace pre-heated to 673K under
purified argon gas. The resultant compacts had a diameter of 10mm and a thickness of 3
3
mm.
Salt cake sample
The industrial salt cake sample was subjected to chemical analysis. The assay is
presented in Table 2.
Table 2: The chemical analysis of raw salt cake
Composition Al2O3 Al AlN MgO Fe2O3 KCl NaCl SiO2 CaO
Mass % 39.71-41.71 3-5 7 4.21 2.67 10.69 22.28 6.64 1.8
As shown in the table, the salt cake contained nearly 32 mass % of alkali chlorides,
over 50 mass % non- metallic oxides, i.e. alumina, silicon oxide as major components.
Stewart [14] suggested that the following compounds may be present in aluminum
drosses: Al2O3, AlN, Al4C3, MgF2, NaAlCl4, KAlCl4, MgAl2O4 besides that, there are
also fluorides, carbides and organic materials, like ink, paint, etc. These are generally in
extremely small amounts.
The pieces of metallic aluminium which have a dull grey were picked out from a
certain amount of salt cake ranged in size from a maximum of about 2 cm down to about
1–2 mm. Some particles having metallic luster and some glassy coating were also picked
out. Both of those were crushed and grounded into finer particles. The fines were
separated using a 200 mesh sieve. The magnetic components in the large particle size
fraction were then separated by U-magnet, the rest is collected. From the mass of salt
cake and metallic aluminum, the content of metallic aluminium can be roughly estimated
as:
%metallic particle
saltcake
MAlwt
M
(1)
Where Al wt% is the content of metallic Al in the salt cake, Mmetallic-particle is the mass
of metallic aluminum, Msaltcakeis the mass of the salt cake.
The salt cake dross was crushed and ground into powders and sieved through 200
mesh sieve. The compacts of salt cake were made by following the same procedure as
above.
b) Thermal diffusivity measurements
The thermal diffusivity of the samples was carried out at Company of 703,
Aerospace Science and Technology Corporation, China. During the measuring, the top
surface of the pellet sample is irradiated with laser beam, which provides an
instantaneous energy pulse. The laser energy is absorbed on the top surface of a sample
4
and gets converted into the heat energy. The heat energy travels through the sample.
Immediately after the laser pulse, the temperature of the rear surface of the sample is
monitored by collecting the radiation using a photovoltaic infrared detector. The thermal
diffusivity, a, is calculated from Eq. 2[15]:
2
1/2
0.1388L
t (2)
Where L is the thickness of the sample and t1/2 is the time required for the
temperature of the rear surface to reach half of its maximum temperature.
The morphology of the samples was studied by optical microscopy (Olympus
Microscope PMG3). The porosity of compacts was determined by Micromeritics'
AutoPore IV 9500, Tsinghua University, China, applying various levels of pressure to a
sample immersed in mercury.
In both cases, the experiments were repeated in the case of selected samples.
3. Results
The results of the thermal diffusivities of the synthetic composites and the single
sample of the dross are presented in Table 3. The corresponding porosity values are also
presented in the same table.
Table 3: The thermal diffusivity and porosity results of different samples
Sample No. 0 2 4 6 8 10 12 Salt
cake
Thermal
Diffusivity/mm2s
-1
3.03 3.08 3.07 3.45 3.61 3.59 3.56 0.87
Porosity% 4.82 4.72 3.80 2.56 4.49 2.06 12.17
It is seen that the salt cake compact has a very high porosity and the thermal
diffusivity value is correspondingly low. In the case of the synthetic compacts, the
thermal diffusivity shows an increase with increasing content of metallic aluminium
except in the cases of samples 4, 10 and 12, for which the diffusivity is nearly constant
within the experimental scatter. There’s no doubt that with the increase of metallic Al in
the matrix, the porosity shows a tendency of decrease, even with facing the fact of the
lack of No.8 sample result and large deviation of sample10. These values are presented in
a graphical form in Fig. 1.
5
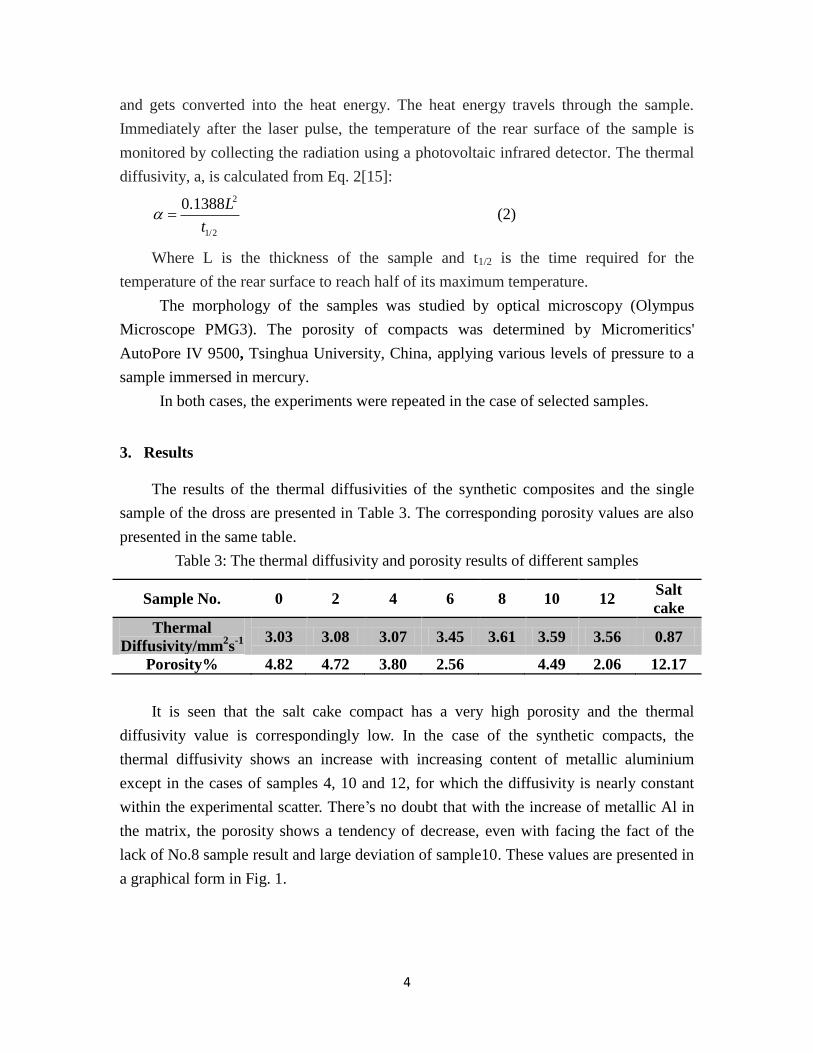
Fig.1: Results of thermal diffusivity and porosity measurements in the case of
salt-aluminium composites with different contents of metallic Al in the matrix.
It is seen in Fig. 1 that, samples with zero and 2 wt-% Al do not show any variation
in porosity. Beyond this, the porosity shows a tendency of decrease with the increase of
metallic Al in the matrix, with the exception of sample No.10, which shows a large
deviation from the general trend. It is also seen in this figure that the thermal diffusivity
initially shows a constant value up to 4 wt % Al in the composite, beyond which there is a
sharp increase with the increase of metallic aluminum content upto 8 wt % in the
composites. In the case of the samples with 10 and 12 wt % Al in the composite, the
values show a slight decreasing trend.
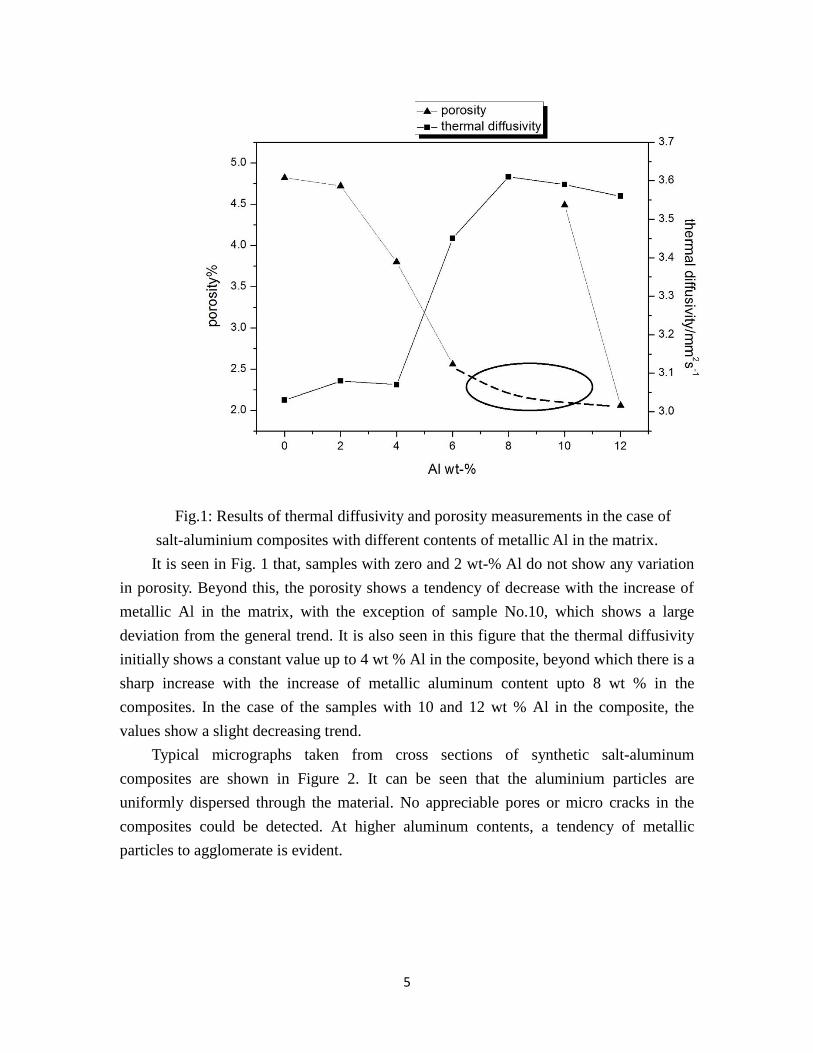
Typical micrographs taken from cross sections of synthetic salt-aluminum
composites are shown in Figure 2. It can be seen that the aluminium particles are
uniformly dispersed through the material. No appreciable pores or micro cracks in the
composites could be detected. At higher aluminum contents, a tendency of metallic
particles to agglomerate is evident.
6
Fig. 2: the surface optical microscope images of (a)No.6, (b) No.8, (c) No.10 and (d)
No.12 samples
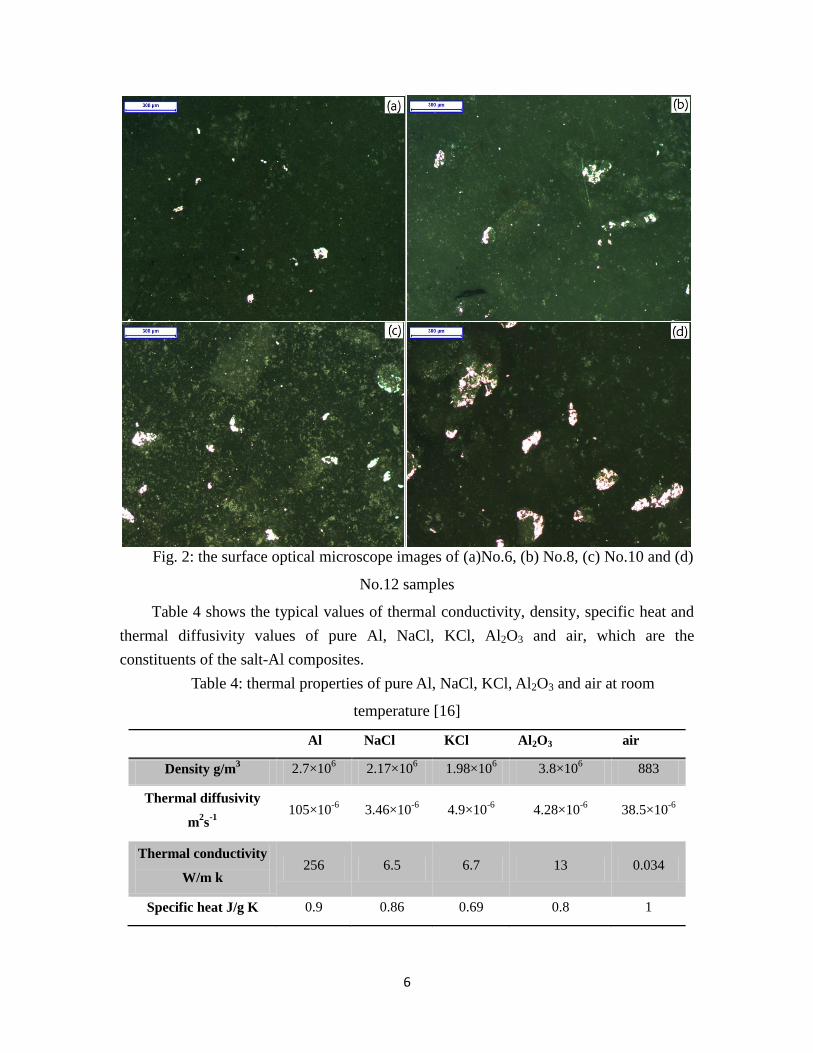
Table 4 shows the typical values of thermal conductivity, density, specific heat and
thermal diffusivity values of pure Al, NaCl, KCl, Al2O3 and air, which are the
constituents of the salt-Al composites.
Table 4: thermal properties of pure Al, NaCl, KCl, Al2O3 and air at room
temperature [16]
Al NaCl KCl Al2O3 air
Density g/m3 2.7×10
6 2.17×10
6 1.98×10
6 3.8×10
6 883
Thermal diffusivity
m2s
-1
105×10-6
3.46×10⁻⁶
4.9×10⁻⁶
4.28×10⁻⁶
38.5×10⁻⁶
Thermal conductivity
W/m k 256 6.5 6.7 13 0.034
Specific heat J/g K 0.9 0.86 0.69 0.8 1
7
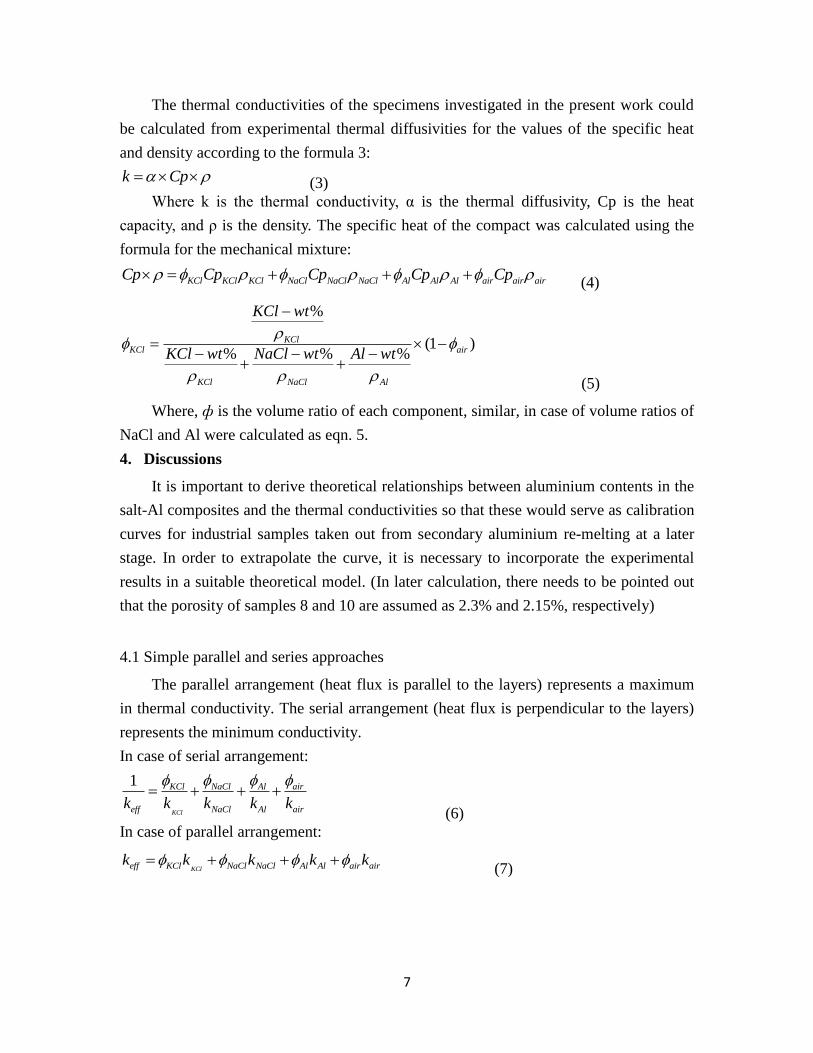
The thermal conductivities of the specimens investigated in the present work could
be calculated from experimental thermal diffusivities for the values of the specific heat
and density according to the formula 3:
k Cp (3)
Where k is the thermal conductivity, α is the thermal diffusivity, Cp is the heat
capacity, and ρ is the density. The specific heat of the compact was calculated using the
formula for the mechanical mixture:
KCl KCl KCl NaCl NaCl NaCl Al Al Al air air airCp Cp Cp Cp Cp (4)
%
(1 )% % %
KClKCl air
KCl NaCl Al
KCl wt
KCl wt NaCl wt Al wt
(5)
Where, ф is the volume ratio of each component, similar, in case of volume ratios of
NaCl and Al were calculated as eqn. 5.
4. Discussions
It is important to derive theoretical relationships between aluminium contents in the
salt-Al composites and the thermal conductivities so that these would serve as calibration
curves for industrial samples taken out from secondary aluminium re-melting at a later
stage. In order to extrapolate the curve, it is necessary to incorporate the experimental
results in a suitable theoretical model. (In later calculation, there needs to be pointed out
that the porosity of samples 8 and 10 are assumed as 2.3% and 2.15%, respectively)
4.1 Simple parallel and series approaches
The parallel arrangement (heat flux is parallel to the layers) represents a maximum
in thermal conductivity. The serial arrangement (heat flux is perpendicular to the layers)
represents the minimum conductivity.
In case of serial arrangement:
1
KCl
KCl NaCl Al air
eff NaCl Al airk k k k k
(6)
In case of parallel arrangement:
KCleff KCl NaCl NaCl Al Al air airk k k k k (7)
8
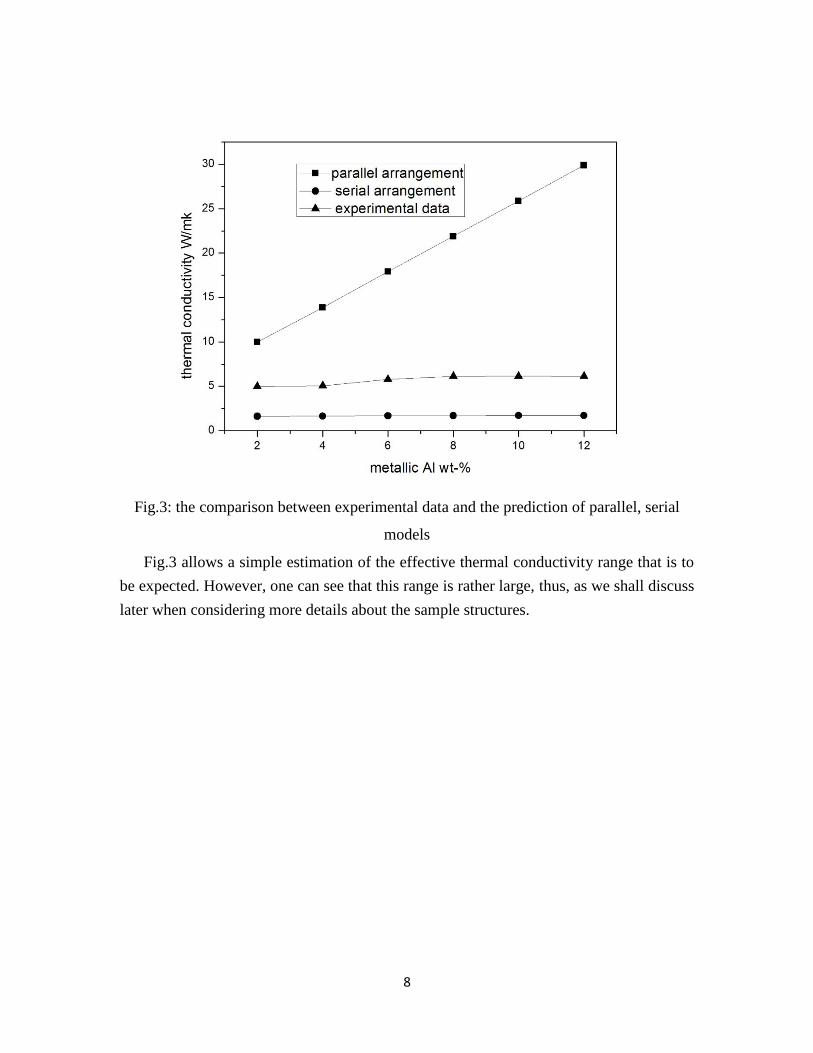
Fig.3: the comparison between experimental data and the prediction of parallel, serial
models
Fig.3 allows a simple estimation of the effective thermal conductivity range that is to
be expected. However, one can see that this range is rather large, thus, as we shall discuss
later when considering more details about the sample structures.
9
4.2 Hsu et al. approach
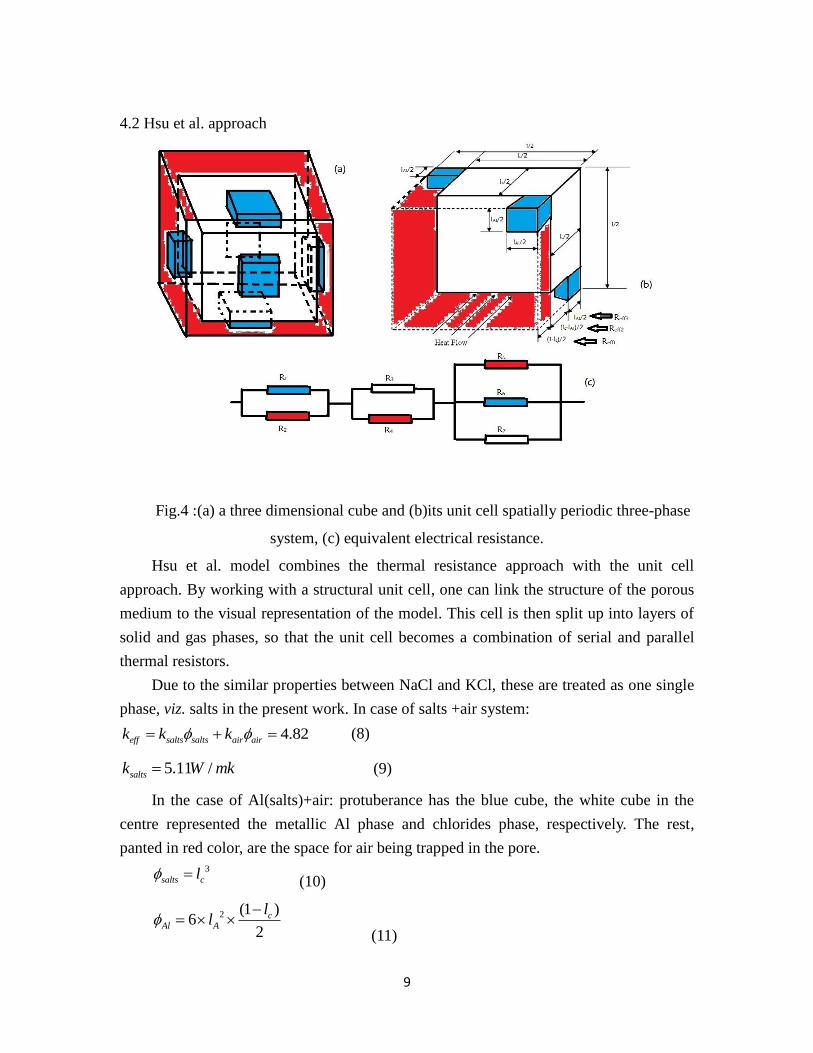
Fig.4 :(a) a three dimensional cube and (b)its unit cell spatially periodic three-phase
system, (c) equivalent electrical resistance.
Hsu et al. model combines the thermal resistance approach with the unit cell
approach. By working with a structural unit cell, one can link the structure of the porous
medium to the visual representation of the model. This cell is then split up into layers of
solid and gas phases, so that the unit cell becomes a combination of serial and parallel
thermal resistors.
Due to the similar properties between NaCl and KCl, these are treated as one single
phase, viz. salts in the present work. In case of salts +air system:
4.82eff salts salts air airk k k (8)
5.11 /saltsk W mk (9)
In the case of Al(salts)+air: protuberance has the blue cube, the white cube in the
centre represented the metallic Al phase and chlorides phase, respectively. The rest,
panted in red color, are the space for air being trapped in the pore.
3
salts cl (10)
2 (1 )6
2
cAl A
ll
(11)
10
Where, lc and lA are the length of cube cell for chlorides and metallic Al, respectively.
12
1
2
( )2
c
AlAl
l
Rl
k
2 2
1
2
1( )
4
c
Alair
l
Rl
k
(12)
3 2
2( )c Al
salts c
l lR
k l
4 2
2( )
(1 )
c Al
air c
l lR
k l
(13)
5 2
2
(1 2 (1 ) )
Al
air Al c c
lR
k l l l
6
2
(2 (1 ))
Al
Al Al c
lR
k l l
7 2
2 Al
salts c
lR
k l
(14)
ee 1 e 2 e 3 3 4 5 6 71 2
1 2 3 4 6 7 5 7 5 6
2 22 RR R Reff ff
ff ff ff
kR R R R RR R
R R R R R R R R R R
(15)
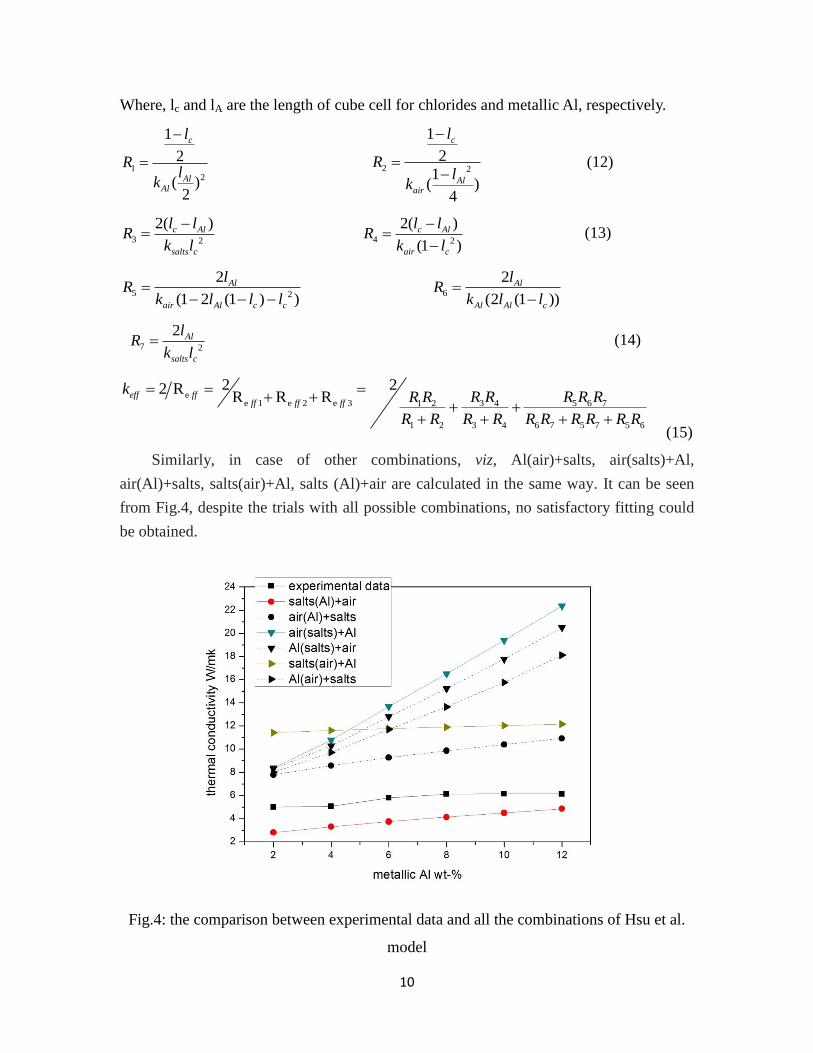
Similarly, in case of other combinations, viz, Al(air)+salts, air(salts)+Al,
air(Al)+salts, salts(air)+Al, salts (Al)+air are calculated in the same way. It can be seen
from Fig.4, despite the trials with all possible combinations, no satisfactory fitting could
be obtained.
Fig.4: the comparison between experimental data and all the combinations of Hsu et al.
model
11
4.3 Modified approach
4.3.1 parallel and serial arrangement
Fig.5: modified three-dimensional cube (a) its unit cell spatially periodic chlorides + air,
(b) its unit cell spatially periodic Al+ chlorides + air system.
It is important to estimate the sensitivity of metallic Al and air content to the
resistance of the matrix, individually, thus understanding their geometry arrangements. In
the real process, based on the observations that
a) metallic Al has a lager particle size than that of the chlorides, and also
b) the shapes may vary with different conditions due to the excellent ductility of
metallic Al.
Aluminium can be considered to behave more like a fluid working as binder
between the layers as shown in Fig.5b. It is normal to assume a serial air layer, as marked
layer 1 in Fig.5a. However, the resistance of serial air layer is extreme sensitive to the
thickness, i.e. (1-a) needs to be well-defined, otherwise, this would cause lager
derivations. It is safer to avoid such arrangement, describe the system instead, using the
arrangement as shown in Fig.5b.
In case of Al+ chlorides+ air system:
a 11
Al ,
a
saltsA
(16)
Where a is the thickness of the serial metallic aluminum layer, A is the area of serial salts
layer which faces to the heat flux.
12
e 1
1 aR ff
Alk
(17)
e 2
aR
(1 )ff
salts airA k A k
(18)
e 1 e 2
1
R Reff
ff ff
k
(19)
A comparison between the model calculation and experimental data is presented in Fig. 6.
4.3.2 Dunn et al. approach
Dunn et al.[17] have investigated the thermal conductivity of multiphase ellipsoidal
inclusion composites using Eshelby’s model[18]. The thermal conductivity of composites
containing pores can be considered as a special case of multiphase composites, and
therefore, can be obtained as follows:
( )( )1
3
m p c mm
cp c p m c p
k k k kk
k k k k k k
(20)
2
1
1 ( 1)p m
Fpk k
Fp
(21)
1
air
Al
Fp
(22)
Where Fp, kC, km, kP, and kcp are the volume fraction of pores, the thermal conductivities
of the fully dense composites, the matrix, the matrix with some porosity, and the
composites containing pores, respectively. Kc can be calculated by eqn. (23)[19-21],
where the interfacial thermal condition is taken into account on the basis of Eshelby’s
model.
2 (1 ) 3 ( 1)(1 2 )
(2 ) 3 ( 1)(1 )c m
F Fk k
F F
(23)
1
Al
air
F
Al
salts
k
k (24)
Where F is the volume fraction of the metallic Al, the parameter β represents the
interfacial thermal condition of the compositions. Value of β between 0 and ∞ represents
the range of interfacial thermal conditions. In composites, an internal stress in the grains
is generated by the mismatch and the scattering of the energy. Therefore, it is reasonable
that a value, β=8 can be assigned in order to express generically the micro structural
effect on the thermal conductivity of composites.
13
Fig.6: the comparison between experimental data and the prediction of parallel and serial
arrangement, Dunn et al. model.
In Fig.6, the curve with red line shows a lower sensitivity to the increase content of Al
in the compact compared with Dunn et al model, as a result of all of metallic Al phase
was arranged in the serial position. The possibility of some part of metallic Al phase may
be present on the parallel position was considered in these calculations, but this
contribution to the final value of thermal properties is so difficult to estimate.
Despite the difference between the experimental data and Dunn et al model, it is seen
that the trend regarding the increase of thermal conductivity with the increase of metallic
Al in the salt composite is reasonably well-represented considering the experimental
scatter and the uncertainties in the calculation of the thermal conductivities from the
thermal diffusivities. Thus, in the present work, Dunn et al. model was used to predict the
thermal conductivity in a narrow range of metallic Al in the salt cake corresponding to
various porosity levels so that the content of metallic Al in the salt cake from secondary
aluminium smelting can be estimated with reasonable accuracy. Such an exercise is
shown in Fig.7
14
Fig. 7: prediction by Dunn et al model with relate to different content of metallic Al
In order to compare the thermal conductivities of the salt-Al composites with that of
the industrial salt cake sample, some approximations have to be made with respect to the
density and the specific heat of the industrial sample. For the composition of aluminum
salt cake as presented in Table 2, it is assumed as the first approximation that the density
is close to that of Al2O3, i.e. 3.8g/cm3, the specific heat is close to 1J/gK. The thermal
conductivity in this case would be only 3.11W/mk. Thus, the thermal conductivities of
the salt cake from the aluminium industry would have a much lower thermal conductivity
(after making assumptions regarding the density and specific heat of the sample) than the
salt-sample composites used in the present work. Thiele [22] proposed that during the
skimming the first oxide formed at 700-850℃ temperature in industrial practice, a tight
protective layer of ɤ-Al2O3, a spinel-like cubic structure is formed around the metallic Al,
which brings the oxidation of the enclosed metal quickly to a halt. This insulating layer of
Al2O3 is compounded by the air layer surrounding each Al particle will affect the thermal
diffusivity value and lead a discrepancy as observed in the present work.
In the practical application, the interfacial condition of metallic Al particle in the salt
cake needs to be considered and which would vary with different types of drosses as
mentioned in the introduction section. It can be treated like β in the Dunn et al. modeling
15
to adjust the validity region of the prediction. Dross with high metal content usually has
a lower porosity due to the abundant liquid aluminum which could fill the existent pores.
[23, 24] The connectivity condition between the granules would be changed under such
circumstance compared with salt cake. Despite of so many variable factors, as long as
the contribution of free aluminum in the dross to the thermal conductivity falls into an
analyzable region, it could be a new standard method for evaluating of the aluminum
content.
5. Conclusions
Thermal diffusivity measurements as a function of temperature on salts-Al
composites having various compositions (0, 2, 4, 6, 8, 10, 12wt pct metallic Al) were
carried out in the present work. The thermal diffusivity and the thermal conductivity were
found to increase with the metallic Al content. The experimental results are in reasonable
agreement with the Dunn et al model.
The complexity of the salt cake leads a discrepancy compared with the prediction by
Dunn et al model based on the composition of reference salts-Al composites. Further
work will be focused on including the interfacial condition of metallic Al particle in the
salt cake as a new parameter in the thermal conductivity model for accurate prediction,
along with an estimation of the resistance offered by the oxide layer around aluminium
particles.
6. Acknowledgements
The authors would also like to thank the National Science Foundation of China for the
financial support (No 51072022, 51074009,50874013), Program for Talents youth in
USTB(FRF-TP-09-005B). The supply of aluminum dross by Stena Metall AB is
gratefully acknowledged.
Reference
1. S. Fukumoto, T. Hookabe, T. Kato and H.Tsubakino: J. Jpn. Inst. Light Met., 1996,
vol.46 (11), pp. 615-616.
2. S. Fukumoto, T. Hookabe and H. Tsubakino: J. Jpn. Inst. Light Met., 1998, vol.48 (4),
pp. 199–203.
3. P.E. Tsakiridis: Journal of hazardous materials 2012, vol.217-218, pp.1-10
4. O. Manfredi, W. Wuth, and I. Bohlinger: JOM., 1997, vol.47 (11), pp. 48–51.
16
5. R.D. Peterson and A. Revet, Recycling of Metals and Engineered Materials, ed. D.L.
Stewart, R. Stephensen, and J.C. Daley (Warrendale, PA: TMS, 2000), pp.
1035–1044.
6. D. Zeng and S. Campbell: Aluminium, 2000, vol.76, pp. 27–32.
7. P.G. Schirk, Light Metals 1997, ed. R. Huglen (Warrendale, PA: TMS, 1997), pp.
1163–1165.
8. R.P. Pawlek: Light Metal Age., 2000, vol.58, pp. 80–87.
9. H. Gripenberg et al., Recycling of Metals and Engineered Materials, ed. P.B.
Queneau and R.D. Peterson (Warrendale, PA: TMS, 1995), pp. 819–828.
10. D.G. Graczyk et al., Light Metals 1997, ed. R. Huglen (Warrendale, PA: TMS, 1997),
pp. 1135–1140.
11. V.Kevorkijan: JOM., 2002, vol.54 (2), pp. 34–36.
12. C. T. Hsu, P. Cheng and K. W. Wong: ASME—Journal of Heat Transfer., 1995, vol.
117, pp. 264–269
13. Maxwell, J. C., A Treatise on Electricity and Magnetism, 3rd
edition, vol. 1, pp.
435–440, Oxford University Press, Oxford, UK, 1904.
14. D.L. Stewart Jr., US Patent no. 5,057,194.
15. W.J. Parker, R.J. Jenkins, C.P. Butler and G.L. Abbott: J. Appl. Phys.,1961, vol. 32,
pp. 1679.
16. D.R. Lide (editor in chief), CRC Handbook of Chemistry and Physics, CRC Press,
Boca Raton, 2004.
17. M. L. Dunn et al., J. Compos. Mater., 1993, vol. 27, pp.1493–519.
18. H. Hatta and M. Taya: Int. J. Eng. Sci., 1986, vol. 24, pp. 1159-72.
19. D.P. H. Hasselman and L.F. Johnson: J.Compos. Mater., 1987, vol. 21, pp.508-15
20. Y. Benveniste and T. Moloh: Int. J. Eng. Sci., 1986, vol.24, pp.1573-52
21. Y. Benveniste and T.Moloh: J. Appl. Phys., 1987,vol. 61, pp.2840-43
22. W. Thiele: Aluminium, part I, 38 (11) (1962), pp.707– 715; part II, 38 (12) (1962), pp.
780–786.
23. K. Meyer, Pelletizing of Iron Ores (Berlin: Springer, 1980), pp. 24–27; 262–264.
24. J. Srb and Z. Ruzicková, Pelletization of Fines (Netherlands: Elsevier-Prague, 1988),
pp. 14–25.

17