Embed Size (px)
Citation preview

Journal of Modeling & Simulation in Electrical & Electronics Engineering (MSEEE) 9
Abstract— Microgrids are practical view of integration of
distributed generations (DGs) into distribution systems. In this
regard, utilizing appropriate technologies and accurate
recognition of energy generation and storage systems, as well as
optimal scheduling for these resources are of the paramount
importance in microgrids. Therefore, connection of DG resources
and storages to the grid in the form of virtual power plant in order
to increase efficiency and owners’ interest has attracted significant
attention of researchers and distribution network operators. This
research presents a model for optimal day-ahead scheduling of
heat-power generation units in a multi-zonal virtual power plant
(VPP). This VPP includes a number of combined heat-power
generations, distribution network loads, and electrical vehicles
with smart charging as well as energy storages. In order to
approach reality of distribution systems, uncertainty related to
behavior of electrical vehicles was modeled with Monte Carlo
simulation while uncertainties of generation and
electrical/thermal loads were modeled using a probabilistic
method. Matlab software and swarm robotics search & rescue
(SRSR) has been used as an optimization tool in this paper. Results
confirmed the effectiveness of the proposed method.
Keywords— renewable energy sources, energy storage,
combined heat and power generation, virtual power plant, load
uncertainty, electric vehicles.
I. INTRODUCTION
mart grids’ utilization has experienced a remarkable
increase in power grids; meanwhile, virtual power plants
(VPPs) have been promising tools to promote effective
penetration of distributed generations (DGs) and energy storage
devices in microgrids. To provide continuity of balancing
demand and generation, renewable sources will be more active
than today in near future due to the tendency of massive
investment on renewable energy sources (RESs) by countries.
However, due to the uncertain and intermittent nature of RESs,
RESs would create problems on power system operations such
as power quality, efficiency, stability and reliability. Owing to
having problems with RESs integration, virtual power plant
(VPP) has introduced to make this integration smooth without
compromising the grid stability and reliability along with
offering many other techno economic benefits [1].
In addition, VPPs, while working under supervision of a
generation coordinating unit, are strongly effective tools,
Z. Moravej, Faculty of Electrical and Computer Engineering Semnan
University, Semnan, Iran (e-mail: [email protected]).
S. Molaei, Faculty of Electrical and Computer Engineering, Semnan
University, Semnan, Iran (e-mail: [email protected]).
allowing consumers to respond to load management signals.
Load response can be economically beneficial both for
distributed energy resources (DERs) and the power grid itself
[2],[3]. A large number of researches carried out in this field
reflect the great attention of researchers to VPPs. Recently, the
idea of VPPs is extended to various generation resources like
renewable energy sources (RESs), combined heat and power
plants (CHPs), as well as controllable loads and energy storage
systems when acting as a unified power plant [4],[5]. In smart-grid framework, VPPs allow small plant owners to
access energy market in a “collective” form to compensate for
unanticipated power fluctuations due to wind farm and solar
energy utilization via coordinated operation of small power
plants [6]. Management systems of generation scheduling
coordination are the central core of a VPP, which communicate
using a communication infrastructure for data exchange [7].
Scheduling of generating units receive signals from power
farms (wind and solar) and market. This schedules and operates
generation power of each energy source which is done
regarding to market price signals, energy demand, wind speed,
and sunlight intensity. It takes into account the current energy
level of energy storage devices as well [8].
A new concept of VPP is presented in [6], taking into account
energy storages, CHP systems, RESs, responsive loads, and
also various forms of micro-generators as well as conventional
power plants. Based on this initial design, all resources
belonging to a given company exchange power with utility from
a common coupling point (CCP). In [9], authors built a CHP
dispatch model for wind-CHP system with solid heat storage
device aiming at minimizing system coal consumption, and set
system demand-supply balance and units’ operation conditions
as the operation constraints. Furthermore, robust stochastic
optimization theory has been utilized to describe wind power
output uncertainty in a small-scale VPP.
Recently, especially in [10], a new and challenging model for
VPP in the form of large-scale virtual power plant (LSVPP) has
been proposed and studied. In the mentioned research, various
power generators, storages and load sources are distributed in a
vast geographical area, while each of them has their own special
coupling point to utility. In [11], a bi-level scheduling approach
for VPPs and intermittent renewable DGs with a large number
of distributed thermostatically controlled loads is presented to
diminish the net exchange power deviation caused by the
A. Jodaei, Faculty of Electrical and Computer Engineering Semnan
University, Semnan, Iran (e-mail: [email protected]).
A smart Method for Multi-zonal Virtual Power
Plant Scheduling with Presence of Electric
Vehicles Zahra Moravej, Saeid Molaei, Alireza Jodaei
S

10 Volume 1, Number 2, August 2021
forecast error of renewable energy. Similar problems have been
solved in [12] using linear programming and in [13] using
stochastic programming. It should be noted that grid limitations
are not considered in [12]; also there is no possibility for load
reduction scheduling. However, the case study in this paper is a
system which includes only one thermal power plant and two
renewable energy sources with one common coupling point to
utility. In [14], the same authors have presented another case
study, in which focus is on minimizing operation costs instead
of maximizing profit. Other papers have considered different
time horizons and time steps using linear programming. In this
regard, [15] has focused on optimal strategies of load control in
real time, while [6] has regarded only annual average of
parameters (costs, prices, and energy generation) in order to
determine optimal annual planning. Authors in [6] have
presented a developed version of their algorithm with goal of
determining optimal storage capacity in VPP, taking into
account sensitivity analysis for price parameters in [8]. Concept
of VPP regional control has been well described in [13] and
[15], but presence of RESs has been overlooked in these works.
Also, model of thermal power plants in mentioned works is very
simple, since plant minimum power is not taken into
consideration, leading to over-simplification of power plants’
contribution problem. In [16] utilizing large number of DERs
in a VPP in order to generate and market both thermal and
electrical energy is proposed, however only thermal storage was
considered in case studies and price of energy and fuel has been
assumed to be constant.
The ultimate goal in [17] to determine the active demand power
required to increase system loading capability and to withstand
disturbances. The effect of different types of DG units in
simulations is considered and then the efficiency of each
equipment such as converters, wind turbines, electrolyzes, etc.,
is achieved to minimize the total operation cost and losses,
improve voltage profiles, and address other security issues and
reliability. The simulations are done in three cases and
compared with HOMER software to validate the ability of
proposed model. On the other hand, decreased dependency on fossil fuels and
reduced pollution are among the reasons for growing use of
electric vehicles (EVs) in personal transportation. In this regard,
plug-in hybrid EVs (PHEVs) has attracted many researchers, so
that in many researches EVs are present in VPPs. In [18], an
analytic based investigation on comparison between utilization
of bulk electrical storages and EVs for a VPP has been
accomplished. In other words, these technologies have been
compared in terms of business incentives and technical
performance. In [19], a VPP model with EVs and wind turbines
in LSVPPs has been considered. EV behavior has been
simulated with Monte Carlo model. Modeling is done on a 118-
bus network where operation costs and pollution emission were
considered as the objective functions. In [20], a stochastic
programming for VPP with presence of wind units, solar units,
and EVs has been presented, taking into account uncertainty. In
this work, enhanced particle swarm optimization algorithm
with fuzzy rules has been used for optimization, and multi-
objective function including optimization cost and network
reliability has been evaluated. In [21], a new method of VPP
operation was proposed for taking part in day-ahead energy
market. Uncertainty in generation, consumption, and prices was
modeled using a stochastic method. Monte Carlo simulation
was also considered in this work in order to model vehicle
random behavior. Presence of EVs in a VPP in order to provide
reserve has been modeled in [22]. In this paper, programming
was performed so that EVs will be charged when energy
exceeds consumption and will be discharged as reserves in
overload time. In [23], it was shown that how generation
scheduling coordination unit can manage its energy resources
in order to maximize aggregate daily profit (regarding buy and
sell price).
This research presents a new algorithm for VPP scheduling
optimization which simultaneously executes schedule for
generation unit contribution, thermal and electrical storages,
EVs, and load flow. Although there have been some efforts in
previous researches [10]-[15] on LSVPPs, none of them have
considered the following items simultaneously, which will be
addressed in this work:
1. Thermal aspects: local thermal loads, CHP units and
thermal power plant requirements.
2. Energy storage devices (both electrical and thermal).
3. Taking into account EVs in a LSVPP with smart
charge/discharge.
4. Considering consumer uncertainty in the form of a
statistical method.
Unlike [12] and [13], main focuses in [23] is optimization,
providing a general schedule for LSVPPs while system
limitations are present. In this research a regional scheduling
algorithm for VPPs is proposed taking into account consumer
uncertainty. An evolutionary algorithm has been used during
the simulations in order to examine the network in grid-
connected and islanded modes.
II. PROBLEM FORMULATION AND UNIT SCHEDULING
In this work, a group of VPPs were connected to a general
distribution network. Structural properties of elements in the
network including active source and storage capacity had been
determined in previous stages and might not change during the
operation.
A. Topology and model of VPPs
VPPs studied in this work were a complex of a generation
system connected to a radial general network separately and fed
through a sub-bus. Each VPP was modeled as shown in
Fig. 1. Economic profit and associated transactions of each
load and generation resource were not taken into account
separately within each VPP; consequently, LSVPP
optimization was considered as shown in
Fig. 2. In this network, only active power of elements was
investigated and reactive power and transmission line losses
were overlooked.
One of the important and emphasized points in this research
compared to previous ones, like [6], [8], [23], [24] is that in this
work only one VPP will not be investigated; but each VPP is
just an element of a larger network (LSVPP). Therefore, using
expressions proposed in [10], the present work focuses on a
LSVPP, regarding the real location of each RES in network.
Thermal section of the model connected to right side of the bus

Journal of Modeling & Simulation in Electrical & Electronics Engineering (MSEEE) 11
is a certain load which can be fed using CHP, boiler or thermal
storage device.
If thermal generation of a CHP exceeding network thermal
demand is not absorbed via thermal storage element because of
energy and/or power limitations, the surplus thermal energy
(Psur) will be released using a thermal converter. It should be
noted that both CHP and boiler are gas-fired. Electrical section
of the network is divided into two sub-sections; the first sub-
section is called internal part, including an automatic
conventional generator, the boundary of which is PCCi. This
part of the model, which regarding
Fig. 1 connects to the left side of bus, mainly consists of an
electrical consumer which can be fed via a CHP, an internal
RES, and/or an electrical storage device. The Second sub-
section includes an external RES which is able to sell energy to
network or internal part.
Fig. 1. A single VPP structure
Fig. 2. General network including n VPPs
B. Optimization Problem Structure
The proposed algorithm was executed in one hour steps.
Daily optimal operation algorithm was determined for the
dispatchable generation resources (boilers, CHPs, conventional
power plants) and energy storage devices. This work aims at
meeting thermal and electrical loads as well as maximizing
daily net benefit of VPP. Also this algorithm was designed so
as to allow load shedding and/or RES limitation in case of
severe shortage in transmission line capacity during LSVPP
islanded operation.
a) Restructured systems’ tariff
In order to form tariff for restructured systems, following
pricing mechanism is applied.
1. Energy sales tariff: when internal generated power (Pint)
is positive i.e. it sales energy to upstream network as well as
it meets the internal demand, in addition to the main sold
energy price, it deserves an extra earning as encouraging
tariff [25].
2. Fuel purchase tariff (generally natural gas): In case of
CHPs, regardless of type of consumption, to generate either
heat or electricity, a combination of the two prices is
considered as an encouraging tariff [25].
3. Incentive plan for RESs: It is an extra payment to the
total generated power, either consumed internally or sold to
upstream network.
C. Mathematical model
a) CHP
Electrical to thermal power conversion rate (λ) is considered
as a constant factor in this system.
,, ,.s s
chp ptch pt echp ptP P (1)
As shown in Eq. (2), the CHP power output is either zero or
a value between minimum technical power and nominal power.
min, max,, , ,. .s s s
echp pt echp ptchp pt echp pt chp ptP U P P U (2)
where, ,
schp pt
U indicates on/ off state of the units.
b) Thermal and electrical storage device
One of the main capabilities of the proposed algorithm is
optimizing thermal and electrical storage devices’ energy level
in each stage of time. Equations (3) and (4) state power limits
during charge/discharge for electrical and thermal storage
devices, respectively.
, , ,
, , ,
ses char p es pt es disc p
sts char p ts pt ts disc p
P P P
P P P
(3)
(4)
Each thermal or electrical storage device can be modeled via
applying related minimum and maximum allowable energy
levels. Batteries’ depth of discharge (DoD) has direct effect on
their life span [26]. Equations (5) and (6) refer to lower and
higher limits of electrical storage energies, respectively.
, min,, , ,
char dischar
, max,, , ,
char dischar
t tes start p es ps s
es p es pi es pi
i Ts i Ts
t tes start p es p s s
es p es pi es pi
i Ts i Ts
e eP P
e eP P
(5)
(6)
Equations (7) and (8) are related to thermal storage devices.
In order to include energy efficiency in operation cycle, charge
and discharge stages were considered completely separate.
, max,
, , ,
char dischar
, min,
, , ,
charg dischar
Te Tets start p ts p s s
ts p ts pi ts pi
i Ts i Ts
Te Tets start p ts ps s
ts p ts pi ts pi
i Ts i Ts
e eP P
e eP P
(7)
(8)

12 Volume 1, Number 2, August 2021
Ts and Te are start and end time of simulation,
respectively. At the end of simulation period, initial energy
level in all storages should be equal to one at the beginning of
operation period:
, , ,
char dischar
, , ,
char dischar
0
0
Te Tes s
es p es pi es pi
i Ts i Ts
Te Tes s
ts p ts pi ts pi
i Ts i Ts
P P
P P
(9)
(10)
If final energy level at the end of operation period differs
from initial value, for instance, when simulation algorithm is
applied for less than 24 hours, previous equations will change
to following ones:
, ,
, , ,
char dischar
, ,
, , ,
char dischar
Te Tees start p es final ps s
es p es pi es pi
i Ts i Ts
Te Tets start p ts final ps s
ts p ts pi ts pi
i Ts i Ts
e eP P
e eP P
(11)
(12)
c) Internal and external RESs
Internal and external RESs’ generated power can be limited
regarding predicted solar and wind powers:
, max,
, max,
0
0
sires pt ires pt
seres pt eres pt
P P
P P
(13)
(14)
Since generated power via RESs is presented into market
with the highest prices, limiting generated power and not using
RESs’ maximum generated power is not economical, as the
goal is to maximize VPP earning (in objective function). To this
aim, optimization algorithm disconnects RESs only in
conditions where either generation exceeds demand or network
faces high congestion.
d) Boiler
A boiler becomes active when CHP is not able to respond
fully to the thermal load. If fuel price changes during the day,
algorithm is capable of recognizing operation strategies in order
to avoid using boiler. This is one of the capabilities of proposed
method compared to those of previous researches regarding
VPPs [16]. Thermal power provided by boiler should remain in
its capacity limits:
max,,0 s
boil ptboil ptP P (15)
e) Load shedding
When it is not possible to respond to demand fully, because
of severe network limitations and lack of internal generation, a
deliberate load shedding limited to utmost γ, is planned by
limiting a part of electrical power demand.
, ,0 ssens pt el ptP (16)
f) NETWORK OBJECTIVES
Current in all transmission lines should not pass the
allowable thermal limit:
max,,s
lin ptlin ptP P (17)
Network radial topology allows simple power flow
calculation starting from first unit in
Fig. 2. If the algorithm is executed in islanded operation,
allowable power for the last line connected to substation is set
zero:
, 0lin NptP (18)
g) EV charging behavior
PHEV charging behavior is influenced by various factors
including charging strategy, number of PHEVs being charged
at the same time, charging type, battery state of charge (SOC),
capacity, charging start time, and charging time duration. In this
research, a smart strategy was considered for vehicle charging;
this means PHEVs would not necessarily be charged at any
hour they are connected to charging plugs. Main idea beyond
all smart charging strategies is that vehicles be charged when it
has maximum benefit both for vehicle owner and for network
operator. A normal distribution function is proposed as follows
in order to indicate complexity of using different smart charging
programs and charging start time [27]:
0.52
1( ) =1, =3
2
t
startf t e
start
(19)
Remaining charge state of battery is calculated from travelled
distance by vehicle. It should be noted that travelled distance by
a vehicle is presented as a logarithmic probability distribution
function [28]. Therefore, battery SOC is calculated using
vehicle travelled distance and its all-electric range (AER):
100%
0 m > AER
SOC AER m m AER
AER
(20)
Various types of PHEVs are available based on their AER,
e.g. PHEV-20, PHEV-30, PHEV-40, PHEV-60 where the
number indicates PHEV AER in terms of miles. In this
research, PHEV-20 was considered as it has been proven during
a long time that it has high usage potential in the market [29];
however, the proposed method is general and other types of
PHEVs can be replaced. Charging time of PHEVs is calculated
by the following formula:
1batD
C SOC DODt
P
(21)
It should be noted when PHEVs reach house, depending on
vehicle's need and regarding maximum DoD limits, (reported
as 80% [29]) charging starts, but charging duration is limited by
both charger performance level (p) and charger efficiency (η).
Charging rate, as shown in Table 1, is determined by the charging
level of charger. Level 1 and 2 are mainly used for PHEVs
capable of being connected at house. Level 3 was not
considered in this research, since it is used for public and
commercial transportation. In addition, battery capacity
distribution (Cbat) in a given range for each class, considered as

Journal of Modeling & Simulation in Electrical & Electronics Engineering (MSEEE) 13
a normal probability distribution in [28], is as follows:
2
4
bat batCbat
bat batCbat
MinC MaxC
MaxC MinC
(22)
Table 1. Various types of PHEV charger
Charger type Input voltage Max. Power
(Kw)
Level 1 120 VAC 1.44
Level 2 208-240 VAC 11.5
Level 3 208-240 VAC 96
Level 4 (DC) 208- 600 VDC 240
h) Thermal and electrical power balance
Regarding Fig. 1 and equations (24) and (25), power balance
in internal and external buses would be as follows:
, , , ,int, , ,
1
, ,,N int, int,1
s s s s s s sires pt es pt eens pt PHEV ptpt echp pt el pt
ps s s s s
eres pt eres itlin pt pt iti
P P P P P P P
P P P P P
(23)
(24)
In previous equations, power flow calculation starts from
VPP unit number 1. Also, thermal power balance can be
formulated as follows:
, , ,, , ,
, 0
s s s s schp p ts pt sur pttl pt echp p bil pt
ssur pt
P P P P P
P
(25)
D. Objective function
The objective function maximizes VPP total profit. To this
aim, following profits have been taken into account:
a) Energy sales and purchasing cost at PCCi
In each VPP unit, profit and cost from energy sale and
purchase (Cpcci) depend on exchanged power at PCCi and
energy sale and purchase price.
, ,int, int,
, ,int, int,
0
0
s s spcci pt es hpt pt
s s spcci pt ep hpt pt
P C c P
P C c P
(26)
b) ENCOURAGING PROFIT FOR RES UNIT
In ePCC , power generated by external RES (ERES) will
include the following profit (ePCCC ) if it is fully sold to
network:
, , ,s spcce pt eres h eres ptC c P (27)
In addition, internal RES (IRES) will receive following profit
if either its generated power is sold to utility or consumed by
internal loads:
, , ,s sicce pt ires h ires ptC c P (28)
c) Fuel cost
Fuel cost for power generation (cgg,h) is lower than cost for
thermal power generation (cgh,h) due to taxes [30]. Fuel cost
per (cttc) per unit p and time t is calculated through the
following equation:
, , ,, ,
, ,,
, , ,,
s s sttc pt boil pt chp ptboil pt echp pt
boil pt boil gh hboil p
chp pt chp gh h gg h
C C P C P
C f C
C f C C
(29)
(30)
(31)
In aforementioned equations, boilf converts ,gh hC to
cost, while chpf considers both ,gh hC and ,gg hC in order
to avoid considering taxes for CHP unit in current tariff
framework. Start-up costs are generally considered for large
thermal power generation units, while it is negligible for small
CHPs.
d) Cost of risk
Preplanned and intentional load shedding has heavy fines. In
order to avoid such outcomes, this cost is formulated as follows:
, ,h ,s ssens pt sens sens ptC C P (32)
During programming for units, the algorithm may plan an
intentional load shedding only when the network is operated in
islanded mode and network generated power does not meet all
demands.
e) Objective function final form
Final profit earned from all units’ operation during total time
period of generation plan is indicated as follows:
, , ,, ,1
max
NpTes s s s s
ires hu ttc hu sens hupcc hu pcc huu Ts h
C C C C Ci e
(33)
i) Uncertainty model in demand
In recent years, a large number of methods have been used in
order to model uncertainty due to DERs application as well as
consumption uncertainty especially in distribution level.
Among these methods are Monte Carlo-, Classic clustering-,
and Fuzzy-based algorithms. Probability or decision-tree
method can be very effective when parameters with uncertainty
are determined exactly. This method can be based on results,
like results from clustering method. Ease of implementation is
one of this method’s advantages [31]. In this paper,
consumption demand level uncertainty in electrical systems
was simulated based on this method [31].
In order to model consumer load uncertainty, different
methods have been presented for expected load percentage,
estimated calculation and corresponding probabilities.
Clustering is one of the most well-known methods, which can
be planned weekly, monthly, or annually. In this work, load
uncertainty was discretely modeled and probability tree method
was used to generate load uncertainty scenarios [31]. Based on
presented scenarios, VPP load demand is described in
Table 2. As shown in this table, hourly probabilities are

14 Volume 1, Number 2, August 2021
divided into two 12-hour periods, each of which has been
assigned to various probabilities. Regarding previous
researches in load anticipation, the highest probability (0.6) is
assigned to the most exact anticipation (100%), while other
anticipations have been modeled via lower probabilities.
Table 2. Discrete probability values for 24 hours ahead
Expected load
(Hours 13-24)
Expected load
(Hours 1-12) Probability
Scenario
Number
100 % 100 % 0.6 1
98 % 98.5 % 0.15 2
103 % 102 % 0.15 3
97 % 98 % 0.05 4
104 % 103 % 0.05 5
In this work, similar probability level for various load types
were considered in all regions. This means, proposed
probability structure in Table 2 is taken into account both for
electrical and thermal loads. Although this assumption is not
close to reality, since patterns and electrical and thermal load
levels are different in microgrids, it is considered for simulation
simplicity.
III. SWARM ROBOTICS SEARCH & RESCUE OPTIMIZATION
During recent years, beside the methods based on mixed
integer programing (MIP) [32]-[35], several heuristic methods
have been developed along with the advancements of large-
scale soft computing. In this paper, a recently developed
evolutionary algorithm called “Swarm Robotics Search &
Rescue (SRSR)” has been employed for optimization obligation
[36]. Flowchart depicted in Fig. 3 shows the procedure of
algorithm implementation. As opposed to the previous nature-
inspired algorithms, SRSR is inspired by artificial intelligence
of robots in cognitive swarm robotics. Details of optimization
algorithm are provided in [36].
IV. SIMULATION AND RESULTS
In this work, a multi-zonal VPP including five regions was
studied. Based on [32] and [38], incentive value for
photovoltaic generation unit is 400$ per megawatt. However,
this amount is 350$ /MW for wind power generation unit. Also
referring to [39] and [40] load loss cost is 8$ per kilowatt. Table
3 describes structural details of each VPP. System data is based
on [23]. To model vehicles’ behavior, Monte Carlo simulation
has been used in each studied scenario. Average and standard
deviation for daily travelled distance of PHEVs are assumed 33
and 20.4 miles, respectively [28]. In this paper, level 2 of
chargers was used according to Table 1. It is assumed that in
each of five VPPs, due to limitations in charger number and
vehicle plug-in technology, it is possible to connect utmost 15
vehicles. It should be also noted that regarding uncertainty of
vehicles’ presence in operation hour, some of them are not
accessible.
Fig. 3. Flow chart of the proposed SRSR algorithm
Table 4 shows market specifications and consumption
demand for each VPP in a 24-hour time horizon. In case studies
of this work, gas cost for thermal- ,gh hC and electrical-power
generation ,gg hC are considered 0.368$/m3 and 0.349$/m3,
respectively [23]. Fuel cost functions for CHPs are as follow:
, , ,,
, ,,
860,
860 min 0.25,
chp gh h gg h gh hchp p
gg h gh hchp p
f C C CLHV
C CLHV
(34)
where lower heating value (LHV) for natural gas is 8250
Kcal/m3. Also, 860 is kWh to kcal conversion ratio.
In this research, 1/4 of delivered gas for CHP was tax-free.
This means one fourth of delivered gas will be used for
electrical- and the remaining will be used for thermal-power
generation. Simplified function for boiler fuel cost is also
presented as:
, ,
860boil gh h gh hf C C
LHV (35)
Referring to [32] and [38], incentive value for photovoltaic
generation unit is 400$ per megawatt. This amount is 350$
/MW for wind power generation unit. Also referring to [39]
and [40], load loss cost is 8$ per kilowatt. Two various case
studies, including grid-connected and islanded operation, have
been done in this work.
A. Case study 1: grid-connected operation
In this case, in addition to presented operation objectives in
previous section, limitations associated with transmission lines
are also considered. It is expected that in peak hours, VPP uses
market transactions as well as VPP’s generating units and
storages in order to reduce costs, increase benefit and solve the
peak-shaving problem.

Journal of Modeling & Simulation in Electrical & Electronics Engineering (MSEEE) 15
Fig.4- Fig. 8 show the results related to operation status of
various units for each VPP.F shows scheduled generation of
CHP in 24-hour period in five regions. As expected, during last
hours of night, where energy market price is low, each region
meets a part or all of its demand from the market. Presence of
CHP results in small generators’ efficiency increase, as well as
it reduces natural gas purchase cost for boiler. At the hours
when upstream network electricity price is low, each region
purchasing electrical power from utility consumes part of it and
stores the remaining in storage devices; otherwise, each region
uses internal resources when utility electricity price is high, and
sells surplus electrical power to utility and hence reduces its
consumer costs.
Table 3. Structural data for generation units, storages, and transmission lines
Unit 5 Unit 4 Unit 3 Unit 2 Unit 1
150 90 80 80 50 max[Kw]echP
20 55 20 10 5 min[Kw]echP
45 33 25 33 30 %chp
1 0.9 1.1 0.7 1.5
1 5 1 5 7 [Kw]es charP
1 5 1 5 7 [Kw]es discP
30 20 10 60 30 max[Kwh]esP
4 0 0 20 10 min[Kwh]esP
7 20 0 60 18 [Kwh]es startP
7 5 5 10 5 [Kw]ts charP
7 5 5 10 5 [Kw]ts discP
30 40 20 70 40 max[Kwh]tsP
3 0 5 5 10 min[Kwh]tsP
10 40 10 50 20 [Kwh]ts startP
93 85 90 95 85 %boil
500 500 150 500 500 max[Kw]linP
Fig. 4 CHP electrical power for 24-hour ahead (case study 1)
Table 4. Electrical and thermal consumed and RES generated power price
Plant 5 Plant 4 Plant 3 Plant 2 Plant 1
Sal
e p
rice
Pu
rchas
e p
rice
Ho
ur
ER
ES
IR
ES
Th
. lo
ad
El.
lo
ad
ER
ES
IR
ES
Th
. L
oad
E
l. l
oad
E
RE
S
IRE
S T
h. lo
ad
El.
lo
ad
ER
ES
IR
ES
Th
. lo
ad
El.
lo
ad
ER
ES
IR
ES
Th
. L
oad
E
l. l
oad
6 0 0 140 0 0 60 32 11 0 33 107 0 0 0 121 0 0 99 156 63 106 1
2 0 0 135 0 0 60 67 7 0 33 99 0 0 0 86 0 0 99 132 53 106 2
4 0 0 112 0 0 59 78 0 0 33 112 0 0 0 98 1 0 99 110 51 106 3
1 0 0 89 0 0 60 67 0 0 33 110 0 0 0 73 0 0 99 110 50 106 4
0 0 0 101 0 0 60 44 2 0 33 145 0 0 0 74 6 0 99 140 51 106 5
0 0 0 78 1 0 60 54 7 0 33 145 3 0 0 93 6 0 100 104 52 106 6
0 2 2 131 0 3 59 68 2 3 34 89 0 2 2 84 0 2 92 167 63 106 7
0 5 79 129 1 5 60 104 4 5 35 134 6 5 98 104 2 5 84 156 67 125 8
1 11 86 149 0 11 60 57 7 10 50 105 3 9 112 121 2 2 10 184 73 135 9
0 3 71 123 4 3 59 123 7 2 61 120 0 2 105 146 6 2 88 219 80 135 10
1 7 90 152 1 7 59 109 2 8 68 132 0 6 117 175 4 7 88 208 80 135 11
0 13 75 106 4 11 59 87 2 12 70 169 0 11 100 178 13 11 83 177 80 135 12
1 15 1 137 4 12 59 62 0 15 70 122 10 12 86 105 6 14 92 113 70 135 13
0 13 0 125 4 11 60 84 24 11 65 154 16 12 117 133 9 11 97 156 69 135 14
0 7 2 108 4 7 60 88 0 8 65 107 0 6 105 150 13 7 97 123 73 135 15
0 2 22 126 24 3 60 63 0 2 68 142 3 2 115 148 9 2 97 207 79 135 16
3 24 82 134 17 24 60 96 0 24 67 151 3 24 117 172 2 24 97 217 80 135 17
0 17 83 107 11 19 59 58 0 16 58 129 24 17 112 160 24 17 95 222 71 135 18
6 10 83 133 4 10 59 67 0 11 50 137 3 10 111 119 24 10 95 204 66 135 19
6 5 68 113 4 5 59 76 0 5 40 132 16 5 102 115 4 5 95 193 67 125 20
13 3 2 99 4 3 59 58 1 3 44 99 16 3 2 59 4 2 96 141 72 125 21
24 0 0 132 0 0 60 56 0 0 33 96 0 0 0 48 6 0 95 86 77 125 22
17 0 0 129 0 0 60 45 0 0 32 149 0 0 0 56 2 0 94 100 67 125 23
13 0 0 87 0 0 60 56 0 0 32 93 0 0 0 55 1 0 93 99 63 106 24
It can be observed that the first unit is operated at its
maximum rate in order to meet electrical demand in most of the
hours. Since in most of the time, electrical demand is higher
than its generating capacity, this unit keeps its generation close
to maximum amount, providing the remaining from storage
sources, and if it lacks power, meets the remaining using
upstream utility power. For the fourth unit, this is the same from
10:00 to 16:00. The difference is that in this region, thermal
load demand is uniformly high. Therefore, it is economically
beneficial to use CHP instead of boiler to meet thermal loads
and sell surplus electrical power to energy market, regarding
higher energy purchase price. As it can be seen, met load by the
fifth unit at 16:00 is at its maximum thermal and electrical
amount. Since this unit has high generating capacity, its
generation reaches to maximum amount. It should also be noted
that, due to low market sale price (not being economical) and
storage limits, the fifth unit would not generate at its maximum
rate. Fig. 5 and Fig. 6 show daytime stored energy trend.
Regarding storage rate limitation, storage devices are capable
of storing power with known values. Also, it is assumed that in
order to increase storage devices’ lifetime, their end of schedule

16 Volume 1, Number 2, August 2021
level returns to initial level; so each region is limited not to
generate its maximum power in all hours. It should be noted
that VPPs’ priority sequence in power generation is internal
load demand, storage in limited storage devices, and finally sale
to market in case of surplus power. Therefore, it is not
economical for VPPs to operate CHPs in all hours in their
maximum rate.
Fig. 5 Electrical charge/ discharge state for 24 hours ahead (case study 1)
Fig. 6 Thermal charge/discharge state for 24 hours ahead (case study 1)
Depending on gas, electricity price and load patterns, RES
plants’ generation and technical limitations in CHPs of each
region, and electrical and thermal charge/discharge cycle may
be totally different. So, it is not easy to decisively investigate
power changes in storages. In addition to all mentioned
parameters, charge and discharge equality during an operation
interval is an objective which makes the anticipation of storage
device behavior even more complicated. Fig. 7 presents boiler
generated thermal power procedure during daily operation
period. As shown in the figure, corresponding to thermal load
increment of each region from 8:00 to 20:00, boiler operation
increases in mentioned time. This condition is also observable
for the second unit. Regarding that in mentioned hours, thermal
load of this region is much higher than CHP thermal generation
as well as thermal storage device capacity; boiler presence is a
necessity in order to compensate for power shortage. It should
be noted that, regarding CHP and storage performance near its
maximum rate during the mentioned hours, boiler performance
pattern in this region exactly coincides with thermal load
pattern.
Fig. 7 Thermal power by boiler (case study 1)
For instance, this state at 13:00 hours where second region
thermal load decreases dramatically for one hour, is obviously
observable; therefore, the second boiler, according to this
demand decrement, decreases its generation. Power flow in
interface transmission lines between regions and upstream
utility is shown in Fig. 8.
Fig. 8 Power flow of transmission line between regions (case study 1)
As shown, due to line high capacity, no line reaches its rated
value. It should also be noted that, transmission line in region 3
which has lower thermal limit, reaches close to its rated
capacity at 11:00 hours. Remarkable point is that power
analysis in of line 5 (connected to upstream utility sub-station)
show that unlike other times where upstream acts as a feeder, at
11:00 hours is seen as a load from LSVPP point of view. In this
condition, VPPs are capable of selling energy to upstream
network as well as feeding internal loads, and unlike other times
of day, performance of photovoltaic units, CHPs’ surplus
generation, and electrical storage devices, reverse power flow
direction in upstream connected transmission line. This
direction change in power flow is also seen during different
hours in other lines. Number of scheduled vehicles in 24-hour
ahead operation is shown in Fig. 9.
It is shown that number of vehicles conforms to network load
pattern to some extent, so that during peak time, number of
recruited vehicles increases; however compared to CHPs, this
conformity would not be so difficult; since, regardless of
conformity to load pattern, entering time of vehicle units to
parking would associate some percentage of uncertainty in the
charging procedure of a smart vehicle. Also, the amount of
battery charging when vehicle enters the parking will depend
on factors such as travelled distance, which is a random process
as well.
Journal of Modeling & Simulation in Electrical & Electronics Engineering (MSEEE) 17
Fig. 9 Number of EVs in operation horizon (case study 1)
Total benefit earned from VPPs’ operation conforms to
combination of gathered energies’ sales pattern and
encouraging subsides from external and internal RESs as well
as load pattern; while current costs’ pattern is generally a
combination of pattern of consumed electrical and thermal load
demand as well as energy purchase price from market.
Fig. 10 LSVPP financial transaction in 24 hour ahead (case study 1)
Fig. 10 shows operation costs, earnings and profits from
generation schedule. It should be noted that these relations and
pattern combinations are not linear. As it is shown and also
mentioned before, at 8:00 to 22:00 hours when electricity sale
price is higher, each region uses its internal units in order to
meet demand, so power purchased from utility decreases;
therefore, operation costs reaches its minimum value due to
higher generation. In this special study on VPP scheduling and
planning, mathematical expectation for resulted income
regarding Table 5 reached 534 dollars, which compared to the
case without load uncertainty, shows 3.5% reduction [23].
Table 5. Final operation profit expectation calculation in grid-connected
mode (case study 1)
Scenario
1
Scenario
2
Scenario
3
Scenario
4
Scenario
5 Profit[$] -520.83 -543.46 -566.08 -531.86 -584.46
Probability 0.6 0.15 0.15 0.05 0.05
Expected profit -534.745
B. CASE STUDY 2: ISLANDED OPERATION
In this case islanding operation of network is studied. In this
case part of the network disconnects from upstream distribution
network. In mentioned condition, network should keep dynamic
and static stability. To this aim, LSVPP generation schedule and
performance in islanded mode is one of the most important
problems related to distribution network operation, which was
studied in this paper. In this way, an exact schedule was
prepared for islanded system operation, taking into account
system reliability and adequacy. In order to execute this, it was
assumed that interface transmission line between last region
and upstream network substation, disconnects after an event.
This is shown in Fig. 11.
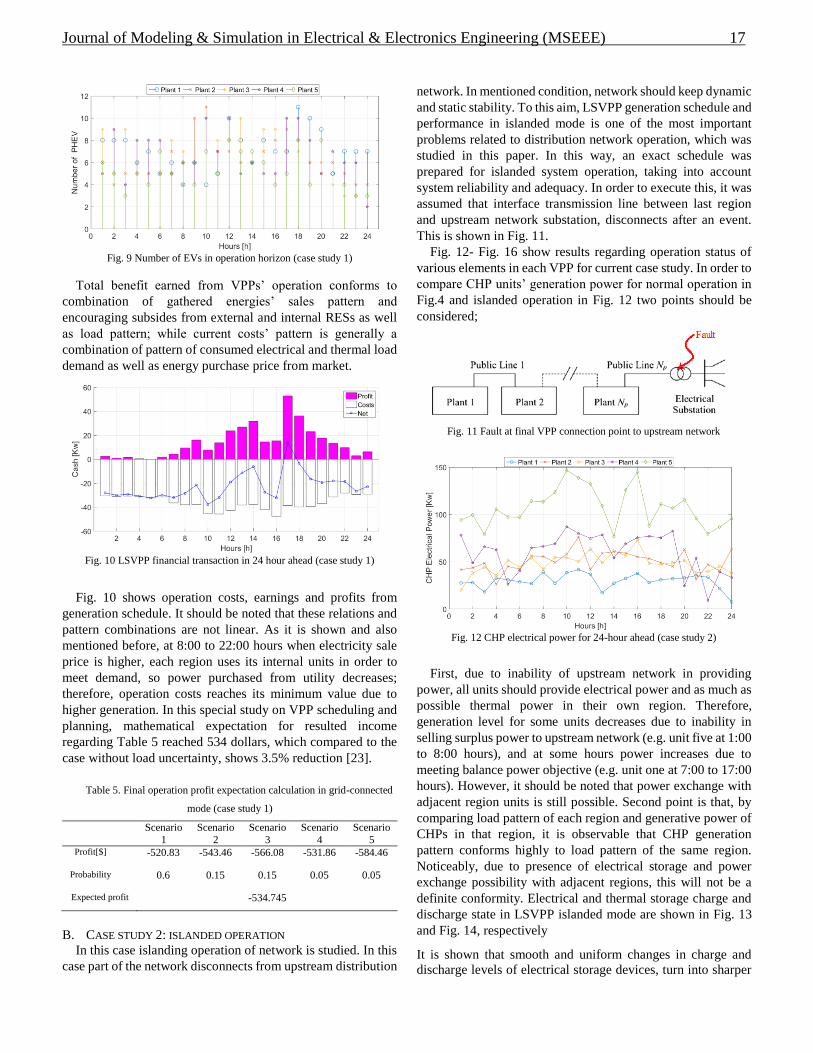
Fig. 12- Fig. 16 show results regarding operation status of
various elements in each VPP for current case study. In order to
compare CHP units’ generation power for normal operation in
Fig.4 and islanded operation in Fig. 12 two points should be
considered;
Fig. 11 Fault at final VPP connection point to upstream network
Fig. 12 CHP electrical power for 24-hour ahead (case study 2)
First, due to inability of upstream network in providing
power, all units should provide electrical power and as much as
possible thermal power in their own region. Therefore,
generation level for some units decreases due to inability in
selling surplus power to upstream network (e.g. unit five at 1:00
to 8:00 hours), and at some hours power increases due to
meeting balance power objective (e.g. unit one at 7:00 to 17:00
hours). However, it should be noted that power exchange with
adjacent region units is still possible. Second point is that, by
comparing load pattern of each region and generative power of
CHPs in that region, it is observable that CHP generation
pattern conforms highly to load pattern of the same region.
Noticeably, due to presence of electrical storage and power
exchange possibility with adjacent regions, this will not be a
definite conformity. Electrical and thermal storage charge and
discharge state in LSVPP islanded mode are shown in Fig. 13
and Fig. 14, respectively
It is shown that smooth and uniform changes in charge and
discharge levels of electrical storage devices, turn into sharper

18 Volume 1, Number 2, August 2021
changes in islanded mode in order to meet power balance
objective. The reason is that charge and discharge pattern of
these storages are more influenced by energy sale and purchase
price pattern in normal operation mode in order to increase VPP
profit, while in islanded mode this becomes the second priority
since rigid network operation objectives are of higher
importance in this condition. It should be noted that thermal
storages does not experience these high fluctuations; since there
are no thermal power transmission lines between existing
regions and in this case study, most changes of thermal storages
are only influenced by variation curve of CHP plants’ generated
thermal power. Regarding that this case study simulates special
operation condition, which may occur rarely during year, 10%
tolerance is allowable in storage devices’ charge and discharge
equality objective during the operation time.
Fig. 13 Electrical storage charge and discharge state for 24 hour
ahead (case study 2)
Fig. 14 Thermal storage charge and discharge state for 24 hour ahead (case
study 2)
Fig. 15 shows boiler generated power. It is indicated that
boiler power pattern highly conforms to thermal load demand.
This is well observable in region two boilers. It should be noted
that in some regions (such as region five), due to high CHP unit
capacity located in this region associated with thermal storage,
the main part of thermal load is fed by these two elements and
aforementioned point would not be applied for this case. Power
flow in transmission lines is shown in Fig. 16. Current in line
ended to upstream network is zero due to an event, which is the
reason of network being islanded. Compared to normal
operation, it is shown that in islanded mode, current flow in
most of the lines is decreased at most of the hours. This was
totally expected due to VPPs disconnection from upstream
network and inability of power exchange at peak hours to meet
a part of demand and at low market price hours to charge
batteries. Fig. 17 shows scheduled vehicle numbers for 24 hour
ahead operation. Fig. 18 shows income, cost and benefit from
operation of all VPPs. It is indicated that cost and income
pattern is so similar to case study 1.
Fig. 15 Generated thermal power by boiler (case study 2)
Fig. 16 Power flowing in interface transmission lines between the regions
(case study 2)
Although, hourly values of these parameters have experienced
some variations, transmission line disconnection from utility
would not have remarkable effect on how financial transactions
are done. One of the reasons is that sale and purchase price in
VPP point of common coupling to adjacent units does not differ
in this case study with previous one and only limitations are
power shortage supply and high load shedding costs. It is shown
that operation costs are also more than first case study; since
more use of fuel in order to generate more power causes more
operation cost. As shown, in this case study too fewer vehicles
have been utilized compared to previous one. Clearly, its reason
is decrease in network capacity for exchange with upstream
network. In this condition of VPP scheduling and operation,
regarding Table 6, mathematical expectation for resulted
income reaches to about -704 dollars which is 30% lower than
non-islanded operation state. It is certain that in normal
operation, due to sale and purchase possibility with upstream
network at hours when energy purchase price is low or when
energy price is high, transaction with market will result in more
profit for system operators. As shown, due to more boiler and
CHP utilization, operation costs increase, while due to surplus
power sales possibility to upstream network, incomes increase.
It should be noted that, in islanded operation mode, since all
regions have similar format, power shortage or surplus is almost

Journal of Modeling & Simulation in Electrical & Electronics Engineering (MSEEE) 19
similar for all regions; therefore, either in power shortage or
power surplus condition, reaching the most optimal operation
condition is not possible by only exchanging power with
adjacent regions, and this condition finally results in more
operation cost. Comparing Table 6 and Table 8 shows that, by
changing the case study, operation cost decreases from -
534.745 in normal conditions to -704.832 in islanded operation.
Accumulative benefit curve for two cases studies are shown in
Fig. 19.
Fig. 17 Electric vehicle numbers in operation time horizon (case study 2)
Fig. 18 LSVPP financial transaction in 24 hour ahead (case study 2)
Table 6. Final operation benefit expectation calculation in islanded operation
(case study 2)
Scenario 1
Scenario 2
Scenario 3
Scenario 4
Scenario 5
Profit [$] -707.17 -666.85 -718.93 -653.70 -799.58
Probability 0.6 0.15 0.15 0.05 0.05
Expected profit
-704.832
Fig. 19 Accumulative benefit cash flows.
V. CONCLUSION
In this paper, an optimal scheduling for LSVPP including
multiple regions was presented. Small VPPs were assumed
similar and connected to each other via transmission lines,
while the last unit was connected to upstream distribution
network substation. Each unit had RESs, storages (thermal and
electrical), CHPs and parking lot. The objective function of
network operation aimed at maximizing total VPPs benefit as
well as meeting thermal and electrical demand. Optimization
was done by an evolutionary algorithm and electrical load
uncertainty was modeled by scenarios based on discrete
probability distribution and mathematical expectation, while
vehicle behavior uncertainty was modeled using Monte Carlo
simulation. Two case studies, normal operation and islanded
operation, were considered and state of each element in VPP
were presented and analyzed via their performance curves in a
24 hour day-ahead period. It was shown that taking into account
load uncertainty compared to basic case, decreased costs, while
islanded operation caused increase in system operation costs. It
should also be noted that islanded operation occurred only in
rare and special cases and in short periods.
EFERENCES
[1] Yavuz, L., Önen, A., Muyeen, S. M., & Kamwa, I. (2019).
Transformation of microgrid to virtual power plant–a
comprehensive review. IET Generation, Transmission & Distribution, 13(11), 1994-2005.
[2] Nosratabadi, S. M., Hooshmand, R. A., & Gholipour, E. (2017). A
comprehensive review on microgrid and virtual power plant concepts employed for distributed energy resources scheduling in
power systems. Renewable and Sustainable Energy Reviews, 67,
341-363. [3] Nguyen, H. T., Le, L. B., & Wang, Z. (2018). A bidding strategy for
virtual power plants with the intraday demand response exchange market using the stochastic programming. IEEE Transactions on
Industry Applications, 54(4), 3044-3055.
[4] Kabalci, Y. (2016). A survey on smart metering and smart grid communication. Renewable and Sustainable Energy Reviews, 57,
302-318.
[5] Vanhoudt, D., Claessens, B. J., Salenbien, R., & Desmedt, J. (2018). An active control strategy for district heating networks and the effect
of different thermal energy storage configurations. Energy and
Buildings, 158, 1317-1327. [6] Kardakos, E. G., Simoglou, C. K., & Bakirtzis, A. G. (2015).
Optimal offering strategy of a virtual power plant: A stochastic bi-
level approach. IEEE Transactions on Smart Grid, 7(2), 794-806. [7] Braun, M. (2007). Technological control capabilities of DER to
provide future ancillary services. International journal of distributed
energy resources, 3(3), 191-206.

20 Volume 1, Number 2, August 2021
[8] Lombardi, P., Stötzer, M., Styczynski, Z., & Orths, A. (2011, July).
Multi-criteria optimization of an energy storage system within a Virtual Power Plant architecture. In 2011 IEEE Power and Energy
Society General Meeting (pp. 1-6). IEEE.
[9] Li, H., Tan, Z., Chen, H., & Guo, H. (2018). Integrated heat and power dispatch model for wind-CHP system with solid heat storage
device based on robust stochastic theory. Wuhan University Journal
of Natural Sciences, 23(1), 31-42. [10] Ramsay, C. and Aunedi, M., “Characterisation of LSVPPs”, Fenix
project, Del. D1.4.1. [Online]. Available:
http://fenix.iwes.fraunhofer. de/html/documents.htm [11] Vanhoudt, D., Claessens, B. J., Salenbien, R., & Desmedt, J. (2018).
An active control strategy for district heating networks and the effect
of different thermal energy storage configurations. Energy and Buildings, 158, 1317-1327.
[12] Zdrilić, M., Pandžić, H., & Kuzle, I. (2011, May). The mixed-
integer linear optimization model of virtual power plant operation. In 2011 8th International Conference on the European Energy
Market (EEM) (pp. 467-471). IEEE.
[13] Zamani, A. G., Zakariazadeh, A., Jadid, S., & Kazemi, A. (2016).
Stochastic operational scheduling of distributed energy resources in
a large scale virtual power plant. International Journal of Electrical
Power & Energy Systems, 82, 608-620. [14] Kuzle, I., Zdrilić, M., & Pandžić, H. (2011, May). Virtual power
plant dispatch optimization using linear programming. In 2011 10th
International Conference on Environment and Electrical Engineering (pp. 1-4). IEEE.
[15] Ruiz, N., Cobelo, I., & Oyarzabal, J. (2009). A direct load control model for virtual power plant management. IEEE Transactions on
Power Systems, 24(2), 959-966.
[16] Caldon, R., Patria, A. R., & Turri, R. (2004, September). Optimisation algorithm for a virtual power plant operation. In 39th
International Universities Power Engineering Conference, 2004.
UPEC 2004. (Vol. 3, pp. 1058-1062). IEEE. [17] Maanavi, M., Najafi, A., Godina, R., Mahmoudian, M., & MG
Rodrigues, E. (2019). Energy Management of Virtual Power Plant
Considering Distributed Generation Sizing and Pricing. Applied Sciences, 9(14), 2817.
[18] Okpako, O., Rajamani, H. S., Pillai, P., Anuebunwa, U., & Swarup,
K. S. (2017, September). A Comparative Assessment of Embedded Energy Storage and Electric Vehicle Integration in a Community
Virtual Power Plant. In International Conference on Wireless and
Satellite Systems (pp. 127-141). Springer, Cham. [19] Wang, M., Mu, Y., Jia, H., Wu, J., Yu, X., & Qi, Y. (2017). Active
power regulation for large-scale wind farms through an efficient
power plant model of electric vehicles. Applied Energy, 185, 1673-1683.
[20] Ju, L., Li, H., Zhao, J., Chen, K., Tan, Q., & Tan, Z. (2016). Multi-
objective stochastic scheduling optimization model for connecting a virtual power plant to wind-photovoltaic-electric vehicles
considering uncertainties and demand response. Energy Conversion
and Management, 128, 160-177. [21] Rostami, M. A., & Raoofat, M. (2016). Optimal operating strategy
of virtual power plant considering plug‐in hybrid electric vehicles
load. International Transactions on Electrical Energy Systems, 26(2), 236-252.
[22] Kahlen, M., & Ketter, W. (2015, February). Aggregating electric
cars to sustainable virtual power plants: The value of flexibility in future electricity markets. In Twenty-Ninth AAAI Conference on
Artificial Intelligence.
[23] Giuntoli, M., & Poli, D. (2013). Optimized thermal and electrical scheduling of a large scale virtual power plant in the presence of
energy storages. IEEE Transactions on Smart Grid, 4(2), 942-955.
[24] “World Wind Energy Association- Press Release”, http://www.wwindea.org,Feb.2009.
[25] Barsali, S., Ceraolo, M., Giglioli, R., & Poli, D. (2003, June).
Aggregation and management of the demand in a deregulated electricity market. In 2003 IEEE Bologna Power Tech Conference
Proceedings, (Vol. 4, pp. 4-pp). IEEE.
[26] Barsali, S., Bechini, A., Giglioli, R., & Poli, D. (2012, September). Storage in electrified transport systems. In 2012 IEEE International
Energy Conference and Exhibition (ENERGYCON) (pp. 1003-
1008). IEEE.
[27] Qian, K., Zhou, C., Allan, M., & Yuan, Y. (2010). Modeling of load
demand due to EV battery charging in distribution systems. IEEE transactions on power systems, 26(2), 802-810.
[28] Li, G., & Zhang, X. P. (2012). Modeling of plug-in hybrid electric
vehicle charging demand in probabilistic power flow calculations. IEEE Transactions on Smart Grid, 3(1), 492-499.
[29] Rezaee, S., Farjah, E., & Khorramdel, B. (2013). Probabilistic
analysis of plug-in electric vehicles impact on electrical grid through homes and parking lots. IEEE Transactions on Sustainable
Energy, 4(4), 1024-1033.
[30] Dulău, L. I., Abrudean, M., & Bică, D. (2014, September). Distributed generation and virtual power plants. In 2014 49th
International Universities Power Engineering Conference
(UPEC) (pp. 1-5). IEEE. [31] Saber, A. Y., & Venayagamoorthy, G. K. (2011). Resource
scheduling under uncertainty in a smart grid with renewables and
plug-in vehicles. IEEE systems journal, 6(1), 103-109. [32] Vanderbei, R. J. (2020). Linear programming: foundations and
extensions (Vol. 285). Springer Nature.
[33] Wong, J. Y. (2014). Testing the Nonlinear Integer Programming
Solver Here with Generalized Euler Bricks.
[34] Alemany, J., Magnago, F., Moitre, D., & Pinto, H. (2014).
Symmetry issues in mixed integer programming based Unit Commitment. International Journal of Electrical Power & Energy
Systems, 54, 86-90.
[35] Gil, E., Aravena, I., & Cárdenas, R. (2014). Generation capacity expansion planning under hydro uncertainty using stochastic mixed
integer programming and scenario reduction. IEEE Transactions on Power Systems, 30(4), 1838-1847.
[36] Bakhshipour, M., Ghadi, M. J., & Namdari, F. (2017). Swarm
robotics search & rescue: A novel artificial intelligence-inspired optimization approach. Applied Soft Computing, 57, 708-726.
[37] Italy4th Conto Energia (Summary), May 2011, European
Photovoltaic Industry Association. [38] ItalyAnnual Report, Aug. 2011, International Energy Agency Wind.
[39] Kariuki, K. K., & Allan, R. N. (1996). Evaluation of reliability
worth and value of lost load. IEE proceedings-Generation, transmission and distribution, 143(2), 171-180.
[40] Li, W. (2006). Expected Energy Not Served (EENS) Study for
Vancouver Island Transmission Reinforcement Project. Report-BCTC.