Embed Size (px)
Citation preview

IOP PUBLISHING MEASUREMENT SCIENCE AND TECHNOLOGY
Meas. Sci. Technol. 24 (2013) 125104 (10pp) doi:10.1088/0957-0233/24/12/125104
A six degree-of-freedom thrust sensor fora labscale hybrid rocketAnn M Wright1, Andrew B Wright2, Traig Born1 and Ryan Strickland1
1 Physics department, Hendrix College, 1600 Washington Avenue, Conway, AR 72032, USA2 Department of Systems Engineering, University of Arkansas at Little Rock, 2801 S University Avenue,Little Rock, AR 72204, USA
E-mail: [email protected]
Received 11 March 2013, in final form 5 September 2013Published 1 November 2013Online at stacks.iop.org/MST/24/125104
AbstractA six degree-of-freedom thrust sensor was designed, constructed, calibrated, and tested usingthe labscale hybrid rocket at the University of Arkansas at Little Rock. The system consistedof six independent legs: one parallel to the axis of symmetry of the rocket for main thrustmeasurement, two vertical legs near the nozzle end of the rocket, one vertical leg near theoxygen input end of the rocket, and two separated horizontal legs near the nozzle end. Each legwas composed of a rotational bearing, a load cell, and a universal joint above and below theload cell. The leg was designed to create point contact along only one direction and minimizethe non-axial forces applied to the load cell. With this system, force in each direction andmoments for roll, pitch, and yaw can be measured. The system was calibrated and tested usinga labscale hybrid rocket using gaseous oxygen and hydroxyl-terminated polybutadiene solidfuel. The thrust stand proved to be stable during calibration tests. Thrust force vectorcomponents and roll, pitch, and yaw moments were calculated for test firings with an oxygenmass flow rate range of 0.0174–0.0348 kg s−1.
Keywords: thrust, hybrid rocket, six degrees of freedom
(Some figures may appear in colour only in the online journal)
1. Introduction
In 1993, a labscale hybrid rocket facility with computer controland data acquisition system was designed and constructed atthe University of Arkansas at Little Rock (UALR). A labscalerocket is large enough to conduct many interesting studieswhile reducing the expense and danger associated with firinglarge rockets. The facility at UALR has aided the aerospacecommunity in numerous studies on hybrid rockets. Studies tocharacterize the physical parameters of the hybrid rocket suchas pressure in pre-combustion and post-combustion chambers,plume flicker, acoustical output, plume emission spectroscopy,and axial thrust have been conducted [1–3].
UALR’s hybrid rocket has used hydroxyl-terminatedpolybutadiene (HTPB) as the fuel and gaseous oxygen as theoxidant. The rocket is operated in a controlled oxygen-to-fuelratio range of 1.5–4.5, by varying the oxygen mass flow ina range of 0.018–0.037 kg s−1. At an oxygen-to-fuel ratio of2.074, HTPB burns stoichiometrically to carbon dioxide (CO2)
and water vapor (H2O). The temperature in the combustionchamber is above 3000 K. With HTPB fuel and a new nozzle,the maximum thrust is approximately 220 N (50 lbf) [1].
The system is ignited when oxygen and propaneare introduced into the combustion chamber. A RamseyElectronics PG13 plasma generator initiates a spark, whichlights the propane/oxygen mixture. This heat source ignitesthe fuel grain and begins the self-sustaining combustion. Oncethe fuel grain has been ignited, the chamber pressure, measuredby a Keller PAA-23S piezoresistive pressure transducer, iscontrolled by modulating the oxygen mass flow, through aTeledyne-Hastings HFC307 mass flow controller. The digitalprocessor is a PowerPC microprocessor on a dSpace DS1104controller board [1].
Thrust is the reactant force experienced by the rocket dueto the ejection of high velocity matter. The function of a thruststand is to restrain the body yet measure an adequate number offorces to define the thrust vector direction and magnitude. Priorto the construction of the new thrust sensor, the UALR hybrid
0957-0233/13/125104+10$33.00 1 © 2013 IOP Publishing Ltd Printed in the UK & the USA

Meas. Sci. Technol. 24 (2013) 125104 A M Wright et al
Figure 1. Rotation axis definitions.
rocket facility measured only the axial component of thrustusing a custom-designed s-beam sensor element [2]. Thrustwas measured using strain gages mounted on four aluminumsupport beams which supported the rocket. The support beamswere fixed on both ends, which forced them to deflect in theshape of a sigmoid curve during the firing. The flexing beamswere made from 2024-T81 aluminum with a yield strengthof 65 kpsi. General purpose strain gages from MeasurementsGroup (CEA-13-125UW-350) were placed on the beams toconvert strain to a voltage proportional to the thrust force. Atwo stage amplification circuit was built to collect the voltageoutput of the strain gages and produce a voltage between0 and 10 V. The voltage was collected by an A/D board at1000 Hz [1].
An instrument was designed to look down the bore ofthe UALR rocket while it was firing, and evidence that gaseswithin the combustion chamber are swirling was seen [3]. Themomentum transfer due to this turbulent flow will generatean external roll torque. It is unknown if this swirling flowpattern will generate a sufficiently large external torque toinduce a hybrid rocket powered vehicle to roll during flight.By measuring the torque experienced by the rocket on the teststand, atmospheric and aerodynamic effects are eliminatedand the contribution of the combustion process is isolated.Therefore, it was decided to create a new thrust sensor arraythat could measure the rotational moments including roll.
To completely specify the thrust vector, thrust must bemeasured in all three spatial directions. In addition to theforces, torques can cause motion called roll, pitch, and yaw.Collectively, the three spatial force components plus the threerotational moments are called the six degrees of freedom (dofs)for the rocket body. In a flying vehicle, the nose is defined as thefront of the vehicle, pointed in the direction of motion. Positiveroll is defined as a torque that produces a counter-clockwiserotation about the motion axis. A positive pitch is defined asa torque that brings the nose up. A positive yaw is defined asa torque that brings the nose towards the left side. In order tomeasure phenomenon such as roll, force measurements in theplane perpendicular to the axial axis must be measured. Forthis sensor, roll is defined as a rotation about the z-axis, pitchis a rotation about the x-axis, and yaw is a rotation about they-axis as shown in figure 1.
There are several ways to arrange sensors to measurethe thrust and moments of a rocket body. A search of the
literature will reveal several choices for sensors and geometrythat will allow a measurement of the six dofs. For example, areport from the Air Force Astronautics Laboratory [4] showsthree possible geometries that are useful for very large rockets(10 000–50 000 lbf thrust). Smaller rockets do not need asmuch support or constraint as the large-scale rockets, andarrangements such as a Stewart platform [5], where six sensorsare mounted in pairs to a platform mounted to the rocket, canbe used. An example of this geometry was used in a six dofthrust sensor for an RC-scale jet at Utah State University [6].Commercially available transducers are available, for examplefrom ATI Industrial Automation [7]. Both the Stewart platformgeometry and the ATI F/T sensor work best if the sensor ismounted parallel to the ground, with the rocket nose pointingstraight up. The UALR rocket is mounted horizontally, parallelto the ground, and must remain in that position due to thearrangement of the firing facility, with the safe zone for theplume pointing into an alley that can be guarded during firing.In order to use the ATI device, the rocket would need to becantilevered off of the device, which would put large forceson the transducer just to support the weight of the rocket, andwould decrease the level of safety due to the rocket beingconstrained only at the nose end.
The best choice of sensor array geometry for the UALRrocket was therefore a cage design that would work well inthe rocket’s current configuration, plus provide a high levelof safety as the thrust array held the rocket securely in place.Other benefits of this design included the ability to customizethe sensor sensitivity in each direction independently, theability to replace one sensor at a time in case of overloadfailure, and the educational benefits for the students involvedin the project. The end result is a highly sensitive thrust arraythat is simple and inexpensive enough that it can be built bycollege students, and safe enough to use for the range of forcesproduced by the UALR hybrid rocket. Installation requiredonly minor modification to the existing rocket facility, and thesensor array can easily be removed as needed.
2. Design of the six degree-of-freedom thrust sensorstand
The thrust stand has six uniaxial force elements located sothat each element carries a single component of the load:one parallel to the axis of symmetry of the rocket for mainthrust measurement, two vertical legs near the nozzle end ofthe rocket, one vertical leg near the oxygen input end of therocket, and two separated horizontal legs near the nozzle end(see figure 2). Each leg was composed of a rotational bearing,a load cell, and a universal joint above and below the load cell(see figure 3). The leg was designed to create point contactalong only one direction and minimize the non-axial forcesapplied to the load cell. The design was chosen for simplicityof analysis and assembly, ease of changing the fuel in betweenfirings, the ability to use readily available load cells, and theability to manufacture the pieces using basic machining skills.A free-body diagram of the rocket body and the location ofthe force measurements are shown in figure 2.
2

Meas. Sci. Technol. 24 (2013) 125104 A M Wright et al
Figure 2. Free-body diagram showing rocket body and force measurement placement.
Figure 3. Uniaxial leg with load cell.
Moments are measured by at least two elements and acouple is calculated from the two uniaxial forces and the knowndistances between the elements. For this stand, the separationdistances are a = 0.065±0.001 m and b = 0.140±0.001 m. Amatrix resulting from the static analysis of the frame gives therelation between the measured forces and the resultant forcesand moments acting on the frame as shown in equation (1):⎡
⎢⎢⎢⎢⎢⎢⎣
1 0 0 0 0 00 0 0 1 1 10 1 1 0 0 00 0 0 0 −a a0 b −b 0 0 00 0 0 b −b −b
⎤
⎥⎥⎥⎥⎥⎥⎦
⎡
⎢⎢⎢⎢⎢⎢⎣
A1
A2
A3
A4
A5
A6
⎤
⎥⎥⎥⎥⎥⎥⎦=
⎡
⎢⎢⎢⎢⎢⎢⎣
Fz
Fy
Fx
Mroll
Myaw
Mpitch
⎤
⎥⎥⎥⎥⎥⎥⎦(1)
where Ai are the six measured scalar force components of theuniaxial legs, 2a is the separation for the two front verticallegs, and 2b is the separation for the two mounting brackets(see figure 2).
Six uniaxial elements for the thrust sensor were designedand built. Each leg measured force along one direction while
directing all other forces to the other legs. Force isolationwas accomplished using universal joints at each end of theforce element and a roll element at the rocket contact point.The leg was attached to the rocket motor body, rather than atthe frame mounting point, so that no possibility of deflectionin the element could affect the measurement. The jointswere fabricated at Hendrix College and at UALR. The forcemeasurements were made using load cells from FGP Sensorsand Instrumentation [8] with maximum loads of 500, 100, and50 N.
Figure 3 shows the uniaxial leg design with a 100 N loadcell inserted. The leg is approximately 25 cm in length. Thepicture on the right shows the action of the two universal jointswhen subjected to an off-axis force. With the entire thruststand assembled, the universal joints are constrained enoughby the six legs so that displacement is never enough to collapsethe entire structure during firing. One of the benefits of alabscale rocket system is the ability to conduct multiple firingswith measurements such as fuel mass and nozzle diameter
3
Meas. Sci. Technol. 24 (2013) 125104 A M Wright et al
Figure 4. The assembled thrust stand. The thrust elements are numbered in the top-left picture.
in between each firing. Therefore, the thrust stand must bestable during the insertion and removal of the rocket body inbetween firings. To provide stiffness and protection of the loadcells during this process, custom aluminum bars were createdto span the load cells, providing protection against hyperextension or compression for the load cells. These aluminumbars were placed on the legs during assembly and disassemblywhen the rocket body was removed for fuel changes andmeasurements and cleaning. The bars were removed duringall measurements. Figure 4 shows four views of the assembledthrust stand in firing and measuring configuration.
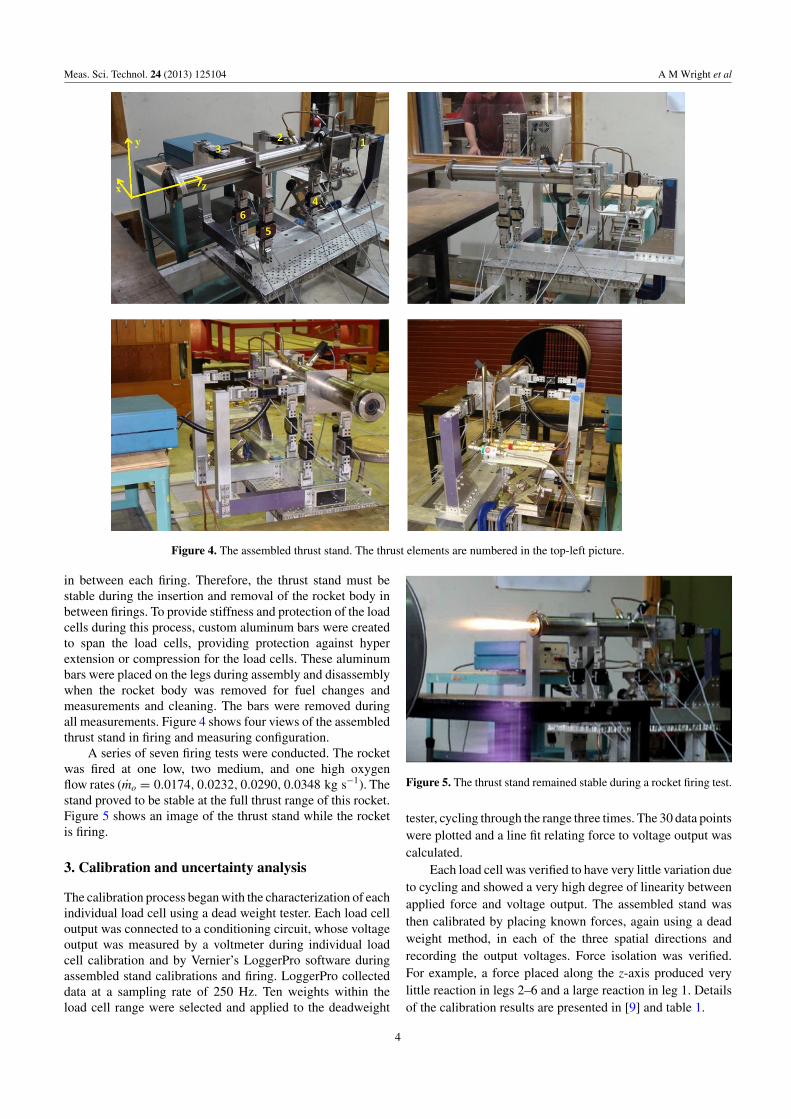
A series of seven firing tests were conducted. The rocketwas fired at one low, two medium, and one high oxygenflow rates (mo = 0.0174, 0.0232, 0.0290, 0.0348 kg s−1). Thestand proved to be stable at the full thrust range of this rocket.Figure 5 shows an image of the thrust stand while the rocketis firing.
3. Calibration and uncertainty analysis
The calibration process began with the characterization of eachindividual load cell using a dead weight tester. Each load celloutput was connected to a conditioning circuit, whose voltageoutput was measured by a voltmeter during individual loadcell calibration and by Vernier’s LoggerPro software duringassembled stand calibrations and firing. LoggerPro collecteddata at a sampling rate of 250 Hz. Ten weights within theload cell range were selected and applied to the deadweight
Figure 5. The thrust stand remained stable during a rocket firing test.
tester, cycling through the range three times. The 30 data pointswere plotted and a line fit relating force to voltage output wascalculated.
Each load cell was verified to have very little variation dueto cycling and showed a very high degree of linearity betweenapplied force and voltage output. The assembled stand wasthen calibrated by placing known forces, again using a deadweight method, in each of the three spatial directions andrecording the output voltages. Force isolation was verified.For example, a force placed along the z-axis produced verylittle reaction in legs 2–6 and a large reaction in leg 1. Detailsof the calibration results are presented in [9] and table 1.
4

Meas. Sci. Technol. 24 (2013) 125104 A M Wright et al
Table 1. Individual load cell calibrations. Ai is the force on leg i inN, Vi is the voltage output from the load cell on leg i in V.
Leg Load cell Calibration Uncertainty,no. Direction limit (N) curve σAi (N)
1 z 500 A1 = 174.20V1 − 0.42 0.2282 x 50 A2 = 10.854V2 − 3.725 0.2823 x 50 A3 = 9.805V3 + 0.0 0.2804 y 100 A4 = 45.525V4 − 0.594 0.2885 y 100 A5 = 44.119V5 − 2.021 0.2866 y 100 A6 = 40.935V6 + 0.623 0.285
Uncertainties in the individual leg force measurementswere calculated using the standard least-squares fitting method[10]. Given a line fit, y = mx + b through N data points,the uncertainty in y is given by equation (2), and resultsfor uncertainty in the individual leg force measurements arepresented in table 1:
σy =
√√√√ 1N − 2
N∑
i=1
(y − b − mxi)2. (2)
Uncertainties in the total force and moment measurementswere calculated using propagation of error. For a function,f = f (x, y, z), the uncertainty in f is shown in equation (3):
σ f =
√(∂ f∂x
σx
)2
+(
∂ f∂y
σy
)2
+(
∂ f∂z
σz
)2
. (3)
Equation (3) was applied to the force and momentformulae presented in equation (1), and results are presentedin table 2. Numerical results are given for the distance andforce measurements, since they do not depend numerically onmeasured values that changed during the experiments. Theuncertainties for the moments were calculated in softwareanalysis for each individual measurement, and results are givenin table 5.
During analysis, all forces and offsets present prior toignition, including weight of the rocket in the y-direction, andthrust produced in the z-direction due to the oxygen flow,were first subtracted. The following results show forces andmoments due purely to the combustion process and rocketnozzle dynamics.
-20-10
0102030405060
4 6 8 10 12 14
Forc
e-z
(N)
Time (s)
-20
0
20
40
60
80
100
8 10 12 14 16 18
Forc
e-z
(N)
Time (s)
-200
20406080
100120
10 12 14 16 18
Forc
e-z
(N)
Time (s)
(a)
(b)
(c)
Figure 6. Axial thrust measurement at oxygen flows:(a) 0.0174 kg s−1, (b) 0.0290 kg s−1, and (c) 0.0348 kg s−1.
4. Results
4.1. Axial thrust measurement
Figures 6(a)–(c) shows the axial force (Fz) measurement for therocket firing at a representative low, medium, and high oxygenflow rate. Note that the oxygen flow controller was set to ramp-up the oxygen flow, and that it took several seconds for the flowrate to reach the maximum set value during each firing run. Thisgradual increase in oxygen flow and thrust reduced the stresson the rocket and thrust sensors plus increased the safety during
Table 2. Uncertainty in measurements.
Measurement Uncertainty
a = 0.065 m σa = 0.001 mb = 0.140 m σb = 0.001 m
Fx = A2 + A3 σFx =√
σ 2A2 + σ 2
A3 = 0.397 N
Fy = A4 + A5 + A6 σFy =√
σ 2A4 + σ 2
A5 + σ 2A6 = 0.496 N
Fz = A1 σFz = σA1 = 0.228 N
Mroll = a (A6 − A5) σMroll =√
a2(σ 2
A6 + σ 2A5
)+ σ 2
a (A6 − A5)2
Myaw = b (A2 − A3) σMyaw =√
b2(σ 2
A2 + σ 2A3
)+ σ 2
b (A2 − A3)2
Mpitch = b (A4 − A5 − A6) σMpitch =√
b2(σ 2
A4 + σ 2A5 + σ 2
A6
)+ σ 2
b (A4 − A5 − A6)2
5

Meas. Sci. Technol. 24 (2013) 125104 A M Wright et al
Table 3. Average force component summary.
O2 flow (kg s–1) Fx (N) Fy (N) Fz (N) |F| (N) %Fx %Fy %Fz
0.0174 0.14 ± 0.40 2.54 ± 0.50 39.07 ± 0.23 39.15 ± 0.23 0.4 6.5 99.80.0232 2.72 ± 0.40 7.24 ± 0.50 15.34 ± 0.23 51.92 ± 0.24 5.2 13.9 98.90.0232 2.33 ± 0.40 7.75 ± 0.50 50.90 ± 0.23 51.54 ± 0.24 4.5 15.0 98.80.0290 5.33 ± 0.40 19.20 ± 0.50 71.07 ± 0.23 73.81 ± 0.26 7.2 26.0 96.30.0290 4.33 ± 0.40 16.91 ± 0.50 64.58 ± 0.23 66.90 ± 0.25 6.5 25.3 96.50.0348 3.70 ± 0.40 7.90 ± 0.50 87.30 ± 0.23 87.73 ± 0.23 4.2 9.0 99.50.0348 3.13 ± 0.40 6.95 ± 0.50 80.15 ± 0.23 80.51 ± 0.23 3.9 8.6 99.6
0.0
20.0
40.0
60.0
80.0
100.0
0.015 0.025 0.035 0.045
Ave
rage
Fz
(N)
Oxygen mass flow (kg/s)
Figure 7. Average axial thrust (Fz) versus oxygen flow rate.
the firings. All measurements of force and rotation momentswere collected from the time intervals when the oxygen flowwas at the set point, usually the last 1–2 s of the firing.
A summary of axial thrust data is presented in figure 7. Foreach set of data, the average thrust was calculated for a sectionof the data after the rocket had achieved the set oxygen flowrate. The thrust oscillations inherent in all hybrid rocket motorsis present in all of the data. The oscillations are a superpositionof several frequencies, and are caused by a number of physicalfactors. For example, acoustic standing waves contribute to theoscillations as well as a phenomenon called chuffing in whichthe fuel is liquefied, burned, and soot is ejected in a cyclicmanner [11]. The standard deviations of the thrust data werecalculated over the same interval as the average thrust andare presented as error bars in figure 7. The standard deviationdoes not represent error in the force measurement, but rathera crude indication of oscillation magnitudes. Uncertainties inthe thrust measurement were computed using the equations intable 2 and results are presented in table 3.
4.2. Measurement of force in x-direction
The x-axis is parallel to the ground and perpendicular to therocket body in this thrust stand. Forces in this direction willprimarily contribute to a yaw rotation. Representative data forthree oxygen flow rates are presented in figure 8. Figure 9presents the average and standard deviation for force in thex-direction as a function of oxygen flow rate. Measurementuncertainty analysis results are presented in table 3.
4.3. Measurement of force in y-direction
The y-axis is in the vertical direction and perpendicular tothe rocket body in this thrust stand. Forces in this direction
-8-6-4-20246
4 6 8 10 12 14
Forc
e-x
(N)
Time (s)
-10
-5
0
5
10
15
8 10 12 14 16 18
Forc
e-x
(N)
Time (s)
-10
-5
0
5
10
10 12 14 16 18 20
Forc
e-x
(N)
Time (s)
(a)
(b)
(c)
Figure 8. Measured force in x-direction at oxygen flows:(a) 0.0174 kg s−1, (b) 0.0290 kg s−1, and (c) 0.0348 kg s−1.
-3.0-2.0-1.00.01.02.03.04.05.06.07.0
0.015 0.020 0.025 0.030 0.035 0.040Ave
rage
Fx
(N)
Oxygen mass flow (kg/s)
Figure 9. Average measured force in x-direction versus oxygenmass flow.
6

Meas. Sci. Technol. 24 (2013) 125104 A M Wright et al
-20
-10
0
10
20
30
4 6 8 10 12 14Forc
e-y
(N)
Time (s)
-20
-10
0
10
20
30
40
8 10 12 14 16 18Forc
e-y
(N)
Time (s)
-25
-15
-5
5
15
25
10 12 14 16 18
Forc
e-y
(N)
Time (s)
(a)
(b)
(c)
Figure 10. Measured force in the y-direction at oxygen flow rates:(a) 0.0174 kg s−1, (b) 0.0290 kg s−1, and (c) 0.0348 kg s−1.
-5.00.05.010.015.020.025.030.0
0.015 0.025 0.035 0.045
Ave
rage
Fy
(N)
Oxygen mass flow (kg/s)
Figure 11. Average measured force in y-direction versus oxygenmass flow.
will primarily contribute to a pitch rotation. Data for the threeoxygen flow rates are presented in figure 10. Figure 11 presentsthe average and standard deviation for force in the y-directionas a function of oxygen flow rate. Uncertainty analysis resultsare presented in table 3.
4.4. Measurement of roll moment
The roll moment indicates the tendency for the rocket to rotateabout the axis of symmetry of the rocket body as shown infigure 1. Data for the three representative oxygen flow rates isshown in figure 12. The average roll moment is presented infigure 13. Uncertainties in the roll moment measurement werecomputed using the formula presented in table 2. Uncertaintyresults are presented in table 5.
-1
-0.5
0
0.5
1
4 9 14
M-r
oll (
Nm
)
Time (sec)
-4
-3
-2
-1
0
1
8 10 12 14 16 18
M-r
oll (
Nm
)
Time (s)
-5
-3
-1
1
3
5
10 12 14 16 18 20M
-rol
l (N
m)
Time (s)
(a)
(b)
(c)
Figure 12. Measured roll moment at oxygen flow rates:(a) 0.0174 kg s−1, (b) 0.0290 kg s−1, and (c) 0.0348 kg s−1.
-2.0
-1.5
-1.0
-0.5
0.0
0.5
0.015 0.020 0.025 0.030 0.035 0.040
Ave
rage
M-r
oll
(Nm
)
Oxygen mass flow (kg/s)
Figure 13. Average roll moment versus oxygen flow.
4.5. Measurement of yaw moment
The yaw moment indicates the tendency for the rocket nose tomove left (positive) or right (negative) as shown in figure 1.Data for three representative oxygen flow rates is shown infigure 14. The average yaw moment is presented in figure 15.Uncertainties in the yaw moment measurement were computedusing the formula presented in table 2. Uncertainty results arepresented in table 5.
4.6. Measurement of pitch moment
The pitch moment corresponds to motion of the rocket noseup (positive) or down (negative) as shown in figure 1. Datafor the three representative oxygen flow rates is shownin figure 16. The average pitch moment is presented infigure 17. Uncertainties in the pitch moment measurementwere computed using the formula presented in table 2.Uncertainty results are presented in table 5.
7

Meas. Sci. Technol. 24 (2013) 125104 A M Wright et al
-1
-0.5
0
0.5
1
4 9 14 19
M-y
aw (N
m)
Time (s)
-2.5-2
-1.5-1
-0.50
0.51
8 10 12 14 16 18
M-y
aw (N
m)
Time (s)
-2
-1.5
-1
-0.5
0
0.5
1
10 12 14 16 18 20
M-y
aw (N
m)
Time (s)
(a)
(b)
(c)
Figure 14. Measured yaw moment at oxygen flow rates:(a) 0.0174 kg s−1, (b) 0.0290 kg s−1, and (c) 0.0348 kg s−1.
-1.5
-1.0
-0.5
0.0
0.5
1.0
0.015 0.020 0.025 0.030 0.035 0.040
Aver
age
M-y
aw (N
m)
Oxygen mass flow (kg/s)
Figure 15. Average yaw moment versus oxygen flow rate.
4.7. Measurement summary
A summary table of the average measured force componentsis presented in table 3. |F| is the magnitude of the force vector.The last three columns represent the percentage of the totalforce magnitude for each component.
The force oscillations inherent in hybrid rocket motors arereadily apparent in all of the measurement graphs (see figure 6as an example). These oscillations are due to a number ofphysical factors, and a frequency analysis such as fast Fouriertransform reveals several prominent frequencies present. Somefactors affecting these oscillations are dimensions of the rocketbody (acoustic resonances) and oxygen feed lines (chugging),and characteristics of the HTPB fuel (chuffing). With carefulmanipulation of these parameters, the oscillations for a givenmotor can be reduced, but never truly eliminated. Reducing
-4-3-2-101234
4 6 8 10 12 14
M-p
itch
(Nm
)
Time (s)
-8
-6
-4
-2
0
2
4
8 10 12 14 16 18
M-p
itch
(Nm
)
Time (s)
-6
-4
-2
0
2
4
6
10 12 14 16 18 20
M-p
itch
(Nm
)
Time (s)
(a)
(b)
(c)
Figure 16. Measured pitch moment at oxygen flow rates:(a) 0.0174 kg s−1, (b) 0.0290 kg s−1, and (c) 0.0348 kg s−1.
-6.0
-4.0
-2.0
0.0
2.0
4.0
0.015 0.020 0.025 0.030 0.035 0.040
Aver
age
M-p
itch
(Nm
)
Oxygen mass flow (kg/s)
Figure 17. Average pitch moment versus oxygen mass flow.
oscillations is vital for a large-scale motor, as major forceoscillations can cause catastrophic damage to the vehicle andpayload. The six dof thrust sensor can give a measure of themagnitude and frequency of the oscillations for the UALRlabscale hybrid rocket with further analysis. The standarddeviation of the force measurements over a time period ofconstant oxygen flow rate are presented in table 4.
The moments for roll, pitch, and yaw were calculated forthe seven firing tests. Averages were calculated for the range ofdata for which the oxygen flow rate had achieved the set rate.Uncertainties were calculated for each measurement, and theaverage uncertainty was calculated over the same interval asthe average moment. A summary of the moment measurementsis presented in table 5.
8

Meas. Sci. Technol. 24 (2013) 125104 A M Wright et al
Table 4. Standard deviation results for force measurements in eachdirection.
O flow (kg s–1) Average (N) Std dev (N)
Fx 0.0174 0.14 1.870.0232 2.72 1.110.0232 2.33 1.370.0290 5.33 0.990.0290 4.33 1.160.0348 3.70 1.040.0348 3.13 1.37
Fy 0.0174 2.54 4.310.0232 7.24 3.840.0232 7.75 5.500.0290 19.20 5.230.0290 16.91 6.100.0348 7.90 6.090.0348 6.95 7.22
Fz 0.0174 39.07 3.480.0232 51.34 4.670.0232 50.90 4.800.0290 71.07 4.820.0290 64.58 4.780.0348 87.30 5.940.0348 80.15 6.01
Table 5. Average moment values and uncertainties.
O flow (kg s–1) M-roll (N m) M-yaw (N m) M-pitch (N m)
0.0174 0.14 ± 0.03 0.05 ± 0.06 0.77 ± 0.070.0232 0.25 ± 0.03 0.82 ± 0.06 2.11 ± 0.070.0232 0.35 ± 0.03 −0.59 ± 0.06 −2.31 ± 0.070.0290 −1.58 ± 0.04 −1.38 ± 0.06 −4.36 ± 0.080.0290 −1.59 ± 0.04 −1.06 ± 0.06 −4.32 ± 0.080.0348 −0.52 ± 0.03 −1.94 ± 0.06 −1.96 ± 0.070.0348 −1.88 ± 0.03 −0.58 ± 0.06 −2.17 ± 0.07
5. Conclusions
A six degree-of-freedom thrust sensor was designed,constructed, calibrated, and tested using the labscale hybridrocket at the University of Arkansas at Little Rock (UALR).The system consisted of six independent legs: one parallelto the axis of symmetry of the rocket for main thrustmeasurement, two vertical legs near the nozzle end of therocket, one vertical leg near the oxygen input end of the rocket,and two separated horizontal legs near the nozzle end. Eachleg was composed of a rotational bearing, a load cell, and auniversal joint above and below the load cell. The leg wasdesigned to create point contact along only one direction andminimize the non-axial forces applied to the load cell.
With this system, force in each direction and momentsfor roll, pitch, and yaw can be measured. The system wascalibrated and tested using a labscale hybrid rocket usinggaseous oxygen and hydroxyl-terminated polybutadiene solidfuel. The thrust stand proved to be stable during initial firingtests. Thrust force vector components and roll, pitch, and yawmoments were calculated for seven test firings with an oxygenflow rate range of mo = 0.0174 to 0.0348 kg s−1.
As expected, the average axial thrust, Fz, increasedlinearly with oxygen flow rate. This result agrees well with pastmeasurements that used a system of strain gages to measureaxial thrust on this rocket [2]. The two force componentsperpendicular to the rocket body are predictably smaller thanthe axial thrust, but are measurable and not negligible whencomputing the total force produced by the rocket motor. Theoff-axis force magnitudes are not linearly dependent on oxygenflow rate, and, for these firings, the forces were always in thepositive x and y directions. This result could be affected byinitial conditions, including the forces introduced by the gasflow before the rocket is ignited and shape of the fuel at thestart of ignition.
A preliminary look at the force measurements showsmeasurable force oscillations, as is expected for a hybridrocket. For this rocket, the oscillations in the vertical (y)and axial (z) directions are most prominent, and are roughlyproportional to the oxygen flow rate. A proper analysis ofthe force oscillations would include a frequency domainanalysis that included uncertainty calculations for amplitudeand frequency results.
The primary purpose of this thrust sensor array is tomeasure the three rotation moments on this hybrid rocket.The measured moments included both positive and negativerotations. For example, the rocket tended to roll counter-clockwise for the two lowest oxygen flow rates, and clockwisefor the two higher oxygen flow rates. Since the oxygen inputwas designed for maximum symmetry, it is possible that thesystem has no predefined disposition for clockwise or counter-clockwise gas swirl [3]. Direction of roll torque may bedetermined by the initial conditions at the start of each firing,by a tendency for the gaseous oxygen to swirl upon entranceinto the combustion chamber, or by asymmetries in the fuelgrain bore. Both positive and negative average values of yawand pitch moments were also measured. Of particular interest isthat the rocket responded with positive yaw and pitch momentsfor one trial at mo = 0.0232 kg s−1 and negative yaw and pitchmoments for the second trial at that flow rate, demonstratingthat the direction of the rotation rate is not determined by thestrength of the oxygen flow rate.
The measured magnitude and sign of the moments arenot correlated with the oxygen mass flow rate. Therefore,a flight vehicle could have rotations about any axis in anunpredictable way, resulting in flight instability and loss ofefficiency in moving the vehicle in the desired direction. Theonly predictable response of the rocket to increased oxygenflow is an increase in axial thrust.
The six degree-of-freedom thrust sensor array was usedto successfully measure three force components and threerotational moments for the UALR hybrid rocket. It was stableduring a series of firing tests, and met all goals of budget,safety, and measurement sensitivity.
Acknowledgments
The authors wish to acknowledge M Keith Hudson for hisinitial development of the UALR Hybrid Rocket Facility.This work was funded by the Arkansas Space Grant
9
Meas. Sci. Technol. 24 (2013) 125104 A M Wright et al
Consortium, by NASA Grant Number NCC5-260, and by theHendrix College Odyssey programme.
References
[1] Wright A B, Teague M W, Wright A M and Wilson E 2006Instrumentation of UALR labscale hybrid rocket motorProc. SPIE 6222 622202
[2] Wright A M, Teague M W, Hudson M K, Wright A Band Foley P 2005 A thrust and impulse study ofguanidinium azo-tetrazolate as a fuel additive for hybridrocket motor J. Pyrotech. 22 44–51
[3] Wright A B, Wright A M and Elsaser J 2005 Optical studies ofcombustion chamber flame in a hybrid rocket motorJ. Pyrotech. 19 21–30
[4] Runyan R B, Haynes R N, Gwinn A F and Jennings B R1988 Basic principles of thrust stand design ReportAFAL-TR-88-060
[5] Stewart D 1965–66 A platform with six degrees of freedomProc. Inst. Mech. Eng. 180 371–86
[6] Sessions S 2011 A six degree of freedom static thrust standdeveloped for RC-scale jet engines MSc Thesis Mechanicaland Aerospace Engineering, Utah State Universityhttp://digitalcommons.usu.edu/gradreports/22
[7] ATI Industrial Automation www.ati-ia.com/products/ft/sensors.aspx?campaign=ims
[8] FGP Sensors and Instrumentation www.meas-spec.com/product/t_product.aspx?id=7103
[9] Wright A M, Strickland R, Born T, Wright A B, Steadman Sand Tidwell J 2013 Design and calibration of a six degree offreedom thrust sensor for a lab-scale hybrid rocket 51stAIAA Aerospace Sciences Meeting Including the NewHorizon Forum and Aerospace Exposition (Grapevine, TX,7–10 Jan.) AIAA 2013-1016
[10] Taylor J R 1997 An Introduction to Error Analysis, the Studyof Uncertainties in Physical Measurements (Sausalito, CA:University Science Books)
[11] Chiaverini M J and Kuo K 2007 Fundamental of HybridRocket Combustion and Propulsion (Reston, VA: AmericanInstitute of Astronautics and Aeronautics)
10