Embed Size (px)
Citation preview
Behavioral/Cognitive
A Single-System Model Predicts Recognition Memory andRepetition Priming in Amnesia
Christopher J. Berry,1 Roy P.C. Kessels,2,3,4 Arie J. Wester,3 and David R. Shanks5
1School of Psychology, Plymouth University, Plymouth PL4 8AA, United Kingdom, 2Donders Institute for Brain, Cognition and Behaviour, RadboudUniversity Nijmegen, 6500 HE Nijmegen, The Netherlands, 3Centre of Excellence for Korsakoff and Alcohol-Related Cognitive Disorders, Vincent van GoghInstitute for Psychiatry, 5803 DN Venray, The Netherlands, 4Department of Medical Psychology, Radboud University Medical Center, 6500 HB Nijmegen,The Netherlands, and 5Division of Psychology and Language Sciences, University College London, London WC1H 0AP, United Kingdom
We challenge the claim that there are distinct neural systems for explicit and implicit memory by demonstrating that a formal single-system model predicts the pattern of recognition memory (explicit) and repetition priming (implicit) in amnesia. In the current inves-tigation, human participants with amnesia categorized pictures of objects at study and then, at test, identified fragmented versions ofstudied (old) and nonstudied (new) objects (providing a measure of priming), and made a recognition memory judgment (old vs new) foreach object. Numerous results in the amnesic patients were predicted in advance by the single-system model, as follows: (1) deficits inrecognition memory and priming were evident relative to a control group; (2) items judged as old were identified at greater levels offragmentation than items judged new, regardless of whether the items were actually old or new; and (3) the magnitude of the primingeffect (the identification advantage for old vs new items) overall was greater than that of items judged new. Model evidence measures alsofavored the single-system model over two formal multiple-systems models. The findings support the single-system model, which ex-plains the pattern of recognition and priming in amnesia primarily as a reduction in the strength of a single dimension of memorystrength, rather than a selective explicit memory system deficit.
Key words: amnesia; computational model; long-term memory; memory systems; recognition memory; repetition priming
IntroductionOne of the most influential distinctions in the cognitive neuro-science of memory is between explicit and implicit long-termmemory. Explicit memory refers to conscious recollection ofprior experiences. Implicit memory refers to changes in behaviorthat are due to prior experience, but are unaccompanied by con-scious recollection of those experiences (Schacter, 1987). Implicitmemory is commonly shown via repetition priming, which is achange or facilitation in identification, production, or detectionof an item (e.g., a picture of an object) as a result of prior exposureto the same or a similar item. Strikingly, despite profound deficitsin explicit memory tasks such as recognition—in which partici-pants judge whether items have been presented before in a certaincontext—individuals with amnesia can show normal levels ofrepetition priming (Hamann and Squire, 1997). This dissocia-tion is widely regarded as some of the strongest evidence for theproposal that functionally and neurally distinct explicit and im-plicit memory systems exist in the brain: recognition is driven by
an explicit (declarative/conscious) memory system located in themedial temporal lobes (damaged in amnesia), whereas priming isdriven by implicit (nondeclarative/unconscious) memory sys-tems in modality-specific neocortical regions (Tulving andSchacter, 1990; Gabrieli, 1998; Squire, 2009). Of primary interesthere is the proposal that recognition and priming are driven bydistinct explicit and implicit memory sources (Squire, 2009).
An alternative perspective is that recognition and repetitionpriming are driven by the same memory system or source. Thisview has been formalized in a single-system (SS) model of recog-nition and priming (Berry et al., 2006, 2008a,b, 2010, 2012;Shanks and Berry, 2012). Surprisingly, this model can explainnumerous results in healthy adults that on the surface appear tobe indicative of multiple systems; it even predicts results that arenot predicted by multiple-systems versions of the model and canprovide better fits to the data (Berry et al., 2012).
Here we provide a critical test of the SS model by applying it todata from amnesia. We also compare its fit to two formalmultiple-systems models. We test a relatively homogeneous andwell characterized group of amnesic patients that is atypicallylarge (n � 24; Hayes et al., 2012). The patients had Korsakoff’ssyndrome (KS), a chronic disorder that is often caused by severealcoholism and thiamine deficiency that results in diencephalic,frontal, and hippocampal brain damage (Le Berre et al., 2014). Itis characterized by anterograde and retrograde amnesia (Kopel-man et al., 2009; Fama et al., 2012; Kessels and Kopelman, 2012;Race and Verfaellie, 2012). Findings from patients with KS have
Received Feb. 24, 2014; revised June 13, 2014; accepted July 4, 2014.Author contributions: C.J.B., R.P.C.K., A.J.W., and D.R.S. designed research; R.P.C.K. and A.J.W. performed re-
search; C.J.B. analyzed data; C.J.B., R.P.C.K., A.J.W., and D.R.S. wrote the paper.Preparation of this article was supported by UK Economic and Social Research Council Grant RES-063-27-0127.
R.P.C.K. was funded by a VIDI innovational grant from the Netherlands Organisation for Scientific Research (no.452-08-005).
Correspondence should be addressed to Christopher J. Berry, School of Psychology, Plymouth University, Plym-outh PL4 8AA, UK. E-mail: [email protected].
DOI:10.1523/JNEUROSCI.0764-14.2014Copyright © 2014 the authors 0270-6474/14/3410963-12$15.00/0
The Journal of Neuroscience, August 13, 2014 • 34(33):10963–10974 • 10963
played a central role in the formulation of multiple-systems views(Hayes et al., 2012), and implicit memory is widely regarded to bepreserved in KS (Kopelman et al., 2009; Oudman et al., 2011). Inthe current investigation, participants categorized pictures of fa-miliar objects (e.g., an elephant) at study. In the test phase, par-ticipants identified fragmented versions of old (studied) and newobjects (providing a measure of priming), and made a recogni-tion memory judgment (old/new) after identifying each object.
Materials and MethodsParticipants. Twenty-four patients (16 male; mean age, 50.2 years; SD, 7.7years) with Korsakoff’s amnesia were recruited via the Korsakoff Clinic ofthe Vincent van Gogh Institute for Psychiatry, Venray, The Netherlands(KOR group). All patients fulfilled the criteria for alcohol-induced per-sisting amnestic disorder (American Psychiatric Association, 2000) andKorsakoff’s syndrome (Kopelman, 2002). The diagnoses were supportedby the patients’ medical history and neuropsychological assessment, andall participants had anterograde amnesia, performing in the impairedrange on the Rivermead Behavioral Memory Test [RBMT; Wilson et al.,1989; Van Balen et al., 1996; total profile score: mean score, 6.7; SD, 4.0(scoring: 17–21, poor memory; 10 –16, mildly impaired; 0 –9, severelyimpaired)], as well as retrograde amnesia for their biographical history.Premorbid intelligence was estimated using the Dutch version of theNational Adult Reading Test (NART; Schmand et al., 1991), with IQs inthe below-average to average range, which was in agreement with thepatients’ educational levels (mean NART-IQ score, 93.8; SD, 12.5; meaneducational level, 3.9; SD, 1.1), where education level was assessed inseven categories based on the Dutch educational system, as follows: 1,primary school; 7, academic degree (Verhage, 1964). Neuroradiologicalfindings (CT or MRI) showed abnormalities associated with KS, such as(diencephalic) atrophy or white-matter lesions (Pitel et al., 2012). Nobrain abnormalities were found that countered the clinical diagnosis(e.g., large strokes, tumors). All patients were abstinent from alcoholsince their admittance to the clinic (�3 months before testing), none wasin the acute Wernicke phase of the syndrome, and none fulfilled thecriteria for alcohol-related dementia (Oslin et al., 1998).
The control (CON) group also consisted of 24 individuals, matched interms of age (mean age, 50.2 years; SD, 13.6 years; t(46) � 0.59, p � 0.56),premorbid IQ (mean NART-IQ score, 96.4; SD, 12.6; t(46) � 0.72, p �0.47), and the proportion of males and females. Exclusion criteria for thecontrol subjects were a self-reported history of neurologic or psychiatricdisorder, or subjective cognitive complaints. Level of education (meanlevel, 5.3; SD, 0.8) was significantly higher in the CON group than theKOR group (Mann–Whitney U � 90.50, p � 0.01); however, this vari-able was not found to be significantly correlated with subsequent mea-sures of recognition or priming performance at test within each group (rvalues ranged from �0.14 to 0.23).
Materials. The stimuli were 80 color photographs of familiar objects(e.g., a bicycle, a guitar). All stimuli were presented on a computer mon-itor against a white background. Each object subtended �7.5° of visualangle in the horizontal and vertical. Stimuli were arranged into two 40-item lists. Each list acted as the studied or new stimuli equally often acrossparticipants. Approximately half of the objects in each list were largerthan a shoebox. All instructions were presented in Dutch.
Procedure. During the study phase, participants were told that theywould be presented with pictures of objects and that they must decidewhether each object was smaller or larger in size than a shoebox, indicat-ing their response with a button press. The sequence of events on eachtrial was as follows: (1) a central fixation point (“�”) was presented for2000 ms; (2) the object was then presented for 2000 ms; and (3) if aresponse had been made, the next trial then commenced, and if a re-sponse had not been made, a blank screen was presented until a responsewas made. For the duration of the study phase, the reminder cue “Is theobject smaller or larger than a shoebox? Z � smaller, M � larger” re-mained visible toward the bottom of the screen. The order of presenta-tion of items was randomly determined for each participant. There was ashort (maximum time, 5 min) retention interval before the test phase
commenced, during which standardized tests (e.g., NART) wereadministered.
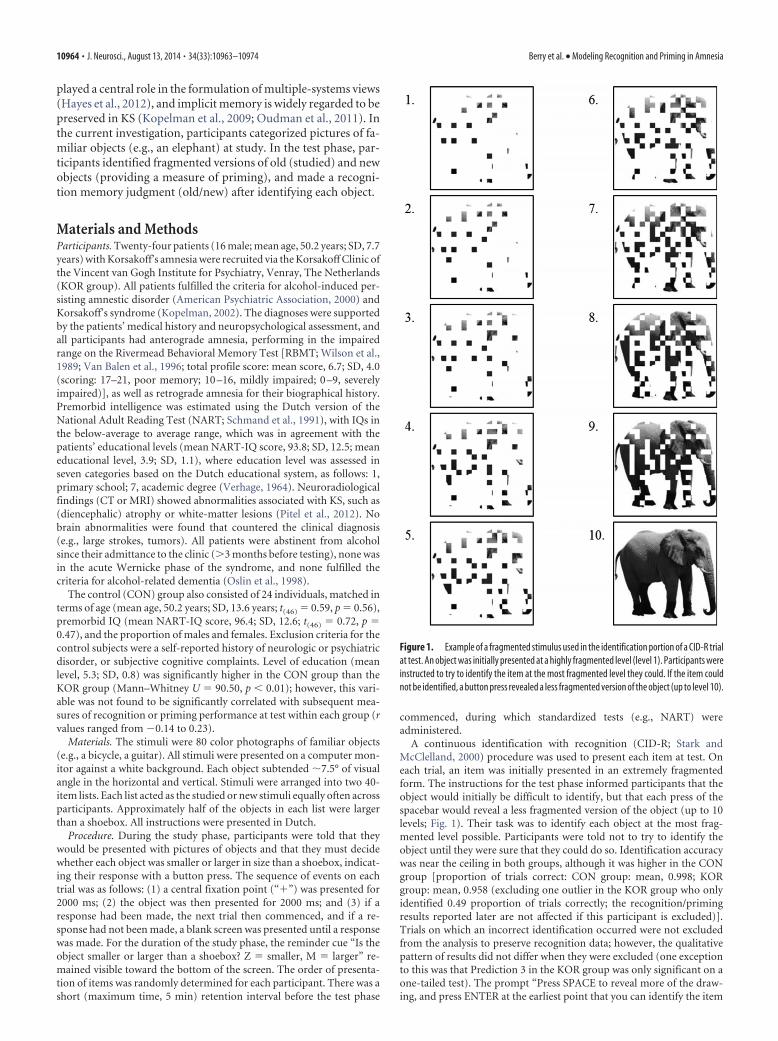
A continuous identification with recognition (CID-R; Stark andMcClelland, 2000) procedure was used to present each item at test. Oneach trial, an item was initially presented in an extremely fragmentedform. The instructions for the test phase informed participants that theobject would initially be difficult to identify, but that each press of thespacebar would reveal a less fragmented version of the object (up to 10levels; Fig. 1). Their task was to identify each object at the most frag-mented level possible. Participants were told not to try to identify theobject until they were sure that they could do so. Identification accuracywas near the ceiling in both groups, although it was higher in the CONgroup [proportion of trials correct: CON group: mean, 0.998; KORgroup: mean, 0.958 (excluding one outlier in the KOR group who onlyidentified 0.49 proportion of trials correctly; the recognition/primingresults reported later are not affected if this participant is excluded)].Trials on which an incorrect identification occurred were not excludedfrom the analysis to preserve recognition data; however, the qualitativepattern of results did not differ when they were excluded (one exceptionto this was that Prediction 3 in the KOR group was only significant on aone-tailed test). The prompt “Press SPACE to reveal more of the draw-ing, and press ENTER at the earliest point that you can identify the item
Figure 1. Example of a fragmented stimulus used in the identification portion of a CID-R trialat test. An object was initially presented at a highly fragmented level (level 1). Participants wereinstructed to try to identify the item at the most fragmented level they could. If the item couldnot be identified, a button press revealed a less fragmented version of the object (up to level 10).
10964 • J. Neurosci., August 13, 2014 • 34(33):10963–10974 Berry et al. • Modeling Recognition and Priming in Amnesia
correctly” remained on screen during the clarification procedure. Whenparticipants pressed enter, a black outlined box and prompt (“Type yourresponse and then press ENTER”) appeared beneath the fragmentedobject. After a response was typed, the nonfragmented version of theobject was then presented with the prompt, “Was the object presented inthe first stage? 1 � sure no, 2 � probably no, 3 � probably yes, 4 � sureyes.” After participants made their recognition response, a blank screenwas presented for 2000 ms before the next test trial was presented. Therewere 80 trials in total (40 old and 40 new). To evenly distribute old andnew trial types across the test phase, trials were randomly arranged intofour blocks with an equal number of old and new trials in each block(there was no indication of block transition to participants).
To create fragmented versions of each image, each 400 � 400 pixelimage was divided into 400 20 � 20 pixel squares. At each of 10 possiblefragmentation levels, a fixed proportion of the squares containing thetarget image was displayed. The proportion of squares displayed at eachfragmentation level, x, was calculated as 0.75 (10�x ), x � [1, 10]. Thus, thefragmentation procedure was such that the rate of clarification was rela-tively slow across the initial fragmentation levels and more rapid in thelater stages. This was done to increase the difficulty of the task in the earlystages of the procedure.
Recognition responses were collapsed across confidence ratings 1 and2 for “new” judgments, and ratings 3 and 4 for “old” judgments. This wasdone because a large proportion of participants made no responses in atleast one of the confidence [(1– 4) � item status (old, new)] responsecategories (79% of individuals in the KOR group, and 71% of individualsin the CON group). Recognition performance was measured with Pr,which was calculated as H � F, where H � p(hit), and F � p(false alarm);d was also calculated as z( H) � z( F)), where a “hit” is an old judgmentto an old item, and a “false alarm” is an old judgment to a new item.Response bias was measured with C (C � �0.5[z( H) � z( F)]). For thecalculation of d and C, a correction was applied when calculating H andF for each individual [i.e., H � (no. of hits � 0.5)/(no. of possible hits �1), and F � (no. of false alarms � 0.5)/(no. of possible false alarms);Snodgrass and Corwin, 1988]. This enabled the calculation of d and Cfor participants for whom H or F was equal to 1 or 0. An � level of 0.05was used for all statistical tests, and all t tests were two tailed, unlessindicated otherwise. Effect sizes are indicated by Cohen’s d (for t tests)and �p
2 (for ANOVA).Reliability of the recognition and priming measures. Prior research has
shown that it is important to take into account the reliability of the tasksused to measure recognition and priming when comparing performance(Buchner and Wippich, 2000). Accordingly, the reliability of the recog-nition and priming measures was calculated using split-half correlations.Each participant’s dataset was split into odd and even trials, and then Pr
and priming measures were calculated for the trials in each of thesehalves. The split-half correlation for recognition/priming is the Pearsoncorrelation of the recognition/priming measures for each half, acrossparticipants. Importantly, both recognition and priming were highly re-liable (recognition: r(46) � 0.91, p � 0.001; priming: r(46) � 0.56, p �0.001). The greater reliability of the recognition task is consistent withprevious research (Buchner and Wippich, 2000); however, when eachgroup was analyzed individually, the reliability of recognition was greaterthan that of priming only in the KOR group, and not the CON group(where the reliability of recognition and priming was approximatelyequal; KOR group: recognition, r(22) � 0.84, p � 0.001; priming, r(22) �0.47, p � 0.02; CON group: recognition, r(22) � 0.50, p � 0.013; priming,r(22) � 0.58, p � 0.003).
Formal single-system and multiple-systems models. Full details of themodels are given in the study by Berry et al. (2012). The SS model is basedon signal detection theory (Green and Swets, 1966) and assumes thatduring the test phase each item is associated with a memory strengthvalue, f, which is a normally distributed, random variable with mean (�)and SD �f [i.e., f � N(�, �f)]. The mean f of old items can be greater thanof new items because of prior study (i.e., �old � �new). The value of f foran item is used to derive its recognition judgment and its measure ofpriming. To generate a recognition judgment, random, normally distrib-uted noise, er, is first added to f to produce the judgment measure Jr [i.e.,Jr � f � er, where er � N(0, �r)]. If Jr exceeds a particular threshold of
strength, C, the item will be judged old, otherwise it will be judged new.For the priming task, greater values of f will tend to result in betterperformance in the task. For example, if the task is to identify fragmentedversions of an object (fragment identification), the greater the value of ffor an item, the greater the level of fragmentation at which it will beidentified. Importantly, however, f is combined with another indepen-dent source of random normally distributed noise, ep, to derive the prim-ing measure [i.e., ID � b � sf � ep, where ID is the level of fragmentationat which identification occurs; b and s are scaling parameters; b is the IDintercept; s is the rate of change in ID with f; and ep � N(0, �p)]. Both ofthe task-specific noise variables er and ep have mean values equal to zero.
The SS model can be modified to create two “multiple-systems” ver-sions of the model—the MS1 and MS2 models. The MS1 model is thesame as the SS model except that one “explicit” memory strength signal,fr, drives recognition [where fr � N(�r, �f)], whereas a separate “im-plicit” memory signal, fp, drives priming [where fp � N(�p, �f)]. As in theSS model, fr and fp are combined with task-specific sources of noise (er
and ep) to produce the recognition judgment (i.e., Jr � fr � er) andpriming measure (i.e., ID � b � sfp � ep). Importantly, however, fr andfp are uncorrelated [i.e., r( fr, fp) � 0], and the mean explicit strength ofold items (�r�old) can vary independently of the mean implicit strength ofold items (�r�old) across individuals/conditions. This allows the model toproduce dissociations at the level of individual items (e.g., stochasticindependence; Tulving et al., 1982; Poldrack, 1996) and also at the levelof group/condition (e.g., independent effects of a variable upon recogni-tion and priming, such as the dissociation in amnesia). Thus, this modelrepresents a relatively strong interpretation of the idea that explicit andimplicit memory systems are independent (Tulving et al., 1982).
Another model, the MS2 model, represents a weaker interpretation ofthe idea that there is independence between systems (Berry et al., 2012).This model is identical to the MS1 model except that the explicit andimplicit strengths of individual items may be positively correlated (withcorrelation w). A correlation could arise, for example, via distinctiveness:a more distinctive item may be better encoded into both the explicit andimplicit memory systems. This gives the MS2 model greater flexibility,allowing it to reproduce associations between recognition and primingmeasures at the level of individual items (like the SS model). In fact, theMS2 model subsumes the SS and MS1 models as special cases of it, andthe MS2 model can therefore, in principle, produce any result that the SSand MS1 models can achieve (Berry et al., 2012). When the correlationbetween fr and fp is 1 [i.e., r( fr, fp) � 1], and the mean fr and fp values ofold items are equal (i.e., �r�old � �p�old), fr � fp, and so the model reducesto the SS model; when the correlation between fr and fp is zero [i.e., r( fr,fp) � 0], the model reduces to the MS1 model (Berry et al., 2012).
Model fitting. Models were fit using maximum likelihood estimation(full details are given in Berry et al., 2012). The likelihood of each iden-tification level (ID) and judgment ( Z) combination is given by the fol-lowing function:
LZ,ID�X� � � Cj��Jr�ID,X, �Jr�ID2 � � Cj�1��Jr�ID,X, �Jr�ID
2 ��
ID�b � s�p�X,�ID2 �,
where X � old, new; is the cumulative normal distribution function; is the normal density function; �ID
2 � s2�f2 � �p
2; �Jr�ID,X; and �Jr�ID2 are
the mean and variance of the conditional distribution of Jr given ID, j �1 when Z � “new” (N), and j � 2 when Z � “old” (O); C0 � ��, C1 �C and C2 � �. �Jr�ID,X and �Jr�ID
2 are calculated as follows:
�Jr�ID,X � �r�X �ws�f
2ID � b � s�p�X)
s2�f2 � �p
2 ,
and
�Jr�ID2 � �f
2 � �r2 �
w2s2�f4
s2�f2 � �p
2,
where �r�new � 0 when X � new, and �r�old � 0 when X � old; �p�new �0 when X � new, and �p�old � 0 when X � old. In the SS model, �r�old �
Berry et al. • Modeling Recognition and Priming in Amnesia J. Neurosci., August 13, 2014 • 34(33):10963–10974 • 10965
�p�old � �old, and w � 1. In the MS1 model, w � 0; in the MS2 model,0 � w � 1.
In fitting the models to the data, an automated procedure was used tofind the parameter values that maximize the summed log likelihoodacross trials. A full list of parameters (both free and fixed) is given inTable 1. The values of certain parameters are nonidentifiable and weretherefore fixed such that they act as scaling parameters (Berry et al.,2012), as follows: SS model, �new � 0; MS1/MS2 models, �r�new ��p�new � 0; M(ep) � M(er) � 0; �f � �r � �0.5; finally, the value ofs in the MS1 and MS2 models was fixed to that of the SS model. Fixing�f and �r to �0.5 means that the SD of Jr is equal to 1 (because �Jr ��(�f
2 � �r2)), and �r�old can therefore be interpreted as d. We have
previously shown that whether s is fixed or free to vary in the MS1 andMS2 models does not affect their fit (Berry et al., 2012).
This leaves the following five free parameters in the SS model: �old, themean strength of the old item distribution; C, the old judgment criterion;b, the ID intercept; s the rate of change in the ID level with changes in f;and �p, the variance of ep, the noise associated with the priming task. TheMS1 model also has the following five free parameters: �r�old, the meanexplicit memory strength of the old item distribution; �p�old, the meanimplicit memory strength of the old item distribution; C, the old judg-ment criterion; b, the ID intercept; and �p, the variance of ep. The MS2model has the following six free parameters: �r�old, the mean explicitmemory strength of the old item distribution; �p�old, the mean implicitmemory strength of the old item distribution; C, the old judgment crite-rion; b, the ID intercept; �p, the variance of ep; and w, the correlationbetween fr and fp.
It is usually preferable to fit the models to each participant’s data;however, this was not possible for all participants because the modelparameters could not be estimated for participants who did not make atleast one hit, miss, false alarm, or correct rejection response. Accordingly,the models were fit to (1) the data aggregated across the 24 participantswithin each group and (2) to each individual’s data, providing that theindividual made at least one hit, miss, false alarm, and correct rejectionresponse (CON group, n � 19; KOR group, n � 15). We report theAkaike information criterion (AIC, Akaike, 1973) and the Bayesian in-formation criterion (BIC, Schwarz, 1978) measures of fit because bothare frequently reported in model comparisons. We place more emphasison the AIC because our previous investigations indicated that the truegenerative model can be more reliably identified with this measure (Berryet al., 2012).
Given the best-fitting parameter values for a model, the expectedmodel results can be calculated analytically as follows: P(hit) � 1 � (C � �r�old); P(false alarm) � 1 � ( C); d � �r�old; E[ID�new] � b;E[ID�old] � b � s�p�old; priming effect � s�p�old.
The expected values of ID conditional on judgment Z are given by thefollowing function:
EID�Z,X� � b � s�p�X �sw�f
2
�Jr
�Cj � �r�X
�Jr���Cj�1��r�X
�Jr�
�Cj��r�X
�Jr�� �Cj�1��r�X
�Jr� ,
where �Jr � �(�f2 � �r
2); j � 1 when Z � N; and j � 2 when Z � O;C0 � ��; C1 � C; and C2 � �. Thus, the equation gives the expected IDof hits (E[ID�H]) when X � old and Z � O; it gives the expected ID offalse alarms (E[ID�F]) when X � new and Z � O. Similarly, the equationgives the expected ID of misses (E[ID�M]) when X � old and Z � N; andit gives the expected ID of correct rejections (E[ID�CR]) when X � newand Z � N.
In the data, because the mean ID for items judged old/new areweighted means, the expected ID for items judged old/new are given bythe weighted expected IDs to hits and false alarms (items judged old), ormisses and correct rejections (items judged old), hence:
E�ID�Z � O� �P(H)E[ID�H] � P(F)E[ID�F]
P(H) � P(F),
and
E�ID�Z � N� ��1 � P(H)E[ID�M] � [(1 � P(F)]E[ID�CR��
2 � P(H) � P(F),
The overall fluency effect (see below) can be calculated as E[ID�Z � N] �E[ID�Z � O].
We should note that the ID response variable is discrete but is modeledhere as continuous (because fp � N(�p, �f) and ID � b � sfp � ep). Tojustify this way of modeling ID, parameter recovery simulations wereperformed. In these simulations, first, recognition judgment and ID data(for 10,000 old/new items) were simulated from a given model. Theparameter values used for this were the mean estimated parameter valuesfor the KOR group (given on the right-hand side of Table 1). The simu-
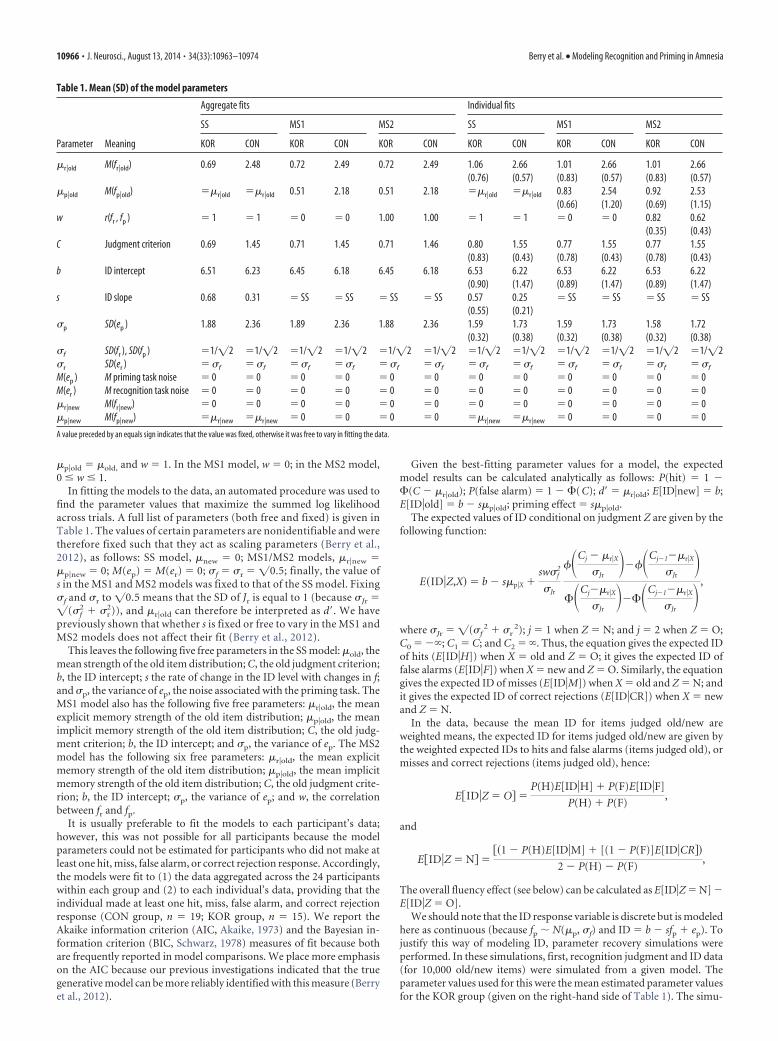
Table 1. Mean (SD) of the model parameters
Aggregate fits Individual fits
SS MS1 MS2 SS MS1 MS2
Parameter Meaning KOR CON KOR CON KOR CON KOR CON KOR CON KOR CON
�r�old M(fr�old) 0.69 2.48 0.72 2.49 0.72 2.49 1.06 2.66 1.01 2.66 1.01 2.66(0.76) (0.57) (0.83) (0.57) (0.83) (0.57)
�p�old M(fp�old) ��r�old ��r�old 0.51 2.18 0.51 2.18 ��r�old ��r�old 0.83 2.54 0.92 2.53(0.66) (1.20) (0.69) (1.15)
w r(fr , fp ) � 1 � 1 � 0 � 0 1.00 1.00 � 1 � 1 � 0 � 0 0.82 0.62(0.35) (0.43)
C Judgment criterion 0.69 1.45 0.71 1.45 0.71 1.46 0.80 1.55 0.77 1.55 0.77 1.55(0.83) (0.43) (0.78) (0.43) (0.78) (0.43)
b ID intercept 6.51 6.23 6.45 6.18 6.45 6.18 6.53 6.22 6.53 6.22 6.53 6.22(0.90) (1.47) (0.89) (1.47) (0.89) (1.47)
s ID slope 0.68 0.31 � SS � SS � SS � SS 0.57 0.25 � SS � SS � SS � SS(0.55) (0.21)
�p SD(ep ) 1.88 2.36 1.89 2.36 1.88 2.36 1.59 1.73 1.59 1.73 1.58 1.72(0.32) (0.38) (0.32) (0.38) (0.32) (0.38)
�f SD(fr ), SD(fp ) �1/�2 �1/�2 �1/�2 �1/�2 �1/�2 �1/�2 �1/�2 �1/�2 �1/�2 �1/�2 �1/�2 �1/�2�r SD(er ) � �f � �f � �f � �f � �f � �f � �f � �f � �f � �f � �f � �f
M(ep ) M priming task noise � 0 � 0 � 0 � 0 � 0 � 0 � 0 � 0 � 0 � 0 � 0 � 0M(er ) M recognition task noise � 0 � 0 � 0 � 0 � 0 � 0 � 0 � 0 � 0 � 0 � 0 � 0�r�new M(fr�new) � 0 � 0 � 0 � 0 � 0 � 0 � 0 � 0 � 0 � 0 � 0 � 0�p�new M(fp�new) ��r�new ��r�new � 0 � 0 � 0 � 0 ��r�new ��r�new � 0 � 0 � 0 � 0
A value preceded by an equals sign indicates that the value was fixed, otherwise it was free to vary in fitting the data.
10966 • J. Neurosci., August 13, 2014 • 34(33):10963–10974 Berry et al. • Modeling Recognition and Priming in Amnesia
lated ID values were then rounded to the nearest integer; if the value was�1 or �10, then it was rounded to 1 or 10, respectively, thereby produc-ing discretized ID data. The simulated ID and judgment data were thenfit by the models as described above, and the estimates of the free param-eters were compared with the values of the parameters that were origi-nally used to simulate the data (i.e., the true parameter values). For allmodels, the estimated parameter values matched the true parameter val-ues. This demonstrates that the parameters of the models can still berecovered, even though the ID data are discrete.
Another issue concerns the function used to relate fp to ID level. Theamount of a test picture revealed across levels varies by an exponentialfunction, whereas the equation relating ID level to fp in the models islinear. It is possible that an alternative function relating ID to fp wouldprovide a more complete characterization of the ID data and improve theperformance of all of the models. However, most important for currentpurposes is that ID is modeled as a monotonically decreasing function offp in all models. We chose to model the ID variable in this way forconsistency with previous applications of the models, and for ease ofmodel specification.
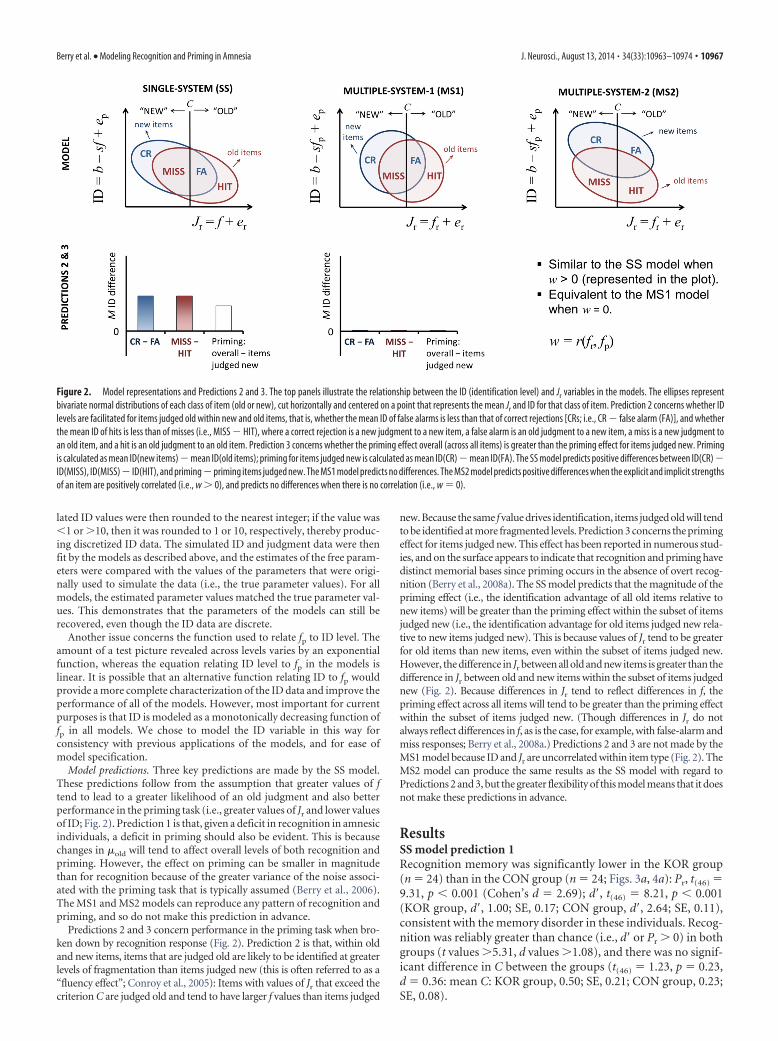
Model predictions. Three key predictions are made by the SS model.These predictions follow from the assumption that greater values of ftend to lead to a greater likelihood of an old judgment and also betterperformance in the priming task (i.e., greater values of Jr and lower valuesof ID; Fig. 2). Prediction 1 is that, given a deficit in recognition in amnesicindividuals, a deficit in priming should also be evident. This is becausechanges in �old will tend to affect overall levels of both recognition andpriming. However, the effect on priming can be smaller in magnitudethan for recognition because of the greater variance of the noise associ-ated with the priming task that is typically assumed (Berry et al., 2006).The MS1 and MS2 models can reproduce any pattern of recognition andpriming, and so do not make this prediction in advance.
Predictions 2 and 3 concern performance in the priming task when bro-ken down by recognition response (Fig. 2). Prediction 2 is that, within oldand new items, items that are judged old are likely to be identified at greaterlevels of fragmentation than items judged new (this is often referred to as a“fluency effect”; Conroy et al., 2005): Items with values of Jr that exceed thecriterion C are judged old and tend to have larger f values than items judged
new. Because the same f value drives identification, items judged old will tendto be identified at more fragmented levels. Prediction 3 concerns the primingeffect for items judged new. This effect has been reported in numerous stud-ies, and on the surface appears to indicate that recognition and priming havedistinct memorial bases since priming occurs in the absence of overt recog-nition (Berry et al., 2008a). The SS model predicts that the magnitude of thepriming effect (i.e., the identification advantage of all old items relative tonew items) will be greater than the priming effect within the subset of itemsjudged new (i.e., the identification advantage for old items judged new rela-tive to new items judged new). This is because values of Jr tend to be greaterfor old items than new items, even within the subset of items judged new.However, the difference in Jr between all old and new items is greater than thedifference in Jr between old and new items within the subset of items judgednew (Fig. 2). Because differences in Jr tend to reflect differences in f, thepriming effect across all items will tend to be greater than the priming effectwithin the subset of items judged new. (Though differences in Jr do notalways reflect differences in f, as is the case, for example, with false-alarm andmiss responses; Berry et al., 2008a.) Predictions 2 and 3 are not made by theMS1 model because ID and Jr are uncorrelated within item type (Fig. 2). TheMS2 model can produce the same results as the SS model with regard toPredictions 2 and 3, but the greater flexibility of this model means that it doesnot make these predictions in advance.
ResultsSS model prediction 1Recognition memory was significantly lower in the KOR group(n � 24) than in the CON group (n � 24; Figs. 3a, 4a): Pr, t(46) �9.31, p � 0.001 (Cohen’s d � 2.69); d, t(46) � 8.21, p � 0.001(KOR group, d, 1.00; SE, 0.17; CON group, d, 2.64; SE, 0.11),consistent with the memory disorder in these individuals. Recog-nition was reliably greater than chance (i.e., d or Pr � 0) in bothgroups (t values �5.31, d values �1.08), and there was no signif-icant difference in C between the groups (t(46) � 1.23, p � 0.23,d � 0.36: mean C: KOR group, 0.50; SE, 0.21; CON group, 0.23;SE, 0.08).
Figure 2. Model representations and Predictions 2 and 3. The top panels illustrate the relationship between the ID (identification level) and Jr variables in the models. The ellipses representbivariate normal distributions of each class of item (old or new), cut horizontally and centered on a point that represents the mean Jr and ID for that class of item. Prediction 2 concerns whether IDlevels are facilitated for items judged old within new and old items, that is, whether the mean ID of false alarms is less than that of correct rejections [CRs; i.e., CR � false alarm (FA)], and whetherthe mean ID of hits is less than of misses (i.e., MISS � HIT), where a correct rejection is a new judgment to a new item, a false alarm is an old judgment to a new item, a miss is a new judgment toan old item, and a hit is an old judgment to an old item. Prediction 3 concerns whether the priming effect overall (across all items) is greater than the priming effect for items judged new. Primingis calculated as mean ID(new items) � mean ID(old items); priming for items judged new is calculated as mean ID(CR) � mean ID(FA). The SS model predicts positive differences between ID(CR) �ID(MISS), ID(MISS)� ID(HIT), and priming�priming items judged new. The MS1 model predicts no differences. The MS2 model predicts positive differences when the explicit and implicit strengthsof an item are positively correlated (i.e., w � 0), and predicts no differences when there is no correlation (i.e., w � 0).
Berry et al. • Modeling Recognition and Priming in Amnesia J. Neurosci., August 13, 2014 • 34(33):10963–10974 • 10967
Priming was calculated as the mean identification level fornew items minus the mean identification level for old items. Bothgroups showed reliable (i.e., �0) levels of priming: KOR group:mean, 0.35; SE, 0.11; t(23) � 3.18, p � 0.004, d � 0.65; CON
group: mean, 0.68; SE, 0.14; t(23) � 4.78, p � 0.001, d � 0.98 (Figs.3b, 4a). Crucially, priming was significantly lower in the KORgroup than in the CON group (t(46) � 1.84; p � 0.036, one-tailed;d � 0.53), as predicted by the SS model. Furthermore, there was
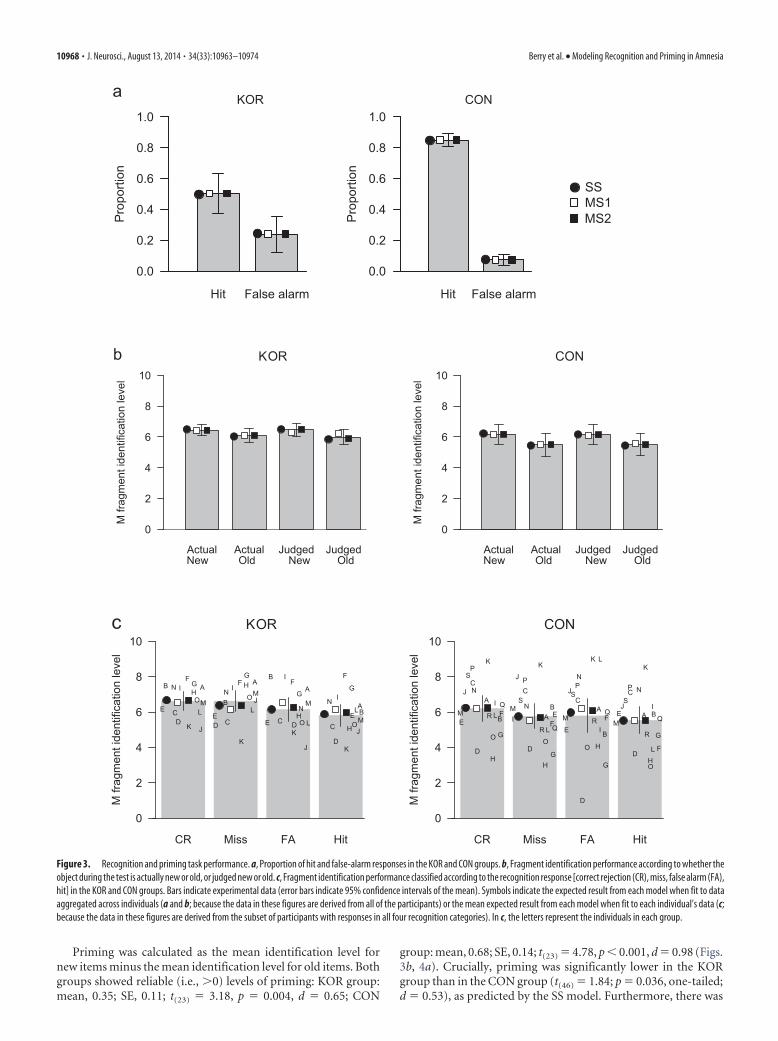
Figure 3. Recognition and priming task performance. a, Proportion of hit and false-alarm responses in the KOR and CON groups. b, Fragment identification performance according to whether theobject during the test is actually new or old, or judged new or old. c, Fragment identification performance classified according to the recognition response [correct rejection (CR), miss, false alarm (FA),hit] in the KOR and CON groups. Bars indicate experimental data (error bars indicate 95% confidence intervals of the mean). Symbols indicate the expected result from each model when fit to dataaggregated across individuals (a and b; because the data in these figures are derived from all of the participants) or the mean expected result from each model when fit to each individual’s data (c;because the data in these figures are derived from the subset of participants with responses in all four recognition categories). In c, the letters represent the individuals in each group.
10968 • J. Neurosci., August 13, 2014 • 34(33):10963–10974 Berry et al. • Modeling Recognition and Priming in Amnesia
no significant difference in the mean identification level for newitems across groups (Fig. 3b; t(46) � 0.74, p � 0.47, d � 0.21),which indicated that any difference in priming across groupscould not be attributed to differences in baseline levels of perfor-mance in the task. Identifications were made at all possible frag-mentation levels (range, 1–10 in both groups; interquartile range:KOR group, 5– 8; CON group, 4 – 8).
SS model predictions 2 and 3To test Predictions 2 and 3, the identification level of each itemduring testing was analyzed according to the following four pos-
sible recognition responses: a correct rejection is a new judgmentto a new item; a false alarm is an old judgment to a new item; amiss is a new judgment to an old item; and a hit is an old judg-ment to an old item (Fig. 3c). A subset of participants made noresponses in at least one of the four response categories, and sothey were not included in the following analyses. There were fiveparticipants from the CON group: one had a hit rate of 1; andfour had a false alarm rate of 0. Nine participants were also ex-cluded from the KOR group on this basis: one had a hit rate of 1;one had a false alarm rate of 1; and seven had a false alarm rate of0. The priming scores in the excluded participants were slightly
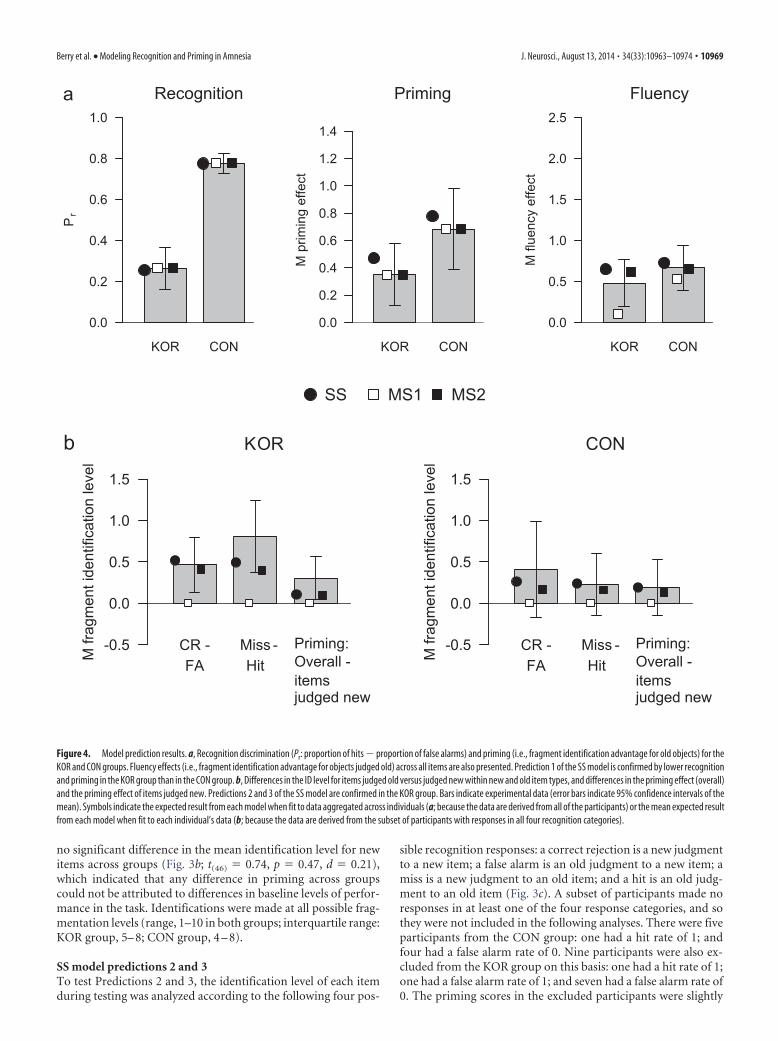
Figure 4. Model prediction results. a, Recognition discrimination (Pr: proportion of hits � proportion of false alarms) and priming (i.e., fragment identification advantage for old objects) for theKOR and CON groups. Fluency effects (i.e., fragment identification advantage for objects judged old) across all items are also presented. Prediction 1 of the SS model is confirmed by lower recognitionand priming in the KOR group than in the CON group. b, Differences in the ID level for items judged old versus judged new within new and old item types, and differences in the priming effect (overall)and the priming effect of items judged new. Predictions 2 and 3 of the SS model are confirmed in the KOR group. Bars indicate experimental data (error bars indicate 95% confidence intervals of themean). Symbols indicate the expected result from each model when fit to data aggregated across individuals (a; because the data are derived from all of the participants) or the mean expected resultfrom each model when fit to each individual’s data (b; because the data are derived from the subset of participants with responses in all four recognition categories).
Berry et al. • Modeling Recognition and Priming in Amnesia J. Neurosci., August 13, 2014 • 34(33):10963–10974 • 10969
higher than in the full set of participants(KOR group: mean, 0.45; CON group:mean, 0.89). In the CON group, the ex-cluded participants tended to have slightlyhigher recognition scores (d � 3.17, Pr �0.82); however, in the KOR group, therecognition scores were similar to the pre-exclusion group mean (d � 1.07, Pr �0.17). The excluded KOR participants didnot appreciably differ from the pre-exclusion KOR group in terms of age(mean age, 49.33 years), NART-IQ score(mean score, 89.00), RBMT (mean score,6.22), or education level (mean level,4.11). Listwise deletion of these partici-pants did not result in any qualitativechanges in the recognition and primingdifferences reported, with the exceptionthat the difference in the priming effectsbetween the groups was only marginal(t(32) � 1.51, p � 0.07, d � 0.53, one-tailed; KOR group: mean, 0.30; SE, 0.14;CON group: mean, 0.64; SE, 0.16); thus,there is need for a little caution in theclaim of a deficit in priming in this KOR group. However, thepriming effect in the KOR group subset (d � 0.52) was stillsmaller than that of that of the CON group (d � 0.90), and wasonly marginally significantly different from chance (t(14) � 2.09,p � 0.055), which is, at least, still consistent with a deficit.
As predicted by the SS model (Prediction 2), in the KORgroup, mean identification levels for items judged old were lowerthan those of items judged new within new and old items: ID(cor-rect rejection) versus ID(false alarm): t(14) � 3.04, p � 0.009, d �0.42; ID(miss) vs ID(hit): t(14) � 3.98, p � 0.001, d � 0.74 (Fig.4b). Furthermore, as predicted by the SS model (Prediction 3),the magnitude of the priming effect for items judged new [calcu-lated as ID(correct rejection) � ID(miss)] was significantly lowerthan the priming effect for items judged new in the KOR group(t(14) � 2.51, p � 0.025, d � 0.51). However, the priming effectfor items judged new was not reliable in this group (t(14) � 0.083,p � 0.94, d � 0.02). Similar trends regarding Predictions 2 and 3were evident in the CON group; however, these were not reliable(Fig. 4b): Prediction 2: ID(correct rejection) versus ID(falsealarm), t(18) � 1.50, p � 0.15, d � 0.23; ID(miss) versus ID(hit),t(18) � 1.29, p � 0.21, d � 0.15; Prediction 3: t(18) � 1.18, p �0.25, d � 0.28. The priming effect for items judged new was,however, reliable in the CON group (t(18) � 2.89, p � 0.01, d �0.29). A 2 (item type: old, new) � 2 (judgment: old, new) � 2(group: CON, KOR) ANOVA was also conducted on the identi-
fication levels. There was a significant main effect of judgment,F(1,32) � 21.23, p � 0.001, �p
2 � 0.40, indicating that identifica-tion levels tended to be lower for items judged old versus new. Noother main effects or interactions were significant (main effect ofitem type: F(1,32) � 3.28, p � 0.08; all other F values �2.33, pvalues �0.137, �p
2 values �0.09).
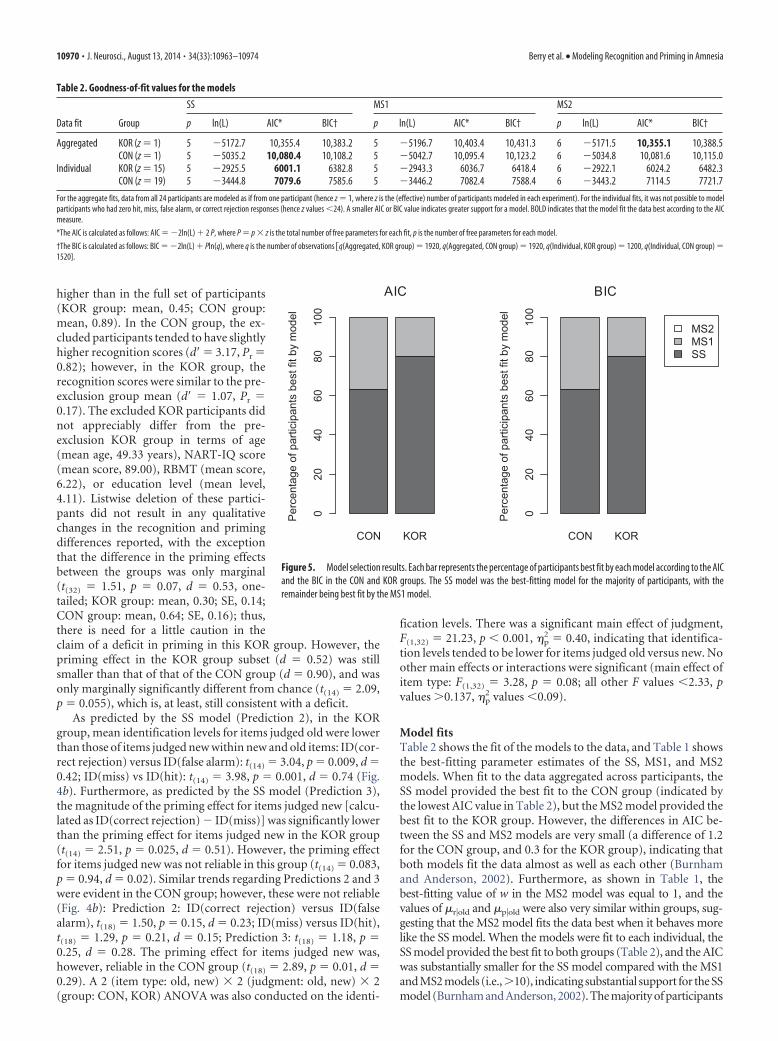
Model fitsTable 2 shows the fit of the models to the data, and Table 1 showsthe best-fitting parameter estimates of the SS, MS1, and MS2models. When fit to the data aggregated across participants, theSS model provided the best fit to the CON group (indicated bythe lowest AIC value in Table 2), but the MS2 model provided thebest fit to the KOR group. However, the differences in AIC be-tween the SS and MS2 models are very small (a difference of 1.2for the CON group, and 0.3 for the KOR group), indicating thatboth models fit the data almost as well as each other (Burnhamand Anderson, 2002). Furthermore, as shown in Table 1, thebest-fitting value of w in the MS2 model was equal to 1, and thevalues of �r�old and �p�old were also very similar within groups, sug-gesting that the MS2 model fits the data best when it behaves morelike the SS model. When the models were fit to each individual, theSS model provided the best fit to both groups (Table 2), and the AICwas substantially smaller for the SS model compared with the MS1and MS2 models (i.e.,�10), indicating substantial support for the SSmodel (Burnham and Anderson, 2002). The majority of participants
Figure 5. Model selection results. Each bar represents the percentage of participants best fit by each model according to the AICand the BIC in the CON and KOR groups. The SS model was the best-fitting model for the majority of participants, with theremainder being best fit by the MS1 model.
Table 2. Goodness-of-fit values for the models
Data fit Group
SS MS1 MS2
p ln(L) AIC* BIC† p ln(L) AIC* BIC† p ln(L) AIC* BIC†
Aggregated KOR (z � 1) 5 �5172.7 10,355.4 10,383.2 5 �5196.7 10,403.4 10,431.3 6 �5171.5 10,355.1 10,388.5CON (z � 1) 5 �5035.2 10,080.4 10,108.2 5 �5042.7 10,095.4 10,123.2 6 �5034.8 10,081.6 10,115.0
Individual KOR (z � 15) 5 �2925.5 6001.1 6382.8 5 �2943.3 6036.7 6418.4 6 �2922.1 6024.2 6482.3CON (z � 19) 5 �3444.8 7079.6 7585.6 5 �3446.2 7082.4 7588.4 6 �3443.2 7114.5 7721.7
For the aggregate fits, data from all 24 participants are modeled as if from one participant (hence z � 1, where z is the (effective) number of participants modeled in each experiment). For the individual fits, it was not possible to modelparticipants who had zero hit, miss, false alarm, or correct rejection responses (hence z values �24). A smaller AIC or BIC value indicates greater support for a model. BOLD indicates that the model fit the data best according to the AICmeasure.
*The AIC is calculated as follows: AIC � �2ln(L) � 2 P, where P � p � z is the total number of free parameters for each fit, p is the number of free parameters for each model.
†The BIC is calculated as follows: BIC � �2ln(L) � Pln(q), where q is the number of observations �q(Aggregated, KOR group) � 1920, q(Aggregated, CON group) � 1920, q(Individual, KOR group) � 1200, q(Individual, CON group) �1520].
10970 • J. Neurosci., August 13, 2014 • 34(33):10963–10974 Berry et al. • Modeling Recognition and Priming in Amnesia
in each group were best fit by the SS model, with the remainder beingbest fit by the MS1 model (Fig. 5). The BIC results also tended tosupport the SS model (Table 2, Fig. 5).
The expected model results are indicated by the symbols inFigures 3 and 4. All models closely reproduced the key trends inthe data: recognition and priming were lower in the KOR groupthan the CON group (Prediction 1); and the SS and MS2 modelspredicted nonzero differences between ID(correct rejection) andID(false alarm), ID(miss) and ID(hit) (Prediction 2), and alsobetween priming overall and for items judged new (Prediction 3;Fig. 4). The MS1 model did not, however, predict any of thesedifferences (Fig. 4).
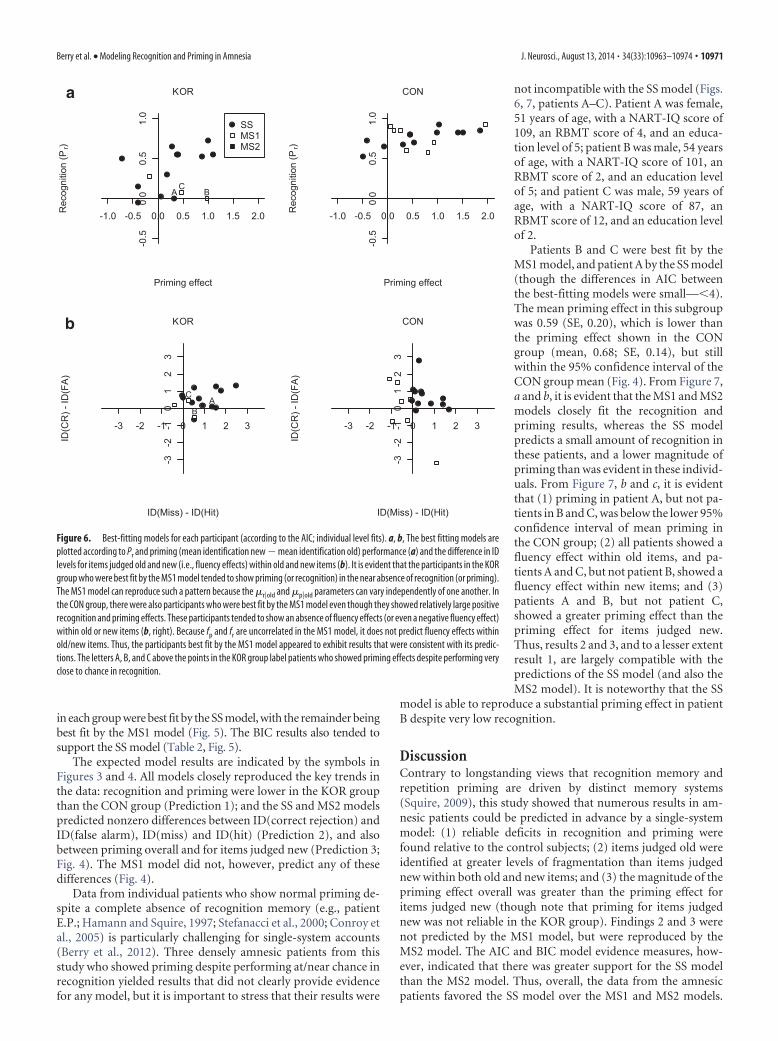
Data from individual patients who show normal priming de-spite a complete absence of recognition memory (e.g., patientE.P.; Hamann and Squire, 1997; Stefanacci et al., 2000; Conroy etal., 2005) is particularly challenging for single-system accounts(Berry et al., 2012). Three densely amnesic patients from thisstudy who showed priming despite performing at/near chance inrecognition yielded results that did not clearly provide evidencefor any model, but it is important to stress that their results were
not incompatible with the SS model (Figs.6, 7, patients A–C). Patient A was female,51 years of age, with a NART-IQ score of109, an RBMT score of 4, and an educa-tion level of 5; patient B was male, 54 yearsof age, with a NART-IQ score of 101, anRBMT score of 2, and an education levelof 5; and patient C was male, 59 years ofage, with a NART-IQ score of 87, anRBMT score of 12, and an education levelof 2.
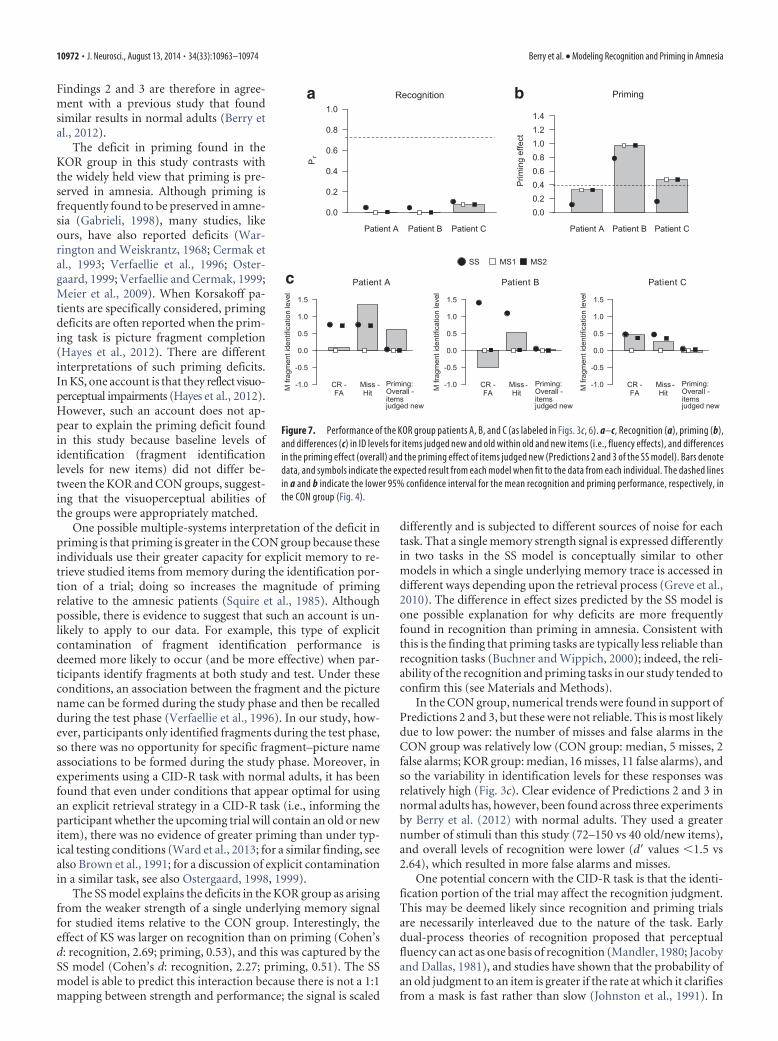
Patients B and C were best fit by theMS1 model, and patient A by the SS model(though the differences in AIC betweenthe best-fitting models were small—�4).The mean priming effect in this subgroupwas 0.59 (SE, 0.20), which is lower thanthe priming effect shown in the CONgroup (mean, 0.68; SE, 0.14), but stillwithin the 95% confidence interval of theCON group mean (Fig. 4). From Figure 7,a and b, it is evident that the MS1 and MS2models closely fit the recognition andpriming results, whereas the SS modelpredicts a small amount of recognition inthese patients, and a lower magnitude ofpriming than was evident in these individ-uals. From Figure 7, b and c, it is evidentthat (1) priming in patient A, but not pa-tients in B and C, was below the lower 95%confidence interval of mean priming inthe CON group; (2) all patients showed afluency effect within old items, and pa-tients A and C, but not patient B, showed afluency effect within new items; and (3)patients A and B, but not patient C,showed a greater priming effect than thepriming effect for items judged new.Thus, results 2 and 3, and to a lesser extentresult 1, are largely compatible with thepredictions of the SS model (and also theMS2 model). It is noteworthy that the SS
model is able to reproduce a substantial priming effect in patientB despite very low recognition.
DiscussionContrary to longstanding views that recognition memory andrepetition priming are driven by distinct memory systems(Squire, 2009), this study showed that numerous results in am-nesic patients could be predicted in advance by a single-systemmodel: (1) reliable deficits in recognition and priming werefound relative to the control subjects; (2) items judged old wereidentified at greater levels of fragmentation than items judgednew within both old and new items; and (3) the magnitude of thepriming effect overall was greater than the priming effect foritems judged new (though note that priming for items judgednew was not reliable in the KOR group). Findings 2 and 3 werenot predicted by the MS1 model, but were reproduced by theMS2 model. The AIC and BIC model evidence measures, how-ever, indicated that there was greater support for the SS modelthan the MS2 model. Thus, overall, the data from the amnesicpatients favored the SS model over the MS1 and MS2 models.
a
b
Figure 6. Best-fitting models for each participant (according to the AIC; individual level fits). a, b, The best fitting models areplotted according to Pr and priming (mean identification new � mean identification old) performance (a) and the difference in IDlevels for items judged old and new (i.e., fluency effects) within old and new items (b). It is evident that the participants in the KORgroup who were best fit by the MS1 model tended to show priming (or recognition) in the near absence of recognition (or priming).The MS1 model can reproduce such a pattern because the �r�old and �p�old parameters can vary independently of one another. Inthe CON group, there were also participants who were best fit by the MS1 model even though they showed relatively large positiverecognition and priming effects. These participants tended to show an absence of fluency effects (or even a negative fluency effect)within old or new items (b, right). Because fp and fr are uncorrelated in the MS1 model, it does not predict fluency effects withinold/new items. Thus, the participants best fit by the MS1 model appeared to exhibit results that were consistent with its predic-tions. The letters A, B, and C above the points in the KOR group label patients who showed priming effects despite performing veryclose to chance in recognition.
Berry et al. • Modeling Recognition and Priming in Amnesia J. Neurosci., August 13, 2014 • 34(33):10963–10974 • 10971
Findings 2 and 3 are therefore in agree-ment with a previous study that foundsimilar results in normal adults (Berry etal., 2012).
The deficit in priming found in theKOR group in this study contrasts withthe widely held view that priming is pre-served in amnesia. Although priming isfrequently found to be preserved in amne-sia (Gabrieli, 1998), many studies, likeours, have also reported deficits (War-rington and Weiskrantz, 1968; Cermak etal., 1993; Verfaellie et al., 1996; Oster-gaard, 1999; Verfaellie and Cermak, 1999;Meier et al., 2009). When Korsakoff pa-tients are specifically considered, primingdeficits are often reported when the prim-ing task is picture fragment completion(Hayes et al., 2012). There are differentinterpretations of such priming deficits.In KS, one account is that they reflectvisuo-perceptual impairments (Hayes et al., 2012).However, such an account does not ap-pear to explain the priming deficit foundin this study because baseline levels ofidentification (fragment identificationlevels for new items) did not differ be-tween the KOR and CON groups, suggest-ing that the visuoperceptual abilities ofthe groups were appropriately matched.
One possible multiple-systems interpretation of the deficit inpriming is that priming is greater in the CON group because theseindividuals use their greater capacity for explicit memory to re-trieve studied items from memory during the identification por-tion of a trial; doing so increases the magnitude of primingrelative to the amnesic patients (Squire et al., 1985). Althoughpossible, there is evidence to suggest that such an account is un-likely to apply to our data. For example, this type of explicitcontamination of fragment identification performance isdeemed more likely to occur (and be more effective) when par-ticipants identify fragments at both study and test. Under theseconditions, an association between the fragment and the picturename can be formed during the study phase and then be recalledduring the test phase (Verfaellie et al., 1996). In our study, how-ever, participants only identified fragments during the test phase,so there was no opportunity for specific fragment–picture nameassociations to be formed during the study phase. Moreover, inexperiments using a CID-R task with normal adults, it has beenfound that even under conditions that appear optimal for usingan explicit retrieval strategy in a CID-R task (i.e., informing theparticipant whether the upcoming trial will contain an old or newitem), there was no evidence of greater priming than under typ-ical testing conditions (Ward et al., 2013; for a similar finding, seealso Brown et al., 1991; for a discussion of explicit contaminationin a similar task, see also Ostergaard, 1998, 1999).
The SS model explains the deficits in the KOR group as arisingfrom the weaker strength of a single underlying memory signalfor studied items relative to the CON group. Interestingly, theeffect of KS was larger on recognition than on priming (Cohen’sd: recognition, 2.69; priming, 0.53), and this was captured by theSS model (Cohen’s d: recognition, 2.27; priming, 0.51). The SSmodel is able to predict this interaction because there is not a 1:1mapping between strength and performance; the signal is scaled
differently and is subjected to different sources of noise for eachtask. That a single memory strength signal is expressed differentlyin two tasks in the SS model is conceptually similar to othermodels in which a single underlying memory trace is accessed indifferent ways depending upon the retrieval process (Greve et al.,2010). The difference in effect sizes predicted by the SS model isone possible explanation for why deficits are more frequentlyfound in recognition than priming in amnesia. Consistent withthis is the finding that priming tasks are typically less reliable thanrecognition tasks (Buchner and Wippich, 2000); indeed, the reli-ability of the recognition and priming tasks in our study tended toconfirm this (see Materials and Methods).
In the CON group, numerical trends were found in support ofPredictions 2 and 3, but these were not reliable. This is most likelydue to low power: the number of misses and false alarms in theCON group was relatively low (CON group: median, 5 misses, 2false alarms; KOR group: median, 16 misses, 11 false alarms), andso the variability in identification levels for these responses wasrelatively high (Fig. 3c). Clear evidence of Predictions 2 and 3 innormal adults has, however, been found across three experimentsby Berry et al. (2012) with normal adults. They used a greaternumber of stimuli than this study (72–150 vs 40 old/new items),and overall levels of recognition were lower (d values �1.5 vs2.64), which resulted in more false alarms and misses.
One potential concern with the CID-R task is that the identi-fication portion of the trial may affect the recognition judgment.This may be deemed likely since recognition and priming trialsare necessarily interleaved due to the nature of the task. Earlydual-process theories of recognition proposed that perceptualfluency can act as one basis of recognition (Mandler, 1980; Jacobyand Dallas, 1981), and studies have shown that the probability ofan old judgment to an item is greater if the rate at which it clarifiesfrom a mask is fast rather than slow (Johnston et al., 1991). In
a b
c
Figure 7. Performance of the KOR group patients A, B, and C (as labeled in Figs. 3c, 6). a–c, Recognition (a), priming (b),and differences (c) in ID levels for items judged new and old within old and new items (i.e., fluency effects), and differencesin the priming effect (overall) and the priming effect of items judged new (Predictions 2 and 3 of the SS model). Bars denotedata, and symbols indicate the expected result from each model when fit to the data from each individual. The dashed linesin a and b indicate the lower 95% confidence interval for the mean recognition and priming performance, respectively, inthe CON group (Fig. 4).
10972 • J. Neurosci., August 13, 2014 • 34(33):10963–10974 Berry et al. • Modeling Recognition and Priming in Amnesia
other words, a relatively fluent identification can be attributed toprior exposure. It is therefore possible that the relations betweenpriming and recognition that we find are accentuated by theCID-R task. However, there is evidence from similar studies thathave used blocked designs, which demonstrate that the within-item recognition-priming measure associations of the kind ob-served in this study are not dependent upon the interleavednature of the CID-R task (Ostergaard, 1998; Sheldon and Mos-covitch, 2010; see also discussion in Berry et al., 2012).
An important question is whether the SS model extends toother explicit tasks that are more reliant upon recollection (i.e.,remembering prior context). Berry et al. (2012) found some evi-dence for this using a modified CID-R task with remember–know judgments (Tulving, 1985). Remember judgments arewidely thought to measure a recollection memory process(Yonelinas, 2002). Berry et al. (2012) found that identificationresponse times to items given remember judgments were fasterthan for those given know judgments (commonly thought tomeasure a familiarity process), and this was predicted by the SSmodel. In future research, it will be important to determinewhether the model extends to other tasks that are reliant uponrecollection such as source memory.
Finally, a remaining issue is whether the SS model can explainthe kind of dissociation that is opposite to that reported in am-nesia, namely, evidence of brain regions that support priming butnot recognition. Although initial neuropsychological studies in-dicated that the right occipital lobe was such a region (Gabrieli etal., 1995), subsequent investigations have not corroborated this(Yonelinas et al., 2001; Kroll et al., 2003). Nevertheless, it is clearthat regions outside the medial temporal lobe are involved inpriming (and also recognition; Schacter et al., 2007), and oneavenue for future research will be to determine how the activity ofdifferent regions maps onto the single strength signal in the SSmodel.
To conclude, the results from amnesic patients supported thepredictions of the SS model. Numerous results were inconsistentwith the MS1 model; this suggests that recognition and primingare not driven by completely independent explicit and implicitmemory signals. Like the SS model, the MS2 model could ac-count for the data. The MS2 model explains the deficits in recog-nition and priming in amnesia as reductions in the strength ofboth the explicit and implicit memory signals. There is also asubstantial degree of association between the explicit and implicitmemory strengths of a given item according to this model. The SSmodel, however, tended to be preferred according to model evi-dence measures and could predict the majority of results in am-nesia in advance. Thus, the SS model appears to provide the mostparsimonious account for the pattern of recognition and primingin amnesia found in this study.
ReferencesAkaike H (1973) Information theory as an extension of the maximum like-
lihood principle. In: Information theory: 2nd international symposium(Csaki F, Petrov BN, eds), pp 267–281. Budapest, Hungary: AkademiaiKiado.
American Psychiatric Association (2000) Diagnostic and statistical manualof mental disorders, Ed 4 (DSM-IV). Washington, DC: American Psychi-atric Association.
Berry CJ, Henson RNA, Shanks DR (2006) On the relationship betweenrepetition priming and recognition memory: insights from a computa-tional model. J Mem Lang 55:515–533. CrossRef
Berry CJ, Shanks DR, Henson RNA (2008a) A single-system account of therelationship between priming, recognition, and fluency. J Exp PsycholLearn Mem Cogn 34:97–111. CrossRef Medline
Berry CJ, Shanks DR, Henson RNA (2008b) A unitary signal-detection
model of implicit and explicit memory. Trends Cogn Sci 12:367–373.CrossRef Medline
Berry CJ, Shanks DR, Li S, Rains LS, Henson RNA (2010) Can “pure” im-plicit memory be isolated? A test of a single-system model of recognitionand repetition priming. Can J Exp Psychol 64:241–255. CrossRef Medline
Berry CJ, Shanks DR, Speekenbrink M, Henson RNA (2012) Models of rec-ognition, repetition priming, and fluency: exploring a new framework.Psychol Rev 119:40 –79. CrossRef Medline
Brown AS, Neblett DR, Jones TC, Mitchell DB (1991) Transfer of process-ing in repetition priming: some inappropriate findings. J Exp PsycholLearn Mem Cogn 17:514 –525. CrossRef Medline
Buchner A, Wippich W (2000) On the reliability of implicit and explicitmemory measures. Cogn Psychol 40:227–259. CrossRef Medline
Burnham KP, Anderson DR (2002) Model selection and multimodel infer-ence. A practical information-theoretic approach, Ed 2. New York:Springer.
Cermak LS, Verfaellie M, Letourneau L, Jacoby LL (1993) Episodic effectson picture identification for alcoholic Korsakoff patients. Brain Cogn22:85–97. CrossRef Medline
Conroy MA, Hopkins RO, Squire LR (2005) On the contribution of percep-tual fluency and priming to recognition memory. Cogn Affect BehavNeurosci 5:14 –20. CrossRef Medline
Fama R, Pitel AL, Sullivan EV (2012) Anterograde episodic memory in Kor-sakoff syndrome. Neuropsychol Rev 22:93–104. CrossRef Medline
Gabrieli JD (1998) Cognitive neuroscience of human memory. Annu RevPsychol 49:87–115. CrossRef Medline
Gabrieli JDE, Fleischman DA, Keane MM, Reminger SL, Morrell F (1995)Double dissociation between memory systems underlying explicit andimplicit memory in the human brain. Psychol Sci 6:76 – 82. CrossRef
Green DM, Swets JA (1966) Signal detection theory and psychophysics.New York: Wiley.
Greve A, Donaldson DI, van Rossum MC (2010) A single-trace dual-process model of episodic memory: a novel computational account offamiliarity and recollection. Hippocampus 20:235–251. CrossRefMedline
Hamann SB, Squire LR (1997) Intact perceptual memory in the absence ofconscious memory. Behav Neurosci 111:850 – 854. CrossRef Medline
Hayes SM, Fortier CB, Levine A, Milberg WP, McGlinchey R (2012) Im-plicit memory in Korsakoff’s syndrome: a review of procedural learningand priming studies. Neuropsychol Rev 22:132–153. CrossRef Medline
Jacoby LL, Dallas M (1981) On the relationship between autobiographicalmemory and perceptual learning. J Exp Psychol Gen 110:306 –340.CrossRef Medline
Johnston WA, Hawley KJ, Elliott JM (1991) Contribution of perceptual flu-ency to recognition judgments. J Exp Psychol Learn Mem Cogn 17:210 –223. CrossRef Medline
Kessels RP, Kopelman MD (2012) Context memory in Korsakoff’s syn-drome. Neuropsychol Rev 22:117–131. CrossRef Medline
Kopelman MD (2002) Disorders of memory. Brain 125:2152–2190.CrossRef Medline
Kopelman MD, Thomson AD, Guerrini I, Marshall EJ (2009) The Korsakoffsyndrome: clinical aspects, psychology and treatment. Alcohol Alcohol44:148 –154. CrossRef Medline
Kroll NE, Yonelinas AP, Kishiyama MM, Baynes K, Knight RT, Gazzaniga MS(2003) The neural substrates of visual implicit memory: do the two hemi-spheres play different roles? J Cogn Neurosci 15:833– 842. CrossRefMedline
Le Berre AP, Pitel AL, Chanraud S, Beaunieux H, Eustache F, Martinot JL,Reynaud M, Martelli C, Rohlfing T, Sullivan EV, Pfefferbaum A (2014).Chronic alcohol consumption and its effect on nodes of frontocerebellarand limbic circuitry: comparison of effects in France and the UnitedStates. Hum Brain Mapp. Advance online publication. Retrieved July 12,2014. doi:10.1002/hbm.22500. CrossRef Medline
Mandler G (1980) Recognizing: the judgment of previous occurrence. Psy-chol Rev 87:252–271. CrossRef
Meier B, Theiler-Burgi M, Perrig W (2009) Levels of processing and amne-sia affect perceptual priming in fragmented picture naming. Int J Neuro-sci 119:1061–1075. CrossRef Medline
Oslin D, Atkinson RM, Smith DM, Hendrie H (1998) Alcohol related de-mentia: proposed clinical criteria. Int J Geriatr Psychiatry 13:203–212.CrossRef Medline
Ostergaard AL (1998) The effects on priming of word frequency, number of
Berry et al. • Modeling Recognition and Priming in Amnesia J. Neurosci., August 13, 2014 • 34(33):10963–10974 • 10973
repetitions, and delay depend on the magnitude of priming. Mem Cognit26:40 – 60. CrossRef Medline
Ostergaard AL (1999) Priming deficits in amnesia: now you see them, nowyou don’t. J Int Neuropsychol Soc 5:175–190. Medline
Oudman E, Van der Stigchel S, Wester AJ, Kessels RP, Postma A (2011)Intact memory for implicit contextual information in Korsakoff’s amne-sia. Neuropsychologia 49:2848 –2855. CrossRef Medline
Pitel AL, Chetelat G, Le Berre AP, Desgranges B, Eustache F, Beaunieux H(2012) Macrostructural abnormalities in Korsakoff syndrome comparedwith uncomplicated alcoholism. Neurology 78:1330 –1333. CrossRefMedline
Poldrack RA (1996) On testing for stochastic dissociations. Psychon BullRev 3:434 – 448. CrossRef Medline
Race E, Verfaellie M (2012) Remote memory function and dysfunction inKorsakoff’s syndrome. Neuropsychol Rev 22:105–116. CrossRef Medline
Schacter DL (1987) Implicit memory: history and current status. J Exp Psy-chol Learn Mem Cogn 13:501–518. CrossRef
Schacter DL, Wig GS, Stevens WD (2007) Reductions in cortical activityduring priming. Curr Opin Neurobiol 17:171–176. CrossRef Medline
Schmand B, Bakker D, Saan R, Louman J (1991) The Dutch Reading Test forAdults: a measure of premorbid intelligence level. Tijdschr Gerontol Geri-atr 22:15–19. Medline
Schwarz G (1978) Estimating the dimension of a model. Ann Stat 6:461–464. CrossRef
Shanks DR, Berry CJ (2012) Are there multiple memory systems? Tests ofmodels of implicit and explicit memory. Q J Exp Psychol 65:1449 –1474.CrossRef
Sheldon SA, Moscovitch M (2010) Recollective performance advantages forimplicit memory tasks. Memory 18:681– 697. CrossRef Medline
Snodgrass JG, Corwin J (1988) Pragmatics of measuring recognition mem-ory: applications to dementia and amnesia. J Exp Psychol Gen 117:34 –50.CrossRef Medline
Squire LR (2009) Memory and brain systems: 1969 –2009. J Neurosci 29:12711–12716. CrossRef Medline
Squire LR, Shimamura AP, Graf P (1985) Independence of recognitionmemory and priming effects: a neuropsychological analysis. J Exp PsycholLearn Mem Cogn 11:37– 44. CrossRef Medline
Stark CE, McClelland JL (2000) Repetition priming of words, pseudowords,
and nonwords. J Exp Psychol Learn Mem Cogn 26:945–972. CrossRefMedline
Stefanacci L, Buffalo EA, Schmolck H, Squire LR (2000) Profound amnesiaafter damage to the medial temporal lobe: a neuroanatomical and neuro-psychological profile of patient E. P. J Neurosci 20:7024 –7036. Medline
Tulving E (1985) Memory and consciousness. Can Psychol 26:1–12.CrossRef
Tulving E, Schacter DL (1990) Priming and human memory systems. Sci-ence 247:301–306. CrossRef Medline
Tulving E, Schacter DL, Stark HA (1982) Priming effects in word-fragmentcompletion are independent of recognition memory. J Exp Psychol LearnMem Cogn 8:336 –342. CrossRef
Van Balen HGG, Westzaan PSH, Mulder T (1996) Stratified norms for theRivermead Behavioural Memory Test. Neuropsychol Rehabil 6:203–217.CrossRef
Verfaellie M, Cermak LS (1999) Perceptual fluency as a cue for recognitionjudgments in amnesia. Neuropsychology 13:198 –205. CrossRef Medline
Verfaellie M, Gabrieli JDE, Vaidya CJ, Croce P, Reminger SL (1996) Implicitmemory for pictures in amnesia: role of etiology and priming task. Neu-ropsychology 10:517–528. CrossRef
Verhage F (1964) Intelligence and age. Assen, The Netherlands: vanGorcum.
Ward EV, Berry CJ, Shanks DR (2013) An effect of age on implicit memorythat is not due to explicit contamination: implications for single andmultiple-systems theories. Psychol Aging 28:429 – 442. CrossRef Medline
Warrington EK, Weiskrantz L (1968) New method of testing long-term re-tention with special reference to amnesic patients. Nature 217:972–974.CrossRef Medline
Wilson B, Cockburn J, Baddeley A, Hiorns R (1989) The development andvalidation of a test battery for detecting and monitoring everyday memoryproblems. J Clin Exp Neuropsychol 11:855– 870. CrossRef Medline
Yonelinas AP (2002) The nature of recollection and familiarity: a review of30 years of research. J Mem Lang 46:441–517. CrossRef
Yonelinas AP, Kroll NE, Baynes K, Dobbins IG, Frederick CM, Knight RT,Gazzaniga MS (2001) Visual implicit memory in the left hemisphere:evidence from patients with callosotomies and right occipital lobe lesions.Psychol Sci 12:293–298. CrossRef Medline
10974 • J. Neurosci., August 13, 2014 • 34(33):10963–10974 Berry et al. • Modeling Recognition and Priming in Amnesia