Embed Size (px)
Citation preview
Tumor and Stem Cell Biology
A Single-Nucleotide Substitution Mutator PhenotypeRevealed by Exome Sequencing of Human Colon Adenomas
Sergey I. Nikolaev1, Sotirios K. Sotiriou2, Ioannis S. Pateras5, Federico Santoni1, Stavros Sougioultzis6,Henrik Edgren7, Henrikki Almusa7, Daniel Robyr1, Michel Guipponi1, Janna Saarela7, Vassilis G. Gorgoulis5,Stylianos E. Antonarakis1,4, and Thanos D. Halazonetis2,3,4
AbstractOncogene-induced DNA replication stress is thought to drive genomic instability in cancer. In particular,
replication stress can explain the high prevalence of focal genomic deletions mapping within very large genesin human tumors. However, the origin of single-nucleotide substitutions (SNS) in nonfamilial cancers isstrongly debated. Some argue that cancers have a mutator phenotype, whereas others argue that the normalDNA replication error rates are sufficient to explain the number of observed SNSs. Here, we sequenced theexomes of 24, mostly precancerous, colon polyps. Analysis of the sequences revealed mutations in the APC,CTNNB1, and BRAF genes as the presumptive cancer-initiating events and many passenger SNSs. We used thenumber of SNSs in the various lesions to calculate mutation rates for normal colon and adenomas and foundthat colon adenomas exhibit a mutator phenotype. Interestingly, the SNSs in the adenomas mapped moreoften than expected within very large genes, where focal deletions in response to DNA replication stress alsomap. We propose that single-stranded DNA generated in response to oncogene-induced replication stresscompromises the repair of deaminated cytosines and other damaged bases, leading to the observed SNSmutator phenotype. Cancer Res; 72(23); 6279–89. �2012 AACR.
IntroductionHuman cancers are characterized by the presence of geno-
mic instability (1–4). One form of genomic instability, chro-mosomal instability (CIN), is present in most cancers andrefers to changes in chromosome number and structure.Multiple mechanisms can lead to CIN in cancers (1–3). Aspecific type of aberrant chromosome structure, focal chro-mosomal deletions, may be caused by oncogene-induced DNAreplication stress (4–6). An analysis of thousands of humancancers and hundreds of cancer cell lines has revealed thatfocal deletions are observed at high frequency within specificchromosomal sites known as common fragile sites (CFS; refs. 7,
8). Deletions within CFSs are pathognomonic of DNA replica-tion stress. In cells exposed to chemicals that inhibit DNAreplication, such as aphidicolin and hydroxyurea, genomicdeletions occur predominantly within CFSs (9–12). Further-more, in various experimental models, activated oncogenesinduce DNA replication stress and deletions within CFSs thatare very similar to the deletions induced by aphidicolin andhydroxyurea (13–15). Finally, DNA replication stress is prev-alent in human precancerous lesions and cancers and isassociated with focal deletions within CFSs (16–18). Takentogether, these observations suggest that oncogene-inducedDNA replication stress is responsible for the focal deletions andLOH observed at CFSs in human precancerous lesions andcancers (4–6).
Another form of genomic instability, microsatellite instabil-ity (MSI), is characterized by changes in the number of short-nucleotide repeats, calledmicrosatellites (1–3).MSI is observedonly in a minority of cancers and is caused by mutation orepigenetic inactivation of DNA mismatch repair genes (1–3).
Finally, it has been argued that cancers have yet another formof genomic instability, whichmakes them susceptible to acquir-ing single-nucleotide substitutions (SNS). This type of genomicinstability is often referred to as themutator phenotype (19–21).The mutator phenotype hypothesis posits that a gene impor-tant for maintaining genomic stability is inactivated early incancer development, presumably in precancerous lesions oreven in normal cells, and that the subsequent increase inmutation rate allows the acquisition of cancer-driver muta-tions. Defects in DNA repair genes have been proposed as themost likely culprits for the mutator phenotype (19–21).
Authors' Affiliations: 1Department ofGeneticMedicine andDevelopment,University of Geneva Medical School; Departments of 2Molecular Biologyand 3Biochemistry, University of Geneva; 4Institute of Genetics and Geno-mics of Geneva (iGE3), Geneva, Switzerland; 5Molecular CarcinogenesisGroup, Department of Histology and Embryology, School of Medicine;6Pathophysiology Department, Gastroenterology Unit, Laiko General Hos-pital, University of Athens, Athens, Greece; and 7Institute for MolecularMedicine Finland (FIMM), University of Helsinki, Helsinki, Finland
Note: Supplementary data for this article are available at Cancer ResearchOnline (http://cancerres.aacrjournals.org/).
CorrespondingAuthors:ThanosD.Halazonetis, Department ofMolecularBiology, University of Geneva, 30 quai Ernest-Ansermet, 1205 Geneva,Switzerland. Phone: 41-22-379-6112; Fax: 41-22-379-6868; E-mail:[email protected]; and Stylianos E. Antonarakis, Departmentof Genetic Medicine and Development, University of Geneva MedicalSchool, 1 rue Michel-Servet, 1211 Geneva, Switzerland. Phone: 41-22-379-5708; E-mail: [email protected]
doi: 10.1158/0008-5472.CAN-12-3869
�2012 American Association for Cancer Research.
CancerResearch
www.aacrjournals.org 6279
on August 29, 2018. © 2012 American Association for Cancer Research. cancerres.aacrjournals.org Downloaded from on August 29, 2018. © 2012 American Association for Cancer Research. cancerres.aacrjournals.org Downloaded from on August 29, 2018. © 2012 American Association for Cancer Research. cancerres.aacrjournals.org Downloaded from
Despite the elegant arguments in favor of the existence of amutator phenotype, it should be noted that an increased SNSmutation rate has not yet been experimentally shown in pre-cancerous lesions. Accordingly, themutator phenotype hypoth-esis has been heavily debated (22–25). The proponents arguethat a mutator phenotype is the only way to explain how a cellcan acquire the multitude of mutations needed for malignanttransformation. The opponents have argued that mutations inDNA repair genes have not been identified in the majority ofnonhereditary human cancers and, especially, not in precan-cerous lesions (23). Furthermore, that normal DNA replicationerror rates are sufficient to explain the number of SNSs observ-ed by genome-wide sequencing of human cancers (24).
It should be stated that, in broad terms, the mutatorphenotype hypothesis embraces all types of genomic instabil-ity, including CIN andMSI (19–21). However, the recent debatehas used a more narrow definition, focusing entirely on SNSs,as the presence of CIN and MSI in cancers is widely accepted(24, 25). Hence, here, we will also use the narrow definition ofmutator phenotype, referring only to SNSs.
High-throughput DNA sequencing is arguably a powerfulmethod to analyze the presence of SNSs in human clinicalsamples and, thus, to help address the mutator phenotypedebate. Thus, we explored whether exome-wide DNA sequenc-ing of precancerous lesions could provide new insights on themechanisms underlying genomic instability, as well as on thesequence of events leading to cancer development. Other thanpancreatic cysts (26, 27), no human precancerous lesions havebeen subjected to exome sequencing to our knowledge.
Materials and MethodsClinical and histopathologic data
Macroscopically appearing adenomas and patient-matchednormal colorectal tissue were endoscopically removed at theLaiko General Hospital (Athens, Greece) after approval of thestudy by the Ethics Committee of the University of AthensMedical School (Athens, Greece) and obtaining informedconsent from the patients. All patients were asymptomaticand were examined in the context of regularly scheduledcolonoscopies. Only the patient with the adenocarcinoma caseCA2 was subjected to colonoscopy because of complaint ofblood in the stools. The patients were not related to each otherand did not have a family history of predisposition to coloncancer or other cancers, as assessed by their medical histories.Relevant clinicopathologic data are shown in SupplementaryTable S1. Resected polyps and normal colon tissue from thesame patientwere snap-frozen and stored at�70�C.Histologicdiagnosis was conducted by 2 pathologists (V.G. Gorgoulis andI.S. Pateras), who evaluated the samples independently of eachother, using formalin-fixed and paraffin-embedded sections.Immunohistochemistry was conducted in paraffin-embeddedtissues, using the UltraVision LP Detection System (ThermoScientific) and an antibody specific for phosphorylated histoneH2AX (p-Ser139, 05-636, Millipore).
DNA extraction and exome sequencingThe overall methodology was as previously described (28).
DNA was extracted from the frozen tissues using the QIAamp
DNA Mini Kit (Qiagen), exome capture was conducted usingthe SureSelect Human Exon v3 50Mb (Agilent Technologies) orSeqCap EZ Human Exome Library SR version 1.2 35 Mb(Roche-Nimblegen) kits, and sequencing was conducted onIllumina HiSeq2000 and GAIIx instruments with paired-end105 nt reads. Burrows–Wheeler Aligner (BWA) software wasused to align the sequence reads to the human referencegenome NCBI build (GRCh37/hg19). SAMtools was used toremove PCR duplicates and to call single-nucleotide variants(SNV). Detection of small insertions and deletions (smINDEL)was conducted with Pindel 0.2.2 software. The search forsomatic mutations was restricted to the regions that werecovered at least 10-fold in both the normal and polyp tissuesamples. The average sequencing coverage was 155� forpolyp DNA and 146� for normal tissue DNA (SupplementaryTable S1).
Calling of SNSsThe initial list of SNVs was filtered against the common
(>5%) germline polymorphisms present in the db135 and 1,000genomes databases. SNVs present in the normal tissue samplefrom the same patient at a frequency of greater than 2% werealso filtered out. To call somatic mutations, we improved, asdescribed later, upon the algorithms that we had used for ourmelanoma exome sequencing project (28). These improve-ments enhanced the accuracy of calling SNSs (SupplementaryFig. S1). In contrast to SNSs, smINDELs were called with loweraccuracy and, therefore, we report only those smINDELs thatwere validated by Sanger sequencing. For both SNSs andsmINDELs, we focused on the mutations that map to theprotein coding sequences and to splice sites, as the untrans-lated exonic regionswere lesswell covered by the commerciallyavailable exome capture kits.
To call SNSs, a modified SAMtools score was calculated foreach SNV using the following formula:
Modified SAMtools score
¼ ½log ðTNR � 100=ACÞ�2 � log ðISÞ=ðBAL2 þ 1Þ;
where TNR is the total number of reads spanning a SNV, ACis the exome-wide average coverage for the specific tissue, ISis the initial SAMtools score; BAL equals NFRW/(NFRWþNRRW) � NFRV/(NFRVþNRRV), where NFRW is the numberof forward-direction reads for thewild-type sequence, NRRW isthe number of reverse direction reads for the wild-typesequence, NFRV is the number of forward-direction reads forthe variant sequence, and NRRV is the number of reversedirection reads for the variant sequence.
The above pipeline was repeated twice, switching thelabels of the polyp and normal tissue datasets. The modifiedSAMtools scores from the switched datasets were used toestablish a threshold for calling SNSs. The threshold was themean score plus 3 SDs (Supplementary Fig. S1).
Two hundred and sixty SNVswere subjected to validation bySanger sequencing. Included within this list were 15 SNVs thatwere less than the threshold for calling SNSs, as ameans to testthe SNS-calling method described earlier. Of the 260 SNVs
Nikolaev et al.
Cancer Res; 72(23) December 1, 2012 Cancer Research6280
on August 29, 2018. © 2012 American Association for Cancer Research. cancerres.aacrjournals.org Downloaded from
subjected to Sanger sequencing, 241 were confirmed. The finalnumber of called SNSs was 1,147 after very few adjustmentswere made to incorporate the results of the validation experi-ments. Potential cancer-drivermutationswere evaluated usingthe MuSiC algorithm (29).
LOH and copy number alterationsTwo independent methods were used to detect regions of
LOH and copy number alterations (CNA) using the exome-sequencing data. Both methods relied on single-nucleotidepolymorphisms (SNP) that were heterozygous in the normaltissue DNA and on the total number of reads across thegenome. In the first method, ratios of SNPs in the normalversus polyp tissue andmedian values of number of sequencingreads were averaged over 10 Mb bins and visualized usingCIRCOS plots. The second method used an updated version ofa previously described pipeline (30). Reads were aligned to thehg19 reference genome and only those that aligned to regionstargeted by exome sequence capture probes were used insubsequent steps. When the regions targeted by 2 or morecapture probes overlapped, all consecutive overlapping regionswere first merged and subsequently split into bins of 200 bp. Acopy number ratio was calculated separately for each bin.Between sample differences in sequencing coverage werenormalized by transforming read counts into RPKM (readsper kilobase of bin length per million mapped reads) values foreach bin. After filtering out bins with low sequencing coverage,log2 copy number ratios of sample divided by reference werecalculated and segmented. Variants were called with SAMtoolsmpileup and variant frequency data were displayed for allvariant bases in targeted regions.
Mutation frequenciesA total of 19,075 protein-coding RefSeq geneswere separated
into bins according to their genomic size. The expectedfrequency of mutations in each bin was calculated on the basisof the fraction of coding sequence length (CDS) of the genes ineach bin relative to the total CDS of all genes or based on thefraction of genomic length of the genes in each bin relative tothe total genomic length of all genes, depending on the data(coding sequences or genome-wide sequences) being analyzed.Differences in the observed and expected frequencies wereevaluated using the cumulative binomial distribution function.
ResultsCancer-driver mutationsThe colon is an ideal system to study human precancerous
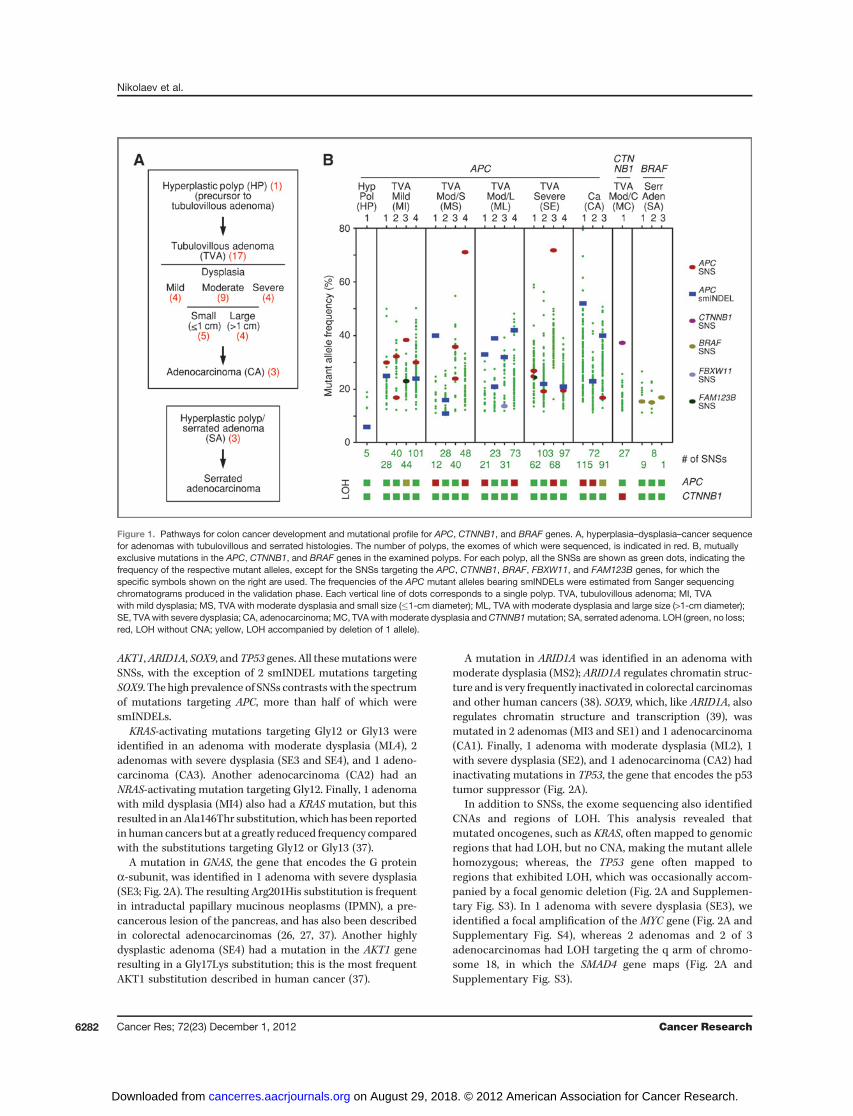
lesions (31). In this tissue, cancer proceeds via a classicsequence of hyperplasia, dysplasia, and cancer (Fig. 1A). Typ-ically, the precancerous and cancerous lesions protrude intothe lumen of the colon as polyps, which can be resected,providing material for DNA sequencing. For this study, wesequenced the exomes of 24 randomly selected polypsobtained from 22 individuals with no family history of predis-position to cancer. DNA from normal tissue from all thesepatients was also sequenced. Histologic analysis revealed thatone of these polyps was a hyperplastic polyp (no dysplasia), 17were adenomas of the tubulovillous type (withmild, moderate,
or severe dysplasia), 3 were serrated adenomas, and 3 wereadenocarcinomas (Fig. 1A and Supplementary Table S1). Forall polyps, the exome sequencing data generated a list of SNSsand smINDELs. In addition, regions of genomic CNAs and LOHwere identified by analyzing the number of sequencing readscorresponding to polymorphic alleles.
To explore the pathways by which normal colon cellsbecome transformed, we tabulated the SNSs and smINDELstargeting the genes that have been implicated in coloncancer development (31–34). Mutations in the APC, CTNNB1,and BRAF genes were found to be mutually exclusive in ourseries, allowing us to subdivide the polyps into 3 distinctgroups (Fig. 1B).
The group with APCmutations included 20 polyps, of which1 was a hyperplastic polyp, 16 were adenomas (all of thetubulovillous type), and 3 were adenocarcinomas. Of the 30APCmutations identified in the 20 polyps, 16 were smINDELsand 14 were SNSs with the majority of polyps having at least 1smINDEL (Fig. 1B). All the APC mutations introduced prema-ture termination codons that, in many cases, mapped withinresidues 1,304 to 1,435 of the APC protein, consistent with thespectrum of APC mutations previously reported in sporadiccolorectal carcinomas (31–34). Furthermore, none of thepolyps had retained a wild-type APC allele; either 2 distinctAPC mutations were identified per polyp or a single mutationwas associated with LOH (Fig. 1B and Supplementary Figs. S2and S3). The only exceptions were the hyperplastic polyp andan adenoma with moderate dysplasia (ML3), in which only asingle APC mutation was identified. The hyperplastic polyp ishistologically a very early lesion with no signs of dysplasia;whereas, the adenoma ML3 had an inactivating mutation inthe FBXW11/beta-TrCP2 gene. The protein product of FBXW11functions together with APC and FAM123B/WTX to targetb-catenin for degradation (35). Interestingly, mutations target-ing the FAM123B gene were also detected in 2 adenomas (MI3and SE1) in our series (Fig. 1B).
The groupwithCTNNB1mutations included only 1 polyp, anadenoma withmoderate dysplasia, and tubulovillous histology(Fig. 1B). The mutation in this polyp was homozygous, due toLOH (Supplementary Fig. S3), and resulted in a Ser45Phesubstitution within b-catenin, the protein product of CTNNB1.This substitution prevents b-catenin from being degraded and,therefore, is equivalent to APC inactivation (35).
The group with BRAF mutations included the 3 adenomaswith serrated histology (Fig. 1B), consistent with previousreports linking activated BRAF to this adenoma type (36). All3 serrated adenomas in our study had a recurrent pointmutation that results in a Val600Glu substitution and rendersthe B-Raf kinase constitutively active (31, 36). Unlike the APCand CTNNB1 mutations, all the BRAF mutations in our serieswere heterozygous (Supplementary Fig. S3).
In the adenomas with CTNNB1 and BRAF mutations, nomutations in other known cancer-driver genes were identifiedby exome sequencing. However, in the adenomas with APCmutations we identified additional cancer-driver mutations,whose number correlated with the degree of dysplasia andinvasiveness (Fig. 2A and Supplementary Table S2). Specifi-cally, mutations were identified in the KRAS, NRAS, GNAS,
Mutator Phenotype in Colon Adenomas
www.aacrjournals.org Cancer Res; 72(23) December 1, 2012 6281
on August 29, 2018. © 2012 American Association for Cancer Research. cancerres.aacrjournals.org Downloaded from
AKT1,ARID1A, SOX9, and TP53 genes. All thesemutations wereSNSs, with the exception of 2 smINDEL mutations targetingSOX9. The high prevalence of SNSs contrasts with the spectrumof mutations targeting APC, more than half of which weresmINDELs.
KRAS-activating mutations targeting Gly12 or Gly13 wereidentified in an adenoma with moderate dysplasia (ML4), 2adenomas with severe dysplasia (SE3 and SE4), and 1 adeno-carcinoma (CA3). Another adenocarcinoma (CA2) had anNRAS-activating mutation targeting Gly12. Finally, 1 adenomawith mild dysplasia (MI4) also had a KRAS mutation, but thisresulted in anAla146Thr substitution, which has been reportedin human cancers but at a greatly reduced frequency comparedwith the substitutions targeting Gly12 or Gly13 (37).
A mutation in GNAS, the gene that encodes the G proteina-subunit, was identified in 1 adenoma with severe dysplasia(SE3; Fig. 2A). The resulting Arg201His substitution is frequentin intraductal papillary mucinous neoplasms (IPMN), a pre-cancerous lesion of the pancreas, and has also been describedin colorectal adenocarcinomas (26, 27, 37). Another highlydysplastic adenoma (SE4) had a mutation in the AKT1 generesulting in a Gly17Lys substitution; this is the most frequentAKT1 substitution described in human cancer (37).
A mutation in ARID1A was identified in an adenoma withmoderate dysplasia (MS2); ARID1A regulates chromatin struc-ture and is very frequently inactivated in colorectal carcinomasand other human cancers (38). SOX9, which, like ARID1A, alsoregulates chromatin structure and transcription (39), wasmutated in 2 adenomas (MI3 and SE1) and 1 adenocarcinoma(CA1). Finally, 1 adenoma with moderate dysplasia (ML2), 1with severe dysplasia (SE2), and 1 adenocarcinoma (CA2) hadinactivating mutations in TP53, the gene that encodes the p53tumor suppressor (Fig. 2A).
In addition to SNSs, the exome sequencing also identifiedCNAs and regions of LOH. This analysis revealed thatmutated oncogenes, such as KRAS, often mapped to genomicregions that had LOH, but no CNA, making the mutant allelehomozygous; whereas, the TP53 gene often mapped toregions that exhibited LOH, which was occasionally accom-panied by a focal genomic deletion (Fig. 2A and Supplemen-tary Fig. S3). In 1 adenoma with severe dysplasia (SE3), weidentified a focal amplification of the MYC gene (Fig. 2A andSupplementary Fig. S4), whereas 2 adenomas and 2 of 3adenocarcinomas had LOH targeting the q arm of chromo-some 18, in which the SMAD4 gene maps (Fig. 2A andSupplementary Fig. S3).
Figure 1. Pathways for colon cancer development and mutational profile for APC, CTNNB1, and BRAF genes. A, hyperplasia–dysplasia–cancer sequencefor adenomas with tubulovillous and serrated histologies. The number of polyps, the exomes of which were sequenced, is indicated in red. B, mutuallyexclusive mutations in the APC, CTNNB1, and BRAF genes in the examined polyps. For each polyp, all the SNSs are shown as green dots, indicating thefrequency of the respective mutant alleles, except for the SNSs targeting the APC, CTNNB1, BRAF, FBXW11, and FAM123B genes, for which thespecific symbols shown on the right are used. The frequencies of the APC mutant alleles bearing smINDELs were estimated from Sanger sequencingchromatograms produced in the validation phase. Each vertical line of dots corresponds to a single polyp. TVA, tubulovillous adenoma; MI, TVAwith mild dysplasia; MS, TVA with moderate dysplasia and small size (�1-cm diameter); ML, TVA with moderate dysplasia and large size (>1-cm diameter);SE, TVA with severe dysplasia; CA, adenocarcinoma; MC, TVAwith moderate dysplasia andCTNNB1mutation; SA, serrated adenoma. LOH (green, no loss;red, LOH without CNA; yellow, LOH accompanied by deletion of 1 allele).
Nikolaev et al.
Cancer Res; 72(23) December 1, 2012 Cancer Research6282
on August 29, 2018. © 2012 American Association for Cancer Research. cancerres.aacrjournals.org Downloaded from
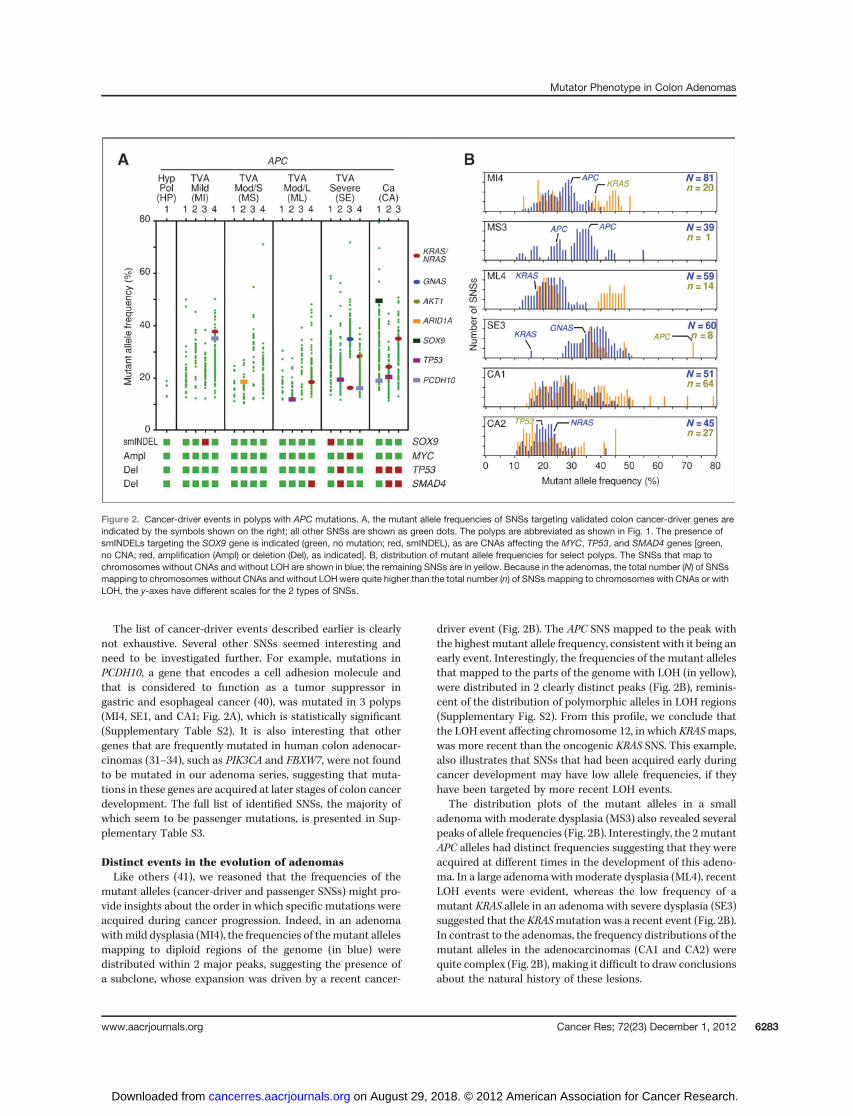
The list of cancer-driver events described earlier is clearlynot exhaustive. Several other SNSs seemed interesting andneed to be investigated further. For example, mutations inPCDH10, a gene that encodes a cell adhesion molecule andthat is considered to function as a tumor suppressor ingastric and esophageal cancer (40), was mutated in 3 polyps(MI4, SE1, and CA1; Fig. 2A), which is statistically significant(Supplementary Table S2). It is also interesting that othergenes that are frequently mutated in human colon adenocar-cinomas (31–34), such as PIK3CA and FBXW7, were not foundto be mutated in our adenoma series, suggesting that muta-tions in these genes are acquired at later stages of colon cancerdevelopment. The full list of identified SNSs, the majority ofwhich seem to be passenger mutations, is presented in Sup-plementary Table S3.
Distinct events in the evolution of adenomasLike others (41), we reasoned that the frequencies of the
mutant alleles (cancer-driver and passenger SNSs) might pro-vide insights about the order in which specific mutations wereacquired during cancer progression. Indeed, in an adenomawithmild dysplasia (MI4), the frequencies of themutant allelesmapping to diploid regions of the genome (in blue) weredistributed within 2 major peaks, suggesting the presence ofa subclone, whose expansion was driven by a recent cancer-
driver event (Fig. 2B). The APC SNS mapped to the peak withthe highest mutant allele frequency, consistent with it being anearly event. Interestingly, the frequencies of the mutant allelesthat mapped to the parts of the genome with LOH (in yellow),were distributed in 2 clearly distinct peaks (Fig. 2B), reminis-cent of the distribution of polymorphic alleles in LOH regions(Supplementary Fig. S2). From this profile, we conclude thatthe LOH event affecting chromosome 12, in which KRASmaps,was more recent than the oncogenic KRAS SNS. This example,also illustrates that SNSs that had been acquired early duringcancer development may have low allele frequencies, if theyhave been targeted by more recent LOH events.
The distribution plots of the mutant alleles in a smalladenoma with moderate dysplasia (MS3) also revealed severalpeaks of allele frequencies (Fig. 2B). Interestingly, the 2mutantAPC alleles had distinct frequencies suggesting that they wereacquired at different times in the development of this adeno-ma. In a large adenoma with moderate dysplasia (ML4), recentLOH events were evident, whereas the low frequency of amutant KRAS allele in an adenoma with severe dysplasia (SE3)suggested that the KRASmutation was a recent event (Fig. 2B).In contrast to the adenomas, the frequency distributions of themutant alleles in the adenocarcinomas (CA1 and CA2) werequite complex (Fig. 2B), making it difficult to draw conclusionsabout the natural history of these lesions.
Figure 2. Cancer-driver events in polyps with APC mutations. A, the mutant allele frequencies of SNSs targeting validated colon cancer-driver genes areindicated by the symbols shown on the right; all other SNSs are shown as green dots. The polyps are abbreviated as shown in Fig. 1. The presence ofsmINDELs targeting the SOX9 gene is indicated (green, no mutation; red, smINDEL), as are CNAs affecting the MYC, TP53, and SMAD4 genes [green,no CNA; red, amplification (Ampl) or deletion (Del), as indicated]. B, distribution of mutant allele frequencies for select polyps. The SNSs that map tochromosomes without CNAs and without LOH are shown in blue; the remaining SNSs are in yellow. Because in the adenomas, the total number (N) of SNSsmapping to chromosomes without CNAs and without LOH were quite higher than the total number (n) of SNSs mapping to chromosomes with CNAs or withLOH, the y-axes have different scales for the 2 types of SNSs.
Mutator Phenotype in Colon Adenomas
www.aacrjournals.org Cancer Res; 72(23) December 1, 2012 6283
on August 29, 2018. © 2012 American Association for Cancer Research. cancerres.aacrjournals.org Downloaded from
Mutation rates in human adenomasThe information obtained from exome sequencing of pre-
cancerous lesions may have use beyond identifying cancer-driver events. An important question, that is currently debated,is whether precancerous lesions have a mutator phenotype(19–25). Opponents of the mutator phenotype hypothesisargue that normal DNA replication error rates can accountfor 60,000 SNSs per cell in fast replicating tissues, such as thecolon, by middle age (24). This translates to 350 SNSs perexome, assuming that mutation rates are 2-fold lower in highlyexpressed genes, as compared with the rest of the genome (42).The proponents of the mutator phenotype argue, instead, forlower basal DNA replication error rates and for acquisition ofpoint mutations primarily after transformation of the normaltissue to a precancerous lesion (21, 25).
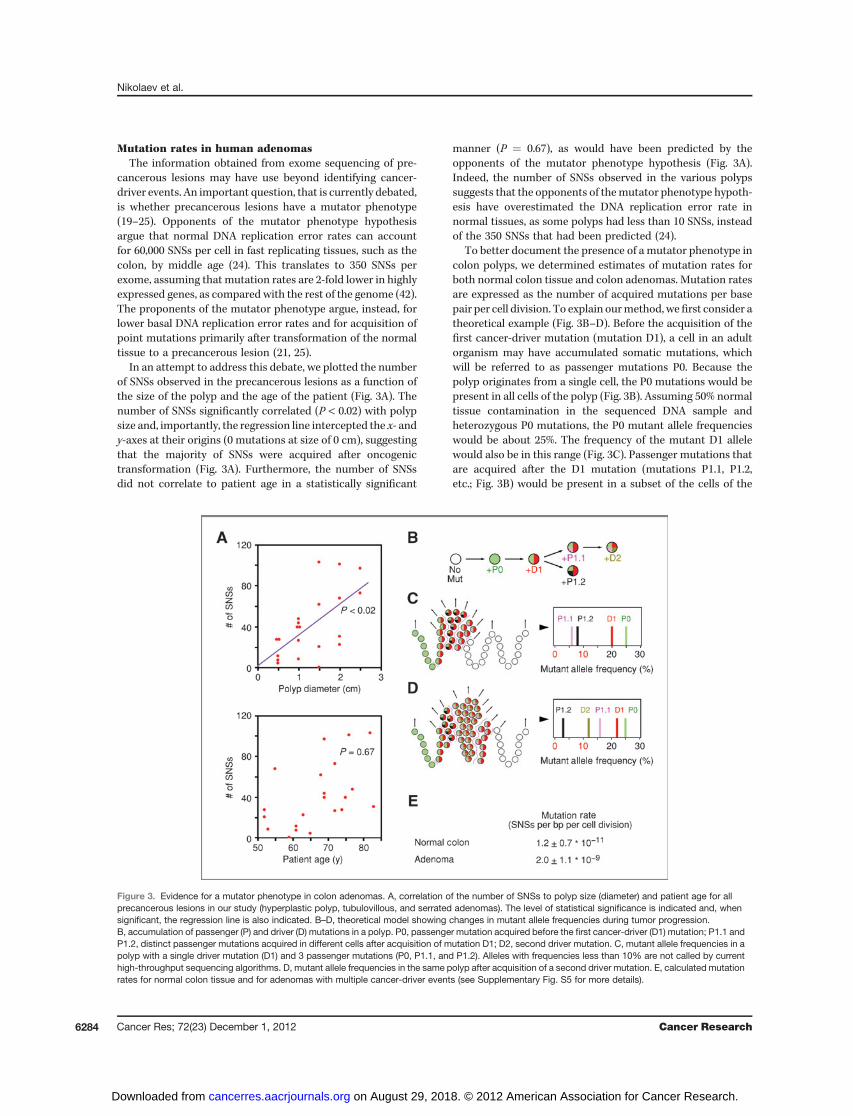
In an attempt to address this debate, we plotted the numberof SNSs observed in the precancerous lesions as a function ofthe size of the polyp and the age of the patient (Fig. 3A). Thenumber of SNSs significantly correlated (P < 0.02) with polypsize and, importantly, the regression line intercepted the x- andy-axes at their origins (0 mutations at size of 0 cm), suggestingthat the majority of SNSs were acquired after oncogenictransformation (Fig. 3A). Furthermore, the number of SNSsdid not correlate to patient age in a statistically significant
manner (P ¼ 0.67), as would have been predicted by theopponents of the mutator phenotype hypothesis (Fig. 3A).Indeed, the number of SNSs observed in the various polypssuggests that the opponents of themutator phenotype hypoth-esis have overestimated the DNA replication error rate innormal tissues, as some polyps had less than 10 SNSs, insteadof the 350 SNSs that had been predicted (24).
To better document the presence of a mutator phenotype incolon polyps, we determined estimates of mutation rates forboth normal colon tissue and colon adenomas. Mutation ratesare expressed as the number of acquired mutations per basepair per cell division. To explain ourmethod, wefirst consider atheoretical example (Fig. 3B–D). Before the acquisition of thefirst cancer-driver mutation (mutation D1), a cell in an adultorganism may have accumulated somatic mutations, whichwill be referred to as passenger mutations P0. Because thepolyp originates from a single cell, the P0 mutations would bepresent in all cells of the polyp (Fig. 3B). Assuming 50% normaltissue contamination in the sequenced DNA sample andheterozygous P0 mutations, the P0 mutant allele frequencieswould be about 25%. The frequency of the mutant D1 allelewould also be in this range (Fig. 3C). Passenger mutations thatare acquired after the D1 mutation (mutations P1.1, P1.2,etc.; Fig. 3B) would be present in a subset of the cells of the
Figure 3. Evidence for a mutator phenotype in colon adenomas. A, correlation of the number of SNSs to polyp size (diameter) and patient age for allprecancerous lesions in our study (hyperplastic polyp, tubulovillous, and serrated adenomas). The level of statistical significance is indicated and, whensignificant, the regression line is also indicated. B–D, theoretical model showing changes in mutant allele frequencies during tumor progression.B, accumulation of passenger (P) and driver (D) mutations in a polyp. P0, passenger mutation acquired before the first cancer-driver (D1) mutation; P1.1 andP1.2, distinct passenger mutations acquired in different cells after acquisition of mutation D1; D2, second driver mutation. C, mutant allele frequencies in apolyp with a single driver mutation (D1) and 3 passenger mutations (P0, P1.1, and P1.2). Alleles with frequencies less than 10% are not called by currenthigh-throughput sequencing algorithms. D, mutant allele frequencies in the same polyp after acquisition of a second driver mutation. E, calculated mutationrates for normal colon tissue and for adenomas with multiple cancer-driver events (see Supplementary Fig. S5 for more details).
Nikolaev et al.
Cancer Res; 72(23) December 1, 2012 Cancer Research6284
on August 29, 2018. © 2012 American Association for Cancer Research. cancerres.aacrjournals.org Downloaded from
polyp and would not be identified by high-throughputsequencing, as their mutant allele frequencies would typicallybe less than 10% threshold value of the mutation-callingalgorithm (Fig. 3C). Therefore, the number of SNSs observedin polyps with a single cancer-driver event can be used tocalculate normal tissue mutation rates. These polyps, whichare the hyperplastic polyp (HP1) and the 3 serrated adenomas,had on average 5 � 3 (mean � 1 SD) P0 mutations per polyp(Fig. 1B and Supplementary Fig. S5).In the same theoretical example, a second cancer-driver
mutation (mutation D2; Fig. 3B), which confers a growthadvantage to a specific cell and its progeny, will allow detectionof a specific subset of P1 mutations, as their allele frequenciesexceed the 10% threshold (Fig. 3D). Therefore, in polyps withmore than 1 cancer-driver events, high-throughput sequencingcan identify passenger mutations acquired after oncogenictransformation, allowing mutation rates for the precancerouslesions to be calculated. In our sample, the tubulovillousadenomas, all of which had more than 1 cancer-driver event,had 50 � 28 (mean � 1 SD) SNSs per polyp (Fig. 1B andSupplementary Fig. S5).In addition to the number of SNSs, we also need an estimate
of the number of cell divisions over which the specific muta-tions were acquired. The crypt stem cells of the colon divideevery 3 to 4 days (43), which means that a normal colon stemcell of a 60-year-old individual would have undergone about6,000 cell divisions since birth, which is exactly the sameestimate as used by others (44). With 5 � 3 (mean � 1 SD)P0 mutations per polyp, the normal colon stem cell mutationrate can be calculated as 1.2 � 0.7 � 10�11 SNSs per base pairper cell division (Fig. 3E and Supplementary Fig. S5), a numbersimilar to the mutation rate observed in the testis (45, 46),which in adult males is also a continuously dividing tissue.For the tubulovillous adenomas, we estimate, based on
clinical experience (31), that they develop on an average overa 5-year period. Tritiated thymidine labeling studies furthersuggest that their proliferation rate is about 1.5-fold lower thanthat of normal colon stem cells (47). The lower proliferationrate can be attributed to DNA replication stress-inducedsenescence (13, 14). On the basis of these estimates and thepresence of 50 � 28 (mean � 1 SD) SNSs per tubulovillousadenoma, we calculated a mutation rate of 2.0 � 1.1 � 10�9
SNSs per base pair per cell division, which is almost 200 timeshigher than the mutation rate calculated for normal coloncrypt cells (Fig. 3E and Supplementary Fig. S5). One can see thatreasonable changes in the estimates cited earlier cannot bridgethe 2 order of magnitude difference in mutation rates betweennormal and precancerous tissues. Thus, we conclude thatprecancerous colon lesions exhibit a mutator phenotype.
Distribution of SNSs in the genomeIn an effort to gain insights about themolecularmechanisms
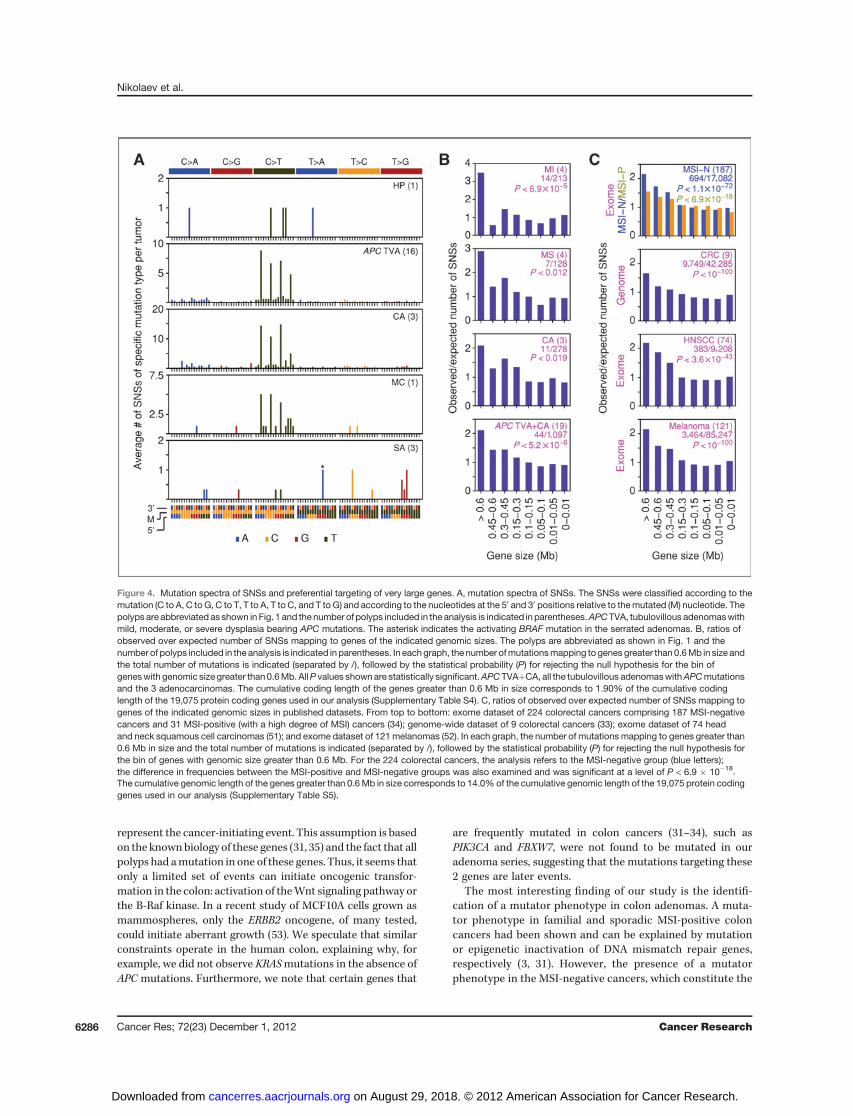
that might underlie the increased mutation rate in colonadenomas, we examined the type of acquired SNSs and theirdistribution in the genome. Most of the SNSs in the adenomasand the adenocarcinomas were C to T transitions and themajority of these occurred in the context of CpG sequences,suggesting that they arose by deamination of 5-methylcyto-
sines (Fig. 4A). This spectrum of SNSs is similar to thatpreviously reported for colon carcinomas (32–34). Remarkably,the mutations in the hyperplastic polyp and the serratedadenomas did not target CpG sequences (Fig. 4A), consistentwith our model that the SNSs detected in these polyps were P0mutations.
About the distribution of the SNSs in the genome, it is wellestablished that in cancer cells, certain loci are more prone togenomic instability than others. For example, 7 of the 10 mostcommon focal deletions in human cancers map to very largegenes (7, 8). These deletions have been attributed to oncogene-induced DNA replication stress (6), on the basis of experimentsshowing that genes greater than 0.6 Mb in size are particularlyprone to genomic deletions, when cells are treated withchemicals that induce DNA replication stress (10–12) or whenoncogenes are overexpressed (13–15). Indeed, most of the so-called CFSs, which are genomic loci sensitive to DNA replica-tion stress, map within very large genes (48–50).
To examine whether the SNSs were also preferentially distri-buted within very large genes, we grouped the mutations ac-cording to the size of the gene that they targeted and thencalculated observed and expected mutation frequencies (Fig.4B). In the 4 adenomas with mild dysplasia, the genes withgenomic size greater than 0.6 Mbp were targeted by SNSs 3.5times more frequently than expected (P < 6.9 � 10�5). Thisanalysis took into account CDS length (Supplementary TableS4). Adenomaswith amoderate degree of dysplasia showed a 3-fold increase in the frequency of SNSs within very large genes,which dropped to 2-fold for the adenocarcinomas (Fig. 4B).When the SNSs from all adenomas and adenocarcinomas withAPC mutations were included (19 polyps; 1,097 SNSs), thestatistical significance reached a level ofP< 5.2� 10�6 (Fig. 4B).
To determine whether the higher prevalence rates of SNSsin very large genes could be reproduced in other datasets, weexamined the mutations recently reported in 224 humancolorectal cancer exomes (34). This dataset does not includeadenomas but could still be used to validate the 2-fold effectthat we observed in the adenocarcinomas (Fig. 4B). The 224colorectal cancers were divided by the authors of the studyinto 2 groups: an MSI-positive and an MSI-negative group. Inthe MSI-negative group, the number of mutations in the verylarge genes was 2-fold higher than expected, whereas in theMSI-positive group, the effect of gene size on mutationfrequency was much smaller (Fig. 4C). The difference inbehavior of the MSI-negative and MSI-positive cancers wasstatistically significant at a level of P < 6.9 � 10�18. Wesubsequently examined datasets of genome-wide mutationsin colorectal cancers (33) and datasets of exomic mutationspresent in head and neck cancers (51) and in melanomas(52). In all these datasets, a higher prevalence of SNSs wasobserved within the very large genes (Fig. 4C). As with theanalysis of the exomic data, the analysis of the genome-widedata took gene size into account (Supplementary Table S5).
DiscussionThe exome sequencing of colon precancerous lesions helps
improve our understanding of cancer development. First, wepropose that mutations in the APC, CTNNB1, or BRAF genes
Mutator Phenotype in Colon Adenomas
www.aacrjournals.org Cancer Res; 72(23) December 1, 2012 6285
on August 29, 2018. © 2012 American Association for Cancer Research. cancerres.aacrjournals.org Downloaded from
represent the cancer-initiating event. This assumption is basedon the knownbiology of these genes (31, 35) and the fact that allpolyps had amutation in one of these genes. Thus, it seems thatonly a limited set of events can initiate oncogenic transfor-mation in the colon: activation of theWnt signaling pathway orthe B-Raf kinase. In a recent study of MCF10A cells grown asmammospheres, only the ERBB2 oncogene, of many tested,could initiate aberrant growth (53). We speculate that similarconstraints operate in the human colon, explaining why, forexample, we did not observe KRASmutations in the absence ofAPC mutations. Furthermore, we note that certain genes that
are frequently mutated in colon cancers (31–34), such asPIK3CA and FBXW7, were not found to be mutated in ouradenoma series, suggesting that the mutations targeting these2 genes are later events.
The most interesting finding of our study is the identifi-cation of a mutator phenotype in colon adenomas. A muta-tor phenotype in familial and sporadic MSI-positive coloncancers had been shown and can be explained by mutationor epigenetic inactivation of DNA mismatch repair genes,respectively (3, 31). However, the presence of a mutatorphenotype in the MSI-negative cancers, which constitute the
Figure 4. Mutation spectra of SNSs and preferential targeting of very large genes. A, mutation spectra of SNSs. The SNSs were classified according to themutation (C to A, C to G, C to T, T to A, T to C, and T to G) and according to the nucleotides at the 50 and 30 positions relative to themutated (M) nucleotide. Thepolyps are abbreviated as shown inFig. 1 and thenumber of polyps included in the analysis is indicated in parentheses.APCTVA, tubulovillous adenomaswithmild, moderate, or severe dysplasia bearing APC mutations. The asterisk indicates the activating BRAF mutation in the serrated adenomas. B, ratios ofobserved over expected number of SNSs mapping to genes of the indicated genomic sizes. The polyps are abbreviated as shown in Fig. 1 and thenumber of polyps included in the analysis is indicated in parentheses. In eachgraph, the number ofmutationsmapping togenes greater than0.6Mb in size andthe total number of mutations is indicated (separated by /), followed by the statistical probability (P) for rejecting the null hypothesis for the bin ofgeneswith genomic size greater than0.6Mb. AllP values shownare statistically significant.APCTVAþCA, all the tubulovillous adenomaswithAPCmutationsand the 3 adenocarcinomas. The cumulative coding length of the genes greater than 0.6 Mb in size corresponds to 1.90% of the cumulative codinglength of the 19,075 protein coding genes used in our analysis (Supplementary Table S4). C, ratios of observed over expected number of SNSs mapping togenes of the indicated genomic sizes in published datasets. From top to bottom: exome dataset of 224 colorectal cancers comprising 187 MSI-negativecancers and 31 MSI-positive (with a high degree of MSI) cancers (34); genome-wide dataset of 9 colorectal cancers (33); exome dataset of 74 headand neck squamous cell carcinomas (51); and exome dataset of 121melanomas (52). In each graph, the number of mutations mapping to genes greater than0.6 Mb in size and the total number of mutations is indicated (separated by /), followed by the statistical probability (P) for rejecting the null hypothesis forthe bin of genes with genomic size greater than 0.6 Mb. For the 224 colorectal cancers, the analysis refers to the MSI-negative group (blue letters);the difference in frequencies between the MSI-positive and MSI-negative groups was also examined and was significant at a level of P < 6.9 � 10�18.The cumulative genomic length of the genes greater than 0.6Mb in size corresponds to 14.0% of the cumulative genomic length of the 19,075 protein codinggenes used in our analysis (Supplementary Table S5).
Nikolaev et al.
Cancer Res; 72(23) December 1, 2012 Cancer Research6286
on August 29, 2018. © 2012 American Association for Cancer Research. cancerres.aacrjournals.org Downloaded from
majority of colon cancers in humans, had not been estab-lished and, in fact, was strongly debated (19–25). Our analysissuggests a 2 order of magnitude difference in mutation ratesbetween normal colon tissue and colon adenomas. This anal-ysis relied on certain assumptions. However, reasonable devia-tions from these assumptions cannot negate the 2 order ofmagnitude difference that we have observed. Thus, whileanalysis of more polyps will certainly lead to a refinement ofthe numbers reported here, the main conclusion that humancolon precancerous lesions have an increased SNS mutationrate compared with normal colon should stand.The presence of amutator phenotype in colon precancerous
lesions is further supported by the correlation between polypsize and number of SNSs and the absence of a correlationbetween patient age and number of SNSs. In addition, the typeof mutations targeting the oncogenes and tumor suppressorgenes in the adenomas is also consistent with a mutatorphenotype. Many of the APCmutations, which are the putativecancer-initiating events in our series, were smINDELs, consis-tent with them being induced by exogenous mutagens. How-ever, the mutations targeting the other tumor suppressorgenes and the oncogenes in the same adenomas were mostlySNSs, suggesting a different mutagenic mechanism, whichwould be consistent with the establishment of a mutatorphenotype.A recent study has also tackled the question of a mutator
phenotype in a human cancer, specifically in acute myelog-
enous leukemia (AML), and reached the conclusion thatmost of the passenger mutations observed in the leukemiccells had been acquired before oncogenic transformation(54). Exome sequencing of hematopoietic stem/progenitorcells (HSPC) from normal individuals was used to determinethe number of SNSs present in nontransformed cells. Inter-estingly, the number of SNSs in the HSPCs correlatedwell with age. In individuals, who were 20- to 70-years old,between 1 and 11, SNSs were identified per HSPC, a numberessentially identical to the number of SNSs present in thepolyps of our series with 1 cancer-driver event. In the AMLcells, the number of SNSs in the coding regions averagedabout 13, which is only slightly higher than the numberobserved in the HSPCs. However, the AML cells were sub-jected to genome sequencing, which results in lower cover-age than exome sequencing, and may miss cancer-associatedSNSs. Nevertheless, it is clear that the number of SNSs inAML cells is not very different from the number of SNSs innormal HSPCs, thereby questioning the presence of a muta-tor phenotype in this tumor type. To reconcile the discrep-ancy with our findings, we note that the biology of AMLdiffers significantly from the biology of solid tumors. Thetotal number of SNSs observed in AML is typically 2 orders ofmagnitude lower than the number of SNSs present in mostsolid tumors, including colon carcinomas (33, 54). Further-more, AML typically requires as few as 2 cancer-driverevents to give rise to clinical symptoms (54). Thus, if AML
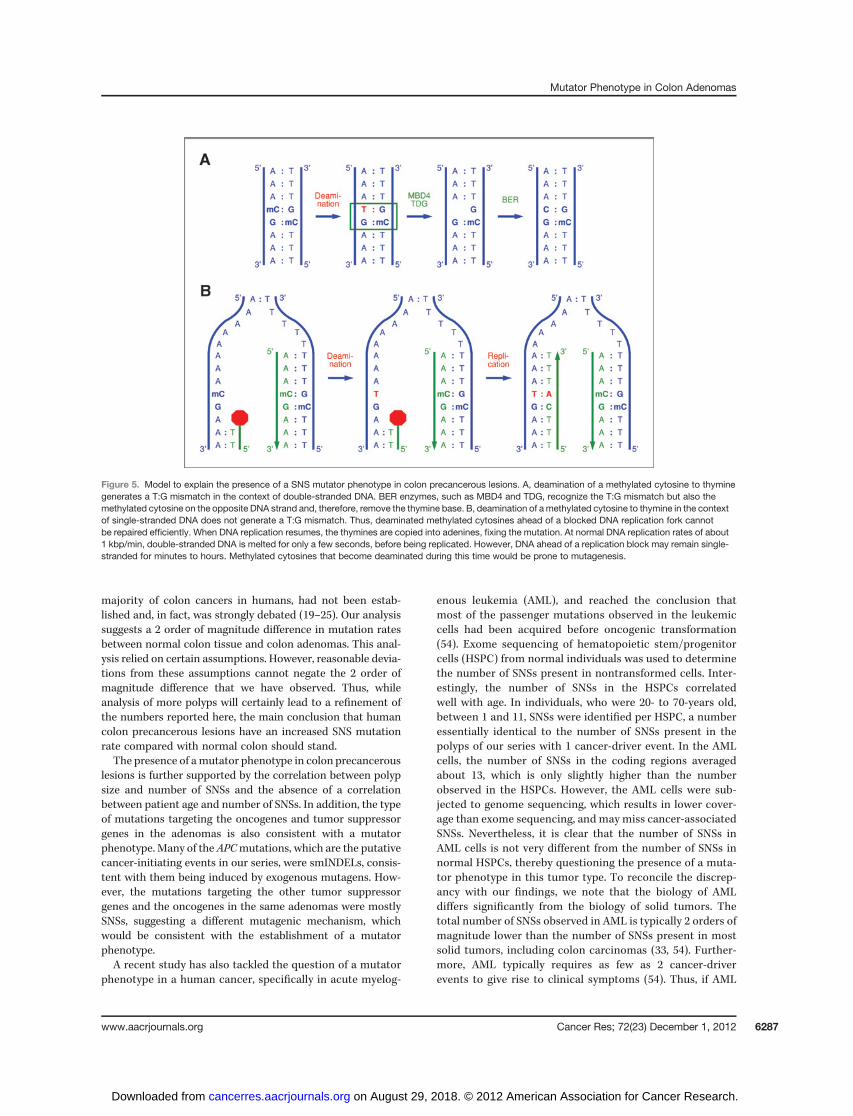
Figure 5. Model to explain the presence of a SNS mutator phenotype in colon precancerous lesions. A, deamination of a methylated cytosine to thyminegenerates a T:G mismatch in the context of double-stranded DNA. BER enzymes, such as MBD4 and TDG, recognize the T:G mismatch but also themethylated cytosine on the opposite DNA strand and, therefore, remove the thymine base. B, deamination of a methylated cytosine to thymine in the contextof single-stranded DNA does not generate a T:G mismatch. Thus, deaminated methylated cytosines ahead of a blocked DNA replication fork cannotbe repaired efficiently. When DNA replication resumes, the thymines are copied into adenines, fixing the mutation. At normal DNA replication rates of about1 kbp/min, double-stranded DNA is melted for only a few seconds, before being replicated. However, DNA ahead of a replication block may remain single-stranded for minutes to hours. Methylated cytosines that become deaminated during this time would be prone to mutagenesis.
Mutator Phenotype in Colon Adenomas
www.aacrjournals.org Cancer Res; 72(23) December 1, 2012 6287
on August 29, 2018. © 2012 American Association for Cancer Research. cancerres.aacrjournals.org Downloaded from
is characterized by a short-time window between acquisitionof the cancer-driver events and diagnosis, it will be very hardto determine whether it has a mutator phenotype. In con-trast, solid tumors remain in the precancerous state foryears, as they require many more cancer-driver events toprogress. For example, in several of the adenomas in ourstudy, all of which were asymptomatic, we identified 5cancer-driver events, counting SNSs, smINDELs, and LOH.
Some hints about the mechanisms leading to a mutatorphenotype in precancerous lesions come from the type ofSNSs and their distribution in the genome. Most SNSsobserved in the colon adenomas were C to T transitionsand most of these transitions were observed in the context ofCpG dinucleotides. As previously proposed, 5-methylcyto-sines can be spontaneously deaminated to form thymines(55). The resulting T:G base pair could then be repaired bybase excision repair (BER) enzymes, most notably by MBD4and TDG, which recognize the mismatch in the context ofdouble-stranded DNA (56). However, DNA replication stress,which is prevalent in human precancerous lesions andcancers, is associated with long stretches of single-strandedDNA (ssDNA; refs. 5, 13–18). Thus, methylated cytosines thatare deaminated in the context of ssDNA would not berepaired by BER resulting in C to T transitions (Fig. 5). Theincreased frequency of SNSs at very large genes is consistentwith such a mechanism, as DNA replication stress targetspreferentially the very large genes (48–50).
Disclosure of Potential Conflicts of InterestNo potential conflicts of interest were disclosed.
Authors' ContributionsConception and design: S.I. Nikolaev, S.E. Antonarakis, T.D. HalazonetisDevelopment of methodology: S.I. Nikolaev, F. Santoni, H. Edgren, M. Guip-poni, J. Saarela, S.E. Antonarakis, T.D. HalazonetisAcquisition of data (provided animals, acquired and managed patients,provided facilities, etc.): S.K. Sotiriou, I.S. Pateras, S. Sougioultzis,M.Guipponi,V.G. Gorgoulis, T.D. HalazonetisAnalysis and interpretation of data (e.g., statistical analysis, biostatistics,computational analysis): S.I. Nikolaev, S.K. Sotiriou, F. Santoni, H. Edgren, H.Almusa, D. Robyr, J. Saarela, V.G. Gorgoulis, S.E. Antonarakis, T.D. HalazonetisWriting, review, and/or revision of the manuscript: J. Saarela, S.E. Anto-narakis, T.D. HalazonetisAdministrative, technical, or material support (i.e., reporting or orga-nizing data, constructing databases): I.S. Pateras, F. Santoni, S. Sougioultzis,S.E. AntonarakisStudy supervision: S.E. Antonarakis, T.D. Halazonetis
AcknowledgmentsThe authors thank Nicolas Roggli for help with figure preparation, Laurence
Tropia and Anne Vannier for technical assistance, and Klas Wiman and ThomasHelleday for helpful discussions.
Grant SupportThis work was supported by grants from the Swiss National Foundation
and the European Commission (ERC) to S.E. Antonarakis and to T.D. Halazonetisand from the European Commission (FP7 Research Projects) to V.G. Gorgoulis.
The costs of publication of this article were defrayed in part by the payment ofpage charges. This article must therefore be hereby marked advertisement inaccordance with 18 U.S.C. Section 1734 solely to indicate this fact.
Received October 7, 2012; accepted October 16, 2012; published onlineNovember 30, 2012.
References1. Hanahan D, Weinberg RA. Hallmarks of cancer: the next generation.
Cell 2011;144:646–74.2. Luo J, Solimini NL, Elledge SJ. Principles of cancer therapy: oncogene
and non-oncogene addiction. Cell 2009;136:823–37.3. Grady WM, Carethers JM. Genomic and epigenetic instability
in colorectal cancer pathogenesis. Gastroenterology 2008;135:1079–99.
4. Negrini S, Gorgoulis VG, Halazonetis TD. Genomic instability—anevolving hallmark of cancer. Nat Rev Mol Cell Biol 2010;11:220–8.
5. Halazonetis TD, Gorgoulis VG, Bartek J. An oncogene-inducedDNA damage model for cancer development. Science 2008;319:1352–5.
6. Dereli-Oz A, Versini G, Halazonetis TD. Studies of genomic copynumber changes in human cancers reveal signatures of DNA replica-tion stress. Mol Oncol 2011;5:308–14.
7. Beroukhim R, Mermel CH, Porter D, Wei G, Raychaudhuri S, DonovanJ, et al. The landscape of somatic copy-number alteration acrosshuman cancers. Nature 2010;463:899–905.
8. Bignell GR,GreenmanCD,DaviesH,Butler AP, EdkinsS, Andrews JM,et al. Signatures of mutation and selection in the cancer genome.Nature 2010;463:893–8.
9. Arlt MF, Casper AM, Glover TW. Common fragile sites. CytogenetGenome Res 2003;100:92–100.
10. Arlt MF, Mulle JG, Schaibley VM, Ragland RL, Durkin SG, Warren ST,et al. Replication stress induces genome-wide copy number changesin humancells that resemblepolymorphic andpathogenic variants. AmJ Hum Genet 2009;84:339–50.
11. Pasi CE, Dereli-Oz A, Negrini S, Friedli M, Fragola G, Lombardo A, et al.Genomic instability in induced stem cells. Cell Death Differ2011;18:745–53.
12. Arlt MF, Ozdemir AC, Birkeland SR, Wilson TE, Glover TW. Hydroxy-urea induces de novo copy number variants in human cells. Proc NatlAcad Sci U S A 2011;108:17360–5.
13. Bartkova J, Rezaei N, Liontos M, Karakaidos P, Kletsas D, Issaeva N,et al. Oncogene-induced senescence is part of the tumorigenesisbarrier imposed by DNA damage checkpoints. Nature 2006;444:633–7.
14. Di Micco R, Fumagalli M, Cicalese A, Piccinin S, Gasparini P, LuiseC, et al. Oncogene-induced senescence is a DNA damageresponse triggered by DNA hyper-replication. Nature 2006;444:638–42.
15. Tsantoulis PK, Kotsinas A, Sfikakis PP, Evangelou K, Sideridou M,Levy B, et al. Oncogene-induced replication stress preferentiallytargets common fragile sites in preneoplastic lesions. A genome-widestudy. Oncogene 2008;27:3256–64.
16. Gorgoulis VG, Vassiliou LV, Karakaidos P, Zacharatos P, Kotsinas A,Liloglou T, et al. Activation of the DNA damage checkpoint andgenomic instability in human precancerous lesions. Nature 2005;434:907–13.
17. Bartkova J, Horejsi Z, Koed K, Kramer A, Tort F, Zieger K, et al. DNAdamage response as a candidate anti-cancer barrier in early humantumorigenesis. Nature 2005;434:864–70.
18. Schepeler T, Lamy P, Laurberg JR, Fristrup N, Reinert T, Bartkova J,et al. A high resolution genomic portrait of bladder cancer: correlationbetween genomic aberrations and the DNA damage response. Onco-gene. Epub 2012 Aug 27.
19. Loeb LA, SpringgateCF, Battula N. Errors in DNA replication as a basisof malignant changes. Cancer Res 1974;34:2311–21.
20. Loeb LA, Bielas JH, Beckman RA. Cancers exhibit a mutator pheno-type: clinical implications. Cancer Res 2008;68:3551–7.
21. Loeb LA. Human cancers express mutator phenotypes: origin, con-sequences and targeting. Nat Rev Cancer 2011;11:450–7.
22. Sieber OM, Heinimann K, Tomlinson IP. Genomic instability—theengine of tumorigenesis? Nat Rev Cancer 2003;3:701–8.
23. Bodmer W. Genetic instability is not a requirement for tumor devel-opment. Cancer Res 2008;68:3558–60.
Nikolaev et al.
Cancer Res; 72(23) December 1, 2012 Cancer Research6288
on August 29, 2018. © 2012 American Association for Cancer Research. cancerres.aacrjournals.org Downloaded from
24. Shibata D, LieberMR. Is there any genetic instability in human cancer?DNA Repair 2010;9:858.
25. Fox EJ, Beckman RA, Loeb LA. Reply: is there any genetic instability inhuman cancer? DNA Repair 2010;9:859–60.
26. Wu J, Jiao Y, Dal Molin M, Maitra A, de Wilde RF, Wood LD, et al.Whole-exome sequencing of neoplastic cysts of the pancreas revealsrecurrent mutations in components of ubiquitin-dependent pathways.Proc Natl Acad Sci U S A 2011;108:21188–93.
27. Furukawa T, Kuboki Y, Tanji E, Yoshida S, Hatori T, YamamotoM, et al.Whole-exome sequencing uncovers frequent GNAS mutations inintraductal papillary mucinous neoplasms of the pancreas. Sci Rep2011;1:161.
28. Nikolaev SI, Rimoldi D, Iseli C, Valsesia A, Robyr D, Gehrig C, et al.Exome sequencing identifies recurrent somaticMAP2K1 andMAP2K2mutations in melanoma. Nat Gen 2012;44:133–9.
29. DeesND, ZhangQ, Kandoth C,Wendl MC, SchierdingW, Koboldt DC,et al. MuSiC: identifying mutational significance in cancer genomes.Genome Res 2012;22:1589–98.
30. Sulonen AM, Ellonen P, Almusa H, Lepisto M, Eldfors S, Hannula S,et al. Comparison of solution-based exome capture methods for nextgeneration sequencing. Genome Biol 2011;12:r94.
31. Fearon ER. Molecular genetics of colorectal cancer. Annu Rev PatholMech Dis 2011;6:479–507.
32. SjoblomT, Jones S,Wood LD, Parsons DW, Lin J, Barber TD, et al. Theconsensuscoding sequencesof humanbreast and colorectal cancers.Science 2006;314:268–74.
33. BassAJ, LawrenceMS,BraceLE,RamosAH,Drier Y,CibulskisK, et al.Genomic sequencing of colorectal adenocarcinomas identifies arecurrent VTI1A-TCF7L2 fusion. Nat Genet 2011;43:964–8.
34. The Cancer Genome Atlas Network. Comprehensive molecular char-acterization of human colon and rectal cancer. Nature 2012;487:330–7.
35. Clevers H, Nusse R. Wnt/beta-catenin signaling and disease. Cell2012;149:1192–205.
36. Chan TL, ZhaoW, Leung SY, Yuen ST, Cancer GenomeProject. BRAFand KRAS mutations in colorectal hyperplastic polyps and serratedadenomas. Cancer Res 2003;63:4878–81.
37. Forbes SA, Bindal N, Bamford S, Cole C, Kok CY, Beare D, et al.COSMIC: mining complete cancer genomes in the catalogue ofsomatic mutations in cancer. Nucleic Acids Res 2011;39:d945–50.
38. Jones S, Li M, Parsons DW, Zhang X, Wesseling J, Kristel P, et al.Somatic mutations in the chromatin remodeling gene ARID1A occur inseveral tumor types. Hum Mutat 2012;33:100–3.
39. Blache P, van de Wetering M, Duluc I, Domon C, Berta P, Freund JN,et al. SOX9 is an intestine crypt transcription factor, is regulated by theWnt pathway, and represses the CDX2 and MUC2 genes. J Cell Biol2004;166:37–47.
40. YuJ,ChengYY, TaoQ,CheungKF, LamCN,GengH, et al.Methylationof protocadherin 10, a novel tumor suppressor, is associatedwith poor
prognosis in patients with gastric cancer. Gastroenterology 2009;136:640–51.
41. Greaves M, Maley CC. Clonal evolution in cancer. Nature 2012;481:306–13.
42. Lee W, Jiang Z, Liu J, Haverty PM, Guan Y, Stinson J, et al. Themutation spectrum revealed by paired genome sequences from a lungcancer patient. Nature 2010;465:473–7.
43. Lipkin M, Bell B, Sherlock P. Cell proliferation kinetics in the gastro-intestinal tract of man. I. Cell renewal in colon and rectum. J Clin Invest1963;42:767–76.
44. Wang TL, Rago C, Silliman N, Ptak J, Markowitz S, Willson JK, et al.Prevalence of somatic alterations in the colorectal cancer cell genome.Proc Natl Acad Sci U S A 2002;99:3076–80.
45. Xue Y, Wang Q, Long Q, Ng BL, Swerdlow H, Burton J, et al. Human Ychromosome base-substitution mutation rate measured by directsequencing in a deep-rooting pedigree. Curr Biol 2009;19:1453–7.
46. Roach JC, Glusman G, Smit AF, Huff CD, Hubley R, Shannon PT, et al.Analysis of genetic inheritance in a family quartet by whole-genomesequencing. Science 2010;328:636–9.
47. LipkinM.Proliferation anddifferentiation of normal andneoplastic cellsin the colon of man. Cancer 1971;28:38–40.
48. Smith DI, Zhu Y, McAvoy S, Kuhn R. Common fragile sites, extremelylarge genes, neural development and cancer. Cancer Lett 2006;232:48–57.
49. Helmrich A, Stout-Weider K, Hermann K, Schrock E, Heiden T. Com-mon fragile sites are conserved features of human and mouse chro-mosomes and relate to large active genes. Genome Res 2006;16:1222–30.
50. McAvoy S, Ganapathiraju SC, Ducharme-Smith AL, Pritchett JR,Kosari F, Perez DS, et al. Non-random inactivation of large commonfragile site genes in different cancers. Cytogenet Genome Res 2007;118:260–9.
51. Stransky N, Egloff AM, Tward AD, Kostic AD, Cibulskis K, SivachenkoA, et al. The mutational landscape of head and neck squamous cellcarcinoma. Science 2011;333:1157–60.
52. Hodis E, Watson IR, Kryukov GV, Arold ST, Imielinski M, Theurillat JP,et al. A landscape of driver mutations in melanoma. Cell 2012;150:251–63.
53. Leung CT, Brugge JS. Outgrowth of single oncogene-expressingcells from suppressive epithelial environments. Nature 2012;482:410–3.
54. Welch JS, Ley TJ, LinkDC,Miller CA, LarsonDE, Koboldt DC, et al. Theorigin and evolution of mutations in acute myeloid leukemia. Cell2012;150:264–78.
55. Cooper DN, Youssoufian H. The CpG dinucleotide and human geneticdisease. Hum Genet 1988;78:151–5.
56. Hendrich B, Hardeland U, Ng HH, Jiricny J, Bird A. The thymineglycosylase MBD4 can bind to the product of deamination at meth-ylated CpG sites. Nature 1999;401:301–4.
Mutator Phenotype in Colon Adenomas
www.aacrjournals.org Cancer Res; 72(23) December 1, 2012 6289
on August 29, 2018. © 2012 American Association for Cancer Research. cancerres.aacrjournals.org Downloaded from
Correction
Correction: A Single-Nucleotide SubstitutionMutator Phenotype Revealed by ExomeSequencing of Human Colon Adenomas
In this article (Cancer Res 2012;72:6279–89), whichwas published in theDecember 1,2012, issue ofCancer Research (1), some nucleotide dataweremislabeled in thewild-type and mutant nucleotide columns of Supplementary Table S3. Specifically, foradenomas MI2 and MI3, column J [ref(wild-type)] lists the mutant nucleotides andcolumn K [variant] lists the wild-type nucleotides at this position in the genome.
The mislabeling of the nucleotide data for adenomas MI2 and MI3 affected only theversion of Supplementary Table S3 prepared for publication. In the mutationdatabase used for the data analysis, the nucleotide data were correctly labeled.Thus, all the other data pertaining to adenomas MI2 and MI3 in SupplementaryTable S3, such as the amino acid substitutions, etc., are correct, as are all the otherdata shown in the article. None of the conclusions of the study are affected. Theauthors regret this error.
A corrected version of Supplementary Table S3 is now available on the onlinejournal.
Reference1. NikolaevSI, SotiriouSK,Pateras IS, Santoni F,SougioultzisS, EdgrenH, et al. A single-nucleotide
substitution mutator phenotype revealed by exome sequencing of human colon adenomas.Cancer Res 2012;72:6279–89.
Published online January 9, 2014.doi: 10.1158/0008-5472.CAN-13-3469�2014 American Association for Cancer Research.
CancerResearch
Cancer Res; 74(2) January 15, 2014636
2012;72:6279-6289. Cancer Res Sergey I. Nikolaev, Sotirios K. Sotiriou, Ioannis S. Pateras, et al. Exome Sequencing of Human Colon AdenomasA Single-Nucleotide Substitution Mutator Phenotype Revealed by
Updated version
http://cancerres.aacrjournals.org/content/72/23/6279
Access the most recent version of this article at:
Material
Supplementary
http://cancerres.aacrjournals.org/content/suppl/2012/10/23/0008-5472.CAN-12-3869.DC1
Access the most recent supplemental material at:
Cited articles
http://cancerres.aacrjournals.org/content/72/23/6279.full#ref-list-1
This article cites 55 articles, 14 of which you can access for free at:
Citing articles
http://cancerres.aacrjournals.org/content/72/23/6279.full#related-urls
This article has been cited by 14 HighWire-hosted articles. Access the articles at:
E-mail alerts related to this article or journal.Sign up to receive free email-alerts
Subscriptions
Reprints and
To order reprints of this article or to subscribe to the journal, contact the AACR Publications Department at
Permissions
Rightslink site. Click on "Request Permissions" which will take you to the Copyright Clearance Center's (CCC)
.http://cancerres.aacrjournals.org/content/72/23/6279To request permission to re-use all or part of this article, use this link
on August 29, 2018. © 2012 American Association for Cancer Research. cancerres.aacrjournals.org Downloaded from