Embed Size (px)
Citation preview
International Journal of New Technology and Research (IJNTR)
ISSN:2454-4116, Volume-2, Issue-7, July 2016 Pages 07-15
7 www.ijntr.org
Abstract—The crucial parameter required for predicting
epitaxial thin film growth rates and uniformity is the chemical
mechanism occurring in the gas phase and at the surface. To
date, few studies have investigated the gallium nitride epitaxial
mechanism in solid state lighting. A simplified chemistry
derived from experimental observation has been used for this
purpose. In this study, three numerical mechanism models are
presented for verifying the growth rate of the gallium nitride
(GaN) mechanism, and their results are compared with the
growth rate results of previous literature studies. To reduce the
calculation time of numerical analysis in commercial software, a
numerical procedure is performed for simplifying the
complicated mechanism of an epitaxial thin-film process. The
mechanism models are developed through rate of production
analysis. All the solution results could be compared in one
schematic diagram, and the differences among these three
mechanisms are extremely pronounced in high temperatures.
The simplified reaction mechanisms are then used as input for a
two-dimensional computational fluid dynamics code FLUENT,
enabling the accurate prediction of growth rates. Validation
studies are presented for two different laboratory-scale reactors.
For each study, the predictions reasonably agree with the
experimental data, indicating the universality of the reaction
mechanisms.
Index Terms—MOCVD, LED, mechanism, GaN, numerical,
thin film.
I. INTRODUCTION
Metal organic chemical vapor deposition (MOCVD) is a
crucial process [1~4] for manufacturing compound
semiconductor devices. Through the force convection
mechanism, thin films are deposited on solid substrates from
the gas inlet to the gas outlet. During this process, the reactant
vapors enter the chamber from the top of the showerhead and
flow down vertically into the reactor.
Chih-Kai, Hu, Department of Mechanical Engineering, National Central
University, Taoyuan 3320, Taiwan (R.O.C.).
Chun-Jung, Chen, Department of Chemical Engineering, Chung Yuan
Christian University, Taoyuan 320, Taiwan (R.O.C.).
Ta-Chin Wei, Professor, Department of Chemical Engineering, Chung
Yuan Christian University, Taoyuan 320, Taiwan (R.O.C.).
Ting-Tung,Li (Tomi T. Li), Professor, Department of Mechanical
Engineering, National Central University, Taoyuan 3320, Taiwan (R.O.C.).
Ching-Chiun, Wang, Industrial Technology Research Institute, Hsinchu
300, Taiwan (R.O.C).
Chih-Yung, Huang, Industrial Technology Research Institute,Hsinchu
300, Taiwan (R.O.C).
Yi-Jiun Lin, Industrial Technology Research Institute, Hsinchu 300,
Taiwan (R.O.C).
Upon contacting the surface of the susceptor, the reactant
vapors flow, radially outward above the susceptor and wafer
then finally exhaust through the outlet. By using this unique
technique, a high-quality GaN epitaxial thin film was
obtained for the first time on a sapphire wafer [5~7].
Design on simulation, which is based on commercial
numerical software, is now widely used in the semiconductor
industry in the optimization and troubleshooting of epitaxial
growth processes that occur on the substrate [8~9].
Furthermore, it is commonly employed in reactor design. In
the past 20 years, only a few studies have investigated the
GaN mechanism; therefore, the experimental data available
for III-nitride MOCVD growth chemistry are extremely
limited, particularly the chemical kinetic rate data in the
Arrhenius equation. Although a simplified reaction model is
introduced by S. A. Safvi [10], several features of the GaN
growth chemistry can be identified that have been established
by experimental and numerical computational studies
[10~14], but the GaN thin film mechanism is still unclear for
many years.
A complicated chemistry method derived from theab
initio quantum chemistry methods developed in 2005 is used
for growth rate prediction [15]. Such detailed reaction
mechanisms, comprising mostly elementary and ring
reactions, have the advantage of requiring little or no
calibration by using experimental data. However, for a
complicated mechanism, a single computer has difficulty in
rapidly obtaining a solution, and the calculation time is
considerably extensive.
For the two-dimensional (2D) calculation, CFD
modeling has recently become one of the critical tools used
for designing and optimizing the performance of an MOCVD
reactor [16~19]. For a complicate mechanism, although the
accuracy is sufficient, the computational capacity is
extremely high, the calculation time is always up to few days
and difficult to calculate using a standard computer.By using
the parallel computing may be the best way to solve this
problem, but the fund cost is too high to achieve. This study
used the complicated chemical mechanism from previous
studies [15], which is simplified through the rate of
production (ROP) analysis (CHEMKIN, 0-dimensional
calculation), and the goal is to develop a simplified
mechanism can easy calculated by a standard computer to
predict the GaN growth in blue-LED process.And it can be
used as the key equipment design for in general academia and
industry.
C.K. Hu, C.J. Chen,T.C. Wei, Tomi T. Li, C. C. Wang, C. Y. Huang, Y.J. Lin
A Simplified and Universal Mechanism Model for
Prediction of Gallium Nitride Thin Film Growth
Through Numerical Analysis
A Simplified and Universal Mechanism Model for Prediction of Gallium Nitride Thin Film Growth Through
Numerical Analysis
8 www.ijntr.org
II. THE NUMERICAL MODELING DETAILS
Procedure for the numericalmodeling
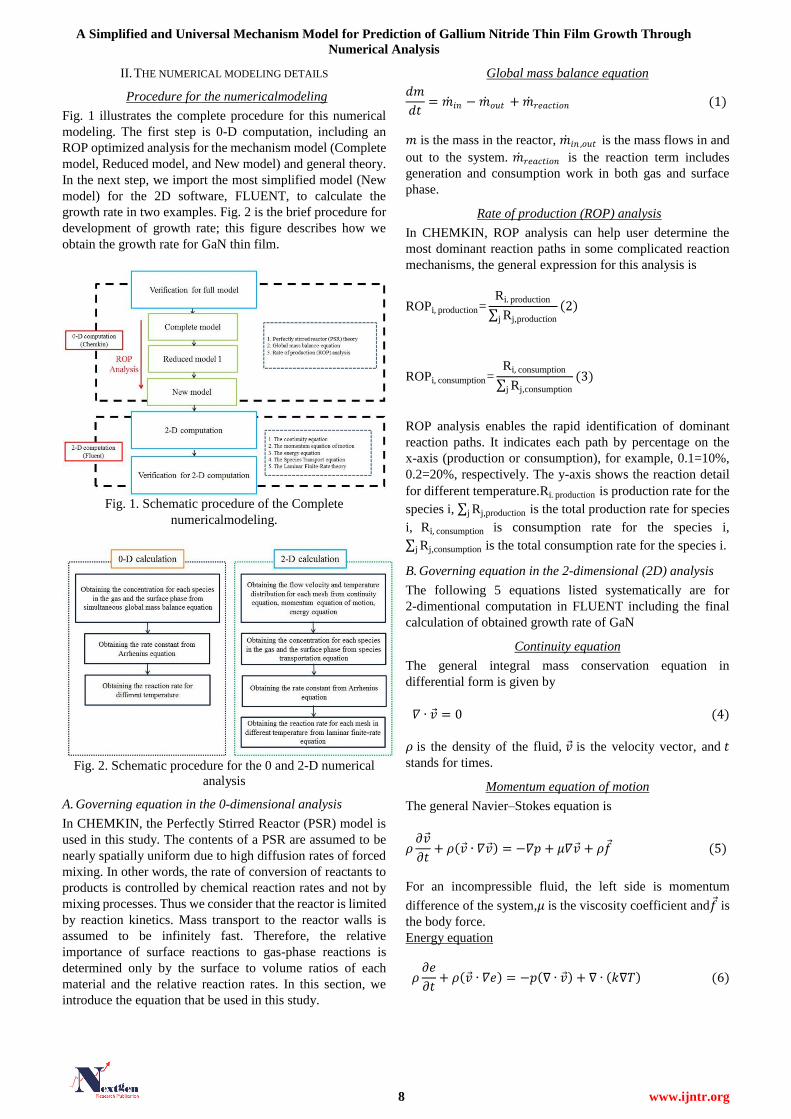
Fig. 1 illustrates the complete procedure for this numerical
modeling. The first step is 0-D computation, including an
ROP optimized analysis for the mechanism model (Complete
model, Reduced model, and New model) and general theory.
In the next step, we import the most simplified model (New
model) for the 2D software, FLUENT, to calculate the
growth rate in two examples. Fig. 2 is the brief procedure for
development of growth rate; this figure describes how we
obtain the growth rate for GaN thin film.
Fig. 1. Schematic procedure of the Complete
numericalmodeling.
Fig. 2. Schematic procedure for the 0 and 2-D numerical
analysis
A. Governing equation in the 0-dimensional analysis
In CHEMKIN, the Perfectly Stirred Reactor (PSR) model is
used in this study. The contents of a PSR are assumed to be
nearly spatially uniform due to high diffusion rates of forced
mixing. In other words, the rate of conversion of reactants to
products is controlled by chemical reaction rates and not by
mixing processes. Thus we consider that the reactor is limited
by reaction kinetics. Mass transport to the reactor walls is
assumed to be infinitely fast. Therefore, the relative
importance of surface reactions to gas-phase reactions is
determined only by the surface to volume ratios of each
material and the relative reaction rates. In this section, we
introduce the equation that be used in this study.
Global mass balance equation
𝑑𝑚
𝑑𝑡= 𝑚 𝑖𝑛 − 𝑚 𝑜𝑢𝑡 + 𝑚 𝑟𝑒𝑎𝑐𝑡𝑖𝑜𝑛 (1)
𝑚 is the mass in the reactor, 𝑚 𝑖𝑛 ,𝑜𝑢𝑡 is the mass flows in and
out to the system. 𝑚 𝑟𝑒𝑎𝑐𝑡𝑖𝑜𝑛 is the reaction term includes
generation and consumption work in both gas and surface
phase.
Rate of production (ROP) analysis
In CHEMKIN, ROP analysis can help user determine the
most dominant reaction paths in some complicated reaction
mechanisms, the general expression for this analysis is
ROPi, production=Ri. production
Rj,productionj
2
ROPi, consumption=Ri, consumption
Rj,consumptionj
(3)
ROP analysis enables the rapid identification of dominant
reaction paths. It indicates each path by percentage on the
x-axis (production or consumption), for example, 0.1=10%,
0.2=20%, respectively. The y-axis shows the reaction detail
for different temperature.Ri. production is production rate for the
species i, Rj,productionj is the total production rate for species
i, Ri, consumption is consumption rate for the species i,
Rj,consumptionj is the total consumption rate for the species i.
B. Governing equation in the 2-dimensional (2D) analysis
The following 5 equations listed systematically are for
2-dimentional computation in FLUENT including the final
calculation of obtained growth rate of GaN
Continuity equation
The general integral mass conservation equation in
differential form is given by
𝛻 ∙ 𝑣 = 0 (4)
𝜌 is the density of the fluid, 𝑣 is the velocity vector, and 𝑡
stands for times.
Momentum equation of motion
The general Navier–Stokes equation is
𝜌𝜕𝑣
𝜕𝑡+ 𝜌 𝑣 ∙ 𝛻𝑣 = −𝛻𝑝 + 𝜇𝛻𝑣 + 𝜌𝑓 (5)
For an incompressible fluid, the left side is momentum
difference of the system,𝜇 is the viscosity coefficient and𝑓 is
the body force.
Energy equation
𝜌𝜕𝑒
𝜕𝑡+ 𝜌 𝑣 ∙ 𝛻𝑒 = −𝑝 ∇ ∙ 𝑣 + ∇ ∙ 𝑘∇𝑇 (6)
International Journal of New Technology and Research (IJNTR)
ISSN:2454-4116, Volume-2, Issue-7, July 2016 Pages 07-15
9 www.ijntr.org
This equation involves the total work done by pressure, work
done by viscous force, 𝑘 is the thermal conductivity for fluid,
𝑇 is temperature, 𝑒is the energy per unit mass for fluid.
Species transportation equation
This conservation equation is expressed in the following
form:
𝜕
𝜕𝑡 𝜌𝑌 + 𝛻 ∙ 𝜌 𝑣 𝑌 = −𝛻 ∙ 𝐽 + 𝑅 + 𝑆 (7)
WhereRis the net rate of production of species by chemical
reaction, Y is the local mass fraction of each species and S is
the rate of creation by addition from the dispersed phase
plusany user-defined sources.
Laminar finite-rate equation and Arrhenius equation
Laminar finite-rate equation is written in general form as
follows:
(8)
N is number of chemical species in the system, 𝑉′𝑖,𝑟 is the
stoichiometric coefficient for reactant i in reaction r, 𝑉"𝑖 ,𝑟 is
the stoichiometric coefficient for product i in reaction r,
symbol denoting species i, 𝑀𝑖 is symbol denoting species i,
𝑘𝑓 ,𝑟 is the forward rate constant for reaction r, 𝑘𝑏 ,𝑟 =
backward rate constant for reaction r.
The forward rate constant (growth rate) is computed
using the Arrhenius expression
𝑘𝑓 ,𝑟 = 𝐴𝑇𝑛ℯ−𝐸𝑎/𝑅𝑇 (9)
Where Ais the pre-exponential factor, B is the temperature
exponent, 𝐸𝑎 is the activation energy for the reaction, and R
is the universal gas constant.
2D numerical assumption
In this study, the following assumptions are made for the
2D model: (1) the gas mixture is treated as a continuum; (2)
steady state is considered; (3) axisymmetric behavioris
assumed; (4) radiation between the walls is neglected; and (5)
incompressible ideal gas behavior is assumed.
Boundary condition
The simulations described in this section were performed
through the commercial fluid dynamics code FLUENT,
which employs the finite volume method to solve governing
fluid equations of mass, momentum, energy, and species
conservation laws in a stationary state; The gas-flow
conditions in various MOCVD reactors and their chemical
conditions can be calculated using FLUENT. Table 7 lists the
used in the numerical simulation parameters. The boundary
conditions for the model are as follows. No slip condition are
imposed on the reactor wall anda velocity boundary
condition is specified as the showerhead or nozzle gas inlet,
which is obtained from the given volume flow rate. The
temperature and species mole fraction are also specified for
the inlet. For the outlet, the outflow boundary condition is
selected, which presumes the fully developed flow at the
outlet. For the wall, zero velocity, constant temperature, zero
species gradient, and zero thermal flux are assumed. The
susceptor temperature is maintained at 1323K, whereas the
temperatures of all the other side walls are set to 27 °C
because of water cooling; the operating pressure is set in the
range 100~200torr.
III. RESULTS AND DISCUSSION
A. Computation of the Complete mechanism model
A mathematical representation is developed for the
Complete mechanism model involving ROP analysis through
the 0D dimension software CHEMKIN. Tables 1 and 2
summarize the gas and surface reaction mechanisms [15].
The Arrhenius coefficients and activation energy are all
temperature sensitive;the small pressure difference will not
affect the final conclusion and computation. So, the pressure
difference between derivative and process is ignoring.
The gas reaction mechanism considers several aspects
including the pyrolysis reactions for tri-methyl gallium
(TMG), di-methyl gallium (DMG), and monomethyl gallium
(MMG), and the adduct reactions with NH3 and CH3;
interaction among CH3, H2, and H; and finally, the pyrolysis
reaction for adducts. TMG and MMG decompose slowly
because of their large activation energy barriers; however, the
pyrolysis reaction of DMG to MMG is rapid. Therefore, the
conversion of TMG to MMG is rapid at high temperatures,
and the concentration of MMG is expected to be high at
higher temperatures. Therefore, MMG and MMG:NH3 are
expected to be the dominant gallium-containing precursors at
high temperatures, whereas TMG and TMG:NH3 are
expected to contribute to the deposition at low temperatures.
For the surface reaction, Table 2 lists three paths and Table 3
is the compositions for chemical compounds on the surface.
Path 1 displays the ring reaction between MMG and NH3.
First, the MMG in the gas phase is absorbed by the substrate
to form the surface site MMG(S) which then interacts with
NH3 in the gas region and forms COMPM1(S). This
procedure is repeated until COMPM5(S) is formed.
COMPM5(S) is desorbed by a CH3 radical to form a ring
structure RINGM1, which is then attached to a nearby
surface Ga(S). Finally, the hydrogen atoms H2 are eliminated,
resulting in GaN formation.
Path 2 for GaN formation starts from the adsorption at the
surface site GaNH2(S). This species can directly be formed
from the gas phase reaction of the MMG and NH3 or through
the reaction of the adsorbed Ga(S) and adsorbed NH2(S).
GaNH2(S) then absorbs the MMG and NH3 in the gas phase
to form the compound COMPMM1(S). Similar to Path 1, this
process is repeated until the elimination of CH4 to produce a
ring structure RINGM1(S). Finally, the ring absorbs CH3
radicals from each Ga atom of the ring followed by the
elimination of CH4, resulting in GaN formation.
In Path 3, TMG adsorbs on N(S) to form TMG(s). NH3 is
then adsorbed by TMG(S) to form TCOM1(S). Moreover,
TCOM1 can be formed by the adduct TMG:NH3 in the gas
phase, which is directly absorbed by the surface N(S). Similar
to the processes in Paths 1 and 2, this procedure repeats until
A Simplified and Universal Mechanism Model for Prediction of Gallium Nitride Thin Film Growth Through
Numerical Analysis
10 www.ijntr.org
a complex TCOM3(S) is formed. Finally, this complex
TCOM3(S) eliminates two molecules of CH4 to produce
GaN. To verify the accuracy of our CHEMKIN software, we
incorporated the Complete mechanism model presented in
Tables 1 and 2 into the solver. Table 4 lists the input
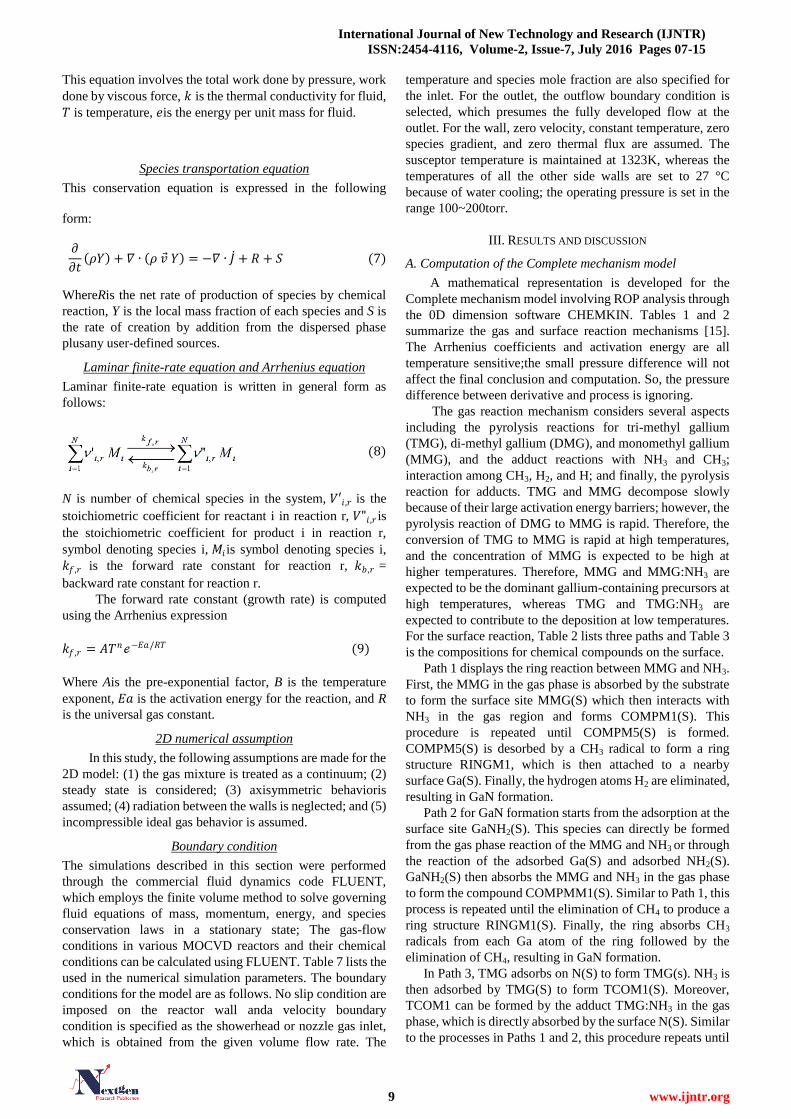
parameters for the calculation of the growth rate. Fig. 3
illustrates the predicted result compared with the results of
previous studies.
Fig. 3. Result of the Complete mechanism model vs.
literaturedata [11].
On the basis of the aforementioned mechanisms, we
observe that in a high-temperature zone, this numerical result
is precisely matched to the experimental data. This section
displays that the numerical code CHEMKIN is a reliable
software tool, and we used it to describe chemical
mechanisms in this study. We describe the simplified
procedure in the next section.
Table 1
Gas-phase mechanism for the Complete model [15]. The unit
of Ea is kJ/mol.
k=A𝑇𝑛e-Ea/RT A n Ea
G1 TMG = DMG + CH3 1.00E+47 -9.18 76996
G2 DMG = MMG + CH3 7.67E+43 -9.8 34017
G3 MMG = Ga + CH3 1.68E+30 -5.07 84030
G4 TMG + NH3 → TMG:NH3 2.28E+34 -8.31 3115
G5 TMG + NH3 → DMG:NH2 + CH4 1.70E+04 2 19969
G6 DMG + NH3 → DMG:NH3 4.08E+31 -7.03 3234
G7 DMG + NH3 → MMG:NH2 + CH4 5.30E+05 1.56 20744
G8 MMG + NH3 → MMG:NH3 7.95E+24 -5.21 2094
G9 MMG + NH3 → GaNH2 + CH4 8.10E+05 1.3 17722
G10 NH3 + CH3 → NH2 + CH4 3.31E+03 2.51 9859
G11 CH3 + H2 → CH4 + H
1.20E+12 0 12518
G12 TMG + H → DMG + CH4 5.00E+13 0 10036
G13 DMG + H → MMG + CH4 5.00E+13 0 10036
G14 TMGNH3 → MMG + 2CH3 + NH3 1.33E+44 -8.24 77791
G15 CH3 + H + M → CH4 + NH3 2.40E+22 -1 0
G16 2CH3 = C2H6 2.00E+13 0 0
G17 2H + M = H2 + M
2.00E+16 0 0
Table 2
Surface-phase mechanism of the Complete model [15]. The
unit of Ea is kJ/mol.
Path 1, k=A𝑇𝑛e-Ea/RT A n Ea
1 MMG + N(S) → MMG(S)
1.16E+05 2.98 0
2 MMG(S) → MMG + N(S)
1.12E+14 0.55 107673
3 NH3 + MMG(S) → COMPM1(S)
3.35E+07 3.33 0
4 COMPM1(S) → NH3 + MMG(S)
5.70E+13 -0.16 8146
5 MMG + COMPM1(S) → CH4 + COMPM2(S) 1.23E+10 3.22 23446
6 NH3 + COMPM2(S) → COMPM3(S)
3.35E+07 3.33 0
7 COMPM3(S) → NH3 + COMPM2(S)
5.70E+13 -0.161 8146
8 MMG + COMPM3(S) → CH4 + COMPM4(S) 1.23E+10 3.22 23446
9 NH3 + COMPM4(S) → COMPM5(S)
3.35E+07 3.33 0
10 COMPM5(S) → NH3 + COMPM4(S)
5.70E+13 -0.161 8146
11 COMPM5(S) → CH4 + RINGM1(S)
1.23E+07 3.22 23446
12 Ga(S) + RINGM1(S) → RINGM2(S) + N(S) 3.35E+07 3.33 0
13 RINGM2(S) → 3H2 + 3GaN(B) + Ga(S) 3.68E+09 2.05 59610
Path 2, k=A𝑇𝑛e-Ea/RT A n Ea
14 CH3 + Ga(S) → MMG(S) 1.76E+09 1.39 0
15 MMG(S) → CH3 + Ga(S) 4.54E+13 0.0346 79480
16 NH2 + Ga(S) → NH2(S) 3.17E+08 1.83 0
17 GaNH2 + N(S) → GaNH2(s) 2.27E+06 2.247 0
18 GaNH2(S) → GaNH2 + N(S) 4.83E+13 0.614 83881
19 COMPMM1(S) → CH4 + GaNH2(S) 1.49E+11 0.609 25950
20 MMG + GaNH2(S) → COMPMM1(S) 1.16E+05 2.98 0
21 NH3 + COMPMM1(S) → COMPMM2(S) 3.35E+07 3.33 0
22 COMPMM2(S) → CH4 + COMPMM3(S) 1.49E+11 0.609 25950
23 MMG + COMPMM3(S) → COMPMM4(S) 1.16E+05 2.98 0
24 NH3 + COMPMM4(S) → COMPMM5(S) 3.35E+07 3.33 0
25 COMPMM5(S) → CH4 + RINGM1(S) 1.49E+11 0.609 25950
26 NH2(S) → NH2 + Ga(S) 1.45E+14 0.09 59786
27 COMPMM1(S) → MMG + GaNH2(S) 1.00E+14 0.55 42819
28 COMPMM2(S) → NH3 + COMPMM1(S) 5.70E+13 -0.1 8146
29 COMPMM4(S) → MMG + COMPMM3(S) 1.00E+14 0.55 42819
30 COMPMM5(S) → NH3 + COMPMM4(S) 5.70E+13 -0.1 8146
31 Ga + N(S) → Ga(S) 1.00E+11 1.5 0
32 Ga(S) + NH2(S) → GaNH2 + Ga(S) 1.00E+25 0 0
33 Ga(S) → Ga + N(S) 1.00E+13 0 45168
34 6CH3 + RINGM2(S) → COM1(S) 7.55E+07 2.31 0
35 COM1(S) → 6CH3 + RINGM2(S) 1.00E+13 0.71 45506
36 COM1(S) → 6CH4 + 3GaN(B) + Ga(S) 4.00E+12 0 49675
Path 3, k=A𝑇𝑛e-Ea/RT A n Ea
37 TMG + N(S) → TMG(S) 1.16E+05 2.98 0
38 NH3 + TMG(S) → TCOM1(S) 3.35E+07 3.33 0
39 TCOM1(S) → CH4 + TCOM2(S) 1.49E+11 0.609 32785
40 Ga(S) + TCOM2(S) → TCOM3(S) + N(S) 3.35E+07 3.33 0
41 TCOM3(S) → 2CH4 + GaN(B) + Ga(S) 1.49E+11 0.609 49675
42 TMG(S) → TMG + N(S) 1.12E+14 0.55 49675
43 TCOM1(S) → NH3 + TMG(S) 5.70E+13 -0.161 11922
44 TMG:NH3 + N(S) → TCOM1(S) 1.16E+05 2.98 0
45 TCOM1(S) → TMG:NH3 + N(S) 1.12E+14 0.55 49675
46 TCOM1(S) → 2CH3 + MMG(S) + NH3 +N(S) 1.12E+14 0.55 107673
47 MMGNH3 + N(S) → COMPM1(S) 1.16E+05 2.98 0
48 COMPM1(S) → MMG:NH3 + N(S) 1.12E+14 0.55 107673
49 MMG:NH3 + COMPM1(S) → CH4 + COMPM3(S) 1.23E+10 3.22 23446
50 MMG:NH3 + COMPM3(S) → CH4 + COMPM5(S) 1.23E+10 3.22 23446
51 MMG:NH3 + GaNH2(S) → COMPMM2(S) 1.16E+05 2.98 0
52 MMG:NH3 + COMPMM3(S) → COMPMM5(S) 1.16E+05 2.98 0
Table 3
The chemical compositions for the chemical compounds on
the surface [15] Compounds names Chemical formula
COMPM1(S) NH3·MMG(S)
COMPM2(S) Ga·NH2·MMG(S)
COMPM3(S) NH3·Ga·NH2·MMG(S)
COMPM4(S) Ga·NH2·Ga·NH2·MMG(S)
COMPM5(S) NH3·Ga·NH2·Ga·NH2·MMG(S)
RINGM1(S) NH2·Ga·NH2·Ga·NH2·Ga(S)
RINGM2(S) (S)NH2·Ga·NH2·Ga·NH2·Ga(S)
COMPMM1(S) MMG·GaNH2(S)
COMPMM2(S) NH3·MMG·GaNH2·Ga(S)
COMPMM3(S) NH2·Ga·NH2·Ga(S)
COMPMM4(S) MMG·NH2·Ga·NH2·Ga(S)
COMPMM5(S) NH3·MMG·NH2·Ga·NH2·Ga(S)
TCOM1(S) NH3·TMG(S)
TCOM2(S) NH2·DMG(S)
TCOM3(3) (S)NH2·DMG(S)
COM1(S) RINGM2(S)·CH3 complex
Table 4
Process parameters for the 0-D model [11]. Volume flow rate values
Standard liter per minute
TMGa flow rate (µmol/min)
NH3 flow rate (Slm)
H2 flow rate (Slm)
7.48 × 10⁻⁴
6
7.1
Parameter value
Initial pressure (torr) 140
Susceptor temperature (K) 600 ~ 1400
Reactor initial temperature (K) 300
Gas inlet temperature (K) 300
V/III ration 2000
B. Development of the Completemechanism model
For the LED industry, rapidly and accurately predicting
epitaxial uniformity and growth rate is critical. The accuracy
is verified using the aforementioned 0D calculation. For the
Complete model, the reaction number of the Complete
mechanism is up to 69,as listed in Tables 1 and 2. Therefore,
we must simplify the Complete model. ROP analysis is used
for determining the contribution of each reaction to the net
production or destruction rate of a species. It is particularly
useful for 0D systems, where the computational expense for
International Journal of New Technology and Research (IJNTR)
ISSN:2454-4116, Volume-2, Issue-7, July 2016 Pages 07-15
11 www.ijntr.org
the added calculations is low, and the data can be considered
from a large reactor set. Therefore, ROP analysis rapidly
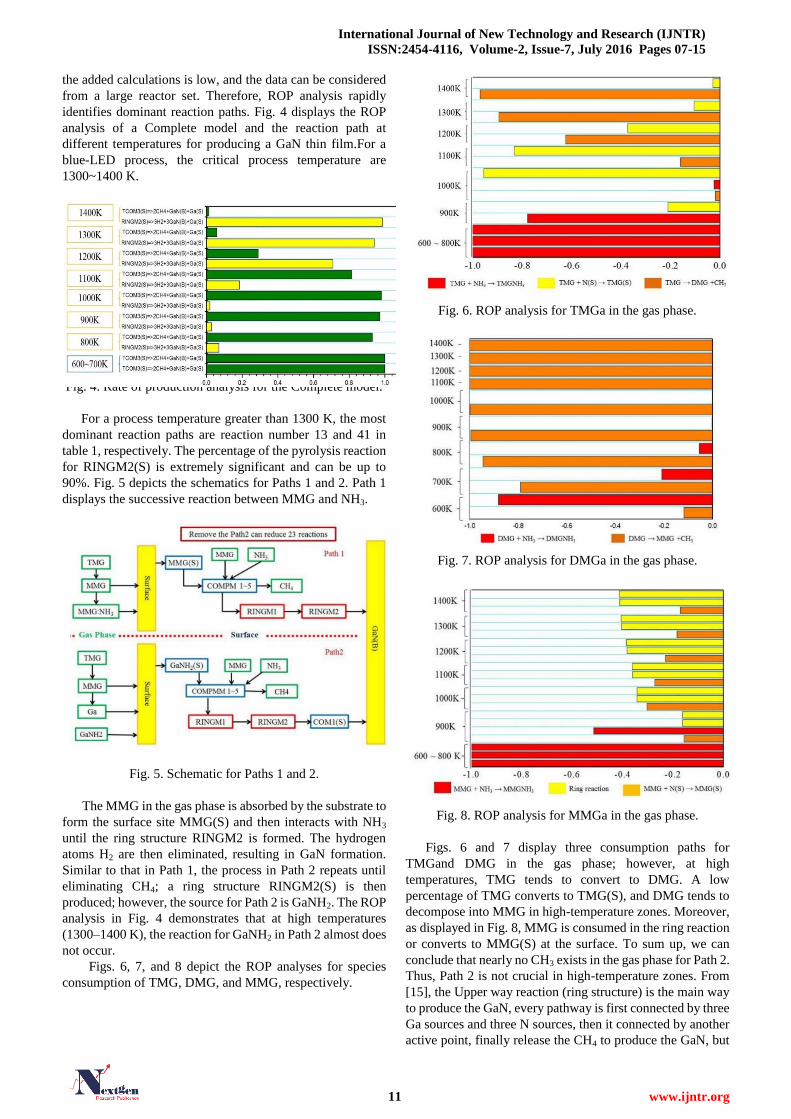
identifies dominant reaction paths. Fig. 4 displays the ROP
analysis of a Complete model and the reaction path at
different temperatures for producing a GaN thin film.For a
blue-LED process, the critical process temperature are
1300~1400 K.
Fig. 4. Rate of production analysis for the Complete model.
For a process temperature greater than 1300 K, the most
dominant reaction paths are reaction number 13 and 41 in
table 1, respectively. The percentage of the pyrolysis reaction
for RINGM2(S) is extremely significant and can be up to
90%. Fig. 5 depicts the schematics for Paths 1 and 2. Path 1
displays the successive reaction between MMG and NH3.
Fig. 5. Schematic for Paths 1 and 2.
The MMG in the gas phase is absorbed by the substrate to
form the surface site MMG(S) and then interacts with NH3
until the ring structure RINGM2 is formed. The hydrogen
atoms H2 are then eliminated, resulting in GaN formation.
Similar to that in Path 1, the process in Path 2 repeats until
eliminating CH4; a ring structure RINGM2(S) is then
produced; however, the source for Path 2 is GaNH2. The ROP
analysis in Fig. 4 demonstrates that at high temperatures
(1300–1400 K), the reaction for GaNH2 in Path 2 almost does
not occur.
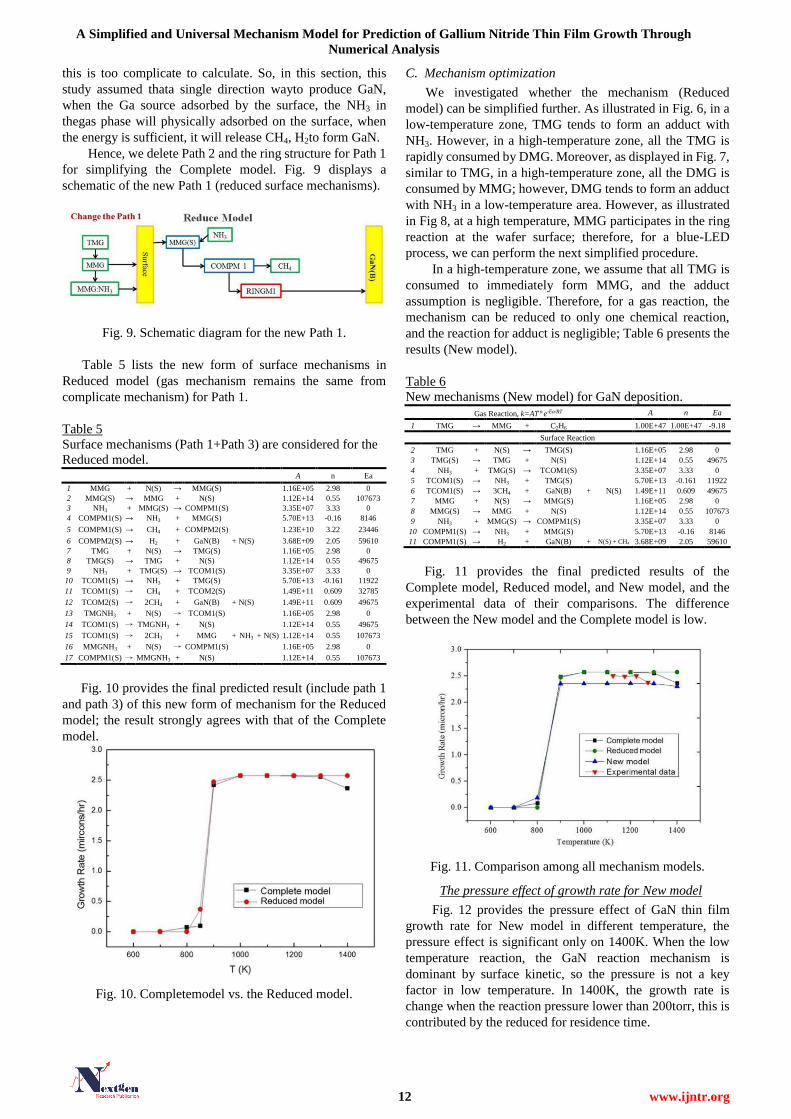
Figs. 6, 7, and 8 depict the ROP analyses for species
consumption of TMG, DMG, and MMG, respectively.
Fig. 6. ROP analysis for TMGa in the gas phase.
Fig. 7. ROP analysis for DMGa in the gas phase.
Fig. 8. ROP analysis for MMGa in the gas phase.
Figs. 6 and 7 display three consumption paths for
TMGand DMG in the gas phase; however, at high
temperatures, TMG tends to convert to DMG. A low
percentage of TMG converts to TMG(S), and DMG tends to
decompose into MMG in high-temperature zones. Moreover,
as displayed in Fig. 8, MMG is consumed in the ring reaction
or converts to MMG(S) at the surface. To sum up, we can
conclude that nearly no CH3 exists in the gas phase for Path 2.
Thus, Path 2 is not crucial in high-temperature zones. From
[15], the Upper way reaction (ring structure) is the main way
to produce the GaN, every pathway is first connected by three
Ga sources and three N sources, then it connected by another
active point, finally release the CH4 to produce the GaN, but
A Simplified and Universal Mechanism Model for Prediction of Gallium Nitride Thin Film Growth Through
Numerical Analysis
12 www.ijntr.org
this is too complicate to calculate. So, in this section, this
study assumed thata single direction wayto produce GaN,
when the Ga source adsorbed by the surface, the NH3 in
thegas phase will physically adsorbed on the surface, when
the energy is sufficient, it will release CH4, H2to form GaN.
Hence, we delete Path 2 and the ring structure for Path 1
for simplifying the Complete model. Fig. 9 displays a
schematic of the new Path 1 (reduced surface mechanisms).
Fig. 9. Schematic diagram for the new Path 1.
Table 5 lists the new form of surface mechanisms in
Reduced model (gas mechanism remains the same from
complicate mechanism) for Path 1.
Table 5
Surface mechanisms (Path 1+Path 3) are considered for the
Reduced model. A n Ea
1 MMG + N(S) → MMG(S) 1.16E+05 2.98 0
2 MMG(S) → MMG + N(S) 1.12E+14 0.55 107673
3 NH3 + MMG(S) → COMPM1(S) 3.35E+07 3.33 0
4 COMPM1(S) → NH3 + MMG(S) 5.70E+13 -0.16 8146
5 COMPM1(S) → CH4 + COMPM2(S) 1.23E+10 3.22 23446
6 COMPM2(S) → H2 + GaN(B) + N(S) 3.68E+09 2.05 59610
7 TMG + N(S) → TMG(S) 1.16E+05 2.98 0
8 TMG(S) → TMG + N(S) 1.12E+14 0.55 49675
9 NH3 + TMG(S) → TCOM1(S) 3.35E+07 3.33 0
10 TCOM1(S) → NH3 + TMG(S) 5.70E+13 -0.161 11922
11 TCOM1(S) → CH4 + TCOM2(S) 1.49E+11 0.609 32785
12 TCOM2(S) → 2CH4 + GaN(B) + N(S) 1.49E+11 0.609 49675
13 TMGNH3 + N(S) → TCOM1(S) 1.16E+05 2.98 0
14 TCOM1(S) → TMGNH3 + N(S) 1.12E+14 0.55 49675
15 TCOM1(S) → 2CH3 + MMG + NH3 + N(S) 1.12E+14 0.55 107673
16 MMGNH3 + N(S) → COMPM1(S) 1.16E+05 2.98 0
17 COMPM1(S) → MMGNH3 + N(S) 1.12E+14 0.55 107673
Fig. 10 provides the final predicted result (include path 1
and path 3) of this new form of mechanism for the Reduced
model; the result strongly agrees with that of the Complete
model.
Fig. 10. Completemodel vs. the Reduced model.
C. Mechanism optimization
We investigated whether the mechanism (Reduced
model) can be simplified further. As illustrated in Fig. 6, in a
low-temperature zone, TMG tends to form an adduct with
NH3. However, in a high-temperature zone, all the TMG is
rapidly consumed by DMG. Moreover, as displayed in Fig. 7,
similar to TMG, in a high-temperature zone, all the DMG is
consumed by MMG; however, DMG tends to form an adduct
with NH3 in a low-temperature area. However, as illustrated
in Fig 8, at a high temperature, MMG participates in the ring
reaction at the wafer surface; therefore, for a blue-LED
process, we can perform the next simplified procedure.
In a high-temperature zone, we assume that all TMG is
consumed to immediately form MMG, and the adduct
assumption is negligible. Therefore, for a gas reaction, the
mechanism can be reduced to only one chemical reaction,
and the reaction for adduct is negligible; Table 6 presents the
results (New model).
Table 6
New mechanisms (New model) for GaN deposition.
Gas Reaction, k=A𝑇𝑛e-Ea/RT A n Ea
1 TMG → MMG + C2H6 1.00E+47 1.00E+47 -9.18
Surface Reaction
2 TMG + N(S) → TMG(S)
1.16E+05 2.98 0
3 TMG(S) → TMG + N(S)
1.12E+14 0.55 49675
4 NH3 + TMG(S) → TCOM1(S)
3.35E+07 3.33 0
5 TCOM1(S) → NH3 + TMG(S)
5.70E+13 -0.161 11922
6 TCOM1(S) → 3CH4 + GaN(B) + N(S) 1.49E+11 0.609 49675
7 MMG + N(S) → MMG(S)
1.16E+05 2.98 0
8 MMG(S) → MMG + N(S)
1.12E+14 0.55 107673
9 NH3 + MMG(S) → COMPM1(S)
3.35E+07 3.33 0
10 COMPM1(S) → NH3 + MMG(S)
5.70E+13 -0.16 8146
11 COMPM1(S) → H2 + GaN(B) + N(S) + CH4 3.68E+09 2.05 59610
Fig. 11 provides the final predicted results of the
Complete model, Reduced model, and New model, and the
experimental data of their comparisons. The difference
between the New model and the Complete model is low.
Fig. 11. Comparison among all mechanism models.
The pressure effect of growth rate for New model
Fig. 12 provides the pressure effect of GaN thin film
growth rate for New model in different temperature, the
pressure effect is significant only on 1400K. When the low
temperature reaction, the GaN reaction mechanism is
dominant by surface kinetic, so the pressure is not a key
factor in low temperature. In 1400K, the growth rate is
change when the reaction pressure lower than 200torr, this is
contributed by the reduced for residence time.
International Journal of New Technology and Research (IJNTR)
ISSN:2454-4116, Volume-2, Issue-7, July 2016 Pages 07-15
13 www.ijntr.org
800 900 1000 1100 1200 1300 14000.0
0.5
1.0
1.5
2.0
2.5
Gro
wth
Rate
(m
icro
n/h
r)
Temperature (K)
760 torr
700 torr
600 torr
500 torr
400 torr
300 torr
200 torr
100 torr
Fig. 12. The pressure effect for the New model
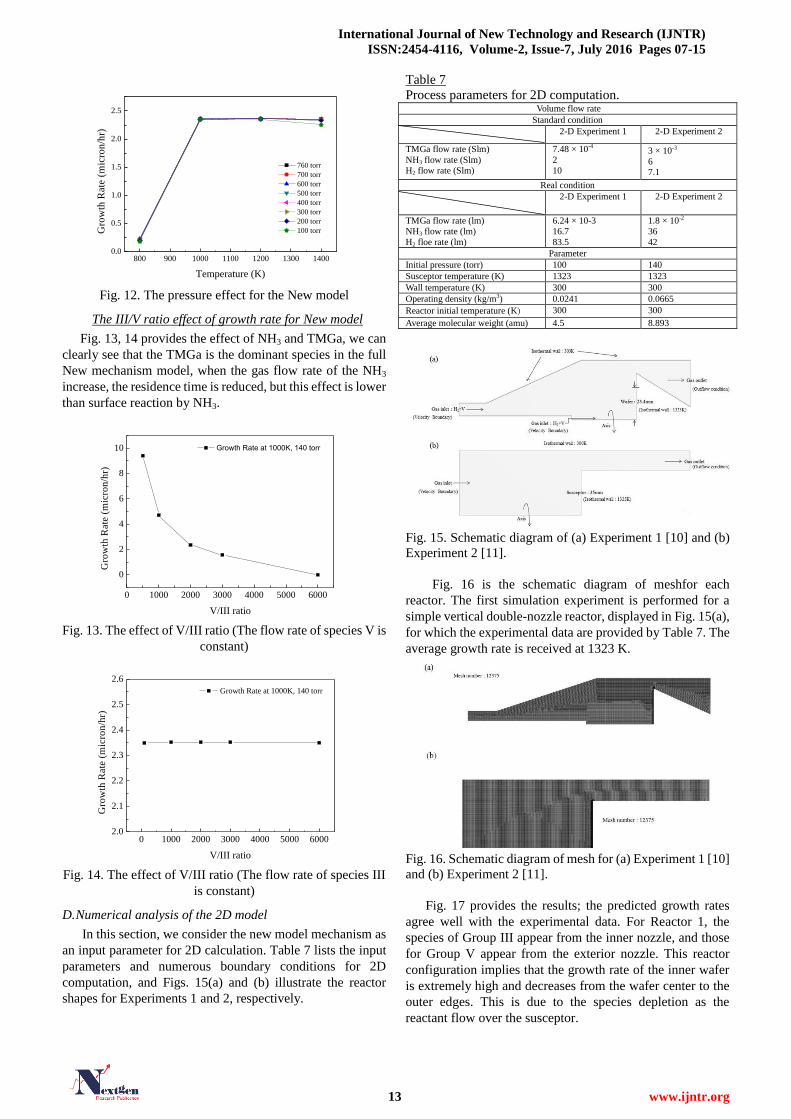
The III/V ratio effect of growth rate for New model
Fig. 13, 14 provides the effect of NH3 and TMGa, we can
clearly see that the TMGa is the dominant species in the full
New mechanism model, when the gas flow rate of the NH3
increase, the residence time is reduced, but this effect is lower
than surface reaction by NH3.
0 1000 2000 3000 4000 5000 6000
0
2
4
6
8
10
Gro
wth
Rate
(m
icro
n/h
r)
V/III ratio
Growth Rate at 1000K, 140 torr
Fig. 13. The effect of V/III ratio (The flow rate of species V is
constant)
0 1000 2000 3000 4000 5000 60002.0
2.1
2.2
2.3
2.4
2.5
2.6
Gro
wth
Rate
(m
icro
n/h
r)
V/III ratio
Growth Rate at 1000K, 140 torr
Fig. 14. The effect of V/III ratio (The flow rate of species III
is constant)
D. Numerical analysis of the 2D model
In this section, we consider the new model mechanism as
an input parameter for 2D calculation. Table 7 lists the input
parameters and numerous boundary conditions for 2D
computation, and Figs. 15(a) and (b) illustrate the reactor
shapes for Experiments 1 and 2, respectively.
Table 7
Process parameters for 2D computation. Volume flow rate
Standard condition
2-D Experiment 1 2-D Experiment 2
TMGa flow rate (Slm)
NH3 flow rate (Slm)
H2 flow rate (Slm)
7.48 × 10⁻⁴
2
10
3 × 10⁻³
6
7.1
Real condition
2-D Experiment 1 2-D Experiment 2
TMGa flow rate (lm)
NH3 flow rate (lm)
H2 floe rate (lm)
6.24 × 10⁻³
16.7
83.5
1.8 × 10⁻²
36
42
Parameter
Initial pressure (torr) 100 140
Susceptor temperature (K) 1323 1323
Wall temperature (K) 300 300
Operating density (kg/m3) 0.0241 0.0665
Reactor initial temperature (K) 300 300
Average molecular weight (amu) 4.5 8.893
Fig. 15. Schematic diagram of (a) Experiment 1 [10] and (b)
Experiment 2 [11].
Fig. 16 is the schematic diagram of meshfor each
reactor. The first simulation experiment is performed for a
simple vertical double-nozzle reactor, displayed in Fig. 15(a),
for which the experimental data are provided by Table 7. The
average growth rate is received at 1323 K.
Fig. 16. Schematic diagram of mesh for (a) Experiment 1 [10]
and (b) Experiment 2 [11].
Fig. 17 provides the results; the predicted growth rates
agree well with the experimental data. For Reactor 1, the
species of Group III appear from the inner nozzle, and those
for Group V appear from the exterior nozzle. This reactor
configuration implies that the growth rate of the inner wafer
is extremely high and decreases from the wafer center to the
outer edges. This is due to the species depletion as the
reactant flow over the susceptor.
A Simplified and Universal Mechanism Model for Prediction of Gallium Nitride Thin Film Growth Through
Numerical Analysis
14 www.ijntr.org
Fig. 17. 2D Experiment 1 result vs. literature results [10].
The second simulation set is performed for a vertical
showerhead reactor, displayed in Fig. 15(b), for which the
experimental data and boundary conditions are provided by
Table 7. The average growth rate is received in the
temperature range 1100–1300 K. The predicted growth rates
agree well with the experimental data at each temperature
point (Fig. 18).
Fig. 18. 2D Experiment 2 results vs. literature results [11].
IV. Conclusions
A simplified process that used CHEMKIN for modeling the
GaN growth is demonstrated. Several reaction pathways are
calculated using ROP analysis. The activation barriers and
vibrational frequencies are employed for calculating rate
constants. The New mechanism (New model) is used for
calculating the growth rate for different reactors through
CFD. The average growth rate is achieved in the temperature
range 1100–1300 K. The predicted growth rates agreed well
with the experimental data at each temperature point. The
most simplified mechanism can be used to predict the growth
rate of a blue-LED process before an actual process begins;
this is extremely useful for LED companies. All of these
observations demonstrate that the proposed mechanisms are
fairly universal and crucial pathways for the epitaxial growth
of GaN.This study provides a useful and a predictable
mechanism for GaN thin film research in blue-LED
process.More verification work is under way by our own
experiments.
V. ACKNOWLEDGMENTS
This study was supported by the Department of Mechanical
Engineering, National Central University, Taiwan
(R.O.C)and Chung Yuan Christian University
(R.O.C).Industrial Technology Research Institute, Taiwan
(R.O.C).
REFERENCES
[1] G.B. Stringfellow,Organometallic Vapor-Phase Epitaxy: Theory and
Practice, Salt Lake City, 1999. pp. 1-16.
[2] Y. Seki, K. Tanno, K. Lida and E. Ichiki, (1975, August). Properties of
epitaxial GaAslayers from a tri-ethyl gallium and arsine system. J. Solid
State Sci. Technol.[Online]. 122(8). pp. 1108-1112.
Available: http://jes.ecsdl.org/content/122/8/1108.full.pdf
[3] R. R. Saxena, V. Aebi and C. B. Cooper, M. J. Ludowise, H. A. Vander
Plas, B. R. Cairns, T. J. Maloney, P. G. Borden and P. E. Gregory.
(1980, July). High‐efficiency AlGaAs/GaAs concentrator solar cells by
organometallic vapor phase epitaxy. J. Appl. Phys. [Online]. 51.pp.
4501-4503.Available:http://scitation.aip.org/content/aip/journal/jap/51/
810.1063/1.328389
[4] H. Amano, M. Kito, K. Hiramatsu and I. Akasaki. (1989, November).
P-type conduction in Mg-doped GaN treated with low-energy electron
beam irradiation. J. Appl. Phys.[Online]. 28.pp. L2112-L2114.
Available:http://iopscience.iop.org/article/10.1143/JJAP.28.
L2112/meta
[5] S. Nakamura. (1991, October). GaN Growth Using GaN Buffer Layer.J.
Appl. Phys. [Online]. 30.pp. L1705-1707.
Available: http://iopscience.iop.org/article/10.1143/JJAP.30.L1705/met
a
[6] S. Nakamura, T. Mukai, M. Senoh and N. Iwasa.(1992, February).
Thermal Annealing Effects on P-Type Mg-Doped GaN Films. J. Appl.
Phys. [Online]. 31.pp. L139-L142.
Available:http://iopscience.iop.org/article/10.1143/JJAP.31.L139/meta
[7] S. Nakamura, T. Mukai and M. Senoh. (1993, January). Candela-class
high-brightness InGaN/AIGaN
double-heterostructureblue-light-emitting.J. Appl. Phys.[Online]. 64.pp.
1687-1689.Available:http://coen.boisestate.edu/bknowlton/files/2011/0
9/APL-Nakamura-Candela-class-high-brightness-InGaN-AlGaN-double
-heterostructure-blue-light-emitting-diodes-19941.pdf
[8] C. K. Hu, H. I Chien, and Tomi T. Li. (2015, July). Numerical analysis
for the growth of epitaxy layer in a large-size MOCVD reactor.Key Eng.
Mater. [Online]. 656-657.pp. 515-519.
Available:http://www.scientific.net/KEM.656-657.515
[9] C. K. Hu, Tomi T. Li, and Y. Lin. (2013, March). The optimization of
thermal flow field in a large-size MOCVD reactor. ECS Trans. [Online].
52(1).pp. 1021-1026. Available:http://ecst.ecsdl.org/content/52/1/1021.abstract
[10] S. A. Safvi, J. M. Redwing, M. A. Tischler and T. F. Kuech. (1997,
May). GaN Growth by Metallorganic Vapor Phase Epitaxy. J.
Electrochem. Soc.[Online]. 144(50). pp. 1789-1796
Available:http://jes.ecsdl.org/content/144/5/1789.short
[11] C. Theodoropoulos, T. J. Mountziaris, H.K. Moffat and J. Han. (2000,
July). Design of gas inlets for the growth of gallium nitride by
metalorganic vapor phase epitaxy. J. Cryst. [Online].Growth. 217. pp.
65-81.
Available:http://www.sciencedirect.com/science/article/pii/S002202
4800004024
[12] J. Sun, J. M. Redwing and T. F. Kuech, (1999, November). Transport
and Reaction Behaviors of Precursors during Metalorganic Vapor
Phase Epitaxy of Gallium Nitride. Phys. Status Solidi A. [Online]. 176.
pp.693-698.
Available:http://onlinelibrary.wiley.com/doi/10.1002/(SICI)1521-396
X(199911)176:1%3C693::AID-PSSA693%3E3.0.CO;2-Z/abstract
[13] A. Hirako, K. Kusakabe, and K. Ohkawa, (2005, February). Modeling
of Reaction Pathways of GaN Growth by Metalorganic Vapor-Phase
Epitaxy Using TMGa/NH3/H2: System: A Computational Fluid
Dynamics Simulation Study. J. Appl. Phys. [Online]. 44(2). pp. 874-879.
Available:http://iopscience.iop.org/article/10.1143/JJAP.44.874/meta
International Journal of New Technology and Research (IJNTR)
ISSN:2454-4116, Volume-2, Issue-7, July 2016 Pages 07-15
15 www.ijntr.org
[14] R. P. Parikh and R. A. Adomaitis.(2006, September). An overview of
gallium nitride growth chemistry and its effect on reactor design:
Application to a planetary radial-flow CVD system. J. Cryst.
Growth,[Online]. 286.pp. 259-278.
Available:https://www.researchgate.net/publication/222567111_An_
overview_of_gallium_nitride_growth_chemistry_and_its_effect_on_re
actor_design_Application_to_a_planetary_radial-flow_CVD_system
[15] D. Sengupta, S. Mazumderb, W. Kuykendall and S. A. Lowry.(2005,
March). Combined ab initio quantum chemistry and computational
fluid dynamics calculations for prediction of gallium nitride growth. J.
Cryst. Growth, [Online]. 279.pp. 369-382.
Available:http://www.sciencedirect.com/science/article/pii/S0022
024805002149
[16] G. H. Evans and R. Greif. (2009, October). A Numerical Model of the
Flow and Heat Transfer in a Rotating Disk Chemical Vapor Deposition
Reactor. J. Heat Transfer, [Online]. 109(4).pp. 928-935.
Available:http://heattransfer.asmedigitalcollection.asme.org/article.a
spx?articleid=1439491
[17] R.Zuo, H. Zhang and X. L. Liu.(2006, August). Transport phenomena in
radial flow MOCVD reactor with three concentric vertical inlets. J.
Cryst. Growth, [Online]. 293(2).pp. 498-508.
Available:http://www.sciencedirect.com/science/article/pii/S00
2202480600546X
[18] C. Y. Soong, C. H.Chyuan and R. Y.Tzong, (1998, October).
Thermo-Flow Structure and Epitaxial Uniformity in Large-Scale
Metalorganic Chemical Vapor Deposition Reactors with Rotating
Susceptor and Inlet Flow Control. J. Appl. Phys.[Online]. 37. pp-5823
5839.
Available:http://iopscience.iop.org/article/10.1143/JJAP.37.5
823/meta
[19] D. I. Fotiadis, S. Kieda and J. F. Jensen, (1990, September). Transport
phenomena in vertical reactors for metalorganic vapor phase epitaxy: I.
Effects of heat transfer characteristics, reactor geometry and operating
conditions. J. Cryst. Growth,102, 441-470.
Available:http://www.sciencedirect.com/science/article/pii/0022024
890904038


![Band alignment of Al2O3 with (-201) β-Ga2O3ww2.che.ufl.edu/ren/paper/2017 p27.pdf · Chemical Vapor Deposition (MOCVD) have been reported [1e13]. The large bandgap of Ga2O3 means](https://img.pdfslide.us/doc/110x75/5e8806a2765f02041f4fdbf2/band-alignment-of-al2o3-with-201-p27pdf-chemical-vapor-deposition-mocvd.jpg)