Embed Size (px)
Citation preview
2016 Science in the Age of Experience 1 http://www.3ds.com/events/science-in-the-age-of-experience
A Simplified 3D Numerical Scheme for Accurate Calculation of Critical Value of Pressure Drawdown
of Weak Sand Formation
Xinpu Shen, Guoyang Shen, and William Standifird
Halliburton
Abstract: The critical value of pressure drawdown (CVPDD) is a key parameter for controlling
the production rate for most of the wells in weak sand formations and depends on the form of
completion used, particularly in cases of high-pressure/high-temperature (HP/HT). This paper
presents a simplified three-dimensional (3D) calculation of CVPDD on the basis of maximum
plastic strain for a given well in offshore Gulf of Mexico. A fully-coupled, poro-elastoplastic
model was adopted to simulate the porous flow that occurred simultaneously with matrix inelastic
deformation. A submodeling technique was adopted to address the discrepancy between the scale
of the oil field and that of the wellbore section. Dual-stress-concentration around the perforation
tunnel was simulated. Resultant values of plastic strain caused by pressure drawdown were
visualized and analyzed along with the distribution. Values of CVPDD were suggested on the
basis of a numerical solution of plastic strain. The method proved to accurately predict CVPDD.
Visualization of 3D numerical results not only illustrates the values of plastic strain but also
shows the size of the plastic region induced by pressure drawdown, which is useful in selecting the
CVPDD. Results presented here indicate that the 3D finite element method is a highly efficient
tool for predicting CVPDD.
Keywords: Weak Sand Formations, Pressure Drawdown, Plasticity, Petroleum Production,
Sanding, Submodeling.
1. Introduction
This work establishes a simplified numerical scheme for the accurate 3D calculation of CVPDD
for wellbores with a casing completion in weak sand formations. The CVPDD is the value of
pressure drawdown at which harmful sanding begins to occur. An optimized CVPDD helps ensure
maximum oil production with a minimum risk of sanding.
Sand production is an important issue affecting oil production; it can cause serious problems in oil
flow within sand reservoirs and be detrimental to the proper functioning of oil production
equipment.
In general, sand production occurs when the stresses of the formation reach and exceed the
strength of the formation. The major cause of sand production is material instability in poorly
cemented and unconsolidated sand formations. As a kind of material instability, it was proved that
material plasticity plays an important role in the process of sand production (Papamichos and

2 2016 Science in the Age of Experience http://www.3ds.com/events/science-in-the-age-of-experience
Stavropoulou, 1998; Papamichos and Malmanger, 2001; van den Hoek et al., 1996). In the last 25
years, investigation and application on plasticity-based methods for prediction of sand production
have been reported by various researchers. Wang and Lu (2001) introduced their work on the
relationship between the onset of sand production and equivalent plastic strain by using a coupled
reservoir-geomechanics model. Yi et al. (2004) propose a sanding onset prediction model that can
analytically calculate critical pressure drawdown by using a set of material-flow parameters.
Oluyemi and Oyemeyin (2010) present an analytical model for the prediction of critical pressure
drawdown based on Hoek-Brown failure criterion instead of Mohr-Coulomb criterion. The terms
“equivalent plastic strain” and “von Mises stress” are two major mechanical variables used in
plastic analysis (Dassault Systems, 2012) and are employed in the discussions of plasticity-related
contents in the following sections.
Porous-elastoplastic consolidation analysis of the perforation tunnel around a wellbore is the
theoretical basis of sand production prediction. In the recent years, various researchers have
contributed efforts to this topic.
A few researchers investigated the numerical calculation of sanding and erosion of weak
formations related to the wellbore only (Shen, 2011; Kim and Sharma, 2012; Pacheco et al., 2009;
Bai et al., 2011). Wang et al. (2005) present studies on the two-dimensional (2D) numerical
calculation of sanding and erosion related to both open-hole and cased-hole completions. Zhang et
al. (2007) study sanding for both open-holes and cased-holes with an analytical method and a 3D
numerical method. Volonté et al. (2013) investigated sanding problems using a 3D numerical
method with the numerical scheme proposed by Zhang et al. (2007).
In general, all of these calculations of sanding prediction were basically performed in a plasticity-
based manner. In other words, if no plasticity occurs around the borehole and perforation tunnel,
then the risk of sanding is zero. If plastic strain occurs, a risk of sanding exists. The degree of
sanding risk depends on the amount of equivalent plastic strain at each material point. If plastic
strain occurs on a large area around the borehole for an open-hole completion and around the
perforation tunnel for a cased-hole completion, then the sanding potential is high. For cased-hole
completions, because of the complexity of stress distribution, the calculation of sanding prediction
has to be performed using the 3D finite element method.
According to references and engineering observations, the critical value of equivalent plastic strain
depends on 1) formation strength properties; 2) formation pore pressure; 3) geostress tensor,
including both mean stress and stress deviator; 4) grain size; 5) formation thickness and other
geometrical parameters; and 6) other factors.
Also, the CVPDD depends on the type of completion used—open-hole or casing. For cased-hole
completions, which corresponds to a casing completion, the dual stress concentration around the
perforation tunnel makes the calculation more complicated than for an open-hole completion. This
point will be further illustrated through the numerical solution of geostress in the validation
example in the next section.
To better understand the plastic strain generated in each processes, it is necessary to be aware of
the details of the perforating process. The process of creating the perforation tunnel is a
complicated dynamic process. A perforation tunnel is created by firing a perforation gun in an
environment in which the bottom-hole is being filled with fluid. As the perforation gun fires a set
of perforation bullets, each bullet will perforate through the casing wall and create a perforation
2016 Science in the Age of Experience 3 http://www.3ds.com/events/science-in-the-age-of-experience
tunnel into the sand formation. The bullet remains at the location where it loses momentum and its
speed becomes zero. Because of discrepancies in stiffness between the steel casing and the weak
sand formation, at the interface between the exit of the casing wall and entry of the sand, the
diameter of the tunnel in the sand will drastically increase. With an increase in the depth the bullet
travels through the sand formation, the diameter of the perforation tunnel rapidly decreases to a
regular value, which is close to the diameter of the bullet. In this process, the formation at the
location of and surrounding the perforation tunnel is squeezed plastically. This process, from
firing the bullet to forming the perforation tunnel, is difficult to reproduce in detail with numerical
modeling. However, it is not necessary to simulate this process in detail. For the purpose of
sanding analysis, it is most important to achieve an accurate stress field around the perforation
tunnel, which is used as input. Besides, the plastic strain occurring during the perforation process
is basically caused by squeezing or “compaction strain” and thus has no significant impact on the
sequential process of pressure drawdown. Consequently, two points can be concluded here: 1) the
plastic strain ε̅0p
obtained in the numerical calculation of the process of perforating the tunnel is not
true, although its stress concentration is true; 2) The amount of ε̅0p should be separated from the
total value of plastic strain occurring during the process of pressure drawdown to obtain an
accurate estimation of sanding risks.
With regards to the references cited previously, major disadvantages of the existing methods for
prediction of CVPDD for a cased borehole include the following: 1) no reported case exists where
a stress solution captures the dual stress-concentration phenomenon around the borehole and
perforation tunnel. These two stress concentration regions overlap each other at the region where
the perforation tunnel intersects the borehole. The accuracy of solutions of CVPDD obtained with
current methods is low; 2) plastic strain caused by the perforation process is not distinguished and
subtracted from the plastic strain caused by pressure drawdown. Consequently, conclusions made
on the basis of the total value of plastic strain are not precise.
This work provides a solution of CVPDD that overcomes the aforementioned disadvantages, and
thus this solution’s accuracy and efficiency are better and higher than for those obtained with other
existing methods.
2. Numerical scheme for sanding prediction
This work presents a simplified 3D numerical scheme for the calculation of CVPDD for wellbores
with casing completions in weak sand formations. This numerical scheme simulates all of the
major steps that significantly impact the values and distribution of the stress concentration around
both the borehole and perforation tunnels. These processes include the following:
1. Drilling process of the wellbore under given drilling mud weight;
2. Casing installation and cementing;
3. Process of perforating tunnels; and
4. The process of pressure drawdown.
Except for those essential assumptions usually adopted in Continuum Mechanics, such as
regarding the sand formation as a continuum, etc., simplifications being introduced in the
simplified numerical model of this work are as follows:
4 2016 Science in the Age of Experience http://www.3ds.com/events/science-in-the-age-of-experience
1. The drilling process of the wellbore is modeled as “element removal,” in which part of
the formation, represented by a set of finite element mesh, is removed from the entire
body of the model, and the pressure of mud weight is applied to the borehole surface to
maintain wellbore stability.
2. Casing installation and the cementing process are jointly represented by the introduction
of a set of displacement constraints and non-permeable boundary conditions on the
borehole surface.
3. The process of creating perforation tunnels is modeled as “element removal,” in which
the part of the formation of the perforation tunnel represented by a set of finite element
mesh is removed from the entire body of the model. Pressure of the bottom-hole fluid is
applied to the surface of the tunnel. No dynamic process is simulated.
4. Only one pair of perforation tunnels is included in the submodel of the analysis. This
simplification is made on the basis of the primary analysis results. It was determined that
the plastic region around one perforation tunnel does not connect to the plastic region of a
neighboring tunnel hole in the process of pressure drawdown. Therefore, this is a
reasonable simplification that captures the poro-elastoplastic mechanical behaviour of the
formation around a perforation tunnel with a minimized computational burden.
It should be noted here that the choice of the direction of the perforation tunnels in the model
impact the solution of the CVPDD. The solution of CVPDD obtained with the perforation tunnel
whose axial direction is in the direction of minimum horizontal stress (Sh) is lower than the one
obtained with a perforation tunnel laying in the direction of maximum horizontal stress (SH).
To achieve high accuracy as well as high efficiency, the numerical scheme proposed here adopts a
submodeling technique to numerically calculate the initial geostress field around the perforation
tunnels and borehole.
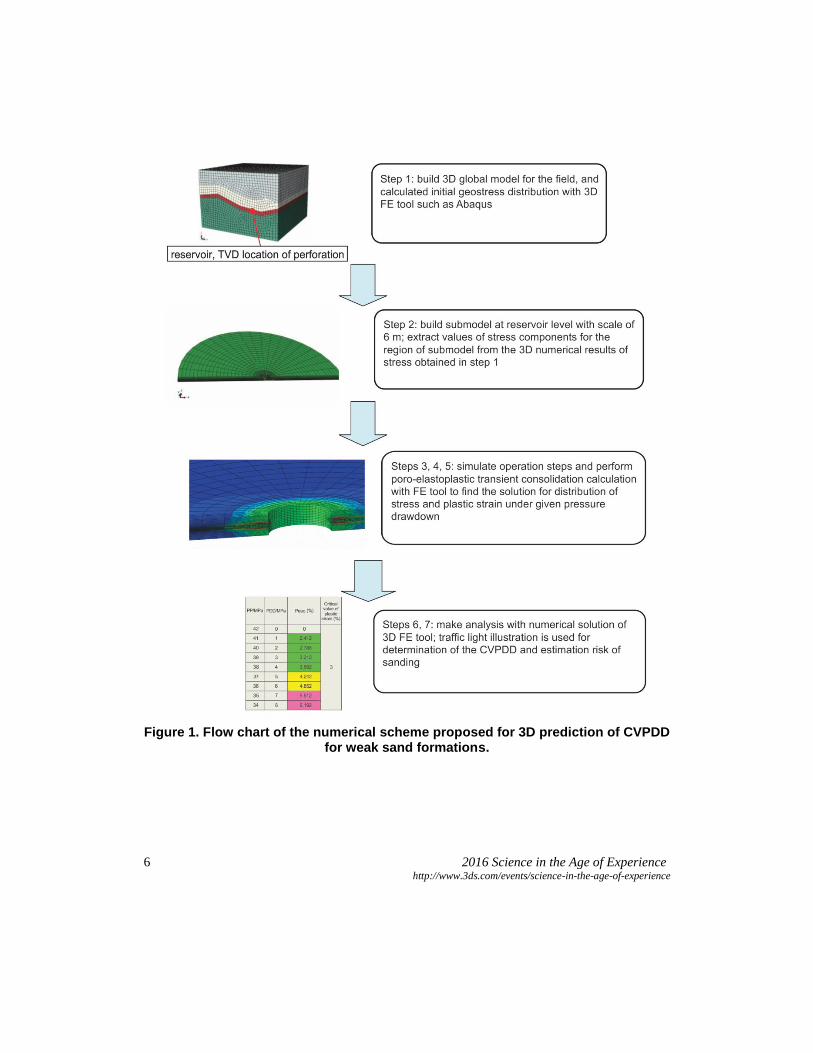
Fig. 1 illustrates the workflow and steps of this 3D numerical scheme for the calculation of
CVPDD in weak sand formations.
Details of the numerical scheme are described as follows:
Step 1: Build a 3D global model for the field and calculate initial geostress distribution
using 3D finite element tools, such as Abaqus software. Usually, the scale of the field
model is in kilometers.
Step 2: Build a submodel at the reservoir level scaled in meters. The center of the
submodel should be located at the position where the perforation section resides. Values
of stress components and displacement vectors at locations of submodel external surfaces
should be subtracted from the 3D numerical results of the field model obtained in Step 1
and applied as boundary conditions to the submodel.
Step 3: Simulate the wellbore drilling process with “element removal,” where part of the
formation of the wellbore is removed and pressure of the drilling mud is applied to the
wellbore surface that appears after the removal operation.
Step 4: Simulate the tunnel perforating process in the formation with “element removal,”
where part of the formation of the perforation tunnel is removed and fluid pressure is
2016 Science in the Age of Experience 5 http://www.3ds.com/events/science-in-the-age-of-experience
applied on the created surface of the tunnel. Also, the pore pressure boundary condition is
applied to the surface of the perforation tunnel.
Step 5: Apply a set of values of pressure drawdown to the surface of the perforation
tunnel and perform the calculation of a transient consolidation process with a coupled
hydro-mechanical finite element tool, such as Abaqus software.
Step 6: Analyze the value of equivalent plastic strain generated by each given value of
the set of pressure drawdown. This value is the amount of increment of plastic strain and
equals the amount of total plastic strain minus the plastic strain generated in Step 4.
Step 7: Compare the value of plastic strain generated by pressure drawdown, p ,with the
specific critical value of equivalent plastic strain p
c . If p > p
c , then the value of
pressure drawdown is greater than the CVPDD; and if p < p
c , then the value of
pressure drawdown is less than the CVPDD. The value of CVPDD is the pressure
drawdown, which makes its generated plastic strain p = p
c .
The critical value of equivalent plastic strain p
c is a material parameter. Its value depends on
grain size, mineral contents, permeability, porosity, saturation, as well as lithological history of the
formation investigated, etc. It can be calibrated from the existing sanding phenomena.
3. Example of validation
The data used in the numerical example in the following is for workflow illustration purposes
only.
A case from an oil field in offshore Gulf of Mexico was chosen to illustrate the numerical scheme
for accurate calculation of CVPDD using the simplified 3D numerical model.
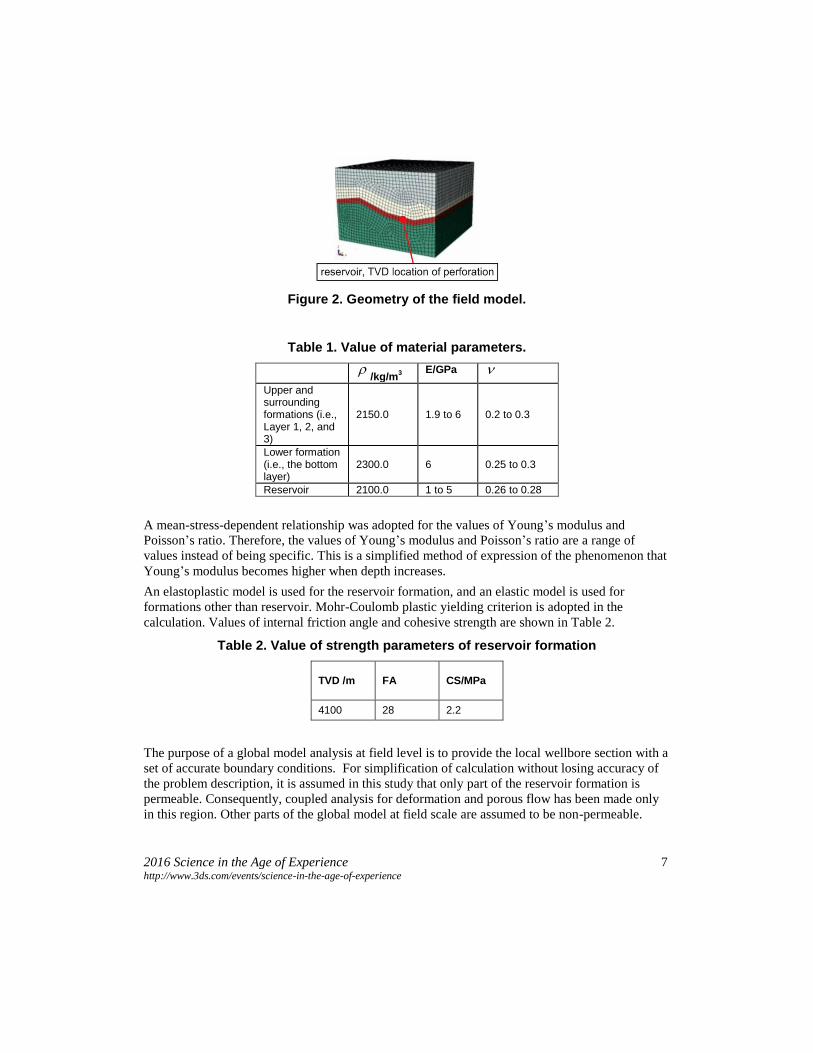
The field-scale model is shown in Fig. 2. The total depth of the model is 3000 m, width is 5000 m,
and length is 5000 m. The model uses four vertical layers of formations, as shown in Fig.2. The
reservoir layer that ranges from 50 to 150 m thick is located in the lower part of the model and is
the third layer. The lithology of the reservoir formation is Middle Miocene. The center of the
wellbore’s perforation section is at 4100 m true vertical depth (TVD).
3.1 Values of material parameters
A simplified model and four layer types were adopted, including the upper formation, lower
formation, the formation surrounding the salt, and the salt body. The parameters are listed in Table
1.
6 2016 Science in the Age of Experience http://www.3ds.com/events/science-in-the-age-of-experience
Figure 1. Flow chart of the numerical scheme proposed for 3D prediction of CVPDD for weak sand formations.
2016 Science in the Age of Experience 7 http://www.3ds.com/events/science-in-the-age-of-experience
Figure 2. Geometry of the field model.
Table 1. Value of material parameters.
/kg/m
3
E/GPa
Upper and surrounding formations (i.e., Layer 1, 2, and 3)
2150.0 1.9 to 6 0.2 to 0.3
Lower formation (i.e., the bottom layer)
2300.0 6 0.25 to 0.3
Reservoir 2100.0 1 to 5 0.26 to 0.28
A mean-stress-dependent relationship was adopted for the values of Young’s modulus and
Poisson’s ratio. Therefore, the values of Young’s modulus and Poisson’s ratio are a range of
values instead of being specific. This is a simplified method of expression of the phenomenon that
Young’s modulus becomes higher when depth increases.
An elastoplastic model is used for the reservoir formation, and an elastic model is used for
formations other than reservoir. Mohr-Coulomb plastic yielding criterion is adopted in the
calculation. Values of internal friction angle and cohesive strength are shown in Table 2.
Table 2. Value of strength parameters of reservoir formation
TVD /m FA CS/MPa
4100 28 2.2
The purpose of a global model analysis at field level is to provide the local wellbore section with a
set of accurate boundary conditions. For simplification of calculation without losing accuracy of
the problem description, it is assumed in this study that only part of the reservoir formation is
permeable. Consequently, coupled analysis for deformation and porous flow has been made only
in this region. Other parts of the global model at field scale are assumed to be non-permeable.
8 2016 Science in the Age of Experience http://www.3ds.com/events/science-in-the-age-of-experience
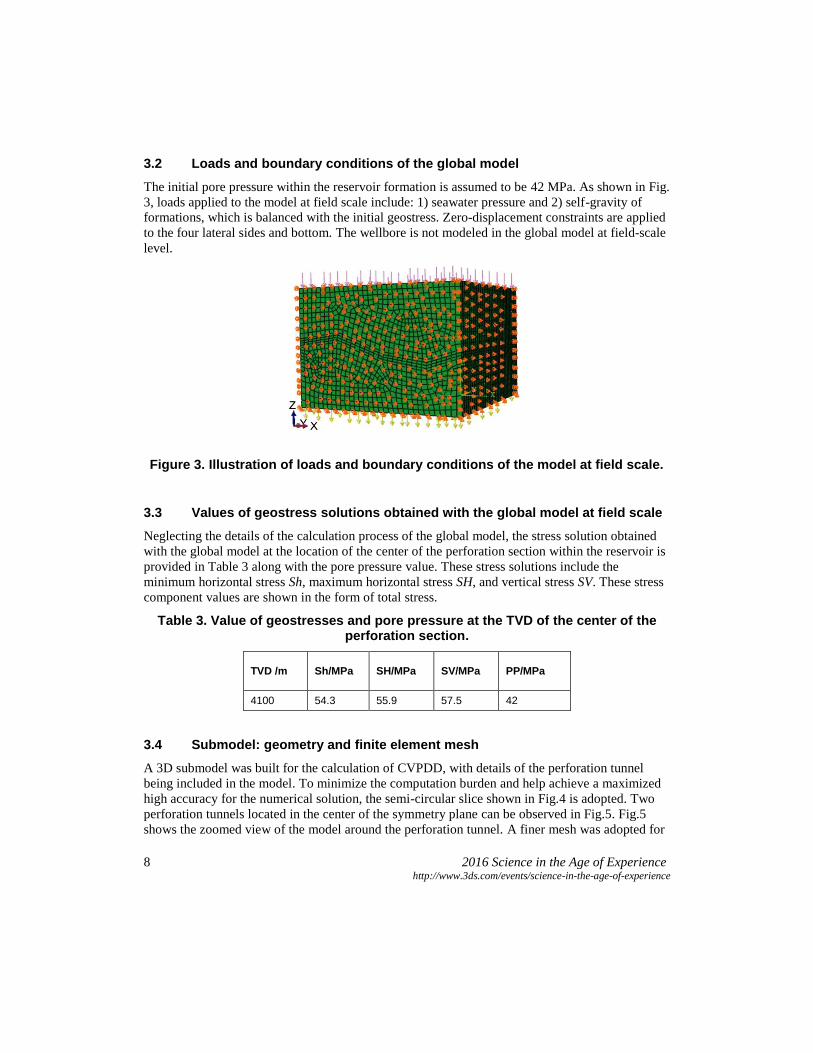
3.2 Loads and boundary conditions of the global model
The initial pore pressure within the reservoir formation is assumed to be 42 MPa. As shown in Fig.
3, loads applied to the model at field scale include: 1) seawater pressure and 2) self-gravity of
formations, which is balanced with the initial geostress. Zero-displacement constraints are applied
to the four lateral sides and bottom. The wellbore is not modeled in the global model at field-scale
level.
Figure 3. Illustration of loads and boundary conditions of the model at field scale.
3.3 Values of geostress solutions obtained with the global model at field scale
Neglecting the details of the calculation process of the global model, the stress solution obtained
with the global model at the location of the center of the perforation section within the reservoir is
provided in Table 3 along with the pore pressure value. These stress solutions include the
minimum horizontal stress Sh, maximum horizontal stress SH, and vertical stress SV. These stress
component values are shown in the form of total stress.
Table 3. Value of geostresses and pore pressure at the TVD of the center of the perforation section.
TVD /m Sh/MPa SH/MPa SV/MPa PP/MPa
4100 54.3 55.9 57.5 42
3.4 Submodel: geometry and finite element mesh
A 3D submodel was built for the calculation of CVPDD, with details of the perforation tunnel
being included in the model. To minimize the computation burden and help achieve a maximized
high accuracy for the numerical solution, the semi-circular slice shown in Fig.4 is adopted. Two
perforation tunnels located in the center of the symmetry plane can be observed in Fig.5. Fig.5
shows the zoomed view of the model around the perforation tunnel. A finer mesh was adopted for
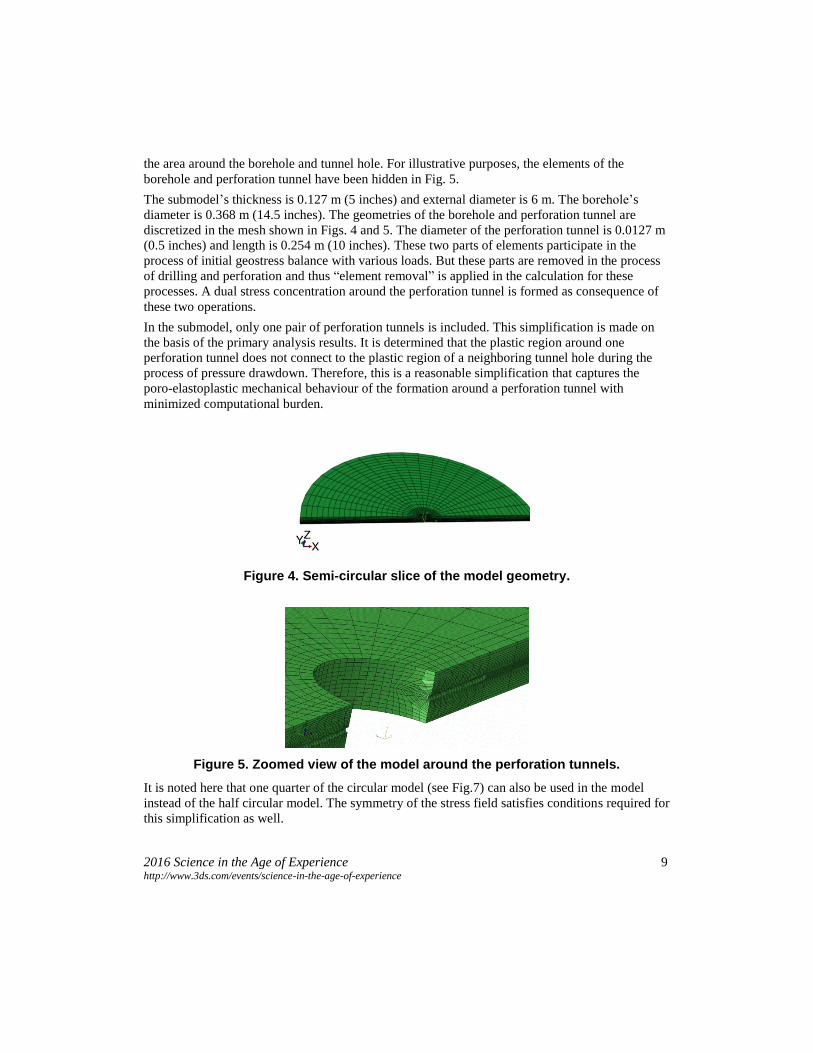
2016 Science in the Age of Experience 9 http://www.3ds.com/events/science-in-the-age-of-experience
the area around the borehole and tunnel hole. For illustrative purposes, the elements of the
borehole and perforation tunnel have been hidden in Fig. 5.
The submodel’s thickness is 0.127 m (5 inches) and external diameter is 6 m. The borehole’s
diameter is 0.368 m (14.5 inches). The geometries of the borehole and perforation tunnel are
discretized in the mesh shown in Figs. 4 and 5. The diameter of the perforation tunnel is 0.0127 m
(0.5 inches) and length is 0.254 m (10 inches). These two parts of elements participate in the
process of initial geostress balance with various loads. But these parts are removed in the process
of drilling and perforation and thus “element removal” is applied in the calculation for these
processes. A dual stress concentration around the perforation tunnel is formed as consequence of
these two operations.
In the submodel, only one pair of perforation tunnels is included. This simplification is made on
the basis of the primary analysis results. It is determined that the plastic region around one
perforation tunnel does not connect to the plastic region of a neighboring tunnel hole during the
process of pressure drawdown. Therefore, this is a reasonable simplification that captures the
poro-elastoplastic mechanical behaviour of the formation around a perforation tunnel with
minimized computational burden.
Figure 4. Semi-circular slice of the model geometry.
Figure 5. Zoomed view of the model around the perforation tunnels.
It is noted here that one quarter of the circular model (see Fig.7) can also be used in the model
instead of the half circular model. The symmetry of the stress field satisfies conditions required for
this simplification as well.
10 2016 Science in the Age of Experience http://www.3ds.com/events/science-in-the-age-of-experience
The reason for choosing a pair of perforation tunnels along with a half circular model is that the
half circular model provides a better visualization of the numerical solution. Therefore, the
decision is made on the basis of better visualization of the numerical results.
Loads of the model include 1) overburden pressure applied on the top surface of the submodel and
2) pressure loading to the tunnel surface during the pressure drawdown.
The value of overburden pressure applied on the top surface of the model is 57.5 MPa, which
equals the value of vertical stress SV.
Pressure drawdown is simulated by varying the pore pressure boundary condition at the
perforation tunnel surface along with varying the pressure applied on the tunnel surface as traction
pressure.
Displacement constraints on all surfaces, except the inner borehole surface and perforation tunnel
surfaces, are derived from the numerical results of the global model at field scale, shown in Fig.2.
On the surface of the borehole, displacement constraints are applied to simulate the rigidity of the
casing and cementing during pressure drawdown.
A pressure drawdown set is subsequently applied on the surface of the perforation tunnels
corresponding to various values of pressure drawdown. This sets the pore pressure boundary
condition at the surfaces of perforation tunnels.
Gravity load and initial stress are applied to the entire submodel. Also, surface pressures are
subsequently applied on the surfaces of the perforation tunnels corresponding to various values of
pressure drawdown.
3.5 Submodel: numerical results of plastic strain under given pressure drawdown
With the set of data values in Tables 1, 2, and 3, 3D poro-elastoplastic calculations were
performed with the submodel shown in Figs. 4 and 5. The steps suggested previously are used in
the calculation.
Fig. 6 shows the dual stress-concentration phenomenon at a pressure drawdown of 3 MPa. Stress
concentration occurs around the borehole resulting from drilling, and a secondary stress
concentration appears in the area where the perforation tunnel penetrates through the stress
concentration area formed by drilling. This dual stress-concentration results in the value of stress
in the area close to the exit of the tunnel being significantly higher than the stress value away from
the exit of the tunnel. The term “S, Mises” in Fig. 6 stands for the von Mises stress, which is a
stress intensity index used for the calculation of plasticity.
Fig. 7 shows the distribution of equivalent plastic strain resulting from the pressure drawdown
together with the impact of drilling perforating. It can be observed that, because of the stress
concentration around borehole, the contour of total plastic strain appears in a range that is much
larger than the diameter of the tunnel diameter. Also, the value of plastic strain in the section close
to the exit of the tunnel is much larger than in the area away from the exit. This phenomenon can
also be explained by the dual-stress-concentration. The term PEEQ in Fig. 7 stands for the
equivalent plastic strain, which is a strain intensity index used in the calculation of plasticity.

2016 Science in the Age of Experience
11 http://www.3ds.com/events/science-in-the-age-of-experience
Figure 6. Visualization of the dual-stress-concentration phenomenon at a pressure drawdown of 3 MPa (zoomed and cut view).
Figure 7. Distribution of total equivalent plastic strain (zoomed view).

12 2016 Science in the Age of Experience http://www.3ds.com/events/science-in-the-age-of-experience
Table 4. Value of pore pressure drawdown and numerical result of plastic strain.
PP/MPa PDD/MPa PEEQ (%) Total PEEQ PEEQ CVPS /%
42 0 0 0.07138 0
3
41 1 2.412 0.095 0.02412
40 2 2.788 0.09926 0.02788
39 3 3.212 0.1035 0.03212
38 4 3.692 0.1083 0.03692
37 5 4.242 0.1138 0.04242
36 6 4.852 0.1199 0.04852
35 7 5.512 0.1265 0.05512
34 8 6.192 0.1333 0.06192
Table 4 provides values of equivalent plastic strain together with their corresponding value of
pressure drawdown. The critical value of equivalent plastic strain (CVPS) is given as 0.03, which
is alternatively expressed as 3%. With the traffic light system introduced in the illustration, the
pressure drawdown value at which the plastic strain value is less than CVPS is highlighted in
green; the pressure drawdown value at which the plastic strain value is more than CVPS but the
difference is less than 1% is highlighted in yellow; and the pressure drawdown value at which the
plastic strain value is 1% greater than the CVPS is highlighted in red.
The resulting CVPDD is 2 MPa. A pressure drawdown less than 2 MPa is safe and should be free
from sanding. For pressure drawdown values higher than CVPDD but the amount of resultant
plastic strain is limited to 1% above the CVPS, the sanding should be controllable, and
consequently related sand protection measures, such as screen net, etc., are suggested. Pressure
drawdown higher than CVPDD when the amount of resultant plastic strain 1% above CVPS is too
high to use and poses a risk of collapse of the perforation tunnel.
4. Conclusions
An accurate solution for CVPDD is crucial for designing completions in wells in weak sand
formations. The degree of sanding risk determines the choice of sand protection devices required.
Also, the CVPDD is important for designing the production plan. An optimized pressure
drawdown value can help maximum production rates and minimize damage to the production
string system caused by sanding.
This work establishes a simplified 3D numerical scheme for calculation of CVPDD. Compared to
other existing methods, CVDD solutions obtained using this method are more accurate and the
calculation process is more efficient. Principal characteristics of the proposed simplified model
and workflow include the following:
This work uses a global model at field scale and submodel at borehole scale to calculate
geostress in the region and neighborhood of the wellbore. In this way, local stress related
2016 Science in the Age of Experience
13 http://www.3ds.com/events/science-in-the-age-of-experience
to the geostructure, such as syncline or anticline, are taken into account in the modeling.
This is one of the bases to help ensure the accuracy of the geostress solutions.
This work uses specific numerical techniques and procedures to help ensure the accuracy
of the stress concentration around the borehole caused by the process of drilling. These
techniques include 1) sequential simulation of the actual drilling process and perforation
process and 2) applying proper boundary conditions to the surfaces created by these
processes.
This work can capture the dual stress-concentration phenomenon around perforation
tunnels and uses this stress field as a basis for the calculation of CVPDD. Solutions for
accurate stress fields obtained with measures described in the first two list items help
ensure the accuracy of the solution for CVPDD.
This work uses a submodel that consists of only one pair of perforation tunnels. This
simplification is made on the basis of the primary analysis results. It is determined that
the plastic region around one perforation tunnel does not connect to the plastic region of a
neighboring tunnel hole during the process of pressure drawdown. As such, the efficiency
of calculation is better than for models that consist of multiple perforation tunnels.
5. References
1. Bai, M., C. Santana, and X.P. Shen, “A Comprehensive Approach in Predicting Excessive
Sand Production,” ISRM 11-0301, ISRM Congress, Beijing, China, 21–23 October, 2011.
2. Dassault Systems. Abaqus Analysis User’s Manual. Vol. 3: Materials, Version 6.8, Dassault
Systems: Vélizy-Villacoublay, France, 19.3.1-17–19.3.2-14.
3. Kim, A.S., and M.M. Sharma, “A Predictive Model for Sand Production in Realistic
Downhole Condition,” ARMA-2012-314, 46th U.S. Rock Mechanics/Geomechanics
Symposium, Chicago, Illinois, USA, 24–27 June, 2012.
4. Oluyemi, G.F., and M. B. Oyemeyin, “Analytical Critical Drawdown (CDD) Failure Model
for Real Time Sanding Potential Prediction Based on Hoek and Brown Failure Criterion,”
Journal of Petroleum and Gas Engineering, 1(2): 16–27, 2010.
5. Pacheco, E., M.Y. Soliman, R. Zepeda, and J. Wang, “Sanding Prediction in a Gas Well
Offshore Mexico using a Numerical Simulator,” SPE-122962-MS, Latin American and
Caribbean Petroleum Engineering Conference, Cartagena de Indias, Colombia, 31 May–3
June, 2009.
6. Papamichos, E., and M. Stavropoulou, “An Erosion-Mechanical Model for Sand Production
Rate Prediction,” International Journal of Rock Mechanics & Mining Sciences, 35: 531–532,
1998.
7. Papamichos, E., and EM. Malmanger, “A Sand-Erosion Model for Volumetric Sand
Predictions in a North Sea Reservoir,” SPE 69841, Reservoir Evaluation & Engineering, 45:
44–50, 2001.
8. Shen, X., “Case Studies on 3-Dimensional Numerical Prediction of Critical Pressure
Drawdown for Wells in Weak Formations,” ARMA 11-177, 45th US Rock Mechanics /
Geomechanics Symposium, San Francisco, California, USA, June 26–29, 2011.
14 2016 Science in the Age of Experience http://www.3ds.com/events/science-in-the-age-of-experience
9. van den Hoek, P.J., G.M.M. Hertogh, A.P. Kooijman, Ph. de Bree, C.J. Kenter, and E.
Papamichos, “A New Concept of Sand Production Prediction: Theory and Laboratory
Experiments,” SPE 36418, SPE Annual Technical Conference and Exhibition, Denver,
Colorado, USA, 6–9 October, 1996.
10. Volonté, G., F. Scarfato, and M. Brignoli, “Sand Prediction: A Practical Finite-Element 3D
Approach for Real Field Applications,” SPE-134464-PA, SPE Production & Operations,
28(01): 95–108, 2013.
11. Wang, Y., and B. Lu, “A Coupled Reservoir-Geomechanics Model and Applications to
Wellbore Stability and Sand Prediction,” SPE 69718, SPE International Thermal Operations
and Heavy Oil Symposium, Porlamar, Margarita Island, Venezuela, 12–14 March, 2001.
12. Wang, J., R.G. Wan, A. Settari, and D. Walters, “Prediction of Volumetric Sand Production
and Wellbore Stability Analysis of a Well at Different Completion Schemes,” RMA/USRMS
05-842, 40th U.S. Symposium on Rock Mechanics (USRMS): Rock Mechanics for Energy,
Mineral and Infrastructure, Anchorage, Alaska, USA,25–29 June, 2005.
13. Yi, X., P.P. Valko, and J.E. Russell, “Predicting Critical Drawdown for the Onset of Sand
Production,” SPE 86555, SPE International Symposium and Exhibition on Formation
Damage Control, Lafayette, Louisiana, USA, 18–20 February, 2004.
14. Zhang, J., W.B. Standifird, and X. Shen, “Optimized Perforation Tunnel Geometry, Density
and Orientation to Control Sand Production,” SPE 107785, European Formation Damage
Conference, Scheveningen, The Netherlands, 30 May–1 June, 2007.