Embed Size (px)
Citation preview
A SIGNIFICANT CIGARETTE TAX RATE INCREASE IN IDAHO
WOULD PRODUCE A LARGE, SUSTAINED INCREASE
IN STATE TOBACCO TAX REVENUES
Frank J. Chaloupka Distinguished Professor
Department of Economics, College of Liberal Arts & Sciences
Division of Health Policy and Administration, School of Public Health
University of Illinois at Chicago
1747 West Roosevelt Rd., Room 558
Chicago, IL 60608
312-413-2287
Jidong Huang Health Policy Center
University of Illinois at Chicago
1747 West Roosevelt Rd., Room 351
Chicago, IL 60608
312-355-0195
February 24, 2011
About the Authors
Dr. Frank Chaloupka is a Distinguished Professor of Economics at the University of Illinois at
Chicago’s College of Liberal Arts & Sciences and its School of Public Health’s Division of Health
Policy and Administration. He also directs the University’s Health Policy Center, is a Research
Associate in the National Bureau of Economic Research’s Health Economics Program and Children’s
Research Program. He is the Director of ImpacTeen, a research program involving nationally-
recognized experts dedicated to studying youth tobacco use, other substance abuse, and other health
behaviors; and he is Co-Director of the International Tobacco Evidence Network, a group of
economists and other policy researchers focused on the economics of tobacco and tobacco control
globally. Dr Chaloupka has written numerous studies, book chapters, and other publications that
evaluate efforts to prevent and reduce tobacco use, with a special focus on the impact of cigarette and
other tobacco product tax increases.
Dr. Jidong Huang is a research specialist at the Health Policy Center of the University of Illinois at
Chicago working closely with Dr. Chaloupka on a variety of tobacco control policy focused analyses.
- 1 -
A SIGNIFICANT CIGARETTE TAX INCREASE IN IDAHO WOULD PRODUCE A LARGE,
SUSTAINED INCREASE IN STATE TOBACCO TAX REVENUES
Frank J. Chaloupka
Distinguished Professor of Economics
University of Illinois at Chicago
Jidong Huang
Health Policy Center
University of Illinois at Chicago
February 24, 2011
EXECUTIVE SUMMARY
State cigarette and other tobacco tax revenues are among the most predictable, steady, and reliable
revenues that states receive. While these revenues do decline gradually over time as smoking and
other tobacco use declines, the reductions in revenue are modest, predictable, and more than offset
by the related reductions in public and private sector health care costs and other economic costs
caused by smoking.
In general, state cigarette tax revenues increase sharply following a significant increase to a state’s
cigarette tax rates (despite the smoking declines prompted by the tax increase and any related
increases in smuggling or tax evasion), and then tend to decline slowly year to year as cigarette
smoking continues to go down in response to other factors (e.g. stronger public policies targeting
tobacco use). However, any decline in revenues from smoking reductions will be offset by related
declines in tobacco-related healthcare costs burdening the state. For instance, the Campaign for
Tobacco-Free Kids projects that an effectively implemented $1.25 per pack cigarette tax increase in
Idaho would raise more than $48 million new tax revenues while preventing nearly 12,500 youth
from becoming adult smokers, encouraging almost 7,800 adults to quit, and preventing as many as
6,000 future smoking-caused premature deaths. These reductions in tobacco use will significantly
reduce the $319 million the state currently spends each year treating diseases caused by smoking,
over $83 million of which is paid for through the state’s Medicaid program.
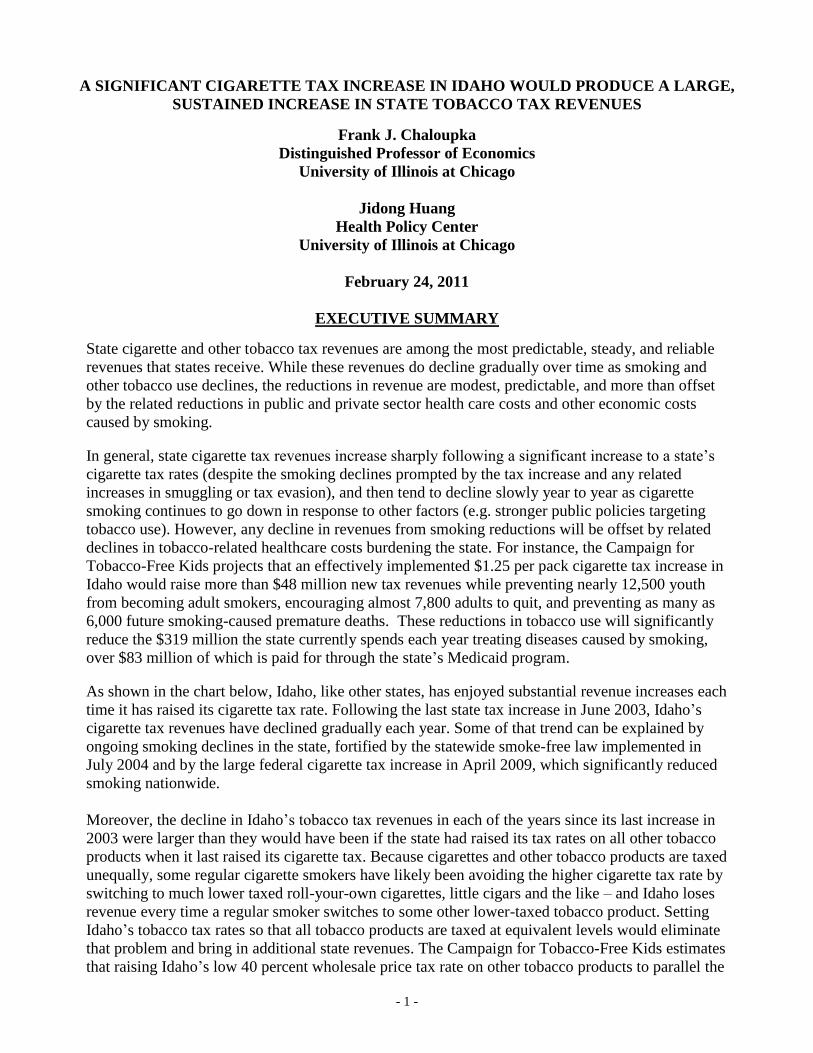
As shown in the chart below, Idaho, like other states, has enjoyed substantial revenue increases each
time it has raised its cigarette tax rate. Following the last state tax increase in June 2003, Idaho’s
cigarette tax revenues have declined gradually each year. Some of that trend can be explained by
ongoing smoking declines in the state, fortified by the statewide smoke-free law implemented in
July 2004 and by the large federal cigarette tax increase in April 2009, which significantly reduced
smoking nationwide.
Moreover, the decline in Idaho’s tobacco tax revenues in each of the years since its last increase in
2003 were larger than they would have been if the state had raised its tax rates on all other tobacco
products when it last raised its cigarette tax. Because cigarettes and other tobacco products are taxed
unequally, some regular cigarette smokers have likely been avoiding the higher cigarette tax rate by
switching to much lower taxed roll-your-own cigarettes, little cigars and the like – and Idaho loses
revenue every time a regular smoker switches to some other lower-taxed tobacco product. Setting
Idaho’s tobacco tax rates so that all tobacco products are taxed at equivalent levels would eliminate
that problem and bring in additional state revenues. The Campaign for Tobacco-Free Kids estimates
that raising Idaho’s low 40 percent wholesale price tax rate on other tobacco products to parallel the
- 2 -
proposed new $1.82 per pack cigarette tax rate would bring almost $3 million per year in new state
revenues on top of the new revenues from the cigarette tax increase.
Note: Data are for fiscal years ending June 30.
Whether or not Idaho increases its cigarette tax rate or creates tax equity among all tobacco
products, there are a number of other steps the state could take to protect or even increase its
cigarette tax revenues over time. For example, Idaho could implement high-tech tax stamps to
ensure that taxes are paid and to prevent cigarette smuggling and tax evasion. The state can also
minimize tobacco product smuggling and other tax evasion through such measures as making sure
smokers understand the state’s laws pertaining to tobacco tax evasion, increasing penalties for
smuggling and other tax evasion, and directing a portion of all penalties to help fund expanded
enforcement (which would bring in both more penalty payments and more tobacco tax revenues).
Despite the declines, Idaho is still receiving cigarette tax revenues in excess of $17 million per year
compared to what it received in the fiscal year before it last increased its cigarette tax rate in 2003.
That same basic pattern, with large amounts of new state revenues in every future year, would occur
again if Idaho increased its cigarette tax rate significantly effective at the start of fiscal 2012 – and
the new revenues would be even larger if Idaho also equalized all its tobacco product tax rates at the
same time.
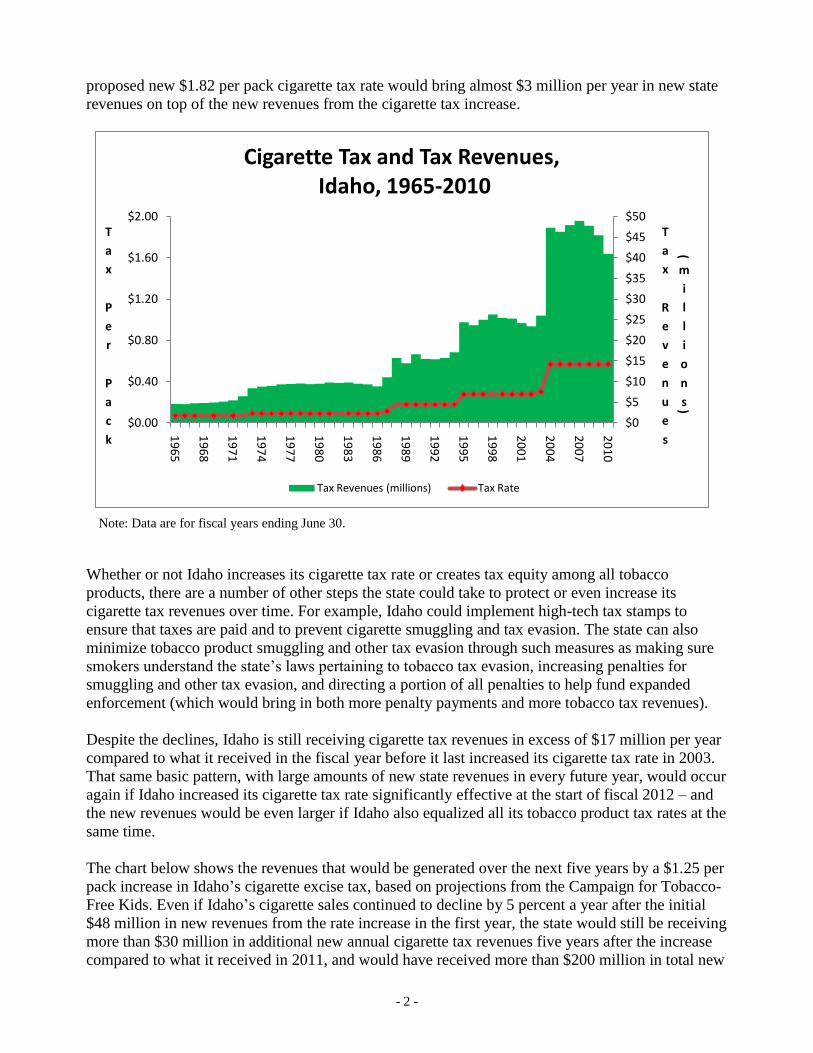
The chart below shows the revenues that would be generated over the next five years by a $1.25 per
pack increase in Idaho’s cigarette excise tax, based on projections from the Campaign for Tobacco-
Free Kids. Even if Idaho’s cigarette sales continued to decline by 5 percent a year after the initial
$48 million in new revenues from the rate increase in the first year, the state would still be receiving
more than $30 million in additional new annual cigarette tax revenues five years after the increase
compared to what it received in 2011, and would have received more than $200 million in total new
$0
$5
$10
$15
$20
$25
$30
$35
$40
$45
$50
$0.00
$0.40
$0.80
$1.20
$1.60
$2.00
19
65
19
68
19
71
19
74
19
77
19
80
19
83
19
86
19
89
19
92
19
95
19
98
20
01
20
04
20
07
20
10
T
a
x
R
e
v
e
n
u
e
s
(
m
i
l
l
i
o
n
s)
T
a
x
P
e
r
P
a
c
k
Cigarette Tax and Tax Revenues,Idaho, 1965-2010
Tax Revenues (millions) Tax Rate
- 3 -
cigarette excise tax revenues over that five year period compared to what it would receive with no
rate increase, even considering losses from cross-border sales, tax evasion, and smuggling.
Note: Data are for the fiscal year ending June 30.
Effective implementation of a $1.25 cigarette excise tax increase in Idaho includes an inventory, or
floor stocks, tax with the cigarette tax increase. This tax applies the difference in the old and new
tax rates to the products that wholesalers, distributors, and retailers have in stock when the rate
increase goes into effect, to prevent stockpiling. Such a tax ensures that the state receives all of the
revenues to which it is entitled. Moreover, making the new tax rate effective as soon as possible
after the enactment of the tax increase will further enhance the revenue impact by limiting the
period during which smokers are able to stock up on lower-taxed cigarettes and use them for
months after the increase went into effect.
In addition, small rate increases or a rate increase that is split into smaller multi-stage increases
would reduce the public health benefits and cost savings, and Idaho would not collect as much
revenue as from a one-time, larger rate increase. A small increase is more easily offset by tobacco
company price cuts and price-reducing promotions and would not generate as many public health
benefits or cost savings.
$0
$10
$20
$30
$40
$50
$60
$70
$80
$90
2003 2004 2005 2006 2007 2008 2009 2010 Est. 2011
Est. 2012
Est. 2013
Est. 2014
Est. 2015
Est. 2016
Cig
are
tte
Tax
Re
ven
ue
s (m
illio
ns)
Estimated Future Cigarette Tax Revenues, IdahoWithout 2012 Increase With $1.25 Increase
- 4 -
A SIGNIFICANT CIGARETTE TAX RATE INCREASE IN IDAHO
WOULD PRODUCE A LARGE, SUSTAINED INCREASE
IN STATE TOBACCO TAX REVENUES
Every state that has passed a significant cigarette tax increase has enjoyed a substantial, sustained
increase in its state cigarette tax revenues. This revenue increase occurs, despite the significant
declines in smoking rates and tax-paid cigarette sales caused by the cigarette tax rate increase,
because the increased tax per pack brings in much more new revenue than is lost by the declines in
the number of packs sold and taxed. Exhibits A and B show many examples from actual state
cigarette tax increases.
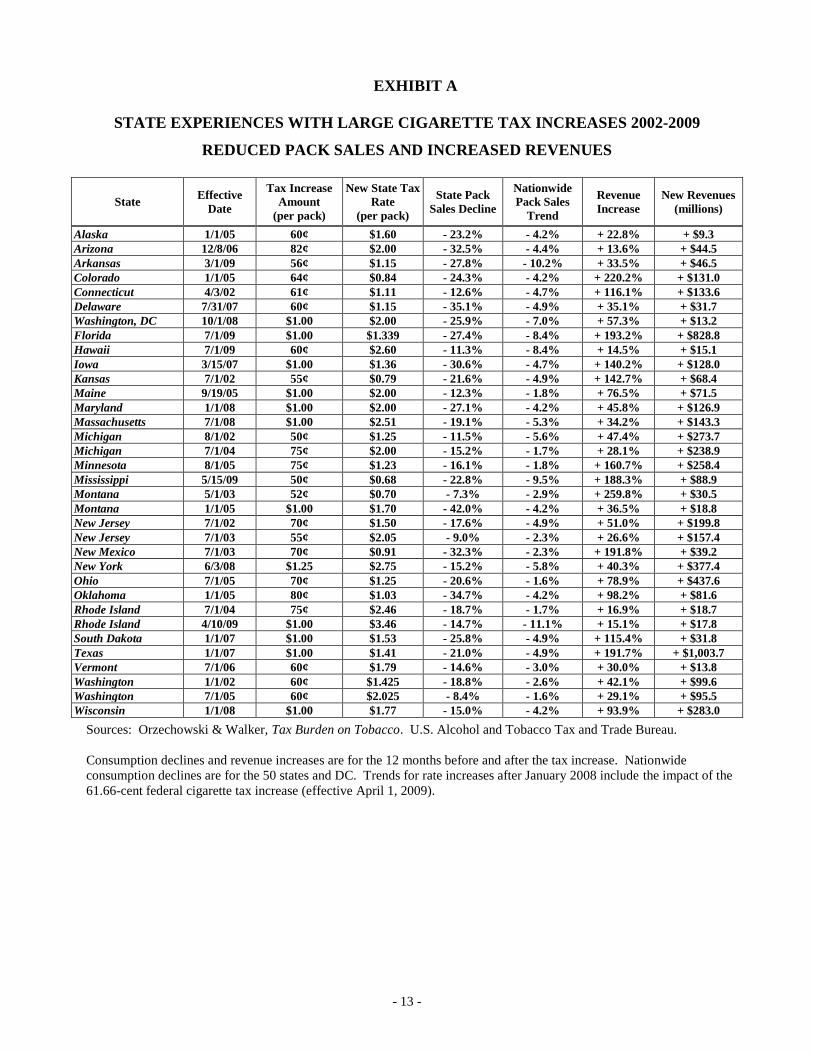
Exhibit A presents a list of significant state cigarette tax increases since 2002 (increases of 50 cents
or more per pack) and shows the amount of the tax increase, the decline in tax-paid cigarette sales,
compared to the decline in sales nationally over the same time period, and the revenue change from
the twelve months before the tax increase to the twelve months after the tax increase. In every state
that significantly increased its tax, there were both sharp reductions in total packs sold and large
increases in total net new revenues in the year following the rate increase, compared to the year
before it.
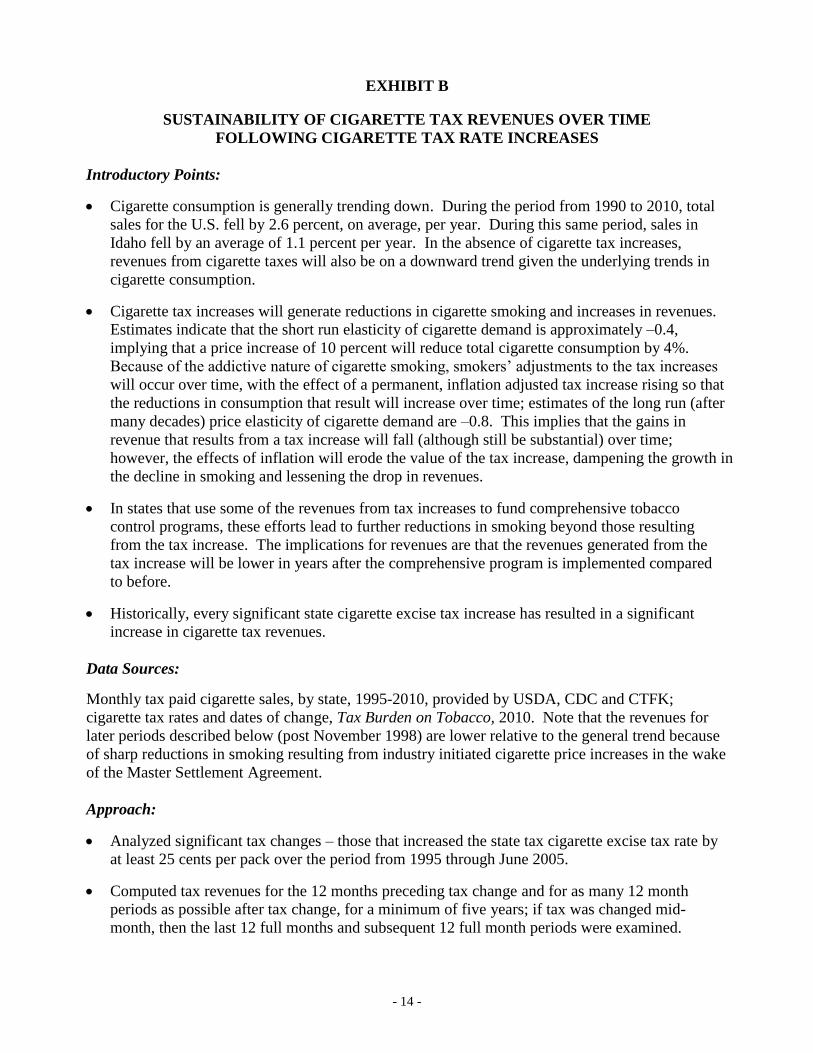
Exhibit B is a short report that examines the sustainability of revenues generated from cigarette tax
increases. This report considered every major cigarette tax increase between 1995 and 2005 and
looked at state cigarette tax revenues before the tax increase and for at least five years following the
increase, with analyses for states with and without well-funded comprehensive tobacco control
programs. In every state that raised its tax during that time period, cigarette tax revenues increased
significantly and remained much higher than revenues prior to the tax for many years after the tax
increase.
Accordingly, Exhibits A and B provide direct evidence from actual state experiences that confirms
that significant cigarette tax increases have always produced substantial amounts of new revenues
(compared to what the state would have received without the increase), both immediately and over
extended periods of time, and despite any and all related decreases in taxed state pack sales.
Cigarette and Other Tobacco Tax Revenues Are Much More Predictable and Stable Than
Many Other State Revenues
Year to year, state cigarette and other tobacco tax revenues are more predictable and less volatile
than most other state revenue sources, such as state personal income taxes or corporate income
taxes, which can vary considerably from year to year because of nationwide or regional recessions
or state economic slowdowns.
In contrast, sharp drops in cigarette or other tobacco tax revenues from one year to the next are rare,
in large part due to the addictive nature of cigarette smoking and other tobacco use. Long term
trends in tobacco use show modest declines from year to year, both nationally and at the state level.
These declines can be accelerated by comprehensive tobacco prevention efforts, but will generally
be no more than a few percentage points each year. The exception to this will be the large smoking
declines and related cigarette tax revenue declines that result from large nationwide increases in
cigarette prices, such as the large cigarette company price increases prompted by the 1998 Master
Settlement Agreement and the April 1, 2009 increase in federal excise taxes on cigarettes and other
- 5 -
tobacco products. The only other large year-to-year changes to state cigarette tax revenues are the
large revenue increases when a state significantly increases its own cigarette tax rates.
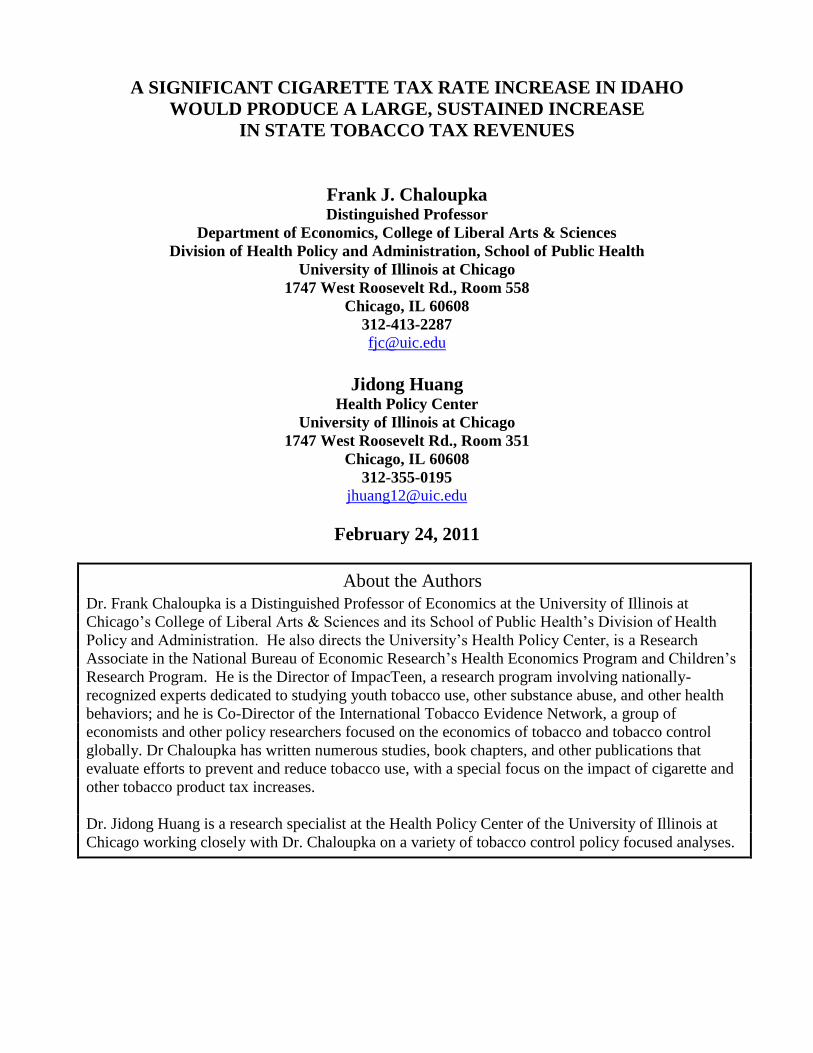
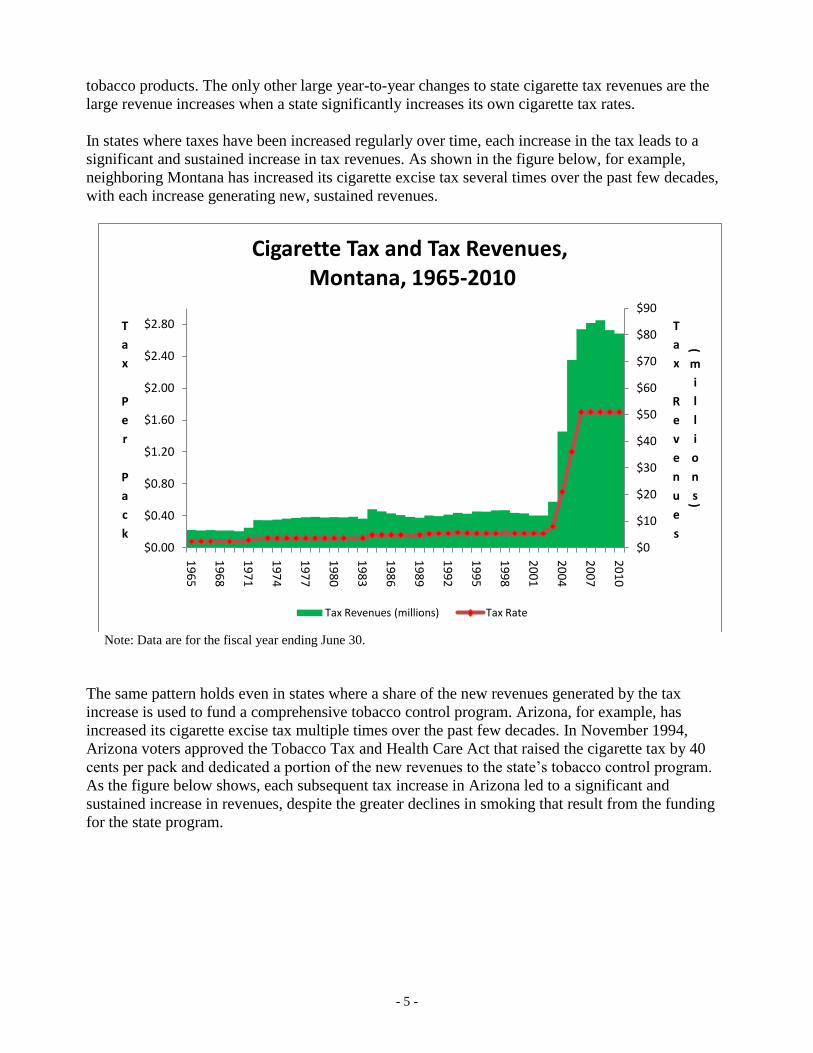
In states where taxes have been increased regularly over time, each increase in the tax leads to a
significant and sustained increase in tax revenues. As shown in the figure below, for example,
neighboring Montana has increased its cigarette excise tax several times over the past few decades,
with each increase generating new, sustained revenues.
Note: Data are for the fiscal year ending June 30.
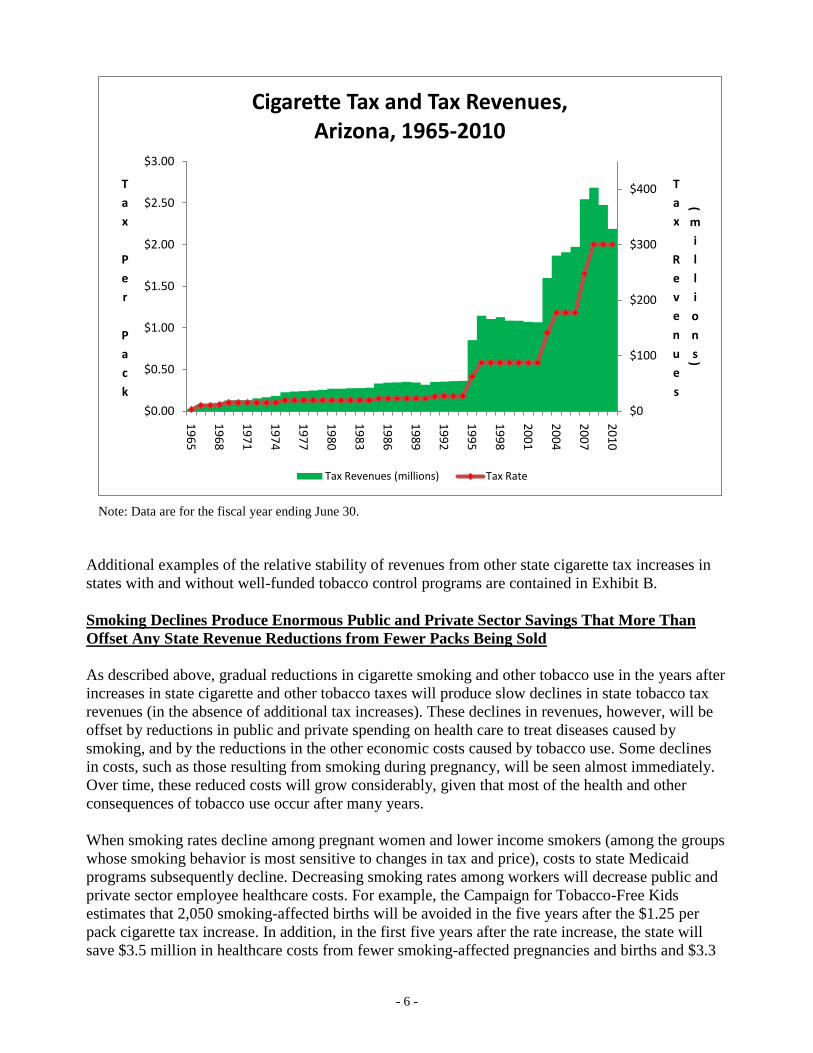
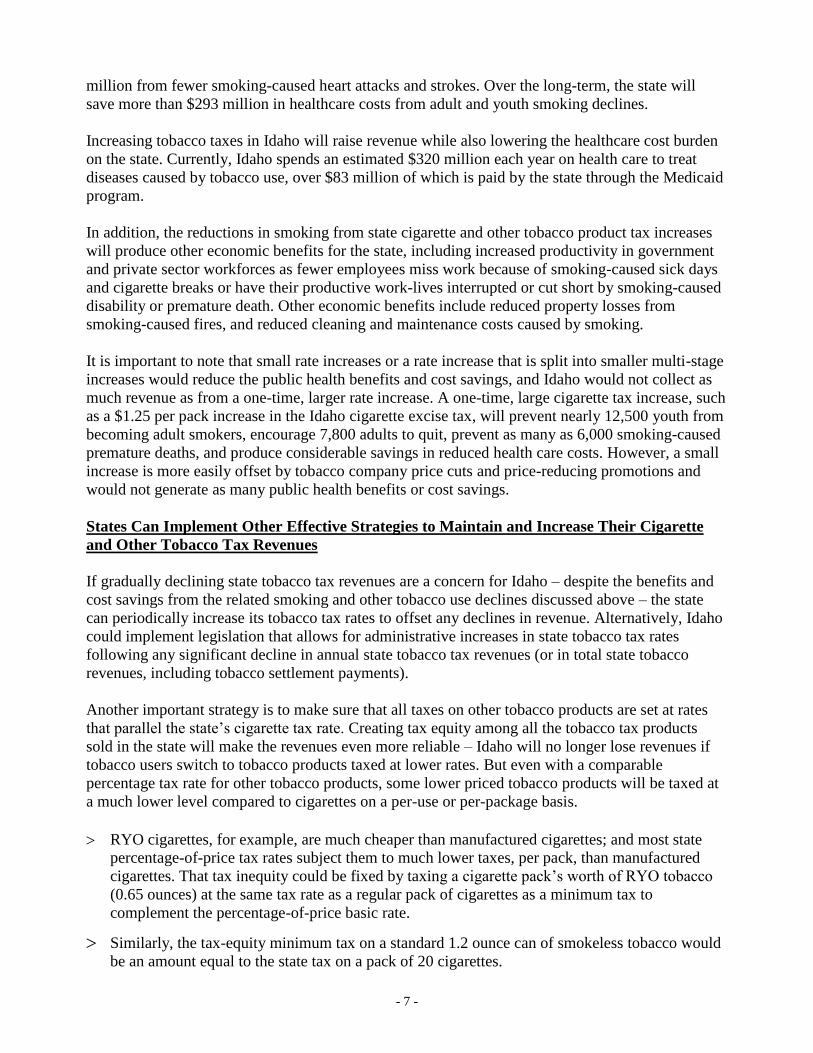
The same pattern holds even in states where a share of the new revenues generated by the tax
increase is used to fund a comprehensive tobacco control program. Arizona, for example, has
increased its cigarette excise tax multiple times over the past few decades. In November 1994,
Arizona voters approved the Tobacco Tax and Health Care Act that raised the cigarette tax by 40
cents per pack and dedicated a portion of the new revenues to the state’s tobacco control program.
As the figure below shows, each subsequent tax increase in Arizona led to a significant and
sustained increase in revenues, despite the greater declines in smoking that result from the funding
for the state program.
$0
$10
$20
$30
$40
$50
$60
$70
$80
$90
$0.00
$0.40
$0.80
$1.20
$1.60
$2.00
$2.40
$2.80
19
65
19
68
19
71
19
74
19
77
19
80
19
83
19
86
19
89
19
92
19
95
19
98
20
01
20
04
20
07
20
10
T
a
x
R
e
v
e
n
u
e
s
(
m
i
l
l
i
o
n
s)
T
a
x
P
e
r
P
a
c
k
Cigarette Tax and Tax Revenues,Montana, 1965-2010
Tax Revenues (millions) Tax Rate
- 6 -
Note: Data are for the fiscal year ending June 30.
Additional examples of the relative stability of revenues from other state cigarette tax increases in
states with and without well-funded tobacco control programs are contained in Exhibit B.
Smoking Declines Produce Enormous Public and Private Sector Savings That More Than
Offset Any State Revenue Reductions from Fewer Packs Being Sold
As described above, gradual reductions in cigarette smoking and other tobacco use in the years after
increases in state cigarette and other tobacco taxes will produce slow declines in state tobacco tax
revenues (in the absence of additional tax increases). These declines in revenues, however, will be
offset by reductions in public and private spending on health care to treat diseases caused by
smoking, and by the reductions in the other economic costs caused by tobacco use. Some declines
in costs, such as those resulting from smoking during pregnancy, will be seen almost immediately.
Over time, these reduced costs will grow considerably, given that most of the health and other
consequences of tobacco use occur after many years.
When smoking rates decline among pregnant women and lower income smokers (among the groups
whose smoking behavior is most sensitive to changes in tax and price), costs to state Medicaid
programs subsequently decline. Decreasing smoking rates among workers will decrease public and
private sector employee healthcare costs. For example, the Campaign for Tobacco-Free Kids
estimates that 2,050 smoking-affected births will be avoided in the five years after the $1.25 per
pack cigarette tax increase. In addition, in the first five years after the rate increase, the state will
save $3.5 million in healthcare costs from fewer smoking-affected pregnancies and births and $3.3
$0
$100
$200
$300
$400
$0.00
$0.50
$1.00
$1.50
$2.00
$2.50
$3.00
19
65
19
68
19
71
19
74
19
77
19
80
19
83
19
86
19
89
19
92
19
95
19
98
20
01
20
04
20
07
20
10
T
a
x
R
e
v
e
n
u
e
s
(
m
i
l
l
i
o
n
s)
T
a
x
P
e
r
P
a
c
k
Cigarette Tax and Tax Revenues,Arizona, 1965-2010
Tax Revenues (millions) Tax Rate
- 7 -
million from fewer smoking-caused heart attacks and strokes. Over the long-term, the state will
save more than $293 million in healthcare costs from adult and youth smoking declines.
Increasing tobacco taxes in Idaho will raise revenue while also lowering the healthcare cost burden
on the state. Currently, Idaho spends an estimated $320 million each year on health care to treat
diseases caused by tobacco use, over $83 million of which is paid by the state through the Medicaid
program.
In addition, the reductions in smoking from state cigarette and other tobacco product tax increases
will produce other economic benefits for the state, including increased productivity in government
and private sector workforces as fewer employees miss work because of smoking-caused sick days
and cigarette breaks or have their productive work-lives interrupted or cut short by smoking-caused
disability or premature death. Other economic benefits include reduced property losses from
smoking-caused fires, and reduced cleaning and maintenance costs caused by smoking.
It is important to note that small rate increases or a rate increase that is split into smaller multi-stage
increases would reduce the public health benefits and cost savings, and Idaho would not collect as
much revenue as from a one-time, larger rate increase. A one-time, large cigarette tax increase, such
as a $1.25 per pack increase in the Idaho cigarette excise tax, will prevent nearly 12,500 youth from
becoming adult smokers, encourage 7,800 adults to quit, prevent as many as 6,000 smoking-caused
premature deaths, and produce considerable savings in reduced health care costs. However, a small
increase is more easily offset by tobacco company price cuts and price-reducing promotions and
would not generate as many public health benefits or cost savings.
States Can Implement Other Effective Strategies to Maintain and Increase Their Cigarette
and Other Tobacco Tax Revenues
If gradually declining state tobacco tax revenues are a concern for Idaho – despite the benefits and
cost savings from the related smoking and other tobacco use declines discussed above – the state
can periodically increase its tobacco tax rates to offset any declines in revenue. Alternatively, Idaho
could implement legislation that allows for administrative increases in state tobacco tax rates
following any significant decline in annual state tobacco tax revenues (or in total state tobacco
revenues, including tobacco settlement payments).
Another important strategy is to make sure that all taxes on other tobacco products are set at rates
that parallel the state’s cigarette tax rate. Creating tax equity among all the tobacco tax products
sold in the state will make the revenues even more reliable – Idaho will no longer lose revenues if
tobacco users switch to tobacco products taxed at lower rates. But even with a comparable
percentage tax rate for other tobacco products, some lower priced tobacco products will be taxed at
a much lower level compared to cigarettes on a per-use or per-package basis.
RYO cigarettes, for example, are much cheaper than manufactured cigarettes; and most state
percentage-of-price tax rates subject them to much lower taxes, per pack, than manufactured
cigarettes. That tax inequity could be fixed by taxing a cigarette pack’s worth of RYO tobacco
(0.65 ounces) at the same tax rate as a regular pack of cigarettes as a minimum tax to
complement the percentage-of-price basic rate.
Similarly, the tax-equity minimum tax on a standard 1.2 ounce can of smokeless tobacco would
be an amount equal to the state tax on a pack of 20 cigarettes.
- 8 -
A similar cigarette pack tax amount tax could be placed on standard five-packs of cigarillos, blunts
and other small cigars. But states usually lose the most revenue from cigarettes being packaged and
sold as “little cigars” to escape the state’s higher tax on cigarettes. That problem can be eliminated by
amending the Idaho’s “cigarette” definitions in the tax code to reach any and all cigarettes, no matter
how they are labeled or packaged (without reaching any bona fide cigars). One way to do that would
be to add the following phrase to the existing “cigarette” definitions: “and includes any other roll for
smoking containing tobacco that weighs no more than four and a half pounds per thousand, unless it is
wrapped in whole tobacco leaf and does not have a filter.”
States can also increase their cigarette and other tobacco tax revenues, without raising tax rates, by
implementing initiatives to prevent and reduce cigarette smuggling and other forms of tobacco tax
evasion – such as adopting new, high-tech tax stamps. California, the first state to adopt a high-tech
tax stamp, enjoyed a $100 million increase in cigarette tax revenues in the first 20 months after the
new tax stamp was introduced.
Additional cost-effective strategies to protect tobacco tax revenues include increasing penalties and
fines; educating smokers about applicable state laws (such as limits on the number of packs that may
be brought into the state from other states); and increasing enforcement efforts – perhaps allowing
the enforcing agencies to keep half of all fines and penalties they collect to fund expanded new
enforcement efforts (with general revenues receiving the other half, along with all of the recouped
tax revenues). Other states have reduced tax avoidance and increased collections by targeting tax
collection efforts at smokers who purchase cigarettes on the Internet without paying the state tax or
by entering into special tax compacts with Native American tribes located in the state so that they
impose and collect equivalent taxes on all reservation cigarette sales.
Idaho’s Past Experience with Cigarette Tax Increases
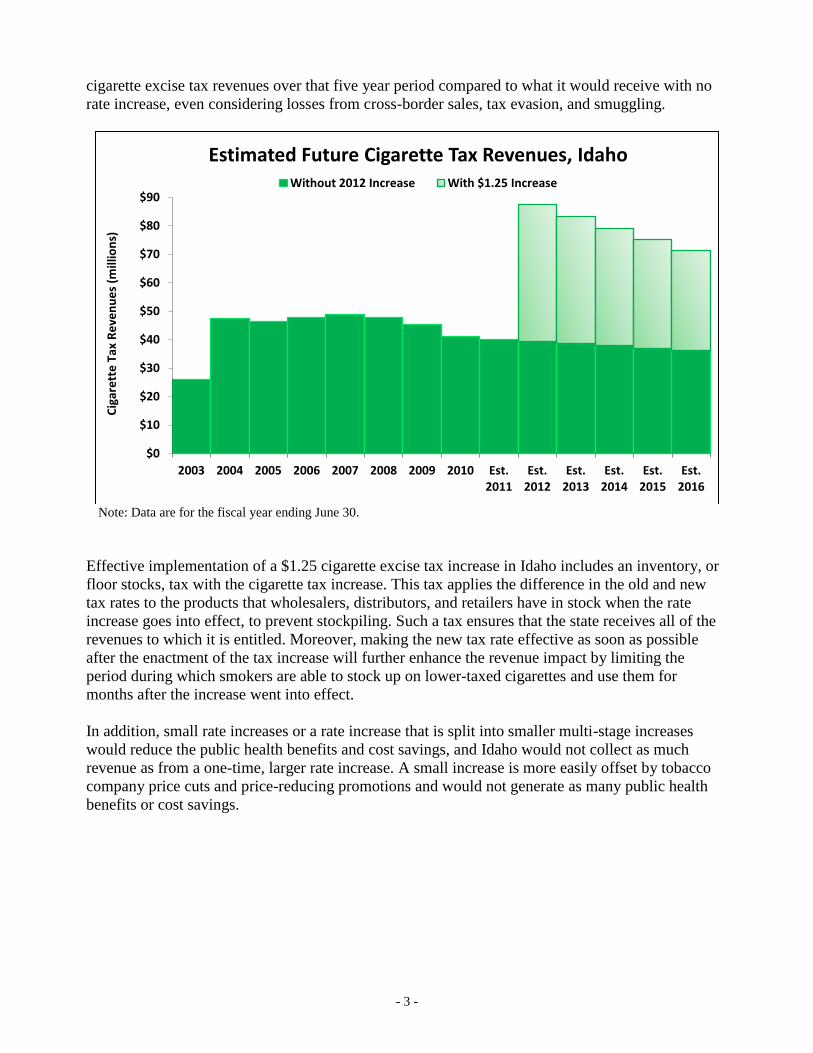
As shown in the chart below, Idaho, like other states, has enjoyed substantial revenue increases each
time it has raised its cigarette tax rate. Following the last state tax increase in June 2003, Idaho’s
cigarette tax revenues have declined gradually each year. Some of that trend can be explained by
ongoing smoking declines in the state, fortified by the statewide smoke-free law implemented in
July 2004 and by the large federal cigarette tax increase in April 2009, which significantly reduced
smoking nationwide.
Moreover, the decline in Idaho cigarette tax revenues in each of the years since its last increase in
2003 were larger than they would have been if the state had raised its tax rates on all other tobacco
products at the same time (the last time Idaho increase its tax rates on other tobacco products was in
1994, from 35% to 40% of wholesale prices). Because of those unequal rates, some regular cigarette
smokers have likely been avoiding the new, higher cigarette tax rate by switching to much lower-
taxed roll-your-own tobacco, little cigars, and the like – and Idaho loses revenue every time a
regular smoker switches to some other lower-taxed tobacco product. Setting Idaho’s tobacco tax
rates so that all tobacco products are taxed at equivalent levels would eliminate that problem and
bring in additional state revenues. The Campaign for Tobacco-Free Kids estimates that raising
Idaho’s low 40 percent wholesale price tax rate on other tobacco products to parallel the proposed
new $1.82 per pack cigarette tax rate would bring $2.9 million per year in additional new state
revenues.
- 9 -
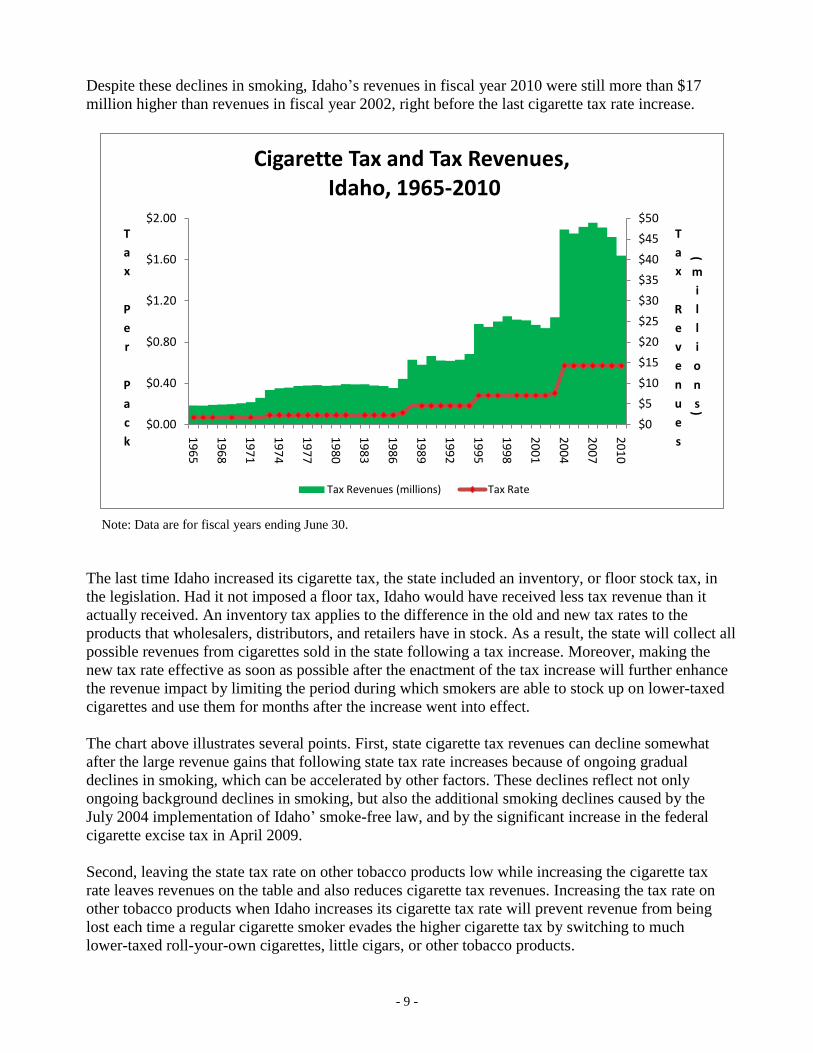
Despite these declines in smoking, Idaho’s revenues in fiscal year 2010 were still more than $17
million higher than revenues in fiscal year 2002, right before the last cigarette tax rate increase.
Note: Data are for fiscal years ending June 30.
The last time Idaho increased its cigarette tax, the state included an inventory, or floor stock tax, in
the legislation. Had it not imposed a floor tax, Idaho would have received less tax revenue than it
actually received. An inventory tax applies to the difference in the old and new tax rates to the
products that wholesalers, distributors, and retailers have in stock. As a result, the state will collect all
possible revenues from cigarettes sold in the state following a tax increase. Moreover, making the
new tax rate effective as soon as possible after the enactment of the tax increase will further enhance
the revenue impact by limiting the period during which smokers are able to stock up on lower-taxed
cigarettes and use them for months after the increase went into effect.
The chart above illustrates several points. First, state cigarette tax revenues can decline somewhat
after the large revenue gains that following state tax rate increases because of ongoing gradual
declines in smoking, which can be accelerated by other factors. These declines reflect not only
ongoing background declines in smoking, but also the additional smoking declines caused by the
July 2004 implementation of Idaho’ smoke-free law, and by the significant increase in the federal
cigarette excise tax in April 2009.
Second, leaving the state tax rate on other tobacco products low while increasing the cigarette tax
rate leaves revenues on the table and also reduces cigarette tax revenues. Increasing the tax rate on
other tobacco products when Idaho increases its cigarette tax rate will prevent revenue from being
lost each time a regular cigarette smoker evades the higher cigarette tax by switching to much
lower-taxed roll-your-own cigarettes, little cigars, or other tobacco products.
$0
$5
$10
$15
$20
$25
$30
$35
$40
$45
$50
$0.00
$0.40
$0.80
$1.20
$1.60
$2.00
19
65
19
68
19
71
19
74
19
77
19
80
19
83
19
86
19
89
19
92
19
95
19
98
20
01
20
04
20
07
20
10
T
a
x
R
e
v
e
n
u
e
s
(
m
i
l
l
i
o
n
s)
T
a
x
P
e
r
P
a
c
k
Cigarette Tax and Tax Revenues,Idaho, 1965-2010
Tax Revenues (millions) Tax Rate
- 10 -
Third, even with the out-year revenue declines caused by ongoing smoking reductions, state cigarette
tax revenues several years after the last cigarette tax increase are still substantially larger than the
revenue levels before the increase – and much higher than what the revenue levels would have been
today absent any cigarette tax increase. For example, despite some year-to-year revenue declines after
2003 tax increase, Idaho is still receiving additional new cigarette tax revenues in excess of $17
million per year compared to what it received in 2002, right before it last increased its cigarette tax
rate.
Fourth, periodic increases in a state’s cigarette tax will more than offset the revenue declines from
underlying downward trends in smoking, or new smoking declines from other factors, and produce
substantially more revenue.
It is also worth noting that the cigarette excise tax rate in Idaho is currently the lowest among its
neighboring states. The $1.25 per pack tax increase will put Idaho’s cigarette excise tax rate
slightly above the current national average of $1.45 per pack. However, Idaho’s rate would still be
much lower than that of Washington state, at $3.025 per pack. As shown in the chart above,
Idaho’s cigarette tax revenue increases were driven primarily by its own tax rate increases. The
higher cigarette excise tax rates in its bordering states did not substantially increase Idaho’s tax
revenues in the past, indicating that there were minimal cross-border purchases in Idaho by
bordering states’ smokers. Similarly, after Idaho increases its cigarette excise tax rate, its revenue
unlikely would be reduced significantly by low cigarette tax rates in bordering states, such as
Nevada and Wyoming.
What Idaho Could Expect from a Tobacco Tax Increase
If Idaho increases its cigarette tax significantly in 2011, its revenues should follow the same basic
patterns that occurred after its last cigarette tax increases, bringing the state substantial new revenues.
For example, the Campaign for Tobacco-Free Kids projects that an appropriately implemented
$1.25 per pack increase in Idaho’s cigarette tax effective July 1, 2011 will generate $48.2 million in
new revenues in state fiscal year 2012, despite reductions in smoking as a result of the rate increase.
In addition, if Idaho increased its tax rate on other tobacco products and implemented a minimum
tax rate to match the new cigarette tax rate at the same time, the state could collect nearly $3 million
in additional revenue, while also gaining public health benefits and savings in health care costs
because of reduced tobacco use.
While significant tobacco tax rate increases bring in substantial amounts of new revenue, periodic
smaller rate increases will reduce the overall amount of revenue a state could receive. These small,
periodic rate increases not only bring in less revenue, but also produce much smaller public health
benefits and cost savings, especially when they are offset or phased-in by temporary cigarette
company price cuts or temporary increases in cigarette company discounts and promotions.
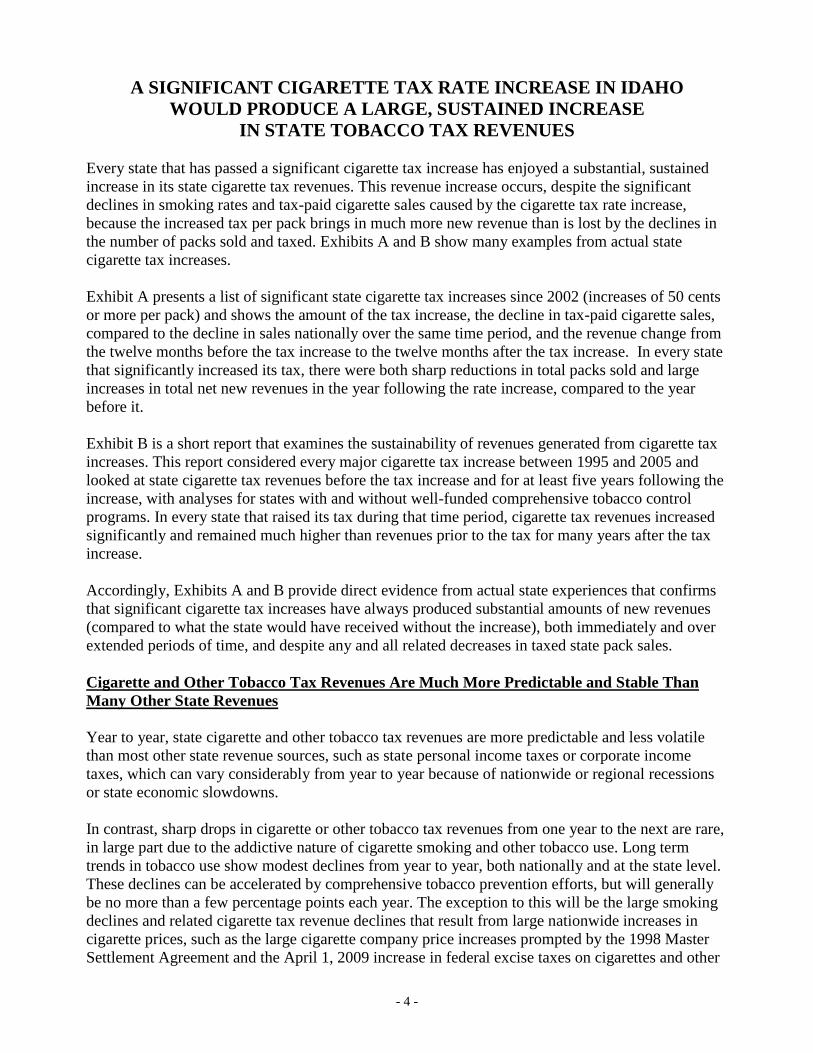
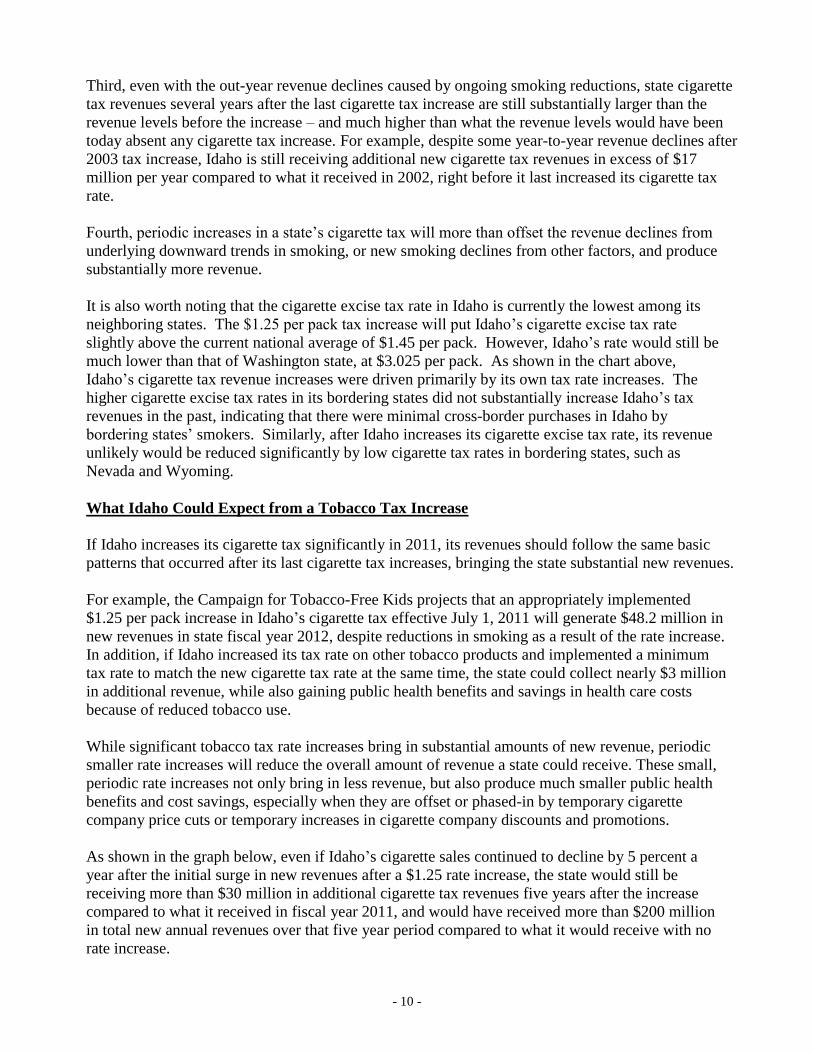
As shown in the graph below, even if Idaho’s cigarette sales continued to decline by 5 percent a
year after the initial surge in new revenues after a $1.25 rate increase, the state would still be
receiving more than $30 million in additional cigarette tax revenues five years after the increase
compared to what it received in fiscal year 2011, and would have received more than $200 million
in total new annual revenues over that five year period compared to what it would receive with no
rate increase.
- 11 -
Note: Data are for fiscal years ending June 30.
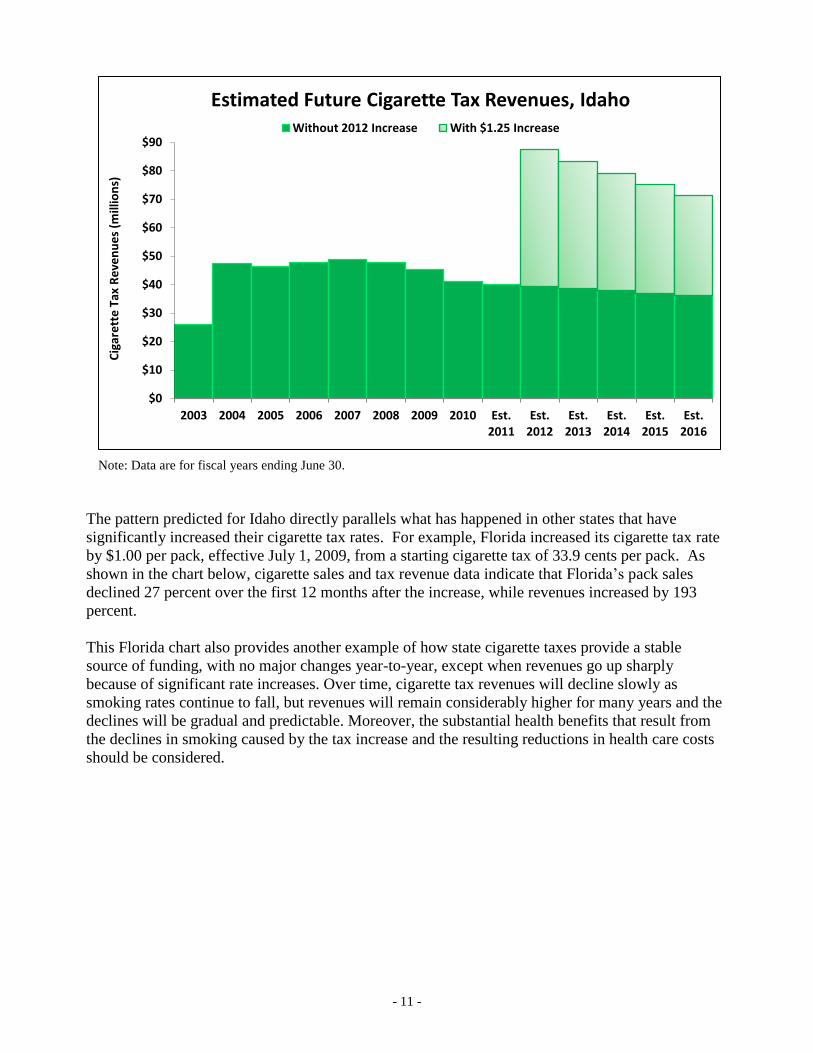
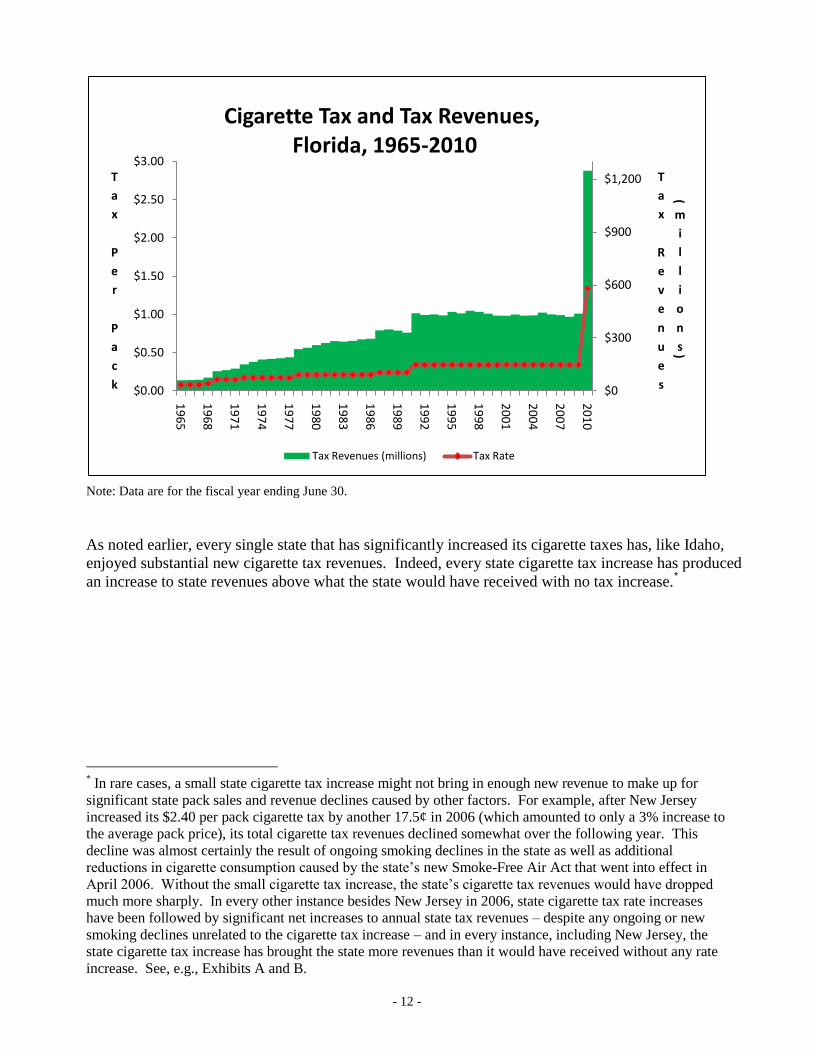
The pattern predicted for Idaho directly parallels what has happened in other states that have
significantly increased their cigarette tax rates. For example, Florida increased its cigarette tax rate
by $1.00 per pack, effective July 1, 2009, from a starting cigarette tax of 33.9 cents per pack. As
shown in the chart below, cigarette sales and tax revenue data indicate that Florida’s pack sales
declined 27 percent over the first 12 months after the increase, while revenues increased by 193
percent.
This Florida chart also provides another example of how state cigarette taxes provide a stable
source of funding, with no major changes year-to-year, except when revenues go up sharply
because of significant rate increases. Over time, cigarette tax revenues will decline slowly as
smoking rates continue to fall, but revenues will remain considerably higher for many years and the
declines will be gradual and predictable. Moreover, the substantial health benefits that result from
the declines in smoking caused by the tax increase and the resulting reductions in health care costs
should be considered.
$0
$10
$20
$30
$40
$50
$60
$70
$80
$90
2003 2004 2005 2006 2007 2008 2009 2010 Est. 2011
Est. 2012
Est. 2013
Est. 2014
Est. 2015
Est. 2016
Cig
are
tte
Tax
Re
ven
ue
s (m
illio
ns)
Estimated Future Cigarette Tax Revenues, IdahoWithout 2012 Increase With $1.25 Increase
- 12 -
Note: Data are for the fiscal year ending June 30.
As noted earlier, every single state that has significantly increased its cigarette taxes has, like Idaho,
enjoyed substantial new cigarette tax revenues. Indeed, every state cigarette tax increase has produced
an increase to state revenues above what the state would have received with no tax increase.*
* In rare cases, a small state cigarette tax increase might not bring in enough new revenue to make up for
significant state pack sales and revenue declines caused by other factors. For example, after New Jersey
increased its $2.40 per pack cigarette tax by another 17.5¢ in 2006 (which amounted to only a 3% increase to
the average pack price), its total cigarette tax revenues declined somewhat over the following year. This
decline was almost certainly the result of ongoing smoking declines in the state as well as additional
reductions in cigarette consumption caused by the state’s new Smoke-Free Air Act that went into effect in
April 2006. Without the small cigarette tax increase, the state’s cigarette tax revenues would have dropped
much more sharply. In every other instance besides New Jersey in 2006, state cigarette tax rate increases
have been followed by significant net increases to annual state tax revenues – despite any ongoing or new
smoking declines unrelated to the cigarette tax increase – and in every instance, including New Jersey, the
state cigarette tax increase has brought the state more revenues than it would have received without any rate
increase. See, e.g., Exhibits A and B.
$0
$300
$600
$900
$1,200
$0.00
$0.50
$1.00
$1.50
$2.00
$2.50
$3.00
19
65
19
68
19
71
19
74
19
77
19
80
19
83
19
86
19
89
19
92
19
95
19
98
20
01
20
04
20
07
20
10
T
a
x
R
e
v
e
n
u
e
s
(
m
i
l
l
i
o
n
s)
T
a
x
P
e
r
P
a
c
k
Cigarette Tax and Tax Revenues,Florida, 1965-2010
Tax Revenues (millions) Tax Rate
- 13 -
EXHIBIT A
STATE EXPERIENCES WITH LARGE CIGARETTE TAX INCREASES 2002-2009
REDUCED PACK SALES AND INCREASED REVENUES
State Effective
Date
Tax Increase
Amount
(per pack)
New State Tax
Rate
(per pack)
State Pack
Sales Decline
Nationwide
Pack Sales
Trend
Revenue
Increase
New Revenues
(millions)
Alaska 1/1/05 60¢ $1.60 - 23.2% - 4.2% + 22.8% + $9.3
Arizona 12/8/06 82¢ $2.00 - 32.5% - 4.4% + 13.6% + $44.5
Arkansas 3/1/09 56¢ $1.15 - 27.8% - 10.2% + 33.5% + $46.5
Colorado 1/1/05 64¢ $0.84 - 24.3% - 4.2% + 220.2% + $131.0
Connecticut 4/3/02 61¢ $1.11 - 12.6% - 4.7% + 116.1% + $133.6
Delaware 7/31/07 60¢ $1.15 - 35.1% - 4.9% + 35.1% + $31.7
Washington, DC 10/1/08 $1.00 $2.00 - 25.9% - 7.0% + 57.3% + $13.2
Florida 7/1/09 $1.00 $1.339 - 27.4% - 8.4% + 193.2% + $828.8
Hawaii 7/1/09 60¢ $2.60 - 11.3% - 8.4% + 14.5% + $15.1
Iowa 3/15/07 $1.00 $1.36 - 30.6% - 4.7% + 140.2% + $128.0
Kansas 7/1/02 55¢ $0.79 - 21.6% - 4.9% + 142.7% + $68.4
Maine 9/19/05 $1.00 $2.00 - 12.3% - 1.8% + 76.5% + $71.5
Maryland 1/1/08 $1.00 $2.00 - 27.1% - 4.2% + 45.8% + $126.9
Massachusetts 7/1/08 $1.00 $2.51 - 19.1% - 5.3% + 34.2% + $143.3
Michigan 8/1/02 50¢ $1.25 - 11.5% - 5.6% + 47.4% + $273.7
Michigan 7/1/04 75¢ $2.00 - 15.2% - 1.7% + 28.1% + $238.9
Minnesota 8/1/05 75¢ $1.23 - 16.1% - 1.8% + 160.7% + $258.4
Mississippi 5/15/09 50¢ $0.68 - 22.8% - 9.5% + 188.3% + $88.9
Montana 5/1/03 52¢ $0.70 - 7.3% - 2.9% + 259.8% + $30.5
Montana 1/1/05 $1.00 $1.70 - 42.0% - 4.2% + 36.5% + $18.8
New Jersey 7/1/02 70¢ $1.50 - 17.6% - 4.9% + 51.0% + $199.8
New Jersey 7/1/03 55¢ $2.05 - 9.0% - 2.3% + 26.6% + $157.4
New Mexico 7/1/03 70¢ $0.91 - 32.3% - 2.3% + 191.8% + $39.2
New York 6/3/08 $1.25 $2.75 - 15.2% - 5.8% + 40.3% + $377.4
Ohio 7/1/05 70¢ $1.25 - 20.6% - 1.6% + 78.9% + $437.6
Oklahoma 1/1/05 80¢ $1.03 - 34.7% - 4.2% + 98.2% + $81.6
Rhode Island 7/1/04 75¢ $2.46 - 18.7% - 1.7% + 16.9% + $18.7
Rhode Island 4/10/09 $1.00 $3.46 - 14.7% - 11.1% + 15.1% + $17.8
South Dakota 1/1/07 $1.00 $1.53 - 25.8% - 4.9% + 115.4% + $31.8
Texas 1/1/07 $1.00 $1.41 - 21.0% - 4.9% + 191.7% + $1,003.7
Vermont 7/1/06 60¢ $1.79 - 14.6% - 3.0% + 30.0% + $13.8
Washington 1/1/02 60¢ $1.425 - 18.8% - 2.6% + 42.1% + $99.6
Washington 7/1/05 60¢ $2.025 - 8.4% - 1.6% + 29.1% + $95.5
Wisconsin 1/1/08 $1.00 $1.77 - 15.0% - 4.2% + 93.9% + $283.0
Sources: Orzechowski & Walker, Tax Burden on Tobacco. U.S. Alcohol and Tobacco Tax and Trade Bureau.
Consumption declines and revenue increases are for the 12 months before and after the tax increase. Nationwide
consumption declines are for the 50 states and DC. Trends for rate increases after January 2008 include the impact of the
61.66-cent federal cigarette tax increase (effective April 1, 2009).
- 14 -
EXHIBIT B
SUSTAINABILITY OF CIGARETTE TAX REVENUES OVER TIME
FOLLOWING CIGARETTE TAX RATE INCREASES
Introductory Points:
Cigarette consumption is generally trending down. During the period from 1990 to 2010, total
sales for the U.S. fell by 2.6 percent, on average, per year. During this same period, sales in
Idaho fell by an average of 1.1 percent per year. In the absence of cigarette tax increases,
revenues from cigarette taxes will also be on a downward trend given the underlying trends in
cigarette consumption.
Cigarette tax increases will generate reductions in cigarette smoking and increases in revenues.
Estimates indicate that the short run elasticity of cigarette demand is approximately –0.4,
implying that a price increase of 10 percent will reduce total cigarette consumption by 4%.
Because of the addictive nature of cigarette smoking, smokers’ adjustments to the tax increases
will occur over time, with the effect of a permanent, inflation adjusted tax increase rising so that
the reductions in consumption that result will increase over time; estimates of the long run (after
many decades) price elasticity of cigarette demand are –0.8. This implies that the gains in
revenue that results from a tax increase will fall (although still be substantial) over time;
however, the effects of inflation will erode the value of the tax increase, dampening the growth in
the decline in smoking and lessening the drop in revenues.
In states that use some of the revenues from tax increases to fund comprehensive tobacco
control programs, these efforts lead to further reductions in smoking beyond those resulting
from the tax increase. The implications for revenues are that the revenues generated from the
tax increase will be lower in years after the comprehensive program is implemented compared
to before.
Historically, every significant state cigarette excise tax increase has resulted in a significant
increase in cigarette tax revenues.
Data Sources:
Monthly tax paid cigarette sales, by state, 1995-2010, provided by USDA, CDC and CTFK;
cigarette tax rates and dates of change, Tax Burden on Tobacco, 2010. Note that the revenues for
later periods described below (post November 1998) are lower relative to the general trend because
of sharp reductions in smoking resulting from industry initiated cigarette price increases in the wake
of the Master Settlement Agreement.
Approach:
Analyzed significant tax changes – those that increased the state tax cigarette excise tax rate by
at least 25 cents per pack over the period from 1995 through June 2005.
Computed tax revenues for the 12 months preceding tax change and for as many 12 month
periods as possible after tax change, for a minimum of five years; if tax was changed mid-
month, then the last 12 full months and subsequent 12 full month periods were examined.
- 15 -
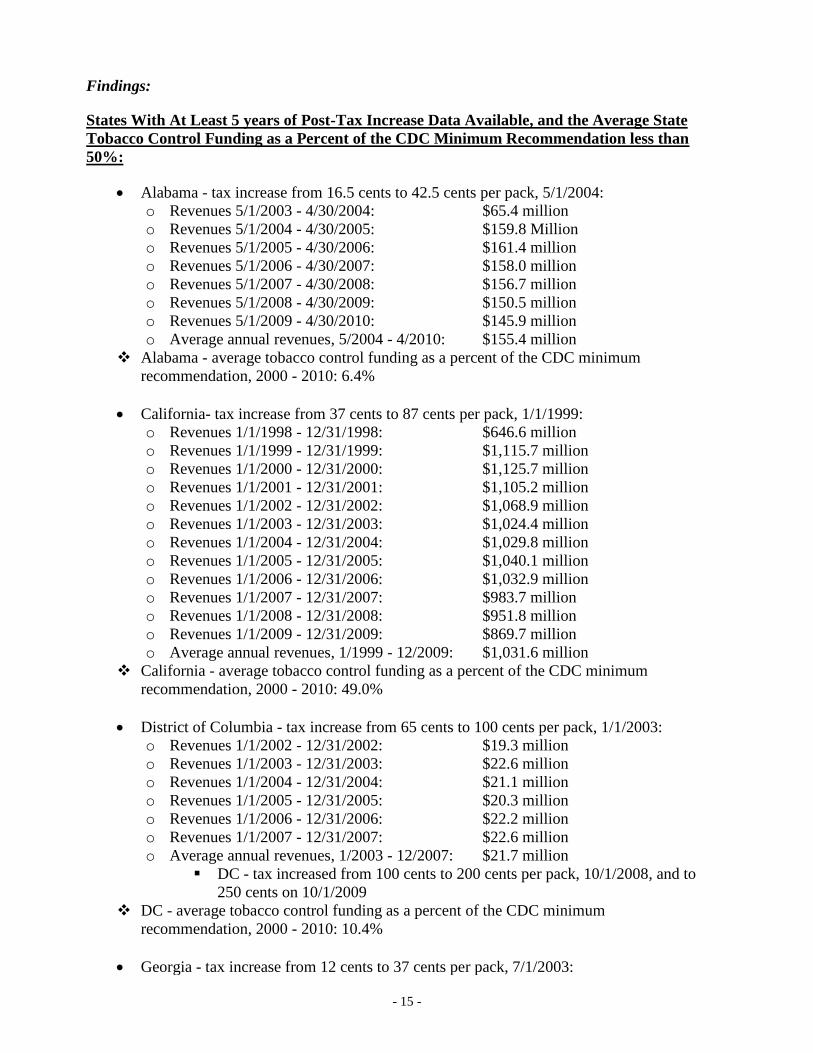
Findings:
States With At Least 5 years of Post-Tax Increase Data Available, and the Average State
Tobacco Control Funding as a Percent of the CDC Minimum Recommendation less than
50%:
Alabama - tax increase from 16.5 cents to 42.5 cents per pack, 5/1/2004:
o Revenues 5/1/2003 - 4/30/2004: $65.4 million
o Revenues 5/1/2004 - 4/30/2005: $159.8 Million
o Revenues 5/1/2005 - 4/30/2006: $161.4 million
o Revenues 5/1/2006 - 4/30/2007: $158.0 million
o Revenues 5/1/2007 - 4/30/2008: $156.7 million
o Revenues 5/1/2008 - 4/30/2009: $150.5 million
o Revenues 5/1/2009 - 4/30/2010: $145.9 million
o Average annual revenues, 5/2004 - 4/2010: $155.4 million
Alabama - average tobacco control funding as a percent of the CDC minimum
recommendation, 2000 - 2010: 6.4%
California- tax increase from 37 cents to 87 cents per pack, 1/1/1999:
o Revenues 1/1/1998 - 12/31/1998: $646.6 million
o Revenues 1/1/1999 - 12/31/1999: $1,115.7 million
o Revenues 1/1/2000 - 12/31/2000: $1,125.7 million
o Revenues 1/1/2001 - 12/31/2001: $1,105.2 million
o Revenues 1/1/2002 - 12/31/2002: $1,068.9 million
o Revenues 1/1/2003 - 12/31/2003: $1,024.4 million
o Revenues 1/1/2004 - 12/31/2004: $1,029.8 million
o Revenues 1/1/2005 - 12/31/2005: $1,040.1 million
o Revenues 1/1/2006 - 12/31/2006: $1,032.9 million
o Revenues 1/1/2007 - 12/31/2007: $983.7 million
o Revenues 1/1/2008 - 12/31/2008: $951.8 million
o Revenues 1/1/2009 - 12/31/2009: $869.7 million
o Average annual revenues, 1/1999 - 12/2009: $1,031.6 million
California - average tobacco control funding as a percent of the CDC minimum
recommendation, 2000 - 2010: 49.0%
District of Columbia - tax increase from 65 cents to 100 cents per pack, 1/1/2003:
o Revenues 1/1/2002 - 12/31/2002: $19.3 million
o Revenues 1/1/2003 - 12/31/2003: $22.6 million
o Revenues 1/1/2004 - 12/31/2004: $21.1 million
o Revenues 1/1/2005 - 12/31/2005: $20.3 million
o Revenues 1/1/2006 - 12/31/2006: $22.2 million
o Revenues 1/1/2007 - 12/31/2007: $22.6 million
o Average annual revenues, 1/2003 - 12/2007: $21.7 million
DC - tax increased from 100 cents to 200 cents per pack, 10/1/2008, and to
250 cents on 10/1/2009
DC - average tobacco control funding as a percent of the CDC minimum
recommendation, 2000 - 2010: 10.4%
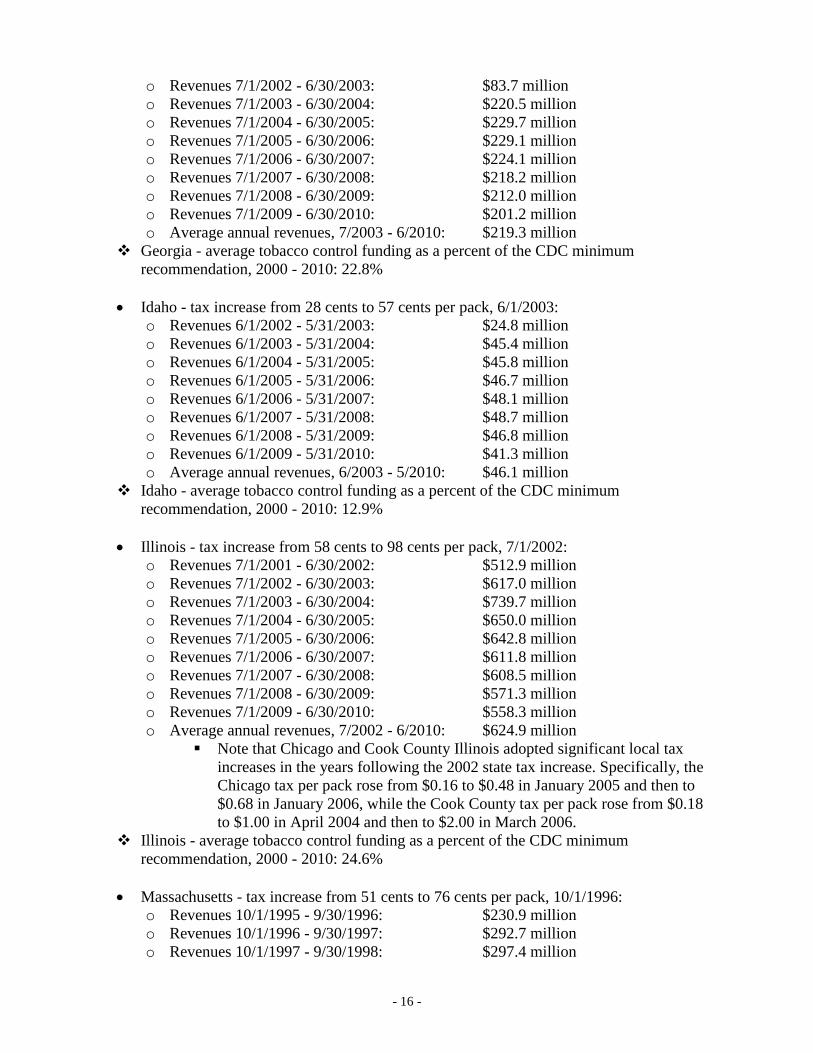
Georgia - tax increase from 12 cents to 37 cents per pack, 7/1/2003:
- 16 -
o Revenues 7/1/2002 - 6/30/2003: $83.7 million
o Revenues 7/1/2003 - 6/30/2004: $220.5 million
o Revenues 7/1/2004 - 6/30/2005: $229.7 million
o Revenues 7/1/2005 - 6/30/2006: $229.1 million
o Revenues 7/1/2006 - 6/30/2007: $224.1 million
o Revenues 7/1/2007 - 6/30/2008: $218.2 million
o Revenues 7/1/2008 - 6/30/2009: $212.0 million
o Revenues 7/1/2009 - 6/30/2010: $201.2 million
o Average annual revenues, 7/2003 - 6/2010: $219.3 million
Georgia - average tobacco control funding as a percent of the CDC minimum
recommendation, 2000 - 2010: 22.8%
Idaho - tax increase from 28 cents to 57 cents per pack, 6/1/2003:
o Revenues 6/1/2002 - 5/31/2003: $24.8 million
o Revenues 6/1/2003 - 5/31/2004: $45.4 million
o Revenues 6/1/2004 - 5/31/2005: $45.8 million
o Revenues 6/1/2005 - 5/31/2006: $46.7 million
o Revenues 6/1/2006 - 5/31/2007: $48.1 million
o Revenues 6/1/2007 - 5/31/2008: $48.7 million
o Revenues 6/1/2008 - 5/31/2009: $46.8 million
o Revenues 6/1/2009 - 5/31/2010: $41.3 million
o Average annual revenues, 6/2003 - 5/2010: $46.1 million
Idaho - average tobacco control funding as a percent of the CDC minimum
recommendation, 2000 - 2010: 12.9%
Illinois - tax increase from 58 cents to 98 cents per pack, 7/1/2002:
o Revenues 7/1/2001 - 6/30/2002: $512.9 million
o Revenues 7/1/2002 - 6/30/2003: $617.0 million
o Revenues 7/1/2003 - 6/30/2004: $739.7 million
o Revenues 7/1/2004 - 6/30/2005: $650.0 million
o Revenues 7/1/2005 - 6/30/2006: $642.8 million
o Revenues 7/1/2006 - 6/30/2007: $611.8 million
o Revenues 7/1/2007 - 6/30/2008: $608.5 million
o Revenues 7/1/2008 - 6/30/2009: $571.3 million
o Revenues 7/1/2009 - 6/30/2010: $558.3 million
o Average annual revenues, 7/2002 - 6/2010: $624.9 million
Note that Chicago and Cook County Illinois adopted significant local tax
increases in the years following the 2002 state tax increase. Specifically, the
Chicago tax per pack rose from $0.16 to $0.48 in January 2005 and then to
$0.68 in January 2006, while the Cook County tax per pack rose from $0.18
to $1.00 in April 2004 and then to $2.00 in March 2006.
Illinois - average tobacco control funding as a percent of the CDC minimum
recommendation, 2000 - 2010: 24.6%
Massachusetts - tax increase from 51 cents to 76 cents per pack, 10/1/1996:
o Revenues 10/1/1995 - 9/30/1996: $230.9 million
o Revenues 10/1/1996 - 9/30/1997: $292.7 million
o Revenues 10/1/1997 - 9/30/1998: $297.4 million
- 17 -
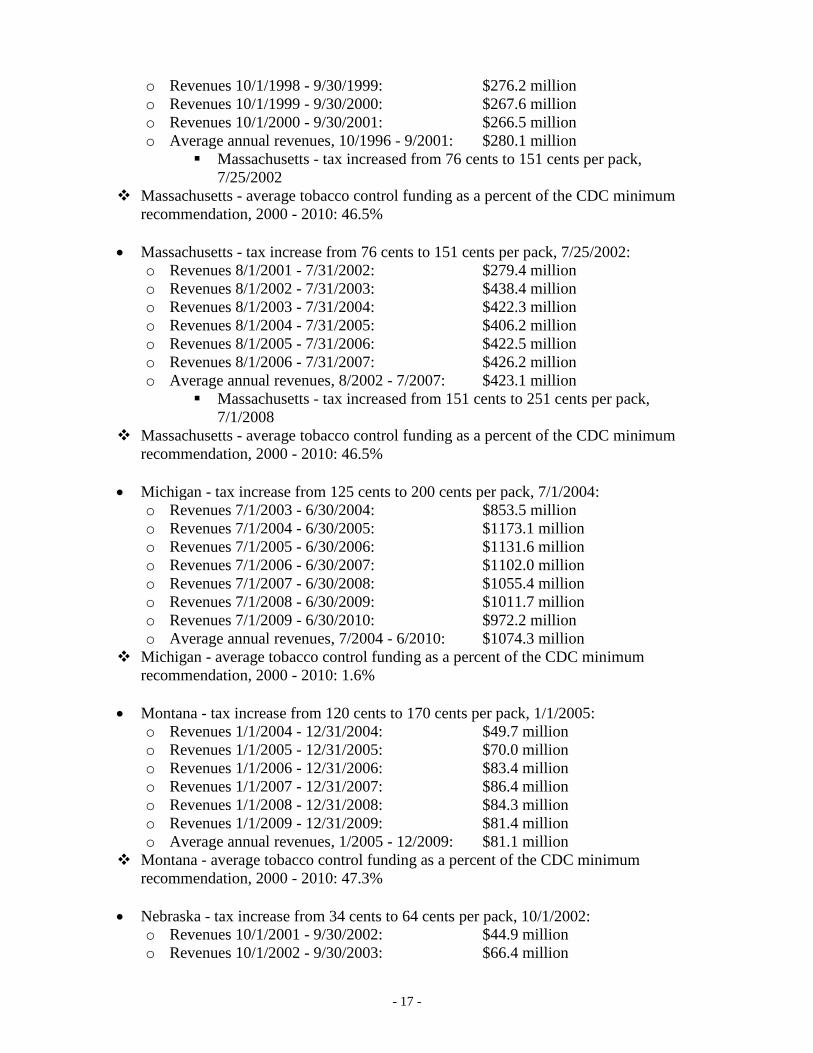
o Revenues 10/1/1998 - 9/30/1999: $276.2 million
o Revenues 10/1/1999 - 9/30/2000: $267.6 million
o Revenues 10/1/2000 - 9/30/2001: $266.5 million
o Average annual revenues, 10/1996 - 9/2001: $280.1 million
Massachusetts - tax increased from 76 cents to 151 cents per pack,
7/25/2002
Massachusetts - average tobacco control funding as a percent of the CDC minimum
recommendation, 2000 - 2010: 46.5%
Massachusetts - tax increase from 76 cents to 151 cents per pack, 7/25/2002:
o Revenues 8/1/2001 - 7/31/2002: $279.4 million
o Revenues 8/1/2002 - 7/31/2003: $438.4 million
o Revenues 8/1/2003 - 7/31/2004: $422.3 million
o Revenues 8/1/2004 - 7/31/2005: $406.2 million
o Revenues 8/1/2005 - 7/31/2006: $422.5 million
o Revenues 8/1/2006 - 7/31/2007: $426.2 million
o Average annual revenues, 8/2002 - 7/2007: $423.1 million
Massachusetts - tax increased from 151 cents to 251 cents per pack,
7/1/2008
Massachusetts - average tobacco control funding as a percent of the CDC minimum
recommendation, 2000 - 2010: 46.5%
Michigan - tax increase from 125 cents to 200 cents per pack, 7/1/2004:
o Revenues 7/1/2003 - 6/30/2004: $853.5 million
o Revenues 7/1/2004 - 6/30/2005: $1173.1 million
o Revenues 7/1/2005 - 6/30/2006: $1131.6 million
o Revenues 7/1/2006 - 6/30/2007: $1102.0 million
o Revenues 7/1/2007 - 6/30/2008: $1055.4 million
o Revenues 7/1/2008 - 6/30/2009: $1011.7 million
o Revenues 7/1/2009 - 6/30/2010: $972.2 million
o Average annual revenues, 7/2004 - 6/2010: $1074.3 million
Michigan - average tobacco control funding as a percent of the CDC minimum
recommendation, 2000 - 2010: 1.6%
Montana - tax increase from 120 cents to 170 cents per pack, 1/1/2005:
o Revenues 1/1/2004 - 12/31/2004: $49.7 million
o Revenues 1/1/2005 - 12/31/2005: $70.0 million
o Revenues 1/1/2006 - 12/31/2006: $83.4 million
o Revenues 1/1/2007 - 12/31/2007: $86.4 million
o Revenues 1/1/2008 - 12/31/2008: $84.3 million
o Revenues 1/1/2009 - 12/31/2009: $81.4 million
o Average annual revenues, 1/2005 - 12/2009: $81.1 million
Montana - average tobacco control funding as a percent of the CDC minimum
recommendation, 2000 - 2010: 47.3%
Nebraska - tax increase from 34 cents to 64 cents per pack, 10/1/2002:
o Revenues 10/1/2001 - 9/30/2002: $44.9 million
o Revenues 10/1/2002 - 9/30/2003: $66.4 million
- 18 -
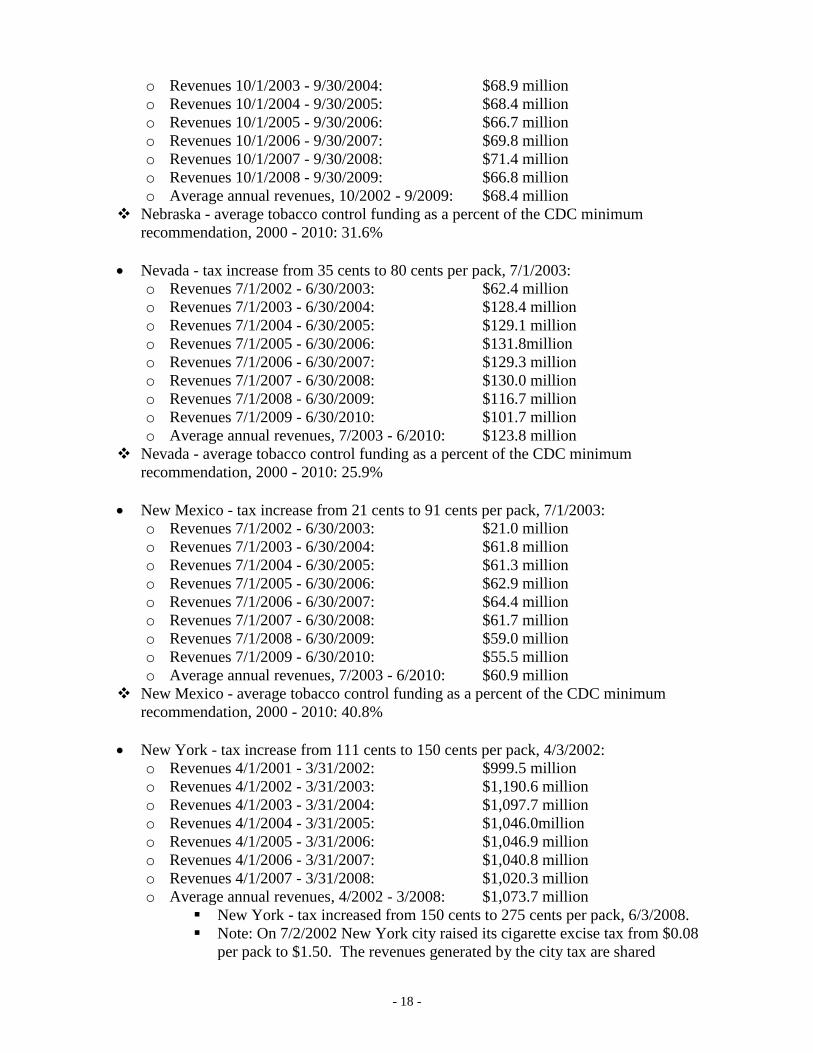
o Revenues 10/1/2003 - 9/30/2004: $68.9 million
o Revenues 10/1/2004 - 9/30/2005: $68.4 million
o Revenues 10/1/2005 - 9/30/2006: $66.7 million
o Revenues 10/1/2006 - 9/30/2007: $69.8 million
o Revenues 10/1/2007 - 9/30/2008: $71.4 million
o Revenues 10/1/2008 - 9/30/2009: $66.8 million
o Average annual revenues, 10/2002 - 9/2009: $68.4 million
Nebraska - average tobacco control funding as a percent of the CDC minimum
recommendation, 2000 - 2010: 31.6%
Nevada - tax increase from 35 cents to 80 cents per pack, 7/1/2003:
o Revenues 7/1/2002 - 6/30/2003: $62.4 million
o Revenues 7/1/2003 - 6/30/2004: $128.4 million
o Revenues 7/1/2004 - 6/30/2005: $129.1 million
o Revenues 7/1/2005 - 6/30/2006: $131.8million
o Revenues 7/1/2006 - 6/30/2007: $129.3 million
o Revenues 7/1/2007 - 6/30/2008: $130.0 million
o Revenues 7/1/2008 - 6/30/2009: $116.7 million
o Revenues 7/1/2009 - 6/30/2010: $101.7 million
o Average annual revenues, 7/2003 - 6/2010: $123.8 million
Nevada - average tobacco control funding as a percent of the CDC minimum
recommendation, 2000 - 2010: 25.9%
New Mexico - tax increase from 21 cents to 91 cents per pack, 7/1/2003:
o Revenues 7/1/2002 - 6/30/2003: $21.0 million
o Revenues 7/1/2003 - 6/30/2004: $61.8 million
o Revenues 7/1/2004 - 6/30/2005: $61.3 million
o Revenues 7/1/2005 - 6/30/2006: $62.9 million
o Revenues 7/1/2006 - 6/30/2007: $64.4 million
o Revenues 7/1/2007 - 6/30/2008: $61.7 million
o Revenues 7/1/2008 - 6/30/2009: $59.0 million
o Revenues 7/1/2009 - 6/30/2010: $55.5 million
o Average annual revenues, 7/2003 - 6/2010: $60.9 million
New Mexico - average tobacco control funding as a percent of the CDC minimum
recommendation, 2000 - 2010: 40.8%
New York - tax increase from 111 cents to 150 cents per pack, 4/3/2002:
o Revenues 4/1/2001 - 3/31/2002: $999.5 million
o Revenues 4/1/2002 - 3/31/2003: $1,190.6 million
o Revenues 4/1/2003 - 3/31/2004: $1,097.7 million
o Revenues 4/1/2004 - 3/31/2005: $1,046.0million
o Revenues 4/1/2005 - 3/31/2006: $1,046.9 million
o Revenues 4/1/2006 - 3/31/2007: $1,040.8 million
o Revenues 4/1/2007 - 3/31/2008: $1,020.3 million
o Average annual revenues, 4/2002 - 3/2008: $1,073.7 million
New York - tax increased from 150 cents to 275 cents per pack, 6/3/2008.
Note: On 7/2/2002 New York city raised its cigarette excise tax from $0.08
per pack to $1.50. The revenues generated by the city tax are shared
- 19 -
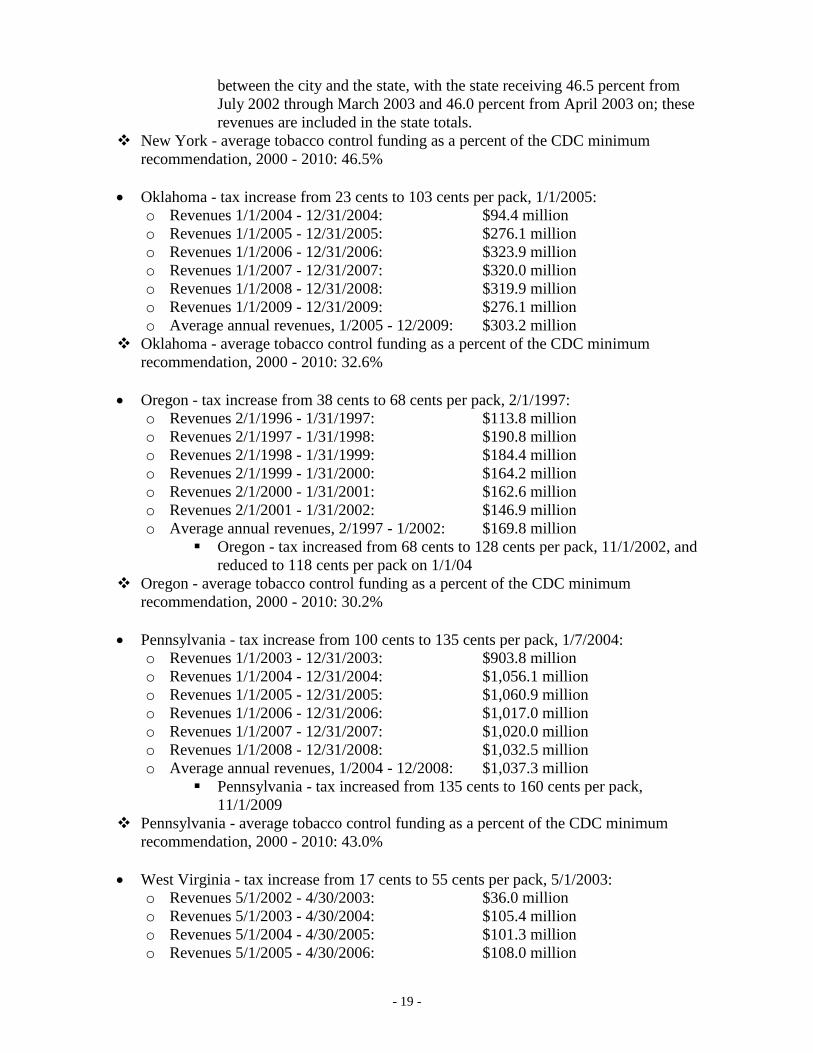
between the city and the state, with the state receiving 46.5 percent from
July 2002 through March 2003 and 46.0 percent from April 2003 on; these
revenues are included in the state totals.
New York - average tobacco control funding as a percent of the CDC minimum
recommendation, 2000 - 2010: 46.5%
Oklahoma - tax increase from 23 cents to 103 cents per pack, 1/1/2005:
o Revenues 1/1/2004 - 12/31/2004: $94.4 million
o Revenues 1/1/2005 - 12/31/2005: $276.1 million
o Revenues 1/1/2006 - 12/31/2006: $323.9 million
o Revenues 1/1/2007 - 12/31/2007: $320.0 million
o Revenues 1/1/2008 - 12/31/2008: $319.9 million
o Revenues 1/1/2009 - 12/31/2009: $276.1 million
o Average annual revenues, 1/2005 - 12/2009: $303.2 million
Oklahoma - average tobacco control funding as a percent of the CDC minimum
recommendation, 2000 - 2010: 32.6%
Oregon - tax increase from 38 cents to 68 cents per pack, 2/1/1997:
o Revenues 2/1/1996 - 1/31/1997: $113.8 million
o Revenues 2/1/1997 - 1/31/1998: $190.8 million
o Revenues 2/1/1998 - 1/31/1999: $184.4 million
o Revenues 2/1/1999 - 1/31/2000: $164.2 million
o Revenues 2/1/2000 - 1/31/2001: $162.6 million
o Revenues 2/1/2001 - 1/31/2002: $146.9 million
o Average annual revenues, 2/1997 - 1/2002: $169.8 million
Oregon - tax increased from 68 cents to 128 cents per pack, 11/1/2002, and
reduced to 118 cents per pack on 1/1/04
Oregon - average tobacco control funding as a percent of the CDC minimum
recommendation, 2000 - 2010: 30.2%
Pennsylvania - tax increase from 100 cents to 135 cents per pack, 1/7/2004:
o Revenues 1/1/2003 - 12/31/2003: $903.8 million
o Revenues 1/1/2004 - 12/31/2004: $1,056.1 million
o Revenues 1/1/2005 - 12/31/2005: $1,060.9 million
o Revenues 1/1/2006 - 12/31/2006: $1,017.0 million
o Revenues 1/1/2007 - 12/31/2007: $1,020.0 million
o Revenues 1/1/2008 - 12/31/2008: $1,032.5 million
o Average annual revenues, 1/2004 - 12/2008: $1,037.3 million
Pennsylvania - tax increased from 135 cents to 160 cents per pack,
11/1/2009
Pennsylvania - average tobacco control funding as a percent of the CDC minimum
recommendation, 2000 - 2010: 43.0%
West Virginia - tax increase from 17 cents to 55 cents per pack, 5/1/2003:
o Revenues 5/1/2002 - 4/30/2003: $36.0 million
o Revenues 5/1/2003 - 4/30/2004: $105.4 million
o Revenues 5/1/2004 - 4/30/2005: $101.3 million
o Revenues 5/1/2005 - 4/30/2006: $108.0 million
- 20 -
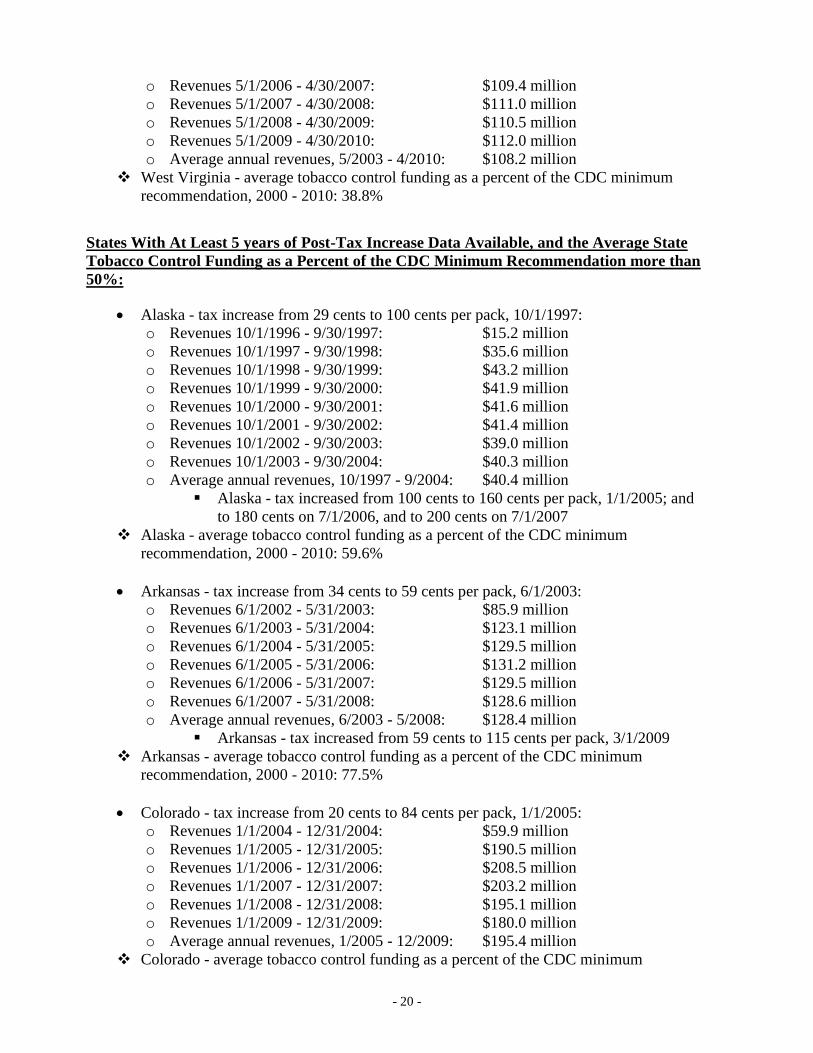
o Revenues 5/1/2006 - 4/30/2007: $109.4 million
o Revenues 5/1/2007 - 4/30/2008: $111.0 million
o Revenues 5/1/2008 - 4/30/2009: $110.5 million
o Revenues 5/1/2009 - 4/30/2010: $112.0 million
o Average annual revenues, 5/2003 - 4/2010: $108.2 million
West Virginia - average tobacco control funding as a percent of the CDC minimum
recommendation, 2000 - 2010: 38.8%
States With At Least 5 years of Post-Tax Increase Data Available, and the Average State
Tobacco Control Funding as a Percent of the CDC Minimum Recommendation more than
50%:
Alaska - tax increase from 29 cents to 100 cents per pack, 10/1/1997:
o Revenues 10/1/1996 - 9/30/1997: $15.2 million
o Revenues 10/1/1997 - 9/30/1998: $35.6 million
o Revenues 10/1/1998 - 9/30/1999: $43.2 million
o Revenues 10/1/1999 - 9/30/2000: $41.9 million
o Revenues 10/1/2000 - 9/30/2001: $41.6 million
o Revenues 10/1/2001 - 9/30/2002: $41.4 million
o Revenues 10/1/2002 - 9/30/2003: $39.0 million
o Revenues 10/1/2003 - 9/30/2004: $40.3 million
o Average annual revenues, 10/1997 - 9/2004: $40.4 million
Alaska - tax increased from 100 cents to 160 cents per pack, 1/1/2005; and
to 180 cents on 7/1/2006, and to 200 cents on 7/1/2007
Alaska - average tobacco control funding as a percent of the CDC minimum
recommendation, 2000 - 2010: 59.6%
Arkansas - tax increase from 34 cents to 59 cents per pack, 6/1/2003:
o Revenues 6/1/2002 - 5/31/2003: $85.9 million
o Revenues 6/1/2003 - 5/31/2004: $123.1 million
o Revenues 6/1/2004 - 5/31/2005: $129.5 million
o Revenues 6/1/2005 - 5/31/2006: $131.2 million
o Revenues 6/1/2006 - 5/31/2007: $129.5 million
o Revenues 6/1/2007 - 5/31/2008: $128.6 million
o Average annual revenues, 6/2003 - 5/2008: $128.4 million
Arkansas - tax increased from 59 cents to 115 cents per pack, 3/1/2009
Arkansas - average tobacco control funding as a percent of the CDC minimum
recommendation, 2000 - 2010: 77.5%
Colorado - tax increase from 20 cents to 84 cents per pack, 1/1/2005:
o Revenues 1/1/2004 - 12/31/2004: $59.9 million
o Revenues 1/1/2005 - 12/31/2005: $190.5 million
o Revenues 1/1/2006 - 12/31/2006: $208.5 million
o Revenues 1/1/2007 - 12/31/2007: $203.2 million
o Revenues 1/1/2008 - 12/31/2008: $195.1 million
o Revenues 1/1/2009 - 12/31/2009: $180.0 million
o Average annual revenues, 1/2005 - 12/2009: $195.4 million
Colorado - average tobacco control funding as a percent of the CDC minimum
- 21 -
recommendation, 2000 - 2010: 56.3%
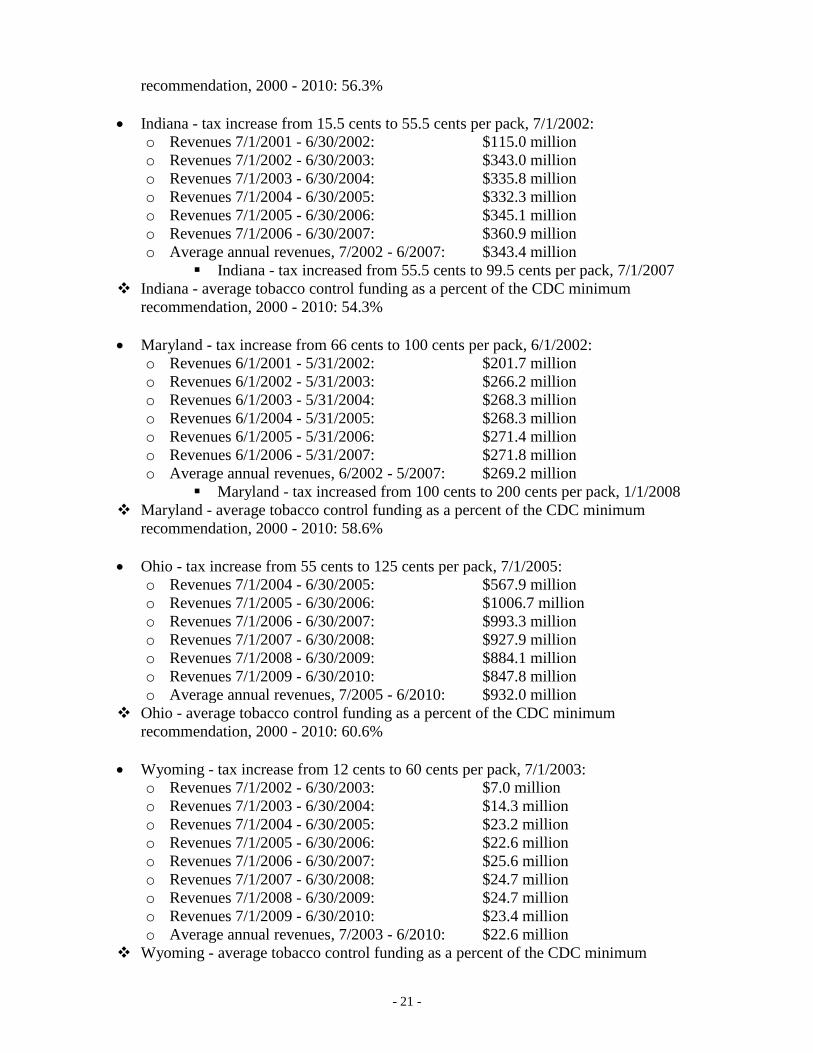
Indiana - tax increase from 15.5 cents to 55.5 cents per pack, 7/1/2002:
o Revenues 7/1/2001 - 6/30/2002: $115.0 million
o Revenues 7/1/2002 - 6/30/2003: $343.0 million
o Revenues 7/1/2003 - 6/30/2004: $335.8 million
o Revenues 7/1/2004 - 6/30/2005: $332.3 million
o Revenues 7/1/2005 - 6/30/2006: $345.1 million
o Revenues 7/1/2006 - 6/30/2007: $360.9 million
o Average annual revenues, 7/2002 - 6/2007: $343.4 million
Indiana - tax increased from 55.5 cents to 99.5 cents per pack, 7/1/2007
Indiana - average tobacco control funding as a percent of the CDC minimum
recommendation, 2000 - 2010: 54.3%
Maryland - tax increase from 66 cents to 100 cents per pack, 6/1/2002:
o Revenues 6/1/2001 - 5/31/2002: $201.7 million
o Revenues 6/1/2002 - 5/31/2003: $266.2 million
o Revenues 6/1/2003 - 5/31/2004: $268.3 million
o Revenues 6/1/2004 - 5/31/2005: $268.3 million
o Revenues 6/1/2005 - 5/31/2006: $271.4 million
o Revenues 6/1/2006 - 5/31/2007: $271.8 million
o Average annual revenues, 6/2002 - 5/2007: $269.2 million
Maryland - tax increased from 100 cents to 200 cents per pack, 1/1/2008
Maryland - average tobacco control funding as a percent of the CDC minimum
recommendation, 2000 - 2010: 58.6%
Ohio - tax increase from 55 cents to 125 cents per pack, 7/1/2005:
o Revenues 7/1/2004 - 6/30/2005: $567.9 million
o Revenues 7/1/2005 - 6/30/2006: $1006.7 million
o Revenues 7/1/2006 - 6/30/2007: $993.3 million
o Revenues 7/1/2007 - 6/30/2008: $927.9 million
o Revenues 7/1/2008 - 6/30/2009: $884.1 million
o Revenues 7/1/2009 - 6/30/2010: $847.8 million
o Average annual revenues, 7/2005 - 6/2010: $932.0 million
Ohio - average tobacco control funding as a percent of the CDC minimum
recommendation, 2000 - 2010: 60.6%
Wyoming - tax increase from 12 cents to 60 cents per pack, 7/1/2003:
o Revenues 7/1/2002 - 6/30/2003: $7.0 million
o Revenues 7/1/2003 - 6/30/2004: $14.3 million
o Revenues 7/1/2004 - 6/30/2005: $23.2 million
o Revenues 7/1/2005 - 6/30/2006: $22.6 million
o Revenues 7/1/2006 - 6/30/2007: $25.6 million
o Revenues 7/1/2007 - 6/30/2008: $24.7 million
o Revenues 7/1/2008 - 6/30/2009: $24.7 million
o Revenues 7/1/2009 - 6/30/2010: $23.4 million
o Average annual revenues, 7/2003 - 6/2010: $22.6 million
Wyoming - average tobacco control funding as a percent of the CDC minimum
- 22 -
recommendation, 2000 - 2010: 51.4%
Conclusions:
Significant cigarette excise tax increases generate significant increases in cigarette tax
revenues.
Revenues several years after the tax increase remain significantly higher than revenues prior
to the tax increase and changes over time after the increase are consistent with changes that
would result from underlying downward trends in cigarette smoking.
Revenues in states that dedicate some revenues for comprehensive tobacco control programs
in the years following the implementation of these programs are still significantly higher
than revenues prior to the tax increase and program implementation.