Embed Size (px)
Citation preview
A short tutorial onLAT pulsar analysis
tools Gamma-ray Large Area Space Gamma-ray Large Area Space TelescopeTelescope
Massimiliano Razzano(Istituto Nazionale di Fisica Nucleare, sec.
Pisa)
Masaharu HirayamaJames Peachey
(NASA Goddard Space Flight Center)
GLAST LAT Collaboration Meeting
(SLAC, August 29th-31th 2005)
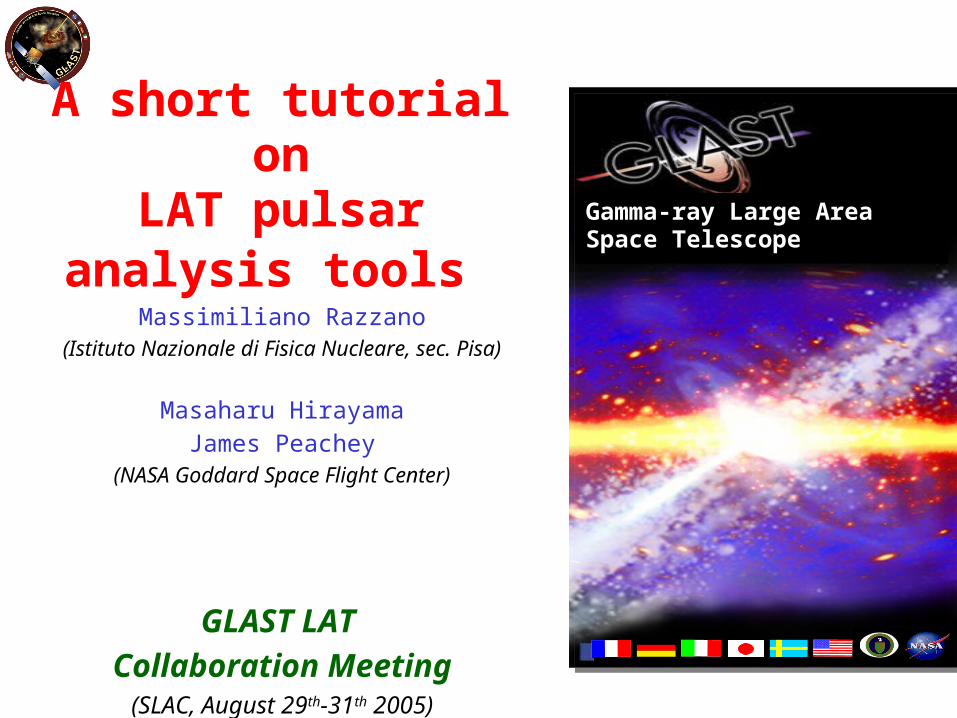
or: “What we want to do?”
Outline
The starting point: simulate pulsars in the sky
The barycentric decorrections
Assigning phases
The Pulsar Database
Periodicity tests
If we don’t know exactly radio ephemerides?
Conclusions and possible other analysis
Simulating pulsars in the sky
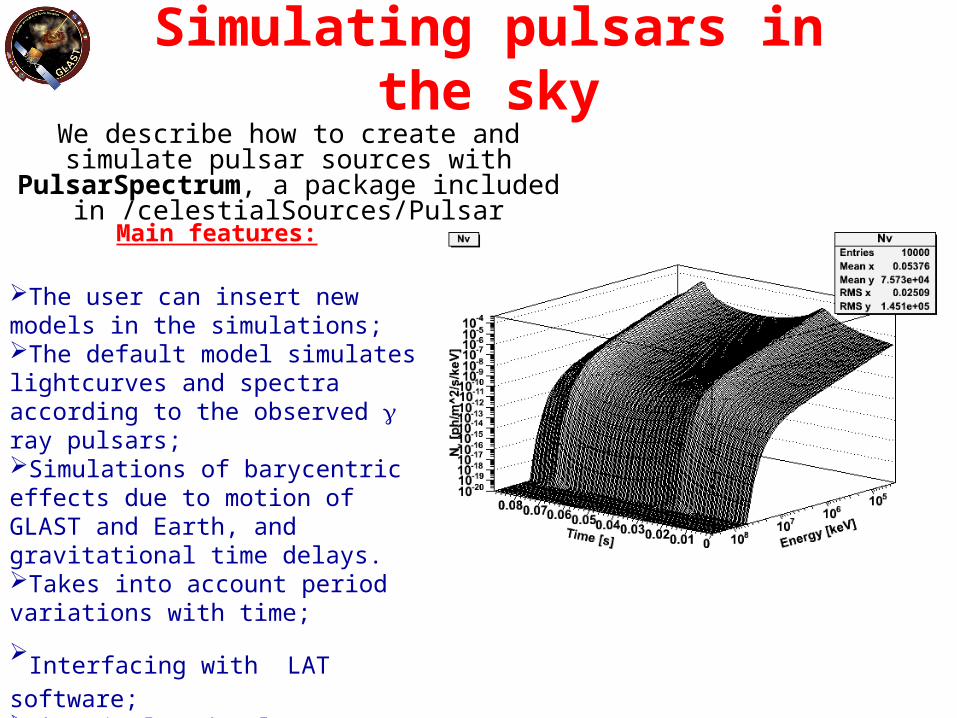
Main features:
The user can insert new models in the simulations;The default model simulates lightcurves and spectra according to the observed ray pulsars;Simulations of barycentric effects due to motion of GLAST and Earth, and gravitational time delays. Takes into account period variations with time;
Interfacing with LAT software;
The simulated pulsars can be easily put in the D4 Database.
We describe how to create and simulate pulsar sources with PulsarSpectrum, a package
included in /celestialSources/Pulsar
The lightcurve and spectrum are combined in a ROOT 2-d histogram like this, and from here the photons are extracted according to the flux

Simulating with gtobsimTo create a pulsar source suitable with gtobsim you have to follow 2 steps:
1 - Edit the PulsarDataList.txt file (located in /Pulsar/vXrYpZ/data), where are stored the general parameters of the pulsars know by the simulator
Flux E>100MeV Ephem. validity range T(>t0) where phi(t) = 0.0Period (or frequency) and derivatives
For more informations, please see at: www.pi.infn.it/~razzanoPulsar/PulsarSpTutor/PulsarSpTutor.htm
2 – Create an XML source entry in a xml file, where are stored the position, energy range and model-dependent parameters of the pulsar
Name as in Datalist Emax,Emin
RA,dec
Model (=1) & random seed
Model parameters
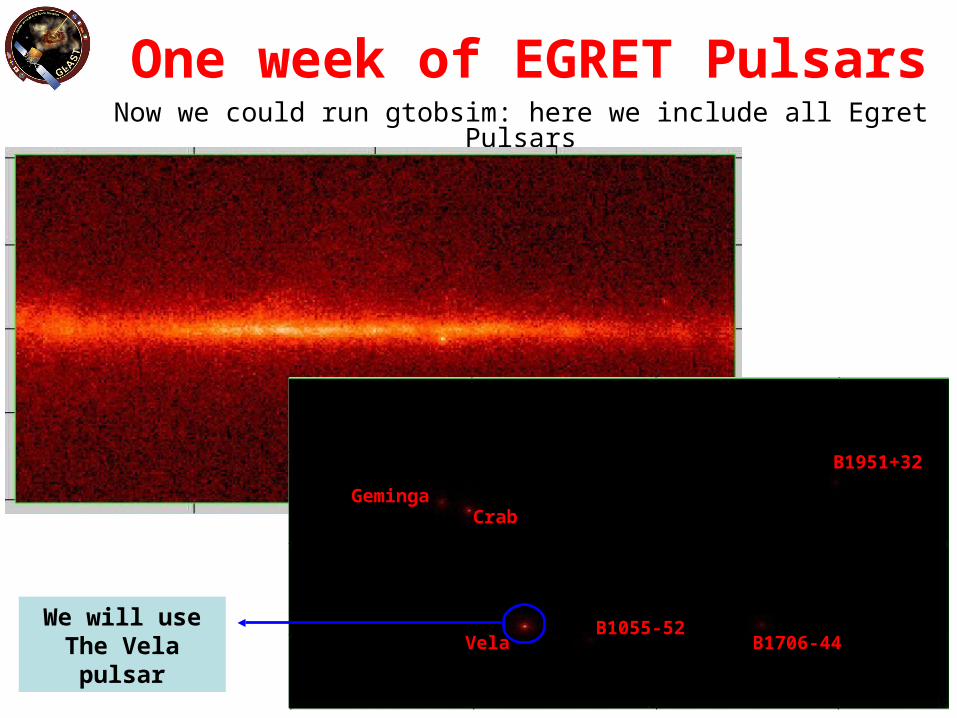
One week of EGRET PulsarsNow we could run gtobsim: here we include all Egret Pulsars
GemingaCrab
Vela B1706-44B1055-52
B1951+32
We will useThe Vela pulsar
First of all, we select with gtselect (/DataSubSelector package) the region of the pulsar, with a radius compatible with the PSF, in order to reduce the number of background photons. Alternatively One could
vary the radius with energy, because PSF vary with radius. We choose a fixed radius of 2 degrees
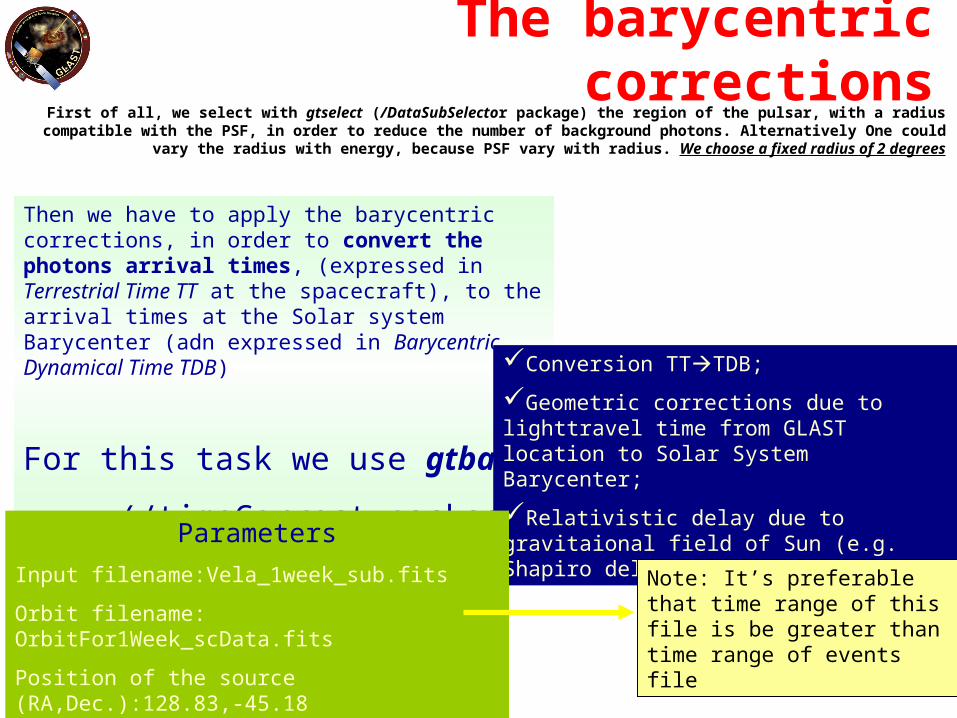
The barycentric corrections
Then we have to apply the barycentric corrections, in order to convert the photons arrival times, (expressed in Terrestrial Time TT at the spacecraft), to the arrival times at the Solar system Barycenter (adn expressed in Barycentric Dynamical Time TDB)
For this task we use gtbary
(/timeCorrect package)
Conversion TTTDB;
Geometric corrections due to lighttravel time from GLAST location to Solar System Barycenter;
Relativistic delay due to gravitaional field of Sun (e.g. Shapiro delay);
Parameters
Input filename:Vela_1week_sub.fits
Orbit filename: OrbitFor1Week_scData.fits
Position of the source (RA,Dec.):128.83,-45.18
Output filename:Vela_1week_bari.fits
Note: It’s preferable that time range of this file is be greater than time range of events file
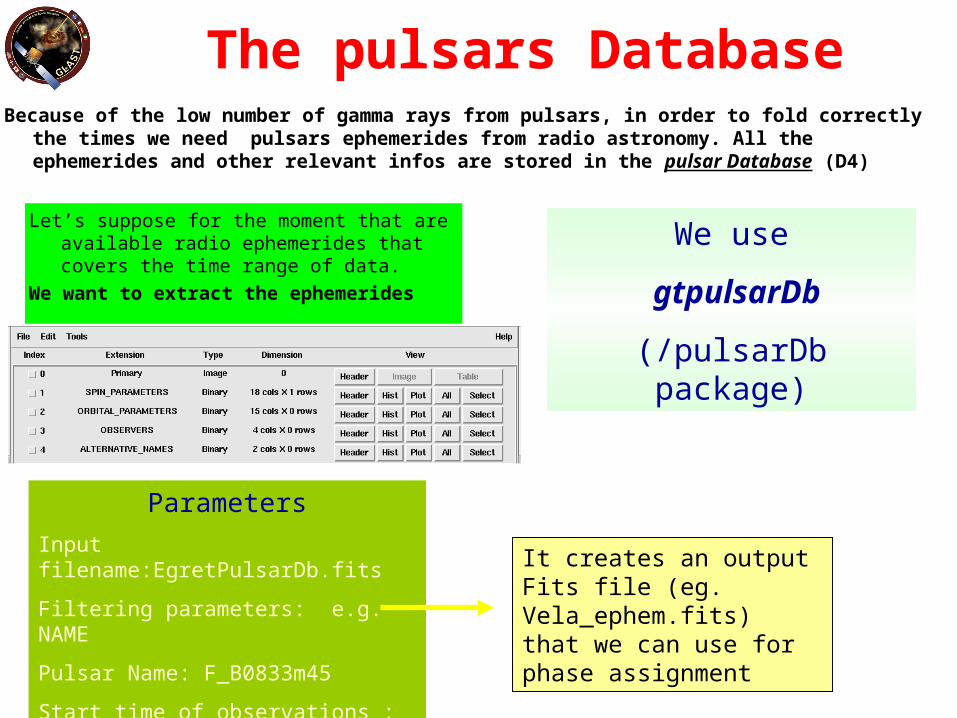
Because of the low number of gamma rays from pulsars, in order to fold correctly the times we need pulsars ephemerides from radio astronomy. All the ephemerides and other relevant infos are stored in the pulsar Database (D4)
The pulsars Database
We use
gtpulsarDb
(/pulsarDb package)
Let’s suppose for the moment that are available radio ephemerides that covers the time range of data.
We want to extract the ephemerides
Parameters
Input filename:EgretPulsarDb.fits
Filtering parameters: e.g. NAME
Pulsar Name: F_B0833m45
Start time of observations : 54101
End Time of observation : 54108
It creates an output Fits file (eg. Vela_ephem.fits) that we can use for phase assignment
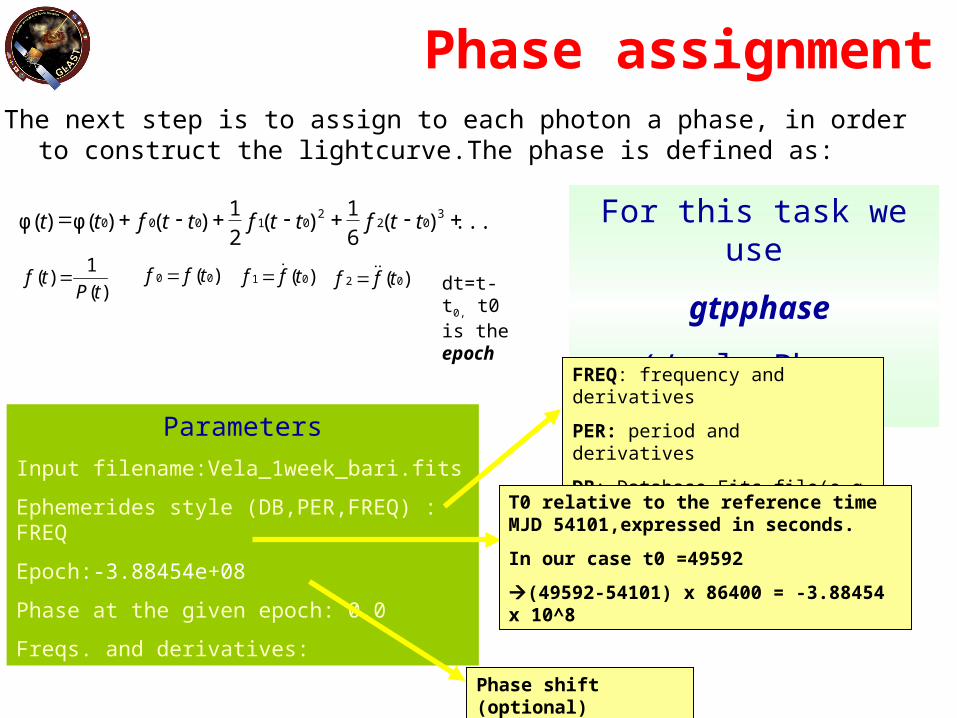
The next step is to assign to each photon a phase, in order to construct the lightcurve.The phase is defined as:
Phase assignment
)( 00 tff )( 01 tff )( 02 tff )(
1)(
tPtf
...)(6
1)(
2
1)()φ()φ( 3
022
01000 ttfttfttftt
dt=t-t0, t0 is the epoch
For this task we use
gtpphase
(/pulsePhase package)
Parameters
Input filename:Vela_1week_bari.fits
Ephemerides style (DB,PER,FREQ) : FREQ
Epoch:-3.88454e+08
Phase at the given epoch: 0.0
Freqs. and derivatives:
FREQ: frequency and derivatives
PER: period and derivatives
DB: Database Fits file(e.g D4 or Vela_ephem.fits)
T0 relative to the reference time MJD 54101,expressed in seconds.
In our case t0 =49592
(49592-54101) x 86400 = -3.88454 x 10^8
Phase shift (optional)
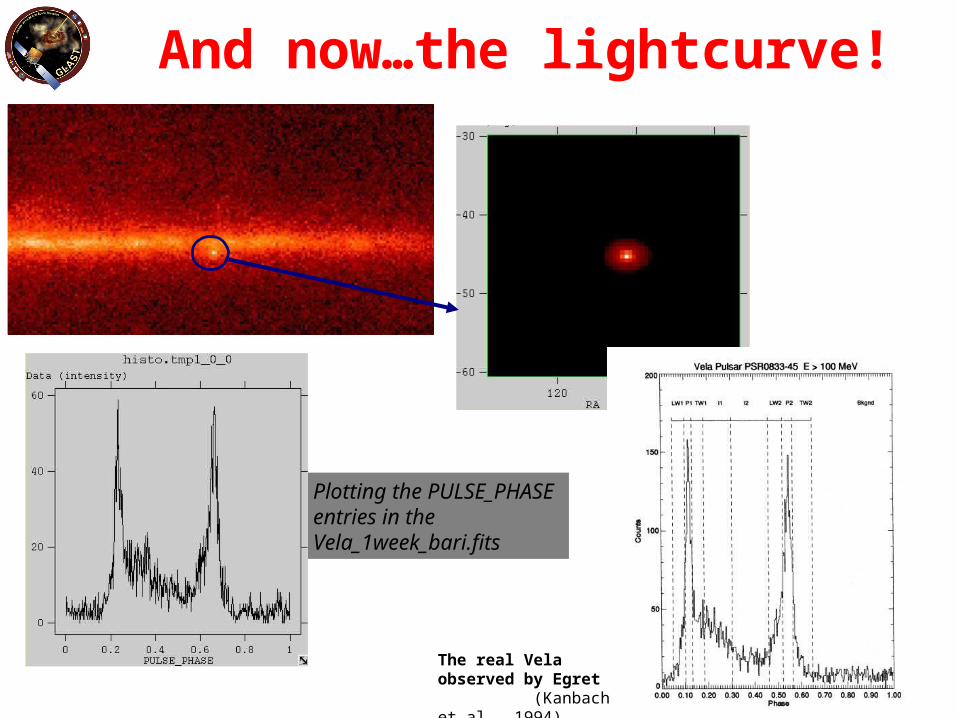
And now…the lightcurve!
Plotting the PULSE_PHASE entries in the Vela_1week_bari.fits
The real Vela observed by Egret (Kanbach et al. ,1994)
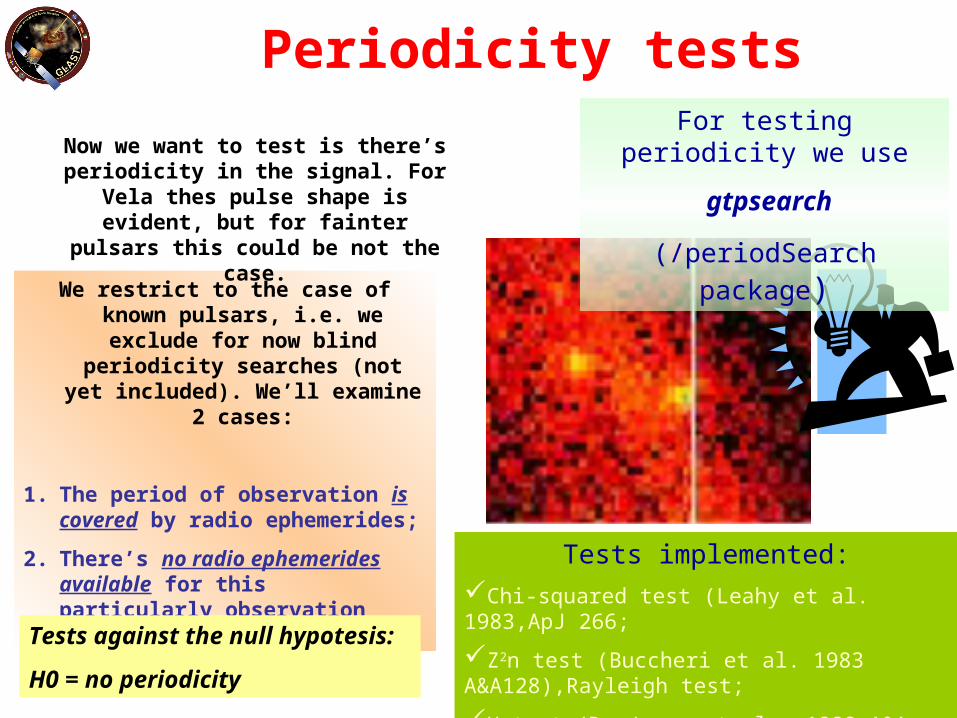
Periodicity tests
We restrict to the case of known pulsars, i.e. we exclude for now
blind periodicity searches (not yet included). We’ll examine 2 cases:
1. The period of observation is covered by radio ephemerides;
2. There’s no radio ephemerides available for this particularly observation time
Now we want to test is there’s periodicity in the signal. For Vela thes pulse shape is evident, but for fainter
pulsars this could be not the case.
For testing periodicity we use
gtpsearch
(/periodSearch package)
Tests implemented:Chi-squared test (Leahy et al. 1983,ApJ 266;
Z2n test (Buccheri et al. 1983 A&A128),Rayleigh test;
H test (De Jager et al., 1989 A&A 221)
Tests against the null hypotesis:
H0 = no periodicity
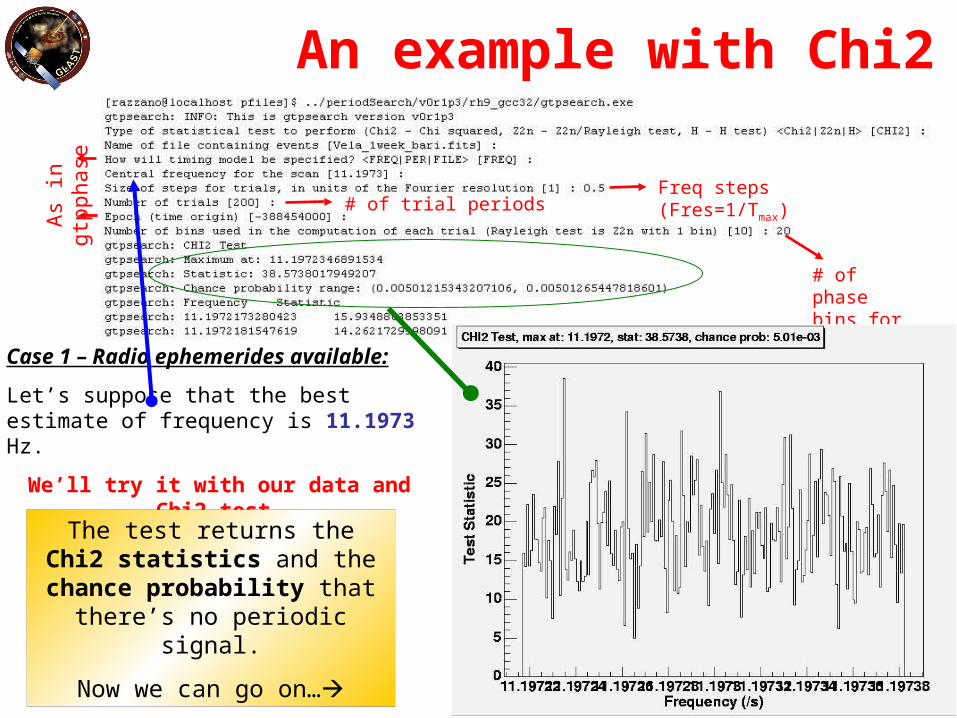
An example with Chi2
Case 1 – Radio ephemerides available:
Let’s suppose that the best estimate of frequency is 11.1973 Hz.
We’ll try it with our data and Chi2 test.
As
in g
tpph
ase
Freq steps (Fres=1/Tmax)# of trial periods
# of phase bins for Chi2
The test returns the Chi2 statistics and the chance probability that there’s no
periodic signal.
Now we can go on…
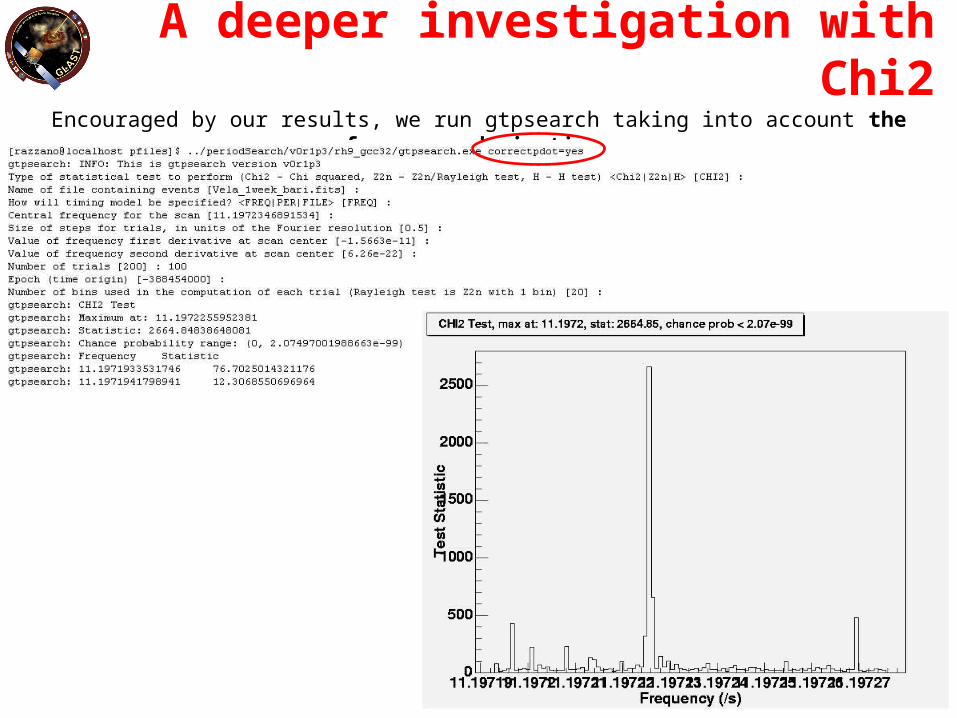
A deeper investigation with Chi2Encouraged by our results, we run gtpsearch taking into account the frequency derivatives
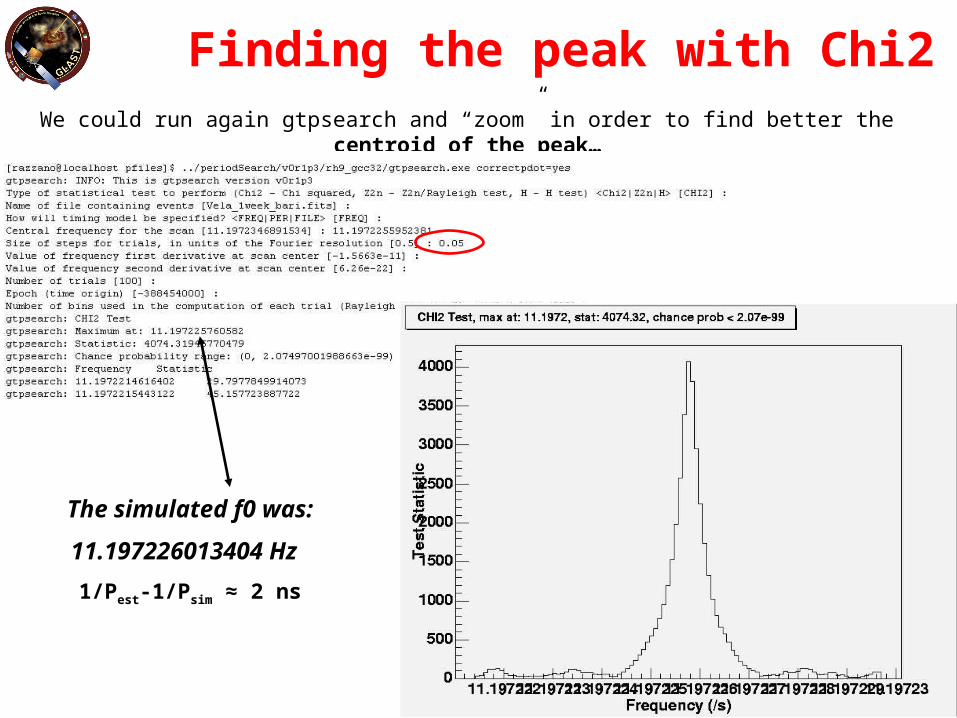
Finding the peak with Chi2We could run again gtpsearch and “zoom” in order to find better the centroid of the peak…
The simulated f0 was:
11.197226013404 Hz
1/Pest-1/Psim ≈ 2 ns
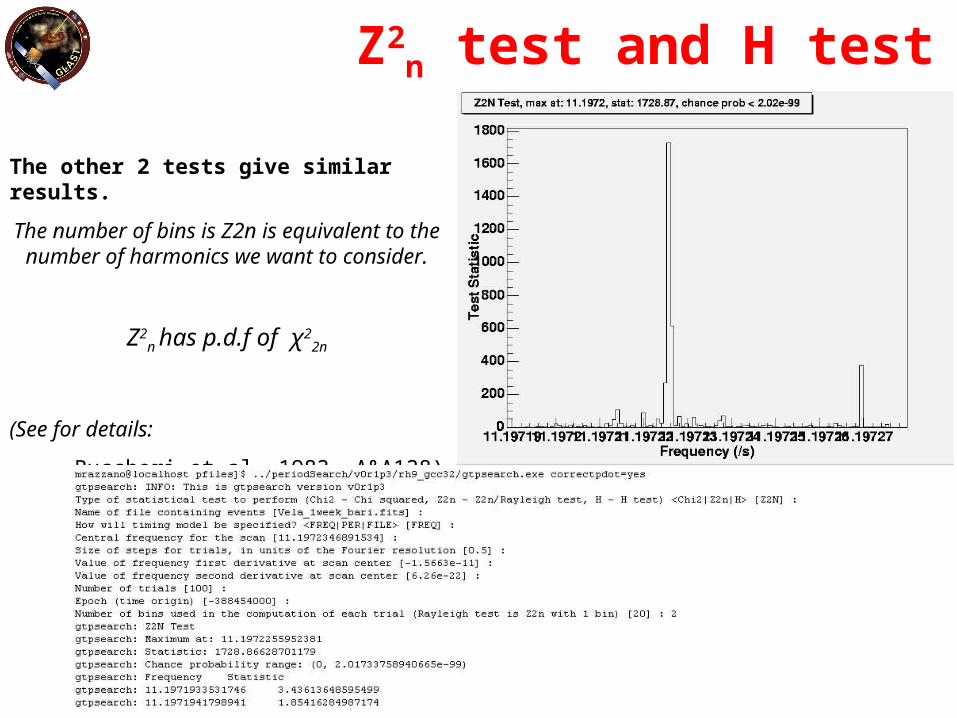
Z2n test and H test
The other 2 tests give similar results.
The number of bins is Z2n is equivalent to the number of harmonics we want to consider.
Z2n has p.d.f of χ2
2n
(See for details:
Buccheri et al. 1983, A&A128)

Z2n test and H test
The other 2 tests give similar results
The H test is more efficient for unknown a priori lightcurves
(see for details:
De Jager et al., 1989 A&A 221)
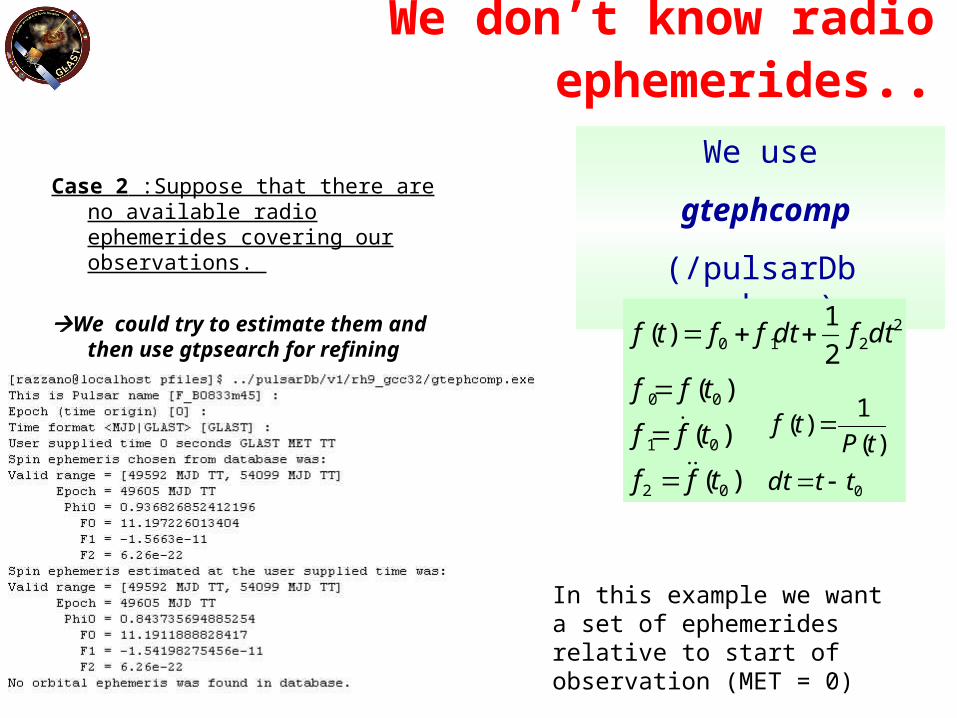
Case 2 :Suppose that there are no available radio ephemerides covering our observations.
We could try to estimate them and then use gtpsearch for refining search
We don’t know radio ephemerides..
We use
gtephcomp
(/pulsarDb package)
)(
)(
)(2
1)(
02
01
00
2210
tff
tff
tff
dtfdtfftf
0
)(
1)(
ttdt
tPtf
In this example we want a set of ephemerides relative to start of observation (MET = 0)
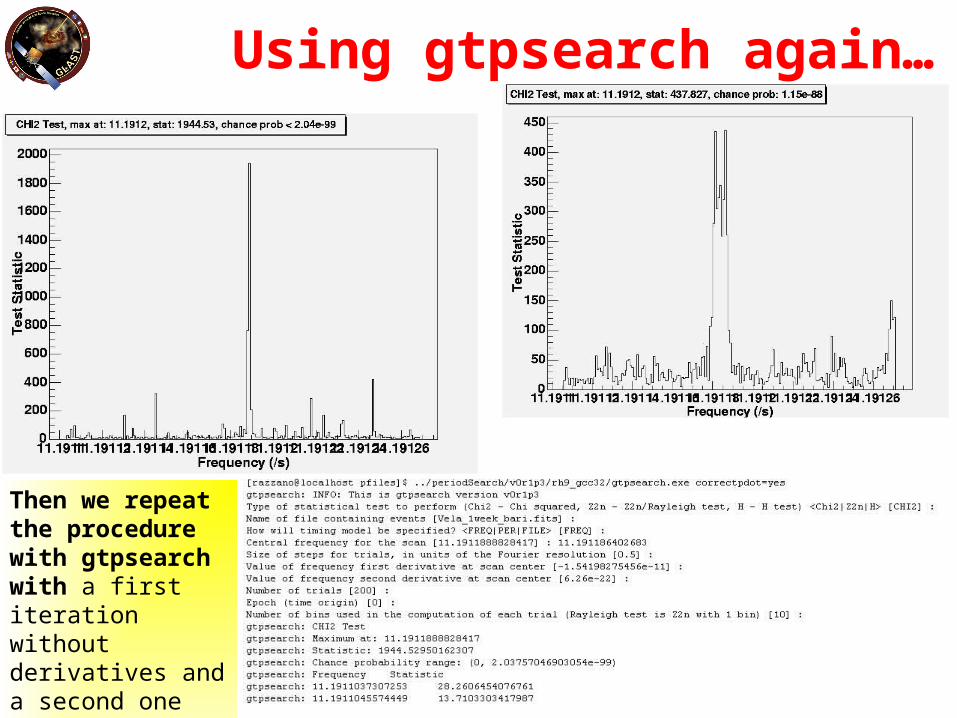
Using gtpsearch again…
Then we repeat the procedure with gtpsearch with a first iteration without derivatives and a second one with the frequency derivatives
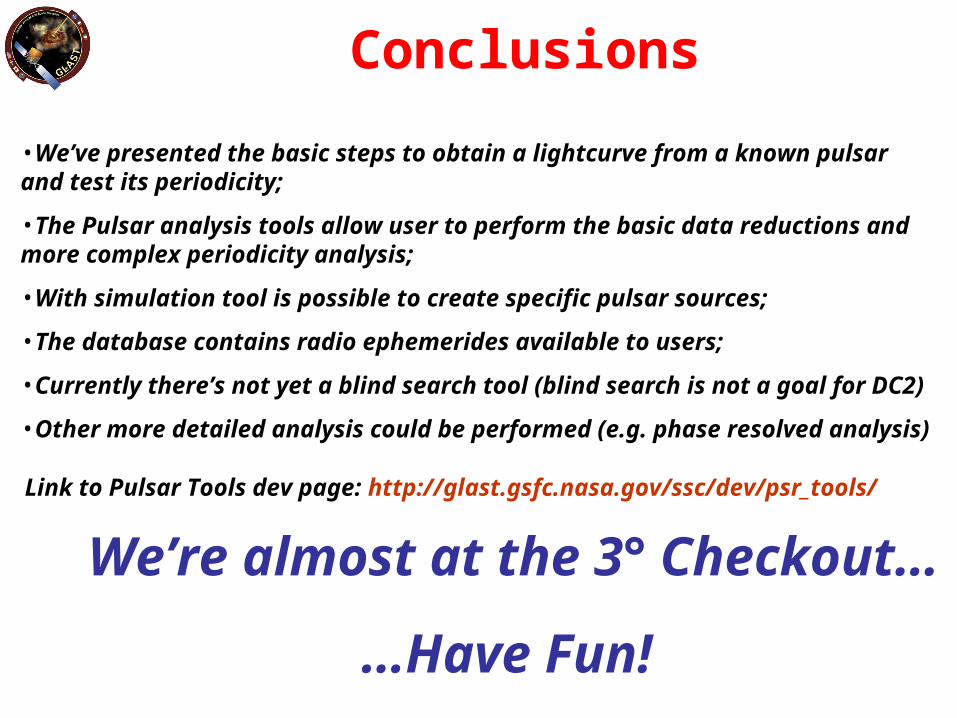
Conclusions
•We’ve presented the basic steps to obtain a lightcurve from a known pulsar and test its periodicity;
•The Pulsar analysis tools allow user to perform the basic data reductions and more complex periodicity analysis;
•With simulation tool is possible to create specific pulsar sources;
•The database contains radio ephemerides available to users;
•Currently there’s not yet a blind search tool (blind search is not a goal for DC2)
•Other more detailed analysis could be performed (e.g. phase resolved analysis)
We’re almost at the 3° Checkout…
…Have Fun!
Link to Pulsar Tools dev page: http://glast.gsfc.nasa.gov/ssc/dev/psr_tools/


![Strategiile Nucleare Sua[1][1]. Articol](https://img.pdfslide.us/doc/110x75/55cf936b550346f57b9d7a1b/strategiile-nucleare-sua11-articol.jpg)