Embed Size (px)
Citation preview
A short history of beverages and how our bodytreats them
A. Wolf1, G. A. Bray2 and B. M. Popkin3
1Schools of Medicine and Public Health,3Department of Nutrition, University of North
Carolina at Chapel Hill, Chapel Hill, NC;2Pennington Biomedical Research Center,
Louisiana State University, Baton Rouge, LA,
USA
Received 30 January 2007; revised 1 May
2007; accepted 10 May 2007
Address for correspondence: Professor BM
Popkin, Carolina Population Center, University
of North Carolina, 123 W. Franklin Street,
Chapel Hill, NC 27516-3997, USA. E-mail:
SummaryNumerous studies have demonstrated that beverages containing sugar, highfructose corn syrup (HFCS) or alcohol are handled differently by the body thanwhen sugar or HFCS are incorporated in solid foods and as a result the overallcaloric intake from solid food does not adjust to account for the calories inthese beverages. A consideration of our evolutionary history may help to explainour poor compensatory response to calories from fluids. This paper reviews thehistory of eight important beverages: milk, beer, wine, tea, coffee, distilled alco-holic beverages, juice and soft drinks. We arrive at two hypotheses. First, humansmay lack a physiological basis for processing carbohydrate or alcoholic calories inbeverage because only breast milk and water were available for the vast majorityof our evolutionary history. Alternatives to those two beverages appeared in thehuman diet no more than 11 000 years ago, but Homo sapiens evolved between100 000 and 200 000 years ago. Second, carbohydrate and alcohol-containingbeverages may produce an incomplete satiation sequence which prevents us frombecoming satiated on these beverages.
Keywords: Beverages, caloric compensation, water.
obesity reviews (2008) 9, 151–164
Introduction
The recent publication of a Beverage Guidance proposalhas increased the discussion of beverages and their healthbenefits. An extensive set of studies show that consump-tion of some calorie-rich beverages does not reduce intakeof solid food to maintain energy balance. The net result isthat when beverages containing sugar, high fructose cornsyrup (HFCS) or alcohol are consumed, the total caloricintake from solid food does not adjust appropriately(1–3). This is true for some beverages, but may not be truefor others. This review will attempt to put this issue intoperspective. It consists of three parts. The first will presentthe current pattern of beverage consumption and outlinethe trends over the past 30 years. The second part willexplore the historical appearance of beverages currentlyused by humankind. The final section will discuss the bio-logical differences between digestion of beverages andsolid foods.
Current beverage consumption patterns
US patterns of beverage consumption
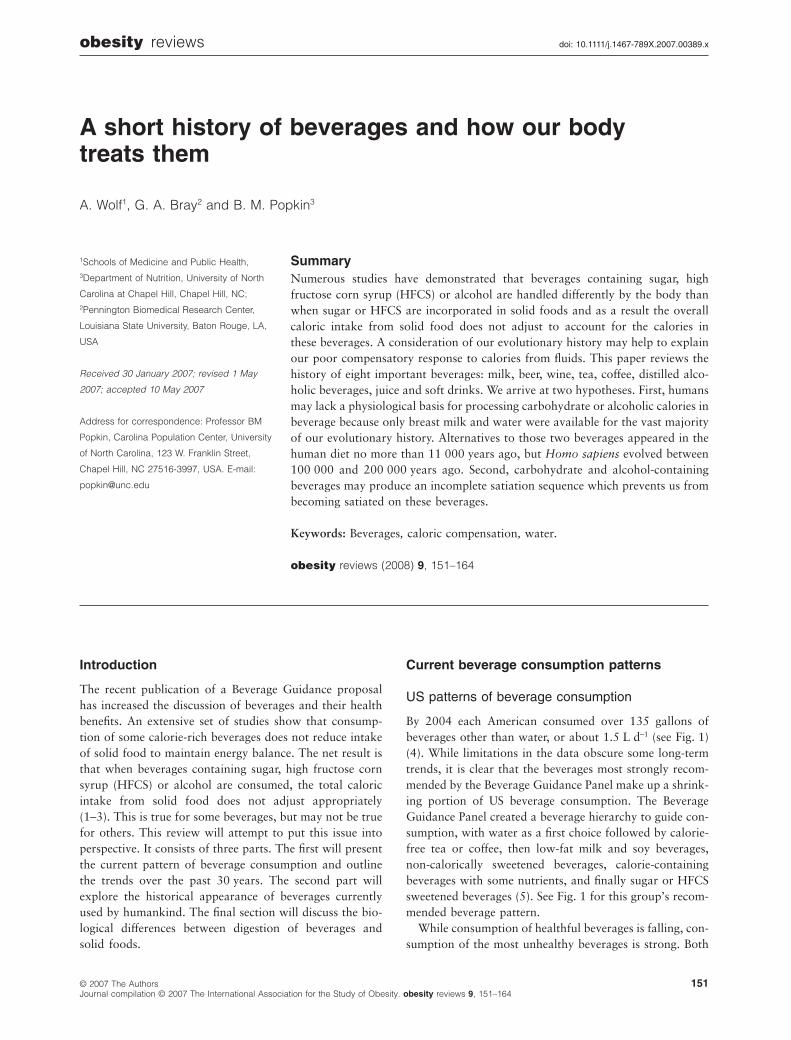
By 2004 each American consumed over 135 gallons ofbeverages other than water, or about 1.5 L d-1 (see Fig. 1)(4). While limitations in the data obscure some long-termtrends, it is clear that the beverages most strongly recom-mended by the Beverage Guidance Panel make up a shrink-ing portion of US beverage consumption. The BeverageGuidance Panel created a beverage hierarchy to guide con-sumption, with water as a first choice followed by calorie-free tea or coffee, then low-fat milk and soy beverages,non-calorically sweetened beverages, calorie-containingbeverages with some nutrients, and finally sugar or HFCSsweetened beverages (5). See Fig. 1 for this group’s recom-mended beverage pattern.
While consumption of healthful beverages is falling, con-sumption of the most unhealthy beverages is strong. Both
obesity reviews doi: 10.1111/j.1467-789X.2007.00389.x
151© 2007 The AuthorsJournal compilation © 2007 The International Association for the Study of Obesity. obesity reviews 9, 151–164
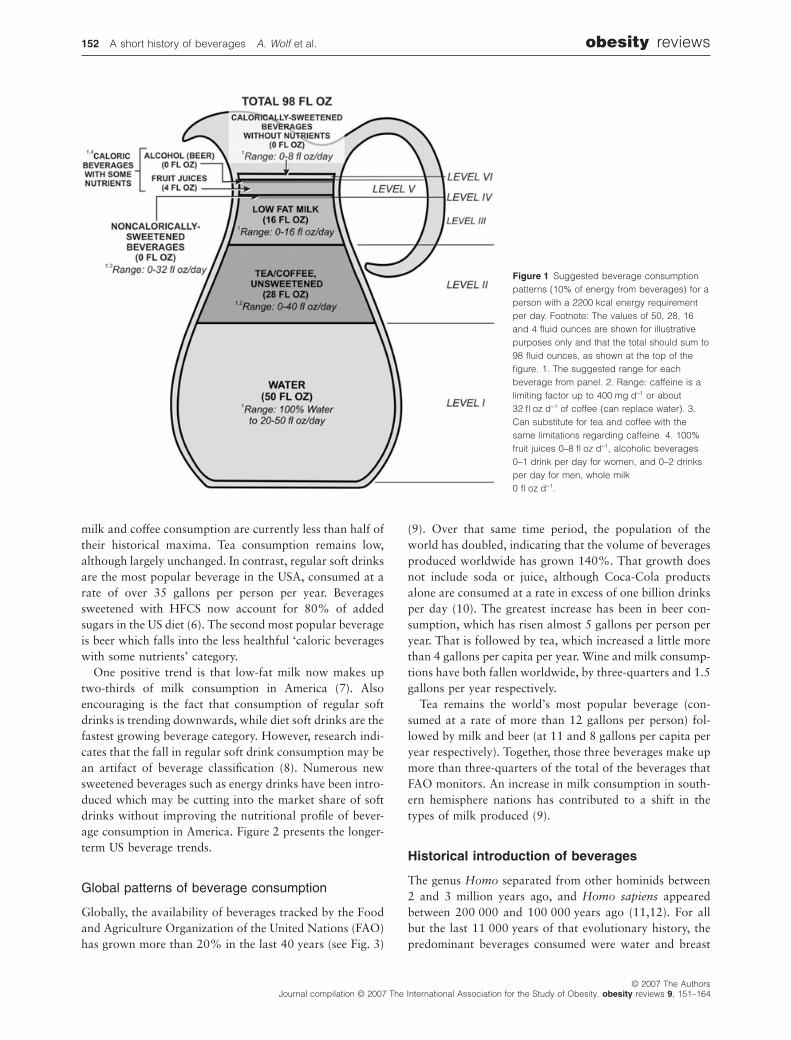
milk and coffee consumption are currently less than half oftheir historical maxima. Tea consumption remains low,although largely unchanged. In contrast, regular soft drinksare the most popular beverage in the USA, consumed at arate of over 35 gallons per person per year. Beveragessweetened with HFCS now account for 80% of addedsugars in the US diet (6). The second most popular beverageis beer which falls into the less healthful ‘caloric beverageswith some nutrients’ category.
One positive trend is that low-fat milk now makes uptwo-thirds of milk consumption in America (7). Alsoencouraging is the fact that consumption of regular softdrinks is trending downwards, while diet soft drinks are thefastest growing beverage category. However, research indi-cates that the fall in regular soft drink consumption may bean artifact of beverage classification (8). Numerous newsweetened beverages such as energy drinks have been intro-duced which may be cutting into the market share of softdrinks without improving the nutritional profile of bever-age consumption in America. Figure 2 presents the longer-term US beverage trends.
Global patterns of beverage consumption
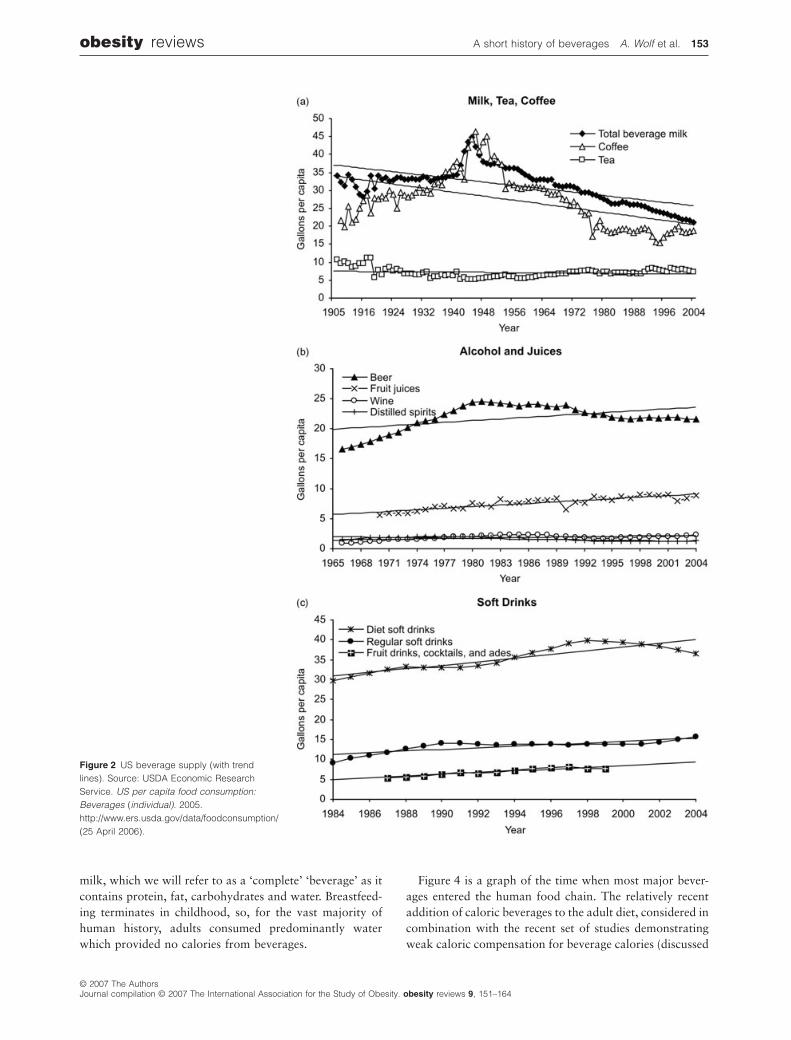
Globally, the availability of beverages tracked by the Foodand Agriculture Organization of the United Nations (FAO)has grown more than 20% in the last 40 years (see Fig. 3)
(9). Over that same time period, the population of theworld has doubled, indicating that the volume of beveragesproduced worldwide has grown 140%. That growth doesnot include soda or juice, although Coca-Cola productsalone are consumed at a rate in excess of one billion drinksper day (10). The greatest increase has been in beer con-sumption, which has risen almost 5 gallons per person peryear. That is followed by tea, which increased a little morethan 4 gallons per capita per year. Wine and milk consump-tions have both fallen worldwide, by three-quarters and 1.5gallons per year respectively.
Tea remains the world’s most popular beverage (con-sumed at a rate of more than 12 gallons per person) fol-lowed by milk and beer (at 11 and 8 gallons per capita peryear respectively). Together, those three beverages make upmore than three-quarters of the total of the beverages thatFAO monitors. An increase in milk consumption in south-ern hemisphere nations has contributed to a shift in thetypes of milk produced (9).
Historical introduction of beverages
The genus Homo separated from other hominids between2 and 3 million years ago, and Homo sapiens appearedbetween 200 000 and 100 000 years ago (11,12). For allbut the last 11 000 years of that evolutionary history, thepredominant beverages consumed were water and breast
Figure 1 Suggested beverage consumptionpatterns (10% of energy from beverages) for aperson with a 2200 kcal energy requirementper day. Footnote: The values of 50, 28, 16and 4 fluid ounces are shown for illustrativepurposes only and that the total should sum to98 fluid ounces, as shown at the top of thefigure. 1. The suggested range for eachbeverage from panel. 2. Range: caffeine is alimiting factor up to 400 mg d-1 or about32 fl oz d-1 of coffee (can replace water). 3.Can substitute for tea and coffee with thesame limitations regarding caffeine. 4. 100%fruit juices 0–8 fl oz d-1, alcoholic beverages0–1 drink per day for women, and 0–2 drinksper day for men, whole milk0 fl oz d-1.
152 A short history of beverages A. Wolf et al. obesity reviews
© 2007 The AuthorsJournal compilation © 2007 The International Association for the Study of Obesity. obesity reviews 9, 151–164
milk, which we will refer to as a ‘complete’ ‘beverage’ as itcontains protein, fat, carbohydrates and water. Breastfeed-ing terminates in childhood, so, for the vast majority ofhuman history, adults consumed predominantly waterwhich provided no calories from beverages.
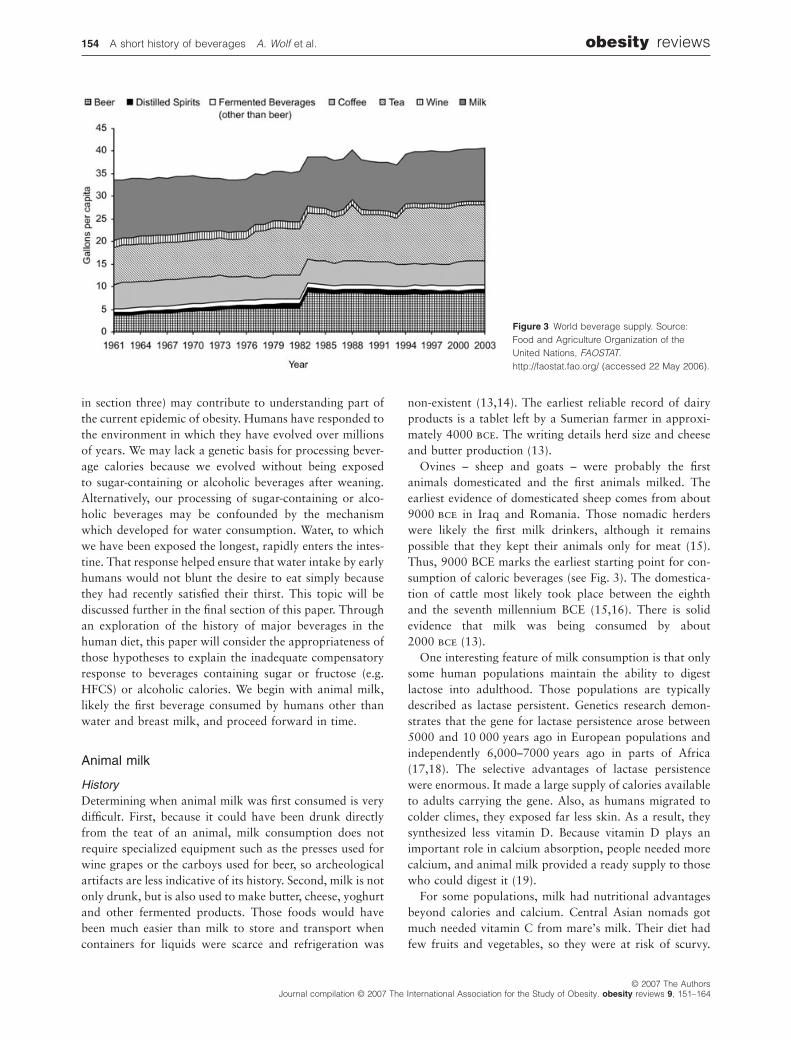
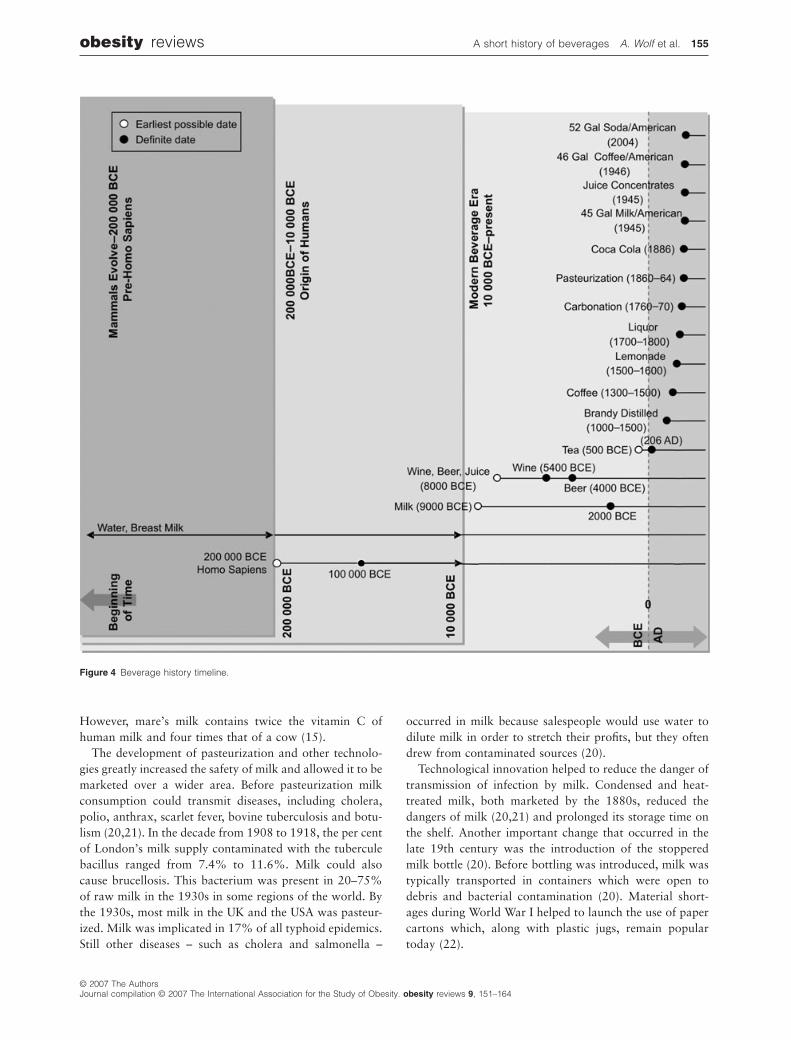
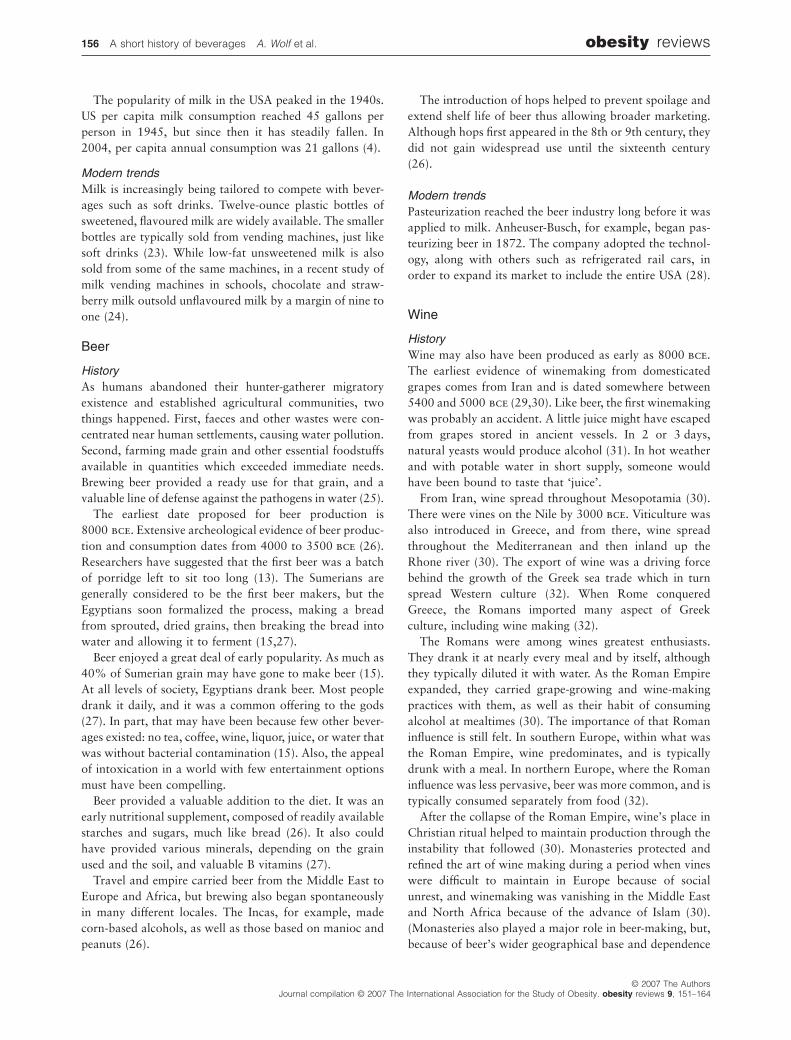
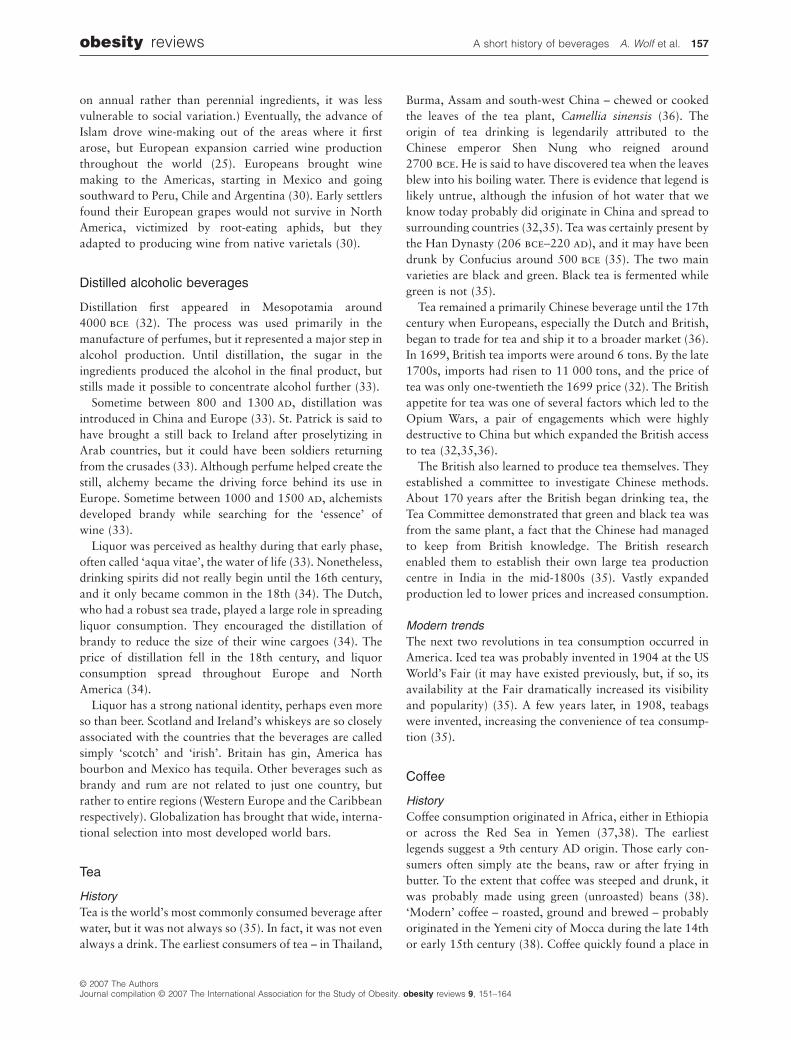
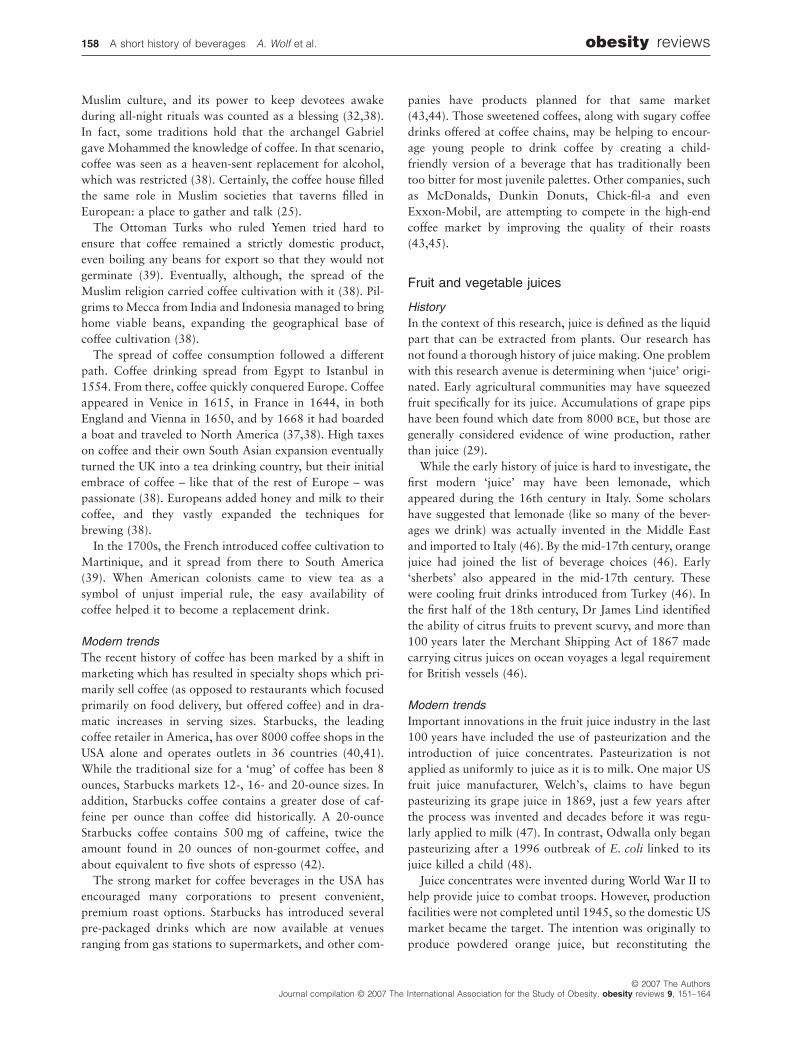
Figure 4 is a graph of the time when most major bever-ages entered the human food chain. The relatively recentaddition of caloric beverages to the adult diet, considered incombination with the recent set of studies demonstratingweak caloric compensation for beverage calories (discussed
Figure 2 US beverage supply (with trendlines). Source: USDA Economic ResearchService. US per capita food consumption:Beverages (individual). 2005.http://www.ers.usda.gov/data/foodconsumption/(25 April 2006).
obesity reviews A short history of beverages A. Wolf et al. 153
© 2007 The AuthorsJournal compilation © 2007 The International Association for the Study of Obesity. obesity reviews 9, 151–164
in section three) may contribute to understanding part ofthe current epidemic of obesity. Humans have responded tothe environment in which they have evolved over millionsof years. We may lack a genetic basis for processing bever-age calories because we evolved without being exposedto sugar-containing or alcoholic beverages after weaning.Alternatively, our processing of sugar-containing or alco-holic beverages may be confounded by the mechanismwhich developed for water consumption. Water, to whichwe have been exposed the longest, rapidly enters the intes-tine. That response helped ensure that water intake by earlyhumans would not blunt the desire to eat simply becausethey had recently satisfied their thirst. This topic will bediscussed further in the final section of this paper. Throughan exploration of the history of major beverages in thehuman diet, this paper will consider the appropriateness ofthose hypotheses to explain the inadequate compensatoryresponse to beverages containing sugar or fructose (e.g.HFCS) or alcoholic calories. We begin with animal milk,likely the first beverage consumed by humans other thanwater and breast milk, and proceed forward in time.
Animal milk
HistoryDetermining when animal milk was first consumed is verydifficult. First, because it could have been drunk directlyfrom the teat of an animal, milk consumption does notrequire specialized equipment such as the presses used forwine grapes or the carboys used for beer, so archeologicalartifacts are less indicative of its history. Second, milk is notonly drunk, but is also used to make butter, cheese, yoghurtand other fermented products. Those foods would havebeen much easier than milk to store and transport whencontainers for liquids were scarce and refrigeration was
non-existent (13,14). The earliest reliable record of dairyproducts is a tablet left by a Sumerian farmer in approxi-mately 4000 bce. The writing details herd size and cheeseand butter production (13).
Ovines – sheep and goats – were probably the firstanimals domesticated and the first animals milked. Theearliest evidence of domesticated sheep comes from about9000 bce in Iraq and Romania. Those nomadic herderswere likely the first milk drinkers, although it remainspossible that they kept their animals only for meat (15).Thus, 9000 BCE marks the earliest starting point for con-sumption of caloric beverages (see Fig. 3). The domestica-tion of cattle most likely took place between the eighthand the seventh millennium BCE (15,16). There is solidevidence that milk was being consumed by about2000 bce (13).
One interesting feature of milk consumption is that onlysome human populations maintain the ability to digestlactose into adulthood. Those populations are typicallydescribed as lactase persistent. Genetics research demon-strates that the gene for lactase persistence arose between5000 and 10 000 years ago in European populations andindependently 6,000–7000 years ago in parts of Africa(17,18). The selective advantages of lactase persistencewere enormous. It made a large supply of calories availableto adults carrying the gene. Also, as humans migrated tocolder climes, they exposed far less skin. As a result, theysynthesized less vitamin D. Because vitamin D plays animportant role in calcium absorption, people needed morecalcium, and animal milk provided a ready supply to thosewho could digest it (19).
For some populations, milk had nutritional advantagesbeyond calories and calcium. Central Asian nomads gotmuch needed vitamin C from mare’s milk. Their diet hadfew fruits and vegetables, so they were at risk of scurvy.
Figure 3 World beverage supply. Source:Food and Agriculture Organization of theUnited Nations, FAOSTAT.http://faostat.fao.org/ (accessed 22 May 2006).
154 A short history of beverages A. Wolf et al. obesity reviews
© 2007 The AuthorsJournal compilation © 2007 The International Association for the Study of Obesity. obesity reviews 9, 151–164
However, mare’s milk contains twice the vitamin C ofhuman milk and four times that of a cow (15).
The development of pasteurization and other technolo-gies greatly increased the safety of milk and allowed it to bemarketed over a wider area. Before pasteurization milkconsumption could transmit diseases, including cholera,polio, anthrax, scarlet fever, bovine tuberculosis and botu-lism (20,21). In the decade from 1908 to 1918, the per centof London’s milk supply contaminated with the tuberculebacillus ranged from 7.4% to 11.6%. Milk could alsocause brucellosis. This bacterium was present in 20–75%of raw milk in the 1930s in some regions of the world. Bythe 1930s, most milk in the UK and the USA was pasteur-ized. Milk was implicated in 17% of all typhoid epidemics.Still other diseases – such as cholera and salmonella –
occurred in milk because salespeople would use water todilute milk in order to stretch their profits, but they oftendrew from contaminated sources (20).
Technological innovation helped to reduce the danger oftransmission of infection by milk. Condensed and heat-treated milk, both marketed by the 1880s, reduced thedangers of milk (20,21) and prolonged its storage time onthe shelf. Another important change that occurred in thelate 19th century was the introduction of the stopperedmilk bottle (20). Before bottling was introduced, milk wastypically transported in containers which were open todebris and bacterial contamination (20). Material short-ages during World War I helped to launch the use of papercartons which, along with plastic jugs, remain populartoday (22).
Figure 4 Beverage history timeline.
obesity reviews A short history of beverages A. Wolf et al. 155
© 2007 The AuthorsJournal compilation © 2007 The International Association for the Study of Obesity. obesity reviews 9, 151–164
The popularity of milk in the USA peaked in the 1940s.US per capita milk consumption reached 45 gallons perperson in 1945, but since then it has steadily fallen. In2004, per capita annual consumption was 21 gallons (4).
Modern trendsMilk is increasingly being tailored to compete with bever-ages such as soft drinks. Twelve-ounce plastic bottles ofsweetened, flavoured milk are widely available. The smallerbottles are typically sold from vending machines, just likesoft drinks (23). While low-fat unsweetened milk is alsosold from some of the same machines, in a recent study ofmilk vending machines in schools, chocolate and straw-berry milk outsold unflavoured milk by a margin of nine toone (24).
Beer
HistoryAs humans abandoned their hunter-gatherer migratoryexistence and established agricultural communities, twothings happened. First, faeces and other wastes were con-centrated near human settlements, causing water pollution.Second, farming made grain and other essential foodstuffsavailable in quantities which exceeded immediate needs.Brewing beer provided a ready use for that grain, and avaluable line of defense against the pathogens in water (25).
The earliest date proposed for beer production is8000 bce. Extensive archeological evidence of beer produc-tion and consumption dates from 4000 to 3500 bce (26).Researchers have suggested that the first beer was a batchof porridge left to sit too long (13). The Sumerians aregenerally considered to be the first beer makers, but theEgyptians soon formalized the process, making a breadfrom sprouted, dried grains, then breaking the bread intowater and allowing it to ferment (15,27).
Beer enjoyed a great deal of early popularity. As much as40% of Sumerian grain may have gone to make beer (15).At all levels of society, Egyptians drank beer. Most peopledrank it daily, and it was a common offering to the gods(27). In part, that may have been because few other bever-ages existed: no tea, coffee, wine, liquor, juice, or water thatwas without bacterial contamination (15). Also, the appealof intoxication in a world with few entertainment optionsmust have been compelling.
Beer provided a valuable addition to the diet. It was anearly nutritional supplement, composed of readily availablestarches and sugars, much like bread (26). It also couldhave provided various minerals, depending on the grainused and the soil, and valuable B vitamins (27).
Travel and empire carried beer from the Middle East toEurope and Africa, but brewing also began spontaneouslyin many different locales. The Incas, for example, madecorn-based alcohols, as well as those based on manioc andpeanuts (26).
The introduction of hops helped to prevent spoilage andextend shelf life of beer thus allowing broader marketing.Although hops first appeared in the 8th or 9th century, theydid not gain widespread use until the sixteenth century(26).
Modern trendsPasteurization reached the beer industry long before it wasapplied to milk. Anheuser-Busch, for example, began pas-teurizing beer in 1872. The company adopted the technol-ogy, along with others such as refrigerated rail cars, inorder to expand its market to include the entire USA (28).
Wine
HistoryWine may also have been produced as early as 8000 bce.The earliest evidence of winemaking from domesticatedgrapes comes from Iran and is dated somewhere between5400 and 5000 bce (29,30). Like beer, the first winemakingwas probably an accident. A little juice might have escapedfrom grapes stored in ancient vessels. In 2 or 3 days,natural yeasts would produce alcohol (31). In hot weatherand with potable water in short supply, someone wouldhave been bound to taste that ‘juice’.
From Iran, wine spread throughout Mesopotamia (30).There were vines on the Nile by 3000 bce. Viticulture wasalso introduced in Greece, and from there, wine spreadthroughout the Mediterranean and then inland up theRhone river (30). The export of wine was a driving forcebehind the growth of the Greek sea trade which in turnspread Western culture (32). When Rome conqueredGreece, the Romans imported many aspect of Greekculture, including wine making (32).
The Romans were among wines greatest enthusiasts.They drank it at nearly every meal and by itself, althoughthey typically diluted it with water. As the Roman Empireexpanded, they carried grape-growing and wine-makingpractices with them, as well as their habit of consumingalcohol at mealtimes (30). The importance of that Romaninfluence is still felt. In southern Europe, within what wasthe Roman Empire, wine predominates, and is typicallydrunk with a meal. In northern Europe, where the Romaninfluence was less pervasive, beer was more common, and istypically consumed separately from food (32).
After the collapse of the Roman Empire, wine’s place inChristian ritual helped to maintain production through theinstability that followed (30). Monasteries protected andrefined the art of wine making during a period when vineswere difficult to maintain in Europe because of socialunrest, and winemaking was vanishing in the Middle Eastand North Africa because of the advance of Islam (30).(Monasteries also played a major role in beer-making, but,because of beer’s wider geographical base and dependence
156 A short history of beverages A. Wolf et al. obesity reviews
© 2007 The AuthorsJournal compilation © 2007 The International Association for the Study of Obesity. obesity reviews 9, 151–164
on annual rather than perennial ingredients, it was lessvulnerable to social variation.) Eventually, the advance ofIslam drove wine-making out of the areas where it firstarose, but European expansion carried wine productionthroughout the world (25). Europeans brought winemaking to the Americas, starting in Mexico and goingsouthward to Peru, Chile and Argentina (30). Early settlersfound their European grapes would not survive in NorthAmerica, victimized by root-eating aphids, but theyadapted to producing wine from native varietals (30).
Distilled alcoholic beverages
Distillation first appeared in Mesopotamia around4000 bce (32). The process was used primarily in themanufacture of perfumes, but it represented a major step inalcohol production. Until distillation, the sugar in theingredients produced the alcohol in the final product, butstills made it possible to concentrate alcohol further (33).
Sometime between 800 and 1300 ad, distillation wasintroduced in China and Europe (33). St. Patrick is said tohave brought a still back to Ireland after proselytizing inArab countries, but it could have been soldiers returningfrom the crusades (33). Although perfume helped create thestill, alchemy became the driving force behind its use inEurope. Sometime between 1000 and 1500 ad, alchemistsdeveloped brandy while searching for the ‘essence’ ofwine (33).
Liquor was perceived as healthy during that early phase,often called ‘aqua vitae’, the water of life (33). Nonetheless,drinking spirits did not really begin until the 16th century,and it only became common in the 18th (34). The Dutch,who had a robust sea trade, played a large role in spreadingliquor consumption. They encouraged the distillation ofbrandy to reduce the size of their wine cargoes (34). Theprice of distillation fell in the 18th century, and liquorconsumption spread throughout Europe and NorthAmerica (34).
Liquor has a strong national identity, perhaps even moreso than beer. Scotland and Ireland’s whiskeys are so closelyassociated with the countries that the beverages are calledsimply ‘scotch’ and ‘irish’. Britain has gin, America hasbourbon and Mexico has tequila. Other beverages such asbrandy and rum are not related to just one country, butrather to entire regions (Western Europe and the Caribbeanrespectively). Globalization has brought that wide, interna-tional selection into most developed world bars.
Tea
HistoryTea is the world’s most commonly consumed beverage afterwater, but it was not always so (35). In fact, it was not evenalways a drink. The earliest consumers of tea – in Thailand,
Burma, Assam and south-west China – chewed or cookedthe leaves of the tea plant, Camellia sinensis (36). Theorigin of tea drinking is legendarily attributed to theChinese emperor Shen Nung who reigned around2700 bce. He is said to have discovered tea when the leavesblew into his boiling water. There is evidence that legend islikely untrue, although the infusion of hot water that weknow today probably did originate in China and spread tosurrounding countries (32,35). Tea was certainly present bythe Han Dynasty (206 bce-220 ad), and it may have beendrunk by Confucius around 500 bce (35). The two mainvarieties are black and green. Black tea is fermented whilegreen is not (35).
Tea remained a primarily Chinese beverage until the 17thcentury when Europeans, especially the Dutch and British,began to trade for tea and ship it to a broader market (36).In 1699, British tea imports were around 6 tons. By the late1700s, imports had risen to 11 000 tons, and the price oftea was only one-twentieth the 1699 price (32). The Britishappetite for tea was one of several factors which led to theOpium Wars, a pair of engagements which were highlydestructive to China but which expanded the British accessto tea (32,35,36).
The British also learned to produce tea themselves. Theyestablished a committee to investigate Chinese methods.About 170 years after the British began drinking tea, theTea Committee demonstrated that green and black tea wasfrom the same plant, a fact that the Chinese had managedto keep from British knowledge. The British researchenabled them to establish their own large tea productioncentre in India in the mid-1800s (35). Vastly expandedproduction led to lower prices and increased consumption.
Modern trendsThe next two revolutions in tea consumption occurred inAmerica. Iced tea was probably invented in 1904 at the USWorld’s Fair (it may have existed previously, but, if so, itsavailability at the Fair dramatically increased its visibilityand popularity) (35). A few years later, in 1908, teabagswere invented, increasing the convenience of tea consump-tion (35).
Coffee
HistoryCoffee consumption originated in Africa, either in Ethiopiaor across the Red Sea in Yemen (37,38). The earliestlegends suggest a 9th century AD origin. Those early con-sumers often simply ate the beans, raw or after frying inbutter. To the extent that coffee was steeped and drunk, itwas probably made using green (unroasted) beans (38).‘Modern’ coffee – roasted, ground and brewed – probablyoriginated in the Yemeni city of Mocca during the late 14thor early 15th century (38). Coffee quickly found a place in
obesity reviews A short history of beverages A. Wolf et al. 157
© 2007 The AuthorsJournal compilation © 2007 The International Association for the Study of Obesity. obesity reviews 9, 151–164
Muslim culture, and its power to keep devotees awakeduring all-night rituals was counted as a blessing (32,38).In fact, some traditions hold that the archangel Gabrielgave Mohammed the knowledge of coffee. In that scenario,coffee was seen as a heaven-sent replacement for alcohol,which was restricted (38). Certainly, the coffee house filledthe same role in Muslim societies that taverns filled inEuropean: a place to gather and talk (25).
The Ottoman Turks who ruled Yemen tried hard toensure that coffee remained a strictly domestic product,even boiling any beans for export so that they would notgerminate (39). Eventually, although, the spread of theMuslim religion carried coffee cultivation with it (38). Pil-grims to Mecca from India and Indonesia managed to bringhome viable beans, expanding the geographical base ofcoffee cultivation (38).
The spread of coffee consumption followed a differentpath. Coffee drinking spread from Egypt to Istanbul in1554. From there, coffee quickly conquered Europe. Coffeeappeared in Venice in 1615, in France in 1644, in bothEngland and Vienna in 1650, and by 1668 it had boardeda boat and traveled to North America (37,38). High taxeson coffee and their own South Asian expansion eventuallyturned the UK into a tea drinking country, but their initialembrace of coffee – like that of the rest of Europe – waspassionate (38). Europeans added honey and milk to theircoffee, and they vastly expanded the techniques forbrewing (38).
In the 1700s, the French introduced coffee cultivation toMartinique, and it spread from there to South America(39). When American colonists came to view tea as asymbol of unjust imperial rule, the easy availability ofcoffee helped it to become a replacement drink.
Modern trendsThe recent history of coffee has been marked by a shift inmarketing which has resulted in specialty shops which pri-marily sell coffee (as opposed to restaurants which focusedprimarily on food delivery, but offered coffee) and in dra-matic increases in serving sizes. Starbucks, the leadingcoffee retailer in America, has over 8000 coffee shops in theUSA alone and operates outlets in 36 countries (40,41).While the traditional size for a ‘mug’ of coffee has been 8ounces, Starbucks markets 12-, 16- and 20-ounce sizes. Inaddition, Starbucks coffee contains a greater dose of caf-feine per ounce than coffee did historically. A 20-ounceStarbucks coffee contains 500 mg of caffeine, twice theamount found in 20 ounces of non-gourmet coffee, andabout equivalent to five shots of espresso (42).
The strong market for coffee beverages in the USA hasencouraged many corporations to present convenient,premium roast options. Starbucks has introduced severalpre-packaged drinks which are now available at venuesranging from gas stations to supermarkets, and other com-
panies have products planned for that same market(43,44). Those sweetened coffees, along with sugary coffeedrinks offered at coffee chains, may be helping to encour-age young people to drink coffee by creating a child-friendly version of a beverage that has traditionally beentoo bitter for most juvenile palettes. Other companies, suchas McDonalds, Dunkin Donuts, Chick-fil-a and evenExxon-Mobil, are attempting to compete in the high-endcoffee market by improving the quality of their roasts(43,45).
Fruit and vegetable juices
HistoryIn the context of this research, juice is defined as the liquidpart that can be extracted from plants. Our research hasnot found a thorough history of juice making. One problemwith this research avenue is determining when ‘juice’ origi-nated. Early agricultural communities may have squeezedfruit specifically for its juice. Accumulations of grape pipshave been found which date from 8000 bce, but those aregenerally considered evidence of wine production, ratherthan juice (29).
While the early history of juice is hard to investigate, thefirst modern ‘juice’ may have been lemonade, whichappeared during the 16th century in Italy. Some scholarshave suggested that lemonade (like so many of the bever-ages we drink) was actually invented in the Middle Eastand imported to Italy (46). By the mid-17th century, orangejuice had joined the list of beverage choices (46). Early‘sherbets’ also appeared in the mid-17th century. Thesewere cooling fruit drinks introduced from Turkey (46). Inthe first half of the 18th century, Dr James Lind identifiedthe ability of citrus fruits to prevent scurvy, and more than100 years later the Merchant Shipping Act of 1867 madecarrying citrus juices on ocean voyages a legal requirementfor British vessels (46).
Modern trendsImportant innovations in the fruit juice industry in the last100 years have included the use of pasteurization and theintroduction of juice concentrates. Pasteurization is notapplied as uniformly to juice as it is to milk. One major USfruit juice manufacturer, Welch’s, claims to have begunpasteurizing its grape juice in 1869, just a few years afterthe process was invented and decades before it was regu-larly applied to milk (47). In contrast, Odwalla only beganpasteurizing after a 1996 outbreak of E. coli linked to itsjuice killed a child (48).
Juice concentrates were invented during World War II tohelp provide juice to combat troops. However, productionfacilities were not completed until 1945, so the domestic USmarket became the target. The intention was originally toproduce powdered orange juice, but reconstituting the
158 A short history of beverages A. Wolf et al. obesity reviews
© 2007 The AuthorsJournal compilation © 2007 The International Association for the Study of Obesity. obesity reviews 9, 151–164
powder did not work well. Instead, the Florida FoodsCorporation (later to become Minute Maid) marketed anintermediate step in the powdering process as juice concen-trate (49).
Juice companies are expanding on the historic healthyprofile of their beverages by adding ingredients perceived toadd further health benefits. Perhaps the most common iscalcium- and Vitamin D-fortified orange juice, whichaccounted for 30% of Minute Maid juice sales in 2002(50). However, vitamins and minerals are not the onlyadditives being used. Spirulina, a blue-green algae, andherbs such as echinacea are also being mixed into juices(51).
Soft drinks
The addition of soft drinks (calorically sweetened bever-ages with no nutritional benefits other than water and asource of energy) to the beverage pantheon began (ratherironically) with the intention of making healthier water.Throughout the history of human civilization, waterbornepathogens had been a source of disease. As a result, waterwas viewed with some suspicion and superstition (52).Most agreed that good water was running water found ona mountain, and the finest of all waters were those thatcame from European spas (32). The early soft drink-makersset out to use the emergent tools of laboratory science toreproduce those famous, naturally carbonated waters.
Carbonation techniques utilizing chalk and acid weredeveloped in the 1760s (46,53). The resulting beverage wassometimes called soda water because early methods reliedon bicarbonate of soda to create carbonation. Other sub-stances such as pulverized marble were also used (53,54).
Soft drinks were first sold by Thomas Henry, a Britishpharmacist, who also published a pamphlet which helpeddisseminate the production techniques (54). The businessof selling soda water soon involved names still associatedwith soft drinks today, such as that of Jacob Schweppe. Hebegan selling seltzer in Geneva in 1789, and later moved toLondon (53). In the USA, Benjamin Silliman of NewHaven, CT is said to have been the first to produce carbon-ated water on a large scale, c. 1800 (53).
No one knows exactly when or by whom flavourings(and sweeteners) began to be added to seltzer (53). Mix-tures of wine and carbonated water became popular in thelate 18th and early 19th centuries (53). Effervescent lem-onade was being sold by 1833 (46). By the 1830s, flavoursyrups made from berries and fruit had been developed(53). In 1861, ginger ale was invented (53). That same year,the term ‘pop’ came to mean flavoured soft drink water inbottles (53). Flavours continued to diversify and by 1865,one supplier was advertising pineapple, black cherry,orange, apple, strawberry, raspberry, gooseberry, pear,melon, lemon, cherry, plum, grape, apricot and peach (53).
The invention of the ice cream soda is attributed to RobertGreen in 1874. However, by that time it was alreadycommon for American pharmacists to add sweet cream tothe seltzer they sold in their drug stores (46,53). Sarsapa-rilla and root beer were both added to the flavour reper-toire before the turn of the century (46).
The soft drink industry expanded rapidly. In 1860 therewere 123 plants bottling soft drink water in the USA (53).By 1870 there were 387, and by 1900 there were 2763 (53).The temperance movement in the USA and the UK contrib-uted to the continued rise of the soda fountain, makingpharmacies an alternative to bars (46).
Among the most important events in the history of softdrinks occurred in 1886 when J.S. Pemberton combinedkola, the caffeinated nut from Africa (and a popular drinkflavour in the UK) with coca, a stimulant from SouthAmerica (and the parent plant of cocaine) to create Coca-Cola. He marketed it in the same way as many carbonatedbeverages, as a ‘tonic’ (in this case for the brain) (46). DrPepper had been in existence since 1885; Pepsi wouldfollow in 1896 (53). In 1890, Coca-Cola sold 9000 gallonsof its flavour syrup (53). In 1892, the Coca-Cola Companyincorporated and authorized $100 000 in capital stock,and by 1904 one million gallons of Coca-Cola syrup werebeing sold annually (53).
Biological response to different beverages
Several studies show that intake of calorically sweetenedbeverages do not reduce the intake of solid food acorresponding amount (1,2,55–64). This issue has beenreviewed recently by Mattes who separates beverages intodifferent categories with respect to their effect on caloriecompensation (3). In 1990 Tordoff et al. reported thatdrinking aspartame sweetened beverages for 3 weeks pro-duced a small weight loss in comparison with a smallweight gain when the same subjects drank calorie sweet-ened beverages (63). This concept was extended in 1994when Mattes provided subjects with carbonated water,cola, or one of three varieties of beer with lunch. Energyintake was compared with the previous day. For all bever-ages except carbonated water, energy intake was signifi-cantly higher on the day the beverage was consumed thanon the previous day (1). In 2000, DiMeglio and Mattesassigned subjects to two groups: one was required toconsume 450 kcal d-1 as a soft drink, and the other toconsume the same energy as jelly beans. The participantscould eat any other food they wanted but had to keep arecord of consumption. The consumers of jelly beansreduced their caloric consumption by slightly more thanthe 450 kcal contained in the beans. The consumers ofcarbohydrate-containing soft drinks not only failed toreduce their caloric consumption to compensate for the softdrink, but also increased their consumption of other foods
obesity reviews A short history of beverages A. Wolf et al. 159
© 2007 The AuthorsJournal compilation © 2007 The International Association for the Study of Obesity. obesity reviews 9, 151–164
slightly. Subjects consuming soft drinks showed a small butsignificant weight gain over the course of the study whichdid not occur with consumption of jelly beans (2). Takentogether, these studies argue that sugar or HFCS calories inliquid beverages may not suppress intake of solid foods tohelp maintain energy balance. In a 2005 study, DellaValleet al. fed lunch to 44 women once a week for 6 weeks. Ateach meal, a different beverage was offered: water, dietcola, regular cola, orange juice, milk and no beverage. Onthe weeks when caloric beverages were consumed withthe meals, average calorie consumption increased by104 � 16 kcal over the level consumed when water, dietcola and no beverage were offered (62). The reduced com-pensation occurs in both men and women (64). The quan-tity of calorically sweetened beverages also increases as theportion size increases (64). Other studies not reviewed herealso demonstrate a lack of compensation for caloriesconsumed as beverages (56–61). See also the review byMattes (3).
Randomized clinical trials are one of the most importantways of examining responses to experimental manipula-tions. Probably the most convincing randomized study ofcalorie-sweetened beverages was performed by Raben et al.They conducted a 10-week double-blind study with 41overweight subjects given a fixed load of aspartame orsugar sweetened beverages (55). At the end of the study, thesubjects drinking the sugar-sweetened beverages gained1.6 kg and had a significant increase in blood pressurewhich contrasted with the weight loss of 1.0 kg in thesubjects drinking aspartame beverages. Three markers ofimmune response (haptoglobin, transferrin and c-reactiveprotein) were also increased in the subjects drinking sugar-sweetened beverages, compared with a decline in the sub-jects drinking the aspartame-sweetened beverages (65).
The mechanism responsible for that weaker compensa-tory response to some fluids is unknown (5). One possiblemechanism is the way in which the gastrointenstinal trackresponds to the form in which it is exposed to those nutri-ents. Solutions can have stronger sensory responses thansolid foods. Likewise, the components making up the bev-erages and solid foods, as well as the concentration of thesecomponents may play a role.
Figure 4 shows the characteristics of various beveragesdescribed above. The sight and smell of beverages are thefirst basis for response to the beverages and foods that weeat. If the sight or smell are ‘repugnant’, we may not eat,and we may also avoid food if there is ‘danger’ in theenvironment – the fight or flight response of Cannon (66).The next interaction is through the taste buds on thetongue. There are now five recognized tastes – sweet, sour,bitter, salty and umami – and a sixth one that has beenidentified in rodents and humans – the taste of fatty acids(67,68). There is also a response related to sickness and toallergy that can lead to ‘aversion’ to foods. For other foods,
the sight, smell and taste of food serve to initiate the vagalresponse – cephalic phase of digestion – that initiatesinsulin secretion and pancreatic secretion of enzymes thatparticipate in the early phase of food digestion. In additionto initiating gastro-intestinal responses, the oral cavity hasenzymes that can digest triglycerides (lingual lipase releasedfrom von Ebner’s glands) and disaccharides.
In the stomach, several important events occur inresponse to food. First, the food is mixed and partiallydigested by peptidases and amylases to reach sizes suitablefor entry into the small intestine. Second, the osmolality ofthe gastric contents are adjusted to close to the osmolalityof other body fluids by secreting fluids into the stomach.Third, the gastric contents become acid, an environment inwhich the gastric enzymes can work. The mixture in thestomach then enters the intestine through the pylorus, aprocess that is controlled by caloric density and fat contentof the foods. In studies in non-human primates, the rate ofemptying was about 1 cal min-1 (69). Water, the preferredbeverage in the Beverage Guidance System and the primarysource of fluid for early human beings is rapidly emptiedfrom the stomach, as it has no calories. Other beveragesslow gastric emptying with foods containing fat slowing itthe most (69).
As the gastric digest moves into the intestine, it is furtherdigested by intestinal and pancreatic enzymes. Table 1 is asummary of some features of the gastric and intestinalpeptides that are released in the presence or absence ofnutrients. These peptides are released from endocrine cells inthe gastro-intestinal track or nerve fibres and ganglia withinthe intestinal mucosa or from the endocrine cells in the isletof the pancreas, and have been subdivided in this tableaccording to the storage and release site. What is directlyrelevant to this discussion is the relation of nutrients in thefood to the pattern of gastrointestinal hormone secretionfrom the gastrointestinal (GI) track. Most of these peptidesserve to reduce food intake, but two of them, ghrelin andpancreatic polypeptide can increase food intake. Thepeptides come largely from two large families: the secre-tin superfamily [vasoactive intestinal polypeptide (VIP);glucose-dependent insulinotropic polypeptide (GIP); gluca-gon; glucagon-like polypeptide-1 and -2; pituitary-adenylcyclase-activating peptide; growth hormone releasinghormone; and oxyntomodulin], and the tachykinin super-family (substance P; bombesin; substance K; neuromedia K& B; and gastrin releasing peptide). The fats and proteins inmixed meals enhance release of cholecystokinin (CCK)secretin, polypeptide YY, VIP and neurotensin. In contrast,carbohydrate is only involved in the release of glucagon-likepeptide-1 and glucose insulino-trophic polypeptide (GIP)(Table 1). Protein, peptides and amino acids stimulate therelease of CCK, pancreatic polypeptide, glucagon, gastrin.Fasting and gastric or intestinal distension can also influencethe release of peptides with both ghrelin and motilin rising
160 A short history of beverages A. Wolf et al. obesity reviews
© 2007 The AuthorsJournal compilation © 2007 The International Association for the Study of Obesity. obesity reviews 9, 151–164
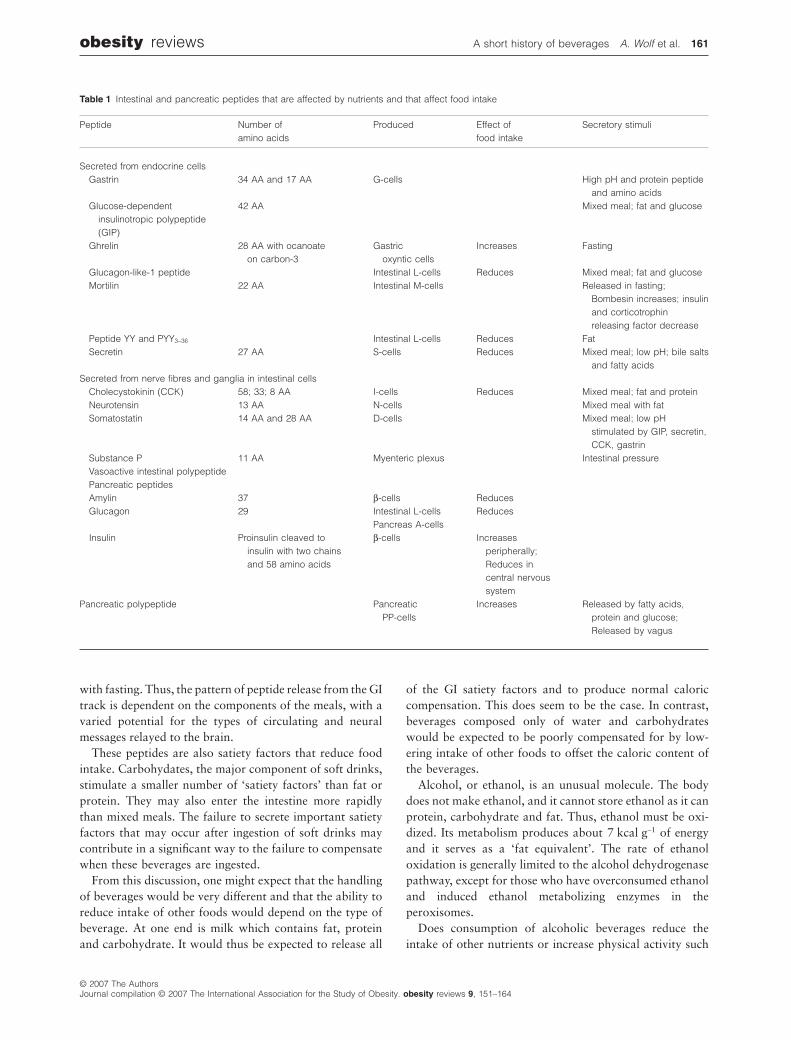
with fasting. Thus, the pattern of peptide release from the GItrack is dependent on the components of the meals, with avaried potential for the types of circulating and neuralmessages relayed to the brain.
These peptides are also satiety factors that reduce foodintake. Carbohydates, the major component of soft drinks,stimulate a smaller number of ‘satiety factors’ than fat orprotein. They may also enter the intestine more rapidlythan mixed meals. The failure to secrete important satietyfactors that may occur after ingestion of soft drinks maycontribute in a significant way to the failure to compensatewhen these beverages are ingested.
From this discussion, one might expect that the handlingof beverages would be very different and that the ability toreduce intake of other foods would depend on the type ofbeverage. At one end is milk which contains fat, proteinand carbohydrate. It would thus be expected to release all
of the GI satiety factors and to produce normal caloriccompensation. This does seem to be the case. In contrast,beverages composed only of water and carbohydrateswould be expected to be poorly compensated for by low-ering intake of other foods to offset the caloric content ofthe beverages.
Alcohol, or ethanol, is an unusual molecule. The bodydoes not make ethanol, and it cannot store ethanol as it canprotein, carbohydrate and fat. Thus, ethanol must be oxi-dized. Its metabolism produces about 7 kcal g-1 of energyand it serves as a ‘fat equivalent’. The rate of ethanoloxidation is generally limited to the alcohol dehydrogenasepathway, except for those who have overconsumed ethanoland induced ethanol metabolizing enzymes in theperoxisomes.
Does consumption of alcoholic beverages reduce theintake of other nutrients or increase physical activity such
Table 1 Intestinal and pancreatic peptides that are affected by nutrients and that affect food intake
Peptide Number ofamino acids
Produced Effect offood intake
Secretory stimuli
Secreted from endocrine cellsGastrin 34 AA and 17 AA G-cells High pH and protein peptide
and amino acidsGlucose-dependent
insulinotropic polypeptide(GIP)
42 AA Mixed meal; fat and glucose
Ghrelin 28 AA with ocanoateon carbon-3
Gastricoxyntic cells
Increases Fasting
Glucagon-like-1 peptide Intestinal L-cells Reduces Mixed meal; fat and glucoseMortilin 22 AA Intestinal M-cells Released in fasting;
Bombesin increases; insulinand corticotrophinreleasing factor decrease
Peptide YY and PYY3-36 Intestinal L-cells Reduces FatSecretin 27 AA S-cells Reduces Mixed meal; low pH; bile salts
and fatty acidsSecreted from nerve fibres and ganglia in intestinal cells
Cholecystokinin (CCK) 58; 33; 8 AA I-cells Reduces Mixed meal; fat and proteinNeurotensin 13 AA N-cells Mixed meal with fatSomatostatin 14 AA and 28 AA D-cells Mixed meal; low pH
stimulated by GIP, secretin,CCK, gastrin
Substance P 11 AA Myenteric plexus Intestinal pressureVasoactive intestinal polypeptidePancreatic peptidesAmylin 37 b-cells ReducesGlucagon 29 Intestinal L-cells Reduces
Pancreas A-cellsInsulin Proinsulin cleaved to
insulin with two chainsand 58 amino acids
b-cells Increasesperipherally;Reduces incentral nervoussystem
Pancreatic polypeptide PancreaticPP-cells
Increases Released by fatty acids,protein and glucose;Released by vagus
obesity reviews A short history of beverages A. Wolf et al. 161
© 2007 The AuthorsJournal compilation © 2007 The International Association for the Study of Obesity. obesity reviews 9, 151–164

that weight is maintained, or does alcohol consumptionadd on calories with a resulting increase in body weight?Alcoholic calories account for 102 kcal d-1 for the averageUS adult in 2002 and ranges as a percentage of daily energyintake for these adults from 3% to 9% (70,71), yet cross-sectional epidemiological studies show absent or weakpositive relations of alcohol and body mass index (BMI) inmen and negative relationship in women (72–74). Onelongitudinal study found that after 5 years of follow-upstable and ‘heavy’ drinkers had the greatest weight gain andhad the highest prevalence of high BMI (75). This contrastswith the lesser weight gain over 10 years in the NationalHealth Examination follow-up among both men andwomen drinkers as compared with non-drinkers.
Alcohol intake appears to be associated with little com-pensatory reduction in energy intake from other foods(76,77). When beverages containing glucose (dextrose) orethanol were given at one of two levels volunteers compen-sated for about 37% of the extra energy whether it wasglucose or alcohol. Thus, total energy intake in this acutestudy increased by 13–27% (76). The second study inhealthy men gave them access to an alcohol beverage orplacebo before a lunch that was either high in fat or low infat. The combination of the alcoholic beverage with thehigh-fat meal increased energy intake by about 700 kcal.
Two explanations may be offered for the lack of weightgain and alcohol intake in the epidemiological studies whenit would be predicted from the short-term metabolic studiesshowing failure of compensation. The first is that individu-als who regularly consume modest amounts of alcohol maybe more physically active. Westerterp et al. (78) found thatindividuals with higher alcohol intake had higher physicalactivity on days when they consumed alcohol as well asdays when they did not. The second possibility is thatsubjects who are overweight underreport energy intakemore than subjects who are not (79).
Discussion
When human beings consume calories from carbohydrate-rich beverages, we do not reduce consumption of caloriesfrom solid food by the corresponding amount. The clearestrationale for that incomplete compensatory response is thatwe lack genetic information for a physiological responsefor responding to these beverage calories with completesatiation because we evolved with water as our majorsource of hydration. Beverages appeared in the human dietat the point in human evolution when selective pressuredramatically abated – just as the domestication of livestockand agricultural production reduced the risk of starvation.Although sugar-containing and alcoholic beverages containenergy (calories), these calories seem to be inadequatelysensed by the satiety mechanisms in the GI track whichcontrol appetite and body fat. That may be because pro-
cessing these types of beverage calories was not codified bymillennia of consumption in the way that food and milkcalories were.
The issue of satiation following beverage consumption isparticularly perplexing. Some would argue that beveragesdo produce satiation. Breast milk appears to satisfy thehunger of infants. Some researchers have found similarresults when adults are asked to report their feelings ofsatiety after drinking a beverage (80). What is missing iscaloric compensation in food consumption. Individualsconsuming beverages shortly before or with a meal eat thesame number of calories as individuals consuming acalorie-free beverage (1,2,56–62). Thus, it appears thatsome beverages do not trigger satiation in the same waythat food does, and in fact may require a separate vocabu-lary for describing the feelings they create. One explanationmay be the different patterns of peptides released from thegastrointestinal track when we drink any caloric sweetener(sucrose or HFCS normally) or alcoholic beverages as com-pared with milk or solid food. These patterns are a key partof the inhibition of food intake and sugar-containing andalcoholic beverages may produce inadequate inhibitorymessages.
Beverage choices have expanded with ever increasingrapidity since humans first created settlements. In the lasthalf century, new options have appeared extremely rapidly.Sports drinks, energy drinks and high-calorie alcoholic bev-erages such as hard lemonade – just to name a few – haveall been added to long-standing options like milk, wine,beer, tea and coffee. Whether the history of beverages canhelp to guide us to healthier options and healthier choicesremains an important question.
Conflict of Interest Statement
No conflict of interest was declared.
Acknowledgements
The article was conceptualized by all three authors, thehistorical and current components were drafted by AW andBP, the biological component by GB, and all three workedon the final draft. Funding for this study comes from theNational Institutes of Health: (R01-CA109831, R01-CA121152, R01-HD30880 and R01-HD38700). We alsowish to thank Ms. Frances L. Dancy for administrativeassistance and Mr Tom Swasey for graphics support.
References
1. Mattes RD. Dietary compensation by humans for supplementalenergy provided as ethanol or carbohydrate in fluids. PhysiolBehav 1996; 59: 179–187.
162 A short history of beverages A. Wolf et al. obesity reviews
© 2007 The AuthorsJournal compilation © 2007 The International Association for the Study of Obesity. obesity reviews 9, 151–164
2. DiMeglio DP, Mattes RD. Liquid versus solid carbohydrate:effects on food intake and body weight. Int J Obes Relat MetabDisord 2000; 24: 794–800.3. Mattes RD. Fluid Energy-Where’s the Problem? J Am DietAssoc 2006; 106: 1956–1961.4. USDA Economic Research Service. U.S. per Capita FoodConsumption: Beverages (Individual). USDA: Washington, DC,2005.5. Popkin BM, Armstrong LE, Bray GM, Caballero B, Frei B,Willett WC. A new proposed guidance system for beverage con-sumption in the United States. Am J Clin Nutr 2006; 83: 529–542.6. Popkin BM, Nielsen SJ. The sweetening of the world’s diet.Obes Res 2003; 11: 1325–1332.7. Putnam J, Allshouse J. Trends in US per Capita Consumption ofDairy Products, 1909–2001. AmberWaves 2003; 1(3): 12–13.USDA [WWW document]. URL http://www.ers.usda.gov/Amberwaves/June03/DataFeature/ (accessed 11 July 2006).8. Nielsen SJ, Popkin BM. Changes in beverage intake between1977 and 2001. Am J Prev Med 2004; 27: 205–210.9. Food and Agriculture Organization of the United Nations.FAOSTAT. FAO: Rome, 2006.10. Coca Cola. [WWW document]. URL http://www2.coca-cola.com/contactus/faq/history_include.html (accessed 12 May2006).11. Wood BA. The history of the genus Homo. In: Ciochon RL,Fleagle JG (eds). The Human Evolution Source Book, 2nd edn.Pearson Prentice Hall: Upper Saddle River, NJ, 2006, pp. 222–227.12. Ciochon RL, Fleagle JG. Evolution of Homo sapiens. In:Ciochon RL, Fleagle JG (eds). The Human Evolution Source Book,2nd edn. Pearson Prentice Hall: Upper Saddle River, NJ, 2006, pp.601–603.13. Toussaint-Samat M. A History of Food. Blackwell Reference:Cambridge, MA, 1993.14. Vernon K. III.9. Milk and dairy products. In: Kiple KF,Ornelas KC (eds). The Cambridge World History of Food. Cam-bridge University Press: Cambridge, UK; New York, 2000, pp.692–702.15. Tannahill R. Food in History. New, fully rev. and updated edn.Crown Publishers: New York, 1989.16. Gade DW. II.G.5 Cattle. In: Kiple KF, Ornelas KC (eds). TheCambridge World History of Food. Cambridge University Press:Cambridge, UK; New York, 2000, pp. 489–496.17. Tishkoff SA, Reed FA, Ranciaro A, Voight BF, Babbitt CC,Silverman JS, Powell K, Mortensen HM, Hirbo JB, Osman M,Ibrahim M, Omar SA, Lema G, Nyambo TB, Ghori J, BumpsteadS, Pritchard JK, Wray GA, Deloukas P. Convergent adaptation ofhuman lactase persistence in Africa and Europe. Nat Genet 2006;39: 31–40.18. Swallow DM. Genetics of lactase persistence and lactose intol-erance. Annu Rev Genet 2003; 37: 197–219.19. Patterson KD. IV.E.6. Lactose Intolerance. In: Kiple KF,Ornelas KC (eds). The Cambridge World History of Food. Cam-bridge University Press: Cambridge, UK; New York, 2000, pp.1057–1062.20. Atkins PJ. White poison? The social consequences of milkconsumption, 1850–1930. Soc Hist Med 1992; 5: 207–227.21. Steele JH. History, trends, and extent of pasteurization. J AmVet Med Assoc 2000; 217: 175–178.22. Robertson G. The paper beverage carton: past and future.Food Technol 2002; 56: 46–52.23. Schoen G. Milking an idea. Sacramento Bee (California) April26, 2006;Sect. F2.24. Jones M. Milk vying with soda for pupils’ attention. Milwau-kee Journal Sentinel (Wisconsin) October 1, 2001;Sect. 1B.
25. Kiple KF, Ornelas KC. The Cambridge World History ofFood. Cambridge University Press: Cambridge, UK; New York,2000.26. Cantrell PA, II. III.1. Beer and ale. In: Kiple KF, Ornelas KC(eds). The Cambridge World History of Food. Cambridge Univer-sity Press: Cambridge, UK; New York, 2000, pp. 619–625.27. Hornsey IS, Royal Society of Chemistry (Great Britain). AHistory of Beer and Brewing. Royal Society of Chemistry:Cambridge, 2003.28. Plavchan RJ. A History of Anheuser-Busch, 1852–1933. ArnoPress: New York, 1976.29. Johnson H. Vintage: The Story of Wine. Simon and Schuster:New York, 1989.30. Newman JL. III.13. Wine. In: Kiple KF, Ornelas KC (eds). TheCambridge World History of Food. Cambridge University Press:Cambridge, UK; New York, 2000, pp. 730–737.31. Hyams E. Dionysus; A Social History of the Wine Vine.Macmillan: New York, 1965.32. Standage T. A History of the World in 6 Glasses. Walker &Co: New York, 2005.33. Comer J. III.5. Distilled Beverages. In: Kiple KF, Ornelas KC(eds). The Cambridge World History of Food. Cambridge Univer-sity Press: Cambridge, UK; New York, 2000, pp. 653–664.34. Austin GA, Southern California Research Institute. Alcoholin Western Society from Antiquity to 1800: A ChronologicalHistory. ABC-Clio Information Services: Santa Barbara, CA, 1985.35. Weisburger JH, Comer J. III.11. Tea. In: Kiple KF, Ornelas KC(eds). The Cambridge World History of Food. Cambridge Univer-sity Press: Cambridge, UK; New York, 2000, pp. 712–720.36. Macfarlane A, Macfarlane I. Green Gold: The Empire of Tea.Ebury: London, 2003.37. Ukers WH. The Romance of Coffee; An Outline History ofCoffee and Coffee-Drinking Through a Thousand Years, 1st edn.Tea and Coffee Trade Journal Co: New York, 1948.38. Topik SC. III.4. Coffee. In: Kiple KF, Ornelas KC (eds). TheCambridge World History of Food. Cambridge University Press:Cambridge, UK; New York, 2000, pp. 641–653.39. Pendergrast M. Uncommon Grounds: The History of Coffeeand How It Transformed Our World. Basic Books: New York,1999.40. Starbucks. Company Fact Sheet. May 2006 [WWW docu-ment]. URL http://www.starbucks.com/aboutus/Company_Fact_Sheet_Feb06.pdf (accessed 26 June 2006).41. Severson K. Is the bay area ready for its morning McLatte?The San Francisco Chronicle September 30, 2003;Sect. A1.42. Nutrition Action Health Letter Staff. Pour better or pourworse. Nutr Action Health Lett 2006; 33: 3–7.43. Egan C. Bottled iced coffee booming. Pittsburgh Post-GazetteJuly 23, 2001;Sect. B-2.44. Vuong M. Iced coffee; Grab a jolt of cool caffeine to go. TheHouston Chronicle May 17, 2006;Sect. 3.45. Lee E. No average Joe; Hot trend for that perfect cup spillsover to fast-food chains, home machines. The Atlanta Journal-Constitution October 27, 2005;Sect. 1E.46. Emmins C. III.10. Soft drinks. In: Kiple KF, Ornelas KC (eds).The Cambridge World History of Food. Cambridge UniversityPress: Cambridge, UK; New York, 2000, pp. 702–712.47. Welch’s. Company history. No date available.48. Denver Post staff and wire reports. Odwalla pleads guiltyJuice maker to pay for E. coli outbreak. The Denver Post July 24,1998;Sect. B-01.49. Minute Maid. History. 2005.50. News B. Minute Maid to add vitamin D to juices. TheHouston Chronicle March 15, 2002;Sect. 2.
obesity reviews A short history of beverages A. Wolf et al. 163
© 2007 The AuthorsJournal compilation © 2007 The International Association for the Study of Obesity. obesity reviews 9, 151–164
51. Nicholls W. Drinking your vitamins (and minerals). TheWashington Post July 29, 1998;Sect. E07.52. Hamlin C. III.12. Water. In: Kiple KF, Ornelas KC (eds).The Cambridge World History of Food. Cambridge UniversityPress: Cambridge, UK; New York, 2000, pp. 720–730.53. Riley JJ. A History of the American Soft Drink Industry;Bottled Carbonated Beverages, 1807–1957. American Bottlers ofCarbonated Beverages: Washington, DC, 1958.54. Chester T. Carbonated Beverages. P.H. Reilly: New York,1882.55. Raben A, Vasilaras TH, Moller AC, Astrup A. Sucrose com-pared with artificial sweeteners: different effects on ad libitum foodintake and body weight after 10 wk of supplementation in over-weight subjects. Am J Clin Nutr 2002; 76: 721–929.56. De Castro J. The effects of the spontaneous ingestion of par-ticular foods or beverages on the meal pattern and overall nutrientintake of humans. Physiol Behav 1993; 53: 1133–1144.57. Van Wymelbeke V, Beridot-Therond ME, de La GueronniereV, Fantino M. Influence of repeated consumption of beveragescontaining sucrose or intense sweeteners on food intake. Eur J ClinNutr 2004; 58: 154–161.58. Lavin JH, French SJ, Ruxton CH, Read NW. An investigationof the role of oro-sensory stimulation in sugar satiety? Int J ObesRelat Metab Disord 2002; 26: 384–388.59. Hagg A, Jacobson T, Nordlund G, Rossner S. Effects of milkor water on lunch intake in preschool children. Appetite 1998; 31:83–92.60. Beridot-Therond ME, Arts I, Fantino M, De La GueronniereV. Short-term effects of the flavour of drinks on ingestive behav-iours in man. Appetite 1998; 31: 67–81.61. Poppitt SD, Eckhardt JW, McGonagle J, Murgatroyd PR,Prentice AM. Short-term effects of alcohol consumption on appe-tite and energy intake. Physiol Behav 1996; 60: 1063–1070.62. DellaValle DM, Roe LS, Rolls BJ. Does the consumption ofcaloric and non-caloric beverages with a meal affect energy intake?Appetite 2005; 44: 187–193.63. Tordoff MG, Alleva AM. Effect of drinking soda sweetenedwith aspartame or high-fructose corn syrup on food intake andbody weight. Am J Clin Nutr 1990; 51: 963–969.64. Flood J, Roe L, Rolls B. The effect of increased beverageportion size on energy intake at a meal. J Am Diet Assoc 2006;106: 1984–1990.65. Sorensen L, Raben A, Stender S, Astrup A. Effect of sucrose oninflammatory markers in overweight humans. Am J Clin Nutr2005; 82: 421–427.66. Cannon W. The Wisdom of the Body. WW Norton & Co:New York, 1932.
67. Mattes RD. Fat taste and lipid metabolism in humans. PhysiolBehav 2005; 15: 691–697.68. Gilbertson TA, Liu L, Kim I, Burks CA, Hansen DR. Fattyacid responses in taste cells from obesity-prone and – resistant rats.Physiol Behav 2005; 86: 681–690.69. McHugh PR, Moran TH, Wirth JB. Postpyloric regulation ofgastric emptying in rhesus monkeys. Am J Physiol 1982; 3: R408–R415.70. Kant AK. Consumption of energy-dense, nutrient-poor foodsby adult Americans: nutritional and health implications. The thirdNational Health and Nutrition Examination Survey, 1988–1994.Am J Clin Nutr 2000; 72: 929–936.71. Duffey K, Popkin BM. Shifts in Patterns and Consumptionof Beverages Between 1965 and 2002. Unpublished manuscript.University of North Carolina: Chapel Hill, NC, 2007.72. Colditz GA, Giovannucci E, Rimm EB, Stampfer MJ, RosnerB, Speizer FE, Gordis E, Willett WC. Alcohol intake in relation todiet and obesity in women and men. Am J Clin Nutri 1991; 54:49–55.73. Liu S, Serdula MK, Williamson DF, Mokdad AH, Byers T. Aprospective study of alcohol intake and change in body weightamong US adults. Am J Epidemiol 1994; 15: 912–920.74. Arif AA, Rohrer JE. Patterns of alcohol drinking and its asso-ciation with obesity: data from the Third National Health andNutrition Examination Survey, 1988–1994. BMC Public Health2005; 5: 126.75. Wannamethee SG, Shaper AG. Alcohol, body weight, andweight gain in middle-aged men. Am J Clin Nutr 2003; 77: 1312–1317.76. Foltin RW, Kelly TH, Fischman MW. Ethanol as an energysource in humans: comparison with dextrose-containing bever-ages. Appetite 1993; 20: 95–110.77. Tremblay A, Wouters E, Wenker M, St-Pierre S, Bouchard C,Despres JP. Alcohol and a high-fat diet: a combination favoringoverfeeding. Am J Clin Nutr 1995; 62: 639–644.78. Westerterp KR, Meijer EP, Goris AH, Kester AD. Alcoholenergy intake and habitual physical activity in older adults. Br JNutr 2004; 91: 149–152.79. Westerterp KR, Goris AH. Validity of the assessment ofdietary intake: problems of misreporting. Curr Opin Clin NutrMetab Care 2002; 5: 489–493.80. Almiron-Roig E, Drewnowski A. Hunger, thirst, and energyintakes following consumption of caloric beverages. Physiol Behav2003; 79: 767–773.
164 A short history of beverages A. Wolf et al. obesity reviews
© 2007 The AuthorsJournal compilation © 2007 The International Association for the Study of Obesity. obesity reviews 9, 151–164