Embed Size (px)
Citation preview
■慶應義塾大学産業研究所社会心理学班研究モノグラフ/No.18
The Japanese
Career Progress Study:
A Seven-year Follow Up
■若林 満 ・南 隆男 ・佐野勝男
65
The Japanese Career Progress Study:A Seven-year Follow Up
Mitsuru Wakabayashi Department of Educational Psychology
Nagoya University
Takao Minami Department of Human Sciences
Keio University
Katsuo Sano Department of Human Sciences
Keio University
A longitudidal study on the process of managerial career progress was begun in 1972 in one of the largest department store chains in Japan . The study monitored the professional development of a cohort group of 80 newly recruited college graduates over their first three years in the company. Result of the study indicated that both
pre-employment selection test results and measured quality of vertical exchages bet-ween the newcomer and his immediate supervisor on the job were predictive of a wide range of career relevant outcomes (Wakabayashi & Minami 1978; Wakabayashi , Minami, Hashimoto, Sano, Graen & Novak, 1980; Wakabayashi , 1980). These results suggest that two managerial progress models developed in America , the human potential model developed in the AT&T Management Progress Study (Bray & Grant , 1966; Bray, C
ampbell & Grant, 1974) and the vertical exchange model developed in the Management Role Making Processes Project (Dansereau, Graen & Haga , 1975; Graen & Cashman, 1975; Liden & Graen, 1980) were both generalizable across cultural differences as a means of predicting outcomes of managerial progress in the Japanese organization . The present study examines the predictive validity of an integrated model which combines human potential and vertical exchange factors. For this purpose follow up data on pro-motion, salary and bonus seven years later were collected . Results show predictability after seven years for both the vertical exchange model and the integrated model . The implications of these results are discussed .
The human potential model assumes that managerial progress can be explained and pre-dicted on the basis of individual talents (Dun-nette, 1971). The manegerial assessment cen-ter was developed as a procedure to enhance this power of the human potential model (Bray & Grant, 1966; Bray, Campbell & Grant, 1974; Finkle, 1976; Henrichs, 1978). Results of these studies and those of others (Bentz, 1971; Greenwood & McNamara, 1967; Thomson, 1970) indicate that individual talents assessed before or very early in employment can pre-dict career progress outcomes for managers.
This model, however, pays little attention to the management development opportunities that occur during the formative years in an organization. Berlew and Hall (1966), for ex-ample, demonstrated that one important pre-dictor of career success was the experience of a "success syndrome" during the first year . This first year experience remained a signifi-cant predictor of later career success even after the effect of individual talents were partialled out. These findings point to the fruitfulness of incorporating developmental, opportunities in the study of managerial careers.
A series of longitudinal investigations con-ducted by Graen and his colleagues focusing upon the developmental opportunities of man-agers found that the quality of the vertical exchange relationship between manager and his/her immediate superior predicted a number
This research was supported in part by Grant No. 57-248 awarded to the first author by the Ishida Foundation, Nagoya.
A part of the results of this research was pre-sented at the Second Japan-United States Business Conference on April 4-6, 1983, Tokyo,
66 WAKABAYASHI, MINAMI, AND SANO
of career relevant outcomes: (1) leadership at-tention and support and severity of various
job problems (Dansereau, Graen & Haga, 1975), (2) job statisfaction, member contribu-tion to the work unit and job performance rating (Graen & Cashman, 1975; Liden & Graen, 1980), (3) agreement between leader and member on job issues (Graen & Schie-mann, 1978), and (4) turnover (Graen & Gins-burgh, 1977; Graen, Liden & Hoel, 1982). These longitudinal study results support the
predictive validity of the vertical exchange measure for a wide range of career develop-ment outcomes.
Past studies on role making processes tended to focus upon the effect of leader-member ex-change relations and to omit the influence of human potential or the interaction between vertical exchange and human potential upon management progress. One may assume that the high quality vertical exchange opportunity is offered only to the most talented members of the unit. Likewise, one may assume that only highly talented members can achieve a high quality exchange relationship with their leaders. However there is very little evidence supporting these assumptions.
Situational Model: A Synthesis In contrast to the traditional single-factor models, the present situational model assumes managerial career
progress requires both the talent variables of the human potential model and the exchange variables of the role making model.
Results of the Japanese management pro-
gress study (Wakabayashi, 1980; Wakabayashi, Minami, Hashimoto, Sano, Graen & Novak, 1980) indicate that the quality of vertical ex-change experienced by the newcomer during the first year in the organization was predic-tive of the level of organizational commitment, role disillusionment, job needs and problems, and job performance criteria evaluated in the second and third years. In addition, a human
potential measure that was a composite of selection tests administered by the company before employment was found to predict job
performance. The potential measure also show-ed a sigificant correlation (r=.30, p<.01) with the bonus that newcomers received during the
third year. Finally, the vertical exchange was found to moderate the relationship between human potential and organizational commit-ment, role disillusionment, job needs, and job
problems during the third year. The interac-tion showed that when the quality of the ver-tical exchange was high, human potential had low and null correlations with the outcomes, but when the quality of the exchange was low, the correlations between potential and the outcomes were strong and significant.
The above results suggest that both poten-tial and environmental factors (quality of vertical exchange) can make independent con-tribution to outcomes relevant to career pro-
gress. Thus, it is hypothesized that vertical exchange, human potential and their interac-tion will all contribute significantly to the pre-diction of career progress outcomes. To test this hypothesis, two sets of criterion data were collected: (1) the amount of bonus and the ratings of job performance and promotability for the 1972-1974 period and (2) the speed of
promotion, monthly salary and the amount of bonus received in the 1978 period.
Sample and Setting
Method
In April, 1972, 85 male college graduates started their career in one of the largest department store organizations in Japan. They were all recently
graduated from college, had no prior formal em-ployment, and passed the company's employment tests. The average age was 23.6 with more than 80 percent being between 23 and 24. All new-comers strated their jobs at the same hierarchical level. Eighty-seven percent earned their bachelor degrees in social sciences and humanities and the remaining 13 percent in engineering, industrial arts or design fields. The latter group of recruits were offered a slightly higher starting salary than the former, but within each category no further
pay differentials were observed. All recruits went through the two-month, in-house training. They were given their first formal assignment at either branch stores or main offices. About 70 percent were engaged in sales jobs, while the remaining were assigned to import/export, interior design,
personnel, and accounting. A pair composed of a focal newcomer and his supervisor was chosen as the unit of observation. This newcomer-supervisor
THE JAPANESE CA
unit called a "vertical dyad" (Graen, 1976) was monitored using a questionnaire method at seven different points in time during the first three years of the recruit's career. During this period, all recruits changed their supervisors at least once. Whenever changes occurred, new vertical dyads were identified for further monitoring.
By the end of 1974, 80 recruits (including their supervisors) completed all questionnaires and they were available for the analysis invoving 6 differ-ent monitoring periods (excluding the first ex-
ploratory survey) over three years. No question-naire survey was conducted since then, but to 1982, updated criterion data were collected from
personnel files of the company for the 1978 period. By this point in time, the number of recruits available for the analysis has dropped from 80 to 72 due to voluntary terminations.
REEK
Measures
Predictor scales. Five different scales were con-structed to be used as predictors (independent variables) in the regression analysis : (1) Vertical Exchange (VE), (2) Human Potential (HP_), (3) an interaction term between the two (VE X HP), (4) University Ranking (UR), and (5) characteristics of the First Job (FJ).
The vertical exchange scale was developed based on the English language questionnaire used by Graen & Cashman (1975), and Cashman, Dansereau, Graen & Haga (1976). For the present study, 11 questions were employed to tap the leader-member exchange : approachability and flexibility of the supervisor, his willingness to use his authority to help the newcomer solve problems, clarity of expectations and feedback, the newcomer's latitude to influence his supervisor to change his role situation, and chances to share after-hour social and leisure activities. Both newcomers and their supervisors were asked to respond from their own point of view regarding exchange by using a 4-point scale. An aggregate VE scale was constructed by using the newcomer's report at each monitoring point. This scale was found to have satisfactorily high reliability coefficients (Cronbach's alphas ranging from .87 to .92). Also, test-retest correlation co-efficients were computed for all possible combina-tions of time periods. Fifteen such correlations were produced ranging from .37 (the lowest) to .80
(the highest) with median r=.60. All correlations were found significant at the p<.01 level (Waka-bayashi, 1980). The above results indicated that the VE scale maintained very high internal consistency and good test-retest stability over time. Therefore,
PROGRESS STUDY 67
the newcomer's reports for the first three years
(from wave 2 to wave 7) on this instrument were aggregated to construct a measure that indicated the average level of vertical exchange that the
newcomer experienced during his first three years
(1972-1974) in the organization. The human potential scale was constructed by
using information derived from the company's
procedures for screening applicants for employ-ment. The company's procedures consisted of the following two steps. First, all applicants attended a one-day paper-and-pencil test session. During this session, they completed the incomplete sent-ences blank (Sano & Makita, 1960), an essay test, and a test of English proficiency. Personnel staff of the company scored and evaluated all tests. The incomplete sentences blank was scored regrarding the type of personality and intelligence level by trained company staff with the help of a psycholo-
gist. The essay was graded using a 4-point scale ; the test of English proficiency was rated using a 100-point scale. About two weeks later, the group of applicants who passed the first-stage screening based on the evaluation of the above test rusults, academic achievement, a personal history blank and references, were called in for the final selec-tion interview. The interview was conducted by a team of five executives. Interviewers were given test scores and background information on each applicant. Based on this information and an eval-uation of applicant's performance in interview session, they generated a group rating for each applicant. A composite potential scale was created using scores on intelligence, essay, English, and the interview. These four scores were standardized with a mean of 50 and a standard deviation 20. Then, a human potential score was computed by summing and dividing the aggregate by four. Intercorrelations among these four subscales were found high and consistent : with correlation co-efficients ranging from .17 to .59 (median r=.38). It was found that this potential scale had a satis-factory level of internal consistency (Cronbach's alpha=.76) to be used as a predictor for outcomes of the career development process of the new-comer (Wakabayashi, 1980).
An interaction term between Vertical Exchange and Human Potential scales were created as a VE X HP form, by multiplying vertical exchange by human potential scales. This term permits the regression equation to account for a portion of criterion variance by a combination of ver-tical exchange (VE) and human potential (HP)
(Kmenta, 1971). Since the VEXHP scores will
68 WAKABAYASHI,
adjust the effect of HP, the combined term is expected to take a minus sign after the positive effect , of HP is accounted for in the regression equation.
Two control variables were used. The first one, called University Ranking (UR), was created to evaluate the quality of universities from which newcomers graduated. It was found that 72 new-comers represented 22 different universities that were located either in the Tokyo or the Osaka area. Two graduate students and one faculty member rated these universities using a 4-point scale (from rank 1 to rank 4) with respect to its prestige believed to be attributed by the general public. Three raters agreed quite well. Agreement measures calculated in terms of correlation coeffici-ents among raters were .92, .90, and .88. The
university ranking represents the quality of educa-tion provided, quality of the student body and
quality of experiences by which students become socialized into business careers in Japan (Waka-bayashi, Graen, Sano, Minami & Hashimoto, 1977). It is hypothesized that this variable will- have a
positive effect upon career development outcomes. The second control variable was created as a
dummy variable to account for characteristics of the First Job (FJ) to which the newcomer was assigned. Within the company, it was generally believed that starting in a sales jobs in the large branch store would offer the most favorable op-
portunities to learn the ropes. Based on this in-formation, newcomers' first formal assignments were classified into (a) sales jobs in large branch stores (Tokyo, Osaka and Kyoto Branches), and
(b) all others. A value "1" was assigned to the former and "0" to the latter.
Among the five predictor variables, the UR, FJ, and HP scales represent influences that begin oper-ating before joining the organization. In other words, they predate career experience in the com-
pany. In contrast, the VE scale and the interaction between VE and HP represent influences that begin operating only after joining the organization.
Criterion measures. Two sets of criterion meas-ures were available for the analysis. One set included three measures that were collected during the 1972-1974 questionnaire survey period, and the other set consisted of three measures that were collected from company's personnel files of the 1978 period.
The amount of bonus earned by the newcomer during 1974, Bonus (1974), was derived from com-
pany's personnel files in the last year of the ques-tionnaire survey period, The raw yen value was
MINAMI, AND SANO
subject to analysis. The Promotability Index (1974) was created by using the company's appraisal of
the newcomer's potential. The appraisal was con- ducted at the end of the third year using a "mul-
tiple rater method" (Sano, Makita & Sekimoto, 1970).
For each newcomer, a team of raters (several bosses, the supervisor, the assistant supervisors,
several peers and several personnel staff members) were identified. They evaluated newcomer's pro-
motability on the basis of their day-to-day interac- tion with him on the job. Using a 6-point scale
they rated each newcomer on technical skill, ad- ministrative skill, interpersonal skill, energy and intelligence. For the present analysis, a promot-
ability score was computed for each newcomer by aggregating all ratings across both dimensions and
raters. An average measure of Job Performance
(1974) was constructed based upon data collected at six different points in time during the 1972-1974
survey period. The job performance instrument employed 9 items: (1) accountability, (2) alertness,
(3) interpresonal skills, (4) planning, (5) technical skills, (6) know-how, (7) the level of contribution ,
(8) interpersonal attraction, and (9) willingness to contribute to the company. The supervisor was
asked to rate the job behavior of his subordinate
on each dimension using a 5-point scale. The composite rating was the aggregate of 9 scores.
Reliability coefficients (Cronbach's alpha) computed for this measure at each time period produced satisfactory results, with alphas ranging from .88
to .94. Also, coefficients of test-retest stability were calculated for all possible combinations be-
tween 6 time periods. Fifteen correlation coeffici- ents were produced, which distributed from the
lowest .15 to the highest.70 with a median r=.46. All coefficients except the lowest one were signifi-
cant at the p<.01 level (Wakabayashi, 1980). Based on the above results, performance ratings at 6
different points in time were aggregated to be used as a measure of the average performance level of
the newcomer for the first three years in the company.
In 1978, seven years after the initial question- naire suvery, most newcomers were granted the
first formal management position (a kakari-cho rank) in the company's managerial hierarchy. However, they were differentiated into three
groups at this point in terms of the Speed of Pro- motion (1978). The first group consisted of those
who were promoted in March, 1978; the second one of those who were promoted in November,
1978; and the last one were those who were not yet
promoted to the position by the end of 1978. The
THE JAPANESE
value "3" was assinged on the SP (1978) scale to those belonging to the first group (51 percent) ,
while those belonging to the second (36 percent) and the third group (13 percent) received the value
"2" and "1" respectively . This scale had a restricted range and a skewed distribution. Nonetheless , it
was an approximation to the full-fledged promotion variable. Company personnel files for the 1978
business period provided another pieces of criterion data : Salary (1978) and Bonas (1978). Raw yen
values were used as dependent variables for the regression analysis.
Analytic Procedures
The present analysis follows the method of hi-erarchical regression analysis (Cohen & Cohen, 1975). This method has been used extensively in leadership studies for evaluating that effect of leader behavior (Katerberg & Hom, 1981; Rousseau, 1978; Vecchio, 1982). The method was employed in the present analysis for the purpose of parti-tioning criterion variance into two parts : (a) the one to be explained by the before entry variables
(Human Potential, University Ranking and the First Job) and (b) the other to be explained by the after entry variables (Vertical Exchnge and VE x HP). For the first step, the before variables enter the regression. The squared multiple correlation (R2)
generated for each criterion represents the portion of variance explained by the before factors of career development. For the second step, the after variables are included in the regression in addi-tion to the before variables. Increases in R2 re-sulting from the inclusion of these variables repre-
Table 1 Correlation Coefficients
CA
Variables
1. Speed of Promotion (1978)
2. Salary (1978)
3. Bonus (1978) 4. Bonus (1974)
5. Promotability (1974)
6. Job Performance ('72-'74)
1 2 3
REEK PROGRESS STUDY 69
sents the unique effects of vertical exchange variables upon each criterion, that is , the change
that takes place after start of the career develop- ment process in the organization. This analysis tests (1) whether increases in R2 is large enough to have a statistical level of significance , and (2)
what portion of variance in each criterion can be explained by combining the before and after vari-
ables into regression equation. In addition , the effect of newcomer's first three-year performance
upon the 1978 criterion measures is examined by extending basically the same procedures as out-
lined above. For this part of analysis , job Perfor- mance (1972-1974) and Promotability Index (1974)
are included in the regression in addition to the before and after variables to explain Speed of Pro-
motion (1978), Salary (1978) and Bonus (1978).
Results
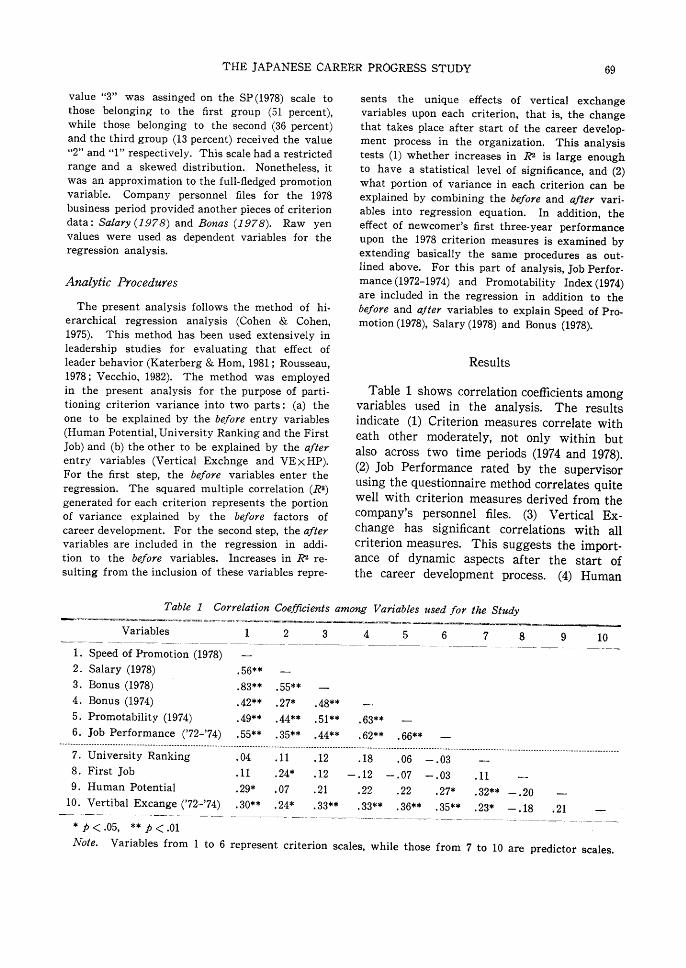
Table 1 shows correlation coefficients among variables used in the analysis. The results indicate (1) Criterion measures correlate with
eath other moderately, not only within but also across two time periods (1974 and 1978).
(2) Job Performance rated by the supervisor using the questionnaire method correlates quite
well with criterion measures derived from the company's personnel files . (3) Vertical Ex- change has significant correlations with all criterion measures. This suggests the import-
ance of dynamic aspects after the start of the career development process . (4) Human
among Variables used for the Study
4 5 6 7 8 9 10
.56**
.83**
.42**
.49**
.55**
.55**
.27*
.44**
.35**
.48**
.51**
.44**
.63**
.62** .66**
7. University Ranking
8. First Job 9. Human Potential
10. Vertibal Excange ('72-'74)
.04
.11
.29*
.30**
represent
11
24*
07
24*
12
12
21
33**
.18
- .12
.22
.33**
.06
-.07
.22
.36**
*p< .05, **p<.01
Note. Variables from 1 to 6 criterion scales, while those
.03
.03
.27*
.35**
from 7
.11 ---
.32** -.20 -
.23* -.18 .21 -
to 10 are predictor scales .
Potential maintains consistent positive correla-tions with all criterion measures but that they are rather weak compared to those exhibited by Vertical Exchange. (5) University Ranking shows significant correlations with Human Potential and Vertical Exchange (but not with criterion measures) indicating the effect of college prestige upon the determinants of career development (but not upon the career outcome itself). (6) Vertical Exchange and Human Po-tential correlates with each other (r=.21) which indicates that the two predictors share a small amount of common variance.
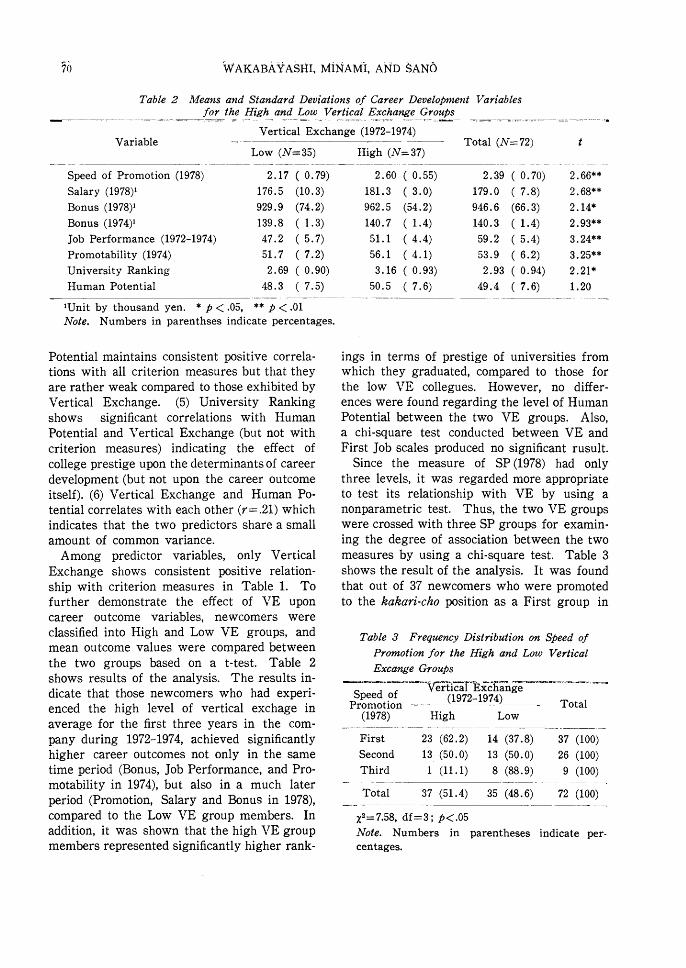
Among predictor variables, only Vertical Exchange shows consistent positive relation-ship with criterion measures in Table 1. To further demonstrate the effect of VE upon career outcome variables, newcomers were classified into High and Low VE groups, and mean outcome values were compared between the two groups based on a t-test. Table 2 shows results of the analysis. The results in-dicate that those newcomers who had experi-enced the high level of vertical exchage in average for the first three years in the com-
pany during 1972-1974, achieved significantly higher career outcomes not only in the same time period (Bonus, Job Performance, and Pro-motability in 1974), but also in a much later
period (Promotion, Salary and Bonus in 1978), compared to the Low VE group members. In addition, it was shown that the high VE group members represented significantly higher rank-
70 WAKABAIYASHI, MINAM4, AND SANG
Table 2 Means and Standard Deviations of Career Development Variables for the High and Low Vertical Exchange Groups
Vertical Exchange (1972-1974) Variable - - -- - Total (N=72) t
Low (N=35) High (N=37)
Speed of Promotion (1978) 2.17 ( 0.79) 2.60 ( 0.55) 2.39 ( 0.70) 2.66** Salary (1978)1 176.5 (10.3) 181.3 ( 3.0) 179.0 ( 7.8) 2.68** Bonus (1978)1 929.9 (74.2) 962.5 (54.2) 946.6 (66.3) 2.14* Bonus (1974)1 139.8 (1.3) 140.7 (1.4) 140.3 (1.4) 2.93** Job Performance (1972-1974) 47.2 ( 5.7) 51.1 ( 4.4) 59.2 ( 5.4) 3.24** Promotability (1974) 51.7 ( 7.2) 56.1 ( 4.1) 53.9 ( 6.2) 3.25** University Ranking 2.69 ( 0.90) 3.16 ( 0.93) 2.93 ( 0.94) 2.21* Human Potential 48.3 ( 7.5) 50.5 ( 7.6) 49.4 ( 7.6) 1.20
'Unit by thousand yen. * p <.05, ** p <.01 Note. Numbers in parenthses indicate percentages.
ings in terms of prestige of universities from which they graduated, compared to those for the low VE collegues. However, no differ-ences were found regarding the level of Human Potential between the two VE groups. Also, a chi-square test conducted between VE and First Job scales produced no significant rusult.
Since the measure of SP (1978) had only three levels, it was regarded more appropriate to test its relationship with VE by using a nonparametric test. Thus, the two VE groups were crossed with three SP groups for examin-ing the degree of association between the two measures by using a chi-square test. Table 3 shows the result of the analysis. It was found that out of 37 newcomers who were promoted to the kakari-cho position as a First group in
Table 3 Frequency Distribution on Speed of Promotion for the High and Low Vertical
Excange Groups
Speed of Aw Vertical Exchange- ~z~. =e:,. .,~ (1972-1974) Promotion Total
(1978) High Low
First 23 (62.2) 14 (37.8) 37 (100) Second 13, (50.0) 13 (50.0) 26 (100) Third 1 (11.1) 8 (88.9) 9 (100)
Total 37 (51.4) 35 (48.6) 72 (100)
X2=7.58, df=3; p<.05
Note. Numbers in
centages.parentheses indicate per-
THE JAPANESE CAREER PROGRESS STUDY
1978, 23 (62.2 percent) were derived from the high VE group, while the remaining 14 (37.8
percent) represented the low VE group. No differences were found for the Second promo-tion group. However, among those who were not yet promoted in 1978 (the Third group) about 90 percent (8 out of 9) were found be-longing to the low VE group. The above results clearly indicate that the experience of high vertical exchange with the supervisor during early stages in newcomer's career
(during 1972-1974), greatly contributed to the fast promotion to the kakari-cho position in 1978, while the experience of low vertical ex-change during that time period contributed to the slow promotion in the later period. A chi-square test applied to Table 3 produced a statistically significant result at the P<.05 level. Table 1 indicated that Human Potential also holds close relationship with other variables following to the Vertical Exchange. Again, newcomers were dichotomized into High and Low groups in terms of Human Potential scores to see the pattern of differences in mean career outcome values between the two
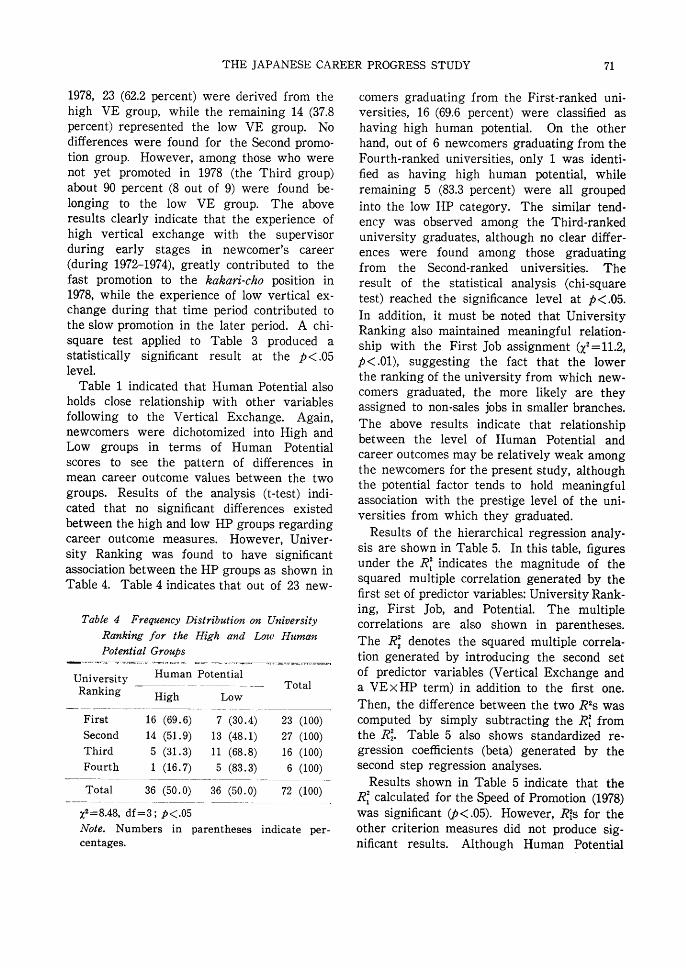
groups. Results of the analysis (t-test) indi-cated that no significant differences existed between the high and low HP groups regarding career outcome measures. However, Univer-sity Ranking was found to have significant association between the HP groups as shown in Table 4. Table 4 indicates that out of 23 new-
Table 4 Frequency Distribution on University Ranking for the High and Low Human
Potential Groups
University Human Potential Ranking Total Hi
gh Low
First 16 (69.6) 7 (30.4) 23 (100) Second 14 (51.9) 13 (48.1) 27 (100) Third 5 (31.3) 11 (68.8) 16 (100) Fourth 1 (16.7) 5 (83.3) 6 (100)
Total 36 (50.0)
x2=8.48, df=3; p<.05
Note. Numbers in
centages.
36 (50.0) 72 (100)
parentheses indicate per-
71
comers graduating from the First-ranked uni-versities, 16 (69.6 percent) were classified as having high human potential. On the other hand, out of 6 newcomers graduating from the Fourth-ranked universities, only 1 was identi-fied as having high human potential, while remaining 5 (83.3 percent) were all grouped into the low HP category. The similar tend-ency was observed among the Third-ranked university graduates, although no clear differ-ences were found among those graduating from the Second-ranked universities. The result of the statistical analysis (chi-square test) reached the significance level at p<.05. In addition, it must be noted that University Ranking also maintained meaningful relation-ship with the First Job assignment (x2=11.2, p<.01), suggesting the fact that the lower the ranking of the university from which new-comers graduated, the more likely are they assigned to non-sales jobs in smaller branches. The above results indicate that relationship between the level of Human Potential and career outcomes may be relatively weak among the newcomers for the present study, although the potential factor tends to hold meaningful association with the prestige level of the uni-versities from which they graduated.
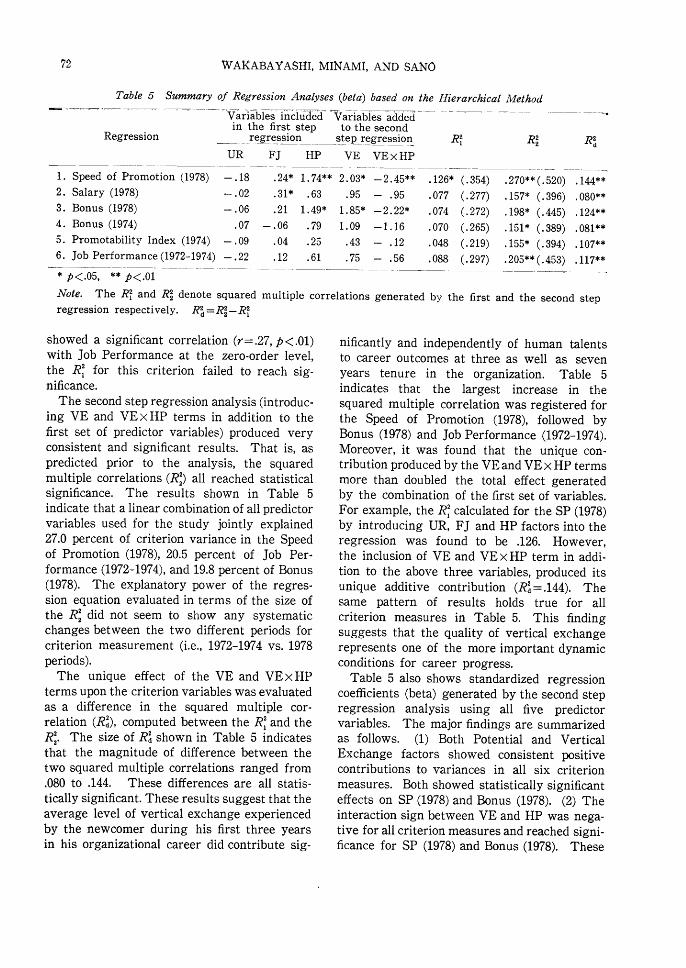
Results of the hierarchical regression analy-sis are shown in Table 5. In this table, figures under the R; indicates the magnitude of the squared multiple correlation generated by the first set of predictor variables: University Rank-ing, First Job, and Potential. The multiple correlations are also shown in parentheses.
The RZ denotes the squared multiple correla-tion generated by introducing the second set of predictor variables (Vertical Exchange and a VE x HP term) in addition to the first one. Then, the difference between the two R's was computed by simply subtracting the R; from the R2. Table 5 also shows standardized re-gression coefficients (beta) generated by the second step regression analyses.
Results shown in Table 5 indicate that the Ri calculated for the Speed of Promotion (1978) was significant (p<.05). However, Ris for the other criterion measures did not produce sig-nificant results. Although Human Potential
72 WAKABAYASIII, MINAMI, AND SAND
Table 5 Summary of Regression Analyses (beta) based on the Hierarchical Method
Variables included Variables added in the first step to the second
Regression a regression step regression R; R2 R2 UR FJ HP VE VE x HP
1. Speed of Promotion (1978) -.18 .24* 1.74** 2.03* -2 .45** .126* (.354) .270**(.520) .144** 2. Salary (1978) -.02 .31* .63 .95 - .95 .077 (.277) .157* (.396) .080** 3. Bonus (1978) -.06 .21 1.49* 1.85* -2 .22* .074 (.272) .198* (.445) .124** 4. Bonus (1974) .07 -.06 .79 1.09 -1 .16 .070 (.265) .151* (.389) .081** 5. Promotability Index (1974) -.09 .04 .25 .43 - .12 .048 (.219) .155* (.394) .107** 6. Job Performance(1972-1974) -.22 .12 .61 .75 - .56 .088 (.297) .205**(.453) .117** * p< .05, ** p<.01 -
Note. The Ri and R2 denote squared multiple correlations generated by the first and the second step regression respectively. Ra=R2-R;
showed a significant correlation (r=.27, p<.01) with Job Performance at the zero-order level, the Ri for this criterion failed to reach sig-nificance. The second step regression analysis (introduc-ing VE and VE x HP terms in addition to the first set of predictor variables) produced very consistent and significant results. That is, as
predicted prior to the analysis, the squared multiple correlations (RZ) all reached statistical significance. The results shown in Table 5 indicate that a linear combination of all predictor variables used for the study jointly explained 27.0 percent of criterion variance in the Speed of Promotion (1978), 20.5 percent of Job Per-formance (1972-1974), and 19.8 percent of Bonus
(1978). The explanatory power of the regres-sion equation evaluated in terms of the size of the R; did not seem to show any systematic changes between the two different periods for criterion measurement (i.e., 1972-1974 vs. 1978
periods). The unique effect of the VE and VE x IIP terms upon the criterion variables was evaluated as a difference in the squared multiple cor-relation (Rd), computed between the Ri and the RZ. The size of Rd shown in Table 5 indicates that the magnitude of difference between the
two squared multiple correlations ranged from .080 to .144. These differences are all statis-
tically significant. These results suggest that the average level of vertical exchange experienced
by the newcomer during his first three years in his organizational career did contribute sig-
nificantly and independently of human talents to career outcomes at three as well as seven
years tenure in the organization. Table 5 indicates that the largest increase in the squared multiple correlation was registered for the Speed of Promotion (1978), followed by Bonus (1978) and Job Performance (1972-1974). Moreover, it was found that the unique con-tribution produced by the VE and VE x HP terms more than doubled the total effect generated by the combination of the first set of variables. For example, the R; calculated for the SP (1978) by introducing UR, FJ and HP factors into the regression was found to be .126. However, the inclusion of VE and VE x HP term in addi-tion to the above three variables, produced its unique additive contribution (Rd=.144). The same pattern of results holds true for all criterion measures in Table 5. This finding suggests that the quality of vertical exchange represents one of the more important dynamic conditions for career progress.
Table 5 also shows standardized regression coefficients (beta) generated by the second step regression analysis using all five predictor variables. The major findings are summarized as follows. (1) Both Potential and Vertical Exchange factors showed consistent positive contributions to variances in all six criterion measures. Both showed statistically significant effects on SP (1978) and Bonus (1978). (2) The interaction sign between VE and HP was nega-tive for all criterion measures and reached signi-ficance for SP (1978) and Bonus (1978). These
THE JAPANESE CAREER PROGRESS ST DY
results suggest that the effect of Potential upon career outcomes may depend as hypothesized upon the level of Vertical Exchange. An analysis of the pattern of interaction between the two variables will be presented later. (3) The First Job assigned (sales jobs or staff job) demonstrated statistically significant contribu-tion to SP (1978) and Salary (1978). These results agree with the belief shared by people in the company as to which job the new-comer should be assigned. (4) It was found that University Ranking measured in term of the
prestige level of the university from which the newcomer graduated made little contribution to career outcomes. As shown in Table 1, UR showed slight positive correlations with crite-rion measures, but these positive signs were negative after Potential and Vertical Exchange were brought into the equation. These results suggest that correlations observed between UR and other variables may be spurious. (5) It is interesting to note that many of the predictors showed stronger association with outcomes for the 1978 period than for the 1972-1974 period. This result suggests that a certain lapse of time may be necessary for the determinants of career progress to appear.
In summary, findings from Table 5 can be stated as follows. (1) As hypothesized, combing the Human Potential and Vertical Exchange factors into a linear regression equation pro-duced greater explanatory power than could be derived by considering either model singlely.
(2) Vertical Exchange generated, as predicted, a significant and unique contribution to career
progress measures. (3) Moreover, the Vertical Exchange unique contribution was consistently
greater than that produced by Human Potential and situational factors combined. (4) As hy-
pothesized, Vertical Exchange and Human Potential produced a consistent interaction effect upon career outcomes after seven years. The effect of Human Potential was found to make a different only for lower quality Vertical Exchanges but not for higher quality exchanges .
For the purpose of evaluating the power of variables assessed during the first three
years in a newcomer's career to predict seven-year career outcomes, again the method of hierarchical regression was used. The criteria
U 73
for this analysis consisted of the Speed of Promotion (1978), Salary (1978) and Bonus (1978). The two performance-related ratings, Job Per-formance (1972-1974) and Promotability Index
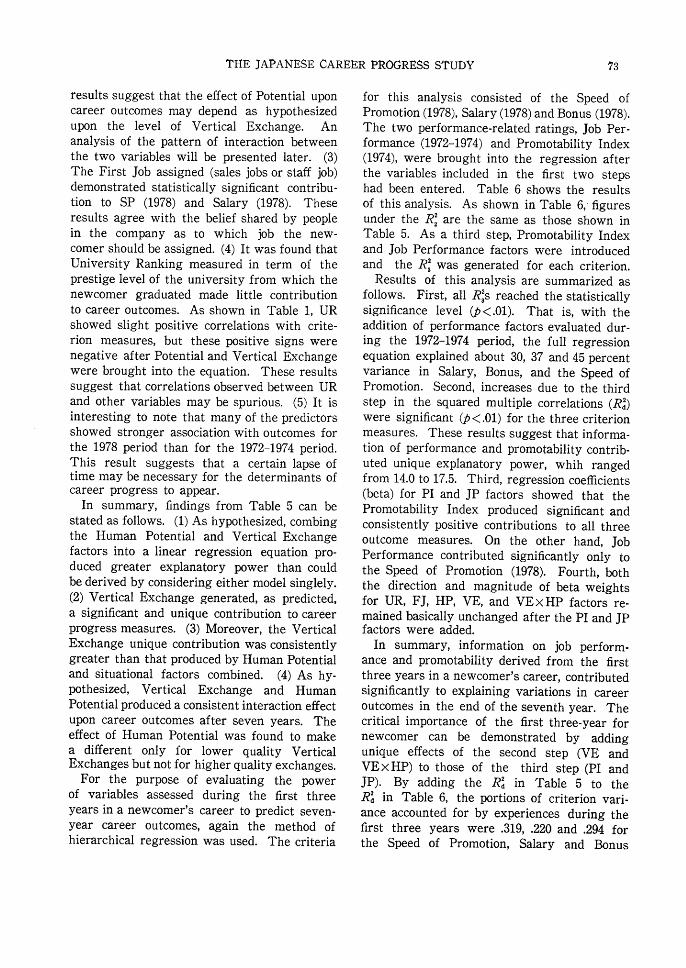
(1974), were brought into the regression after the variables included in the first two steps had been entered. Table 6 shows the results of this analysis. As shown in Table 6,- figures under the Rz are the same as those shown in Table 5. As a third step, Promotability Index and Job Performance factors were introduced and the R3 was generated for each criterion. Results of this analysis are summarized as
follows. First, all R 2 s reached the statistically significance level (p<.01). That is, with the addition of performance factors evaluated dur-ing the 1972-1974 period, the full regression equation explained about 30, 37 and 45 percent variance in Salary, Bonus, and the Speed of Promotion. Second, increases due to the third step in the squared multiple correlations (Ra) were significant (p<.01) for the three criterion measures. These results suggest that informa-tion of performance and promotability contrib-uted unique explanatory power, whih ranged from 14.0 to 17.5. Third, regression coefficients
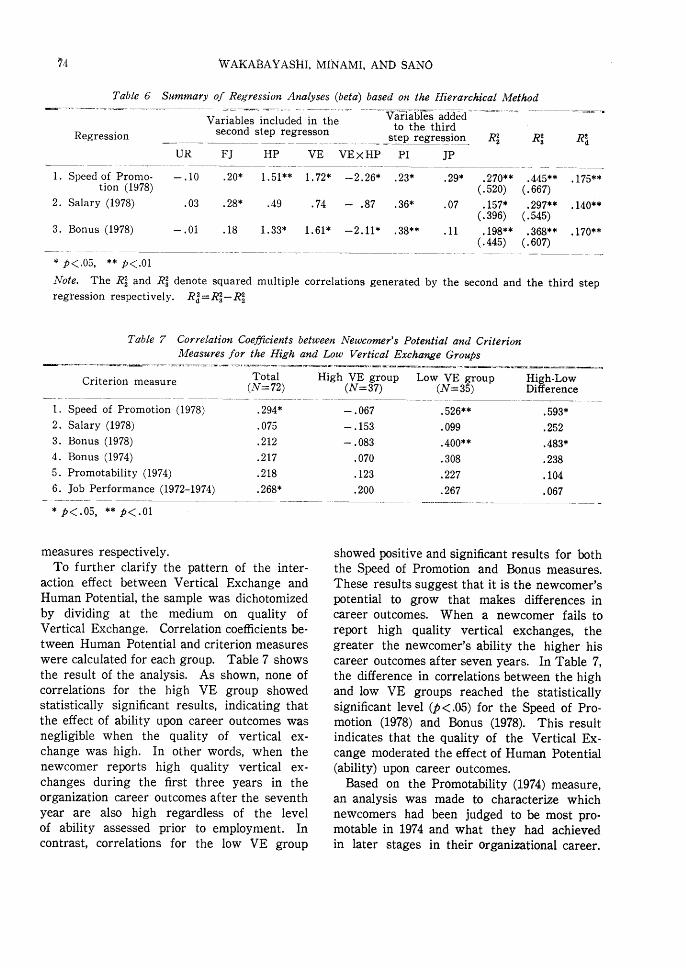
(beta) for PI and JP factors showed that the Promotability Index produced significant and consistently positive contributions to all three outcome measures. On the other hand, Job Performance contributed significantly only to the Speed of Promotion (1978). Fourth, both the direction and magnitude of beta weights for UR, FJ, HP, VE, and VE x HP factors re-mained basically unchanged after the PI and JP factors were added.
In summary, information on job perform-ance and promotability derived from the first three years in a newcomer's career, contributed significantly to explaining variations in career outcomes in the end of the seventh year. The critical importance of the first three-year for newcomer can be demonstrated by adding unique effects of the second step (VE and VE x HP) to those of the third step (PI and JP). By adding the Rd' in Table 5 to the Rd' in Table 6, the portions of criterion vari-ance accounted for by experiences during the first three years were .319, .220 and .294 for the Speed of Promotion, Salary and Bonus
N
Table 6
Regression
1. Speed of Pr tion
2. Salary (1978
3. Bon
WAI~ABAYASIII, MINAMI, AND SANG
Summary of Regression Analyses (beta) based on the Hierarchical Method
Variables included in the Variables added second step regresson to the third 2
step regression RZ
UR FJ HP VE VE x HP PI JP
omo- -.10 .20* 1.51** 1.72* -2.26* .23* .29* .270** 1978) (.520)
.03 .28* .49 .74 - .87 .36* .07 .157* (.396) (.545)
(1978) -.01 .18 1.33* 1.61* -2.11* .38** .11 .198** (.445)
* p< .05, ** p<.01
Note. The R2 and R3 denote squared multiple correlations generated by the second and regression respectively. R, =R3-R2
Table 7 Correlation Coefficients between Newcomer's Potential and Criterion Measures for the High and Low Vertical Exchange Groups
Criterion measure Total High VE group Low VE group-High-Low (N=72) (N=37) (N=35) Difference
1. Speed of Promotion (1978) .294* -.067 .526** .593* 2. Salary (1978) .075 -.153 .099 .252 3. Bonus (1978) .212 -.083 .400** .483* 4. Bonus (1974) .217 .070 .308 .238 5. Promotability (1974) .218 .123 .227 .104 6. Job Performance (1972-1974) .268* .200 .267 .067
Rs Rd
.445** .175** (.667) .297** .140** .545) .368** .170**
(.607)
the third step
* p< .05, ** p<.01
measures respectively. To further clarify the pattern of the inter-
action effect between Vertical Exchange and Human Potential, the sample was dichotomized by dividing at the medium on quality of Vertical Exchange. Correlation coefficients be-tween Human Potential and criterion measures were calculated for each group. Table 7 shows the result of the analysis. As shown, none of correlations for the high VE group showed statistically significant results, indicating that the effect of ability upon career outcomes was negligible when the quality of vertical ex-change was high. In other words, when the newcomer reports high quality vertical ex-changes during the first three years in the organization career outcomes after the seventh
year are also high regardless of the level of ability assessed prior to employment. In contrast, correlations for the low VE group
showed positive and significant results for both the Speed of Promotion and Bonus measures. These results suggest that it is the newcomer's
potential to grow that makes differences in career outcomes. When a newcomer fails to report high quality vertical exchanges, the
greater the newcomer's ability the higher his career outcomes after seven years. In Table 7, the difference in correlations between the high and low VE groups reached the statistically significant level (p<.05) for the Speed of Pro-motion (1978) and Bonus (1978). This result indicates that the quality of the Vertical Ex-cange moderated the effect of Human Potential
(ability) upon career outcomes. Based on the Promotability (1974) measure,
an analysis was made to characterize which newcomers had been judged to be most pro-motable in 1974 and what they had achieved in later stages in their organizational career.
THI~ JAPANESE CARRRR PRO(~RRSS STUDY 'Ill
Table 8 Means and Standard Deviations of Career Development
for the High, Mid and Low Promotability Groups
Variables
Variables
Speed of Promotion (1278)'
Salary (1988)'
Bonus (1978)'
Bonus (1974)1
Job Performance (1972-1974) Vertical Exchange (1972-1974)
Human Potential
Promotability (1974)
Low Mid (N=22) -(N=30)---
1.95 ( 0.79) 2.43 ( 0.63) 2
173.5 (11.9) 181.2 ( 3.8) 181
911.3 (76.5) 945.3 (57.4) 987
139.3 ( 0.93) 140.1 ( 1.09) 141
44.4 ( 3.7) 49.6 ( 4.7) 53
30.0 ( 4.2) 32.9 ( 6.2) 34
48.7 ( 6.9) 48.3 ( 8.8) 52
High (N=20)
Total (N= 74)
80
7
6
6
8
5
0
( 0.41)
( 0.8)
(41.3)
( 1.36) ( 3.2)
( 5.6) ( 7.0)
2.39
179.0
946.6
140.3
49.2
32.4
49.4
( 0.70)
( 7.8)
(66.3)
( 1.41) ( 5.4)
( 5.7)
( 7.6)
F
2.91** a
9.9** a
8.4** b
21.2** a. c
28.8** a, c
3.71** d
1.59
'Unit by thousand yen . * p<.05, ** p<.O1 Note. Number in parentheses indicate standard deviations. Letters a, b, and c indicate results of group
comparisons based on the Tukey's method, i.e., a : Low <Mid and High, b : High> Mid and Low, c : High >Mid, and d: High>Low, at the p<0.5 level.
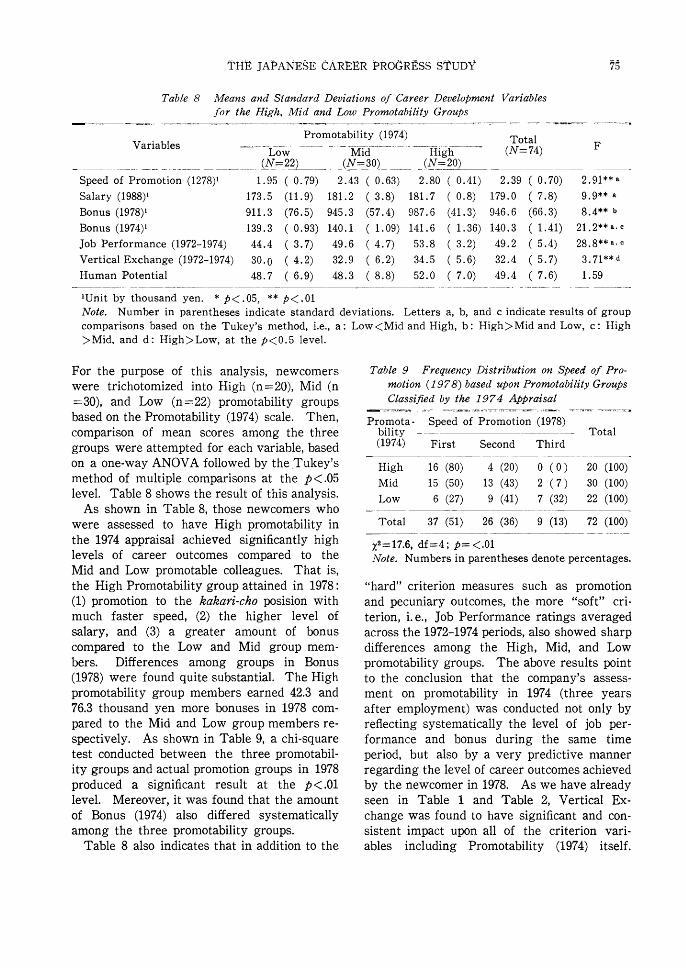
For the purpose of this analysis, newcomers Table 9 Frequency Distribution on Speed of Pro-were trichotomized into High (n=20), Mid (n motion (1978) based upon Promotability Groups =30), and Low (n=22) promotability groups Classified by the 1974 Appraisal
based on the Promotability (1974) scale. Then, Promota- Speed of Promotion (1978) comparison of mean scores among the three bility - - Total
groups were attempted for each variable, based (1974) First Second Third on a one-way ANOVA followed by the Tukey's High 16 (80) 4 (20) 0 (0) 20 (100) method of multiple comparisons at the p<.05 Mid 15 (50) 13 (43) 2 (7) 30 (100) level. Table 8 shows the result of this analysis. Low 6 (27) 9 (41) 7 (32) 22 (100)
As shown in Table 8, those newcomers who -were assessed to have High promotability in Total 37 (51) 26 (36) 9 (13) 72 (100) the 1974 appraisal achieved significantly high x2=17.6, df=4; p=<.O1 levels of career outcomes compared to the Note. Numbers in parentheses denote percentages. Mid and Low promotable colleagues. That is,the High Promotability group attained in 1978:
(1) promotion to the kakari-cho posision with much faster speed, (2) the higher level of salary, and (3) a greater amount of bonus compared to the Low and Mid group mem-bers. Differences among groups in Bonus
(1978) were found quite substantial. The High promotability group members earned 42.3 and 76.3 thousand yen more bonuses in 1978 com-
pared to the Mid and Low group members re-spectively. As shown in Table 9, a chi-square test conducted between the three promotabil-ity groups and actual promotion groups in 1978
produced a significant result at the p<.01 level. Mereover, it was found that the amount of Bonus (1974) also differed systematically among the three promotability groups.
Table 8 also indicates that in addition to the
"hard" criterion measures such as promotion
and pecuniary outcomes, the more "soft" cri-terion, i. e., Job Performance ratings averaged across the 1972-1974 periods, also showed sharp differences among the High, Mid, and Low
promotability groups. The above results point to the conclusion that the company's assess-ment on promotability in 1974 (three years after employment) was conducted not only by reflecting systematically the level of job per-formance and bonus during the same time
period, but also by a very predictive manner regarding the level of career outcomes achieved by the newcomer in 1978. As we have already seen in Table 1 and Table 2, Vertical Ex-change was found to have significant and con-sistent impact upon all of the criterion vari-ables including Promotability (1974) itself.
76 WAKABAYASI-1I, MINAMT, AND SANO
These results, combined with those in Table 7, indicate that the level of vertical exchange experienced by the newcomer during his early stages of organizational career, constitutes one of the most important determinants of his level of job performance and the judgement of pro-motability in those periods. This is the reason why VE predicted all important career out-comes in later stages. However, the measure of Human Potential and the other two pre-dictors (University Ranking and First Job) did not show any significant relationship with Promotability (1974).
Discussion
This study examined the predictive validity of the "Situational Model" of managerial career
progress. The critical components of the model are the strength of the managerial potential of the newcomers and the quality of the ver-tical exchanges between leaders and newcomers. This model, thus, combines Human Potential and Vertical Exchange factors into a single model. It was found that the exchange factor and the combined effect of exchange and ability
(VEX HP) produced statistically significant unique contributions to all career outcomes assessed. Although Human Potential and Ver-tical Exchange factors represented two unique contributors to career progress outcomes, the influence of the Vertical Exchange factor was stronger. Reasons for the stronger VE effect found in this study can be speculated about as follows. The human potential factor is the newcomer's aptitude or ability, while vertical exchange factor has more to do with motivating the newcomer to work and mentoring the new-comer's behavior toward the attainment of career goals. Wakabayashi and his associates
(1980) discussed some characteristic motivating and mentoring functions related to the vertical exchange. They pointed out that high quality vertical exchange helped the newcomer to
penetrate the " inclusion boundaries " (Schein, 1971) and obtain access to resources and opera-tions that are more central to his work unit . This " insider " experience enables the new-comer to feel a sense of enhanced self-worth ,
improved confidence in one's talents and to set higher performance goals. It is most likely
that a high quality vertical exchange facilitates those complex psychological processes required
for career progress in the organization. In addition to its motivating and mentor-
ing functions, vertical exchange was found to moderate the abitity to career outcome
relationship. An examination of the pattern of interaction (the VExHP effect) suggests a
compensatory model: Either high vertical exchange or high ability lead to the attainment
of high level career outcomes (low HP is com- pensated by high VE) and only low exchange
and low ability lead to the attainment of low level outcomes.
The vertical exchange measure is designed to tap outcropping of the socialization process
of newcomers into organization careers (Berlew & Hall, 1966; Bray, et al., 1974; Schein, 1968; Wanous, 1980). On the other hand, the ability factor focused upon selection of newcomers and assumed that the organizational environment for career progress was stable and impersonal or at least unaffected by systematic leadership effects. However, this assumption was found wanting for our newcomers. They appeared to be guided by the strong socialization forces embedded in their leader-member exchanges . In summary, human potential evaluated before
the start of the career development process explained a rather small portion of variance in career outcome measures. A large piece of the criterion variance left unexplained was found to be accounted for by the situational factor (leader-member exchange) that encourag-ed and directed the newcomer's efforts toward the attainment of career outcome after the start of the career development process in the organization. The vertical exchange factor suc-cessfully represented this dynamic situation after employment. It should be emphasized that this critical leader-member exchange was relatively independent of the newcomer's ability level.
The average level of job performance and
promotability rating during the first three years predicted very effectively the level of career outcomes in the seventh year . When perfor-mance factors were included in the regression
CO
LL
EG
E E
DU
CA
TIO
N
(Uni
vers
ity
Ran
king
)
I
'HU
MA
N '
. PO
TE
NT
IAL
`~
r
(f
eedb
ack)
--
----
----
-
VE
RT
ICA
L
E
XC
HA
NG
E
----
--
----
I r I I 1 1 1 1 f
PRO
MO
TA
BIL
ITY
and
JOB
PE
RFO
RM
AN
CE
r I
4
1 FI
RST
JO
B
A
SSIG
NM
EN
T
I I 1 I I 1 1 1 I
(i
nter
actio
n)
D
YN
AM
IC .I
EFF
EC
T
1 .
PTR
ST
.T(1
R
1
i
L
<
C
AR
EE
R
OU
TC
OM
ES
(P
rom
otio
n,
Sal
ary,
B
onus
, et
c.)
';
(em
ploy
men
t
cond
ition
s)(c
aree
r de
velo
pmen
t
situ
atio
ns
in
the
orga
niza
tion)
H
M FL
I
b z n tl b 0 C
~7
U
Tim
e
befo
reth
e st
art
of
the
deve
lopm
enta
l pr
oces
saf
ter
the
star
tof
th
ede
velo
pmen
tal
proc
ess
Figu
re
boun
dari
es
of
the
orga
niza
tion
1 D
iagr
am
for
the
Situ
atio
nal
Mod
el
of O
rgan
izat
iona
l C
aree
r D
evel
opm
ent
V V
78 WAKABAYASHI,
in addition to the before and after factors , an additional large portion of variance was ex-
plained for each criterion measure. This was particularly true for the Speed of Promotion in which about 45 percent of the total variation was predictable.
The career development of the Japanese " salaryman ," at least up to the lower-middle management position, can be predicted by the
quality of work activities experienced in the very early stages of the career (first three
years). Results indicated that the first job assignment, newcomer's assessed potential, vertical exchange relations, job performance , and promotability can be useful indices for
predicting the quality of career progress out-comes during these early stages. College pre-stige in terms of University Ranking (UR) was found affecting the level of human
potential evaluated by the company upon employment, and also the kind of first job assignment provided for each newcomer as a result of employment. However, in contrast to the general belief and the results of one study (Pucik, 1981; Pucik & Hanada, 1982), college prestige was found to have null effects upon career outcomes.
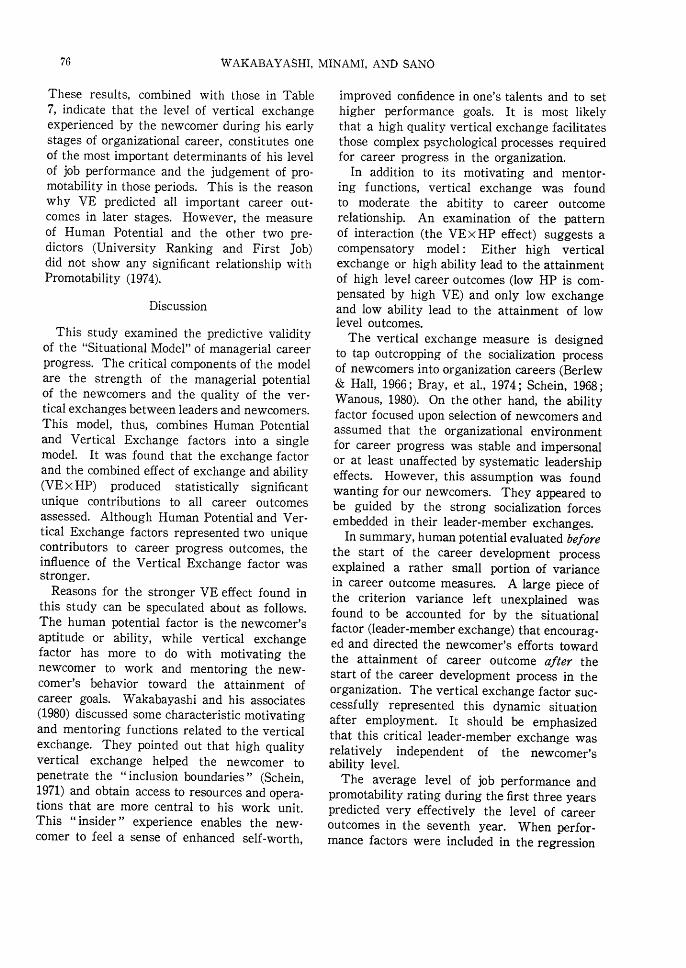
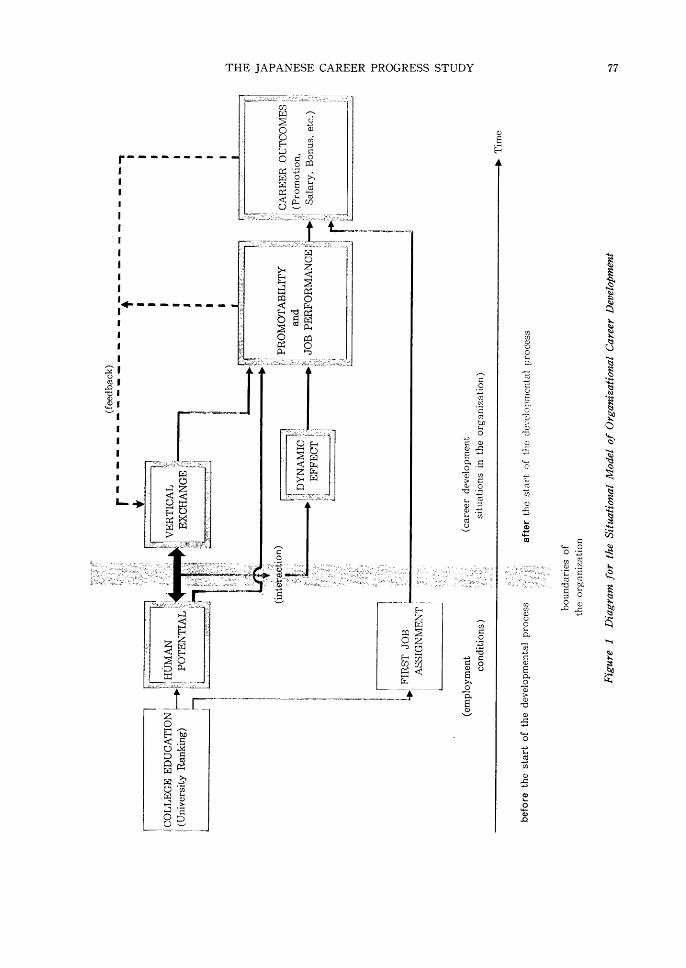
It must be emphasized that experiences in early career stages are cumulative in nature. Vertical exchanges in the "critical first year"
(Berlew & Hall, 19056; Hall & Nougaim, 1968; Wakabayashi 1980; Wakabayashi, et. al., 1980) will influence exchanges in the second year and beyond and exchanges in the second year will influence exchanges in the third year . Once established early in the career the quality of leader-member exchange that a newcomer established with successive leaders was quite stable and predictable. These features of the career developmental process can be sum-marised as shown in Figure 1.
Regarding the method of the study, a few
points need to be made. First, the human potential scale was constructed using informa-tion derived from the company's employmet test battery and not from an assessment center
(Bray, et. al., 1974; Hinrichs, 1978). As a result the test battery was not comprehensive. In addition the restriction of range problem prob-ably limited the predictive validity of the
MINAMI, AND SANO
human potential scale in the present study. This study, however, is relatively free of the
criterion contamination problem, since as a matter of policy all selection and employment
information is kept confidential from people in the company, except for a few personnel
staff members. Second, the vertical exchange instrument for the present study was developed through a rather rigorous " retranslation " of
the English version questionnaire (Graen & Cashman, 1975). By this procedure, question-
naire items were constructed to yield equivalent connotations and denotations in the two differ-
ent cultures (Wakabayashi et. al., 1980). How- ever, the question of similarities and differences
of the construct of vertical exchange between the Japanese and American business cultures has yet to be explored in detail. The present study was not directed at this issue, but rather
assumed construct similarities. This assump- tion may have some validity considering the
fact that vertical exchange demonstrated strong
predictive validity in the present study and these results were compatible with those of
American studies by Graen and his associates. Third, the time interval involved in this study
may be short for a study of the managerial career development process. To examine
career effect of predictor variables, especially those of vertical exchange, a longer time interval
(ten or fifteen years) and the possible occur- rence of more critical career events (attain-
ment of upper-middle management positions) may be desirable as conditions for future follow
up studies. Given the high retension rate in the Japanese company (94c/", for the first three
years and 8517, for the first seven years), a ten-year and fifteen-year follow up of this
project appear quite feasible.
References
Bentz, V, J. Validity of Sears assessment center proce-iu i es. In W, C. Byham (Chm.), Validity
of assessment centers. American Psychological Association, Washington, D.C., September, 1971.
Berlew, D. E., and Hall, D. T. The socialization of manager : Effects of expectation on perform-
ance. Administrative Science Quartery. 1966, 11, 207-233.
Bray, D. W., Cambell, R. J., and Grant, D. L. Forma-
THE JAPANESE CAREER PROGRESS STUDY 79
tive years in business : A long-term AT&T study of managerial lives. New York : Wiley, 1974.
Bray, D.W., and Grant, D.L. The assessment center as the measurement of potential for business
management. Psychological Monographs, 1966, 80 (whole No. 625),
Cashman, J., Dansereau, F., Graen, G., and Haga, W. J. Orgonizational understructure and leader-
ship: A longitudinal investigation of the man- agerial role making process. Organizational
Behavior and Human Performance, 1976, 15, 278-- 296.
Cohen, J., and Cohen, P. Applied multiple regression/ correlation analysis for the behavioral sciences.
Hillsdale, N.J.: Erlbaum, 1975. Dansereau, F., Graen, G., and Haga, W. J. A ver-
tical dyad linkage approach to leadership within formal organizations. Organizational
Behavior and Human Performance, 1975, 13, 46-78.
Dunnette, M. D. The assessment of managerial talent. In P. McReynolds (Ed.), Advances in psy-
chological assessment (II). Pal Alto : Science and behavior Books, Inc., 1971.
Dunnette, M. D., Arvey, R. D., and Banas, P.A. Why do they leave? Personnel, 1973, May-June, 25-39.
Finkle, R. B. Managerical assessment centers. In M. D. Dunnette (Ed.), Handbook of industrial
and organizational psychology. Chicago : Rand McNally, 1976.
Graen, G. Role-making processes within complex organizations. In M. D. Dunnette (Ed.), Hand-
book of industrial and organizational psychology. Chicago : Rand McNally, 1976.
Graen, G., and Cashman, J. A role making model of leadership in formal organizations : A develop-
mental approach. In J. Hunt and L. Larson
(Eds.), Leadeship frontiers. Kent : Kent State University Press, 1975.
Graen, G., and Ginsburgh, S. Job resignation as a function of role orientation and leader accpt-
ance. Organizational Behavior and Human Per- formance, 1977, 19, 1-17.
Graen, G., Liden, R., and Hoel, W. Role of leader- ship in the employee withdrawal process. Jour-
nal of Applied Psychology, 1982, 67, 868-872.
Graen, G., and Schiemann, W. Leader-member agreement : A vertical dyad linkage approach.
Journal of Applied Psychology, 1978, 63, 206- 212.
Greenwood, J. M., and McNamara, W. J. Interrater reliability in situational tests. Journal of Ap-
plied Psychology, 1967, 51, 101-106.
Hall, D. T. A theoretical model of career subiden- tity development in organizational settings. Organizational Behavior and Human Perform- ance, 1971, 6, 50-76.
Hall, D. T., and Nougaim, K. E. An examination of Maslow's need hierarchy in an organizational
setting. Organizational Behavior and Human Performance, 1968, 3, 12-35.
Hinrichs, J. R. Comparison of "real life" assessment management potential with situational ex-
ercises, paper-and-pencil ability tests, and
personality inventories. Journal of Applied Psy- chology, 1969, 53, 425-432.
Hinrichs, J. R. An eight-year follow-up of a man- agerial assessment center. Journal of Applied
Psychology, 1978, 63, 596-601. Katerberg, R., and Hom, P. W. Effects of within-
group and between-groups variation in leader- ship. Journal of Applied Psychology, 1981, 66,
218-223. Kmenta, J. Elements of econometrics. New York :
Macmillan, 1971. Liden, R. C., and Graen, G. Generalizability of the
vertical dyad linkage model of leadership. Academy of Management journal, 1980, 23, 451
465. Pucik, V. A challenge to the "Theory of Japanese
Management" : An empirical analysis of the promotion pattern to the middle management
level, Toyo Keizai, Summer, 1981, 104-111. Pucik, V., and Hanada, M. Determinants of suc-
cessful careers among Japanese manegers. Sanno College Bulletin, 1982, 33-49.
Rousseau, D. Measures of technology as predictors of employee attitude. Journal of Applied Psy-
chology, 1978, 63, 213-218• Sano, K., and Makita, H. The SEIKEN sentence
completion test : User's manual. Tokyo : Kanel:o Shobo, 1960. (In Japanese)
Sano, K., Makita, H., and Sekimoto, M. Identifyin ,} and assessing managerial potentials. Tokyo : Nihon Keiei Shuppankai, 1970. (In Japanese)
Schein, E. H. Organizational socialization and the
profession of management. Industrial and Man- agement Review, 1968, 9, 1-16.
Schein, E. H. The individual, the organization, and the career : A conceptual scheme. The Journal
of Applied Behavioral Science, 1971, 7, 401-426. Thomson, H. A. Comparison of predictor and cri-
terion judgements of managerial performance using the multitrait-multimethod approach.
Journal of Applied Psychology, 1970, 54, 496-502. Veechio, R. P. A further test of leadership effects
due to between-group variation and within-

80 WAKABAYASHI, MINAMI, AND SANO
group variation. Journal of Applied Psychology. 1982, 67, 200-208.
Wakabayashi, M. Managerial career progress in a Japanese organization. Ann Arbor : UMI Re-
search Press, 1980. Wakabayashi, M., Graen, G., Sano, K., Minami, T.,
and Hashimoto, M. Japanese private univer- sity as a socialization system for future leaders in business and industry. International Journal of Intercultural Relations, 1977, 1, 60-80.
Wakabayashi, M., and Minami, T. Toward a theory
of managerial career development : A longi- tudinal investigation of the role making process
of Japanese college graduates. Tetsugaku, 1978, 68, 105-132.
Wakabayashi, M., Minami, T., Hashimoto, M., Sano, K., Graen, G., and Novak, M. Managerial career
development : Japanese style. International Jour- nal of Intercultural Relations, 1980, 4, 391-420.
Wanous, J. P. Organizational entry : Recruitment, selection, and socialization of newcomers. Read-
ing, Mass.: Adison-Wesley, 1980.