Embed Size (px)
Citation preview

A SEMINAR PAPER ON
Comparative Profitability Analysis of Spices Production in Bangladesh
Course Title: Seminar
Course Code: AEC 598
Term: Autumn, 2018
SUBMITTED TO:
Course Instructors
1. Dr. Md. Mizanur Rahman
Professor
BSMRAU
2. Dr. A. K. M. Aminul Islam
Professor
BSMRAU
3. Dr. Md. Sanaullah Biswas
Associate Professor
BSMRAU
4. Dr. Shilpi Islam
Associate Professor
BSMRAU
Major Professor
Dr. M Kamruzzaman
Professor
Department of Agricultural Economics
BSMRAU
SUBMITTED BY:
Jannat Ara Prity
MS Student
Reg. No.: 13-05-3083
Department of Agricultural Economics
BANGABANDHU SHEIKH MUJIBUR RAHMAN AGRICULTURAL UNIVERSITY
SALNA, GAZIPUR 1706

i
ABSTRACT
Bangladesh is predominantly an agricultural country where agriculture sector plays an important
role in accelerating the economic growth. It is very important to have a profitable, sustainable
and environment-friendly agricultural system to ensure long-term food security for people of our
country. The present study attempts to determine the production, yield and profitability of four
promising spices that’s are onion, chili, ginger and turmeric. The highest production of onion and
chili was in the year 2015-16 and the lowest production of onion was in the year 2011-12
whereas for chili it was lowest in the year 2012-13. The production of ginger was highest in the
year 2014-15 and lowest in the year 2012-13 but in this study it was seen that turmeric
production was the highest in the year 2011-12 and that was slightly fall till 2014-15. But it was
little bit risen in the year 2015-16. The study revealed that spices production in Bangladesh is
influenced by the average price in the market. When the market price falls then farmer do not
want to produce that crop in the next year. From BCR analysis it is found that among all the
spices of the study turmeric (5) was the most profitable, followed by BCR (3.12) for ginger,
BCR (2.19) for chili and BCR (2.13) for onion.
Key Words: Profitability, Gross return, Net return, Cost, BCR.
ii
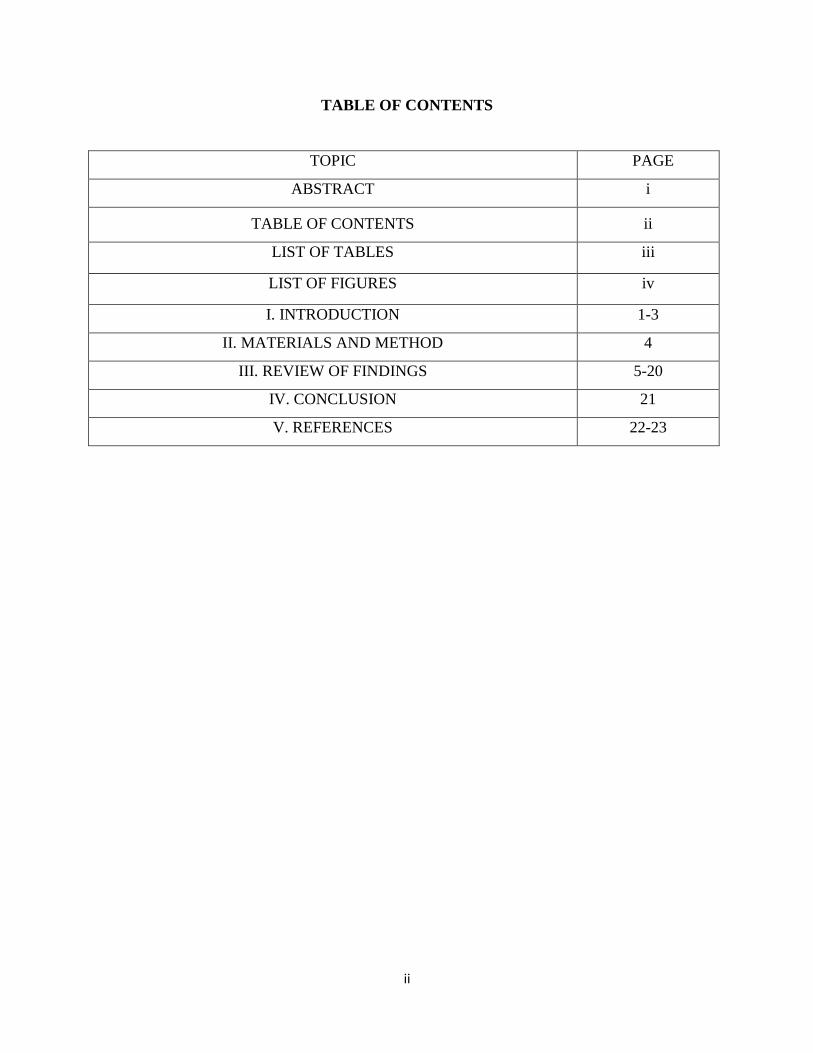
TABLE OF CONTENTS
TOPIC PAGE
ABSTRACT i
TABLE OF CONTENTS ii
LIST OF TABLES iii
LIST OF FIGURES iv
I. INTRODUCTION 1-3
II. MATERIALS AND METHOD 4
III. REVIEW OF FINDINGS 5-20
IV. CONCLUSION 21
V. REFERENCES 22-23

iii
LIST OF TABLES
Table
no:
Name of the Table Page
no.
01 Yield of Onion 2013-14 to 2015-16 6
02 Cost of Onion Production per acre 7
03 Profitability of Onion for the year 2014-15 7
04 Benefit-Cost Analysis of Onion for the Farmers for the year 2014-15 7
05 Yield of Ginger 2013-14 to 2015-16 12
06 Profitability of Ginger for the year 2015-16 14
07 Benefit-Cost Analysis of Ginger for the Farmers for the year 2015-16 14
08 Yield of Turmeric 2013-14 to 2015-16 16
09 Profitability of Turmeric for the year 2013-14 17
10 Benefit-Cost Analysis of Turmeric for the Farmers for the year 2013-14 17

iv
LIST OF FIGURES
Figure
no:
Name of the Figure Page
no.
01 Production and area of production of onion crop 5
02 Annual price variation for onion 6
03 Production and area of production of chili crop 8
04 Seasonal chili production 9
05 Annual price variation for chili 9
06 Per acre production cost for chili production by type of input 10
07 BCR of chili for different division 11
08 Production and area of production of ginger crop 11
09 Annual price variation for ginger 12
10 Per acre production cost by type of input 13
11 Production and area of production of turmeric crop 15
12 Annual price variation for turmeric 16
13 Per acre production cost by type of input 17
14 Average wholesale price 18

1
CHAPTER 1
INTRODUCTION
Agricultural sector has been given the highest priority in order to make Bangladesh self-
sufficient in food. The Government determined to develop the overall agriculture sector with the
concern of the goals set out in the Seventh Five Year Plan and National Agriculture Policy.
Sustainable growth has maintained and GDP growth of more than 6 percent on an average during
the last decade in the economy of Bangladesh. The GDP growth go beyond the 7 percent in FY
2015-16 and stood at 7.11 percent. According to the BBS, the GDP growth stood at 7.28 percent
in FY 2016-17. Among the 3 wide sectors of economy the growth of agriculture sector increased
to 2.97 percent of GDP, which was 2.79 percent in previous fiscal year. Growth of agriculture
and forestry sector under broad agriculture sector rose to 1.96 percent of GDP (BER, 2017).
Spices are very important as food and also as medicine. They bring out the unique natural taste
of cuisines and could be used to change the look of food to make it more attractive in color.
Almost all people are habituated to use spices in curries and other food. They bring different
flavors and aroma. Not only medicine but also food, the importance of spices cannot be
overemphasized. Almost all curries are popular and testy which are made from a combination of
several spices. Presently 109 kinds of spices are cultivated in the world (ISO list of spices) but
in Bangladesh we use only 27 and produce 17. Major spices are regularly used in daily diet at
large amount such as chili, onion, garlic, turmeric and ginger. Turmeric is helpful in reducing
blood sugar. Turmeric has long been used as a home remedy against common colds and
influenza. Ginger, for example, is well known as a helpful digestive aid. Garlic is touted for
preserving memory and keeping a heart healthy (Islam et al., 2011).
Now-a-days many spice-processing industries such as Square, BD Foods, PRAN, Archu,
Advanced Chemical Industries (ACI), Amrita, Dekko etc. have been established in Bangladesh.
They are exporting spices as a finished product outside the country. Due to that, demands for
spices as raw material of these industries are increasing with the extension of their production.
That is why; the total demands for spices are increasing at incremental rate. Resulting that, a big
gap was observed between production and demand now. To meet up this gap the country has to
spend a huge amount of foreign currency in every year for importing spices from abroad.
Realizing the importance of spices, Bangladesh government started spices research institute
(Hasan & Mahmud, 2014).

2
BARI developed and released 18 (major-12, minor-6) disease resistance improved variety of
spices. On the other hand, 81 technologies on production, soil and water management; disease
and insect management and post-harvest management have been also been developed. BARI,
BARC, DAE and NGO’s have strengthened their works to extend these technologies. However,
using these technologies, farmers are now immensely benefited in large scale. As a result, total
production of spices has increased (Islam et al., 2011).
Onion is one of the most important spices in Bangladesh both in acreage and production. It is to
consume either as spice or as condiment. Onion is popular crop to the farmer for its higher
demand and price, diversified use, favorable potentiality to grow the soils and agro-climatic
condition in Bangladesh. Onion obtained from two sources was marketed in our country; one is
indigenous production and the other was imported. Onion is semi-perishable in nature. Post-
harvest technique reduces short term losses of onion. After harvesting of onion, farmers cut the
onion tops within 1.0 to 1.5 cm neck length. Top cutting bulbs significantly improved the storage
quality of onion (Adnan et al., 2014).
Chili is a valuable spice and also one of the most important cash crops grown in Bangladesh. It is
available and used in the form of green, dried and powdered. It has become an essential
ingredient in Bangladeshi meals. It has diversified uses. The peoples of Bangladesh are usually
used chilies in all curry preparation like meat, fish, vegetables, pulses etc. for its typical color,
taste and flavor. In addition, chili are a good source of most vitamin-B and vitamin-B6 in
particular. They are very high in potassium, magnesium and iron (BBS, 2014). Production
estimates of crops, cost of production and market price of crops are directly interrelated and
important factor that influence the farmers in their decision of land utilization. Statistical data on
these issues are essential for government policy making in agriculture sector. The government
fixes up procurement price at the harvesting time considering the investment of farmers for
certain crops. If price is lower than the production cost, producers get looser and are discouraged
to produce those crops. This type of loss and profit influences the farmers for cultivating the crop
in the following years. Accurate information in this regard can facilitate policy makers, planners,
researchers, and stakeholders in understanding factors those are needed to be taken into care
(BBS, 2013). Most of the spices are high value crops. Net returns of major spices are almost 2
to 3 times higher than any other crops. It can play a vital role to increase the farmer’s income,
3
generate employment, alleviate poverty, enhance food security, and empower women and to
increase social development of Bangladesh. Bangladesh possesses a favorable agro-ecological
condition for the production of spices crops. Though production of spices has been increasing in
the recent year, Bangladesh import some spices from the abroad. Now government are taking
initiative to increase the production of spices and reduce the import of spices. Based on above
facts the objectives of this review paper are-
To review the present status of selected spices in terms of area, yield and production,
To highlight the annual price variation and financial profitability of selected spices &
To identify the constraints of spices production.

4
CHAPTER 2
MATERIALS AND METHODS
This seminar paper is exclusively a review paper. All data and information has been collected
from the secondary sources. During preparation of this paper, I went through various articles
published in different journals, books, proceedings, reports, publications and annual report etc.
Different published reports of different journals mainly supported in providing data for this
paper. Findings related to my topic have been reviewed with the help of the library facilities of
Bangabandhu Sheikh Mujibur Rahman Agricultural University (BSMRAU) and Bangladesh
Agricultural University (BAU). Information also collected from Department of Agricultural
Economics, BSMRAU. I have also searched related internet websites to collect information. I got
valuable suggestion and information from my major professor and course instructors. After
collecting all the available information, I myself compiled and prepared this seminar paper.

5
CHAPTER 3
REVIEW OF FINDINGS
Onion
Onion is one of the important spices in Bangladesh. It ranks first in production among the spice
crops and is used as salad while its stalk becomes green. Onion is cooked in many ways in
preparing curries and other delicious foods which are important ingredient in the list of spices.
Moreover, has been used as a common ingredient in various dishes since past in different
cultures in the South East Asia. There are different varieties of onion like red, yellow, white, and
green. Each has its own unique flavor for its own far its strong and mildly sweet essence (BBS,
2014). From early July to August 18, 2013, the market prices of onion rose dramatically in
Bangladesh. Although prices showed a downward trend at the end of August and early
September, they have begun to rise again. Onion is popular in Bangladeshi cooking, so demand
for it is high and growing steadily alongside increasing incomes of population. In fact, demand
is expected to increase by 51 percent this decade from 1.23 million metric tons in 2010 to 1.86
million metric tons in 2020 under the business-as-usual scenario. Under an optimistic income
growth scenario, it’s expected to increase by 69 percent to 2.08 million metric tons (Ahmed &
Ahmad, 2013).
Fig. 3.1. Production and area of production of onion crop (BBS, 2014 & BBS, 2016).
Fig. 3.1 shows that the production of onion is increasing every year. In the year 2011-12 the
production of onion was 1156000 MT and cultivated area for onion was 335000 acre and in the
1156 11681387
1704 1735
335 332 373 419 438
0
1000
2000
2011-12 2012-13 2013-14 2014-15 2015-16Pro
duct
ion
Year
Production in 000'MT Area in 000' Acres
Linear (Production in 000'MT) Linear (Area in 000' Acres)

6
year 2015-16 the production was increased in 1735000 MT and cultivated area for onion was
438000 acre. As a whole the production shows increasing trend line than cultivated area.
Table 3.1. Yield of Onion 2013-14 to 2015-16
Division 2013-14 2014-15 2015-16
Yield(kg)/acre Yield(kg)/acre Yield(kg)/acre
Barisal 1503 1491 1541
Chittagong 2093 2179 2166
Dhaka 3487 4011 3822
Khulna 4036 4626 4709
Rajshahi 4126 4159 4000
Rangpur 2454 3160 3198
Sylhet 1627 2463 2145
Average 3719 4067 3958
Fig. 3.2. Annual price variation for onion (DAM, 2017).
From the Fig. 3.2 the highest price of onion was 41 Tk. per kg in the year 2013-14 and lowest
price was 28 Tk. per kg in the year 2014-15. From the figure it can be concluded that the price of
onion shows decreasing trend line.
41
2833
0
10
20
30
40
50
2013-14 2014-15 2015-16
Tk. per
kg
Year
Source: Calculated from BBS (2017)

7
Table 3.2. Cost of Onion Production per acre
Description of Items Cost of Producing Onion
Land preparation 4912
Seed and seedbed related 5103
Seedling/onion 4484
Plantation 6186
Weeding 6186
Irrigation 3645
Fertilizer 6699
Pesticide/ Insecticide/ Harmon 2818
Harvesting 10651
Transport 1893
Others 373
Total 53399
Table 3.3. Profitability of Onion for the year 2014-15
Item Gross Return per
acre (Tk.)
Production(Kg.) Price per
Kg.
(Tk.)
Cost
per
Acre
Net Return
per
acre(Tk.)
Net
Return per
Kg.(Tk.)
Onion 113876 4067 28 53399 60477 14.87
Table 3.4. Benefit-Cost Analysis of Onion for the Farmers for the year 2014-15
Name of the
spices
Gross Return per acre(Tk.) Gross cost per acre (Tk.) Benefit cost ratio
Onion 113876 53399 2.13
In the table 3.3 total production is multiplied by the price of that product to get gross return. The
production cost is deducted from the gross return to get net return. Net return for onion is 14.87
Source: Calculated from BBS (2017)
Source: BBS (2014)
Source: Calculated from BBS (2017)

8
Tk. per kg and the benefit cost ratio is 2.13. That means farmer get 2.13 Tk. for every one taka
investment.
Chili
Chili grows in the tropical and sub-tropical region. It grows well in warm and humid climate.
Deep, loamy, fertile soils rich in organic matter are suitable for the satisfactory growth. Also
need well drained soils with adequate soil moisture for the growth of the crop. Chili grows well
in the dry and the intermediate part of the country. Chili plants should be in a location that
receives a good amount of light. Chilies should not be in a position where the nightly
temperature falls below 12°C. Growth will be inhibited if temperatures fall below 15°C. Chili
peppers are harvested when the peppers are either green or red. Red peppers are hotter than green
peppers. If anyone wants to harvest green chili peppers, allow them to grow as large as possible.
Harvesting of chilies should be done when they start to turn red. Clip the peppers from the plant
by cutting the stems where they connect to the main branch (BBS, 2014).
Fig. 3.3. Production and area of production of chili crop (BBS, 2014 & BBS, 2016).
Fig. 3.3 shows that the production of chili was 126000 MT in the year of 2011-12 and the
cultivated area was 240000 acre. The production of chili was 130000 MT in the year of 2015-16
and the cultivated area was 252000 acre. The figure shows slightly increasing trend in production
than the area of production.
126102 110 123 130
240 231 222 227252
0
50
100
150
200
250
300
2011-12 2012-13 2013-14 2014-15 2015-16
Pro
duct
ion
Year
Production in 000'MT Area in 000' Acres
Linear (Production in 000'MT) Linear (Area in 000' Acres)

9
Fig. 3.4. Seasonal chili production (BBS, 2014 & BBS, 2016).
From the Fig. 3.4 it is clear that the production of Rabi chili is greater than the production of
Kharif chili. It shows that the large portion of the total chili production comes from the Rabi
seasons. The contribution of Kharif chili is too small in total chili production.
Fig. 3.5. Annual price variation for chili (DAM, 2017).
The Fig. 3.5 shows that the annual price variation for chili was highest in the year of 2015-16
amounted Tk. 50 per kg and the lowest was Tk. 36 per kg in the year 2014-15 and the price of
chili shows an increasing trend.
19589 21314 2127430035
31204.26
104750
8266288772 92813
99056
124339
103976110046
122848 130260.26
0
20000
40000
60000
80000
100000
120000
140000
2011-12 2012-13 2013-14 2014-15 2015-16
Pro
duct
ion
Year
Kharif (Production in MT) Rabi (Production in MT) Total (Production in MT)
4636
50
0
20
40
60
2013-14 2014-15 2015-16
Tk. per
kg
Year

10
Fig. 3.6. Per acre production cost for chili production by type of input (BBS, 2014).
The Fig. 3.6 shows that most of the cost of production is invested in harvesting chili is 9541 Tk.
per acre. Because in the peak season the price of labor and the availability of labor is too low.
For this reason the farmer needs to pay high amount for labor and cost increase. Followed that,
the lion share of total cost of production is spent in fertilizer application that is 9251 Tk. per acre
and after that seedling and plantation that needs 7024 Tk. per acre. The total cost of chili
production is 45242 Tk. per acre.
Per acre benefit cost ratio of chili crop by division is presented in the Fig. 3.7. It is observed
that the highest BCR in Sylhet division was 2.41. Its means if farmer produce chili in Sylhet
division then they are more benefited than they produce in other division. So the Sylhet
division is more suitable for chili production. Followed by the Chittagong division and the
lowest benefit cost ratio was 2.10 in Khulna division.
6931765
728
3556
9541
92515175
3398
70244111
0 2000 4000 6000 8000 10000 12000
Others
Transport
Hormon
Irrigation
Harvesting
Fertilizer
Weeding
Pesticides
Seed & seedling
Land Preparation
TAKA
ITE
MS

11
Fig. 3.7. BCR of chili for different division (BBS, 2014).
Ginger
Ginger (Zingiber officinale) is one of the common and popular spices, which has widely use in
Bangladesh. The price fluctuation of ginger is relatively high than other spices (BBS 2015).
However, there is no effective organization in the production and marketing of ginger in
Bangladesh. Price of ginger can be controlled by maintaining its supply. On the other hand,
fluctuations of ginger prices results the fluctuation of ginger production on the farm level. So,
farmers have to aware of market prices to make their production plan accordingly. Prices in the
market are formed based on supply and demand principles rather than production costs (Hasan
et al., 2017).
Fig. 3.8. Production and area of production of ginger crop (BBS, 2014 & BBS, 2016).
2.19 2.172.25
2.152.1
2.162.24
2.41
1.9
2
2.1
2.2
2.3
2.4
2.5B
enef
it c
ost
rat
io
Division
72084 6885577052 83004 77290
22528 22094 23472 25246 23400
0
20000
40000
60000
80000
100000
2011-12 2012-13 2013-14 2014-15 2015-16
Pro
duct
ion
Year
Production in MT Area in Acres
Linear (Production in MT) Linear (Area in Acres)

12
Above Fig. 3.8 shows that the production of ginger was 72084 MT in the year 2011-12 and the
cultivated area was 22528 acre and the production of ginger was 77290 MT in the year 2015-16
and the cultivated area was 23400 acre. The above figure indicates increasing trend line for
ginger production.
Table 3.5. Yield of Ginger 2013-14 to 2015-16
Division 2013-14 2014-15 2015-16
Yield(kg)/acre Yield(kg)/acre Yield(kg)/acre
Barisal _ _ _
Chittagong 3682 3560 3479
Dhaka 2690 2795 2926
Khulna 2935 3127 2976
Rajshahi 1960 2031 2699
Rangpur 3295 3438 3425
Sylhet 2182 2288 3256
Average 3283 3288 3303
Fig. 3.9. Annual Price Variation for Ginger (DAM, 2017).
11695
74
0
50
100
150
2013-14 2014-15 2015-16
Tk. per
kg
Year
Source: Calculated from BBS (2017)
13
The Fig. 3.9 shows that the highest price of ginger was 116 Tk. per kg in the year of 2013-14 and
the lowest price was 74 Tk. per kg in the year of 2015-16. The price of ginger shows decreasing
trend line.
Cost of ginger production
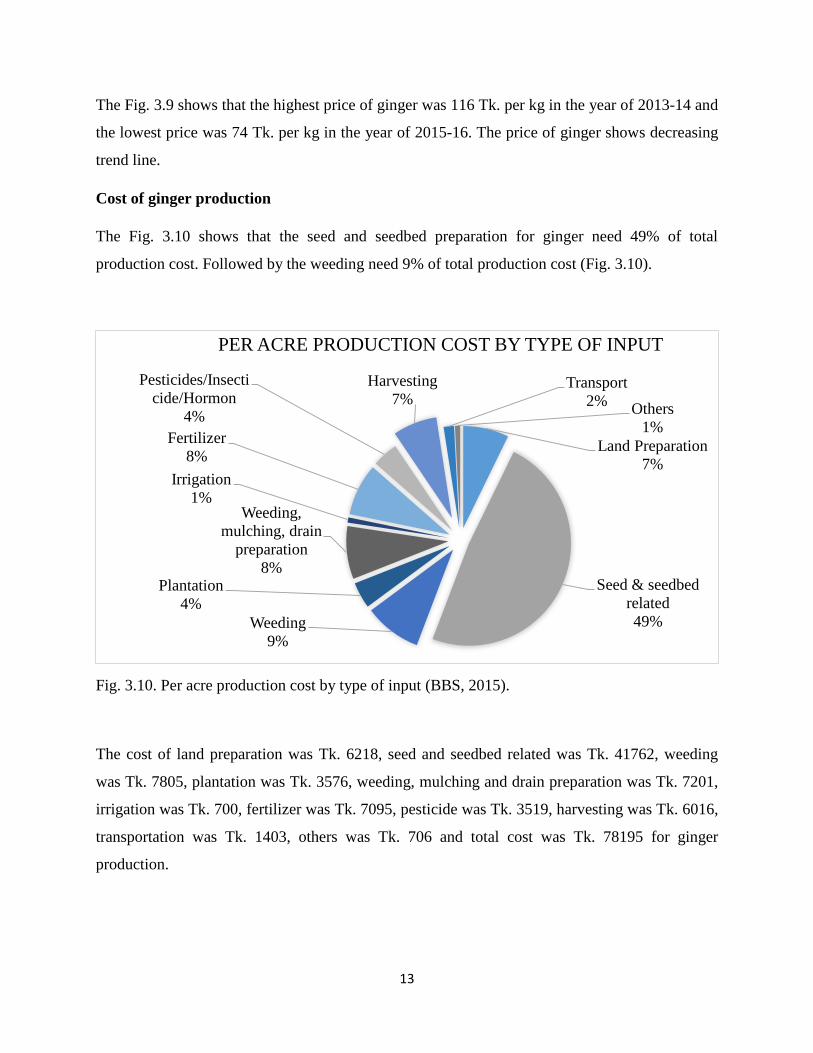
The Fig. 3.10 shows that the seed and seedbed preparation for ginger need 49% of total
production cost. Followed by the weeding need 9% of total production cost (Fig. 3.10).
Fig. 3.10. Per acre production cost by type of input (BBS, 2015).
The cost of land preparation was Tk. 6218, seed and seedbed related was Tk. 41762, weeding
was Tk. 7805, plantation was Tk. 3576, weeding, mulching and drain preparation was Tk. 7201,
irrigation was Tk. 700, fertilizer was Tk. 7095, pesticide was Tk. 3519, harvesting was Tk. 6016,
transportation was Tk. 1403, others was Tk. 706 and total cost was Tk. 78195 for ginger
production.
Land Preparation
7%
Seed & seedbed
related
49%Weeding
9%
Plantation
4%
Weeding,
mulching, drain
preparation
8%
Irrigation
1%
Fertilizer
8%
Pesticides/Insecti
cide/Hormon
4%
Harvesting
7%Transport
2%Others
1%
PER ACRE PRODUCTION COST BY TYPE OF INPUT

14
Table 3.6. Profitability of Ginger for the year 2015-16
Item Gross Return per
acre (Tk.)
Production(Kg.) Price
per Kg.
(Tk.)
Cost per
Acre
Net Return
per
acre(Tk.)
Net Return
per
Kg.(Tk.)
Ginger 244422 3303 74 78195 46817 14.17
Table 3.7. Benefit-Cost Analysis of Ginger for the Farmers for the year 2015-16
Name of the
spices
Gross Return per acre(Tk.) Gross cost per acre (Tk.) Benefit cost ratio
Ginger 244422 78195 3.12
From the table 3.6 and 3.7 it is seen that the total production is multiplied by the price of that
product to get gross return. The production cost is deducted from the gross return to get net
return. Net return for ginger is 14.17 Tk. per kg and the benefit cost ratio is 3.12. That means
farmer get 3.12 taka for every one taka investment.
Turmeric
Turmeric is a spice made from the roots of the Curcuma longa plant referred as “Queen of
Spices”. It is a similar of the ginger plant and produces a stalk over 5 feet tall with yellow
flowers. The turmeric needs to boil the roots and bulbs, drying them to obtain the characteristic
yellow color and grinding them into powder. The people of Bangladesh usually use turmeric in
all curry preparation like meat, fish, vegetables, pulses etc. for its typical color and flavor.
Besides, it is used in medicine and cosmetics and as dye in textile industries. It contents about
69.43% carbohydrate, 6.30% protein, 5.10% oil and 3.50% mineral and other important element
in dry turmeric. It is intensively grown in the highland with sandy loam soil. Turmeric is
cultivated commercially as an annual crop. For cultivating turmeric small rhizomes or pieces of
rhizome is planted on flat soil. The growing plants require heavy manure to get the best possible
yield of turmeric. When the lower leaves turn yellow then it’s ready for harvesting. It needs 7 to
10 months. Harvesting is done by digging the rhizomes up. Leafy tops are then cut off and the
Source: Calculated from BBS (2017)
Source: Calculated from BBS (2017)

15
roots and adhering earth is removed. Rhizomes are then washed. Some of these are retained and
replanting them as a future crop. The remainders are processed into turmeric. For developing the
yellow color and aroma, cleaned rhizomes are boiled in water for one hour under slightly
alkaline conditions and then boiled rhizomes are dried in the sun for 6 to 8 days. Dried rhizomes
are polished to smooth their exterior and also to improve the color. They are then sold in this
form or grind into powder. Turmeric, specially Timla and local variety Sinduri, have huge
demand in the market (BBS, 2013).
Fig. 3.11. Production and area of production of turmeric crop (BBS, 2014 & BBS, 2016).
Fig. 3.11 shows that the production of turmeric was 149564 MT in the year 2011-12 and the
cultivated area was 60583 acre and the production of turmeric was 139877 MT in the year 2015-
16 and the cultivated area was 62014 acre. From the figure it is seen that the trend of production
is slightly decreasing.
149564 143528 136214 129599139877
60583 59223 60963 60932 62014
020000400006000080000
100000120000140000160000
2011-12 2012-13 2013-14 2014-15 2015-16
Pro
duct
ion
Year
Production in MT Area in Acres
Linear (Production in MT) Linear (Area in Acres)
16
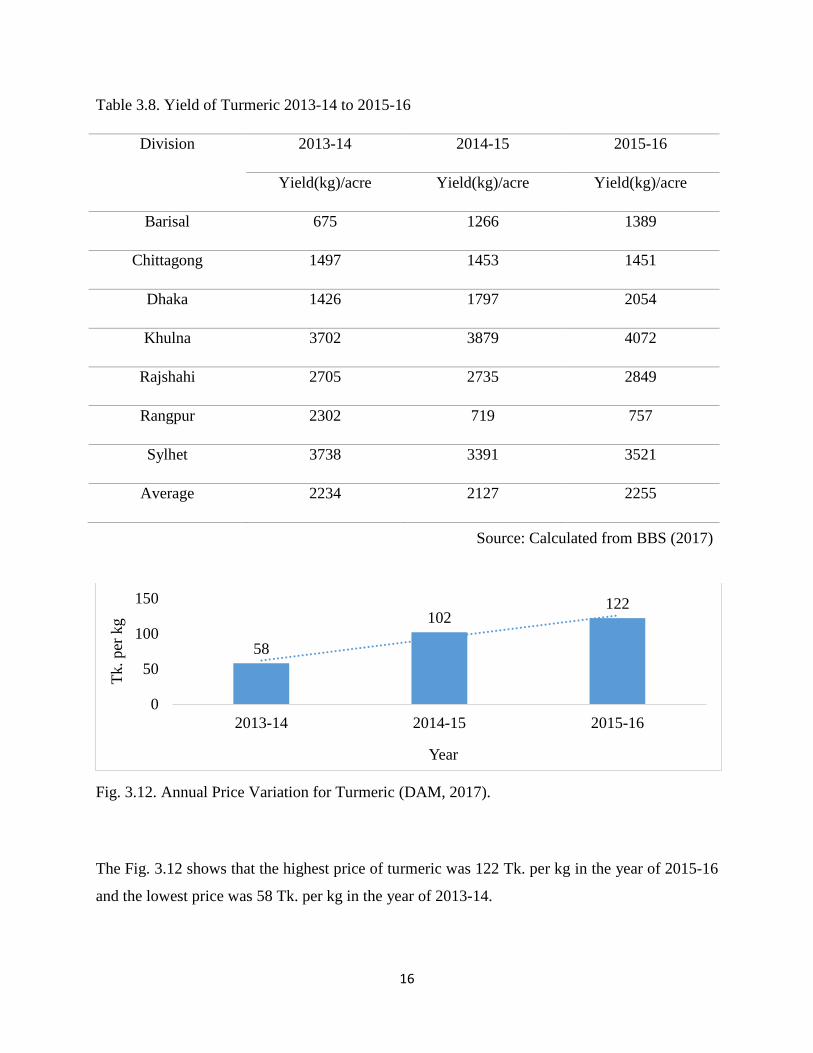
Table 3.8. Yield of Turmeric 2013-14 to 2015-16
Division 2013-14 2014-15 2015-16
Yield(kg)/acre Yield(kg)/acre Yield(kg)/acre
Barisal 675 1266 1389
Chittagong 1497 1453 1451
Dhaka 1426 1797 2054
Khulna 3702 3879 4072
Rajshahi 2705 2735 2849
Rangpur 2302 719 757
Sylhet 3738 3391 3521
Average 2234 2127 2255
Fig. 3.12. Annual Price Variation for Turmeric (DAM, 2017).
The Fig. 3.12 shows that the highest price of turmeric was 122 Tk. per kg in the year of 2015-16
and the lowest price was 58 Tk. per kg in the year of 2013-14.
58
102122
0
50
100
150
2013-14 2014-15 2015-16
Tk. per
kg
Year
Source: Calculated from BBS (2017)

17
Fig. 3.13. Per acre production cost by type of input (BBS, 2013).
The Fig. 3.13 shows that the cost of production is the highest for seed that is 6161 Tk. per acre.
Followed by harvesting that is 5899 Tk. per acre and then plantation is 4295 Tk. per acres. The
total cost of turmeric production is 31575 Tk. per acre.
Table 3.9. Profitability of Turmeric for the year 2013-14
Item Gross Return
per acre (Tk.)
Production(Kg) Price
per Kg
(Tk.)
Cost
per
Acre
Net Return
per
acre(Tk.)
Net
Return
per Kg
(Tk.)
Turmeric 158614 2234 71 31575 127039 56.87
Table 3.10. Benefit-Cost Analysis of Turmeric for the Farmers for the year 2013-14
Name of the
spices
Gross Return per acre(Tk.) Gross cost per acre (Tk.) Benefit cost ratio
Turmeric 158614 31575 5
From the table 3.9 and 3.10 it is seen that the total production is multiplied by the price of that
crop to get gross return. When the production cost is deducted from the gross return then net
11181848
1096
5899
3536 37664295
6161
3857
0
1000
2000
3000
4000
5000
6000
7000T
k. per
acr
e
Items
Source: Calculated from BBS (2017)
Source: Calculated from BBS (2017)
18
return is obtained. Net return for turmeric is 56.87 Tk. per kg and the benefit cost ratio is 5. That
means farmer get 5 taka for every one taka investment.
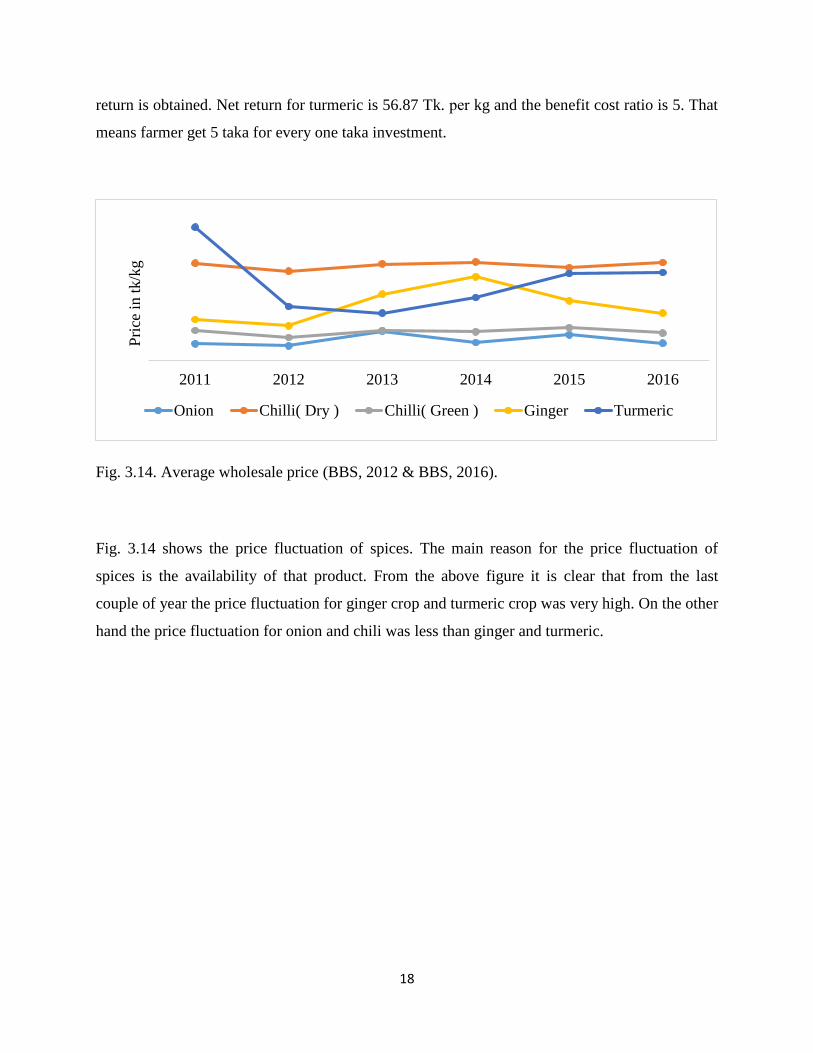
Fig. 3.14. Average wholesale price (BBS, 2012 & BBS, 2016).
Fig. 3.14 shows the price fluctuation of spices. The main reason for the price fluctuation of
spices is the availability of that product. From the above figure it is clear that from the last
couple of year the price fluctuation for ginger crop and turmeric crop was very high. On the other
hand the price fluctuation for onion and chili was less than ginger and turmeric.
2011 2012 2013 2014 2015 2016
Pri
ce i
n t
k/k
g
Onion Chilli( Dry ) Chilli( Green ) Ginger Turmeric

19
Constraints
Loss of arable Land
In Bangladesh, about 80,000 ha of arable land are going out of production every year. The loss is
alarming and needs to be addressed immediately. The land use policy of the government should
be updated and implemented immediately to stop further loss of arable land (Mondal, 2010).
Unfair price of agricultural produces
Most of the productive farmers of Bangladesh belong to small and marginal categories. These
farmers do not have either Farmer’s Association or Farmer’s Co-operative to bargain for fair
prices of their produces. They are forced to sell their produces at low prices to middleman. Since
the farmers are often unable to meet procurement requirements (14% moisture content, absence
of foreign materials in seeds, etc.) of the government, they cannot sell their produces at the price
fixed by the government. (Mondal, 2010).
Lack of quality seeds
Of the total seed requirement, only about 6% quality seeds were supplied in 2003-2004, though
seed as an input could increase production of crop by 10-15% (M. Mondal, 2005). Contribution
of private sector and NGOs for quality seed production is still insignificant. Because the lacking
of seed preservation and processing facilities. They have to depend on BADC for seed
processing. It may be noted that farmer’s low quality seeds still meet about 95% seed
requirement that is considered to be one of the major constraints to crop productivity (Mondal,
2010).
Imbalanced use of fertilizers
Farmers normally use urea in recommended doses. Because of high prices, they apply P and K
fertilizers at the rates that are far below the recommended amount. Chemical fertilizers are not
usually integrated with organic manures. It is thus evident that farmers virtually do not use
balanced fertilizers that are necessary for high productivity. A task force of the Ministry of
Agriculture recently stated that the productivity of crops for the last few decades or so has either
stagnated or declined even though fertilizer use in the country has almost increased three folds
(Mondal, 2010).

20
Rate of taking new technology adoption
One of the causes of relatively poor performance of agriculture is the relatively poor rate of
adoption of new technologies. Public services like research, education and extension are
important to bring improvement in the adoption of new technology, obviously supported by the
private sector input supply (seed, fertilizer, credit, etc.). The challenge is to develop effective
linkages between these public services and farmers. Who plays a major role in testing and
adapting technologies based on their local knowledge (Islam et al., 2012) .
Inadequate credit support to farmers
About 90% farmers of Bangladesh are small and marginal (below 2.5 acres land). They are very
often constrained by finance and thus cannot afford high cost for management. They have very
limited access to institutional credit because of collateral requirement. At present, only 27% of
farmers receive institutional credit. The credit amount again is quite inadequate and not advanced
in time. They are also not eligible for microcredit of NGOs that deal mainly with landless
farmers. The situation compels these farmers to apply inputs, especially expensive P and K
fertilizers far below the recommended doses that finally result in low yield. (Mondal, 2010).
Low education and experience of farmers
Most of the farmers are illiterate and they have not any knowledge and experience about how to
reach in maximum frontier (Islam et al., 2012).

21
CHAPTER 4
CONCLUSION
The production of spices is increasing every year. The production of onion is
1735000MT, the production of chili is 130000MT, the production of ginger is 77290MT
and the production of turmeric is 139877MT in the year 2015-16.
From BCR analysis it is found that among all the spices of the study turmeric (5) was the
most profitable. Followed by BCR (3.12) for ginger, BCR (2.19) for chili and BCR (2.13)
for onion.
There are many constraints in spices production in Bangladesh. The main constraints are
the loss of arable land, unfair price for agricultural products, low rate of technology
adoption, low educational level of farmers etc. In every year a large amount of spices is
imported from abroad due to the shortage of production. Bangladesh has a great prospect
in spices production. So government should take some effective initiative to increase
production in spices sector and raise consciousness among the farmer for enhancing
spices production.

22
REFERENCES
Adnan, K. M. M., Rahman, M. M., & Sarker, S. A. (2014). Marketing channels and post-harvest
practice of onion: A case of Bogura and Joypurhat district in Bangladesh. Universal
Journal of Agricultural Research, 2(2), 61-66.
Ahmed, A., & Ahmed, K. (2013). Sudden onion price surge in Bangladesh: a situation analysis
for policy. International Food Policy Research Institute.
BBS (2012). Statistical Year Book of Bangladesh, Bangladesh Bureau of Statistics, Statistical
Division, Ministry of Planning, Government of the People's Republic of Bangladesh,
Dhaka, Bangladesh.
BBS (2013). Report on Productivity Survey of Turmeric Crop 2013, Productivity Assessment
Survey of Different Agricultural Crops Program, Bangladesh Bureau of Statistics,
Statistics and Informatics Division, Ministry of Planning, Government of the People's
Republic of Bangladesh, Dhaka, Bangladesh.
BBS (2014). Statistical Year Book of Bangladesh, Bangladesh Bureau of Statistics, Statistical
Division, Ministry of Planning, Government of the People's Republic of Bangladesh,
Dhaka, Bangladesh.
BBS (2015). Report on Productivity Survey of Ginger Crop 2015, Productivity Assessment
Survey of Different Agricultural Crops Program, Bangladesh Bureau of Statistics,
Statistics and Informatics Division, Ministry of Planning, Government of the People's
Republic of Bangladesh, Dhaka, Bangladesh.
BBS (2016). Statistical Year Book of Bangladesh, Bangladesh Bureau of Statistics, Statistical
Division, Ministry of Planning, Government of the People's Republic of Bangladesh,
Dhaka, Bangladesh.
BBS (2017). Statistical Year Book of Bangladesh, Bangladesh Bureau of Statistics, Statistical
Division, Ministry of Planning, Government of the People's Republic of Bangladesh,
Dhaka, Bangladesh.
BER (2017). Bangladesh Economic Review, Economic Division, Ministry of Finance, Dhaka,
Bangladesh.
DAM (2017). Annual Report of DAM 2016-17, Department of Agricultural Marketing, Ministry
of Agriculture, Government of the People's Republic of Bangladesh, Dhaka, Bangladesh.
Hasan, M. K., Haque, M. M., & Rabbani, M. G. (2017). Production and price relationship of
ginger (Zingiber officinale) in Bangladesh: A distributed lag model. A Scientific Journal
of Krishi Foundation, 15(1), 01-09.

23
Hasan, M. K., & Mahmud, M. A. A. (2014). The contribution of turmeric research and
development in the economy of Bangladesh: An ex-post analysis. International Journal of
Agricultural Research Innovation & Technology, 4(1), 1-10.
Islam, M. S., Rahman, K. M. M., & Hasan, M. K. (2011). Profitability and resource use
efficiency of producing major spices in Bangladesh. Bangladesh Journal of Agricultural
Economics, 1&2, 1-13.
Islam, Q. M. S., Matin, M. A., & Hossain, S. (2012). Economic performance of ginger (Zingiber
officinale Rose.) cultivation in some selected locations of Bangladesh. Bangladesh
Journal of Agricultural Research, 37(1), 109-120.
Mondal, M. H. (2005). Challenges and Opportunities of sustainable crop production in
Bangladesh, Eighth Biennial Agronomy Convention, Bangladesh Society of Agronomy.
Mondal, M. H. (2010). Crop agriculture of Bangladesh: challenges and opportunities.
Bangladesh Journal of Agricultural Research, 35(2), 235-245.