Embed Size (px)
Citation preview

A SEASONAL STUDY CIF PLANKTON, LARVAL FISH, AND WATER QUALITY IN BUZZARDS BAY, MASSACHUSETTS
INTERIM DATA REPORT OCTOBER, 1987 THROUGH SEPTEMBER, 1988
Jefferson T. Turner, David G. Borkman, William Lima, and Richard W. Pierce
Biology Department Southeastern Massachusetts University North Dartmouth, Massachusetts 02747
Prepared for the Massachusetts Division of Water Pollution Control Research and Demonstration Project 87-15
May, 1989

TNTERIM DATA REPORT OCTOBER, 1987 THROUGH SEPTEMBER, 1988
Research and Demonstration Project 87-15
Jefferson T. Turner, David G. Borkman, William Lima, and Richard W. Pierce
Biology Department Southeastern Massachusetts University
North Dartmouth, Massachusetts 02747
Prepared for Technical Services Branch Division of Water Pollution Control Westborough, Massachusetts 01581
Massachusetts Executive Office of Environmental Affairs John P. DeVillars, Secretary
Department of Environmental Quality Engineering Daniel S. Greenbaum, Commissioner
Division of Water Pollution Control Cornelius J. OtLeary, Acting Director
May, 1989
Publication #15988-250-50-6-89-c.R. Approved By: Ric Murphy, State Purchasing Agent

CONTENTS
Section Page .
ABSTRACT ................................................................... iii ............................................................... INTRODUCTION 1
.................................................................... METHODS 5
................................................................. Stations 5 Sampling ............................................................. 5
................................................. Temperature and Salinity. 6 Light Penetration ...................................................... 6 Nutrients .............................................................. 6
.......................................... Chlorophyll a and Phaeopigments 6 ......................................................... Bacterioplankton 7
Phytoplankton ............................................................ 8 ......................................................... Microzooplankton 9
Net-Zooplankton ........................................................ 9 RESULTS ................................................................... 11 Temperature and Salinity ................................................ 11 Light ................................................................... 11 Nutrients .............................................................. 11
......................................... Chlorophyll a and Phaeopigments 12 ........................................................ Bacterioplankton 12
............................................. Plankton Community Analyses . 13
........................................................ Phytoplankton 13 ..................................................... Microzooplankton 15
Net-Zooplankton ...................................................... 16 DISCUSSION .............................................................. 18
ACKNOWLEDGEMENTS ......................................................... 22 REFERENCES ................................................................ 23 LIST OF FIGURES ........................................................... 31 Appendix Table 1 . Salinity. temperature. chlorophyll & light data ......... 232 Appendix Table 2 . Nutrient data ......................................... 241

iii
ABSTRACT
From October, 1987 through May, 1988, eight stations were sampled in Buzzards Bay on a monthly schedule. Biweekly sampling of the same stations was done from June through September of 1988. Data were obtained on temperature, salinity, water transparency, inorganic nutrients (ammonium, nitrite, nitrate, phosphate, silicate), chlorophyll a and phaeopigments, total bacterioplankton abundance, and numbers and species composition of phytoplankton, microzooplankton (>20 pm) , net-zooplankton (>lo2 pm) , and ichthyoplankton. The eight stations included three in the deep central portion of the bay, two in shallow embayments (Megansett and Mattapoisett Harbors), one in the southern end of the Cape Cod Canal, and two in New Bedford Harbor (one over the sewage outfall and one in the inner harbor).
Although taxonomic analyses of plankton are proceeding, and sampling continues into 1989, some trends are already apparent from the initial year of sampling. On a given day, there was remarkable similarity in the levels of nutrients, chlorophyll a and bacterioplankton abundance throughout most of the bay. Exceptions were the two new Bedford harbor stations. Bacterioplankton numbers ranged from 0.303-10.921 million cells/ml, although most values were between 1-5 million cells/ml. There was a general increase in bacterioplankton abundance at higher temperatures, although 'the trend was not statistically linear. There was no relation between bacterioplankton abundance and level of either chlorophyll a or ammonium.
Nutrient levels were usually higher at the New Bedford sewage outfall and in the inner harbor than at other stations. Although ammonium levels were generally <2-5 micromolar at all other stations, levels generally exceeded 10 micromolar at the sewage outfall, with maximum levels of 20-70 micromolar at warm temperatures (17-24 degrees C). Ammonium generally comprised >70% of total dissolved inorganic nitrogen throughout the bay, regardless of temperature.
Chlorophyll a values were generally <20 pg/l (most <10 pg/l) except in the New Bedford inner harbor. There, almost all chlorophyll a values were >20 pg/l, with a maximum of 65 pg/l. This was even though ammonium values were <10 mlcromolar, values that were much lower than over the more enriched, but also more turbid sewage outfall in the outer harbor.
The differences between the two New Bedford stations and the rest of Buzzards Bay appear due to several factors. The high levels of ammonium, bacterioplankton and turbidity at the sewage outfall are due to sewage. The characteristics of the inner harbor are likely due to long water residence times and reduced circulation due to constriction by the hurricane dike. The rest of Buzzards Bay is well-mixed and open, and appears more similar to continental shelf than

estuarine water. There was considerable seasonality in the composition of all plankton groups being examined.
Data presented here suggest, that at least for the parameters being measured, the New Bedford sewage outfall is the major anthropogenic environmental insult to the water column of Buzzards Bay. There are other pollutants such as PCB's and metals that contaminate sediments, but they are not addressed by this data set. Nonetheless, in terms of pollution (nutrients, turbidity and bacteria) from sewage disposal, it appears that most of Buzzards Bay away from the Clark Point-Clark Cove area near the New Bedford sewage outfall is relatively "unpolluted" by sewage. Accordingly, it is predicted that the projected upgrading of sewage treatment facilities for the City of New Bedford will have a demonstrably beneficial effect.

INTRODUCTION
Estuaries are variable habitats. Their water m,,,,, and populations exhibit pronounced natural fluctuations on time scales ranging from tidal cycle to daily to seasonal to interannual. Superimposed over this natural variability a,, anthropogenic influences that can change both temporally and
C . - - -. . . . . . . . * L
such an estuary. There is a popular local perception that Buzzards Bay
is heavily polluted. This perception is reinforced by (1) perpetual closure of many areas to shellfishing due to high levels of fecal coliform, bacteria, (2) frequent media accounts of PCB pollution in sediments of some rivers draining into Buzzards Bay, (3) recurring spills of raw sewage from overloaded sewage treatment facilities, and (4) the fact that the City olf New Bedford is presently under court order to upgrade sewage treatment facilities from primary to secondary levels.
Although there clearly are substantial "pollutionw problems in some of the embayments of Buzzards Bay, particularly those adjacent to the population center of New Bedford, whether the entire system is heavily impacted is yet unclear. It will be impossible to pinpoint changes in water quality and marine populations, either for better or for worse, without considerable additional baseline information. This must cover not only the urbanized embayments, but also the more open and remote areas of the bay. In short, there must be a "beforeN to have nbefore and afterw comparisons, and it must be known what is ttnormalw to be able to spot what is wabnormalw. With projected population growth in portions of southeastern Massachusetts that border Buzzards Bay, baseline information on the estuary is essential for rational management of the system. This is particularly urgent in view of likely increases in eutrophication, coastal development, and commercial and recreational use.
There are increasing indications that the quantity and/or composition of the plankton may be indicators of pollution. This particularly applies to the impact of sewage disposal. For instance, sewage and its associated ammonium may favor replacement of diatoms by nanoplanktonic flagellates and chlorophytes (Greve and Parsons, 1977; Ryther and Dunstan, 1971; Ryther and Officer, 1981), or blue-green algae (Taslakian and Hardy, 1976). However, these trends are not universal. Smayda (1984) found that in Narragansett Bay, the major phytoplankton species simply

became more abundant upon exposure to ammonium enrichment. I Further complications include the abilities of zooplankton
grazers to alter the species composition and size distribution of the phytoplankton (Ryther and sanders, 1980), as well as changes due to the normal seasonal succession of various phytoplankters and their grazers (Turner et al., 1983). In essence, increasing abundance of flagellates in estuarine waters may mean that the water is becoming polluted, or that the zooplankton have just grazed down a diatom bl-oom, or simply that it is summer.
Since various components of the plankton interact with the water, its c:hemistry, and with each other, it is essential that these parameters be measured synoptically. otherwise, it will be impossible to separate anthropogenic from natural variations. The plankton are not only the base of pelagic food chains leading to larger water-column consumers such as fishes, but also are either direct or indirect prey of shellfish and other benthic organisms.
Information on the water quality and plankton populations of Buzzards Bay is quite limited. A recently- prepared bibliography of scientific studies from the Buzzards Bay region (Tripp, 1985) highlights this fact. Although numerous cited studies came from the laboratory using organisms or water from Buzzards Bay, and there have been numerous field studies of plankton and water chemistry from adjacent waters in the "Buzzards Bay region" (ie. Vineyard Sound, Cape Cod Bay, the Gulf of Maine and the southern New England continental shelf), there are no published studies of community analyses of phytoplankton, bacterioplankton, or ichthyoplankton populations of Buzzards Bay proper. There has been only a single paper on zooplankton distributions in Buzzards Bay (Anraku, 1964), and that presented data only for copepods. Aside from some very recent, yet: unpublished studies done in connection with siting of a new sewage outfall for the City of New Bedford, understanding of plankton populations in Buzzards Bay must be largely extrapolated from studies in adjacent waters such as Vineyard Sound, Narragansett Bay, Cape Cod Bay, and Long Island and Block Island Sounds (see Smayda, 1973; 1980; 1983; and Davis and Merriman, 1984, for reviews).
There has been more effort to gather data on water chemistry in the bay (Beskenis, 1987; Gil, 1987; 1988; Stenner et al., 1988). However, much of this data, though spatially extensive, was not temporally intensive. Many stations were occupied only during one season. Although this data demonstrates nutrient variability, there is still inadequate know]-edge of nutrients throughout the bay to quantify trends (Stenner et al., 1988).
In view of the general paucity of plankton and nutrient data for Buzzards Bay, a sampling program was initiated in October of 1987 to characterize these parameters. This project was funded by the Massachusetts Department of ~nvironmental Quality Engineering (DEQE), Research and Demonstration Program (Project 87-15). In view of increased

environmental awareness concerning Buzzards Bay, other studies proceeding in the estuary, and pending decisions relating to wastewater management, it was decided to make this data available. Diata are presented on temperature, salinity, water transparency, nutrient, chlorophyll a and phaeopigment, and bacterioplankton distributions over the first year of study (October 1, 1987-September 20, 1988), throughout the bay. In addition, additional data are presented on populations of phytoplankton, microzooplankton, and net-zooplankton at several stations over a portion of the year. Although taxonomic analyses of the initial year's samples are proceeding, and sampling continues into 1989, some trends are already apparent from the first year's data.

70°40
Fig. 1

METHODS
Stations
Samples were collected at eight stations throughout Buzzards Bay (Fig. 1) . Three of these (Stations 4 , 5, and 6 ) were at buoys along the central axis of the bay at depths of different from those sampled throughout the rest of the bay. stations 1 and 3 were at buoys in the shallow embayments of Mattapoisett and Megansett Harbors (depths of approximately 5-8 m. Station 7 (depth = subsurface outfall of the at Clark Point. Station 8 Bedford inner harbor (ie. main channel opposite the
6-8 m) was within 50 m-of the -
New Bedford sewage treatment plant (depth = 8 m) was in the New inside the hurricane dike) in the State Pier. All stations were
precisely located by Loran coordinates. Water column depths at a given station varied, depending upon tide.
Samples were obta.ined 17 times between October 1, 1987 and September 20, 1988. All stations were sampled on a single day on each cruise. Cruises were made monthly from November-May, and biweekly in October, and from June- September. At each staition water samples were collected with Niskin bottles from surface, mid-depth, and near-bottom (ie. within approximately 1. m of the bottom). These water samples were used for synoptic: salinity, nutrient, chlorophyll-a and phaeopigment, bacterioplankton (surface only), phytoplankton, and mic:rozooplankton analyses. Larger zooplankton and ichthyoplankton were collected by vertical- oblique tows over the entire water column with 102 pm-mesh nets. Temperature was measured at lm depth intervals over the entire water colun~n at each station, and water column transparency was measured with a Secchi disk. Average on- station time was approximately 15-20 min, and filtration, screening, and labelling of samples was done while underway to the next station. Cruises typically began at 0700-0730 h, and were completed by 1500 h. In all but a few cases, the order of sampling was, sequentially, Stations 6, 5, 4, 3, 2, 1, 7, and 8.

Temperature and salinity
Temperature was measured at lm-intervals over the entire water column to the nearest hundreth.of a degree c with a Beckman te:mperature probe. Salinity was measured at surface, mid-deptlh, and bottom levels to the nearest part per thousand with a refractometer.
Liaht Penetration
Light penetration was estimated from readings taken with a 30 cm-diameter white Secchi disk. Estimates were made to the nearest half meter. The equations of Smayda presented on p. 3 of Loder (1988) were used to calculate the 1% isolume depth (ie. bottom of the euphotic zone):
Isolume depth in meters = In (fraction of light)/(-K)
where: fraction of light is percent of that at the surfacle (ie. fraction = 0.01 for 1%) ,
and: extinction coefficient (K) = 1.44/Secchi depth in meters
Nutrients
At surface, mid-depth and bottom depths at all stations on all cruises, water samples were collected for ammonium, nitrate, nitrite, orthophosphate, and silicate analyses. To avoid measuring nutrients that were incorporated into the cells of plankton organisms, or other all samples for nutrient analyses were filtered through Whatman GFC glass fiber filters aboard ship. Samples were then kept on ice until return to the laboratory. Ammonium analyses were usually perfo~rmed the evening after a cruise, or in a few cases, they were frozen and performed the next morning. Nitrate, nitrite, orthophosphate and silicate analyses were performed within two days on samples that had been deep frozen. Analyses were conducted with either a Technicon Autoanalyzer 2, or a Alpkem RFA-300 elemental analyzer. The chemistry was essentially that according to Parsons et al. (1984).
Chloro~hvll a and P'haeo~iaments
Water from surface, mid-depth and bottom samples at all stations was filtered through Whatman GFC glass fiber filters aboard ship. Either 100 ml or, most often, 200 ml was filtered. Filters were coated immediately with 1% MgC03 to prevent pigment degradation, and filters were individually wrapped in aluminum foil and kept on ice until return to the laboratory. Either the night after sampling, or the next day (using frozen filters), filters were

disintegrated in 90% acetone and kept overnight in a freezer in the dark for maximum extraction of pigments. ~h~ following day chloroplnyll a analyses Were done with a Turner Designs (no relation) Model 10 fluorometer according to the methods described in Parsons et al. (1984) . Phaeopigment analyses were after acidification with 1N HC1.
The procedures for bacterioplankton anaylses borrowed various portions of the epifluorescence microscopy direct count methods of Hobbie et al. (1977), Porter and Feig (1980) and Caron (1983). These were adapted to the present sampling regime. Accordingly, these methods are described in some detail.
Bacterioplankton samples were collected from the surface only. Since samples must be processed within 1-2 days of collection, it was impossible to do 24 samples from each cruise within the acceptable time frame, but it was possible to do all 8 surface samples within a day. Attempts were made to perform bacterioplankton counts from Cruise 1, but the data had to be! discarded due to contamination of the distilled water used t.o rinse the samples (see below). Although the water hadl been filtered through 0.2 pm Nucleopore filters to remove bacterial contaminants, filtration was done several days prior to the cruise, and there was sufficient time for bacteria in the water bottle to grow to contaminating levels. Thereafter, all stains, rinsing solutions, and preservatives were filtered within a half hour of use in preparing slides, or in the case of the gluteraldehyde preservative used aboard ship, within a half day prior to each cruise. All solutions were refrigerated until use. Blank samples (0.2 pm-filtered distilled water) were otherwise treated as if they were field bacterioplankton samples. It was consistently found that there were almost no bacterial cells in soultions. The only discernable particles present appeared to be fibers, probably from the laboratory atmosphere or the investigatorsf clothes.
Samples were preserved aboard ship in gluteraldehyde. This was purchased as a 50% solution, and was diluted to 6% stock solution (6 ml gluteraldehyde in 44 ml of 0.2 - filtered distilled watler). Aboard ship 18 ml of sur Pm ace sea water was added to 2 ml of gluteraldehyde stock solution in a scintillation vial, for a final gluteraldehyde concentration of 0.6%.
Two stains were used: DAPI for bacteria cells (see Porter and Feig, 1980) and proflavin for eucaryotes (see Caron, 1983) . DAPI stains DNA, so for procaryotes such as bacteria, the entire cell becomes stained. Under blue light with epifluorescence microscopy, DAPI is a bright light-blue against a dark blue background. Proflavin stains cytoplasm light yellowish green (blue light passing through a yellow excita filter). Since chlorophyll a fluoresces bright red

under epifluorescence microscopy, photosynthetic versus heterotrophic protists can be distinguished (using the yellow filter) as either red or yellowish green cells against a black background.
Although this technique works beautifully with cells that were alive until just prior to slide preparation, preservation with gluteraldehyde causes rapid fading of the red fluorescence in chlorophyll-bearing cells. his fading can be somewhat minimized by refrigeration of samples prior to making slides. Unfortunately, however, it was discovered that preservation of only several hours caused sufficient fading to preclude reliable distinction of faded orangeish/reddisl~ green (autotrophic) from proflavin-stained yellowish green (heterotrophic) protists. It was necessary to preserve samples aboard ship since ceil growth in unpreserved samples during the eight or so hours of a cruise would have compromised quantification. Accordingly, attempts were abandoned to count #@redw versus "green1# flagellates, and only the DAPI-stained bacterioplankton were counted.
Gluteraldehyde-preserved samples were refrigerated upon return to the laboratory, and samples were prepared and counted either the day after each cruise, or at most, the day after that (ie. less than 40 hrs. after sampling). Cells were concentrated for counting by filtration onto 0.2 pm- pore size black Nucleopore filters. A Whatman GFC glass fiber filter was placed beneath each Nucleopore filter for support. A sample of 5 ml of the 0.6% solution from shipboard was placed in the filtration funnel with 0.1 ml of proflavin stock for 2 minutes for staining. This solution was then filtered until the filter was only slightly wet and immediately 10 m:L of 0.2 pm-filtered distilled water and 0.1 ml of DAPI stock was added. After an additional 5 minutes of staining, this solution was filtered. Before the filter could dry, it was quickly sandwiched between a slide and coverslip using non-fluorescing immersion oil as a mounting medium.
Bacterioplankton cells were counted at lOOOx with oil immersion using a Whipple disk. At least 400 cells were counted, giving a counting accuracy of better than + 10% (~uillard, 1973). Knowing the dimensions of each Whipple disk field and the total filtration area containing cells, it was possible to calculate the fraction of the total sample that had been counted.
Phytoplankton
Samples of 800 ml each were taken from surface, mid- depth, and bottom Niskin bottle collections and preserved in Uterm'dhl's solution (Guillard, 1973). Cells were concentrated by gravimetric sedimentation (ashore) in graduated cylinders until aliquots of 10 ml were obtained. These aliquots were examined in hemocytometer and/or Sedgwick-Rafter counting chambers. All cells were counted and identified to the lowest possible taxon. In most cases,

aliquots of at least 400 cells were counted, giving accuracy of + 10% or better (Guillard, 1973).
A variety of taxonlomic references were used f o r phytoplankton identification, including Lebour, 1925; 1930; Cupp, 1943; Hulburt, 1957; 1965; Brunel, 1962; Hendey, 1964; Steidinger and Williams, 1970; Campbell, 1973; and Marshall, 1986. However, the latter two were most helpful for most routine identifications,, and in cases of taxonomic discrepancies between various references, the convention of using the classification of Marshall (1986) was followed.
Samples of either 3 or 4 liters from each surface, mid- depth, and bottom Niskin bottle collection were screened aboard ship through 20 plm-mesh Nitex screen, rinsed into jars, and preserved with Utermohlfs solution. Rinse water was always from the same collection as the sample. Aliquots of generally 80-150 ml were obtained by gravimetric sedimentation, and subsamples of these were examined in a Sedgwick-Rafter cell with a compound microscope. At least 400 organisms were counted and identified to the lowest possible taxon, which was usually species. In the case of copepod nauplii, not only species but usually naupliar stage was identified.
A variety of taxono:mic references were useful in identifying the heterogeneous assemblage comprising the t micro zoo plankton". For dinoflagellates many of the same references were used as in the phytoplankton studies, although Campbell (1973) and Marshall (1986) were, again, most helpful. For tintinnids, Marshall (1969) was the primary reference, although Gold and Morales (1975a; 1975b; 1976a; 1976b; 1976c) were also used. Additionally, Hargraves (1981), Sanders (1987) and Verity (1987) provided useful information on tintinnid seasonality in New England estuarine waters. For oligotrich identifications, Lynn and Montagnes (1988), Lynn et: al. (1988) and Montagnes et al. (1988) were essential, although Bock (1967) , Small and Lynn (1985) Maeda (1986) and Maeda and Carey (1985) provided additional information. For rotifers Berzins (1960) and Rousselet (1902) were used for generic classifications, although as in Heinbokel et al. (1988), it was decided that preservation of rotifers causes enough size distortion to preclude species-level identifications in most cases. For copepod nauplii the most useful taxonomic references were Gibbons and Oglivie (1933), Conover (l956), Faber (1966), and Lawson and Grice (1970; 1973).
Net-Zoovlankton
Net-zooplankton were collected with 102 pm-mesh flowmeter-equipped nets of 0.5 m diameter. Vertical/oblique tows were made over the entire water column, and shipboard preservation was in 5-10% forma1in:sea water solutions.

Ashore, samples were transferred to 70% ethanol solutions, primarily to prevent constant inhalation of formalin during sorting.
Samples were reduced to aliquots of at least 500 animals with a Folsom plankton splitter, and animals were counted under a dissecting microscope and identified to the lowest possible taxon. In most cases this was to species, and adult copepods were further characterized by sex. All copepodite stages of a given copepod genus were lumped. All copepod nauplii were also lumped, because copepod nauplii of small species cannot be reliably separated to genus under a dissecting microscope. Recall, however, that nauplii were identified to species, and usually naupliar stage, in the microzooplankton analyses done at higher magnification with a compound microsc:ope.
A wide variety of taxonomic references were employed in zooplankton identifications. Helpful references, not previously cited in connection with the microzooplankton, included Wilson (1.932), Rose (1933), Wells (1970), Grice (l97l), Bowman (1971; l975), and Nishida (1985) (copepods) ; Lang (1980) Lang and Ackenhusen-Johns (1980) (barnacle nauplii); Della Cr-oce (1974) (cladocerans); Fraser (1957) (chaetognaths); Nutting (1901) (hydroids); and Sandifer (1972) (decapod larvae). For other groups, the zooplankton fiches (Fraser and Hansen, 1957-1980) were most frequently used.

RESULTS
Tem~erature and Salinity
Buzzards Bay exhibited pronounced seasonal Variability in temperature (Fig. 2) with surface values ranging from minus 2.0 degrees C on January 12, to 27.26 degrees C on August 10, 1988 (Table 1). From October, 1987 through May, 1988, and again in September, 1988, the water column was essentially isothermal with less than a single degree C vertical variation in temperature at a given station. However, from June through August, 1988, there was vertical temperature structure (Fig. 3). The surface warning appeared to have been partially a die1 phenomenon, in that near- surface waters progressively warmed from early morning through mid-afternoon. It is presumed that nighttime cooling contributed to the low early morning temperatures, but there are no data to confirm this since sampling was always completed prior to 1500 h.
Salinity was almost uniformly 30 o/oo, throughout the bay, throughout the year (Appendix Table 1).
Lisht (All light data are listed in Appendix Table 1)
Secchi disk readings varied considerably with season and location, with values of up to 9 m in April (Cruise 8) and August (Cruise 14). Minimum readings (1.0-1.5 m) were recorded, in most cases, at Station 7 above the New Bedford sewage outfall.
Calculated euphoti,c zone depths were generally deeper than the depth of the wfater column. Accordingly, with a generally euphotic bottom, it appears that light rarely limits phytoplankton growth in Buzzards Bay.
Nutrients (All nutrient data are listed in Appendix Table 2)
Inorganic Nitrogen Species
The most remarkable facet of distributions of inorganic nitrogen species was their seasonal, vertical and areal uniformity throughout most of Buzzards Bay (Figs. 4-22). Except for generally higher surface ammonium values (2.49- 70.53 pg AT/l) at the New Bedford sewage outfall (Station 7), ammonium values were generally less than 10 pg AT/1 throughout the rest of the bay, regardless of season (Fig. 23). Although the highest surface ammonium values were found at Station 7 at temperatures warmer than 18 degrees C (Fig. 23), ammonium generally comprised >70% of total dissolved inorganic nitrogen (D.I.N.) (= NH4 + NO3 + N02) throughout the bay (range = 14.29-99.79%), regardless of temperature(Fig. 24). Nitrate levels ranged from 0.01 - 4.16 pgAT/l and nitrite levels ranged from 0.00 -1.71 pgAT/1 (Figs. 4-22).

Silicate and Phosphate
Silicate levels fluctuated more with season than did other nutrients (Figs. 25-44). From late October through April, silicate values were generally <2 pgAT/l throughout the bay except for slightly higher values (up to 6-12 pgAT/l) at the two New Bedford stations, 7 and 8 (Figs. 26- 32). However, beginning in May and continuing through late July, silicate values progressively increased throughout the bay (Figs. 33-37). Beginning in August, and continuing through September of 1988, however, silicate concentrations declined to more typical levels (Figs. 38-44). Phosphate levels were comparatively uniform ( 0.14 - 6.72 pgAT/l) throughout the estuary, throughout the year (Figs. 25-44).
Prior to, and including Cruise 15, all nutrient analyses were performed at Woods Hole Oceanographic Institution (WHOI) using a Technicon Autoanalyzer 2. Beginning with Cruise 16, however, nutrient analyses were also performed at SMU with a Alpkem autoanalyzer, and for Cruises 16 and 17, analyses were performed with both instruments, at both institutions. Comparisons of Figs. 19 and 40 (Cruise 16 data from WHOI) with Figs. 20 and 41 (Cruise 16 data from SMU), and Figs. 21 and 42 (Cruise 17 data from WHOI) with Figs. 22 and 43 (Cruise 17 data from SMU) reveal that the data from the two instruments corresponded within analytical error.
Chlorowhvll a and Phaeowiments (Borkman)
Most chlorophyll a values (range = 2.09-64.66 pg/l) were remarkably similar over a broad temperature range (Fig. 4 5 ) , throughout most of the bay, both at the surface and over all depths (Figs. 46-62). Values were generally <20 pg/l, with most <:lo pg/l except at Station 8 in the inner harbor of New Bedford (Fig. 45). At Station 8, however, almost all chlorophyll a values exceeded 20 pg/l, even though ammonium levels were <10 (Fig. 63). At Station 7 (the New Bedford sewage outfall), at much higher ammonium levels (approximately 10-70 p), chlorophyll a levels mostly remained below 10 ug/l (Fig. 63).
Phaeopigment concentrations (0.013 - 9.39 )~g/l) were negligible throughout the bay (Figs. 46-62).
Bacteriowlankton (Sample preparation by Borkman, microscopic counts by Turner)
Surface bacterioplankton abundance ranged from 0.303- 10.921 million cells/ml (Fig. 64), Although there was a general increase in abundance as temperatures warmed beyond 18 degrees C, this trend was not statistically linear. On most sampling dates, bacterioplankton numbers were similar throughout the estuary (Figs. 65-80). On a few dates during the warmer season bacterioplankton abundance was somewhat

higher at Stations 7 and 8 near New Bedford (Figs. 76, 77, go), but such elevated numbers were unexpectedly infrequent. There was an apparent difference, however, in the -composition of the bacterioplankton assemblage at the sewage outfall (Station 7), compared to other stations. Throughout the survey, the bacterioplankton assemblage at all stations except 7 was almost exclusively comprised of small cocci <1 um in diameter. At Station 7, however, rod-shaped cells of up to 2 um in length were always abundant, comprising a mean of 33% of total cells (range = <1% - 72%). These rods were probably fecal coliform or other sewage-related bacteria.
There was no apparent relationship between bacterioplankton abundance and concentrations of either chlorophyll a (Fig. 81) or ammonium (Fig. 82).
Plankton Community Analyses
Taxonomic analyses of phytoplankton, microzooplankton, and net-zooplankton samples necessarily lag behind the relatively instantaneous generation of chlorophyll, nutrient and bacterioplankton data. Thus, taxonomic analyses are completed for only a portion of the plankton samples collected thus far. Nonetheless, those data are presented for two reasons: 1) to give examples of the types of analyses being performed, and 2) to show that total plankton abundance and taxonomic composition vary much more with location, time and depth than other parameters discussed above.
Phytoplankton (Borkman)
Phytoplankton taxonomic analyses have been completed for surface, mid-depth, and bottom samples from all eight stations on Cruise 1 (October 1, 1987), and for all three depths for stations on a gradient from mid-bay (Station 6), to the New Bedford outer harbor (Station 7), to the inner harbor (Station 8) for Cruises 2-5 (October 20, 1987 - January 8, 1988).
On Cruise 1, there were virtually no differences in phytoplankton numbers between depths at a given station (Fig. 83). This reflects the well-mixed state of the system in early October. In addition, total phytoplankton numbers were similar throughout the bay (0.511-1.908 million cells/liter) with the exception of Station 3 (Megansett Harbor). There, cell numbers (4.568-4.795 million cells/liter) were over twice those recorded elsewhere throughout the bay.
Despite the vertical and nearly complete areal homogeneity in phytoplankton numbers on Cruise 1, there were taxonomic differences in assemblages at different stations (Figs. 84-107). Some stations were numerically dominated by a mixture of microflagellates (p-flagellates in Figures), numerous species of the diatom genus Chaetoceros, and the diatom Skeletonema costatum (Stations 1 and 5). However, at

Station 3 (Megansett) and 4 (Cleveland c edge), S . costaturn was overwhelmingly dominant (64.6-84.2%). Also, the diatom .
LeDtocvlindrus danicus was abundant at station 2 (cape cod Canal) and downstream at Station 5. his probably reflects the presence of water originating in Cape cod Bay that was flowing through the Canal from northeast to southwest (ie. into Buzzards Bay) at the time of sampling. The insignificant amount of H. danicus at Station 4 (Cleveland Ledge), together with the phytoplankton similarity at this station with station 3 (Megansett), suggests that the water mass at Stations 3 and 4 (dominated by S. costatum) was different from that flowing through the Canal (dominated by L. danicus) and downstream at Station 5. -
Other differences were apparent on Cruise 1, particularly comparing Station 6 with the two adjacent New Bedford harbor stations (Stations 7 and 8). The diatom Ceratulina ~elaaica was abundant (8.7-25.5%) at Stations 6 and 7 (Figs. 102-107), even though this species was unrecorded or numerically insignificant elsewhere. Also, S . costatum was the major component of the "other diatomsIt category that comprised 10.2.-24.7% of cells at Station 6 (Figs. 99-101), even though this species was not recorded at the nearby New Bedford stations (Stations 7 and 8). Finally, the flagellate Chroomonas sp. was abundant at Stations 6, 7, and 8, but was absent or insignificant elsewhere.
Phytoplankton abundance at Stations 6, 7, and 8 varied considerably on Cruises 2-5 (Figs. 108, 109, and 110) . There was variation with cruise, station, and, to a lesser extent, depth. In order to better visualize temporal trends at these stations, data for Cruise 1 are repeated in Figures 108-110. Taxonomic composition of the phytoplankton also varied with depth at a given station, from station-to-station within the same cruise, as well as from cruise-to-cruise (discussed below).
On Cruise 2 (October 20, 1987) abundant taxa (in varying proportions) included unidentified microflagellates, several species of the diatom genus Chaetoceros, the diatom Le~tocvlindrus danicus, a mixed assemblage of other diatoms, and dinoflagellates, including Gvmnodinium nelsoni (Figs. 111-119). There were pronounced differences with depth, such as the different percentages of microflagellates and L. danicus at Stations 6 and 7. Also, dinoflagellates (primarily G. nelsoni) comprised over half the cells at the bottom at Station 7 (Fig. 116), but only 3.9-5.4% of cells in overlying depths (Figs. 114, 115). Conversely, at Station 8, the relative proportions of taxa were relatively similar with depth (Figs. 117-119).
By Cruise 3 (late November), unidentified microflaglellates had declined to levels of 2-13% of totals (Figs. 120-128), and the phytoplankton was dominated by diatoms. These included several species of Chaetoceros, Le~tocvlindrus danicus, Asterionella slacialis, Ceratulina pelaaica, and a mixture of other taxa. Dinoflagellates were a minor component (<1-3.4%). Also, at Station 6 the
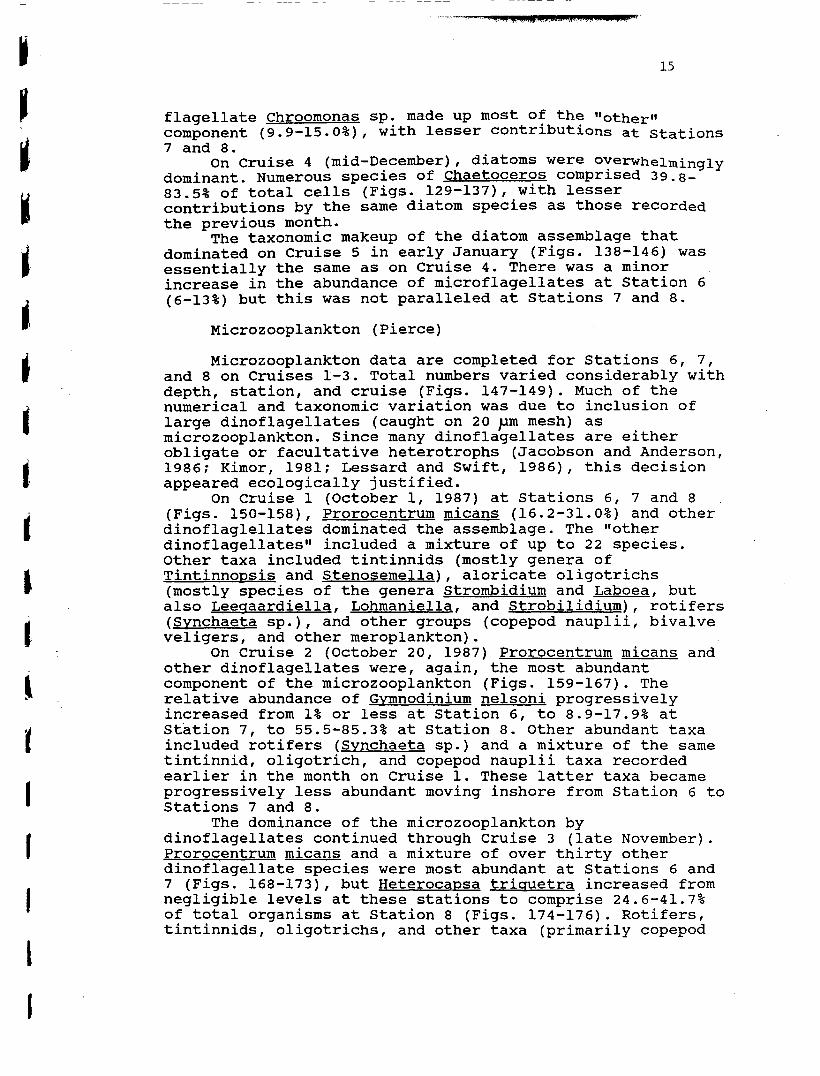
flagellate Chroomonas sp. made up most of the mother" component (9.9-15.0%), with lesser contributions at stations 7 and 8.
On Cruise 4 (mid-December), diatoms were OVeWhelmingly dominant. Numerous species of Chaetoceros comprised 39.8- 83.5% of total cells (Figs. 129-137), with lesser contributions by the same diatom species as those recorded the previous month.
The taxonomic makeup of the diatom assemblage that dominated on Cruise 5 in early January (Figs. 138-146) was essentially the same as on Cruise 4. There was a minor increase in the abundance of microflagellates at Station 6 (6-13%) but this was not paralleled at Stations 7 and 8.
Microzooplankton (Pierce)
Microzooplankton data are completed for Stations 6, 7, and 8 on Cruises 1-3. Total numbers varied considerably with depth, station, and cruise (Figs. 147-149). Much of the numerical and taxonomic variation was due to inclusion of large dinoflagellates (caught on 20 )Im mesh) as microzooplankton. Since many dinoflagellates are either obligate or facultative heterotrophs (Jacobson and Anderson, 1986; Kimor, 1981; Lessard and Swift, 1986), this decision appeared ecologically justified.
On Cruise 1 (October 1, 1987) at Stations 6, 7 and 8 (Figs. 150-158), Prorocentrum micans (16.2-31.0%) and other dinoflaglellates dominated the assemblage. The "other dinoflagellatesw included a mixture of up to 22 species. Other taxa included tintinnids (mostly genera of Tintinnopsis and Stenosemella), aloricate oligotrichs (mostly species of the genera ~trombidium and Laboea, but also Leeaaardiella, Lohmaniella, and Strobilidium), rotifers (Svnchaeta sp.), and other groups (copepod nauplii, bivalve veligers, and other meroplankton).
On Cruise 2 (October 20, 1987) Prorocentrum micans and other dinoflagellates were, again, the most abundant component of the microzooplankton (Figs. 159-167). The relative abundance of Gvmnodinium nelsoni progressively increased from 1% or less at Station 6, to 8.9-17.9% at Station 7, to 55.5-85.3% at Station 8. Other abundant taxa included rotifers (Svnchaeta sp.) and a mixture of the same tintinnid, oligotrich, and copepod nauplii taxa recorded earlier in the month on Cruise 1. These latter taxa became progressively less abundant moving inshore from Station 6 to Stations 7 and 8.
The dominance of the microzooplankton by dinoflagellates continued through Cruise 3 (late November). Prorocentrum micans and a mixture of over thirty other dinoflagellate species were most abundant at Stations 6 and 7 (Figs. 168-173), but Heteroca~sa triauetra increased from negligible levels at these stations to comprise 24.6-41.7% of total organisms at Station 8 (Figs. 174-176). Rotifers, tintinnids, oligotrichs, and other taxa (primarily copepod

nauplii and bival assemblages.
veligers) comprised the remainder of
Net-Zooplankton (Lima)
Analyses of vertical net-zooplankton samples have been completed for a gradient of stations from the center of the bay, to the New Bedford outer harbor, to the New ~edford inner harbor (stations 6, 7, and 8, respectively), from Cruises 1-6 (October 1, 1987 - February 2, 1988). ~otal zooplankton population densities fluctuated considerably (Fig. 177) with no systematic trends either from station-to- station, or date-to-date. There was also considerable taxonomic variation between stations (discussed in following paragraphs) .
On Cruise 1 (October 1, 1987) at Station 6 (Fig. 178), copepod nauplii were dominant (28.8%), along with the appendicularian Oikowleura dioica, and a mixture of the copepod Paracalanus (primarily 2. crassirostris copepodites) and other copepods (mixture of adults and copepodites of Acartia tonsa, Oithona similis, and Q. colcawa). There was also a smattering of polychaete larvae and other taxa. On the same date at Stations 7 and 8 (Figs. 179, 180), copepod nauplii were overwhelmingly dominant (46.7-70.0%), along with a mixture of other copepods (adults and copepodites of the genera Paracalanus, Oithona, Acartia, and Sa~hirella). There were almost no Oiko~leura dioica at Stations 7 and 8.
On Cruise 2 (October 20, 1987) at Station 6, Oikopleura dioica, Paracalanus spp. (copepodites) and other copepods (adults and copepodites of Acartia tonsa, Oithona spp., and Sa~hirella spp.) were again abundant, with copepod nauplii comprising only 16.7% of total numbers (Fig. 181). At Stations 7 and 8 (Figs. 182, 183), relative percentages of copepod nauplii more than doubled, Q. dioica disappeared, and rotifers (Svnchaeta spp.) were present. Although Paracalanus spp. copepodites were again the dominant copepods at Station 7 (Fig. 182), these were replaced as dominants at Station 8 by Acartia tonsa copepodites (Fig. 183).
By Cruise 3 in late November, relative percentages of copepod nauplii had declined (6.9-15.9%), and a mixture of copepods was dominant (Figs. 184, 185, 186). These copepods included primarily adults and copepodites of Paracalanus crassirostris, but also Oithona spp. (primarily colcawa), Acartia tonsa and Acartia hudsonica, Centropaues spp. and Savhirella sp.. Polychaete larvae were 10% of total animals at Station 7 (Fig. 185), but this proportion rose to almost a third at Station 8 in the New Bedford inner harbor (Fig. 186).
On Cruise 4 in early December (Figs. 187, 188, 189) copepod nauplii were again a minor component of the zooplankton. Paracalanus crassirostris adults and other copepods (copepodites of Paracalanus spp., Centropases spp., ~cartia spp., and 0ithona spp., and adults of Centropases

tvpicus, Centro~ases hamatus, Oithona sirnilis, Oithona colcarva, Acartia hudsonica, Microsetella nomesica, and Saphirella sp.) accounted for much of the assemblage at Stations 6 and 7. ~dditionally, cladocerans (Podon polv~hemoides juveniles and adults) accounted for 11.0-1~,~% of the catch at Stations 6 and 7. Most of the other organisms were meroplankton such as gastropod and bivalve veligers (stations 6 and 7) and barnacle larvae (primarily Semibalanus balanoides nauplii) and polychaete larvae (Stations 7 and 8).
On cruise 5 in early January, 1988 (Figs. 190, 191, 192) copepod nauplii had increased to account for 16.2-21.1% of total numbers. Copepods (combined adults and copepodites) decreased from offshore to inshore (Stations 6, 7, and 8, respectively). Included were copepodites of the genera Centropaaes, Paracalanus, Oithona, Pseudocalanus, Acartia, and adults of Pseudocalanus spp., Paracalanus crassirostris, Acartia hudsonica, 0ithona similis, Oithona colcarva, Microsetella norveqica, and unidentified harpacticoids. Percentages of barnacle larvae (primarily semibalanus balanoides nauplii) increased heading inshore from Station 6, to 7 and 8 (5.8, 29.9, and 36.9%, respectively). Polychaete larvae were also abundant (14.1-14.5%) at the two inshore stations (7 and 8).
On Cruise 6 in early February (Figs. 193, 194, 195) copepod nauplii continued to increase (22.5-37.9%). Copepod adults and copepodites comprised 10.8-37.9% of total numbers. These copepods included, in varying proportions, the same taxa as those found the previous month. Barnacle larvae declined to 10.2-20.8% (Stations 6 and 7), and polychaete larvae comprised only 1.6-4.8% outside the inner harbor (ie. at Stations 6 and 7). At Station 8 in the inner harbor, a combination of polychaete larvae and rotifers (primarily Svnchaeta sp.) made up almost half of total numbers.

DISCUSSION
Although taxonomic analyses of plankton and larval fish are proceeding, and sampling continues into 1989, certain trends are already apparent from the initial year of data.
Buzzards Bay is well-mixed by wind and tide. Salinity was almost monotonously 30 O/OO (+ 1 o/oo) throughout most of the bay over depth and time. Also, there was essentially no vertical temperature structure with the exception of six sampling dates during summer (Fig. 3). At a given station, temperatures seldom varied by more than a single degree centigrade over the depth of the water column (Appendix Table 1). There was evidence of progressive solar warming of the water column over the course of a given day, and this was most pronounced during summer (Fig. 3). Also, Station 8 in the New Bedford inner harbor often had slightly higher temperatures than the other stations (Appendix Table 1). ~lthough this was often related to the usual practice of sampling this station last (ie. during mid-afternoon), even during colder periods of the year the inner harbor was often warmer, and it appears that die1 solar warming was not entirely the cause. A possible explanation is the combination of the shallow depth of the inner harbor station, combined with restricted circulation due to the hurricane dike that $early encloses the harbor. This speculation is supported by the occasionally lower salinity and usually different plankton populations in the inner harbor, relative to other stations.
On a given day, there was usually considerable similarity in the levels of nutrients, chlorophyll, and bacterioplankton abundance throughout most of the bay, with the exception of the two New Bedford harbor stations (7 and 8). This similarity was undoubtedly related to the holomictic state of the bay throughout most of the year.
The major exceptions to this general uniformity were Station 7 near the New Bedford sewage outfall, and Station 8 in the New Bedford inner harbor. At Station 7, there were usually higher levels of ammonium (Fig. 23), and occasionally higher levels of bacterioplankton abundance (Fig. 64) than elsewhere in the bay. Also, Station 7 was the only location where rod-shaped bacterial cells (probably fecal coliforms) were abundant. The ammonium and bacteria differences, together with the dramatically lower light penetration (Appendix Table l), predictable aggregation of sea gulls, oily and brown appearance of the water, and continually noxious smell, all point to the substantial impact of primary-treated sewage discharge at Station 7. I
I Chlorophyll a levels were generally higher at Station 8
in the New Bedford inner harbor than elsewhere in the bay (Fig. 45). b his was likely not due to sewage discharge, however, since levels of ammonium (Fig. 63) and bacterioplankton (Fig. 81) at Station 8 were similar to those elsewhere except for Station 7. It appears that the
k
higher chlorophyll levels in the inner harbor were indirectly due to reduced water exchange. If water becomes Iltrapped" behind the hurricane dike for extended periods, it might somewhat resemble a large phytoplankton culture where community succession pathways proceed differently from more turbulent waters outside the dike (Margalef, 1978). ~ccordingly, the differences in chlorophyll levels in the inner harbor may reflect differences in species composition of the phytoplankton community.
Although community analyses of phytoplankton, microzooplankton, and net-zooplankton samples are far from complete, they already point to community compositional differences between different depths, and stations on the same sampling days. Most often, these differences were primarily in terms of relative proportions of taxa in assemblages, rather than presence or absence. There was also considerable variation between cruises, although taxonomic data thus far extend only from October through January (phytoplankton), November (microzooplankton) or February (net-zooplankton) .
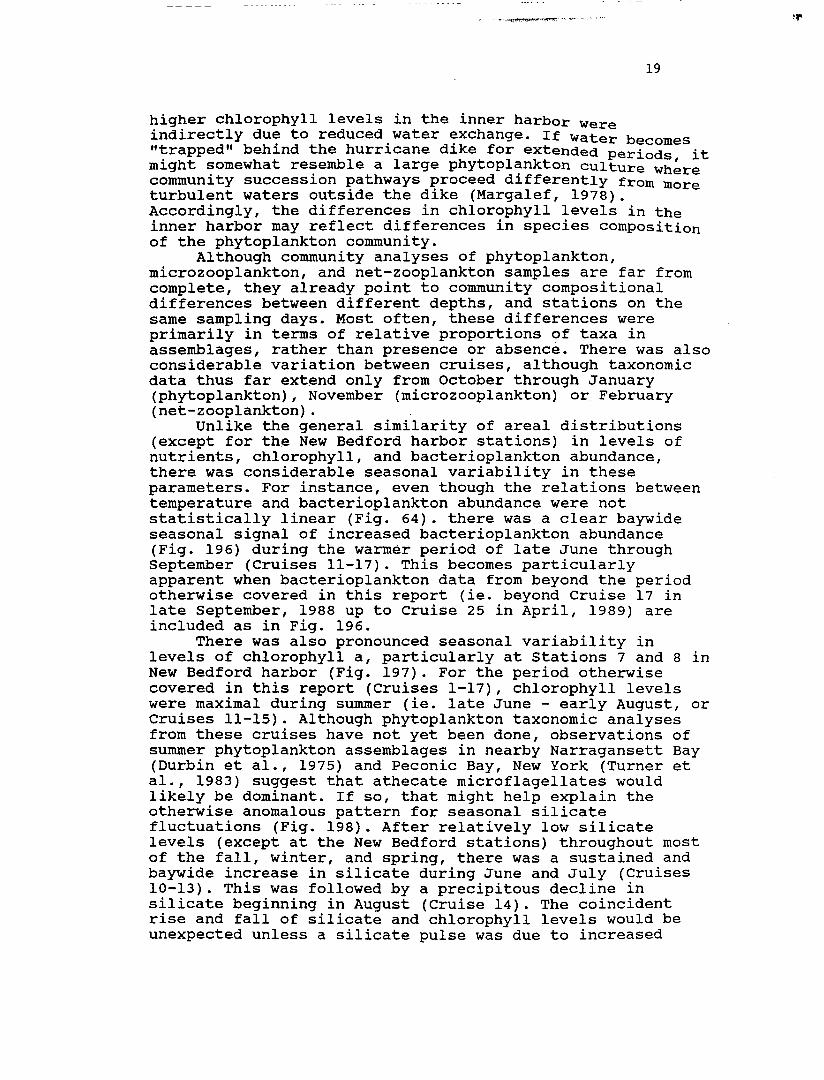
Unlike the general similarity of areal distributions (except for the New Bedford harbor stations) in levels of nutrients, chlorophyll, and bacterioplankton abundance, there was considerable seasonal variability in these parameters. For instance, even though the relations between temperature and bacterioplankton abundance were not statistically linear (Fig. 64). there was a clear baywide seasonal signal of increased bacterioplankton abundance (Fig. 196) during the warmer period of late June through September (Cruises 11-17). This becomes particularly apparent when bacterioplankton data from beyond the period otherwise covered in this report (ie. beyond Cruise 17 in late September, 1988 up to Cruise 25 in April, 1989) are included as in Fig. 196.
There was also pronounced seasonal variability in levels of chlorophyll a, particularly at Stations 7 and 8 in New Bedford harbor (Fig. 197). For the period otherwise covered in this report (Cruises 1-17), chlorophyll levels were maximal during summer (ie. late June - early August, or Cruises 11-15). Although phytoplankton taxonomic analyses from these cruises have not yet been done, observations of summer phytoplankton assemblages in nearby Narragansett Bay (Durbin et al., 1975) and Peconic Bay, New York (Turner et al., 1983) suggest that athecate microflagellates would likely be dominant. If so, that might help explain the otherwise anomalous pattern for seasonal silicate fluctuations (Fig. 198). After relatively low silicate levels (except at the New Bedford stations) throughout most of the fall, winter, and spring, there was a sustained and baywide increase in silicate during June and July (cruises 10-13). This was followed by a precipitous decline in silicate beginning in August (Cruise 14). The coincident rise and fall of silicate and chlorophyll levels would be unexpected unless a silicate pulse was due to increased

runoff, or the chlorophyll increase reflected a bloom of phytoplankters that did not utilize silicate (ie. not diatoms). Since the Buzzards Bay watershed experienced a drought during summer of 1988, it appears that the summer chlorophyll increase was due to growth of athecate microflagellates that did not require silicate. If that prediction proves correct, the implication would be that the silicate increase was due to release from overutilization, and that silicate levels throughout much of the preceeding year had been depressed by diatom growth.
The identity of nutrients that limit phytoplankton growth or control species succession in a subject of continuing interest and disagreement. The controversy is usually framed in terms of whether nitrogen or phosphorus is the limiting nutrient (Ryther and Dunstan, 1971; Hecky and - Kilham, 1988; DfElia et al., 1986; DfElia and Sanders, 1987). Silicate has only rarely been considered a limiting nutrient in coastal marine waters (Malone et al., 1980), although Smayda and Villareal (1989) suggested that the scenario envisioned here may also apply to Narragansett Bay.
The decline in silicate levels in August may also be related to changes in zooplankton community structure. Deason and Smayda (1982) found that summer blooms of chain- forming diatoms were related to decreases in abundance of herbivorous zooplankton such as copepods, because these were being eaten by ctenophores. Again, keeping in mind that neither zooplankton nor phytoplankton analyses for summer samples have yet been performed, cruise notes lend credence to such a scenario. During August and September, ctenophores were collected in most net tows. Also, zooplankton nets frequently collected large amounts of phytoplankton that appeared as a greenish-brownish slime. Experience in both Buzzards Bay and Peconic Bay indicates that such a lgslimell is usually produced by chain-forming diatoms such as Skeletonema costatum and/or species of Chaetoceros. Based upon data collected to date in the present study, it is predicted that the summer silicate fluctuations were related to phytoplankton community compositional changes, and that these were partly related to both abundance and composition of two trophic levels of zooplankton. Similar "trophic cascadesw (Carpenter et al., 1985) are common in freshwater environments, and have been reported for nearby summer estuarine assemblages (Deason and Smayda, 1982; Turner et al., 1983).
As with the bacterioplankton data presented in Fig. 196, extension of chlorophyll data beyond the first year of sampling (Fig. 197) reveals additional aspects of seasonality. During the first year of sampling, there was a moderate chlorophyll increase for the llwinter-springll diatom bloom that is common in New England estuarine waters (Hitchcock and Smayda, 1977). However, this was largely confined to the New Bedford inner harbor (Station 8) on cruises 5-8 from January-early April of 1988 (Fig. 197). This bloom signal was relatively weak (chlorophyll a levels

of approximately 20-30 pg/l) compared to the summer bloom (chlorophyll a levels of up to 65 pg/l). During winter of 1989, however, chlorophyll a levels from January through March were dramatically higher at Station 8 than during the previous winter (Fig. 197). ~ualitative microscopic examination of live samples (the evenings after cruises) revealed that there was a massive bloom of the chain-fonning diatom Thalassiosira nordenskioldii that persisted in the inner harbor over three months. This diatom is a typical New England winter-spring bloom species (Karentz and Smayda, 1984). However, it was unrecorded in samples (analyzed thus far) from the previous year. Thus, there is not only seasonal variability but also year-to-year variability in the plankton of Buzzards Bay. This variability is in terms of not only abundance, but also community composition, and it appears that changes in one are related to changes in the other.
The seasonal distributions of phosphate (Fig. 199) and ammonium (Fig. 200) were unlike the pattern for silicate (Fig. 198), in that there was no consistent seasonal signal. Rather, there was a pronounced locational trend, with elevated concentrations at Station 7. Wastewater often contains elevated levels of phosphate due to detergents, and high ammonium due to breakdown of urea (Ryther and Dunstan, 1971). The dramatically elevated levels of phosphate and ammonium at Station 7, compared to the generally lower
1
concentrations at most other locations, are a clear indication of nutrient loading due to sewage disposal.
In terms of the parameters measured in the present study, it appears that the New Bedford sewage outfall is the major anthropogenic environmental insult to the water column of Buzzards Bay. Of course, there are other pollutants such as PCB's and metals that contaminate sediments, but these concerns are not addressed by this data set. In terms of eutrophication, howeverfit is apparent that most of Buzzards Bay away from the Clark Point-Clark Cove area near the New Bedford outfall is relatively ~unpollutedw by sewage disposal. Accordingly, the projected upgrading of New Bedford's sewage treatment facilities will likely have a demonstrably beneficial effect.

ACKNOWLEDGEMENTS
We thank the Research and � em on strati on (R & D) Program of the Massachusetts Department of Environmental ~uality Engineering (DEQE) for funding, and our project managers, John Jonasch and Arthur Screpetis, for their continued support. Dr. Francis X. OfBrien, Chairperson of the SMU Biology Department, is acknowledged for initiating the dialogue between the DEQE R & D Program and SMU that led to this project. Captain Leonard Hathaway and Captain John Gage provided competent and cheerful seamanship, even on days that were so miserable that, if we had any sense, we would have stayed ashore. We also thank Zofia Mlodzinska (Woods Hole Oceanographic Institution), and Dr. Damian Shea and Lynn McInnes (SMU) for nutrient analyses, Joe Battaglia (SMU) for shipboard assistance, and Dr. Peter Verity (Skidaway Institute of Oceanography) for teaching bacterioplankton techniques to Turner. Finally, we thank Drs. Donald Douglas and Robert Dalgleish (SMU) for financial "bridgingw to keep this project going during a period of budgetary complications.
Portions of the data presented here will appear in future theses by David Borkman, William Lima, and Richard Pierce, which will be submitted as part of the requirements for the Master of Science degree in Biology from Southeastern Massachusetts University.

REFERENCES
Anraku, M. 1964. Influence of the Cape Cod Canal on the hydrography and on the copepods in Buzzards Bay and Cape Cod Bay, Massachusetts. I. Hydrography and distribution of copepods. Limnol. Oceanogr. 9: 46-60.
Berzins, B. 1960. Rotatoria I. Fiches drIdentification du Zooplancton. Sheets 84-85.
~eskenis, J. L. 1987. Buzzards Bay research. Bacteriological data report. Microbiological indicator surveys and source differentiation of the fecal streptococci bacteria June-October 1986. Mass. DEQE, Div. Wat. ~ollut. Control, Publ. #14, 798-161-50-4-87-CR, 151 pp.
~ock, K. J. 1967. Protozoa. Order: Oligotrichida. Families Halteriidae, Strobiliidae. Fiches drIdentification du Zooplancton. Sheet 110.
Bowman, T. E. 1971. The distribution of calanoid copepods off the southeastern United States between Cape Hatteras and southern Florida. Smithsonian Contrib. Zool. 96: 1-58.
Bowman, T. E. 1975. Oithona colcarva, n. sp., an American copepod incorrectly known as Q. brevicornis (Cyc1opoida:Oithonidae). Chesapeake Sci. 16: 134-137.
Brunel, J. 1962. Le phytoplancton de la Baie des Chaleurs. Les Presses de lrUniversite de Montreal, 365 pp.
Bruno, S. F., R. D. Staker, G. M. Sharma, and J. T. Turner. 1983. Primary productivity and phytoplankton size fraction dominance in a temperate North Atlantic estuary. Estuaries 6: 200-211.
Campbell, P. H. 1973. Studies on brackish water phytoplankton. U.N.C. Sea Grant Publ. UNC-SG-73-07.
Caron, D. A. 1983. Technique for enumeration of heterotrophic and phototrophic nanoplankton, using epifluorescence microscopy, and comparison with other procedures. Appl. Environ. Microbiol. 46: 491-498.
Carpenter, S. R., J. F. Kitchell, and J. R. Hodgson. 1985. Cascading trophic interactions and lake productivity. BioScience 35: 634-639.
Conover, R. J. 1956. Oceanography of Long Island Sound, 1952-1954. VI. Biology of Acartia clausi and A . tonsa. Bull. Bingham Oceanogr. Coll. 15: 156-233.

CupP, E. E. 1943. Marine plankton diatoms of the west Coast of North America. ~ull. ~cripps Inst. Oceanogr. 5(1): 1-238,
Davis, J. D. and D. Merriman (eds.). 1984. Observations on the ecology and biology of .western Cape Cod Bay, Massachusetts. springer-Verlag, 289 pp.
DfElia, C. F. and J. G . Sanders. 1987. Scientists don't make environmental management decisions (and why we wish that sometimes we did...). Mar. Pollut. Bull. 18: 429- 434.
~ f ~ l i a , C. F., J. G. Sanders, and W. R. Boynton. 1986. ~utrient enrichment studies in a coastal plain estuary: phytoplankton growth in large-scale, continuous cultures. Can. J. Fish. Aquat. Sci. 43: 397-406.
Della Croce, N. 1974. Cladocera. Fiches dfIdentification du Zooplancton. Sheet 143.
Deason, E. E. and T. J. Smayda. 1982. Ctenophore- zooplankton-phytoplankton interactions in Narragansett Bay, Rhode Island, USA, during 1972-1977. J. Plankt. Res. 4: 203-217.
Durbin, E. G., R. W. Krawiec, and T. J. Smayda. 1975. Seasonal studies on the relative importance of different size fractions of phytoplankton in Narragansett Bay (USA). Mar. Biol. 32: 271-287.
Faber, D. J. 1966. Free-swimming copepod nauplii of Narragansett Bay with a key to their identification. J. Fish. Res. Bd. Can. 23: 189-205.
Fraser, J. H. 1957. Chaetognatha. Fiches dfIdentification du zooplancton. Sheet 1.
Fraser, J. H. and V. K. Hansen (eds.). 1957-1980. Fiches dfIdentification du Zooplancton. Sheets 1-164.
Gibbons, S. G. and H. S. Ogilvie. 1933. The developmental stages of Oithona helaolandica and Oithona s~inirostris, with a note on the occurrence of body spines in cyclopoid nauplii. J. Mar. Biol. Assoc. U. K. 18: 529-550.
Gil, L. W. 1987. Buzzards Bay 1985 water quality survey data, Part A. Mass. DEQE, Div. Wat. Pollut. Control, Publ. #14, 712-158-75-2-87-CR, 147 pp.
Gil, L. W. 1988. Buzzards Bay 1986 water quality survey data. Mass. DEQE, Div. Wat. Pollut. Control, Publ. #15, 462-116-75-5-88-CR, 104 pp.

old, K. and E. A. Morales. 1975b. Seasonal changes in lorica sizes and the species of Tintinnida in the N e w York Bight. J. Protozool. 22: 520-528.
Gold, K. and E. A. Morales. 1976a. Observations on the nature and isgnificance of the particles used by Tintinnida during lorica-building. Trans. Amer. Microsc. Soc. 95: 69-72.
Gold, K. and E. A. Morales. 1976b. Studies on the sizes, shapes, and the development of the lorica of agglutinated Tintinnida. Biol. Bull. 150: 377-392.
Gold, K. and E. A. Morales. 1976c. Studies on Tintinnida using scanning electron microscopy. Trans. Amer. Microsc. Soc. 95: 707-711.
Greve, W. and T. R. Parsons. 1977. Photosynthesis and fish production: hypothetical effects of climatic change and pollution. Helgolander wiss. Meeresunters. 30: 666-672.
Grice, G. D. 1971. The developmental stages'of Eurvtemora americana Williams, 1906, and Eurvtemora herdmani Thompson & Scott, 1897. (Copepoda, Calanoida). Crustaceans 20: 145-158.
Guillard, R. R. L. 1973. Division rates, p. 289-311. In: J. R. Stein, (ed.), Phycological methods. Cambridge Univ. Ptess .
Hargraves, P. E. 1981. Seasonal variations of tintinnids (Ciliophora:~ligotrichida) in Narragansett Bay, Rhode Island, U.S.A.. J. Plankt. Res. 3: 81-91.
Hecky, R. E. and P. Kilham. 1988. Nutrient limitation of phytoplankton in freshwater and marine environments: a review of recent evidence on the effects of enrichment. Limnol. Oceanogr. 33: 796-822.
Heinbokel, J. F., D. W. Coats, K. W. Henderson, and M. A. Tyler. 1988. Reproduction rates and secondary production of three species of the rotifer genus Svnchaeta in the estuarine Potomac River. J. Plankt. Res. 10: 659-674.
Hendey, N. I. 1964. An introductory account of the smaller algae of British coastal waters. Part V. ~acillarioph~ceae (Diatoms). Fish. Invest., Ser. 4: 1- 317.

Hitchcock, G . L. and T. J. Smayda. 1977. The importance of light in the initiation of the 1972-1973 winter-spring diatom bloom in Narragansett Bay. Limnol. Oceanogr. 22: 126-131.
Hobbie, J. E., R. J. Daley, and S. Jasper. 1977. Use of Nucleopore filters for counting bacteria by fluorescence microscopy. Appl. Environ. Microbial. 3 3 : 1225-1228.
Hulburt, E. M. 1957. The taxonomy of unarmored ~inophyceae of shallow embayments on Cape Cod, Massachusetts. Biol. Bull. 112: 196-219.
Hulburt, E. M. 1965. Flagellates from brackish waters in the vicinity of Woods Hole, Massachusetts. J. Phycol. 1: 87-94.
Jacobson, D. M. and D. M. Anderson. 1986. Thecate heterotrophic dinoflagellates: feeding behavior and mechanisms. J. Phycol. 22: 249-258.
Karentz, D. and T. J. Smayda. 1984. Temperature and seasonal occurrence patterns of 30 dominant phytoplankton species in Narragansett Bay over a 22-year period (1959-1980). Mar. Ecol. Prog. Ser. 18: 277-293.
Kimor, B. 1981. The role of phagotrophic dinoflagellates in marine ecosystems. Kieler Meeresforsch. Sonderh. 5: 164-173.
Lang, W. H. 1980. Balanomorph nauplii of the NW Atlantic shores. Fiches dtIdentification du Zooplancton. Sheet 163.
Lang, W. H. and A. Ackenhusen-Johns. 1981. Seasonal species composition of barnacle lanrae (Cirripedia:Thoracica) in Rhode Island waters, 1977-1978. J. Plankt. Res. 3: 567-575.
Lawson, T. J. and G. D. Grice. 1970. The developmental stages of Centro~aaes tv~icus Kroyer (Copepoda, Calanoida). Crustaceana 18: 187-209.
Lawson, T. J. and G. D. Grice. 1973. The developmental stages of Paracalanus crassirostris Dahl, 1894 (Copepoda, Calanoida). Crustaceana 24: 43-56.
Lebour, M. V. 1925. The dinoflagellates of northern seas. Mar. Biol. Assoc. U. K., Plymouth, 250 pp.
Lebour, M. V. 1930. The planktonic diatoms of northern seas. Ray Soc. Publ. 116: 244 pp.

Lessard, E. J. and E. Swift. 1986. Dinoflagellates from the North Atlantic, as phototrophic or heterotrophic by epifluorescence microscopy. J. Plankt. Res. 8: 1209- 1215.
Loder, T. C. 1988. A final report on water-column marine ecology field investigations for outfall siting - secondary treatment facilities plan outfall evaluation program. Univ. New Hampshire Tech. Mem. UNH-BH-3- 5/26/88.
Lynn, D. H. and D. J. S. Montagnes. 1988. Taxonomic descriptions of some conspicuous species of Strobilidiine ciliates (Ci1iophora:Choreotrichida) from the Isles of Shoals, Gulf of Maine. J. Mar. Biol. Assoc. U. K. 68: 639-658.
Lynn, D. H., D. J. S. Montagnes, and E. B. Small. 1988. Taxonomic descriptions of some conspicuous species in the Family Strombidiidae (Ci1iophora:Oligotrichida) from the Isles of Shoals, Gulf of Maine. J. Mar. Biol. Assoc. U. K., 68: 259-276.
Maeda, M. 1986. An illustrated guide to the species of the Families Halteriidae and Strobilidiidae (Oligotrichida, Ciliophora), free swimming protozoa common in the aquatic environment. Bull. Ocean Res. Inst., Univ. Tokyo No. 21, 67 pp.
Maeda, M. and P. G. Carey. 1985. An illustrated guide to the species of the Family Stromdidiidae (Oligotrichida, Ciliophora), free swimming protozoa common in the aquatic environment. Bull. Ocean Res. Inst., Univ. Tokyo, No. 19, 68 pp.
Malone, T. C., C. Garside, and P. J. Neale. 1980. Effects of silicate depletion on photosynthesis by diatoms in the plume of the Hudson River. Mar. Biol. 58: 197-204.
Marshall, H. G. 1986. Identification manual for phytoplankton of the United States ~tlantic coast. US EPA/600/4-86/003, 132 pp.
Marshall, S. M. 1969. Protozoa. Order ~intinnida. Fiches d8Identification du Zooplancton Sheets 117-127.
Montagnes, D. J. S., D. H. Lynn, D. K. Stoecker, and E. B. Small. 1988. Taxonomic descriptions of one new species and redescription of four species in the ~amily Strombidiidae (Ciliophora, oligotrichida). J. Protozool. 35: 189-197.

Nishida, S. 1985. Taxonomy and distribution of the Family Oithonidae (Copepoda, Cyclopoida) in the Pacific and Indian Oceans. Bull. Ocean Res. Inst., Univ. Tokyo, No 20: 167 pp.
Nutting, C. C. 1901. The hydroids of the Woods Hole region. Bull. U. S. Fish. Comm. 19: 325-386.
Parsons, T. R., Y. Maita, and C. M. Lalli. 1984. A manual o chemical and biological methods for seawater analysis. Pergamon Press, 173 pp.
Porter, K. G. and Y. S. Feig. 1980. The use of DAPI for identifying and counting aquatic microflora. Limnol. Oceanogr. 25: 943-948.
Rose, M. 1933. Copepodes pelagiques. Faune France 26: 1-374
Rousselet, C. F. 1902. The genus Svnchaeta: a monographic study, with descriptions of five new species. J. Roy. Micros. Soc. (1902): 269-290, 393-411.
Ryther, J. H. and W. M. Dunstan. 1971. Nitrogen, phosphorus and eutrophication in the coastal marine environment. Science 171: 1008-1013.
Ryther, J. H. and C. B. Officer. 1981. Impact of nutrient enrichment on water uses, p. 247-261. In: B. J. Neilsol and L. E. Cronin, (eds.), Estuaries and nutrients. Humana Press.
Ryther, J. H. and J. G. Sanders. 1980. Experimental evidence of zooplankton control of the species composition and size distribution of marine phytoplankton. Mar. Ecol. Prog. Ser. 3: 279-283.
Sanders, R. W. 1987. Tintinnids and other microzooplankton - seasonal distributions and relationships to resources and hydrography in a Maine estuary. J. Plankt. Res. 9: 65-77.
Sandifer, P. 1972. Morphology and ecology of Chesapeake Bay decapod crustacean larvae. Ph.D. dissertation, Univ. Virginia, 532 pp.
Small, E. B. and D. H. Lynn. 1985. Phylum Ciliophora, p. 393-575. In: J. J. Lee, S. H. Hunter, and E. C. Bovee, (eds.), An illustrated guide to the Protozoa. Society of Protozoologists, Lawrence, Kansas.

Smayda, T. J. 1973. A survey of phytoplankton dynamics in the coastal waters from Cape Hatteras to Nantucket, p. 3-1 - 3-100. In Coastal and offshore environmental inventory, Cape Hatteras to Nantucket Shoals. ~niv. Rhode Island, Mar. Publ. Ser. No. 2.
Smayda, T. J. 1980. Phytoplankton species succession, p. 493-570. In: I. Morris, (ed.), The physiological ecology of phytoplankton. Blackwell sci. Publ., Oxford.
Smayda, T. J. 1983. The phytoplankton of estuaries, p. 65- 102. In: B. H. Ketchum, (ed.), Estuaries and enclosed seas. Elsevier, Amsterdam.
Smayda, T. J. 1984. Variations and long-term changes in Narragansett Bay, a phytoplankton-based coastal marine ecosystem: relevance to field monitoring for pollution assessment, p. 663-679. In H. H. White, (ed.), Concepts in marine pollution measurements. Univ. Maryland Sea Grant Publ.
Smayda, T. J. and T. A. Villareal. 1989. The 1985 llbrown tidew and the open phytoplankton niche in Narragansett Bay. In: E. M. Cosper, E. J. Carpenter, and M. Bricelj, (eds.), Novel phytoplankton blooms: Causes and impacts of recurrent brown tides and other blooms. Springer- Verlag (in press) .
Steidinger, K. A. and J. Williams. 1970. Dinoflagellates. Memoirs of the Hourglass Cruises, vol. 11. Florida Dept. Nat. Resour., Mar. Res. Lab., 251 pp.
Stenner, T. W., T. C. Gulbransen, and E. M. Baptiste. 1988. Water quality data assessment for Buzzards Bay, Massacuhusetts. Final report to Massachusetts Executive Office of Environmental Affairs. Battelle Ocean Sciences, Duxbury, MA, 69 pp. + appendices.
Taslakian, M. J. and J. T. Hardy. 1976. Sewage nutrient enrichment and phytoplankton ecology along the central coast of Lebanon. Mar. ~iol. 38: 315-325.
Tripp, B. W. 1985. Buzzards Bay bibliography. A reference collection of scientific and technical reports published on Buzzards Bay. Woods Hole Oceanogr. Inst. Tech. Rept. WHOI-85-27, 96 pp.
Turner, J. T., S. F. Bruno, R. J. Larson, R. D. Staker, and G. M. Sharma. 1983. Seasonality of plankton assemblages in a temperate estuary. P.S.Z.N.1: ~arine Ecology 4: 81-99.

Verity, P. G. 1987. Abundance, community composition, size distribution, and production rates of tintinnids in Narragansett Bay, Rhode Island. Est. Coast. Shelf Sci. 24: 671-690.
Wells, J. B. J. 1970. Copepoda-I. Sub-order Harpacticoida. Fiches drIdentification du Zooplancton. Sheet 133.
Wilson, C. B. 1932. The copepods of the Woods Hole region, Massachusetts. Bull. U. S. Nat. Mus. 158: 1-635.

FIGURE
Fig. 1.
Fig. 2.
Fig. 3.
Figs. 4-22.
Fig. 23.
Fig. 24.
Figs. 25-44.
Fig. 45:
Figs. 46-62.
Fig. 63.
Fig. 64.
Figs. 65-80.
Fig. 81.
Fig. 82.
Fig. 83.
Figs. 84- 107.
Figs. 108- 110.
Figs. 111- 146.
Figs. 147- 149.
Figs. 150- 176.
Fig. 177.
Figs. 178- 195.
Fig. 196.
LIST OF FIGURES
.......................................... Sampling stations
Average and range of surface temperatures for all stations.
Vertical temperature profiles for Cruises #lo-f15, .................................. (June 7-August 23, 1988)
Nitrogen species: N-NO3, N-NO2, N-NH by station for 3 Cruises 81-/I17 ............................................
Surface ammonium vs. temperature (Cruises 81-#17). ......... % D.I.N. (Dissolved Inorganic Nitrogen) as ammonium vs.
.............................. temperature (Cruises #l-#l7)
Silicate (Si-SiO ) & phosphate (P-PO4) by station for 2 ........................................... Cruises //l-//l8
Chlorophyll a vs. surface temperature (Cruises #l-#17) .... Chlorophyll a & phaeopigments by station for Cruises !/1-#17 ...................................................
....... Chlorophyll a vs. surface ammonium (Cruises f/l-#l7)
Bacterioplankton vs . surface temperature (Cruises 112-#17) . Surface bacterioplankton abundance by station for Cruises il2-/I17 ...........................................
...... Bacterioplankton vs. chlorophyll a (Cruises //2-#17).
.... Bacterioplankton vs. surface ammonium (Cruises #2-#17)
Phytoplankton abundance by station and depth, Cruise 111, ........................................ (October 1, 1987)
Phytoplankton composition by station and depth, Cruise #I, (October 1, 1987), for all stations......................
Total phytoplankton abundance, Cruises #I45 (October 1, 1987-January 8, 1988) at Stations 6, 7, & 8, respectively
Phytoplankton composition by station for Cruises i/2-#5 for ......................... Stations 6, 7, & 8, respectively
Total microzooplankton abundance, Cruises #1-#3, October 1, 1987-November 24, 1987, at Stations 6, 7, & 8,
............................................. respectively
Microzooplankton composition by station and depth for Cruises !/I-#3, for Stations 6, 7, and 8, respectively.. .. Total net-zooplankton population density (entire water column) for Cruises #I-116 (October 1, 1987- February 2, 1988) at Stations 6, 7, and 8.......-.....-..
Net-zooplankton composition by station for Cruises #1-/i6 at Stations 6, 7, and 8..........................-.-....-
Surface bacterioplankton abundance by cruise and station (Cruises {/2-#25) .........................................
31
PAGE
4
33
34
35-53
5 4
5 5
56-75
7 6
77-93
94
95
96-111
112
113
114

LIST OF FIGURES (cont inued)
FIGURE PAGE
Fig. 197. Sur face c h l o r o p h y l l a by c r u i s e and s t a t i o n , (Cru i ses /il-/i25) .......................................... 228
Fig . 198. Sur face s i l i c a t e by c r u i s e and s t a t i o n , (Cru i ses f l-#17) ... 229
Fig . 199. Sur face phosphate by c r u i s e and s t a t i o n , (Cru i ses #I-#17). . 23 0
Fig. 200. S u r f a c e ammonium by c r u i s e and s t a t i o n , (Cru i ses ji1-#17). . . 23 1

NET-ZOOPLANKTON Total Denslty
Station 6 I\-\1 station 7 Station 8

POLYCHAETE
Olkopleura ( 1 5 dioica
NET-ZOOPLANKTOI'\I 1 OCTOBER 1, 1987 St.#6
Fig. 178


Fig. 180
NET-ZOOPLANKTON Cr.#l OCTOBER 1, 1987 St.#8
OTHER (5.5%)
POLYCHAETE LARVAE (9
CO
I
COPEPOD NAUPLll (46.7%)
PEPODS (38.7%


BIVALVE
COPEPOD N
NET-ZOOPLANKTON Cr.#2 OCTOBER 20, 1 9 8 7 St.#7
O T H ~ R (5.446)

Fig. 183
COPEPOD
NET-ZOOPLANKTON Cr.*2 OCTOBER 20, 1987 S1.M
OTHER (7.2%)

NET-ZOOPLANKTON
Oithona spp. (22.4%)
COPEPOD NAUPLll (6.9%)
OTHER COPEPODS (4.3%)
I
i
Paracalanus crasslrostrls Paracalanus spp. (30.5%) copepodites I

NET-ZOOPLANKTON Cr.#3 , NOVEMBER 24, 1987 St.#7
OTHER (4.4%)
POLYCHAETE LARVAE (1 0.4%)
I - I
COPEPOD NAUPLll (1 3.2%) I
I Paracalan
' I
OTHER COPEPODS (26.8%j -
. Fig, 185

POLYCHAETE LARVAE
F ig . 186
NET-ZOOPLANKTON 0 . ~ 3 NOVEMBER 24, 1987 St.#8
\ Ollhona spp. (18.6%)

NET-ZOOPLANKTON Cr.*4 DECEMBER 16, 1987 St.#6
GASTROPOD VELIGER (4.5%)
Paracalanus crasslrostrls (22.5%)
BIVALVE VELIGER (8.8%)
CLADOCERANS (1 3.5%)
COPEPOD NAUPLll (3.9%)
COPEPODS (36.9%)
Fig. 187

NET-ZOOPLANKTON Cr.#4 DECEMBER 16. 1988 St.*7
OTHER (4.0%) INVE RTEBRATE EGG (4.3%)
1 I I I
I
I
I
! I
1 BARNACLE (20.4%) I IARVAE
I I
BIVALVE VELIGER (4.9%)
I
CLADOCERANS (1 1 .OX) COPEPOD NAUPLII (
COPEPODS (43.1%)
POLYCHAETE LARVAE (5.4%)

NET-ZOOPLANKTON Cr.#4 DECEMBER 16, 1988 St.#8
OTHER (7.0%)
BARNACLE (36.0%) LARVAE
COPEPODS ( 1 1.0%)
OPEPOD NAUPLII
LARVAE

NET-ZOOPLANKTON Cr.#5 JANUARY 8, 1 9 8 8 St.#6
INVERTEBRATE EGG (5.8%)
RNACLE LARVAE (5.8%)
BIVALVE (5.4%) VELIGER
COPEPOD HAUPLII (2 1.1%)
COPEPODS
Fig. 190

Cr-*J JANUARY 8, 1988 3 . ~ 7
OTHER (1 0.3a
INVERTEBRATE
BARNACLE (29.9%) LARVAE


/
NET-ZOOPLANKTON ) . r L D I X U C
TROCHOPHORE LARVAE~</!~&) (3.6%)
INVERTEBRATE EGG (1 0.7%)
BARNACLE ( 1 0.2%) LARVAE
POLYCHAETE (4.8%) LARVAE
' I
Fig. 193 8 ."'
, 3 4 1
*. , .f*' ' i , ." y L L E m i m r j t f l l l - i P C

i
OTHER
., . .
r . . Fig. 194
TROCHOPHORE
INVERTEBRATE EGG
BARNACLE (20. LARVAE
'1
NET-ZOOPLANKTON Cr.#6 FEBRUARY 2, 1988 St.#7 .
POLYCHAETE LARVAE (1.6%) .

Fig. 195
NET-ZOOPLANKTON I
Cr.#6 FEBRUARY 2, 1988 St.*8 OTHER (3.2%)
I
COPEPOD
LARVAE (