Embed Size (px)
Citation preview

A Scorecard in the Market for Money Transfers:
Trends in Competition in Latin America and the Caribbean
Manuel Orozco, Elisabeth Burgess and Landen Romei
Inter-American Dialogue
June 18, 2010
FINAL DRAFT

2
Introduction
This report presents fieldwork research and a review on remittance markets in 15 selected Latin
America and Caribbean countries,1 with a focus on key indicators relating to competition in money
transfers.2 We find that competition in money transfers among remittance service providers (RSPs) is
relatively strong with most businesses offering more than one remittance product, operating in at least
three remittance-payout countries, and relying on payment networks spanning over 50,000 payment
points3 across these countries.
The results of this work show that remittance companies are turning more competitive. Increased
competition brings costs down. We find that transfer costs in 2010, on average, have decreased slightly
compared to 2009, to 5 percent of the value transferred. Additionally, RSPs have to compete for the
satisfaction of the customer and have achieved an average of 70 percent satisfaction rate. Using four
key indicators to measures company performance—scope, cost, distribution network, and consumer
satisfaction—no company reached the highest grade, A+. Thus, there is still room for improvement
among RSPs.
We show that the majority of remittance service providers on the sending side are money transfer
operators (MTOs), and on the payout side the majority of partner institutions are commercial banks. In
fact, bank branches represent 76 percent of all payout locations, and the majority of payout points are
represented by MTO and bank payer partnerships. Overall, 63 percent of all payout locations are in
urban areas of at least 100,000 people, compared to only 46 percent of the population living in these
areas, showing a divergence in the concentration of payout locations to population. We find that MTOs
dominate the market for payout locations in Latin American and the Caribbean at 94 percent of
locations, though banks that send remittances also play a significant role in many countries. Overall,
MoneyGram has the largest share of locations, but despite the significant shares held by the largest five
RSPs, the majority of all payout locations (59 percent) are held by other RSPs.
The report looks at the marketplace for transfers as performed by at least 39 leading companies,
compared across 15 countries representing 90 percent of all remittance flows from the U.S. to Latin
America and the Caribbean, as well as regulations in money transfers. The analysis looks into the main
remittance service providers, the cost of remitting, the number, institutional type, and geographic
concentration of payout locations in each country.4 Regulations on money transfers are examined in
relationship to the institutions that authorize foreign currency payers, the limits and requirements on
money transfers, anti-money laundering measures, the rules on foreign currency accounts and the roles
of MFIs in remittance markets.
1
Mexico, Colombia, Guatemala, El Salvador, Dominican Republic, Peru, Ecuador, Honduras, Jamaica, Haiti, Bolivia,
Nicaragua, Paraguay, Guyana, Brazil. 2
Data collection was conducted by Guadalupe Ortigoza, Elisabeth Burgess, Tim Cheston, Jessica Brackett, Eugenia
Garcia-Zanello, and Maite Hostetter between September 2009 and June 2010. 3
A payout location includes bank and office branches, agencies, retail store locales, as well as ‘mobile’ payers, that
is, individuals conducting home delivery, known in the Dominican Republic as ‘motorizados’. 4 Remittance service providers are identified from immigrant market surveys, interviews with competitors in the
corridors, and previous country studies. Nevertheless, the list is not exhaustive and it is a work in progress. The
data on payout locations are used as a way to capture the extent of payout coverage, but not necessarily the
market share of the intermediaries.

3
The first section presents the scorecard results and summarizes basic findings among companies. The
second section looks into the various indicators characterizing the marketplace. It also includes an
analysis of over 70 remittance service providers and 2,500 paying institutions working predominantly in
the U.S.-Latin America and Caribbean corridors.5 The data provides information about transfers costs,
presence in rural areas, partnership with banking and microfinance institutions, for example. The third
section looks at regional trends across the various indicators. Section four reviews regulatory
frameworks governing payment of remittances to Latin America. The appendix explains the data
collection methodology as well as detailed scorecard results.
1. Intermediation in money transfers: measuring competition
In order to better understand the marketplace for money transfers, a set of variables were utilized to
develop key indicators. These indicators are associated with features that characterize the money
transfer industry in its competitive landscape, and are aspects of the marketplace that both consumers
and development policy practitioners find important. Competition in the remittance transfer market
typically refers to a situation where businesses play by the rules, offer a range of products across various
regions, offer market prices, have accessible payment origin and distribution networks that offer various
financial services, and satisfy consumers.6
The four key indicators utilized are scope, cost, distribution network, and consumer satisfaction. These
indicators capture immigrant preferences on payment services as well as the link between remittances
and financial asset building. The first indicator, scope, refers to the extent of product and geographic
coverage that companies adopt. Businesses that offer more than one remittance product such as cash-
to-cash or cash-to-bank account remittances, and transfer to more than one country make themselves
more competitive. As the results below show, many businesses are increasingly offering various
products and focus on fewer than three corridors. Transfer cost, the next indicator, is also a key feature
defining competition and has been discussed in the literature as a policy issue. As more companies
enter the market, lowering costs turns into a mechanism to attract consumers.
Transfer locations in the remittance origination and payment points in the destination are another
feature distinguishing competitiveness. In the third indicator, we focus on the destination side to
understand the types of payout institutions partnering with remittance service providers. The last
indicator, consumer satisfaction, is reflected in consumers’ appreciation of the services offered and is a
key factor that illustrates a company’s competitiveness. The table below presents the 16 variables
utilized to create the four key indicators.
5 For the purposes of protecting proprietary information, however, the numbers in our study were translated into
ratios and percentages. These ratios and percentages serve for comparison. 6 Legal compliance is not covered in this scorecard.

4
Table 1: Scoring Indicators Indicator Variable Description
Products Number of transfer products offered. Products include cash
to cash (C2C), cash to account (C2A), cash to home delivery
(C2HD), account to cash (A2C), account to account (A2A),
account to home delivery (A2HD), Internet to cash (I2C),
Internet to account (I2A), as well as other value-added
financial services offered by the RSP.
Scope
Countries Number of countries the RSP operates in
Fee Transaction fee
FX margin Commission on foreign exchange when sending of payout in
local currency
Cost
Total cost Sum of fee and exchange rate commission
Points Number of existing payment points or agent payout locations
Points per country Total payment points divided by all countries where RSP
operates
Points as share of all points in corridor Total payment points divided by payment points in all 15
countries
Rural presence Ratio of RSP payment points located in rural areas (areas
outside cities of more than 100,000 people)
Bank payers as share of all points Ratio of bank payout locations to all RSP payment points
Distribution network7
MFI payers as share of all points Ratio of MFI payout locations to all RSP payment points
Fee transparency Percent of people who agree or strongly agree that the RSP is
transparent with its costs
FX transparency Percent of people who agree or strongly agree that the RSPS
is transparent with its foreign exchange (FX) rates
Ease of use Percent of people who agree or strongly agree that the RSP is
easy to use
Inexpensive Percent of people who agree or strongly agree that the RSP
service is inexpensive
Consumer satisfaction
Value Percent of people who agree or strongly agree that the RSP
has more value than other RSPs
a) A scorecard on remittance transfer companies
Using the 16 variables described the table above, 39 leading companies were ranked to identify their
position in the market. Each variable included a scale from 0 to 4, adding up to a maximum of 64 points
per company (see Table 19 in the Appendix). Two main total scores were created, one score comprising
all 16 indicators and another score excluding the five consumer confidence variables due to
unavailability of data for 13 companies. Letter grades were assigned to reflect an average of the four key
indicators of scope, cost, distribution network, and consumer satisfaction.8 The table below shows that
no company reached an A+ and three distinct and emerging businesses—Xoom, an internet money
transfer business, Wells Fargo, a bank, and Vigo and Viamericas, emerging MTOs—are the top
performers.
7 ATMs are excluded from the count of payment points.
8 These indicators comprise the 16 variables as measured in Table 1

5
Table 2: RSP Scores (%) and Grades***
RSP Grade 1* Grade 2*
Xoom A- B+
Wells Fargo A- A-
Vigo A- A-
Viamericas B+ A-
Dolex Dollar Express B+ B+
Sigue B B-
Remesas Quisqueyana B B-
Alante Financial B B-
Western Union B B-
La Nacional B C+
Ria Envia B B
MoneyGram B B
Delgado Travel B B-
Bank of America B B
BHD B C+
Giromex B- B-
Bancomer Transfer Services B- C+
Intermex B- C+
Girosol B- C+
Envios de Dinero G&T
Continental
B- B-
Orlandi Valuta B- B-
Bancuscatlan C+ C+
Bancomercio C+ C+
Banco Agricola C+ C
Multivalores (Nexxo) C C+
Unitransfer C- D+
Remesas Pujols C
Uniteller B+
Grupo Express B-
Maniflo C+
Barri International C+
Order Express B-
Citibank B-
Banco Atlantida C+
Dinero Seguro (USPS) C+
Ficohsa Express C
Jamaica National Overseas C
Cibao C
Laparkan C
*Includes consumer confidence data for a total of 64 points; ** Does not include consumer confidence data and counts 48
points; *** Based on average of scores across the four indicators.
In the following section, we analyze each of the key indicators scored above.

6
2. Remittance service providers: competition at work in the U.S.-Latin America
corridor
The U.S.-Latin America remittances corridor covers 70 percent of all transfers to the region sent by over
15 million migrants. Here we show findings by company, which are increasingly diversifying their
remittance product mix, and work mostly in one to three countries. The top six companies remitting to
Latin America are among the largest in market share and have the largest operating presence in the
region. The payment network from the United States to Latin America and the Caribbean involves
partnerships with over 2,500 payout institutions and encompasses over 50,000 unique payment points,
nearly half of which are in Mexico. RSPs are largely working with banking institutions as payout agents,
and 60 percent of payout locations are in urban areas.
a) Product and Geographic Scope
When looking at the type of remittance products9 RSPs offer, the majority of companies still center their
services on C2C transfers, mostly working on the assumption that migrants are not switching or
prepared to switch to other methods. However, there is increasing diversification in product offering:
just under one-quarter (10 of 40 companies) still only offer C2C transfers, but the other three quarters
(31 of 40 companies) offer transfers into bank accounts, six companies offer Internet transfers, and 17
offer additional financial services to consumers, such as money orders and check cashing services.
In terms of geographic scope, the volume of money transfers continues to be an attractive financial
proposition to companies in the business, but the large majority of companies work in fewer than three
countries. There is a divide between a large group of businesses operating in a few countries and a
small group of companies each operating in more than ten countries. These latter companies also have
on aggregate the largest market share in transfers to the region. The companies that exhibit the largest
share of payment points include MoneyGram, Western Union and Vigo, followed by Xoom and
Viamericas. The latter two are emerging companies with less than ten years in operation.
Table 3: RSPs geographic scope Operates in # (%)
10 or more countries 8 13
Four to nine 4 7
Up to three 47 80
Table 4: RSPs geographic scope (%) RSP Payout Distribution Share Market share (est.)
MoneyGram 13 10
Western Union 9 30
Vigo 9 8
Xoom 8 3
Viamericas 7 3
Ria 6 8
Uniteller 6 3
Dolex 6 3
Other 32 32
9 A remittance product is a transactional service that includes accepting the transfer in cash, through an account or
providing additional financial services.

7
b) Transfer Costs.
Remittance transfer costs, typically measured by the fee and the commission on the exchange rate have
been a topic of concern in public policy and international development circles. The average cost
remitted in 2010 by these companies shows a slight decline compared to 2009, to 5.0 percent of a
US$200 transfer (see Table 11). The most important result in 2010 is that prices converge more closely
around the mean, either in the fee or the foreign exchange commission: nearly 70 percent of costs are
between 3.5 percent and 6.5 percent. These averages represent an important improvement in the
marketplace because the range of prices fluctuates from a low of 1 percent to a high of 9 percent.
Table 5: Cost of sending US$200 as percent of principal sent Measure Fee FX Total
Average 4.15 1.19 5.00
Range 8.43 3.36 7.92
Standard deviation 1.8 0.8 1.5
The companies offering the lowest cost are among those offering services in dollarized economies,
where transfers are mostly paid out in U.S. dollars, or among RSPs paying to fewer countries. The cost
slightly increases as the number of countries where an RSP operates increases. But for the most part
these company costs are increasingly concentrated along mean values. The table below shows 15 out of
39 companies with total costs below the mean. At least one third of the revenue from most of these
companies comes from one country corridor, which in many cases is paid in U.S. dollars.
Table 6: RSP average transfer costs
RSP Main country
it operates in
Total cost
(%)
Bank of America (SafeSend) Mexico 1.58
BHD D. Republic 2.01
Delgado Travel Ecuador 3.00
Girosol Mexico 3.00
Dolex Dollar Express Mexico 3.04
Alante Financial El Salvador 3.50
Ficohsa Express Honduras 3.50
Envios de Dinero G&T Continental Guatemala 3.70
Wells Fargo Mexico 3.73
Banco Agricola El Salvador 4.50
Bancuscatlan El Salvador 4.50
Uniteller Ecuador 4.59
Jamaica National Overseas Jamaica 4.83
Viamericas Mexico 4.86
Citibank Mexico 4.90
c) Distribution network
Remittance service providers are working with more than 2,500 paying institutions in remittance
receiving countries. The payers are distributed unevenly across regions, countries, and rural and urban
areas. We find that Money Gram has the largest distribution of payment points. Nearly half (46 percent)

8
of all payment points are held by the five largest RSPs: Money Gram, Vigo, Xoom, Western Union, and
Viamericas. Payers tend to be banks and tend to be located in urban areas.
Marketplace trends among Remittance Service Providers and Payers
Although there are a number of new remittance service providers, competition is concentrated in about
thirteen companies per country, most of which have been active in the market for many years.
However, the range is high: Mexico has 21 RSPs while Haiti and Guyana have only seven. In some
countries, new players hold significant shares of all payout locations; they may not have large
remittance volumes yet, but they have built large payout networks. Country-specific RSPs, or an RSP
whose presence is significant in only one country in the region, also represent an important segment of
the market.
At the regional level, a select number of RSPs dominate. Of the 15 countries surveyed, MoneyGram has
the largest number of locations in four countries, followed by Vigo, Viamericas, Xoom, Ria, and Western
Union, with their largest number of locations in two countries each, while the other RSPs dominate in
one country each: UnoMoneyTransfers in Brazil, Viamericas in Guatemala, and Ria in Nicaragua.
Despite the significant shares held by the largest five RSPs, the majority of all payout locations (59
percent) are held by other RSPs. Viamericas holds an important footprint of all payout locations, at 7
percent. Additionally, Uniteller, Dolex, and Intermex have between four and six percent of the total
payout locations, due mostly to their prevalence in Mexico. In Mexico and Nicaragua, a large number of
RSPs hold moderate shares in the market, in particular, Dolex and Viamericas (7 percent) in Mexico and
Alante Financial (9 percent) in Nicaragua. In the Dominican Republic, six RSPs have 8 or 9 percent of the
total number of payment points each: La Nacional, Mateo Express, Pronto Envio, Remesas Pujols,
Uniteller and Viamericas.
Small countries with fewer payout locations, such as Jamaica and Guyana, have the greatest disparity in
RSP participation, with Western Union and MoneyGram holding larger shares. Conversely, countries
with the largest number of payout locations, particularly Mexico, Guatemala, and Ecuador, show greater
parity among RSPs.
The nature of payer institutions has important implications for financial access and the geographic
concentration of payment points. On the payer side, the trend remains that banks represent the
primary institutions for money transfer into a country. Bank branches represent 70 percent of all payout
locations, followed by retail at 10 percent. “Other” payers, which primarily reflect home delivery
services, hold 5 percent of the payout locations, while credit unions and foreign exchange bureaus play a
small role as payers in Latin America, with 7 and 3.5 percent of all payout locations, respectively. Post
offices, which play a significant role in the payout side in other world regions such as Africa, play a small
role in Latin America and the Caribbean, at one percent, and MFIs do not even reach one percent.
In terms of the intersection of RSP and payer institutions types, the partnership between MTO RSPs and
bank payers represents 64 percent of all payment points. MTOs also have important partnerships with
retail outlets and “other” RSPs. Bank RSPs partner nearly exclusively with bank payers, though retail and
credit union payers have a very small presence. MFI RSPs play an insignificant role in the market and
partner exclusively with banks, retail, and other payers, which do not include MFI payers.

9
Table 7: Types of RSPs and Types of Paying Institutions: Share of All Payout Locations (%)
Types of RSPs
Types of Paying
Institutions
MTO Bank Other
Bank 64.0 5.4 .2
NBFI 1.0 .0 .0
MFI 1.1 .1 .1
Credit Union 6.7 .4 .0
Retail 9.6 .2 .0
Forex 3.5 .0 .0
Post 2.5 .0 .0
Other 5.0 .0 .0
Note: 0 percent represents the presence of a partnership though the total share of all locations is less than 0.05 percent of all
locations.
The prominence of each payer type also varies significantly by RSP. Western Union and MoneyGram
have a large number of partner institutions across the region, at well over 1,000 each, compared to an
average of less than one hundred for all of the other RSPs. As a result, Western Union and MoneyGram
are the only RSPs to have a significant partnership with paying institutions besides banks. Intermex has
the highest reliance on bank partner institutions with bank branches representing nearly 95 percent of
all locations. Other than MoneyGram, Xoom has the highest number of credit union payout locations. By
comparison, only about 60 percent of all Western Union and MoneyGram partner locations are
represented by bank branches. Western Union has the highest level of partnership with retail outlets
and NBFIs. MoneyGram also partners with retail outlets at significant levels, along with credit unions.
MFI payers generally partner with Western Union, MoneyGram, and Viamericas.
Table 8: Top 10 MTOs and Payer Types in Latin America: Share of All MTO Payout Locations (%)
Bank NBFI MFI Credit
Union
Retail Forex Post Other Total No. of
Partners*
MoneyGram 58.3 0.9 2.6 11.3 19.3 1.9 0.9 4.8 1,481
Vigo 73.3 1.3 0.0 4.6 5.4 2.6 0.2 12.6 92
Xoom 73.8 0.2 0.6 8.4 6.6 3.0 0.1 7.4 228
Ria 82.8 0.1 0.6 4.3 1.9 3.2 0.3 6.7 53
Western Union 59.7 3.7 1.9 4.7 19.6 2.1 0.1 8.4 1,247
Viamericas 79.8 0.2 1.5 1.9 5.7 2.5 8.4 60
Uniteller 63.2 0.4 0.8 5.7 10.8 2.0 9.6 7.4 55
Dolex 89.7 0.2 0.0 1.3 5.0 1.4 2.5 28
Intermex 94.8 0.4 4.8 10
Wells Fargo 81.8 18.2 16
Other 80.7 0.5 0.3 4.2 4.5 1.8 0.1 7.9 271
* Notes the total number of unique partner institutions which do not double count a payer if it works across more than one
country in the region. Note: Blank entries signify the absence of payout locations between the MTO and a payer type, while a
zero percent represents the presence of a partnership though the total share of all locations is less than 0.5 percent.

10
The diverging geographic concentrations of RSP partner payout locations also play an important role in
determining access to remittance services. Of the largest RSPs, Ria has the largest concentration of its
partners’ payout locations in urban areas, with only 35 percent of its locations in rural areas overall,
where 54 percent of the population lives. Viamericas, on the other hand, has the largest concentration
of payout locations in rural areas.
Table 9: Geographic Concentration of Payout Locations and Population (%)
Rural Urban
MoneyGram 42 58
Ria 35 65
Vigo 36 64
Western Union 40 60
Xoom 40 60
Viamericas 69 31
Other 41 59
All RSPs 42 58
Total Population 54 46
d) Consumer satisfaction
Consumer satisfaction is measured from surveys with immigrants who are asked whether they agree or
strongly agree that they are satisfied with certain aspects of the RSP that they currently use. The five
categories measured are the fee transparency, the foreign exchange transparency, the ease of use,
overall inexpensiveness, and the value that the service has in comparison to other RSP’s. The consumer
satisfaction of these components is important because consumers will choose to frequent RSPs that
they are most satisfied and content with. Therefore, it is in the interest of the RSP to understand and
adapt to the consumer’s satisfaction rating.10
The ease of use has the highest average satisfaction rating at 86.2 percent. The high average satisfaction
with ease of use could be related to migrant tendencies to find one method of sending remittances and
not exploring new options over time. Nearly three quarters of consumers are satisfied with the
transparency of the fee, 60.1 percent were satisfied with the inexpensiveness of the service, 61.4
percent are satisfied with the transparency of foreign exchange, and only 46 percent of people
responded that they are satisfied with the value of services available through their RSP. The value
satisfaction rates may be low because consumers are unaware of the value of their services and
products through their RSPs and of how to compare amongst them.
Among the five largest RSPs, Xoom has the highest consumer satisfaction ratings in transparency of the
fee, transparency of the foreign exchange, and value. Xoom is tied for the highest satisfaction rating for
inexpensiveness with Vigo, though Vigo is actually the least expensive. Finally, Xoom is only one
percentage point below Vigo for ease of use. Among the lowest ratings are Viamericas for fee
transparency and ease of use, Moneygram for foreign exchange transparency and inexpensiveness, and
Vigo for value of service. In this case, Western Union is the most expensive.
10
The results on consumer satisfaction are based on a nationwide survey to 1000 immigrants conducted between
February and June, 2010.

11
Figure 1: Consumer satisfaction in the 5 largest RSPs in Latin America and the Caribbean
Consumer Satisfaction
0
10
20
30
40
50
60
70
80
90
100
Fee Transparency FX Transparency Ease of use Inexpensiveness Value
RSP
Per
cen
t sa
tisf
ied
or
stro
ng
ly s
atis
fied
Xoom Vigo Viamericas
MoneyGram Western Union Other
3. Corridor Competition in Remittance Markets in Latin America and the
Caribbean The market for remittance intermediation between the United States and Latin America and Caribbean
countries continues to show significant dynamism, even in times of crisis. For example, market
consolidation continues as a feature of competition. Currently, there are 13 remittance service providers
in each given corridor on average, which are by and large money transfer operators. However,
compared to previous years, the number of remittance service providers has declined, reflecting in part
changes in the industry that may reflect consolidation of companies.11
The main data for fourteen countries shows a total of over 53,000 unique locations paying remittances
in the countries researched. These locations are associated with 2,500 institutions authorized to
perform money transfers. Not all companies with the largest volumes have the larger number of
locations: there are new players with higher number of paying partners securing a bigger footprint in
Latin America. This report uses payment locations as a measure of participation in the remittance
market by RSPs and payers rather than market share by volume. One reason why payout location is
important is that when RSPs control more payout locations, this ensures them a greater footprint and
competitive advantage in the long term. Also, learning about the presence of payout locations allows
studies on development finance in relationship to remittances to get a closer perspective about the
potential to enable financial access to recipients.
11
Orozco 2006.

12
a. General Features of Remittance Markets in Latin America and the Caribbean We find a correspondence between the number of payout locations and aggregate volumes, suggesting
that a larger number of transfers require a larger number of locations (see Figure 1 for example). When
comparing payment points with costs, we also find that as a country’s payment network expands, the
cost of sending to that country decreases.
Table 10: Remittances to Latin America and the Caribbean: Basic Features
Country Annual
Remittance
(US$ millions)
Remittances’
Share of GDP
(%)
Remittances
Per Capita
(US$)
RSPs (#) Unique
Payment
Points
Average Cost
of Remitting
(%)
Mexico 25,145 2.5 232 21 20,611 6.2
Colombia 4,842 2.3 100 15 2,288 5.8
Guatemala 4,315 12.7 298 14 3,398 5.0
El Salvador 3,788 18.3 517 16 1,362 4.5
Dominican Rep. 3,148 7.5 320 18 1,919 5.7
Peru 2,960 2.6 109 14 1,865 4.0
Ecuador 2,822 5.9 200 14 3,332 3.8
Honduras 2,707 21.6 338 14 1,480 4.3
Jamaica 2,034 17.9 754 9 589 6.5
Haiti 1,184 30.0 136 7 437 6.4
Bolivia 1,097 8.1 103 11 1,527 6.1
Nicaragua 1,056 18.1 195 20 497 5.0
Paraguay 700 5.7 109 9 755 5.0
Guyana 415 36.7 528 7 115 8.0
Brazil 4,746 2.5 232 9 13,022 6.6
Source: Central Bank of each country, World Bank Development indicators, data collected by the author.
Figure 2: Remittances and Payout Locations in Latin America and the Caribbean
0
500
1,000
1,500
2,000
2,500
3,000
3,500
4,000
0 1,000 2,000 3,000 4,000 5,000
Total Country Remittances (US$ millions)
Un
iqu
e R
em
itta
nce
Payo
ut
Loca
tio
ns
Note: Mexico and Brazil, which exhibit the same trend, are excluded from the graph due to the large size of their payment
networks and remittances volume.

13
Figure 3: Cost of Remitting and number of payment points in Latin America
0
1
2
3
4
5
6
7
8
9
0 500 1,000 1,500 2,000 2,500 3,000 3,500 4,000Unique Payment Po ints
Co
st o
f R
em
itti
ng
(%
)
Note: Mexico and Brazil, which exhibit the same trend, are excluded from the graph.
Table 11: Cost of remitting US$200 to selected Latin American and Caribbean countries
2001 2002 2003 2004 2005 2006 2007 2008 2009 2010
Bolivia 10.1 6.7 5.6 6.1 4.3 6.1
Colombia 10.1 8.7 6 5.9 5 6.8 4.4 5.2 4.4 5.8
Cuba 13 12.9 12.4 12.4 12 12.4 12.8 ND 17
Dominican
Rep.
9.4 8.4 7.2 7.1 6.4 8.2 8.4 5.9 6 5.7
Ecuador 5.7 5.1 4.4 3.9 3.8 3.8 4.2 3.7 3.8
El Salvador 6.7 6.2 5.8 5 5.2 4.8 5.2 4.3 4.5 4.5
Guatemala 7.4 7.3 7.8 6.3 5.6 6.2 5.8 5.6 5.0
Haiti 9 8.1 10.4 7.9 6.7 7.2 7.3 5.2 7 6.4
Honduras 6.9 6.9 6.2 5.8 5.8 3.6 4.84 5.7 4.3
Jamaica 9.8 10 12.7 8.8 8.2 7.1 7.8 6.4 6.7 6.5
Mexico 8.8 9.3 7.5 6.2 6 6.2 5.7 6.6 5.6 6.2
Nicaragua 7.5 7.5 7 6.7 5.2 5.2 4.7 5.0
Peru 6.2 6.1 4.6 4.4 3.6 3.8 4 4.0
Venezuela 7.4 8.6 5.2 8.2 ND ND
Guyana 8.0
Brazil 6.6
Paraguay 5.0
LAC 9 8.6 8.2 7.1 6.3 6.5 6.1 5.2 5.3 6.1
Note: cost includes fee and commission.
The relative importance of payer types varies significantly by country. Of the fourteen countries
surveyed, banks hold at least 70 percent of all payout locations in eight countries. Banks have the
highest share of the market in Guatemala, at 95 percent, which reflects the restricted regulatory
environment on authorized payers.

14
In Paraguay, by contrast, MFIs dominate as payers, with 50 percent of all locations. In Guyana, retail
outlets hold significant shares at 43 percent. Banks in Guyana have their lowest share of locations in the
region at only 7 percent. In the Dominican Republic, home delivery represents the largest payer type, at
84 percent. Still, other countries have a myriad of payer types with significant presences in the country.
In Bolivia, for example, MFIs comprise 17 percent of all locations, followed by credit unions and banks at
16 and 28 percent respectively.
Table 12: Inbound payment of remittances by payer institutional type (%)
Bank NBFI MFI Credit Union Retail Forex Post Other* TOTAL
Bolivia 28 6 17 16 8 17 0 7 100
Brazil 86 0 0 10 0 1 0 4 100
Colombia 84 8 0 0 1 7 0 0 100
D.R. 12 0 1 0 0 4 0 84 100
Ecuador 60 0 1 9 3 6 0 19 100
Guatemala 95 0 0 1 1 0 0 3 100
Guyana 7 1 0 0 37 3 0 53 100
Honduras 88 0 0 3 6 1 0 2 100
Haiti 30 2 15 0 15 12 0 26 100
Jamaica 40 4 0 8 22 12 8 6 100
Mexico 79 0 0 5 11 1 2 3 100
Nicaragua 77 6 3 2 2 2 5 1 100
Peru 75 0 9 1 4 9 0 1 100
Paraguay 23 0 50 0 0 23 1 2 100
El Salvador 75 1 2 12 4 0 0 6 100
* “Other” in the Dominican Republic and Haiti reflects the large share of home delivery services offered in the countries.
The prominence of each payer type varies significantly by sub-region. In the Caribbean, only 14 percent
of payment points are bank branches. By contrast, 75 percent of all branches are “other” payers, which
primarily reflect the large role home delivery services play in the Caribbean. The role of banks is
particularly acute in Central America, where 89 percent of all payout locations are bank branches. Retail
outlets and credit unions play a small role as payers in Central America. Credit unions have their
greatest relative share of all locations in South America, at 6 percent of all locations. MFIs also play a
relatively larger role in South America with 4 percent of all locations, equivalent to the share of retail
outlets. Retail outlets have the largest relative presence in Mexico, at 11 percent, though banks
dominate.
Table 13: Payer Institutional Type: Share of All Payout Locations
Bank NBFI MFI Credit Union Retail Forex Post Other* TOTAL
Caribbean 14 0 1 1 2 5 1 75 100
Central America 89 1 1 3 3 0 0 3 100
Mexico 79 0 0 5 11 1 2 3 100
South America 75 2 2 7 2 5 0 6 100
LAC 76 1 1 5 7 2 1 7 100
Note: * “Other” in the Caribbean primarily reflects the large presence of home delivery services.

15
The presence of banks and their relationship to remittances
Banking sectors in Latin America and the Caribbean vary significantly not only in the number of banks,
but in the concentration of bank branches in major cities. In general, smaller countries with smaller
GDPs have fewer banks, though exceptions exist such as Paraguay with 16 licensed banks. Mexico has
the largest number of banks and bank branches, at 41 and 9,332, respectively. Ecuador has a
disproportionately high level of banks, at 25, for its GDP. Colombia has a high number of branches per
bank. Interestingly, the number of banks and branches per bank do not correlate with the concentration
of bank branches in major cities. Bolivia has the highest concentration of bank branches in the major
city, though its number of banks and branches per bank are not exceptional. Mexico has the largest
banking system, yet the concentration of bank branches in the major cities is low, allowing the
possibility that after a certain cluster point, banks expand into rural areas rather than crowding urban
areas further. Colombia disproves such a concept, however, as its large banking system is only
moderately concentrated in rural areas.
Table 14: Characteristics of Latin American Banking Institutions
Banks Branches
Branches
per bank
Branches in
major cities (%)
Population in
major cities (%)
Bolivia 12 323 27 54 24
Colombia 18 3,991 222 47 31
Dominican Rep. 12 674 45 45 21
Ecuador 25 951 38 44 26
El Salvador 8 291 36 44 8
Guatemala 19 1,689 89 43 8
Guyana 6 30 5 30 17
Haiti 9 154 17 45 9
Honduras 17 783 46 23 13
Jamaica 7 140 20 39 25
Mexico 41 9,332 288 35 19
Nicaragua 8 247 31 46 17
Paraguay 16 259 16 42 8
Peru 17 1,920 113 57 35
Total 215 20,784 97 41 21
Banks show varying participation levels with the major RSPs. On the one hand, 75 percent of all banks
pay out with either Western Union or MoneyGram in El Salvador. On the other hand, only 12 percent of
all banks pay out with Western Union or MoneyGram in Mexico. In a given country, banks also
participate at significantly different levels between Western Union and MoneyGram. In the Dominican
Republic, banks offer 315 payment points through MoneyGram and zero points through Western Union.
In Haiti, Western Union partners with banks to offer 90 payment points in bank branches, while
MoneyGram only offers 43 bank payout locations. In general, however, banks show significantly higher
levels of payment points with MoneyGram than with Western Union.
Table 15: Banks’ Partnership with Western Union and MoneyGram
Total RSP Bank
Payment Points
Western
Union
Money
Gram
Share of Banks
Paying out with
Western Union or
MoneyGram (%)
Bolivia 88 51 33
Colombia 113 533 11

16
Dominican Rep. 0 315 25
Ecuador 112 415 28
El Salvador 149 86 75
Guatemala 670 860 58
Guyana 0 10 17
Haiti 90 43 44
Honduras 292 387 76
Jamaica 0 49 14
Mexico 1,491 4,231 12
Nicaragua 33 47 25
Paraguay 19 11 13
Peru 199 867 29
Grand Total 3,256 7,905 31
b. Geographic Concentration of Payout Locations
Competition also has important implications on service coverage in the areas where demand exists. In
Latin America and the Caribbean, a significant divergence exists between the geographic concentration
of the population and payout locations. Overall, 63 percent of all payout locations are located inside
urban areas of at least 100,000 people, compared to only 46 percent of the population residing in those
urban areas. In other words, those who live outside of urban areas, which constitute the majority, only
have access to a little over a third of all payout locations. Only Paraguay has parity between its urban
population and urban payout locations. The divergence is also significant among major cities, or
metropolises in the region. Only 22 percent of the populace lives in major cities compared to 36 percent
of all payout locations.
Figure 4: Urban Concentration of Payout Locations and Population in Latin America
0.0
10.0
20.0
30.0
40.0
50.0
60.0
70.0
80.0
90.0
Bo
livia
Colo
mbi
aD
om
inic
an R
ep.
Ecua
dor
El S
alva
dor
Gua
tem
ala
Guy
ana
Hai
ti
Ho
ndur
as
Jam
aica
Nic
arag
ua
Para
guay
Peru
Mex
ico
Urban payout locations Urban population

17
The urban concentration of payout location varies significantly by country and sub-region. South
America has the highest concentration of its payout locations in urban areas at 70 percent (excluding
Brazil), though only 48 percent of the population lives in urban areas. This lack of correspondence in the
geographic concentration of payout networks and population is similar in the Caribbean, but to a lesser
degree. In the Caribbean countries of Jamaica, Haiti, and the Dominican Republic, 47 percent of all
payout locations are located in urban areas compared to 39 percent of the population. In Central
America, 47 percent of all locations are located in urban areas. Colombia has the highest divergence
between the geographic concentration of the population and payment points, with 53 percent and 89
percent in urban areas, respectively. The Dominican Republic is the only country to have a higher share
of payout locations outside of urban areas than the share of urban population respectively.
Figure 5: Urban concentration of payout locations by sub-region
0.0
10.0
20.0
30.0
40.0
50.0
60.0
70.0
80.0
Cari
bbea
n
Cent
ral A
mer
ica
Mex
ico
Sout
h A
mer
ica
Urban payout locations Urban population
In Latin America and the Caribbean, the payer institution types with the greatest concentrations outside
of urban areas have the smallest shares of all payout locations. As Figure 6 shows, banks dominate as
payers and are also the most concentrated in urban areas, along with NBFIs. The second largest payer
type, retail, is also present in urban areas in particular. Post offices, by contrast, have the lowest
concentration in urban areas and yet represent less than one percent of all payout locations. Credit
unions and MFIs both have relatively greater presences in rural areas, but their market share is small as
well.
Figure 6: Urban concentration of payment points by payer type
65 6461
53 51
38 37
12
58
0
10
20
30
40
50
60
70
NBFI Retail Banks Forex MFI CU Other Post Total

18
4. Remittance Market Regulations in Latin America and the Caribbean
Regulations on money transfers exist in order to facilitate payment systems for remittances and address
an efficient and effective process that is safe but reliable. Five particular regulatory issues affecting
remittance markets are examined here: rules on authorized payers that are able to deal in foreign
exchange, limits and requirements on amounts transferred, anti-money laundering laws, foreign-
currency accounts, and the capabilities of MFIs in money transfers. Regulations affecting money
transfers take several forms, many of which indirectly affect remittances in ways not often anticipated
by the primary legislation.
Regulations that allow or restrict the types of paying institutions that are able to perform foreign
currency transfers impact the extent of competition, geographic access to remittance services, and the
ability to access additional financial services from the payout institution. One often cited example is the
ability of MFIs to conduct foreign currency transfers. In countries where only banks are able to deal in
foreign currency, access to remittance services is often restricted as the geographic reach of banks is
limited in many countries. Other payer institutional types, such as retail outlets, may be permitted in a
country, allowing greater reach into rural areas, though the ability to access additional financial
products, such as microcredit, may be limited. Often, restrictive regulations may force remittance
recipients to travel long, costly distances to urban areas to receive their money or otherwise encourage
informal transfers, despite the existence of an extensive network of financial institutions capable of
paying out remittances.
The regulatory environment varies significantly across Latin America and the Caribbean, though
restrictions on authorized payers occur in a few countries. Of the fourteen countries surveyed, only two
countries restrict authorized payers to banks and foreign exchange (forex) bureaus: Haiti and
Guatemala. In both countries, MFIs may conduct foreign currency transactions, but only as subagents of
banks, which decreases the incentives for MFIs to participate in the remittance markets as the bank
agents earn a share of their profits. Ecuador, El Salvador, Colombia, Dominican Republic and Honduras
permit banks, forex, MFIs, credit unions, and non-banking financial institutions (NBFIs), while other
types of institutions may be prohibited or forced to receive Central Bank approval. Finally, the remaining
six countries surveyed allow a broad spectrum of institutional types to participate as authorized payers
in foreign currency transactions. In general, regulation regarding authorized payers falls under broader
banking and financial system laws dating as far back as 1989 in Guyana and as recent as 2005 in
Nicaragua. Haiti is the only country without a law that provides a direct framework for authorizing
institutions to conduct money transfers.
Table 16: Authorized Payers in Latin America and the Caribbean
Country Law Year
Authorized
Payers
Haiti n/a n/a
Guatemala Ley de Bancos y Grupos Financieros 2002
Banks and
Forex
Ecuador Ley General de Instituciones del Sistema Financiero (LGISF) 1994
El Salvador Ley de Intermediarios Financieros no Bancarios Decreto 849 - 2000; LEY DE
BANCOS DECRETO No. 697 – 1999
1999
Colombia Resolución Externa 8 de 2000 y sus modificaciones, Junta Directiva del
Banco de Reservas Central
2000
Banks, Forex
and
MFIs/Credit
Unions/NBFIs

19
Dominican Rep. Monetary and Financial Law, No.183 2002
Honduras Ley del Sistema Financiero (Decreto 129) 2004
Guyana Dealers in Foreign Currency Licensing Act 1989 1989
Bolivia Ley de Bancos y Entidades Financieras, Nro. 1488 1993
Mexico Banking Law 1993
Peru Ley del Sistema Financiero (incluye Microfinanzas) y de Seguros (Ley 26702) 1996
Paraguay Ley 861 General de Bancos, Financias y Otros Entidades de Crédito 1996
Jamaica Requirements for License to Operate a Remittance Service in Jamaica 2002
Nicaragua Ley General de Bancos, Instituciones Financieras No Bancarias y Grupos
Financieros
2005
All of the
above and
other entities
Limits on the amount of transfers have generally been liberalized in Latin America and the Caribbean.
Not one of the countries surveyed maintains limits on the amounts transferred, though three countries
have reporting requirements for transactions under US$10,000: Haiti, Honduras, and Nicaragua.
Every country also has a law requiring proof of beneficiary for large transactions, in line with anti-money
laundering (AML) legislation. Every country has passed AML legislation, with legislation in several
countries dating back before 2001.
Most countries have established task forces to deal with AML issues. For many small financial
institutions, the development of comprehensive anti-money laundering efforts often adds an additional
cost of doing business, particularly as it regards cross-border transactions. The extent to which financial
institutions must document and report even small transactions has important implications for the
institutional capacity and funding needed to conduct remittance business.
Table 17: Restrictions on Money Transfers in Latin America and the Caribbean Inbound Transfers Outbound Transfers
Country Law Year Limit Report
Amount
Less Than
US$10,000
Proof of
Beneficiary
Limit Report
Amount
Less Than
US$10,000
Proof of
Beneficiary
Bolivia Resolución UIF/032/99 - Instructivo
Especifico para Entidades de
Intermediación Financiera
1999 X X
Colombia Decreto 633 1993 X X
Dominican
Rep.
Instructivo de Formulario "Registro
de Transacciones en Efectivo que
Superen el Contravalor en Moneda
Nacional de US $10,000, Según Tasa
de Compra del Banco Central"
2007 X X
Ecuador Ley para Reprimir el Lavado de
Activos
2005 X X
El Salvador Ley Contra el Lavado de Dinero y
Activos
1998 X X

20
Inbound Transfers Outbound Transfers
Guatemala Ley Contra El Lavado de Dinero u
Otros Activos - Decreto 67
2001 X X
Guyana Money Laundering (PREVENTION)
Act
2000 X X
Haiti Circular n 95 regarding Commercial
Banks, Mortgage and Savings
banks, Foreign Exchange Agents
and Transfer Houses
2000 X X X X
Honduras Ley Contra el Delito de Lavados del
Dinero
2002 X X X
Jamaica Proceeds of Crime Act 2005 X X
Mexico Banking Law of 1993 1993 X X
Nicaragua Norma para la gestión de
prevención de los riesgos del lavado
de dinero, bienes o activos; y del
financiamiento al terrorismo
2009 X X X X
Paraguay Law 374 Treaty Between the United
States and Paraguay on the
Cooperation for the Prevention of
Money Laundering
1994 X X
Peru Resolution 6561 2009 X X

21
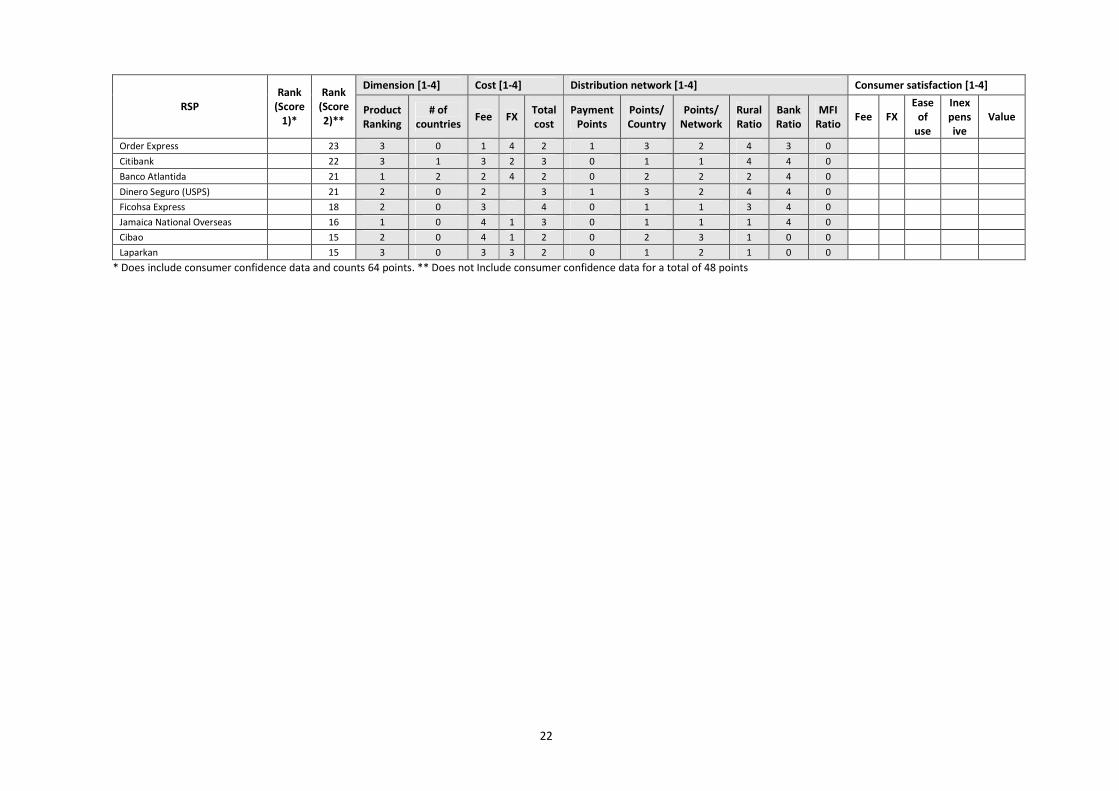
Appendix 1: Scorecard
Table 18: U.S.-LAC scorecard
Scale 1–4. Ranking: Dimension, Cost and Distribution network, Consumer satisfaction, 64 points. [See Table 3 for metrics]
Dimension [1-4] Cost [1-4] Distribution network [1-4] Consumer satisfaction [1-4]
RSP
Rank
(Score
1)*
Rank
(Score
2)** Product
Ranking
# of
countries Fee FX
Total
cost
Payment
Points
Points/
Country
Points/
Network
Rural
Ratio
Bank
Ratio
MFI
Ratio Fee FX
Ease
of
use
Inex
pens
ive
Value
Xoom 49 30 3 4 3 2 2 3 3 4 2 3 1 4 4 4 3 4
Wells Fargo 46 31 4 3 4 1 4 2 3 2 4 4 0 4 2 4 4 1
Viamericas 44 34 3 3 3 3 3 3 3 4 3 4 2 1 3 3 3
Vigo 44 32 3 4 3 3 2 3 3 4 3 3 1 3 2 4 3 0
Sigue 43 27 1 1 2 3 2 2 4 3 4 4 1 4 4 4 2 2
Remesas Quisqueyana 42 26 2 2 2 3 2 1 2 3 4 3 2 4 3 4 4 1
Giromex 41 25 2 0 2 3 2 1 4 3 4 4 0 4 4 3 3 2
Bancomer Transfer Services 41 23 3 0 2 2 1 1 4 3 3 4 0 4 4 4 3 3
Alante Financial 40 25 3 1 3 4 0 2 3 2 3 4 4 0 4 4 3
Western Union 39 24 3 4 1 1 1 3 3 4 1 2 1 4 3 4 2 2
Intermex 39 23 2 0 2 0 2 2 4 4 3 4 0 4 4 3 3 2
La Nacional 39 20 2 2 3 1 2 1 2 3 2 2 0 4 4 4 4 3
Dolex Dollar Express 38 31 1 3 4 3 4 3 3 2 3 4 1 2 0 4 0 1
Ria Envia 38 28 3 4 3 1 1 3 3 3 2 4 1 3 1 4 1 1
MoneyGram 38 27 3 4 2 1 1 4 3 4 1 2 2 3 2 4 1 1
Delgado Travel 38 18 3 2 4 4 0 1 1 3 0 0 4 4 4 4 4
Girosol 38 18 1 1 4 0 4 0 2 2 2 2 0 4 4 4 4 4
Bank of America 37 27 3 0 4 2 4 1 4 3 2 4 0 2 0 4 2 2
Envios Dinero G&T Continental 34 24 2 0 3 4 4 0 2 2 3 4 0 4 2 4 0 0
BHD 32 20 2 0 2 4 3 0 2 2 1 0 4 4 0 4 4 0
Bancuscatlan 32 16 2 0 3 3 0 1 1 2 4 0 4 4 4 4
Multivalores (Nexxo) 29 21 2 0 2 4 2 0 2 3 2 4 0 4 0 4 0 0
Bancomercio 29 17 3 0 2 3 0 1 1 3 4 0 4 4 3 1
Orlandi Valuta 27 20 3 1 3 3 2 1 3 1 3 0 0 2 1 4 0 0
Banco Agricola 26 16 3 0 3 3 0 1 1 1 4 0 2 4 3 1
Remesas Pujols 17 17 2 0 3 2 2 0 3 4 1 0 0
Unitransfer 17 10 2 0 1 1 0 1 2 1 2 0 1 3 3 0 0
Uniteller 31 2 3 3 4 3 3 3 3 4 2 1
Grupo Express 26 2 0 2 4 2 1 4 3 4 4 0
Maniflo 26 2 0 2 2 1 2 4 4 4 4 1
Barri International 23 1 0 3 1 1 2 4 3 4 4 0
22
Dimension [1-4] Cost [1-4] Distribution network [1-4] Consumer satisfaction [1-4]
RSP
Rank
(Score
1)*
Rank
(Score
2)** Product
Ranking
# of
countries Fee FX
Total
cost
Payment
Points
Points/
Country
Points/
Network
Rural
Ratio
Bank
Ratio
MFI
Ratio Fee FX
Ease
of
use
Inex
pens
ive
Value
Order Express 23 3 0 1 4 2 1 3 2 4 3 0
Citibank 22 3 1 3 2 3 0 1 1 4 4 0
Banco Atlantida 21 1 2 2 4 2 0 2 2 2 4 0
Dinero Seguro (USPS) 21 2 0 2 3 1 3 2 4 4 0
Ficohsa Express 18 2 0 3 4 0 1 1 3 4 0
Jamaica National Overseas 16 1 0 4 1 3 0 1 1 1 4 0
Cibao 15 2 0 4 1 2 0 2 3 1 0 0
Laparkan 15 3 0 3 3 2 0 1 2 1 0 0
* Does include consumer confidence data and counts 64 points. ** Does not Include consumer confidence data for a total of 48 points
23
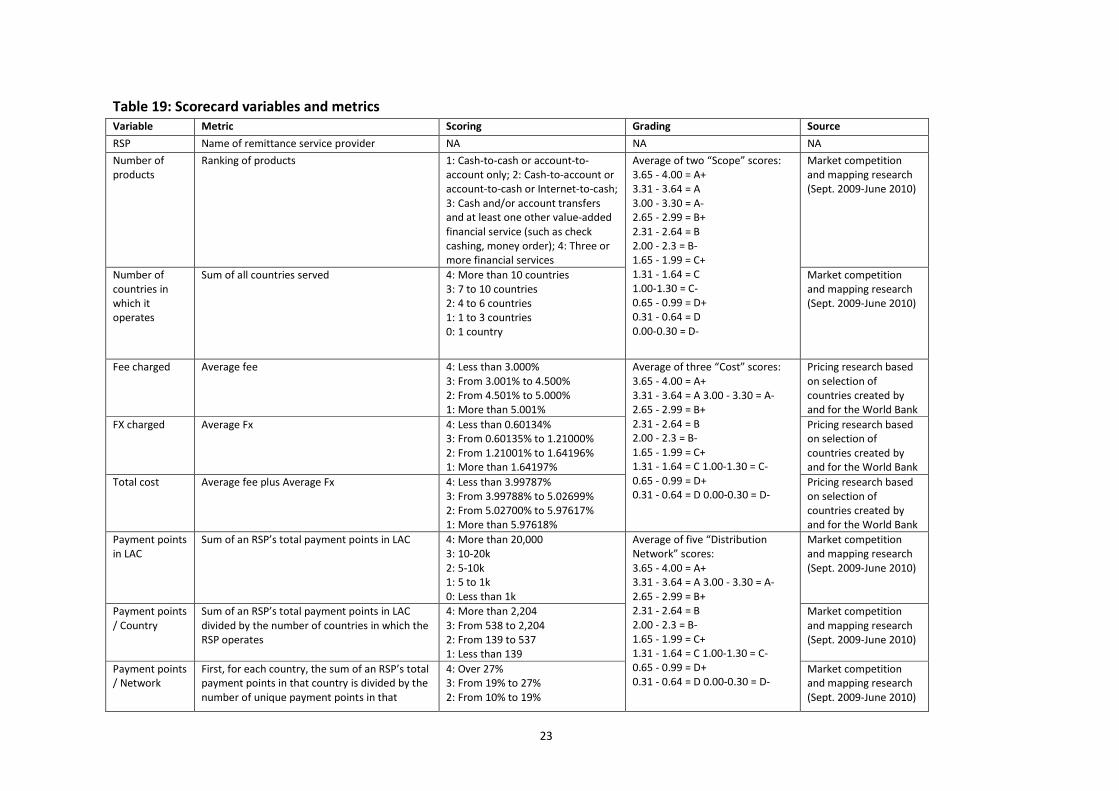
Table 19: Scorecard variables and metrics
Variable Metric Scoring Grading Source
RSP Name of remittance service provider NA NA NA
Number of
products
Ranking of products 1: Cash-to-cash or account-to-
account only; 2: Cash-to-account or
account-to-cash or Internet-to-cash;
3: Cash and/or account transfers
and at least one other value-added
financial service (such as check
cashing, money order); 4: Three or
more financial services
Market competition
and mapping research
(Sept. 2009-June 2010)
Number of
countries in
which it
operates
Sum of all countries served 4: More than 10 countries
3: 7 to 10 countries
2: 4 to 6 countries
1: 1 to 3 countries
0: 1 country
Average of two “Scope” scores:
3.65 - 4.00 = A+
3.31 - 3.64 = A
3.00 - 3.30 = A-
2.65 - 2.99 = B+
2.31 - 2.64 = B
2.00 - 2.3 = B-
1.65 - 1.99 = C+
1.31 - 1.64 = C
1.00-1.30 = C-
0.65 - 0.99 = D+
0.31 - 0.64 = D
0.00-0.30 = D-
Market competition
and mapping research
(Sept. 2009-June 2010)
Fee charged Average fee 4: Less than 3.000%
3: From 3.001% to 4.500%
2: From 4.501% to 5.000%
1: More than 5.001%
Pricing research based
on selection of
countries created by
and for the World Bank
FX charged Average Fx 4: Less than 0.60134%
3: From 0.60135% to 1.21000%
2: From 1.21001% to 1.64196%
1: More than 1.64197%
Pricing research based
on selection of
countries created by
and for the World Bank
Total cost Average fee plus Average Fx 4: Less than 3.99787%
3: From 3.99788% to 5.02699%
2: From 5.02700% to 5.97617%
1: More than 5.97618%
Average of three “Cost” scores:
3.65 - 4.00 = A+
3.31 - 3.64 = A 3.00 - 3.30 = A-
2.65 - 2.99 = B+
2.31 - 2.64 = B
2.00 - 2.3 = B-
1.65 - 1.99 = C+
1.31 - 1.64 = C 1.00-1.30 = C-
0.65 - 0.99 = D+
0.31 - 0.64 = D 0.00-0.30 = D- Pricing research based
on selection of
countries created by
and for the World Bank
Payment points
in LAC
Sum of an RSP’s total payment points in LAC 4: More than 20,000
3: 10-20k
2: 5-10k
1: 5 to 1k
0: Less than 1k
Market competition
and mapping research
(Sept. 2009-June 2010)
Payment points
/ Country
Sum of an RSP’s total payment points in LAC
divided by the number of countries in which the
RSP operates
4: More than 2,204
3: From 538 to 2,204
2: From 139 to 537
1: Less than 139
Market competition
and mapping research
(Sept. 2009-June 2010)
Payment points
/ Network
First, for each country, the sum of an RSP’s total
payment points in that country is divided by the
number of unique payment points in that
4: Over 27%
3: From 19% to 27%
2: From 10% to 19%
Average of five “Distribution
Network” scores:
3.65 - 4.00 = A+
3.31 - 3.64 = A 3.00 - 3.30 = A-
2.65 - 2.99 = B+
2.31 - 2.64 = B
2.00 - 2.3 = B-
1.65 - 1.99 = C+
1.31 - 1.64 = C 1.00-1.30 = C-
0.65 - 0.99 = D+
0.31 - 0.64 = D 0.00-0.30 = D- Market competition
and mapping research
(Sept. 2009-June 2010)

24
Variable Metric Scoring Grading Source
country to get a percentage presence. Then, the
percentages for each country are averaged.
1: Under 10%
Rural/Urban
Ratio
Percent of all payment points that are rural 4: Over 68.5317%
3: From 58.6331% to 68.5316%
2: From 47.3706% to 58.6330%
1: Under 47.3705%
Market competition
and mapping research
(Sept. 2009-June 2010)
Bank partners
as ratio of all
payment points
Banks payment points / All payment points 4: Over 80%
3: 70-79.9%
2: 50-69.9%
1: 35-49.9%
0: Under 34.9%
Market competition
and mapping research
(Sept. 2009-June 2010)
MFI partners as
ratio of all
payment points
MFI payment points / all payment points 4: Over 10%
3: 5.0%-9.9%
2: 2.0%-4.99%
1: Under 1.99%
0: No partner
Market competition
and mapping research
(Sept. 2009-June 2010)
Consumer
satisfaction:
Fee
transparency
Percent of people who agree or strongly agree
that the RSP is transparent with its costs
4: Over 75%
3: 60 to 75%
2: 50 to 59%
1: 30 to 49%
0: Under 30%
Survey conducted
among migrants in the
United States (May
2010)
Consumer
satisfaction: FX
transparency
Percent of people who agree or strongly agree
that the RSPS is transparent with its foreign
exchange (FX) rates
4: Over 75%
3: 60 to 75%
2: 50 to 59%
1: 30 to 49%
0: Under 30%
Survey conducted
among migrants in the
United States (May
2010)
Consumer
satisfaction:
ease of use
Percent of people who agree or strongly agree
that the RSP is easy to use
4: Over 75%
3: 60 to 75%
2: 50 to 59%
1: 30 to 49%
0: Under 30%
Survey conducted
among migrants in the
United States (May
2010)
Consumer
satisfaction:
inexpensive
Percent of people who agree or strongly agree
that the RSP service is inexpensive
4: Over 75%
3: 60 to 75%
2: 50 to 59%
1: 30 to 49%
0: Under 30%
Survey conducted
among migrants in the
United States (May
2010)
Consumer
satisfaction:
value
Percent of people who agree or strongly agree
that the RSP has more value than other RSPs
4: Over 75%
3: 60 to 75%
2: 50 to 59%
1: 30 to 49%
0: Under 30%
Average of five “Consumer
Satisfaction” scores:
3.65 - 4.00 = A+
3.31 - 3.64 = A 3.00 - 3.30 = A-
2.65 - 2.99 = B+
2.31 - 2.64 = B
2.00 - 2.3 = B-
1.65 - 1.99 = C+
1.31 - 1.64 = C 1.00-1.30 = C-
0.65 - 0.99 = D+
0.31 - 0.64 = D 0.00-0.30 = D-
Survey conducted
among migrants in the
United States (May
2010)

25
Table 20: RSP indicators from the U.S. to LAC Cost (%) Payment Network Consumer satisfaction (%)
RSP Product # of
countries Fee FX Total
cost
Payment
Points
Points/
Country
Points/
Network
(%)
Rural
ratio
(%)
Bank
ratio
(%)
MFI
ratio
(%)
Fee FX
Ease
of
use
Inexpen-
sive Value
Alante Financial C2C/C2A 2 3.50 0.00 3.50
354
177
23 48 74 11 87 NA 100 100 63
Banco Agricola C2C/C2A 1 4.50 0.00 4.50
55
55
4 45 100 0 50 NA 83 67 33
Banco Atlantida C2C 1 5.00 0.03 5.03
157
157
11 48 100 0 NA NA NA NA NA
Bancomer Transfer
Services C2C/C2A 1 5.00 1.51 6.51
4,672
4,672
23 66 100 0 85 85 91 63 72
Bancomercio C2C/C2A 1 5.00 0.00 5.00
55
55
4 65 100 0 80 NA 100 74 33
Bancuscatlan C2C/C2A 1 4.50 0.00 4.50
50
50
4 50 100 0 100 NA 100 100 100
Bank of America
(SafeSend) A2C 1 0.00 1.58 1.58
4,877
4,877
24 54 87 0 55 18 82 55 55
Barri International C2C 1 4.00 4.55 8.55
5,580
5,580
27 75 92 0 NA NA NA NA NA
BHD C2C/C2A/C2HD 1 2.00 0.01 2.01
343
343
18 40 24 15 100 0 100 100 0
Cibao C2C/C2A/C2HD 1 2.62 2.64 5.26
366
366
19 45 22 0 NA NA NA NA NA
Citibank C2A/I2A/A2A 2 3.25 1.64 4.90
173
87
4 80 100 0 NA NA NA NA NA
Delgado Travel C2C/C2A 4 3.00 0.00 3.00
195
49
5 61 2 0 94 94 94 100 91
Dinero Seguro (USPS) C2C 1 5.00 5.00
2,204
2,204
11 75 100 0 NA NA NA NA NA
Dolex Dollar Express C2C 10 1.95 1.09 3.04
11,109
1,111
15 64 90 0 50 17 83 0 33
Envios de Dinero G&T
Continental C2C/C2A 1 3.34 0.35 3.70
526
526
15 60 100 0 100 50 100 0 0
La Nacional C2C/C2A/C2HD 6 3.21 2.00 5.21
3,181
530
23 55 61 0 85 83 84 84 65
Ficohsa Express C2C 1 3.50 0.00 3.50
75
75
5 68 100 0 NA NA NA NA NA
Giromex C2C/C2A 1 5.00 0.73 5.73
4,889
4,889
24 78 95 0 NA NA NA NA NA
Girosol C2C 2 3.00 0.00 3.00
278
139
12 59 65 0 100
10
0 100 100 100
Grupo Express C2C 1 5.00 0.57 5.57
4,031
4,031
20 73 94 0 NA NA NA NA NA

26
Cost (%) Payment Network Consumer satisfaction (%)
RSP Product # of
countries Fee FX Total
cost
Payment
Points
Points/
Country
Points/
Network
(%)
Rural
ratio
(%)
Bank
ratio
(%)
MFI
ratio
(%)
Fee FX
Ease
of
use
Inexpen-
sive Value
Intermex C2C 1 5.00 0.00 5.00
8,159
8,159
40 66 95 0 86 86 64 64 50
Jamaica National
Overseas C2C/I2C 1 2.33 2.49 4.83
41
41
7 39 100 0 NA NA NA NA NA
Laparkan C2C 1 4.50 0.98 5.48
15
15
13 47 0 0 64 46 100 63 0
Maniflo C2C/C2A 1 5.00 1.43 6.43
6,300
6,300
31 69 81 0 NA NA NA NA NA
MoneyGram C2C/C2HD/I2C 15 4.88 1.91 6.79
20,808
1,387
34 47 58 3 62 59 76 48 41
Multivalores (Nexxo) C2C/C2A 1 5.00 0.08 5.08
362
362
24 52 100 0 100 0 100 0 0
Order Express C2C/C2A 1 5.01 0.02 5.03
2,046
2,046
10 70 78 0 NA NA NA NA NA
Orlandi Valuta C2C/C2A 3 4.28 0.93 5.21
2,345
782
9 66 25 0 55 33 89 22 22
Remesas Pujols C2C/C2A/C2HD 1 4.03 1.46 5.49
746
746
39 26 0 0 NA NA NA NA NA
Remesas Quisqueyana C2C/C2HD 5 4.93 1.00 5.93
2,054
411
19 78 77 4 83 67 95 83 41
Ria Envia C2C/C2A 15 3.40 2.60 6.00
15,011
1,001
27 58 82 1 65 45 82 47 35
Sigue C2C 2 5.00 0.79 5.79
6,423
3,212
27 69 87 0 77 77 92 54 54
Uniteller C2C 10 4.10 0.49 4.59
11,363
1,136
25 73 63 0 NA NA NA NA NA
Unitransfer C2C 1 8.00 8.00
54
54
12 4 0 33 67 67 0 0
Viamericas C2C/C2A/C2HD 10 3.76 1.10 4.86
16,226
1,623
36 67 80 2 33 NA 67 67 67
Vigo C2C/C2A 15 4.14 1.12 5.26
18,808
1,254
29 62 73 0 72 54 96 68 24
Wells Fargo C2C/C2A/A2C/
A2A/I2C/I2A 10 1.45 2.28 3.73
5,385
539
10 74 82 0 94 57 94 75 44
Western Union C2C/C2A/I2C/I2
A 15 4.83 1.82 6.65
14,971
998
29 43 60 2 73 67 77 60 56
Xoom I2A/I2C 13 4.16 1.62 5.78
15,260
1,174
29 58 74 1 89 89 95 68 90

27
Table 21: Number of RSP payment points per country (U.S. to LAC)
RSP BRA MEX BOL COL DOM ECU GTM GUY HND HTI JAM NIC PER PRG SLV TOTAL
Alante Financial 154 159 195 508
Banco Agricola 55 55
Banco Atlantida 157 157
Banco Ficohsa 75 75
Bancomercio 55 55
Bancomer Transfer Services 4,672 4,672
Bancuscatlan 50 50
Bank of America (SafeSend) 4,877 4,877
Banrural 377 377
Barri International 5,580 5,580
Braz Transfers 1,647 1,647
CAM 66 16 82
Cibao 366 366
Citibank 25 148 173
Coinstar 3,128 169 676 60 559 554 9 133 121 24 179 168 5,780
Delgado 69 69
Delgado Travel 84 25 94 203
Dinero Seguro (USPS) 2,204 2,204
Dolex 9,003 59 458 293 204 320 112 45 508 107 11,109
Envios 22-24 17 17
Envios de Dinero G&T Continental 526 526
Gigante Express 526 14 540
Giros Latinos 329 31 360
Girosol 189 89 278
Giromex 4,889 4,889
Grupo Express 4,031 4,031
iKobo 5 5
Intermex 8,159 8,159
Jamaica National Overseas 41 41
JNBS Money Transfer 37 37
La Nacional 18 746 1,041 445 604 327 3,181

28
RSP BRA MEX BOL COL DOM ECU GTM GUY HND HTI JAM NIC PER PRG SLV TOTAL
Laparkan 15 15
Maniflo 6,300 6,300
Mateo Express 746 746
Money Trans 127 127
MoneyGram 3,685 10,689 565 574 336 862 1,397 57 729 84 305 104 812 90 491 20,780
Multivalores 362 362
Order Express 2,046 2,046
Orlandi Valuta 2,107 190 48 2,345
Pronto Envio 746 746
Quisqueyana 565 267 820 392 79 2,123
Rapid Envios 96 96
Remesas Dominicanas (BHD) 343 343
Remesas Pujols 746 746
Ria 1,680 7,629 1,076 960 621 965 15 686 54 69 185 699 136 104 14,879
Samsos 45 45
Sigue 6,302 121 6,423
South 426 426
Transfast 100 100
Uniteller 6,871 70 613 746 411 1,472 241 107 347 485 11,363
Unitransfer 54 54
Uno Money Transfer (Omnex Group) 4,411 15 308 105 4,839
Viamericas 458 9,101 1,107 819 662 2,091 730 111 709 438 16,226
Vigo 515 10,789 90 1,659 828 956 1,791 15 594 22 36 164 787 89 354 18,689
Wells Fargo 4,365 44 302 82 65 697 70 52 169 135 5,981
Western Union 4,008 6,327 408 378 78 663 1,373 34 315 267 62 138 348 499 320 15,218
Xoom 426 8,568 285 1,321 1,099 404 1,129 569 29 100 687 89 536 15,242
Unique points 13,022 20,611 1,527 2,288 1,919 3,332 3,398 115 1,480 437 589 497 1,865 755 1,362 53,197

29
Table 22: Number of RSP payment points as percentage of total payment points in a country (U.S. to LAC)
RSP # of countries BRA MEX BOL COL DOM ECU GTM GUY HND HTI JAM NIC PER PRG SLV Average
Alante Financial 2 10 32 14 19
Banco Agricola 1 4 4
Banco Atlantida 1 11 11
Banco Ficohsa 1 5 5
Bancomercio 1 4 4
Bancomer Transfer Services 1 23 23
Bancuscatlan 1 4 4
Bank of America (SafeSend) 1 24 24
Banrural 1 11 11
Barri International 1 27 27
Braz Transfers 1 13 13
CAM 2 15 3 9
Cibao 1 19 19
Citibank 2 1 8 4
Coinstar 12 15 11 30 3 17 16 8 9 21 5 10 12 13
Delgado 1 3 3
Delgado Travel 3 3 1 12 5
Dinero Seguro (USPS) 1 11 11
Dolex 10 44 4 20 15 6 9 8 9 27 8 15
Envios 22-24 1 3 3
Envios de Dinero G&T Continental 1 15 15
Gigante Express 2 15 1 8
Giros Latinos 2 22 6 14
Girosol 2 6 18 12
Giromex 1 24 24
Grupo Express 1 20 20
iKobo 1 1 1
Intermex 1 40 40
Jamaica National Overseas 1 7 7
JNBS Money Transfer 1 6 6

30
RSP # of countries BRA MEX BOL COL DOM ECU GTM GUY HND HTI JAM NIC PER PRG SLV Average
La Nacional 6 1 39 31 13 32 24 23
Laparkan 1 13 13
Maniflo 1 31 31
Mateo Express 1 39 39
Money Trans 1 26 26
MoneyGram 15 28 52 37 25 18 26 41 50 49 19 52 21 44 12 36 34
Multivalores 1 24 24
Order Express 1 10 10
Orlandi Valuta 3 10 8 10 9
Pronto Envio 1 39 39
Quisqueyana 5 25 14 25 21 10 19
Rapid Envios 1 19 19
Remesas Dominicanas (BHD) 1 18 18
Remesas Pujols 1 39 39
Ria 14 13 37 47 50 19 28 13 46 12 12 37 37 18 8 27
Samsos 1 9 9
Sigue 2 31 24 27
South 1 3 3
Transfast 1 20 20
Uniteller 10 33 5 27 39 12 43 16 22 19 36 25
Unitransfer 1 12 12
Uno Money Transfer (Omnex Group) 4 34 13 17 14 19
Viamericas 6 4 44 48 43 20 62 49 22 38 32 36
Vigo 15 4 52 6 73 43 29 53 13 40 5 6 33 42 12 26 29
Wells Fargo 10 21 3 13 4 2 21 5 10 9 10 10
Western Union 15 31 31 27 17 4 20 40 30 21 61 11 28 19 66 23 29
Xoom 13 3 42 19 58 57 12 33 38 5 20 37 12 39 29
Unique points 13,022 20,611 1,527 2,288 1,919 3,332 3,398 115 1,480 437 589 497 1,865 755 1,362 53,197

31
Appendix 2: Additional Features of Remittance Markets in Latin America and
the Caribbean
Table 23: Type of paying institution operating in selected Latin American and Caribbean countries (%)
# of
Payers Bank Non Bank Financial
Institution
MFI Credit
Union
Retail Forex Post
Office
Other
Colombia 29 64.7 11.6 .1 .0 4.2 18.9 .0 .6
Dominican
Republic 54 28.7 .2 4.5 .1 2.1 18.8 .0 45.7
Ecuador 278 38.7 .6 .2 24.8 6.1 15.4 .0 14.2
El Salvador 88 70.2 1.2 4.9 13.3 3.0 .8 .0 6.5
Guatemala 70 83.0 .0 .8 2.2 8.7 .0 .0 5.2
Honduras 85 78.9 .6 1.1 6.2 2.6 4.7 .0 5.9
Jamaica 241 28.1 5.2 .2 9.8 28.1 11.7 11.2 5.8
Mexico 862 74.1 .5 .2 7.1 12.6 2.0 .0 3.5
Peru 158 60.1 1.7 11.3 2.6 8.2 13.5 .2 2.3
Guyana 116 9.0 .0 .0 .0 43.4 4.1 23.0 20.5
Paraguay 117 7.5 7.5 2.2 7.0 14.2 57.2 1.2 3.2
Total 2076
Table 24: RSPs share of number of locations held in Latin America and the Caribbean
RSP Payout Distribution Share (%)
MoneyGram 10
Vigo 9
Viamericas 8
Xoom 7
Western Union 7
Ria 6
Uniteller 6
Dolex 5
Intermex 4
Sigue 3
Maniflo 3
Wells Fargo 3
Barri International 3
Giromex 2
Bank of America 2
Other 21

32
Table 25: Remittance service providers and paying institutions in Latin America and the Caribbean (%)
MTO Bank Post Office Credit Union Other
Bank 64.1 6.5 .0 .0 .3
Credit Union 7.1 .0 .0 .0 .1
Forex 4.0 .1 .0 .0 .0
MFI .7 .1 .0 .0 .1
NBFI 1 .0 .0 .0 .0
Other 4.7 .0 .0 .0 .0
Post .2 .0 .0 .0 .0
Retail 11.0 .2 .0 .0 .0
Table 26: Number of remittance service providers
2001 2002 2003 2004 2005 2009 2010
Bolivia 18 18 14 11
Colombia 4 16 37 37 29 13 15
Cuba 2 12 10 9 5
Dominican Republic 30 36 34 31 25 15 18
Ecuador 13 34 18 19 12 14
El Salvador 21 26 24 29 15 11 16
Guatemala 22 30 32 30 14 7 14
Haiti 5 10 18 14 7 7
Honduras 16 20 20 12 11 14
Jamaica 7 7 8 13 6 9 9
Mexico 25 49 69 51 56 19 21
Nicaragua 13 14 16 11 6 20
Peru 23 24 13 11 14
Venezuela 18 10 8

33
Appendix 3: Research Methodology
a) Distribution network research
Data collection on the plethora of locations where money is retrieved (bank branches, post offices,
foreign exchange bureaus, etc.) by recipients through authorized entities was obtained between
September 2009 and June 2010 by using primary sources based on a review of all institutions authorized
to carry out foreign currency payments. The process included three steps: a) identification of active
remittance service providers (RSPs) in each country, b) data collection on the operational locations of
each RSP, and c) identification of all authorized banks and data collection on their branch locations.
The types of RSPs were classified into the following groups: money transfer operators, banks, credit
unions, microfinance institutions (MFIs), post offices, non-banking financial institutions (NBFIs), and
“other” RSPs that do not fit any of the other categories. On the payout side, the types of institutions
included are banks, retail outlets, MFIs, credit unions, NBFIs, retail stores, post offices, and “other”
paying institutions who were not able to be classified or do not fit any of these categories (ex. home
delivery services or private postal companies). Also, if the type of payer could not be determined (if it
was the name of a geographic location, an acronym, etc. that could not be elucidated through further
research) it was classified as “other.”
When searching for payout locations for various RSPs, three main approaches were used to gather the
necessary information. For many RSPs, the cities where services are offered are listed on the RSP
website. By clicking on the name of the city, a list of payout locations appears. These locations were put
into an excel file, noting the RSP, the city, the name of the payout location, the payout type (Bank, MFI,
Forex, Other), and how many of each payer there are in each city. A second approach was used for RSPs
that do not list payment points on their website, but do offer a search engine function to search for
locations by city. That way, an extensive list of city names was developed for each country. A third
approach was used for RSPs that do not list their branches online but only provide information on their
paying institution partners. In this case, the branches of the paying institutions were collected and the
locations that pay remittances were confirmed with the institution. The identification of institutions
authorized to perform foreign currency transactions provided further information on the landscape of
paying institutions. Each authorized institution was researched as to whether it pays transfers or not,
who their RSP partner is, and where and which of their branch locations pay remittances.
Table 27: Variables in distribution network data set Variable Label
CoID Country Identification
Country Country
City Name of city
RSP Remittance service provider name
RSP Type Type of RSP (MTO, bank, NBFI, etc.)
Payer Paying institution name
Payer Type Payer type (bank, MFI, NBFI, post office, retail, etc.)
Number of branches Number of payment points
Urban/rural 1: Urban, over 100,000 people in city, 0: Rural, under 100,00 people
UrbanTotalPayoutPresence Urban/Total Payout Presence
UrbanTotalPop Urban/TotalPop
UrbanPop Urban Pop
TotalPop Total Pop
Urbpart Number of locations in the capital

34
The competition data also collected the concentration of the population and payout branches in urban
and rural areas. Urban was defined as being located inside the city limits of the capital city and any city
with more than 100,000 inhabitants.12 The report uses this urban definition for populations and
remittance payout locations. Defining an “urban area” in a way that aligns with the available
information on populations and payout locations is particularly challenging. Population data is available
for cities with more than 100,000 people in nearly every country.13 Additional information is available
for many major cities on the size of the population in the city proper and the suburban fringe. Data on
remittance payout locations, by contrast, are only available by the name of the city where the paying
institution is located. This report, therefore, used the definition of urban to maximize the allowance of
the information available by both definitions: including cities of more than 100,000 people and limiting
spatial boundaries to the city proper. To obtain the population information for each country, this report
used the Gazetteer, 14 a widely cited source of population data, which regularly updates information
from recognized sources, including the UN Population Division and United States Bureau of International
Program Center, along with official in-country sources and local survey data. The remittance payout
location information was gathered from the respective websites of remittance service provider and their
payout institutions.
b) Pricing research. Pricing data (remittance service providers’ fees and foreign exchange margin above
the Central Bank’s reported rate) was collected in February 2010 based on a selection of countries
created by and for the World Bank. Inter-American Dialogue staff conducted mystery shopping by
posing as customers who wanted to send US$200 to a certain Latin American country and asking RSP
agents across the United States about their prices. Data was collected within each corridor on the same
day, in order to control for fluctuations in exchange rates and other changes in fee structures.
c) Consumer satisfaction research. Consumer satisfaction data was obtained through a survey
conducted by Hispanic Market Research and Services on behalf of the Inter-American Dialogue in April
2010. The survey was conducted in the metropolitan areas of New York-New Jersey (NY-NJ), DC (DC-VA-
MD), Los Angeles (LA), Boston-Lawrence-Providence (MA-RI), Chicago (CHI), and Miami (MIA) among
1000 immigrants over 18 years of age from Mexico, Dominican Republic, El Salvador, Guatemala,
Jamaica, Haiti, Ecuador and Colombia.
Respondents were asked to state where they strongly agree, agree, were indifferent, disagree, or
strongly disagree that they preferred money transfer sender is: a) transparent on its costs, b)
transparent on its exchange rates, c) easy to use, d) inexpensive, and e) its service has more value than
the others. In the scorecard, satisfaction was determined by adding those respondents who agreed or
strongly agreed with each statement.
12
For a discussion of defining urban areas, see: Salvatore, M. et al. “Mapping Global Urban and Rural Population
Distributions.” FAO. 2005. 13
The UN Statistics Division provides information on the population of capital cities and cities of 100,000 and more
inhabitants for the latest available year for the urban population and suburban fringes. 14
World Gazetteer. Data accessed June 10, 2009. http://www.world-gazetteer.com/