Embed Size (px)
Citation preview
A Scenario‐based Forecasting of Multi‐modal Data Traffic
in an n‐Screen Environment
Suk‐Gwon Chang Professor, School of Business,
Hanyang [email protected]
2013. 6. 25
ISF 2013 Conference
2
Contents
1. Problem Definition
2. Literature Review
3. Scenarios for ICT Ecosystem Dynamics
4. ICT Ecosystem Forecasting Problem
5. Data Traffic Forecasting: Case Study
6. Conclusion
3
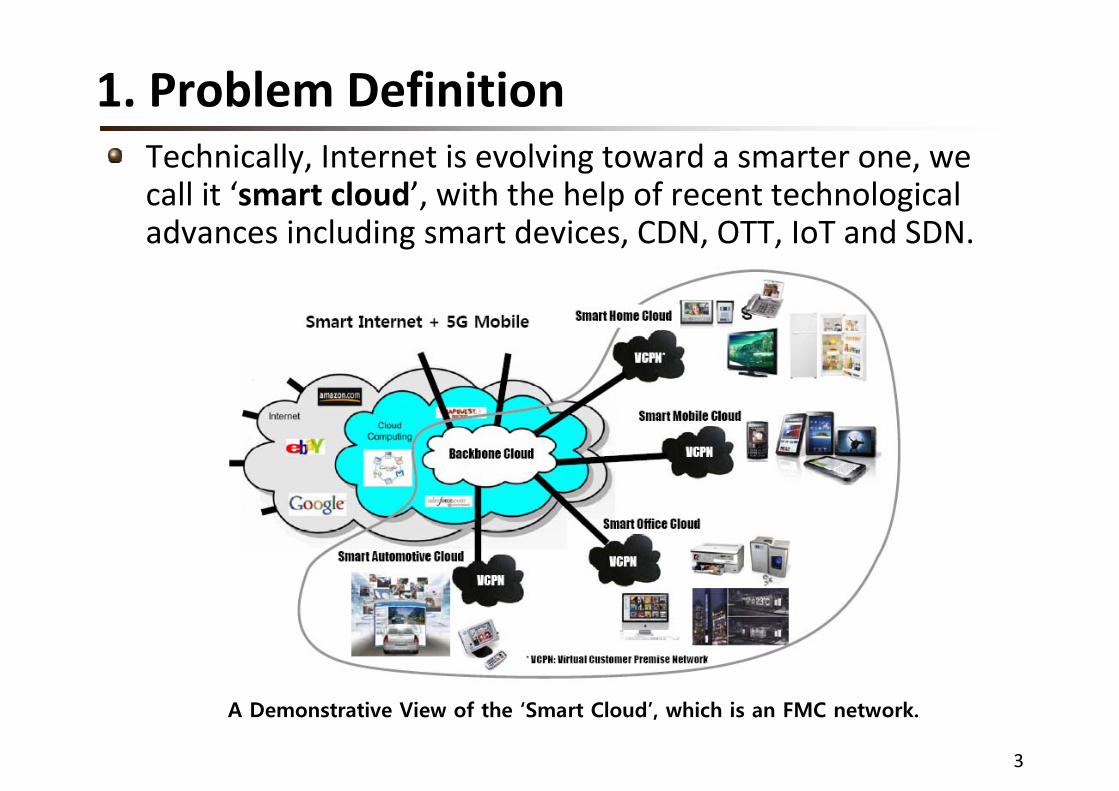
1. Problem DefinitionTechnically, Internet is evolving toward a smarter one, we call it ‘smart cloud’, with the help of recent technological advances including smart devices, CDN, OTT, IoT and SDN.
A Demonstrative View of the ‘Smart Cloud’, which is an FMC network.

4
1. Problem DefinitionN‐screen service is referred to as the one provided across all screens – mobile phone, computer, TV, glass and even car windows – on top of the ‘smart cloud’.
Prospective N-screen Applications

5
1. Problem Definition
N‐Screen Service Model over FMC
* Source: C. Yoon, et al., “Classification of N-Screen Services and Its Standardization,” ICACT2012.

6
1. Problem Definition
Data Traffic Explosion from Smart Applications*Network of Korea as of 2010
C P N TCATV
C P N TIP‐TV
C P N TCable Internet
C P N TTelco Internet
C P N TWireless Internet
TV 15.08 million
TV 3.65 million
PC 3 millionSmart TV 0.01 million
PC 14.2 millionSmart TV 0.04 million
Smart Phone 7.22 millionSmart Pad 0.6 million
Source: S.‐G. Chang, Telecommunications Market Transformation and Network Policy for the Future: Industry Case Studies and Strategic Implications, Research Report 2011‐1, Digital Convergence Research, November 2011.

7
1. Problem Definition
Data Traffic Explosion from Smart Applications*Network Prospects of Korea as of 2015
C P N TCATV
C P N TIP‐TV
C P N TCable Internet
C P N TTelco Internet
C P N TWireless Internet
TV 15 million
TV 7 million
PC 3.49 millionSmart TV 0.95 millionSmart Pad 0.4 million
Smart Phone 2.64 million
PC 16.51 millionSmart TV 3.8 millionSmart Pad 1.59 million
Smart Phone 10.56 million
Smart Phone 26.8 millionSmart TV 0.25 millionSmart Pad 4.02 million
Car 6 millionDominant Network Structure
Source: S.‐G. Chang, Telecommunications Market Transformation and Network Policy for the Future: Industry Case Studies and Strategic Implications, Research Report 2011‐1, Digital Convergence Research, November 2011.
8
1. Problem Definition Problem Recognition
As more smart devices are connected to the network, n‐screen services across three or more screens proliferate, which leads to a fundamental structural change in the ICT ecosystem in a national scale. As more non‐Internet services move into the Internet world, large‐scale complementary, and substitution effects across different services are frequently observed, which are intrinsically interactive and non‐linear.From the nature of the regulated industries, the impacts of eco‐politics and regulatory/promotional policy are still strong, but quite uncertain and often unpredictable.The interests of policy makers and service providers lie not in getting some quantitative, individual forecasts calculated anyhow, but in understanding the underlying overall mechanism of ICT ecosystem behaviors responding to the environmental changes.In this regard, we specify our problem as an “ICT ecosystem forecasting problem,” for which a scenario approach seems to be most suitable.
9
2. Literature ReviewScenario Methodologies
As scenario planning attracts more and more attentions from practice, a bunch of academic researches have been reported until recently. For instance, a special issue of Technological Forecasting and Social Change (Vol. 80, 2013) collected 20 papers which deal with most recent topics of scenario planning. Refer to Wright, Cairns and Bradfield (2013)* for details. Some relevant issues covered in most recent researches on scenario planning include:
Multi‐layer economic scenario analysis: Ehlen and Vargas (2013)Modes of futures thinking and scenario models: Smedt, Borch and Fuller (2013)Scenario discovery: Kwakkel, Auping and Pruyt (2013)Combining the qualitative and quantitative: Varho and Tapio (2013)Structuration approach: MacKay and Tambeau (2013)
* G. Wright, G. Cairns and R. Bradfield, “Scenario Methodology: New Developments in theory and practice - Introduction to the Special Issue,” Technological Forecasting and Social Change 80 (2013), pp. 561-565.
10
2. Literature ReviewScenario Methodologies
Some relevant issues covered in most recent researches on scenario planning include: (continued)
Systemic Foresight Methodology for complex systems: Saritas and Nugroho (2012)Scenario planning for public policy: Volkery and Ribeiro (2009)Scenario planning principles: Wright and Goodwin (2009)Combining scenario analysis with technological forecasting: Wang and Lan(2007), Chatterjee and Gordon (2006) And many others
Researches on Ecosystem Modeling and AnalysisSome recent approaches which deal with the ecosystem analysis include
Multi‐scale modeling of ecosystem service: Castellazzi, et al. (2010)Multi‐hazard, multi‐infra, economic scenario analysis: Ehlen and Vargas (2013)Ecosystem model of technology evolution: Adomavicius, et al (2007)
11
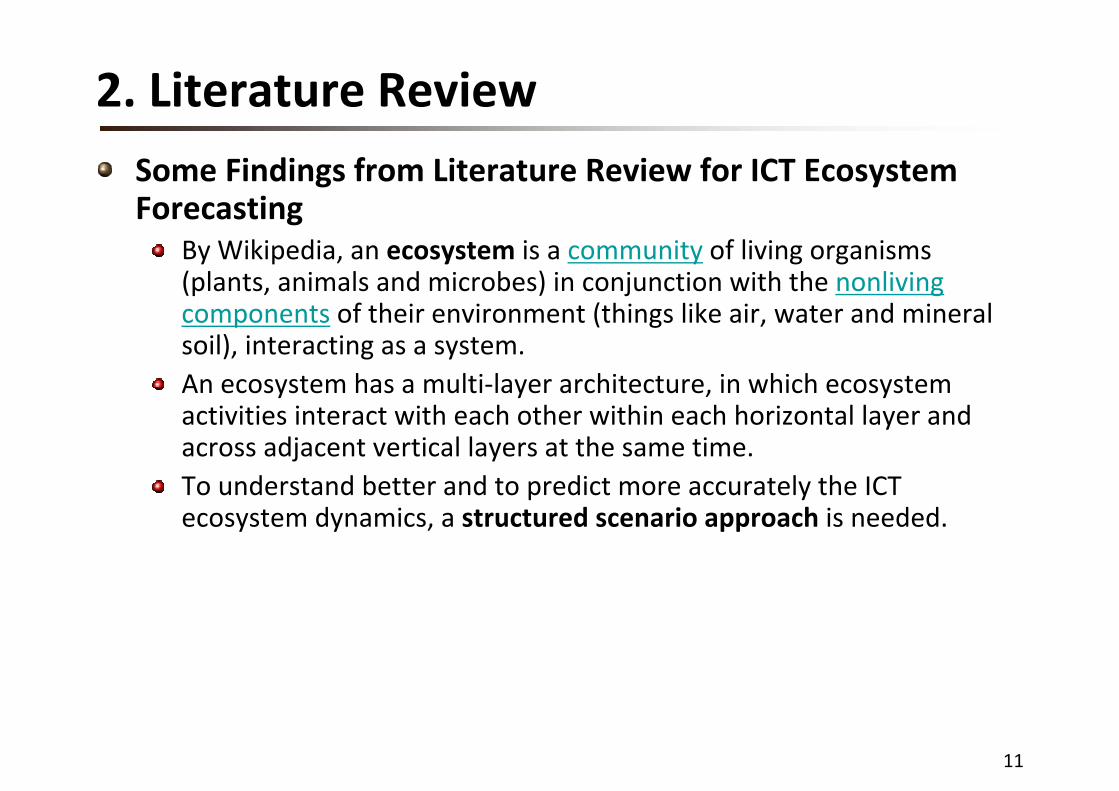
2. Literature ReviewSome Findings from Literature Review for ICT Ecosystem Forecasting
By Wikipedia, an ecosystem is a community of living organisms (plants, animals and microbes) in conjunction with the nonliving components of their environment (things like air, water and mineral soil), interacting as a system. An ecosystem has a multi‐layer architecture, in which ecosystem activities interact with each other within each horizontal layer and across adjacent vertical layers at the same time. To understand better and to predict more accurately the ICT ecosystem dynamics, a structured scenario approach is needed.
12
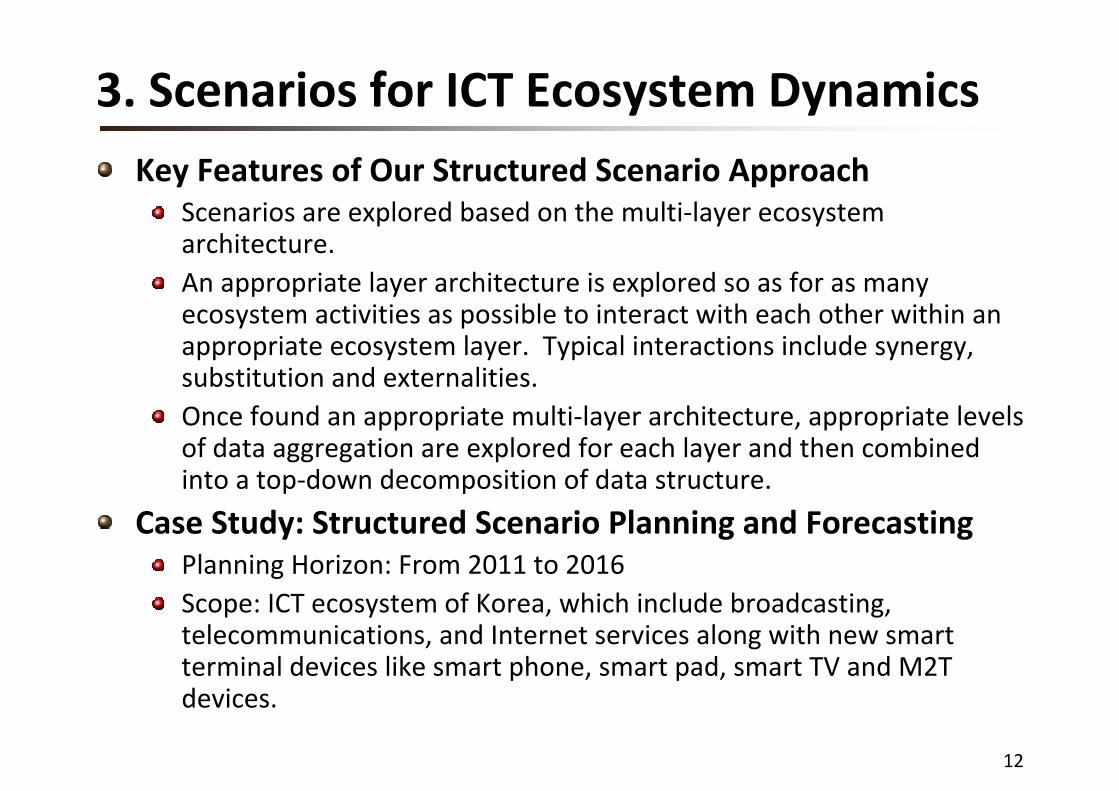
3. Scenarios for ICT Ecosystem DynamicsKey Features of Our Structured Scenario Approach
Scenarios are explored based on the multi‐layer ecosystem architecture. An appropriate layer architecture is explored so as for as many ecosystem activities as possible to interact with each other within an appropriate ecosystem layer. Typical interactions include synergy, substitution and externalities.Once found an appropriate multi‐layer architecture, appropriate levels of data aggregation are explored for each layer and then combined into a top‐down decomposition of data structure.
Case Study: Structured Scenario Planning and ForecastingPlanning Horizon: From 2011 to 2016Scope: ICT ecosystem of Korea, which include broadcasting, telecommunications, and Internet services along with new smart terminal devices like smart phone, smart pad, smart TV and M2T devices.
13
3. Scenarios for ICT Ecosystem Dynamics
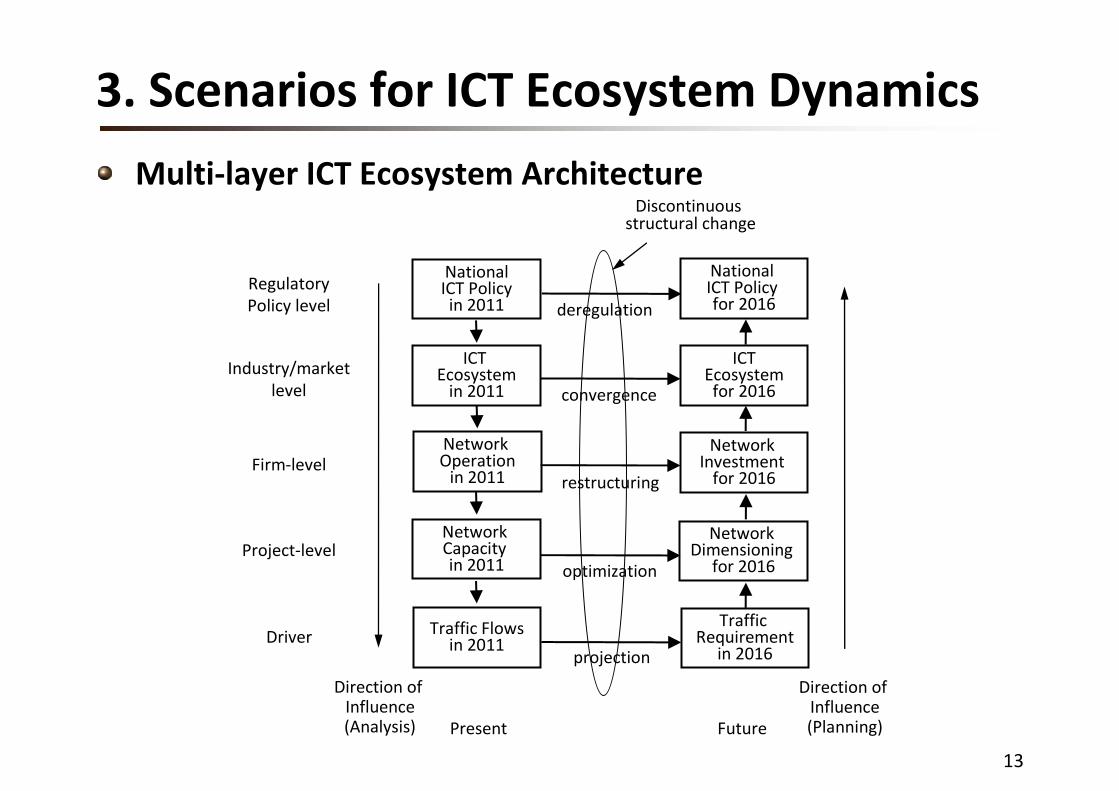
Multi‐layer ICT Ecosystem Architecture
Traffic Flowsin 2011
Traffic Requirement
in 2016
Discontinuous structural change
Network Capacity in 2011
Network Dimensioning
for 2016
Network Operationin 2011
Network Investment for 2016
Driver
Project‐level
Firm‐level
Industry/marketlevel
RegulatoryPolicy level
ICT Ecosystemin 2011
NationalICT Policyin 2011
ICTEcosystemfor 2016
National ICT Policy for 2016deregulation
convergence
restructuring
optimization
projection
Direction of Influence(Analysis)
Direction of Influence(Planning)Present Future

14
3. Scenarios for ICT Ecosystem Dynamics
Network Connection Structure in Industry/Market layer (Focusing on Synergy and Substitution)
PSTN
Fixed/Wireless Internet
Cellular Mobile
Mobile Internet
Terrestrial/Satellite/Cable Net
OTT/InternetVideo
OTT/InternetVideo
mVoIP
MobilityVoIP
PC
Notebook
Smart Pad
Smart Phone
Smart TV
TV Telephone
Mobile Phone
M2M
Old
New
Old
New
15
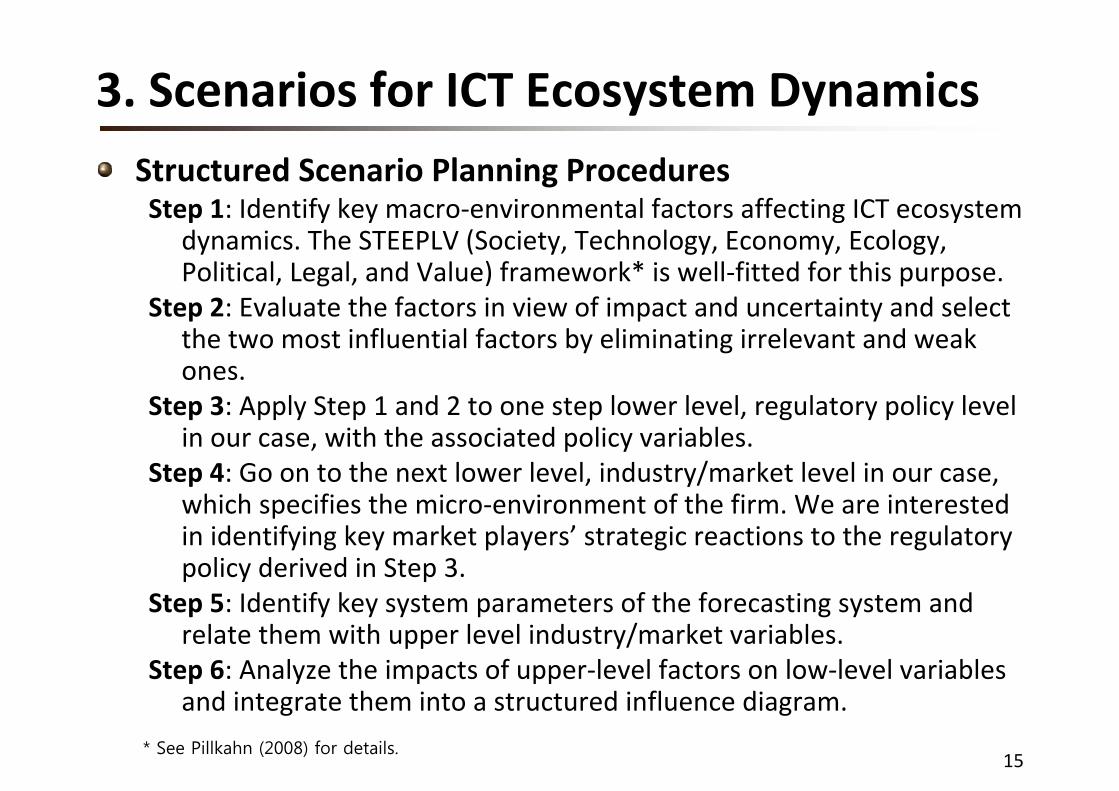
3. Scenarios for ICT Ecosystem DynamicsStructured Scenario Planning ProceduresStep 1: Identify key macro‐environmental factors affecting ICT ecosystem
dynamics. The STEEPLV (Society, Technology, Economy, Ecology, Political, Legal, and Value) framework* is well‐fitted for this purpose.
Step 2: Evaluate the factors in view of impact and uncertainty and select the two most influential factors by eliminating irrelevant and weak ones.
Step 3: Apply Step 1 and 2 to one step lower level, regulatory policy level in our case, with the associated policy variables.
Step 4: Go on to the next lower level, industry/market level in our case, which specifies the micro‐environment of the firm. We are interested in identifying key market players’ strategic reactions to the regulatory policy derived in Step 3.
Step 5: Identify key system parameters of the forecasting system and relate them with upper level industry/market variables.
Step 6: Analyze the impacts of upper‐level factors on low‐level variables and integrate them into a structured influence diagram.
* See Pillkahn (2008) for details.
16
3. Scenarios for ICT Ecosystem Dynamics
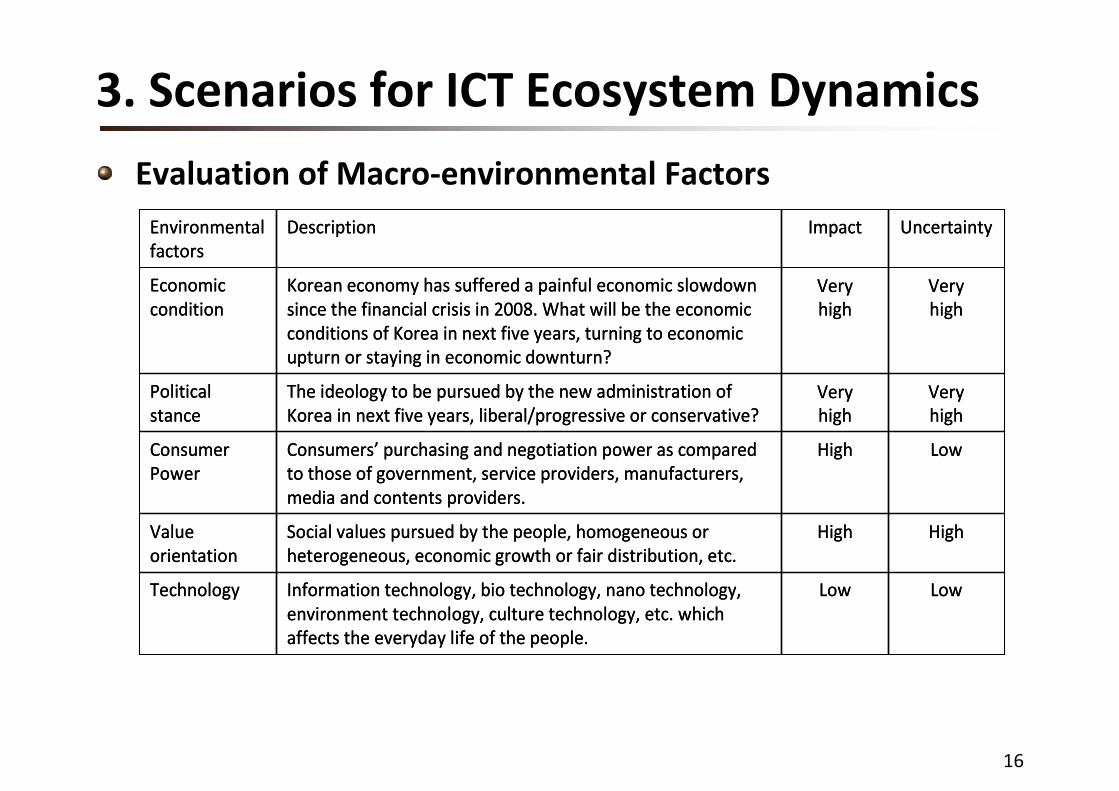
Evaluation of Macro‐environmental Factors
LowLow Information technology, bio technology, nano technology, environment technology, culture technology, etc. which affects the everyday life of the people.
Technology
High HighSocial values pursued by the people, homogeneous or heterogeneous, economic growth or fair distribution, etc.
Value orientation
Low HighConsumers’ purchasing and negotiation power as compared to those of government, service providers, manufacturers, media and contents providers.
Consumer Power
Very high
Very high
The ideology to be pursued by the new administration of Korea in next five years, liberal/progressive or conservative?
Political stance
Very high
Very high
Korean economy has suffered a painful economic slowdown since the financial crisis in 2008. What will be the economic conditions of Korea in next five years, turning to economic upturn or staying in economic downturn?
Economic condition
UncertaintyImpact DescriptionEnvironmental factors
17
3. Scenarios for ICT Ecosystem Dynamics
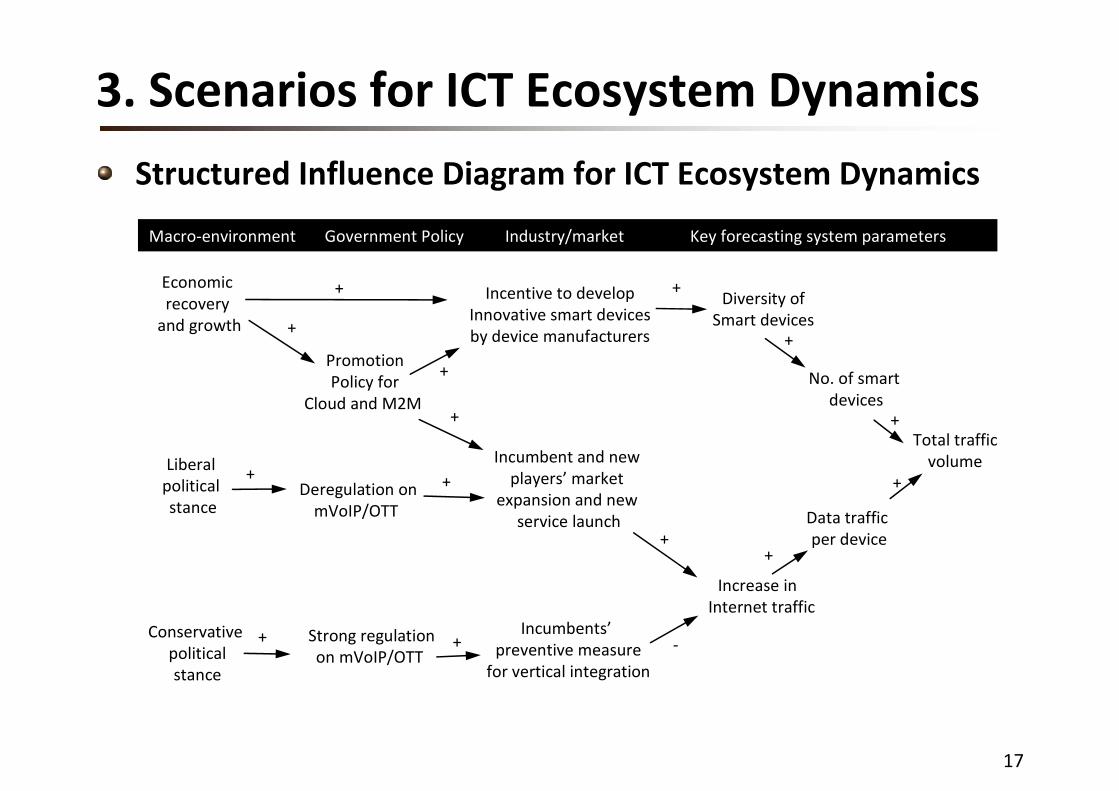
Structured Influence Diagram for ICT Ecosystem Dynamics
Diversity ofSmart devices
Increase in Internet traffic
PromotionPolicy for
Cloud and M2M
Deregulation onmVoIP/OTT
Incumbents’preventive measurefor vertical integration
Incumbent and new players’ market
expansion and new service launch
Incentive to developInnovative smart devicesby device manufacturers
Data traffic per device
+
+
+
+
‐
No. of smart devices
+Economic recovery and growth
+
+
Total trafficvolume
Macro‐environment Government Policy Industry/market Key forecasting system parameters
+
Liberal political stance
Conservative politicalstance
Strong regulationon mVoIP/OTT
+
+
+
+
+
+
18
3. Scenarios for ICT Ecosystem Dynamics
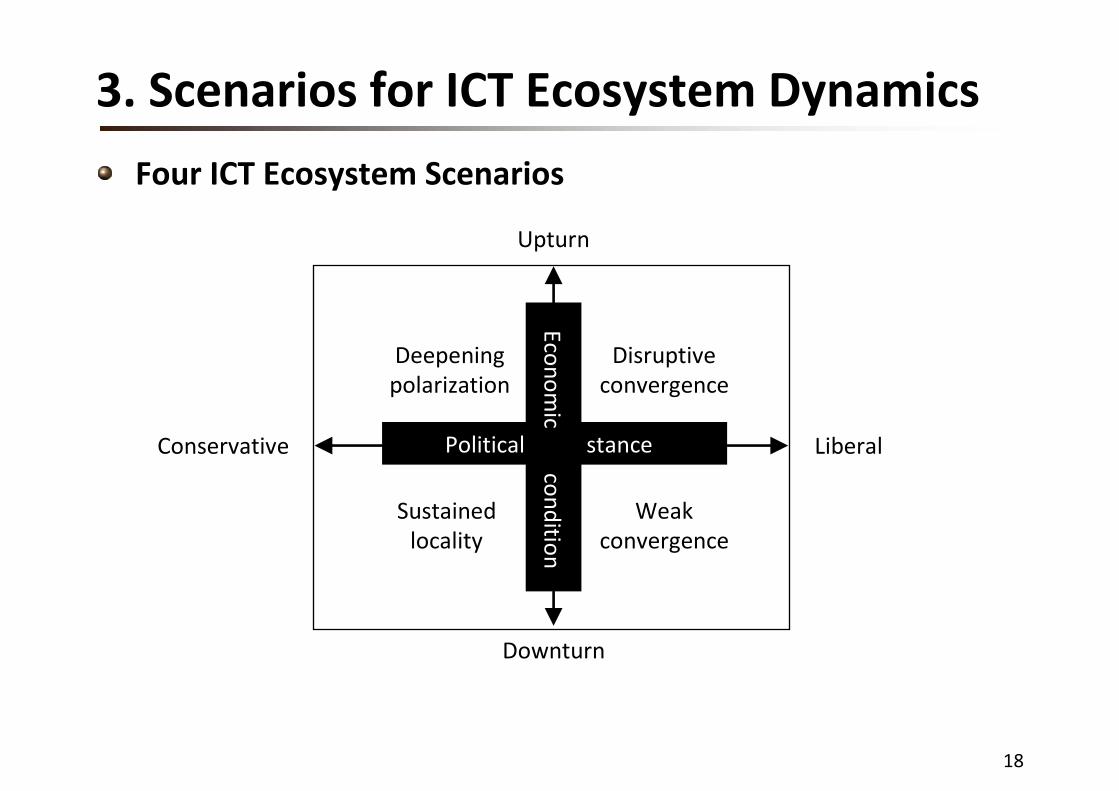
Four ICT Ecosystem Scenarios
Upturn
Downturn
Conservative Liberal
Disruptiveconvergence
Sustained locality
Weakconvergence
Deepeningpolarization
Political stance
Economic condition
19
3. Scenarios for ICT Ecosystem Dynamics
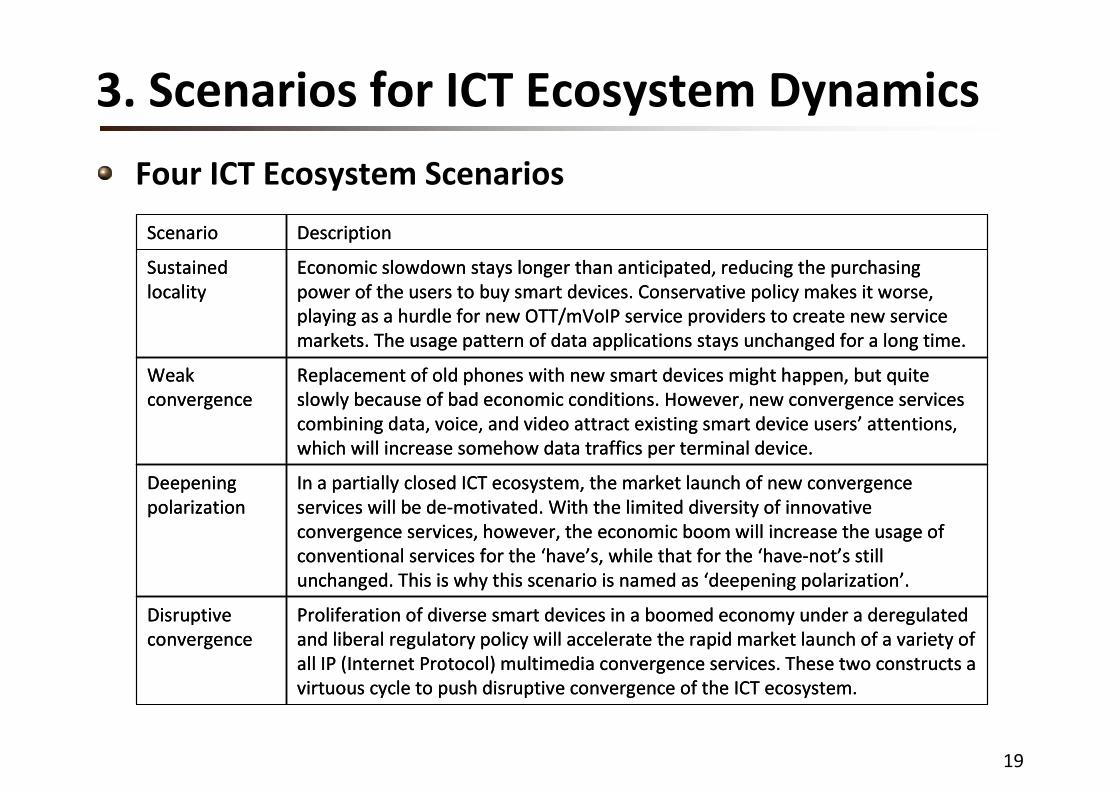
Four ICT Ecosystem Scenarios
Proliferation of diverse smart devices in a boomed economy under a deregulated and liberal regulatory policy will accelerate the rapid market launch of a variety of all IP (Internet Protocol) multimedia convergence services. These two constructs a virtuous cycle to push disruptive convergence of the ICT ecosystem.
Disruptive convergence
In a partially closed ICT ecosystem, the market launch of new convergence services will be de‐motivated. With the limited diversity of innovative convergence services, however, the economic boom will increase the usage of conventional services for the ‘have’s, while that for the ‘have‐not’s still unchanged. This is why this scenario is named as ‘deepening polarization’.
Deepening polarization
Replacement of old phones with new smart devices might happen, but quite slowly because of bad economic conditions. However, new convergence services combining data, voice, and video attract existing smart device users’ attentions, which will increase somehow data traffics per terminal device.
Weak convergence
Economic slowdown stays longer than anticipated, reducing the purchasing power of the users to buy smart devices. Conservative policy makes it worse, playing as a hurdle for new OTT/mVoIP service providers to create new service markets. The usage pattern of data applications stays unchanged for a long time.
Sustained locality
DescriptionScenario
20
4. ICT Ecosystem Forecasting Problem
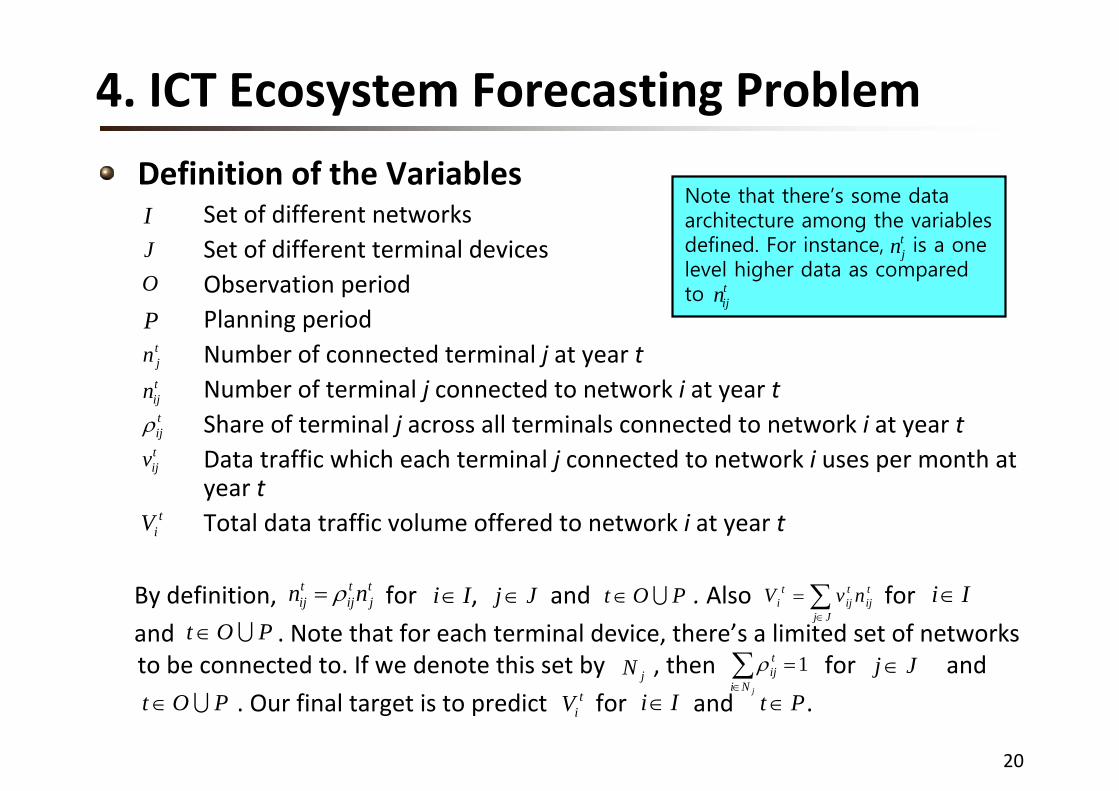
Definition of the VariablesSet of different networks Set of different terminal devicesObservation periodPlanning periodNumber of connected terminal j at year tNumber of terminal j connected to network i at year tShare of terminal j across all terminals connected to network i at year tData traffic which each terminal j connected to network i uses per month at year tTotal data traffic volume offered to network i at year t
By definition, for , and . Also for
and . Note that for each terminal device, there’s a limited set of networks to be connected to. If we denote this set by , then for and
. Our final target is to predict for and .
IJO
Ptjntijntijρtijv
tiV
tj
tij
tij nn ρ= Ii∈ Jj∈ POt U∈ t
ijJj
tij
ti nvV ∑
∈
= Ii∈POt U∈
jN 1=∑∈ jNi
tijρ Jj∈
POt U∈ tiV Ii∈ Pt∈
Note that there’s some data architecture among the variables defined. For instance, is a one level higher data as compared to
tjn
tijn
21
4. ICT Ecosystem Forecasting Problem
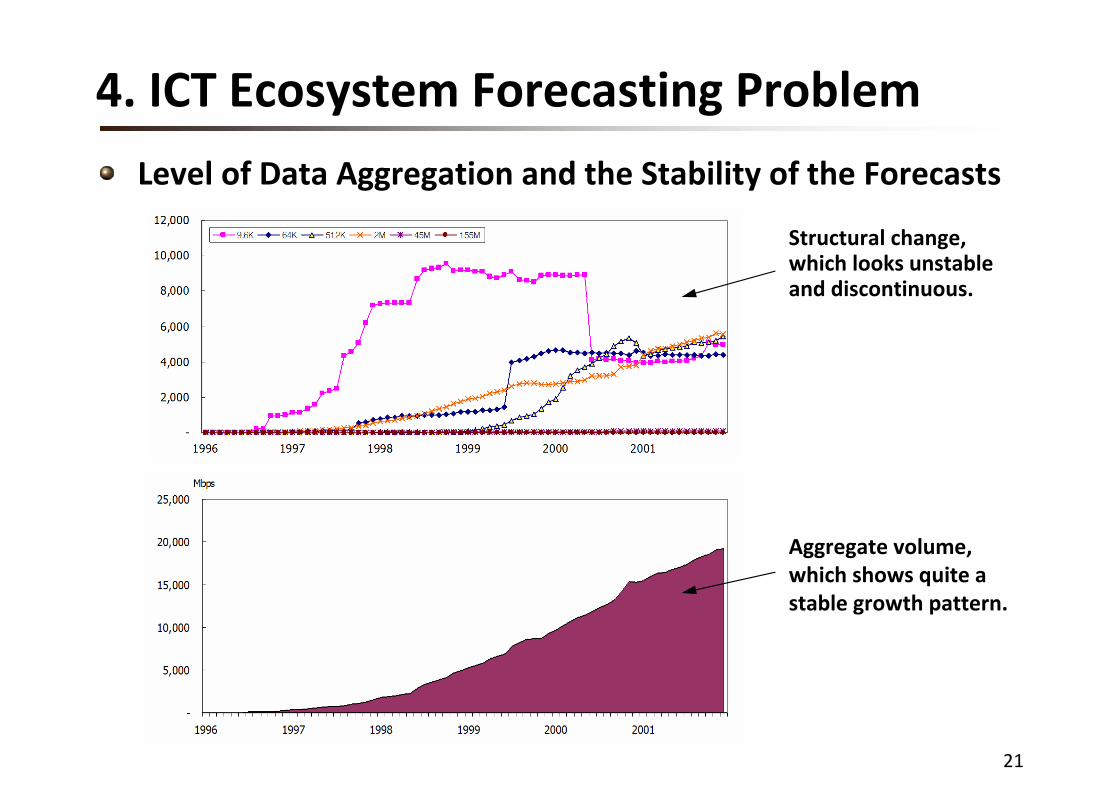
Level of Data Aggregation and the Stability of the Forecasts
Structural change, which looks unstableand discontinuous.
Aggregate volume,which shows quite astable growth pattern.

22
4. ICT Ecosystem Forecasting Problem
Level of Data Aggregation and the Stability of the Forecasts
Structural change, which looks unstableand discontinuous.
Aggregate volume,which shows quite astable growth pattern.
Proposition 1: When there are substitution, complementarities, synergy and network externality effects among individual variables, we can find an aggregate of them, which shows more stable change pattern, thus more predictable. This is also the case when there are some discontinuous structural changes in individual variables.
Proposition 1: When there are substitution, complementarities, synergy and network externality effects among individual variables, we can find an aggregate of them, which shows more stable change pattern, thus more predictable. This is also the case when there are some discontinuous structural changes in individual variables.
23
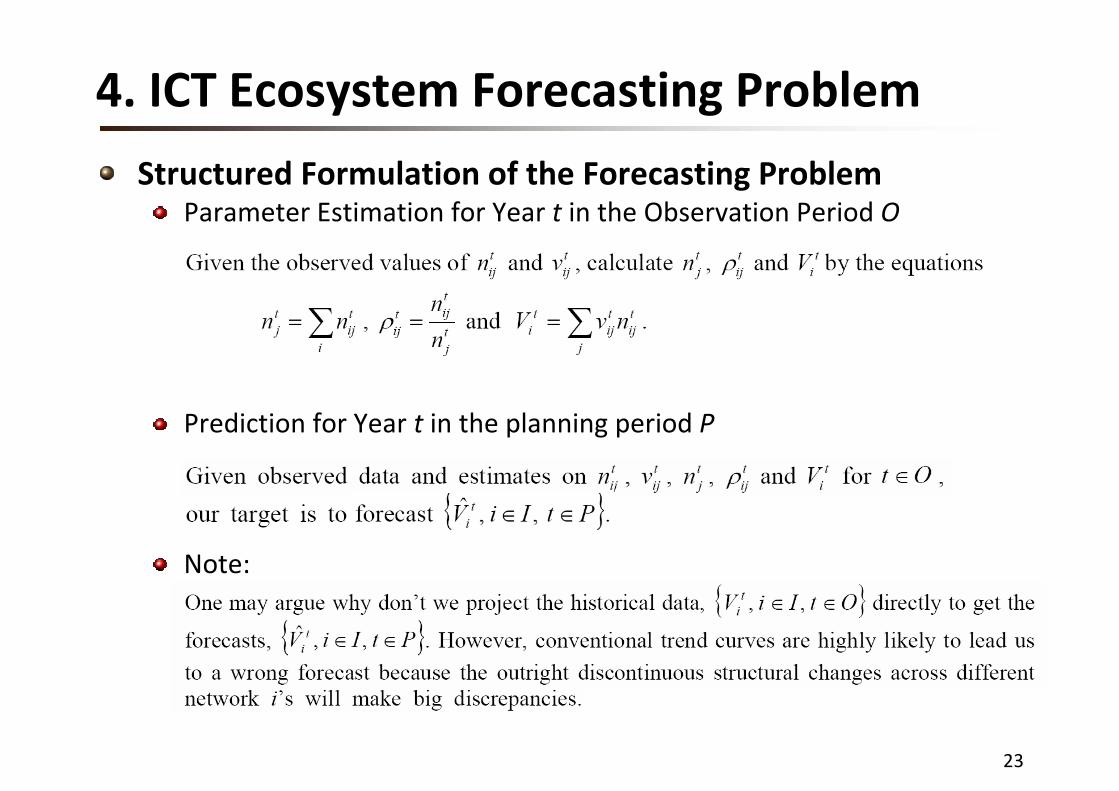
Structured Formulation of the Forecasting Problem Parameter Estimation for Year t in the Observation Period O
Prediction for Year t in the planning period P
Note:
4. ICT Ecosystem Forecasting Problem
24
4. ICT Ecosystem Forecasting Problem
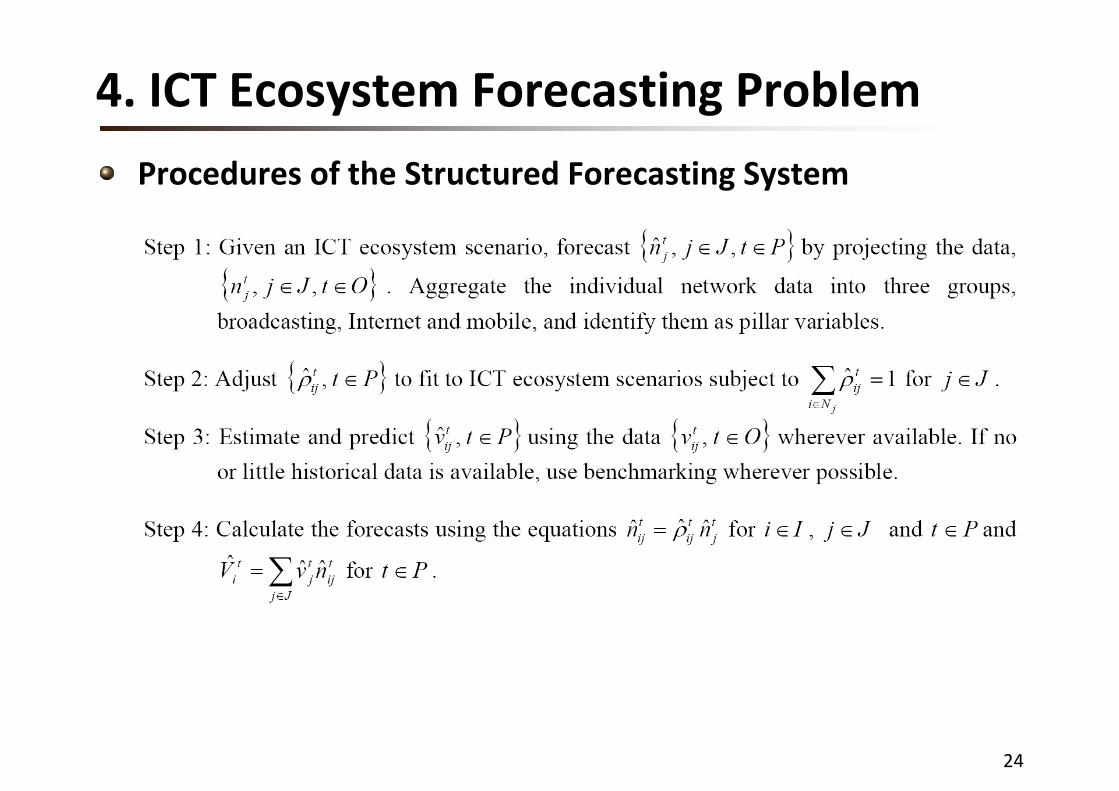
Procedures of the Structured Forecasting System
25
5. Data Traffic Forecasting: Case Study
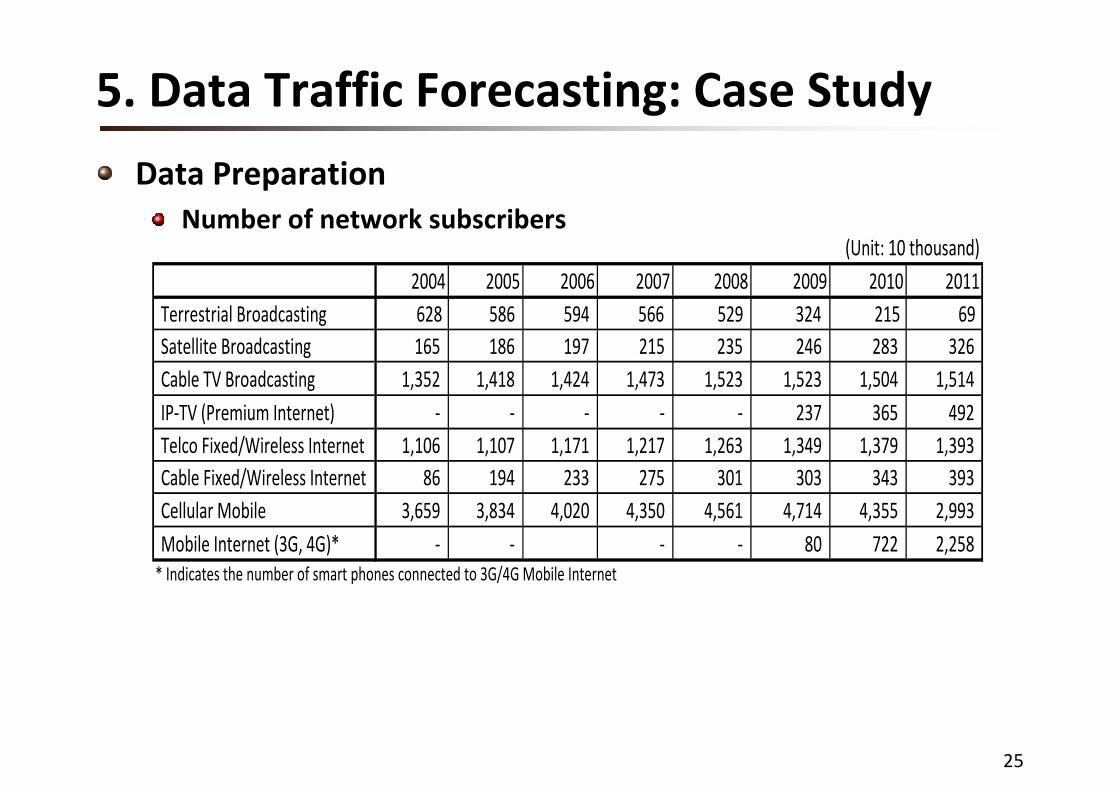
Data PreparationNumber of network subscribers
(Unit: 10 thousand)2004 2005 2006 2007 2008 2009 2010 2011
Terrestrial Broadcasting 628 586 594 566 529 324 215 69Satellite Broadcasting 165 186 197 215 235 246 283 326 Cable TV Broadcasting 1,352 1,418 1,424 1,473 1,523 1,523 1,504 1,514 IP‐TV (Premium Internet) ‐ ‐ ‐ ‐ ‐ 237 365 492 Telco Fixed/Wireless Internet 1,106 1,107 1,171 1,217 1,263 1,349 1,379 1,393 Cable Fixed/Wireless Internet 86 194 233 275 301 303 343 393 Cellular Mobile 3,659 3,834 4,020 4,350 4,561 4,714 4,355 2,993 Mobile Internet (3G, 4G)* ‐ ‐ ‐ ‐ 80 722 2,258 * Indicates the number of smart phones connected to 3G/4G Mobile Internet
26
5. Data Traffic Forecasting: Case Study
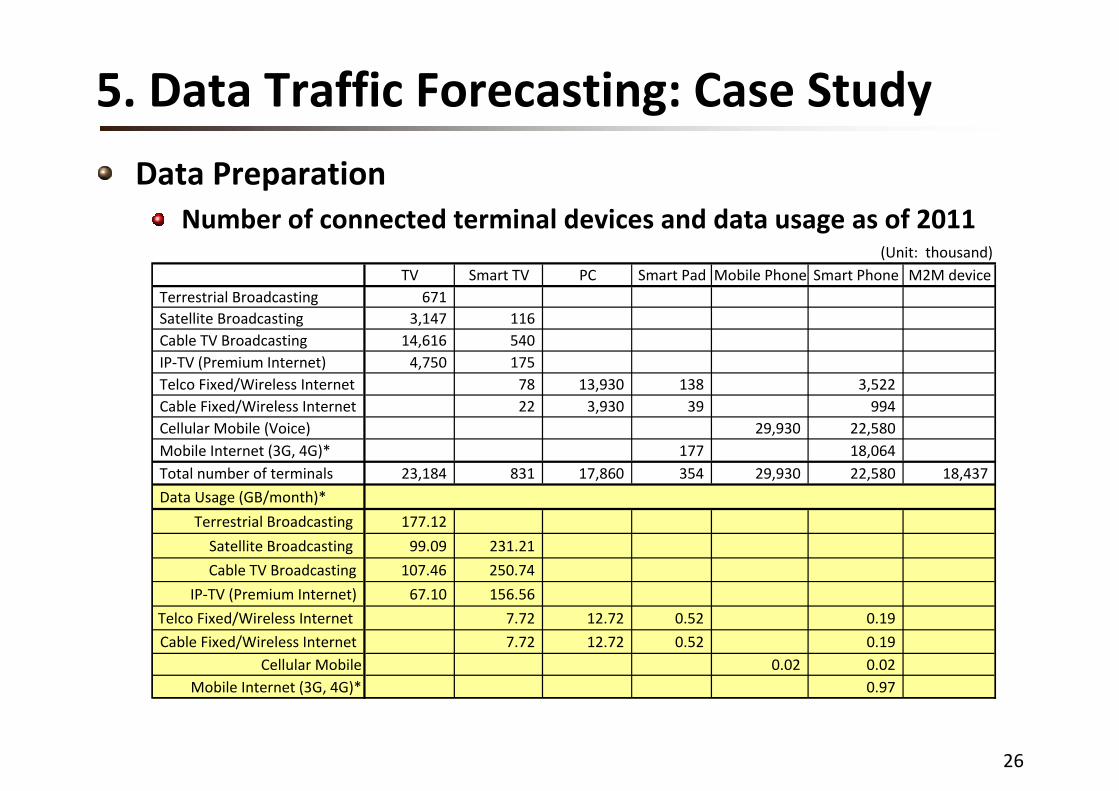
Data PreparationNumber of connected terminal devices and data usage as of 2011
(Unit: thousand)TV Smart TV PC Smart Pad Mobile Phone Smart Phone M2M device
Terrestrial Broadcasting 671Satellite Broadcasting 3,147 116Cable TV Broadcasting 14,616 540IP‐TV (Premium Internet) 4,750 175Telco Fixed/Wireless Internet 78 13,930 138 3,522Cable Fixed/Wireless Internet 22 3,930 39 994Cellular Mobile (Voice) 29,930 22,580Mobile Internet (3G, 4G)* 177 18,064Total number of terminals 23,184 831 17,860 354 29,930 22,580 18,437
Data Usage (GB/month)*
Terrestrial Broadcasting 177.12
Satellite Broadcasting 99.09 231.21
Cable TV Broadcasting 107.46 250.74
IP‐TV (Premium Internet) 67.10 156.56
Telco Fixed/Wireless Internet 7.72 12.72 0.52 0.19
Cable Fixed/Wireless Internet 7.72 12.72 0.52 0.19Cellular Mobile 0.02 0.02
Mobile Internet (3G, 4G)* 0.97
27
5. Data Traffic Forecasting: Case Study
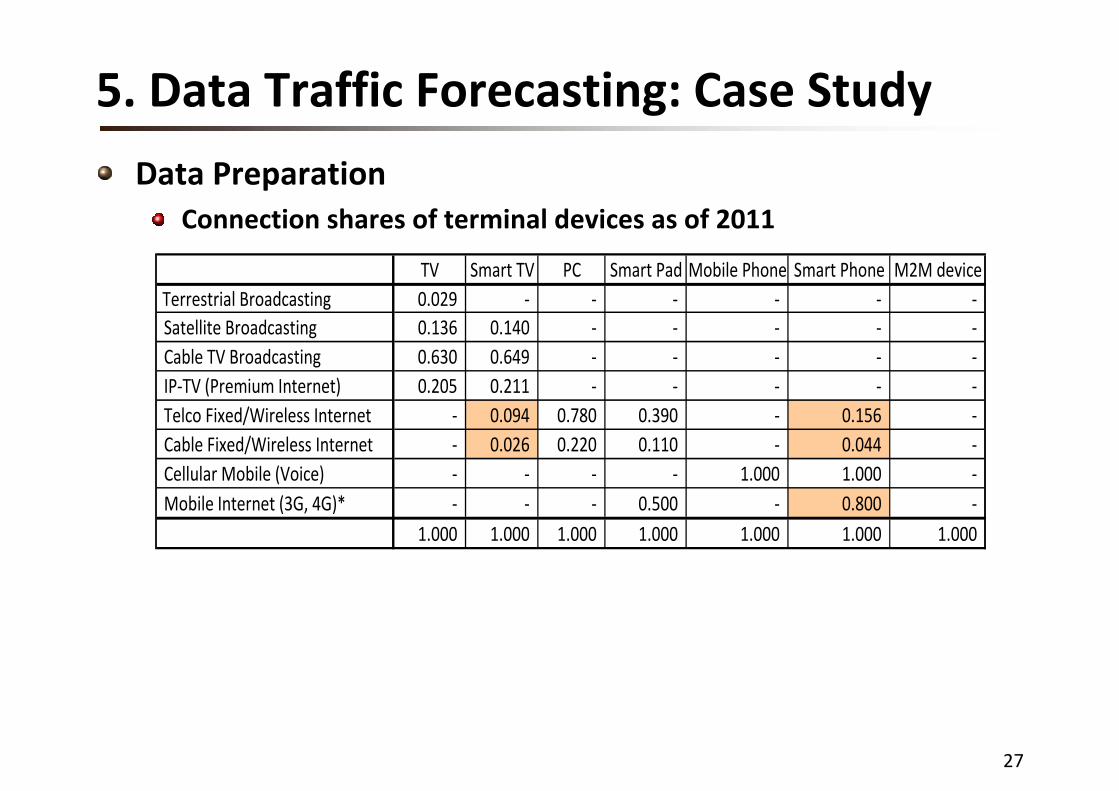
Data PreparationConnection shares of terminal devices as of 2011
TV Smart TV PC Smart Pad Mobile Phone Smart Phone M2M device Terrestrial Broadcasting 0.029 ‐ ‐ ‐ ‐ ‐ ‐ Satellite Broadcasting 0.136 0.140 ‐ ‐ ‐ ‐ ‐ Cable TV Broadcasting 0.630 0.649 ‐ ‐ ‐ ‐ ‐ IP‐TV (Premium Internet) 0.205 0.211 ‐ ‐ ‐ ‐ ‐ Telco Fixed/Wireless Internet ‐ 0.094 0.780 0.390 ‐ 0.156 ‐ Cable Fixed/Wireless Internet ‐ 0.026 0.220 0.110 ‐ 0.044 ‐ Cellular Mobile (Voice) ‐ ‐ ‐ ‐ 1.000 1.000 ‐ Mobile Internet (3G, 4G)* ‐ ‐ ‐ 0.500 ‐ 0.800 ‐
1.000 1.000 1.000 1.000 1.000 1.000 1.000
28
5. Data Traffic Forecasting: Case Study
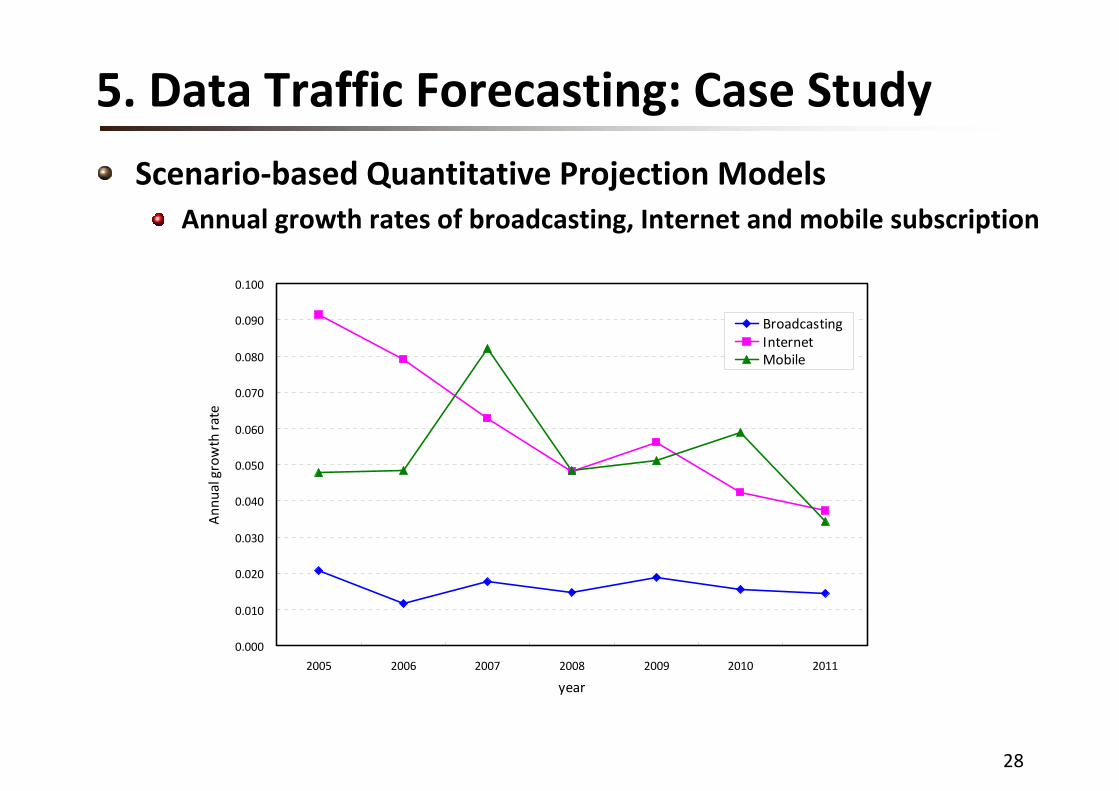
Scenario‐based Quantitative Projection ModelsAnnual growth rates of broadcasting, Internet and mobile subscription
0.000
0.010
0.020
0.030
0.040
0.050
0.060
0.070
0.080
0.090
0.100
2005 2006 2007 2008 2009 2010 2011
year
Ann
ual growth rate
Broadcasting Internet Mobile
29
5. Data Traffic Forecasting: Case Study
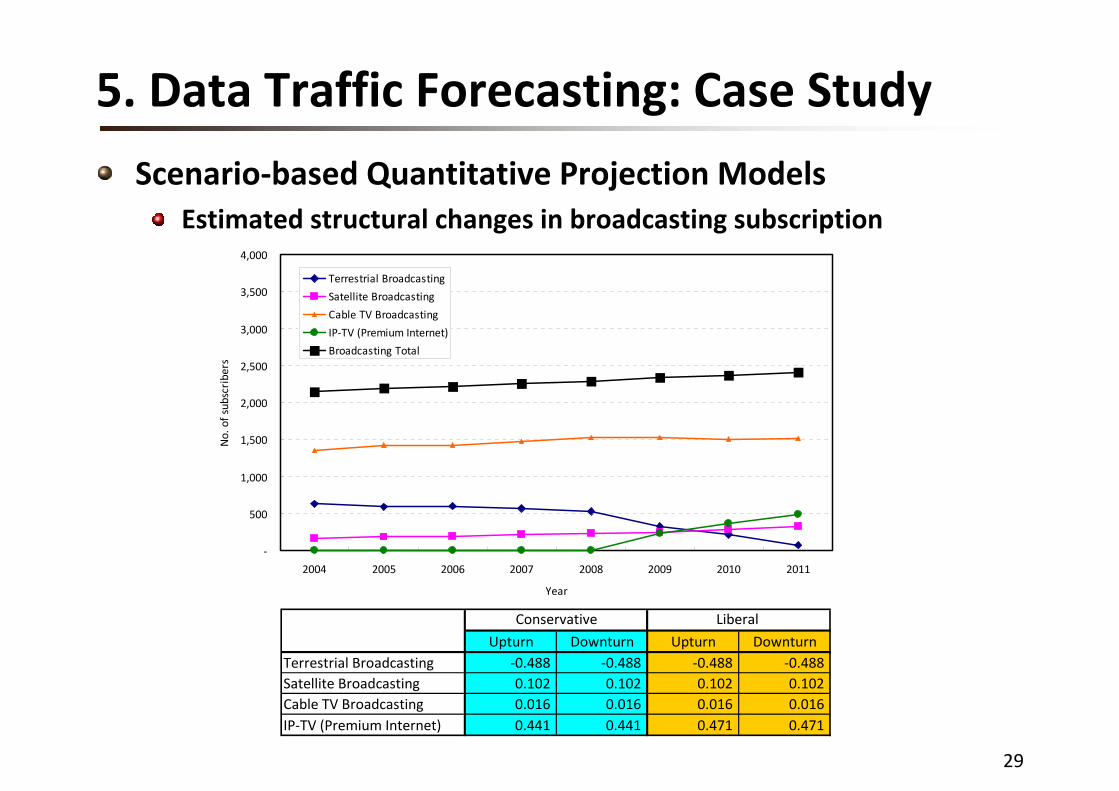
Scenario‐based Quantitative Projection ModelsEstimated structural changes in broadcasting subscription
‐
500
1,000
1,500
2,000
2,500
3,000
3,500
4,000
2004 2005 2006 2007 2008 2009 2010 2011
Year
No. of subscribers
Terrestrial Broadcasting
Satellite Broadcasting
Cable TV Broadcasting
IP‐TV (Premium Internet)
Broadcasting Total
Upturn Downturn Upturn DownturnTerrestrial Broadcasting ‐0.488 ‐0.488 ‐0.488 ‐0.488Satellite Broadcasting 0.102 0.102 0.102 0.102Cable TV Broadcasting 0.016 0.016 0.016 0.016IP‐TV (Premium Internet) 0.441 0.441 0.471 0.471
Conservative Liberal
30
5. Data Traffic Forecasting: Case Study
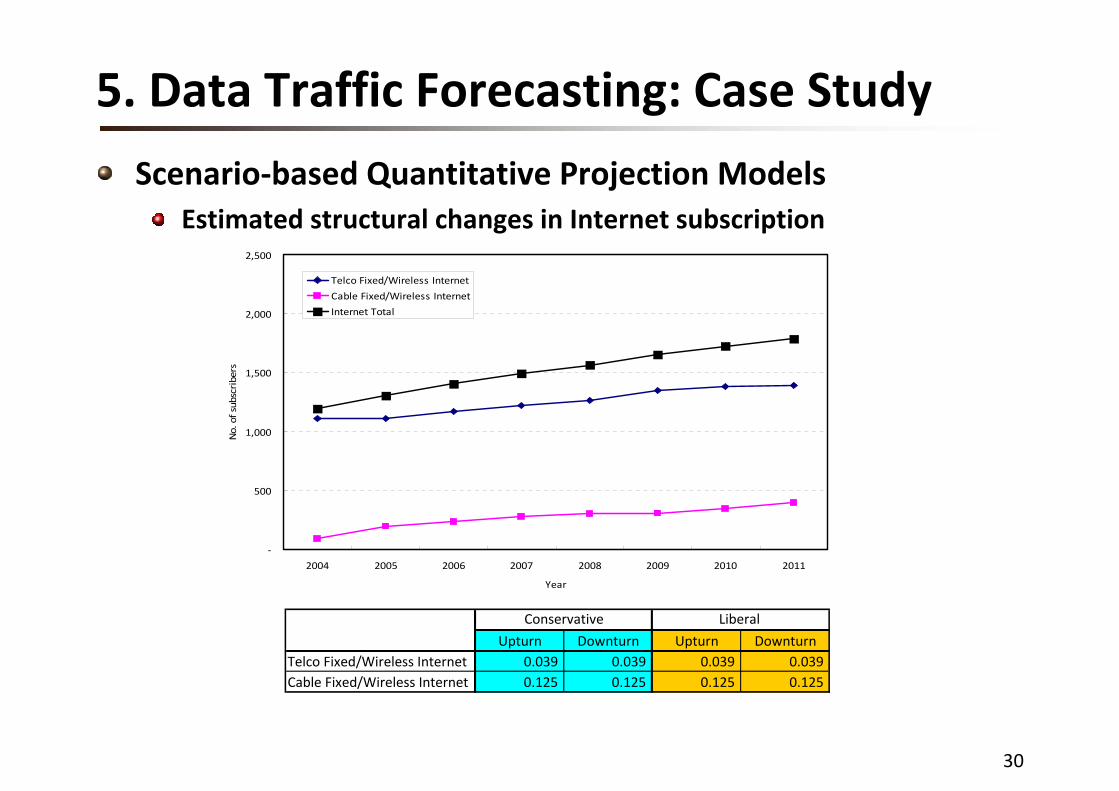
Scenario‐based Quantitative Projection ModelsEstimated structural changes in Internet subscription
‐
500
1,000
1,500
2,000
2,500
2004 2005 2006 2007 2008 2009 2010 2011
Year
No. of subscribers
Telco Fixed/Wireless Internet
Cable Fixed/Wireless Internet
Internet Total
Upturn Downturn Upturn DownturnTelco Fixed/Wireless Internet 0.039 0.039 0.039 0.039Cable Fixed/Wireless Internet 0.125 0.125 0.125 0.125
Conservative Liberal

31
5. Data Traffic Forecasting: Case Study
Scenario‐based Quantitative Projection ModelsEstimated structural changes in mobile subscription
‐
1,000
2,000
3,000
4,000
5,000
6,000
2004 2005 2006 2007 2008 2009 2010 2011
Year
No. of s
ubscribe
rs
Cellular Mobile
Mobile Internet (3G, 4G)*
Mobile Total
32
5. Data Traffic Forecasting: Case Study
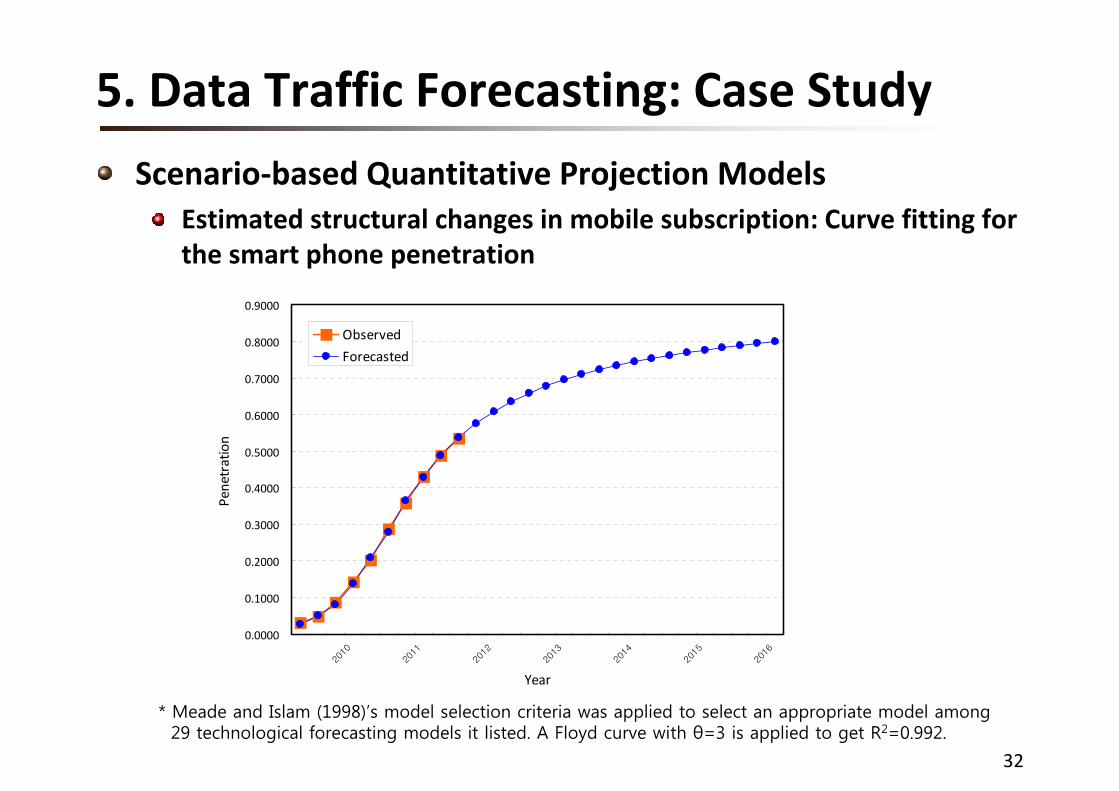
Scenario‐based Quantitative Projection ModelsEstimated structural changes in mobile subscription: Curve fitting for the smart phone penetration
0.0000
0.1000
0.2000
0.3000
0.4000
0.5000
0.6000
0.7000
0.8000
0.9000
2010
2011
2012
2013
2014
2015
2016
Year
Penetration
Observed
Forecasted
* Meade and Islam (1998)’s model selection criteria was applied to select an appropriate model among 29 technological forecasting models it listed. A Floyd curve with θ=3 is applied to get R2=0.992.
33
5. Data Traffic Forecasting: Case Study
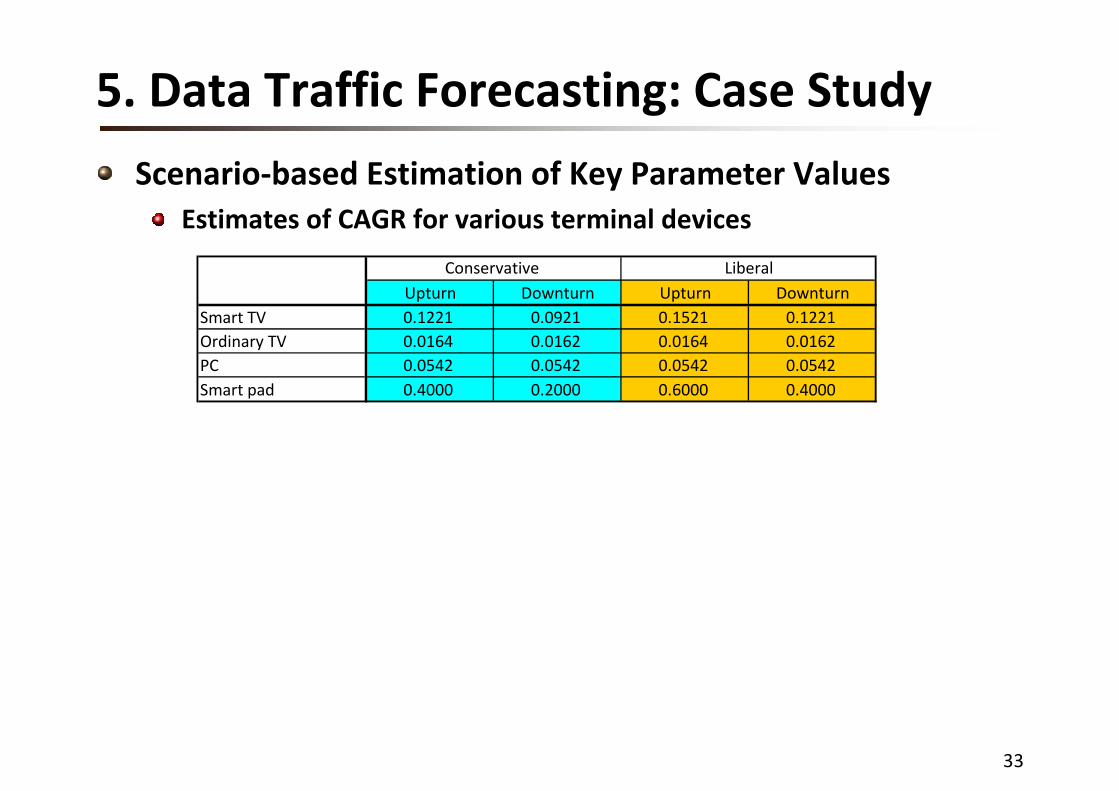
Scenario‐based Estimation of Key Parameter ValuesEstimates of CAGR for various terminal devices
Upturn Downturn Upturn DownturnSmart TV 0.1221 0.0921 0.1521 0.1221Ordinary TV 0.0164 0.0162 0.0164 0.0162PC 0.0542 0.0542 0.0542 0.0542Smart pad 0.4000 0.2000 0.6000 0.4000
Conservative Liberal
34
5. Data Traffic Forecasting: Case Study
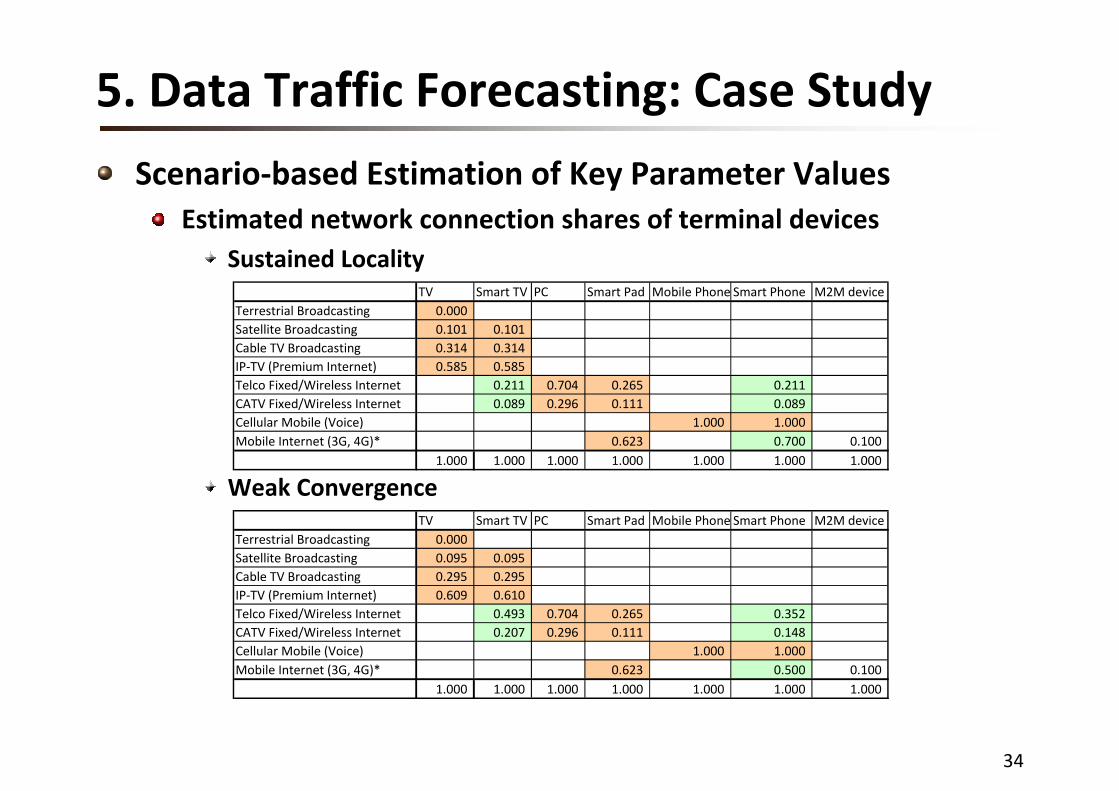
Scenario‐based Estimation of Key Parameter ValuesEstimated network connection shares of terminal devices
Sustained Locality
Weak Convergence
TV Smart TV PC Smart Pad Mobile Phone Smart Phone M2M deviceTerrestrial Broadcasting 0.000 Satellite Broadcasting 0.101 0.101 Cable TV Broadcasting 0.314 0.314 IP‐TV (Premium Internet) 0.585 0.585 Telco Fixed/Wireless Internet 0.211 0.704 0.265 0.211 CATV Fixed/Wireless Internet 0.089 0.296 0.111 0.089 Cellular Mobile (Voice) 1.000 1.000 Mobile Internet (3G, 4G)* 0.623 0.700 0.100
1.000 1.000 1.000 1.000 1.000 1.000 1.000
TV Smart TV PC Smart Pad Mobile Phone Smart Phone M2M deviceTerrestrial Broadcasting 0.000 Satellite Broadcasting 0.095 0.095 Cable TV Broadcasting 0.295 0.295 IP‐TV (Premium Internet) 0.609 0.610 Telco Fixed/Wireless Internet 0.493 0.704 0.265 0.352 CATV Fixed/Wireless Internet 0.207 0.296 0.111 0.148 Cellular Mobile (Voice) 1.000 1.000 Mobile Internet (3G, 4G)* 0.623 0.500 0.100
1.000 1.000 1.000 1.000 1.000 1.000 1.000

35
5. Data Traffic Forecasting: Case Study
Scenario‐based Estimation of Key Parameter ValuesEstimated network connection shares of terminal devices
Deepening Polarization
Disruptive Convergence
TV Smart TV PC Smart Pad Mobile Phone Smart Phone M2M deviceTerrestrial Broadcasting 0.000 Satellite Broadcasting 0.101 0.101 Cable TV Broadcasting 0.314 0.314 IP‐TV (Premium Internet) 0.585 0.585 Telco Fixed/Wireless Internet 0.211 0.704 0.254 0.211 CATV Fixed/Wireless Internet 0.089 0.296 0.107 0.089 Cellular Mobile (Voice) 1.000 1.000 Mobile Internet (3G, 4G)* 0.639 0.700 0.200
1.000 1.000 1.000 1.000 1.000 1.000 1.000
TV Smart TV PC Smart Pad Mobile Phone Smart Phone M2M deviceTerrestrial Broadcasting 0.000 Satellite Broadcasting 0.095 0.095 Cable TV Broadcasting 0.295 0.295 IP‐TV (Premium Internet) 0.609 0.610 Telco Fixed/Wireless Internet 0.493 0.704 0.254 0.352 CATV Fixed/Wireless Internet 0.207 0.296 0.107 0.148 Cellular Mobile (Voice) 1.000 1.000 Mobile Internet (3G, 4G)* 0.639 0.500 0.200
1.000 1.000 1.000 1.000 1.000 1.000 1.000
36
5. Data Traffic Forecasting: Case Study
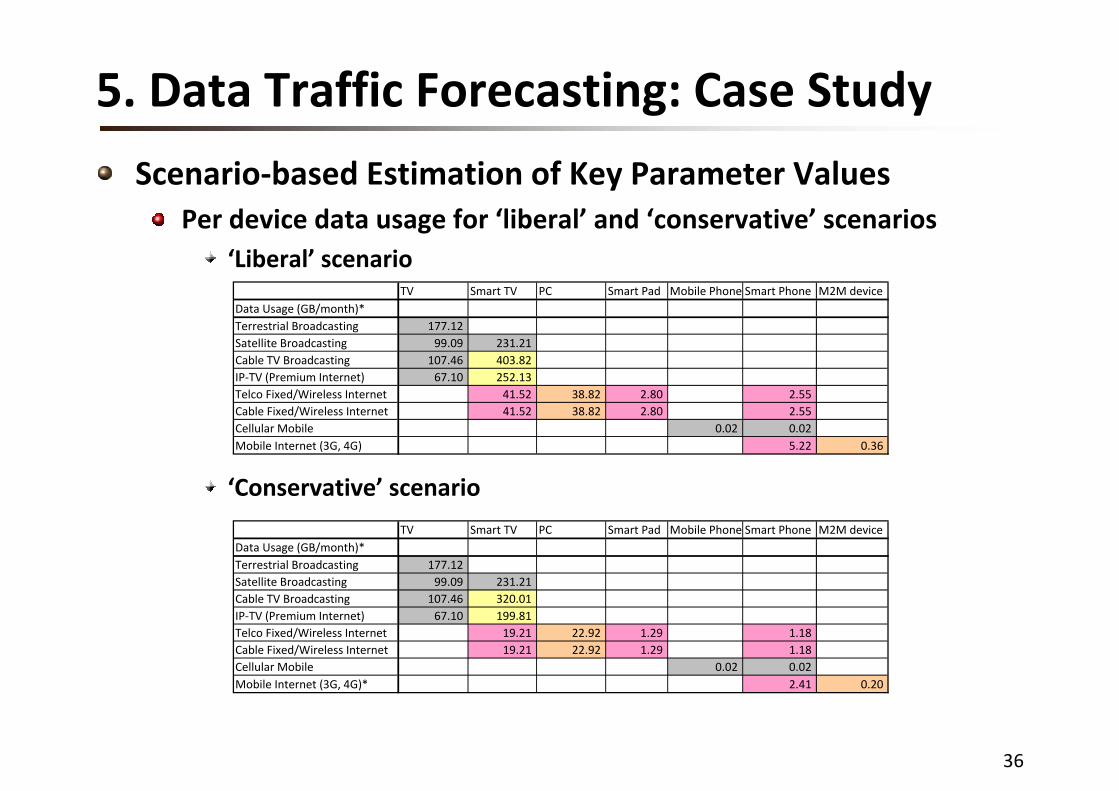
Scenario‐based Estimation of Key Parameter ValuesPer device data usage for ‘liberal’ and ‘conservative’ scenarios
‘Liberal’ scenario
‘Conservative’ scenario
TV Smart TV PC Smart Pad Mobile Phone Smart Phone M2M deviceData Usage (GB/month)*Terrestrial Broadcasting 177.12Satellite Broadcasting 99.09 231.21Cable TV Broadcasting 107.46 403.82IP‐TV (Premium Internet) 67.10 252.13Telco Fixed/Wireless Internet 41.52 38.82 2.80 2.55Cable Fixed/Wireless Internet 41.52 38.82 2.80 2.55Cellular Mobile 0.02 0.02Mobile Internet (3G, 4G) 5.22 0.36
TV Smart TV PC Smart Pad Mobile Phone Smart Phone M2M deviceData Usage (GB/month)*Terrestrial Broadcasting 177.12Satellite Broadcasting 99.09 231.21Cable TV Broadcasting 107.46 320.01IP‐TV (Premium Internet) 67.10 199.81Telco Fixed/Wireless Internet 19.21 22.92 1.29 1.18Cable Fixed/Wireless Internet 19.21 22.92 1.29 1.18Cellular Mobile 0.02 0.02Mobile Internet (3G, 4G)* 2.41 0.20
37
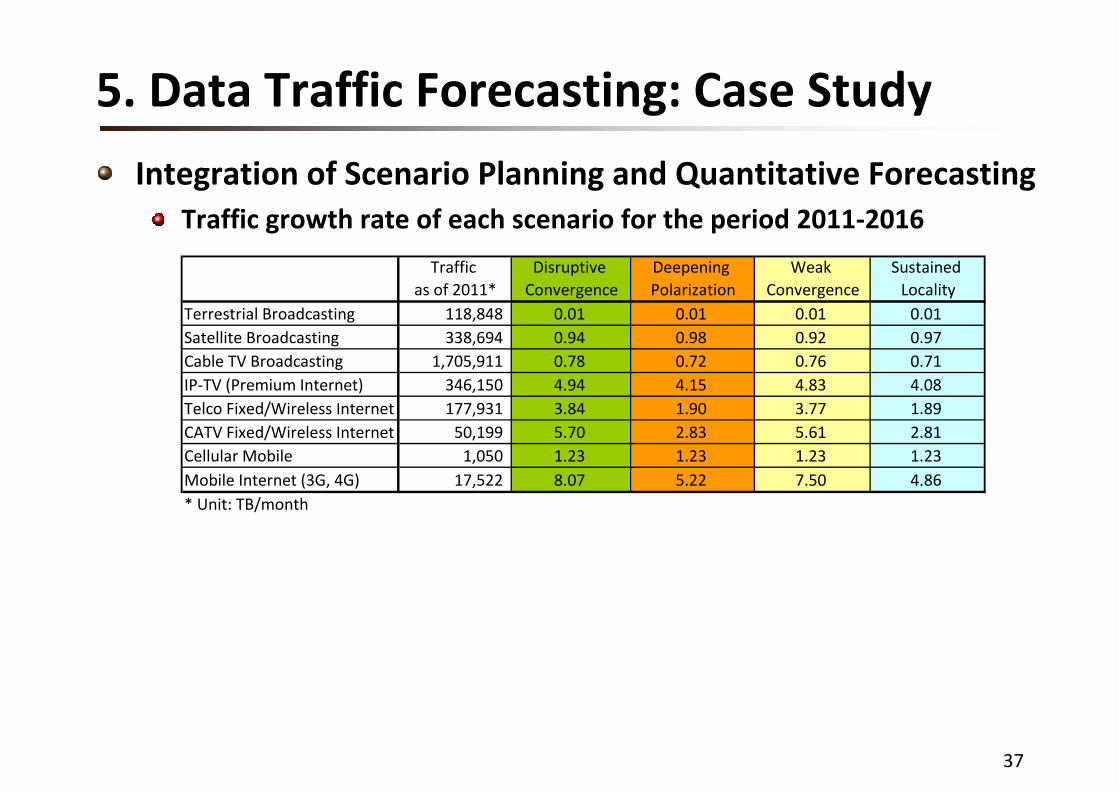
5. Data Traffic Forecasting: Case Study
Integration of Scenario Planning and Quantitative ForecastingTraffic growth rate of each scenario for the period 2011‐2016
Traffic Disruptive Deepening Weak Sustained as of 2011* Convergence Polarization Convergence Locality
Terrestrial Broadcasting 118,848 0.01 0.01 0.01 0.01Satellite Broadcasting 338,694 0.94 0.98 0.92 0.97Cable TV Broadcasting 1,705,911 0.78 0.72 0.76 0.71IP‐TV (Premium Internet) 346,150 4.94 4.15 4.83 4.08Telco Fixed/Wireless Internet 177,931 3.84 1.90 3.77 1.89CATV Fixed/Wireless Internet 50,199 5.70 2.83 5.61 2.81Cellular Mobile 1,050 1.23 1.23 1.23 1.23Mobile Internet (3G, 4G) 17,522 8.07 5.22 7.50 4.86* Unit: TB/month
38
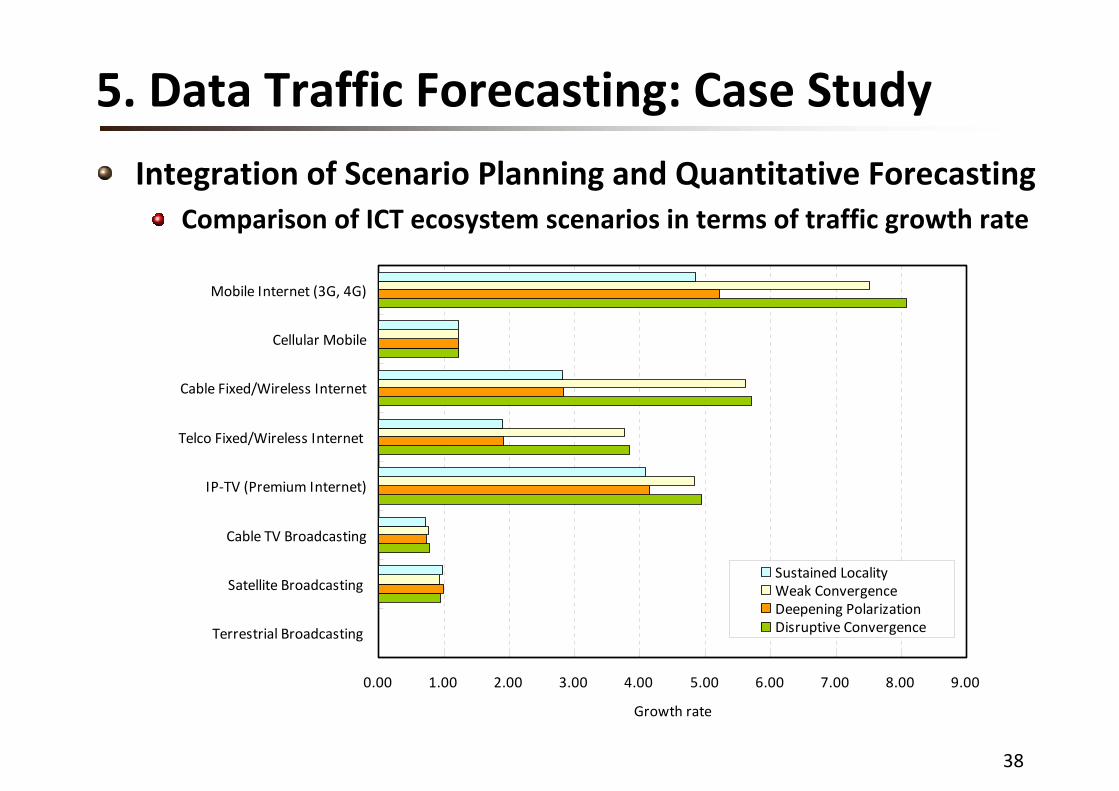
5. Data Traffic Forecasting: Case Study
Integration of Scenario Planning and Quantitative ForecastingComparison of ICT ecosystem scenarios in terms of traffic growth rate
0.00 1.00 2.00 3.00 4.00 5.00 6.00 7.00 8.00 9.00
Terrestrial Broadcasting
Satellite Broadcasting
Cable TV Broadcasting
IP‐TV (Premium Internet)
Telco Fixed/Wireless Internet
Cable Fixed/Wireless Internet
Cellular Mobile
Mobile Internet (3G, 4G)
Growth rate
Sustained LocalityWeak ConvergenceDeepening PolarizationDisruptive Convergence
39
5. Data Traffic Forecasting: Case Study
Policy Implications of the Scenario Analysis and ForecastingICT ecosystem of Korea, measured in data traffic volume, will beentirely reconfigured in next five years such a way that non‐Internet broadcasting networks like cable TV broadcasting and satellite broadcasting will shrink somehow, with terrestrial broadcasting almost abolished, while both best‐effort open Internets of telcos and cable operators and premium Internets of IP‐TV and 3G/4G mobile Internet will expand up to 8 times the sizes of each network in 2011.
Apparently, mobile Internet and telco/cable Internet will grow so fact especially under ‘disruptive convergence’ and even under ‘weak convergence’ scenarios, at least 5 times and up to 8 times by 2016. The influence of economic condition appears to be quite limited, as compared to that of political stance, or equivalently government’s regulatory policy for all these networks. Meanwhile, IP‐TV market shows quite consistent growth regardless of the ICT ecosystem scenarios.
40
5. Data Traffic Forecasting: Case Study
Strategic Implications of the Scenario Analysis and Forecasting
First, deregulation is much more effective than promotional policy for the ICT ecosystem booming in 2016.
Second, some rationalization measures might have to be done for cellular mobile, Cable TV broadcasting and satellite broadcasting networks to payback the investment cost as soon as possible.
Third, the role of IP‐TV in shaping the future ICT ecosystem will be recognized as more and more important. Setting up a good differentiation strategy between IP‐TV and telco Internet will be benefited.
41
6. Conclusion This paper developed a structured scenario planning method and applied it to the prospective n‐screen service market of Korea in 2016. An ICT ecosystem architecture and structured influence diagram were devised as a tool for formulating the forecasting model and a structured forecasting system procedure was suggested to get more stable forecasts. Four typical ICT ecosystem scenarios were identified and compared in terms of traffic growth for next five years. Sensitivity of the outputs to key environmental factors was discussed, and its strategic implications were noted. The main contribution of this paper is not in developing a good forecasting technique, but in setting up a good discipline and better procedures to formulate a forecasting problem in a right way. Multi‐model traffic forecasting in an n‐screen environment fitted quite well for this purpose and well justified the importance of a well‐designed structured scenario planning method. Enhancements of the methodologies, procedures, formulations, and behind logics remain to be explored in future researches.