Embed Size (px)
Citation preview
Cities and the Environment (CATE)Volume 6Issue 1 Urban Forestry Practitioners Share All Article 12
9-11-2013
A Satellite and Ground Evaluation of UrbanVegetation and Infrastructure in the Landscape of aTropical City: Heredia, Costa RicaJulian Monge-NajeraUNED San Jose Costa Rica, [email protected]
Zaidett BarrientosZaidett Barrientos, Laboratorio de Ecología Urbana, UNED, San José, Costa Rica,, [email protected]
Maribel Zúñiga-SolísLaboratorio de Ecología Urbana, UNED, San José, Costa Rica,, [email protected]
This Article is brought to you for free and open access by the Biology at Digital Commons @ Loyola Marymount University and Loyola Law School. Ithas been accepted for inclusion in Cities and the Environment (CATE) by an authorized administrator of Digital Commons at Loyola MarymountUniversity and Loyola Law School. For more information, please contact [email protected].
Recommended CitationMonge-Najera, Julian; Barrientos, Zaidett; and Zúñiga-Solís, Maribel (2013) "A Satellite and Ground Evaluation of Urban Vegetationand Infrastructure in the Landscape of a Tropical City: Heredia, Costa Rica," Cities and the Environment (CATE): Vol. 6: Iss. 1, Article12.Available at: http://digitalcommons.lmu.edu/cate/vol6/iss1/12
A Satellite and Ground Evaluation of Urban Vegetation and Infrastructurein the Landscape of a Tropical City: Heredia, Costa Rica
Urban vegetation can have beneficial effects on biodiversity and human health and has been widely studied intemperate cities. The situation, however, is different in the tropics: there is a knowledge gap describing theinfluence of the growth and expansion of tropical cities on vegetation within the cities. There is also a scarcityof work discussing appropriate methods to quantify urban vegetation in the tropics, where financial resourcesfor research are normally quite limited. Our objectives in this article were to measure the amount of urbanvegetation in a tropical city, its relationship to population and infrastructure, and to determine if satelliteresults differ from those obtained on the ground. For these objectives we studied the city of Heredia, CostaRica, during the rainy season, when vegetation was most developed. We sampled 91 sites from the ground(with 360 degree digital panoramic photographs) and compared the measurements with the correspondingsatellite photographs. Satellite and ground estimates of vegetation and infrastructure differed significantly(Kruskal-Wallis ANOVA, p=0.00002). The satellite estimate of vegetation was nearly one third higher that theground estimate. These finding illustrated that a significant part of the vegetation is hidden from the view,reducing the potential beneficial effects that a person’s perception of plants has on their psychology.Conversely, the estimate of infrastructure cover was much higher from the ground than in the satellitephotographs. In the ground estimate the dominant landscape component was vegetation (48%), followed bybuildings (28%), roads (23%) and billboards (0.41%). We conclude that density of the human population,rather than its total size, is the best predictor of vegetation in this tropical landscape (multiplicative modelregression, F Ratio 7.33, p= 0.0081).
Keywordstropical urban ecosystems, landscape components, relative infrastructure cover, Central America
AcknowledgementsWe thank several anonymous reviewers for their excellent comments to improve an earlier draft and LigiaBermudez for her statistical advice and Karla Vega for the graphs.
This article is available in Cities and the Environment (CATE): http://digitalcommons.lmu.edu/cate/vol6/iss1/12
Introduction
Landscape analysis is an important part of urban planning and has been widely applied in
temperate cities under a variety of psychological, biological, and physical approaches that
include urban vegetation and its psychological effect on humans of all ages, its relationship with
city animals, and physical aspects, such as light pollution of the nocturnal landscape (Kaplan and
Kaplan, 1989; McDonnell, Hahs, and Breuste, 2009). In contrast with temperate cities, very little
is known about urban vegetation in the tropics (Barrientos, 2009; Monge-Nájera and Pérez-
Gómez, 2010).
The scarcity of information about tropical urban vegetation is particularly regrettable
because the tropics have the highest levels of terrestrial biodiversity in the world and because the
biota of tropical cities is being affected by urbanization (Fournier, 1993; Estado de la Nación,
2007). The inhabitants of cities perceive vegetation in their landscape and are affected by it in
significant ways that have health and even economic implications that are beneficial when
vegetation is abundant and deleterious when it is scarce (Kaplan and Kaplan, 1989;
Groenewegen, van den Berg, de Vries, Verheij, 2006; WHO, 2007).
Urban population growth is also a problem in the tropical country considered in this
study, Costa Rica; in 1900 it had approximately 300,000 inhabitants, but by 2008 the population
had increased to 4,500,000 of which 71% live in urban and peri-urban areas (INEC, 2008;
Centro Centroamericano de Población, 2012). As a result, small towns, mostly established in
colonial times, grew until they merged with their neighbors, forming a large metropolitan area in
the geographic center of the country (Barrientos, 2010). There is, however, very little
information about how this growth has affected urban vegetation in the country (Monge-Nájera
and Pérez Gómez, 2010).
Traditionally, urban vegetation has been evaluated from high above the ground using
aerial or satellite photographs (Solano, Robinson, and Morera, 1996; Savitsky, 1999) and this is
the dominant type of data used by the Costa Rican government for defining its policies (e.g.,
www.minae.go.cr) but it has more recently been found that the vegetation perceived by humans
on land (“ground perception”) can be different from what is perceived from airplanes and
satellites, at least for a tropical region (Monge-Nájera and Gieseke, 2005). A recent article from
a temperate habitat also found a difference in estimates and added that this depends on the type
of vegetation (King and Locke, 2013). In a detailed review of methods, Kaplan and Kaplan
(1989) concluded that a combination of ground and aerial methods can improve the overall
analysis of the landscape. Based on these findings, we decided to combine ground-level
photographic landscape analysis with satellite data for the city of Heredia, Costa Rica. Our
objectives for this study were to measure the amount of urban vegetation in a tropical city and
describe the relationship of urban vegetation to human population and city infrastructure (using a
statistical regression), and to determine if satellite results differed from those obtained on the
ground.
1
Monge-Najera et al.: A Satellite and Ground Evaluation of Urban Vegetation Costa Rica
Published by Digital Commons at Loyola Marymount University and Loyola Law School, 2013
MATERIALS AND METHODS
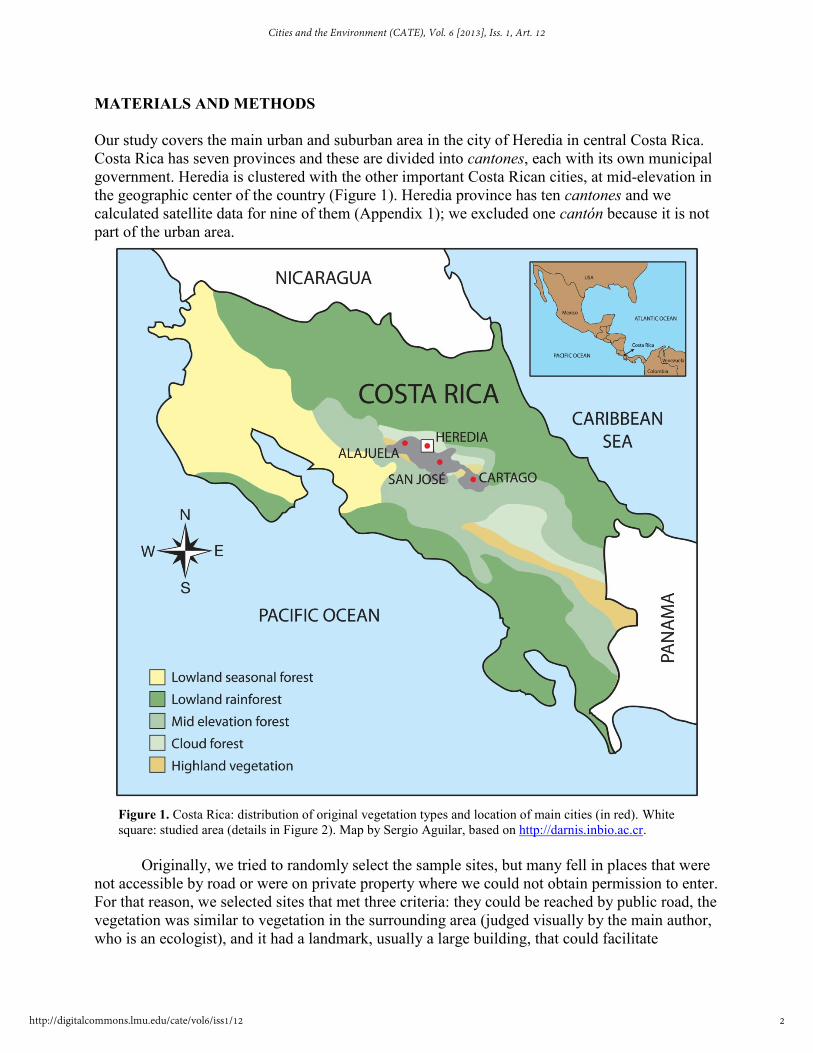
Our study covers the main urban and suburban area in the city of Heredia in central Costa Rica.
Costa Rica has seven provinces and these are divided into cantones, each with its own municipal
government. Heredia is clustered with the other important Costa Rican cities, at mid-elevation in
the geographic center of the country (Figure 1). Heredia province has ten cantones and we
calculated satellite data for nine of them (Appendix 1); we excluded one cantón because it is not
part of the urban area.
Figure 1. Costa Rica: distribution of original vegetation types and location of main cities (in red). White
square: studied area (details in Figure 2). Map by Sergio Aguilar, based on http://darnis.inbio.ac.cr.
Originally, we tried to randomly select the sample sites, but many fell in places that were
not accessible by road or were on private property where we could not obtain permission to enter.
For that reason, we selected sites that met three criteria: they could be reached by public road, the
vegetation was similar to vegetation in the surrounding area (judged visually by the main author,
who is an ecologist), and it had a landmark, usually a large building, that could facilitate
2
Cities and the Environment (CATE), Vol. 6 [2013], Iss. 1, Art. 12
http://digitalcommons.lmu.edu/cate/vol6/iss1/12
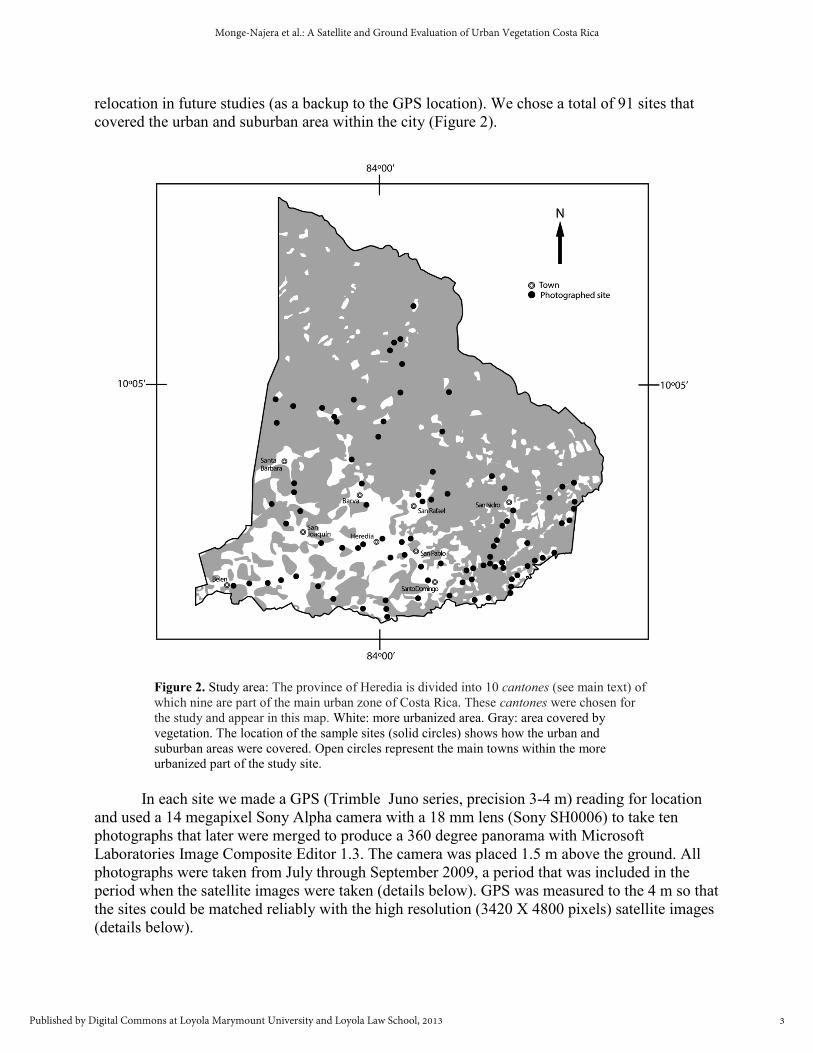
relocation in future studies (as a backup to the GPS location). We chose a total of 91 sites that
covered the urban and suburban area within the city (Figure 2).
Figure 2. Study area: The province of Heredia is divided into 10 cantones (see main text) of
which nine are part of the main urban zone of Costa Rica. These cantones were chosen for
the study and appear in this map. White: more urbanized area. Gray: area covered by
vegetation. The location of the sample sites (solid circles) shows how the urban and
suburban areas were covered. Open circles represent the main towns within the more
urbanized part of the study site.
In each site we made a GPS (Trimble Juno series, precision 3-4 m) reading for location
and used a 14 megapixel Sony Alpha camera with a 18 mm lens (Sony SH0006) to take ten
photographs that later were merged to produce a 360 degree panorama with Microsoft
Laboratories Image Composite Editor 1.3. The camera was placed 1.5 m above the ground. All
photographs were taken from July through September 2009, a period that was included in the
period when the satellite images were taken (details below). GPS was measured to the 4 m so that
the sites could be matched reliably with the high resolution (3420 X 4800 pixels) satellite images
(details below).
3
Monge-Najera et al.: A Satellite and Ground Evaluation of Urban Vegetation Costa Rica
Published by Digital Commons at Loyola Marymount University and Loyola Law School, 2013
The area is all tropical and the study was done in the rainy season to guarantee that full
vegetation cover was included (vegetation may lose foliage during the dry season in some parts
of this area). The panoramic images covered a varying amount of space according to the site
characteristics, so we converted all values to percentages to account for this and to make
comparisons meaningful.
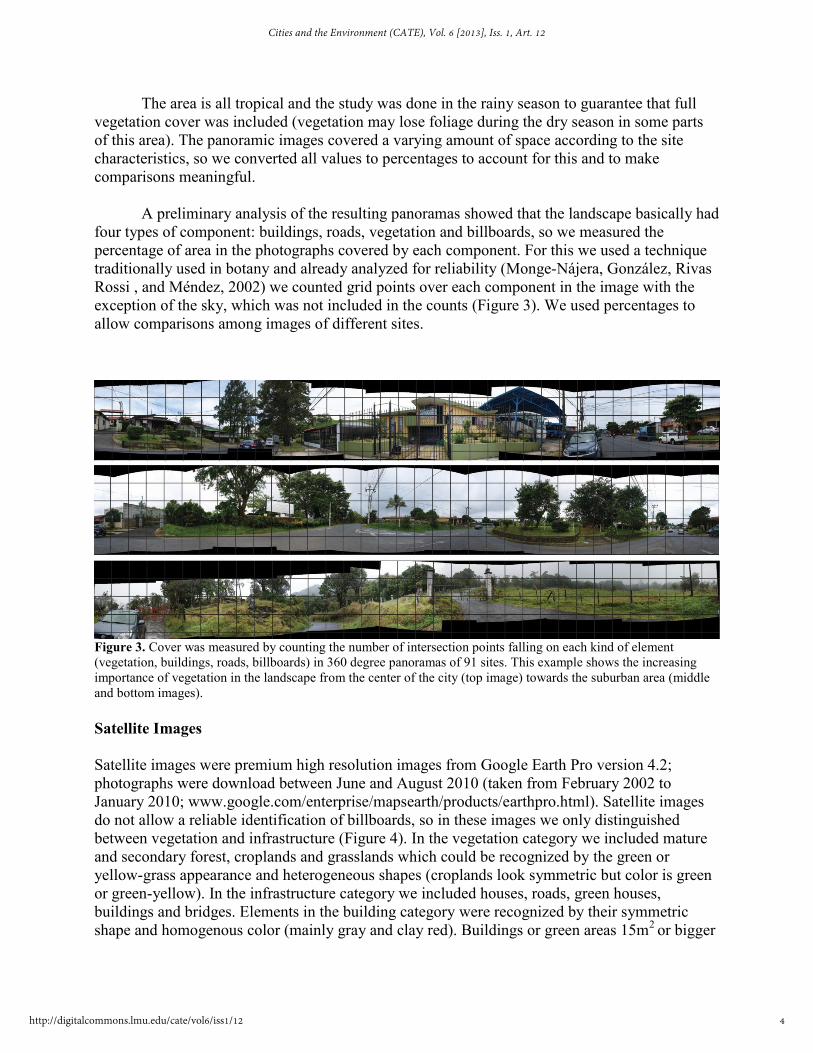
A preliminary analysis of the resulting panoramas showed that the landscape basically had
four types of component: buildings, roads, vegetation and billboards, so we measured the
percentage of area in the photographs covered by each component. For this we used a technique
traditionally used in botany and already analyzed for reliability (Monge-Nájera, González, Rivas
Rossi , and Méndez, 2002) we counted grid points over each component in the image with the
exception of the sky, which was not included in the counts (Figure 3). We used percentages to
allow comparisons among images of different sites.
Figure 3. Cover was measured by counting the number of intersection points falling on each kind of element
(vegetation, buildings, roads, billboards) in 360 degree panoramas of 91 sites. This example shows the increasing
importance of vegetation in the landscape from the center of the city (top image) towards the suburban area (middle
and bottom images).
Satellite Images
Satellite images were premium high resolution images from Google Earth Pro version 4.2;
photographs were download between June and August 2010 (taken from February 2002 to
January 2010; www.google.com/enterprise/mapsearth/products/earthpro.html). Satellite images
do not allow a reliable identification of billboards, so in these images we only distinguished
between vegetation and infrastructure (Figure 4). In the vegetation category we included mature
and secondary forest, croplands and grasslands which could be recognized by the green or
yellow-grass appearance and heterogeneous shapes (croplands look symmetric but color is green
or green-yellow). In the infrastructure category we included houses, roads, green houses,
buildings and bridges. Elements in the building category were recognized by their symmetric
shape and homogenous color (mainly gray and clay red). Buildings or green areas 15m2
or bigger
4
Cities and the Environment (CATE), Vol. 6 [2013], Iss. 1, Art. 12
http://digitalcommons.lmu.edu/cate/vol6/iss1/12
were classified in the corresponding category. The small areas (less than 15m2) inside a matrix of
the opposite category were ignored.
Costa Rica has seven provinces and these are divided into cantones; each cantón has its
own municipal government. The satellite image data were calculated for a total of nine cantones
(Appendix 1).
Human Population
Population size for each geographic unit (cantón) and density per unit were obtained from
official records of the 2008 national census (INEC 2008).
Statistical Analysis
We used Statgraphics Plus 5.1 to calculate means and standard errors, Kruskal-Wallis
ANOVAs (Figs. 4 and 5) and regression equations to estimate vegetation cover in the landscape
with population density, buildings, roads and billboards as independent variables. A series of
backward stepwise regressions with all variables indicated that only population density was
required to estimate vegetation (here used as % vegetation in the landscape). For this reason we
reanalyzed the data with a simple regression and found that the linear model was not the most
appropriate among 27 calculated models (e.g. Reciprocal-Y square root-X, S-curve model and
Reciprocal-Y logarithmic-X). We thus recalculated the regression with t Multiplicative model: Y
= a*X^b that had the best results.
The full dataset and statistical results are included in the electronic Appendices 1 and 2.
RESULTS
Ground and Satellite Results
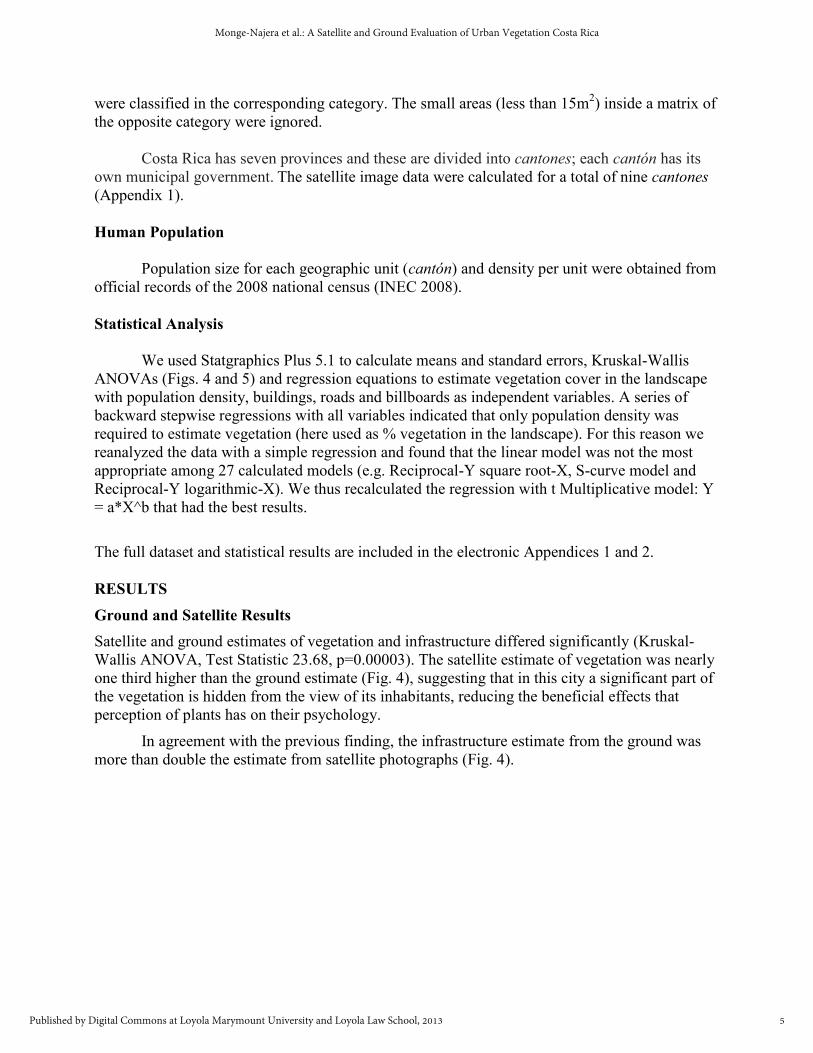
Satellite and ground estimates of vegetation and infrastructure differed significantly (Kruskal-
Wallis ANOVA, Test Statistic 23.68, p=0.00003). The satellite estimate of vegetation was nearly
one third higher than the ground estimate (Fig. 4), suggesting that in this city a significant part of
the vegetation is hidden from the view of its inhabitants, reducing the beneficial effects that
perception of plants has on their psychology.
In agreement with the previous finding, the infrastructure estimate from the ground was
more than double the estimate from satellite photographs (Fig. 4).
5
Monge-Najera et al.: A Satellite and Ground Evaluation of Urban Vegetation Costa Rica
Published by Digital Commons at Loyola Marymount University and Loyola Law School, 2013
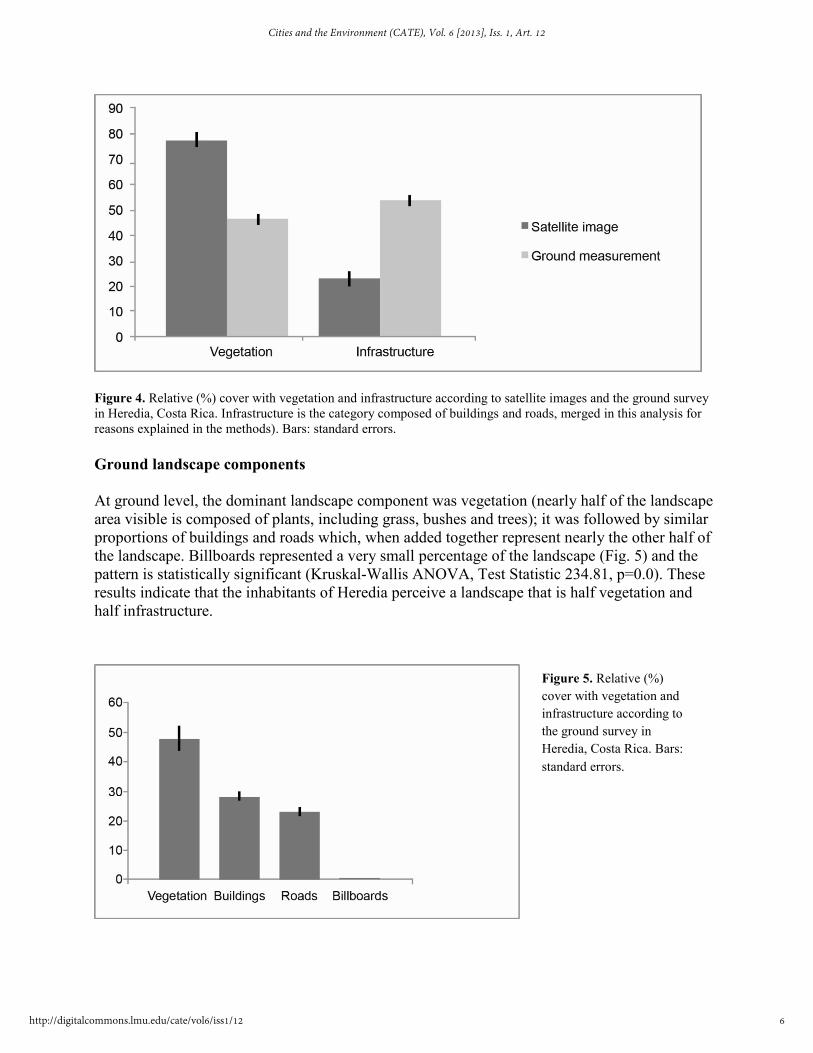
Figure 4. Relative (%) cover with vegetation and infrastructure according to satellite images and the ground survey
in Heredia, Costa Rica. Infrastructure is the category composed of buildings and roads, merged in this analysis for
reasons explained in the methods). Bars: standard errors.
Ground landscape components
At ground level, the dominant landscape component was vegetation (nearly half of the landscape
area visible is composed of plants, including grass, bushes and trees); it was followed by similar
proportions of buildings and roads which, when added together represent nearly the other half of
the landscape. Billboards represented a very small percentage of the landscape (Fig. 5) and the
pattern is statistically significant (Kruskal-Wallis ANOVA, Test Statistic 234.81, p=0.0). These
results indicate that the inhabitants of Heredia perceive a landscape that is half vegetation and
half infrastructure.
Figure 5. Relative (%)
cover with vegetation and
infrastructure according to
the ground survey in
Heredia, Costa Rica. Bars:
standard errors.
6
Cities and the Environment (CATE), Vol. 6 [2013], Iss. 1, Art. 12
http://digitalcommons.lmu.edu/cate/vol6/iss1/12
Variable Associations
A total of 27 models were tested and appear in Appendix 2. The equation of the fitted
multiplicative model that best describes the relationship between Vegetation and Population
Density is:
(p=0.0081, r2=7.6)
Vegetation(%)= exp (5.29508 – 0.242817*ln (Population Density)
The regression of infrastructure versus population density:
Infrastructure(%)= sqrt(-460.176 + 242.419*ln(Population Density)
was not significant (p=0.1556; r2=2.25265 percent) and the possible reason for this is analyzed in
the discussion. The need to use exponential values and logarithms indicates that the relationship
between the density of the human population and the vegetation perceived in the landscape is
complex and non-linear.
DISCUSSION
The only previous study focused on how satellite and ground images differ for Central American
landscapes is that of Monge-Nájera and Gieseke (2005) who found that satellite images produced
higher estimates of vegetation cover, which is consistent with the present study. This does not
mean that satellites are better or worse than ground measurements, but that usually more
infrastructure is visible from ground level, and thus, the perceived proportion of vegetation in the
landscape is lower for the people who live in it (Monge-Nájera and Gieseke, 2005). A recent
study in New York City found no statistically significant differences among geographic
information system data, ground visual estimations and ground hemispherical photographs when
measuring tree canopy, but the hemispheric photographs overestimated building coverage (King
and Locke, 2013). These results cannot be directly compared with ours because they are from a
temperate city and because King and Locke used a skyward-oriented fisheye lens while we used a
horizontally oriented 18 mm lens, but they highlight the fact that ground perception is different
from airplane and satellite images. We only recommend ground measurements when the
objective is assessing landscape perception by urban inhabitants, an important element in their
psychological condition according to Kaplan and Kaplan (1989). The finding that ground data are
meaningful and acceptable when compared with more expensive high technology is particularly
valuable for the tropics, where financial research resources are normally quite limited.
Archaeological data show that humans have been adding natural specimens to their homes for
more than 2,000 years and the proportion of natural versus artificial items in a landscape is of key
importance to define how the landscape is perceived (Grinde and Patil, 2009), but filters are
needed to properly define which elements are measured and which are excluded (Llobera, 2003).
For our study we decided that the important elements were vegetation, buildings, roads and
billboards because they could be reliably measured in the images and represent the “natural
versus artificial” dichotomy of the landscape. A limitation of our study is that the classifications
were not more detailed; other researchers may think of many further subdivisions for the
vegetation (even to plant species) and of the infrastructure (for example, windows, doors, wood
walls, concrete walls, traditional or modern constructions, and many others). However, such a
7
Monge-Najera et al.: A Satellite and Ground Evaluation of Urban Vegetation Costa Rica
Published by Digital Commons at Loyola Marymount University and Loyola Law School, 2013
fine subdivision was not within the scope of this study that had the vegetation versus
infrastructure as a central objective.
Areas with a higher proportion of infrastructure may not have the largest population
density because people live elsewhere and commute. More densely populated areas have less
vegetation because humans tend to replace natural elements such as vegetation with
infrastructure, sometimes with unexpected effects on their behavior (Antonson, Mårdh, Wiklund,
and Blomqvist, 2009) and health (Sorensen, Barzetti, Keipi, and Williams, 1998). This intensive
use of space is notable in tropical cities where land is expensive and funds scarce. For this
reason, our finding that nearly half of the landscape seen by the inhabitants of Heredia is
composed of vegetation is reassuring, considering that the only comparable published value that
we found is "under 30 % vegetation" for the city of Sacramento, California (Akbari, Rose, and
Taha, 1999). By selecting areas close to roads, we introduced a bias against areas that are hard to
reach and even more vegetated. The effect of this bias, albeit possibly low, would be an
underestimation of vegetation, and again, the implication is favorable: the vegetation in Heredia
may be even higher than the 50 % that we found.
While the urban landscape of Heredia can be similar to those of many tropical Latin
American cities, it is very different from tropical colonial cities such as Antigua in Guatemala
and Guanajuato in México. Those cities have urban landscapes dominated by buildings and
roads, with minimal billboards and street and park vegetation and our results cannot be
extrapolated to them. These cities deserve a future study because even though they are poor in
vegetation, the houses have large internal gardens (JMN and ZB personal observation).
Our study is, to our knowledge, the first to measure these landscape elements with ground
panoramic images and satellites photographs for any Central American city. We found that
Heredia has an important proportion of vegetation in its urban landscape, and that it needs to be
measured from the ground in studies on how it affects its human inhabitants. We hope that this
study will provide a baseline for follow up work on how this tropical landscape evolves in the
years to come and that it will inspire similar research in other tropical cities.
LITERATURE CITED
Akbari, H., Rose, L. S., & Taha, H. (1999). Characterizing the Fabric of the Urban
Environment: A Case Study of Sacramento,California. Lawrence Berkeley National
Laboratory, California, Berkeley.
Antonson, H., Mårdh, S., Wiklund, M., & Blomqvist, G. (2009). Effect of surrounding landscape
on driving behaviour: A driving simulator study. Journal of Environmental Psychology,
29(4), 493-502.
Barrientos, Z. (2009). Biodiversidad y desarrollo en tiempos de crisis económica: desde una
perspectiva sociobiológica. Revista Posgrado y Sociedad, 9 (1), 40-79.
Barrientos, Z. (2010). Problemática de los ciclos biogeoquímicos, hidrológico y de nutrientes en
la meseta central de Costa Rica. Revista Posgrado y Sociedad, 10 (1), 23-37.
8
Cities and the Environment (CATE), Vol. 6 [2013], Iss. 1, Art. 12
http://digitalcommons.lmu.edu/cate/vol6/iss1/12
Centro Centroamericano de población. (2012). Centro Centroamericano de Población.
Universidad de Costa Rica, San José, Costa Rica. Retrieved from
http://ccp.ucr.ac.cr/index.shtml. (Accessed 08/21/2013)
Estado de la Nación. (2007). Armonía con la Naturaleza. In 13o Informe Estado de la Nación.
Estado de la Nación, San José, Costa Rica, Retrieved from
http://www.estadonacion.or.cr/images/stories/informes/013/docs/info13cap4.pdf. (Accessed
08/21/2013)
Fournier, L.A. (1993). Recursos Naturales. San José, Costa Rica, EUNED.
Grinde, B., & Patil, G. G. (2009). Biophilia: Does Visual Contact with Nature Impact on Health
and Well-Being? International Journal of Environmental Research and Public Health, 6,
2332–2343.
Groenewegen, P.P., van den Berg, A. E., de Vries, S., & Verheij, R. A. (2006). Vitamin G:
effects of green space on health, well-being, and social safety. BMC Public Health, 6, 149).
INEC. (2008). Instituto Nacional de Estadística y Censos. INEC, San José, Costa Rica. Retrieved
from http://www.inec.go.cr/. (Accessed 08/21/2013)
Kaplan, R., & Kaplan, S. (1989). The Experience of Nature. Cambridge University, Cambridge,
United Kingdom.
King, K. L., & Locke, D. H. (2013). A Comparison of Three Methods for Measuring Local
Urban Tree Canopy Cover. Arboriculture and Urban Forestry, 39, 62–67.
Llobera, M. (2003). Extending GIS-based visual analysis: the concept of visualscapes.
International Journal of Geographical Information Science, 17, 25–48.
McDonnell, M.J., Hahs, A.H., & Breuste, J.H. (2009). Ecology of Cities and Towns. A
Comparative Approach. Cambridge, United Kingdom.
Monge-Nájera, J., González, M.I., Rivas Rossi, M.,& Méndez, V.H. (2002). A new method to
assess air pollution using lichens as bioindicators. Revista de Biología Tropical, 50(1), 321-
325.
Monge-Nájera, J., & Pérez-Gómez, G. (2010). Urban vegetation changer after a hundred years in
a tropical city (San José de Costa Rica). Revista de Biología Tropical, 58 (4), 1347-1386.
Monge-Nájera, J., & Gieseke, M.E. (2005). Efecto de la carretera Interamericana sobre la
vegetación entre El Salvador y México. Repertorio Científico, 9, 31-38.
Savitsky, B. (1999). GIS. P 41-47. In Savitsky, B., & Lacher, P T. (ed.). GIS methodologies for
developing conservation strategies. tropical forest recovery and wildlife management in
Costa Rica. Columbia University, Columbia, New York.
Solano, M., Robinson, T., & Morera, C. (1996). Sistemas de Información geográfica como
herramienta para el análisis espacial de los recursos hídricos. In Reynolds, J. (ed.).
Utilización y manejo de los Recursos Hídricos. San José, Costa Rica, Editorial Fundación
UNA.
Sorensen, M., Barzetti, V., Keipi, K., & Williams, J. (1998). Manejo de las áreas verdes
urbanas: documento de buenas prácticas. Washington, D.C., Banco Interamericano de
Desarrollo, Doc. No ENV-109. Retrieved from
9
Monge-Najera et al.: A Satellite and Ground Evaluation of Urban Vegetation Costa Rica
Published by Digital Commons at Loyola Marymount University and Loyola Law School, 2013
http://disciplinas.stoa.usp.br/pluginfile.php/80827/mod_resource/content/1/Manejo%20de%
20las%20areas%20verdes%20urbanas_BM_1997.pdf. (Accessed 08/12/2013)
WHO. (2007). Global Surveillance, prevention and control of chronic respiratory diseases: a
comprehensive approach. Geneva, Switzerland, World Health Organization. Retrieved from
http://www.who.int/gard/publications/GARD%20Book%202007.pdf. (Accessed
08/21/2013)
Appendix 1. Full dataset for the present study.
http://digitalcommons.lmu.edu/cgi/viewcontent.cgi?filename=0&article=1124&context=cat
e&type=additional
Appendix 2. Statistical results in detail.
http://digitalcommons.lmu.edu/cgi/viewcontent.cgi?filename=1&article=1124&context=cat
e&type=additional
10
Cities and the Environment (CATE), Vol. 6 [2013], Iss. 1, Art. 12
http://digitalcommons.lmu.edu/cate/vol6/iss1/12