Embed Size (px)
DESCRIPTION
A & S. December 14, 2010. Graduation Rates High School Grades. DRE. FY2010 Graduation Rates. DRE. SDPBC: Three Graduation Rates. *significant increase. DRE. SDPBC: Three Graduation Rates. *. *. *significant increase. DRE. SDPBC: Three Graduation Rates. *. *. *. - PowerPoint PPT Presentation
Citation preview

A & SDecember 14, 2010
DRE
Graduation RatesHigh School Grades

FY2010 Graduation Rates
DRE

SDPBC:Three Graduation Rates
FY2006 FY2007 FY2008 FY2009 FY201060%
70%
80%
90%
100%
69.3%
82.9%
NGA NCLB
Florida (Standard, ESE, GED)
*
DRE
*significant increase

SDPBC:Three Graduation Rates
FY2006 FY2007 FY2008 FY2009 FY201060%
70%
80%
90%
100%
68.2%
81.9%
69.3%
82.9%
NGA NCLB Florida
Florida (Standard, ESE, GED)NGA (Standard, ESE, GED)
DRE
*
*significant increase
*

SDPBC:Three Graduation Rates
FY2006 FY2007 FY2008 FY2009 FY201060%
70%
80%
90%
100%
68.2%
81.9%
66.9%
80.2%
69.3%
82.9%
NGA NCLB Florida
Florida (Standard, ESE, GED)NGA (Standard, ESE, GED)NCLB (Standard, ESE, GED)
DRE
*significant increase
***
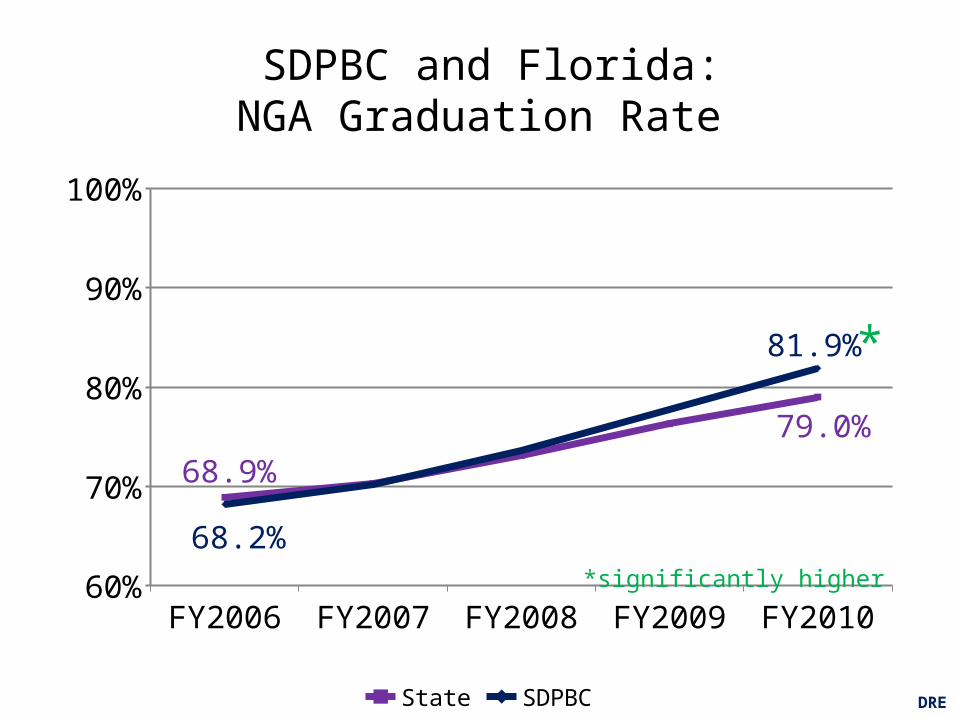
SDPBC and Florida:NGA Graduation Rate
FY2006 FY2007 FY2008 FY2009 FY201060%
70%
80%
90%
100%
68.9%
79.0%
68.2%
81.9%
State SDPBC DRE
*
*significantly higher

Large Urban Seven: NGA Graduation Rate
FY2006 FY2007 FY2008 FY2009 FY201050%
60%
70%
80%
90%
100%
68.2%
81.9%
Broward Dade Duval Hillsborough Orange Palm Beach PinellasDRE

Large Urban Seven: NGA Graduation Rate
FY2006 FY2007 FY2008 FY2009 FY201050%
60%
70%
80%
90%
100%
74.5%
82.3%
68.2%
81.9%
Broward Dade Duval Hillsborough Orange Palm Beach PinellasDRE
*
*gap no longer exists

SDPBC Black, White, Hispanic:Florida Graduation Rate
FY2006 FY2007 FY2008 FY2009 FY201050%
60%
70%
80%
90%
100%
53.6%
71.4%
61.2%
80.5%81.8%
91.5%
Black Hispanic WhiteDRE
(2) gaps with Whites significantly closing
**
* (1) significant increases
*
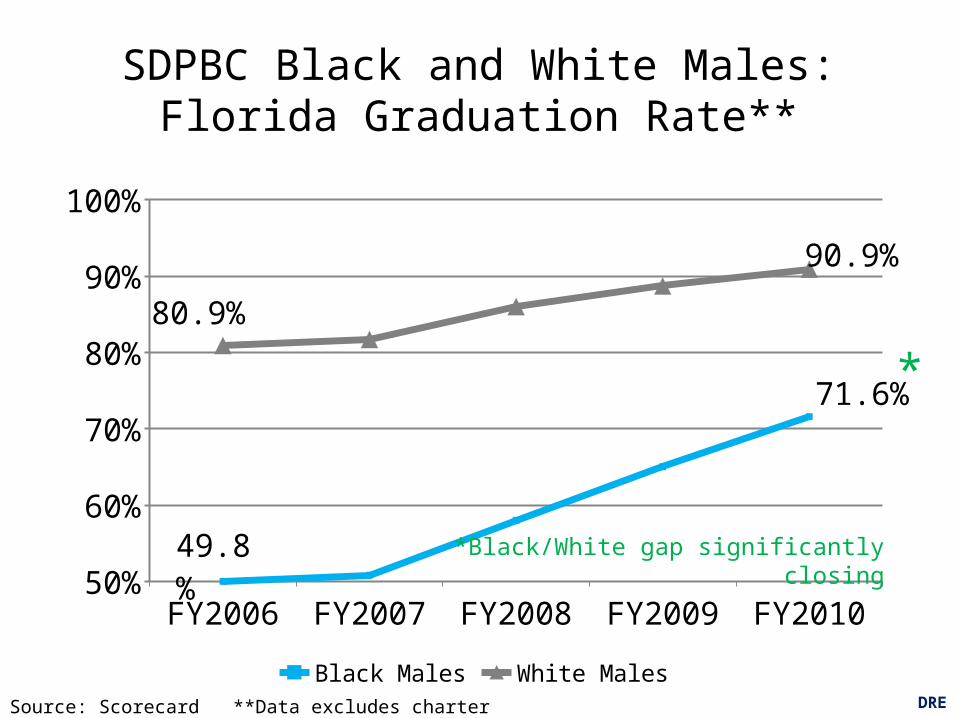
SDPBC Black and White Males:Florida Graduation Rate**
FY2006 FY2007 FY2008 FY2009 FY201050%
60%
70%
80%
90%
100%
71.6%
80.9%
90.9%
Black Males White Males
49.8%
Source: Scorecard **Data excludes charter schools. DRE
*
*Black/White gap significantly closing

Graduation Summary
1. SDPBC getting better
2. # 1 (tied) of Urban 7
3. White, Black, Hispanic increasing and gaps closing
DRE

FY2010 High School Grades
DRE

FY2010 SDPBC and State High School Grades*:
Grade
Palm Beach State
A 54% 30%
B 32% 41%
C 7% 15%
D 4% 12%
F 4% 2%
*includes charter schools DRE

FY2010 SDPBC High School Grades*:Seven Large Urban Districts in Florida
Grade
Palm Beach State Browar
d Dade Duval
Hills-boroug
h
Orange
Pinellas
A 54% 30% 37% 33% 21% 35% 19% 47%
B 32% 41% 37% 22% 16% 46% 43% 18%
C 7% 15% 21% 20% 5% 15% 10% 18%
D 4% 12% 5% 18% 53% 4% 24% 18%
F 4% 2% 0% 8% 5% 0% 5% 0%
*includes charter schools DRE
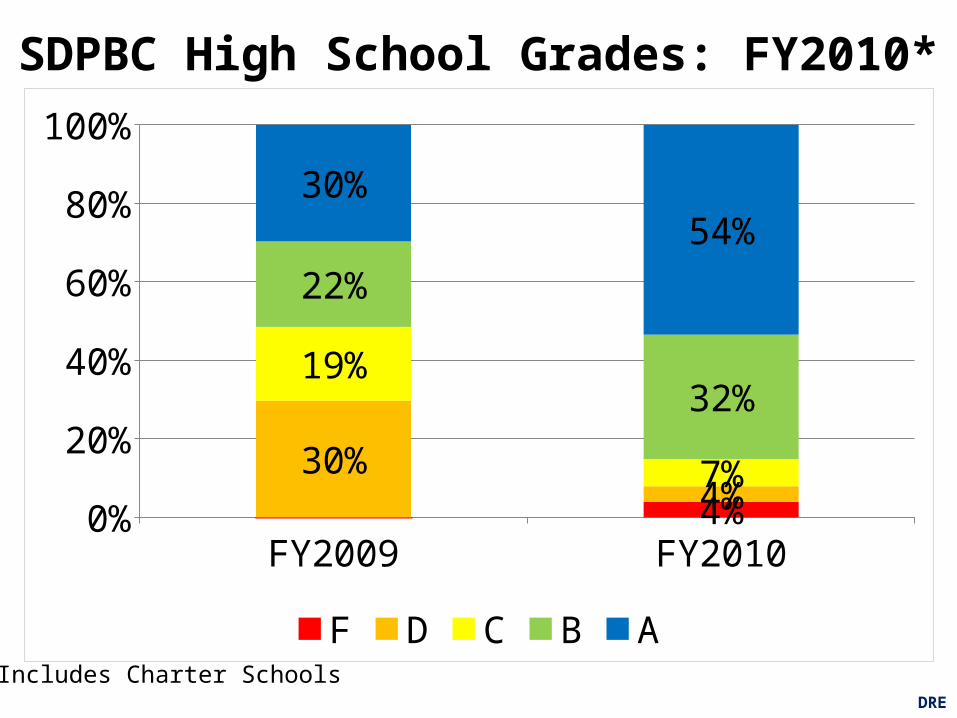
FY2009 FY20100%
10%20%30%40%50%60%70%80%90%
100%
30%4%
19%
7%
22%
32%
30%54%
4%
F D C B A* Includes Charter Schools
SDPBC High School Grades: FY2010*
DRE

* Excludes Charter SchoolsDRE
SDPBC High School Grades: FY2010*
FY2009 FY20100%
10%20%30%40%50%60%70%80%90%
100%
22%
17%
9%
26%
30%
35%61%
F D C B A

A B C D F
A 8 0 0 0 0
B 3 3 0 0 0
C 2 3 0 0 0
D 2 3 2 1 0
F 0 0 0 0 0
*includes charter schools
2010 School Grade20
09 S
choo
l Gra
de
DRE
SDPBC High School Grades: FY2010*

A B C D F
A 8 0 0 0 0
B 3 3 0 0 0
C 1 3 0 0 0
D 2 1 2 0 0
F 0 0 0 0 0
2010 School Grade20
09 S
choo
l Gra
de
*excludes charter schools DRE
SDPBC High School Grades: FY2010*

•D to A•Lake Worth •Santaluces
•D to B•Royal Palm Beach •Inlet Grove •South Tech
•C to A•John I. Leonard•G-Star
DRE
SDPBC High School Grades: FY2010 High Schools Improving Two or More Grades

20
High School Grade: FY2010
50% on FCAT Components
800 Points Possible
50% on High School Components
800 Points Possible
TOTAL POINTS (FCAT + High School
Components) 1600 Points Possible
Grade ScaleA >= 1050B 990 to 1049C 870 to 989D 790 to 869F < 790

FCAT Components: FY2010
READING MATH WRITING SCIENCE
Performance100
Performance100
Performance100
Performance100
Learning Gains
100
Learning Gains
100 TOTAL FCAT POINTS800 POINTSLearning
Gains of Lowest 25%
100
Learning Gains of
Lowest 25%100
PLUS 11th and 12th grade retakes for possible bonus points (10)

0
10
20
30
40
50
60
70
80
90
100
PALM BEACH Mean of other Large Six Districts
Perc
entil
e
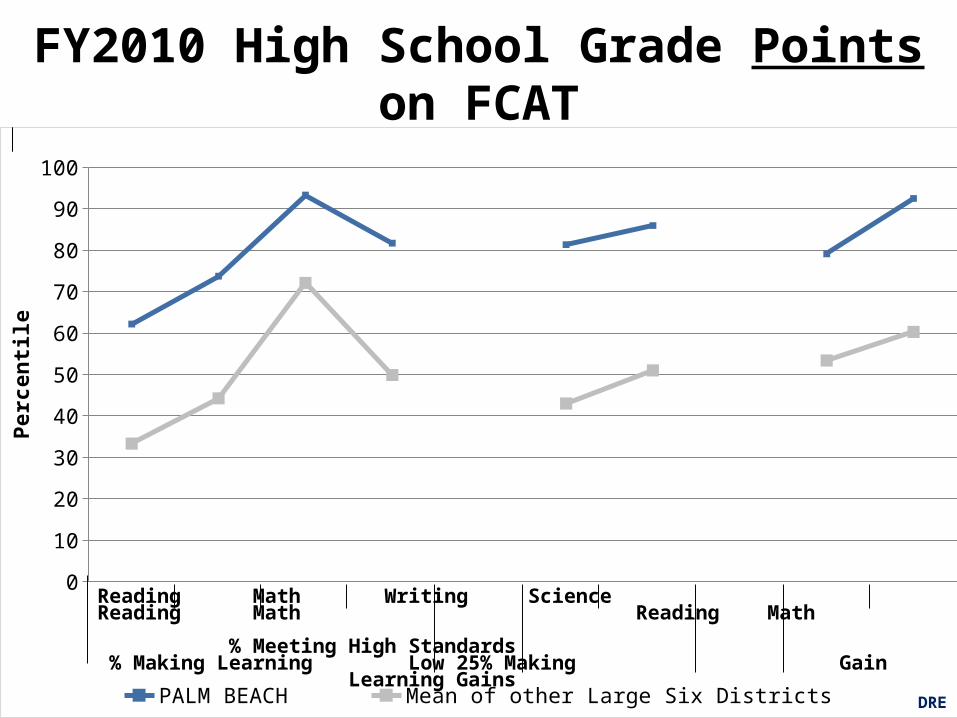
FY2010 High School Grade Points on FCAT
Reading Math Writing Science Reading Math Reading Math
%Meeting High Standards %Making Learning Low 25% Making Gain Learning Gains
DRE

0
10
20
30
40
50
60
70
80
90
100
PALM BEACH Mean of other Large Six Districts
Perc
entil
e
FY2010 High School Grade Points on FCAT
Reading Math Writing Science Reading Math Reading Math
%Meeting High Standards %Making Learning Low 25% Making Gain Learning Gains
DRE
0
10
20
30
40
50
60
70
80
90
100
PALM BEACH Mean of other Large Six Districts
Perc
entil
e
FY2010 High School Grade Points on FCAT
Reading Math Writing Science Reading Math Reading Math
% Meeting High Standards % Making Learning Low 25% Making Gain Learning Gains
DRE

0
10
20
30
40
50
60
70
80
90
100
PALM BEACH BROWARD DADE DUVAL HILLSBOROUGH ORANGE PINELLAS
Perc
entil
e
FY2010 High School Grade Points on FCAT
Reading Math Writing Science Reading Math Reading Math
% Meeting High Standards % Making Learning Low 25% Making Gain Learning Gains
DRE

0
10
20
30
40
50
60
70
80
90
100
FY2010 FY2009
Perc
entil
e
SDPBC High School Grade Points on FCATFY2010 vs FY2009
Reading Math Writing Science Reading Math Reading Math
% Meeting High Standards % Making Learning Low 25% Making Gain Learning Gains
DRE

27
High School Grade: FY2010
50% on FCAT Components
800 Points Possible
50% on High School Components
800 Points Possible
TOTAL POINTS (FCAT + High School
Components) 1600 Points Possible
Grade ScaleA >= 1050B 990 to 1049C 870 to 989D 790 to 869F < 790
50% on
FCAT Components
800 Points Possible

28
High School Components: FY2010
GRADUATION ACCELERATION READINESS GROWTH/DECLINE
Overall Rate
200
Participation
200
Performance on Reading
100
For each component schools may earn up to 20 additional
points for GROWTH(40 points for factors worth
200 points)
At-Risk Rate
100
Performance
100
Performance on Math
100
For each component schools may lose
5 additional points for DECLINE
(10 points for factors worth 200 points)
Total Graduation
Points
300
Total Acceleration
Points
300
Total Readiness
Points
200
Total NEW HIGH SCHOOL Points Possible
800

29
High School Components: FY2010 SDPBC HS Average
GRADUATION ACCELERATION READINESS GROWTH/DECLINE
Overall Rate
93*
Participation
85*
Performance on Reading
89
For each component schools may earn up to 20 additional
points for GROWTH(40 points for factors worth
200 points)
At-Risk Rate
88
Performance
76
Performance on Math
73
For each component schools may lose
5 additional points for DECLINE
(10 points for factors worth 200 points)
Total Graduation
Points
300
Total Acceleration
Points
300
Total Readiness
Points
200
Total NEW HIGH SCHOOL Points Possible
800
* Divided by two to make comparable to unweighted points

0
10
20
30
40
50
60
70
80
90
100
PALM BEACH Mean of other Large Six Districts
Perc
entil
eFY2010 High School Grade Points on non-FCAT
Over All At Risk Participation Performance Reading Math Graduation Accelerated Coursework College Readiness
DRE

0
10
20
30
40
50
60
70
80
90
100
PALM BEACH BROWARD DADE DUVAL HILLSBOROUGH ORANGE PINELLAS
Perc
entil
eFY2010 High School Grade Points on non-FCAT
Over All At Risk Participation Performance Reading Math Graduation Accelerated Coursework College Readiness
DRE

0
10
20
30
40
50
60
70
80
90
100
FY2010 FY2009
Perc
entil
e
SDPBC High School Grade Results on non-FCAT:FY2010 vs FY2009
Over All At Risk Participation Performance Reading Math Graduation Accelerated Coursework College Readiness
DRE

33
High School Grade: 2009-10
50% on FCAT Components
800 Points Possible
50% on High School Components
800 Points Possible
TOTAL POINTS (FCAT + High School
Components) 1600 Points Possible
Grade ScaleA >= 1050B 990 to 1049C 870 to 989D 790 to 869F < 790

Total FCAT Non-FCAT0
10
20
30
40
50
60
70
80
90
100
PALM BEACH Mean of other Large Six Districts
Perc
entil
eFY2010 High School Grade Points
DRE

Total FCAT Non-FCAT0
10
20
30
40
50
60
70
80
90
100
PALM BEACH BROWARD DADE DUVALHILLSBOROUGH ORANGE PINELLAS
Perc
entil
eFY2010 High School Grade Points
DRE

SDPBC High School Grades Summary
1. More than 50% A’s2. # 1 of urban 73. Most schools improved
• 2 schools: D to A
DRE


![Pipelined Computations P0P1P2P3P5. Pipelined Computations a s in s out a[0] a s in s out a[1] a s in s out a[2] a s in s out a[3] a s in s out a[4] for(i=0](https://img.pdfslide.us/doc/110x75/56649f0e5503460f94c228ca/pipelined-computations-p0p1p2p3p5-pipelined-computations-a-s-in-s-out-a0.jpg)