Embed Size (px)
Citation preview

A Root Cause Study to Determine the Source of High Gypsum Moisture
Jamie L. Mion, Michael T. Hoydick, Stephen E. Winter;
Foster Wheeler North America, Pittsburgh, PA
Presented at
Power Plant Pollutant Control MEGA Symposium August 19-21, 2014
Baltimore, MD, USA
1
A Root Cause Study to Determine the Source of High
Gypsum Moisture
Paper # 62
Presented at the
Power Plant Pollutant Control “MEGA” Symposium
August 19-21, 2014
Baltimore, MD
Jamie L. Mion, Michael T. Hoydick, Stephen E. Winter; Foster Wheeler North America,
Pittsburgh, PA
ABSTRACT
A study was launched to identify the root cause of periodic episodes of high gypsum free
moisture being produced by a newly commissioned multi-boiler WFGD system. The
investigation revealed the sources of the high moisture were unusually flat gypsum crystals
which were making dewatering difficult. Testing revealed that a series of flyash elements were
acting as gypsum crystal modifiers. Results also indicated flyash from only one of the four
boilers appeared to drive the high moisture events. Flyash leaching experiments were successful
in replicating the full scale problem. It is hypothesized that the combination of low WFGD sulfur
loading and the unique flyash chemistry introduced from one of the boilers were central in
producing the unique gypsum shape.
INTRODUCTION
The study was conducted at a Midwestern utility (Plant A), which is a coal-fired generating
station with a total net generating capacity of approximately 1,100 MW. Air pollution control
equipment includes four ESP’s, two SCR’s and two WFGD’s. The WFGD design is a Foster
Wheeler (formerly Siemens Environmental Systems and Services / Wheelabrator Air Pollution
Control) limestone forced oxidation system producing commercial grade gypsum. This WFGD
system, commissioned in 2012, is an exact duplicate of the WFGD at a sister site (Plant B),
which was commissioned several years earlier. The generating stations share an identical
limestone supply and are fueled by similar low-sulfur PRB coal (0.5 wt.% maximum). The
make-up water at both sites is from the same general source, but several differences exist in
treatment and composition.
Two absorber modules were provided at both Plant A and Plant B. At Plant A, one module is
dedicated to Boiler Units 5 and 6 and one is dedicated to Boiler Units 7 and 8. Each absorber
consists of recycle pumps, a dual flow tray and a forced oxidation air blower. Limestone slurry is
produced by horizontal wet grinding ball mills. The dewatering process begins with each
absorber’s dedicated primary hydroclone, where gypsum slurry is separated into a high solids
underflow and a low solids overflow. The underflow streams from both of the primary
hydroclones accumulate in the common filter feed tank before being sent to one of two

2
redundant vacuum filters for final dewatering. The overflow stream from the primary hydroclone
is either recycled back to the absorber or processed through the secondary hydroclone system to
purge chlorides and inerts. Gypsum quality parameters were defined as 10% maximum free
moisture and 95% minimum calcium sulfate dihydrate (purity).
At Plant A, Unit 56 and Unit 78 Absorber startups were staggered by three months. During the
initial Unit 56 start-up, the gypsum filter cake became increasingly difficult to dewater. Gypsum
moisture values exceeded the 10% maximum specification after only two weeks of dewatering
operation. By the seventh week, moisture had continued to increase and surpassed 20%. This is
illustrated in Figure 1.
Figure 1. Unit 56 Initial Gypsum Moisture Excursion
Initial investigations focused on a number of equipment and process possibilities, including poor
vacuum filter performance, improperly tuned hydroclones, absorber operating density, limestone
quality and water quality. Pictures of the gypsum crystals taken by SEM (Scanning Electron
Microscope) provided the first insight into the issue. Typical WFGD gypsum crystals appear
block-like in shape and have a distinct structure, but the Plant A gypsum crystals appeared as
flat, plate-like crystals with irregular edges. These flat crystals were exceptionally difficult to
dewater because they created an impervious filter cake that prevented the extraction of moisture.
Figure 2 compares typical FGD gypsum crystals with the irregular crystals from Plant A.
0
5
10
15
20
25
30
3/4/12 3/11/12 3/18/12 3/25/12 4/1/12 4/8/12 4/15/12
Gyp
sum
Mo
istu
re,
%
Date
Gypsum Moisture

3
Figure 2. SEM Photographs of Gypsum Crystals
Typical Gypsum Crystals (Top), Plant A Gypsum Crystals (Bottom)
Plant B, which uses similar low sulfur PRB coal and identical limestone, had never experienced
similar gypsum moisture issues in five years of operation. Additionally, Plant C, which shares
the site with Plant A and also has a wet scrubber, had never experienced gypsum moisture issues.
The limestone supplied to Plant C is identical to that of Plant A and Plant B. The quality of
make-up water at Plant C is slightly different than that of Plant A due to differences in treatment,
but both are supplied from the same general source. It is important to note that the Plant C
system burns high sulfur eastern bituminous coal, which is distinctly different from coal burned
at Plant A and Plant B. SEM photographs of gypsum from Plant B and Plant C gypsum
confirmed typical crystal structure and low gypsum moisture content.
Upon discovery of the flat irregular crystals, it was hypothesized that the gypsum crystal
morphology was being affected by a liquid-phase species within the absorber liquor. Operational
data revealed that increasing the operating pH from 5.6 to 6.1 had a positive effect on reducing
the gypsum moisture. Since metals often precipitate with increasing pH, it was suspected that a
metal element(s) in the absorber liquor could be the species of interest. Additionally, it is known
that certain transition metal elements can inhibit gypsum precipitation1. Some of these elements
are common and present in sufficient concentrations in WFGD liquor, including cadmium,
copper, iron and chromium.
A root cause investigation was launched by Foster Wheeler to confirm or refute the hypothesis.
A test program ensued.

4
METHODOLOGY
Stage 1
Foster Wheeler commenced Stage 1 of a root cause analysis program in early November 2012.
Although the Unit 56 Absorber had experienced a greater number and higher degree of gypsum
moisture excursions, it was entering an extended outage at the same time that the root cause test
plan was developed. Due to the sensitivity and timeliness of the problem, the test program was
therefore redirected to Unit 78 Absorber. It was believed that the Unit 78 Absorber would
experience the same problem since it is of identical design and operation to the Unit 56
Absorber. The Stage 1 approach was to gradually reduce purge rates thereby allowing
accumulation of chlorides and other dissolved species. The intent of this procedure was to induce
the high gypsum moisture events and to determine the concentration at which the events
occurred. Absorber slurry and gypsum samples were collected concurrently at pre-determined
times to quantify levels of dissolved species and observe corresponding changes in gypsum
morphology.
The chloride concentration in the absorber slurry served as the benchmark for sample collection.
Chlorides were tested daily by the plant laboratory using EPRI Method O4. Baseline samples
were collected at 3,000 ppm (mg/L) chlorides. Operation of the purge system was then limited to
allow the chloride levels to increase in increments of approximately 500 ppm. The absorber was
maintained at this level for one week before the next sample collection. To maintain consistency,
absorber slurry and gypsum samples were collected during full load operation and at the start of
a dewatering run. Sample collection continued in 500 ppm increments until a level of 5,500 ppm
was reached. If gypsum moisture exceeded 10% consistently during the study, purging operation
could resume until moisture was reduced to less than 10%.
Absorber slurry samples were sent to the Siemens Water Enviroscan laboratory for full
chemistry characterization including dissolved elements, ions and classical parameters. Gypsum
samples were sent to RJ Lee Group for SEM analysis and photographs. The plant laboratory
tested the gypsum samples for moisture using EPRI Method F1 and tested for purity and
moisture using a thermo-gravimetric analyzer (TGA). On a routine basis, the plant laboratory
also tested the absorber slurry for pH, specific gravity and percent solids. All of the test results,
plus additional process highlights and observations, were compiled and recorded to support the
root cause analysis.
RESULTS
Stage 1
Surprisingly, the Unit 78 gypsum moisture values did not exceed the specification limits during
the test plan even under the most concentrated conditions, as shown in Figure 3.

5
Figure 3. Results of Stage 1 Test
After the onset of the testing on Unit 78, Boiler Units 5 and 6 returned to service and resumed
operation under normal AQCS conditions. Gypsum moisture excursions returned to the Unit 56
system but were absent on Unit 78, even though Unit 78 was operating with increased
concentrations of dissolved species. See Figure 4.
0
1,000
2,000
3,000
4,000
5,000
6,000
0
5
10
15
20
25
11/7/12 11/17/12 11/27/12 12/7/12 12/17/12 12/27/12 1/6/13 1/16/13 1/26/13 2/5/13 2/15/13
Ab
sorb
er C
hlo
rid
es,
pp
m
Gyp
sum
Mo
istu
re,
%
Date
Unit 78 Gypsum Moisture Unit 78 Chlorides

6
Figure 4. Unit 56 & 78 Gypsum Moisture during Stage 1 Test
Although this was an unexpected development, the timing of events proved to be advantageous
as they allowed Foster Wheeler to simultaneously analyze the differences between the systems
and to determine why one absorber was producing poor gypsum crystals while the other was not.
Of particular interest was the solution chemistry of each absorber, since Unit 78 was operating
with much lower purge rates without any adverse effects on gypsum. The excursion indicated
that the issue was unique to Unit 56, and therefore any system shared with Unit 78 could be
eliminated as the root cause.
Thus began a more thorough investigation of upstream boiler operation, SCR operation, and ESP
performance to determine what, if any, differences could be found. Upon investigation, it was
noticed that the absorber inlet opacity on Unit 56 was generally higher than that of Unit 78.
Performance test results agreed with the measurements of the installed opacity instruments,
confirming a higher particulate loading to the Unit 56 Absorber and subsequent higher
particulate capture as compared to the Unit 78 Absorber.
Stage 2 of the root cause analysis was then initiated to further explore the detailed differences in
liquor-phase concentrations that may correspond to opacity and flyash elements.
0
5
10
15
20
25
11/7/12 11/17/12 11/27/12 12/7/12 12/17/12 12/27/12 1/6/13 1/16/13 1/26/13
Gyp
sum
Mo
istu
re,
%
Date
Unit 78 Unit 56

7
METHODOLOGY
Stage 2
Based on the Stage 1 results, the test program for Stage 2 reflected a more focused program.
Sample collection was closely coordinated with operational changes in the scrubber. Stage 2
highlights were as follows.
1. Several simultaneous absorber slurry and gypsum samples were collected from Unit 56
and Unit 78 using the same procedure and under similar operating conditions as
described in Stage 1 methodology. Since the filter feed tank is common to both units, the
slurry from each absorber was segregated to the extent possible.
2. The operating pH of the Unit 56 Absorber was increased from 5.7 to 6.0. The operating
pH of Unit 78 remained unchanged. Absorber chloride concentrations were maintained.
3. Additional samples were collected from Unit 56 and Unit 78 after the pH change.
4. All samples were analyzed as described in Stage 1 methodology.
5. Monitoring of gypsum moisture values continued during Stage 2.
Flyash samples were collected from each of the four units at Plant A and also from the two units
at Plant B. The samples were analyzed by RJ Lee Group for elemental composition, mineralogy,
particle size and leaching properties. Two different leach tests were done. The first was the
standard SPLP Leach Test (EPA Method 1312). The second leach test was a modified leaching
procedure aimed at simulating FGD operating conditions. A brief summary of the modified
procedure is as follows.
1. Mixed 100 ml DI water and 20 g flyash into a beaker and began to continuously stir.
2. Took initial pH and recorded.
3. pH was then adjusted to 5.7 with H2SO4.
4. Mixture was continuously stirred for 48 hours while trying to maintain a pH of 5.7.
5. After 48 hours, slurry was filtered, and the filtrate was analyzed for dissolved elements.
RESULTS
Stage 2
Analysis of the Unit 56 and Unit 78 Absorber chemistries revealed that significant differences
existed between the absorbers regarding the concentrations of dissolved species. Because of the
difference in purge rates between the absorbers, Unit 56 had three times less chlorides than Unit
78. It was therefore expected that the other dissolved components should be approximately three
times less in Unit 56 as compared to Unit 78. This was the case for most of the species, but there
were a few notable exceptions. Specifically, major elements associated with flyash, such as
aluminum, iron, and silicon, were found at significantly elevated levels in Unit 56. Certain other
elements were found in levels so close to detection limits that they were considered insignificant
even though the ratio between absorbers was high.

8
After the pH increase on Unit 56, gypsum moisture began to improve. The samples taken after
the change showed a significant decrease in the amount of aluminum in Unit 56 slurry. The data
in Table 1 shows these ratios before and after the pH change.
Table 1. Ratio of Dissolved Elements, Unit 56 to Unit 78
Unit 56 pH = 5.7 Unit 56 pH = 6.0
Sample 1 Sample 2 Sample 3 Sample 4 Sample 5 Sample 6
Chloride 0.4 0.3 0.3 0.2 0.2 0.4
Fluoride 0.4 0.4 0.4 0.3 0.4 0.4
Aluminum 2.8 2.3 3.5 1.2 0.5 0.2
Barium 0.8 0.8 0.9 1.1 1.0 0.9
Beryllium 1.6 0.9 0.8 ND 0.2 0.2
Boron 0.5 0.5 0.3 0.3 0.4 0.4
Cadmium 0.7 0.6 0.4 0.3 0.2 0.4
Calcium 1.0 1.1 1.1 1.0 1.0 1.0
Chromium 0.7 0.6 0.8 0.6 0.5 0.7
Cobalt 0.5 0.4 0.4 0.3 0.3 0.3
Copper 0.9 0.9 0.6 0.4 0.4 0.3
Iron ND 0.4 2.8 2.6 1.1 1.1
Magnesium 0.4 0.4 0.3 0.3 0.3 0.3
Manganese 0.4 0.4 0.3 0.3 0.3 0.3
Molybdenum 0.8 0.7 0.5 0.4 0.4 0.4
Potassium 0.5 0.5 0.3 0.3 0.3 0.3
Nickel 0.4 0.3 0.3 0.3 0.3 0.3
Selenium 1.4 1.2 0.6 0.4 0.6 0.3
Silicon 1.6 1.8 1.6 1.6 1.4 1.5
Strontium 0.8 0.8 0.7 1.1 1.1 0.8
Sodium 0.5 0.5 0.3 0.3 0.3 0.4
Titanium 2.0 0.6 1.0 1.0 1.3 0.4
Vanadium 10.0 10.0 3.6 4.4 2.4 ND
Zinc 0.9 0.8 0.8 0.7 0.5 0.6
Flyash analysis showed that the mineralogy and elemental composition were fairly consistent
among all four Plant A units. Samples from Plant B showed some minor differences in
mineralogy and elemental composition as compared to Plant A. The particle size distribution of
all Plant A samples was the same, but the Plant B samples had a larger average particle size
distribution. However, major differences were observed in the leaching test results of Unit 5
flyash as compared to those of the other samples. Using the SPLP method, Unit 5 flyash leached
significantly more elements, particularly aluminum, iron and silicon. Unit 5 flyash also leached
significantly more aluminum using the simulated FGD conditions leach test. The results are
shown in Table 2 and Table 3.

9
Table 2. SPLP Leach Test
All results reported in mg/L
Plant A
Unit 5
Plant A
Unit 6
Plant A
Unit 7
Plant A
Unit 8
Plant B
Unit 1
Plant B
Unit 2
Aluminum 267 86.0 80.4 111 13.1 44.3
Barium 25.0 16.1 19.2 16.6 5.3 2.7
Beryllium < 0.0080 < 0.0080 < 0.0080 < 0.0080 < 0.0080 < 0.0080
Boron 1.44 0.764 0.584 0.140 3.11 0.102
Cadmium 0.011 < 0.010 < 0.010 < 0.010 < 0.010 < 0.010
Calcium 563 302 286 275 177 124
Chromium 0.285 < 0.020 < 0.020 < 0.020 0.079 0.301
Cobalt 0.050 < 0.020 < 0.020 < 0.020 < 0.020 < 0.020
Iron 86.2 < 0.050 0.083 0.272 < 0.050 < 0.050
Magnesium 71.0 < 0.050 0.0802 0.293 < 0.100 < 0.100
Manganese 0.350 < 0.020 < 0.020 < 0.020 < 0.020 < 0.020
Molybdenum 0.082 < 0.020 < 0.020 < 0.020 0.0.098 0.168
Nickel 0.096 < 0.010 < 0.010 < 0.010 < 0.010 < 0.010
Potassium 10.8 2.61 3.42 3.97 0.753 1.96
Selenium < 0.0500 < 0.0500 < 0.0500 < 0.0500 < 0.0500 < 0.0500
Silicon 122 0.131 0.284 0.771 1.71 0.908
Sodium 57.0 22.0 33.3 24.8 21.2 31.9
Strontium 22.8 24.6 27.2 21.8 19.6 11.2
Titanium 15.5 < 0.070 < 0.070 < 0.070 < 0.070 < 0.070
Vanadium 0.475 < 0.010 < 0.010 < 0.010 0.014 0.034
Zinc 0.335 < 0.050 < 0.050 < 0.050 < 0.050 < 0.050
Mercury 0.0007 < 0.0002 < 0.0002 < 0.0002 0.0002 < 0.0002

10
Table 3. Simulated FGD Conditions Leach Test
All results reported in mg/L
Plant A
Unit 5
Plant A
Unit 6
Plant A
Unit 7
Plant A
Unit 8
Plant B
Unit 1
Plant B
Unit 2
Aluminum 2110 0.0784 3.20 0.347 0.249 0.197
Barium 0.256 0.172 0.193 0.181 0.200 0.0621
Beryllium 0.240 < 0.0080 < 0.0080 < 0.0080 < 0.0080 < 0.0080
Boron 71.0 36.6 49.2 39.0 59.8 50.7
Cadmium 0.086 < 0.010 0.036 0.019 < 0.010 0.075
Calcium 587 422 427 423 447 425
Chromium 1.92 0.557 0.148 0.416 2.02 0.062
Cobalt 2.19 0.297 0.965 0.514 0.024 1.22
Iron 44.0 < 0.050 < 0.050 < 0.050 < 0.050 < 0.050
Magnesium 3910 2100 3930 2540 1040 2320
Manganese 12.7 0.492 2.57 0.927 0.315 8.30
Molybdenum 0.035 0.129 0.027 0.084 0.188 < 0.020
Nickel 4.83 1.08 2.25 1.40 0.306 3.20
Potassium 63.6 8.54 36.6 16.5 5.30 19.9
Selenium 0.164 0.208 0.177 0.203 0.090 < 0.050
Silicon 325 33.8 57.7 42.5 24.6 24.8
Sodium 409 183 331 177 94.1 197
Strontium 19.2 11.1 9.18 10.4 16.3 10.9
Titanium 1.99 < 0.070 < 0.070 < 0.070 < 0.070 < 0.070
Vanadium 0.094 0.043 0.010 0.027 0.039 < 0.010
Zinc 15.8 < 0.050 2.35 0.596 <0.050 4.53
Mercury < 0.0002 < 0.0002 < 0.0002 < 0.0002 0.0003 < 0.0002
initial pH 11.26 11.32 11.71 11.68 11.2 11.1
The results of the leach tests correspond to the liquor-phase composition of the slurries. Elevated
levels of elements such as aluminum, iron and silicon found in the Unit 56 slurry can be
attributed to the unusual leaching behavior of the Unit 5 flyash. The leaching characteristics of
Unit 7 and 8 flyash correlates to the lower levels of dissolved elements found in Unit 78 slurry.
The leaching data also agrees with the presence of a problem on Unit 56 and the absence of a
problem on Unit 78.
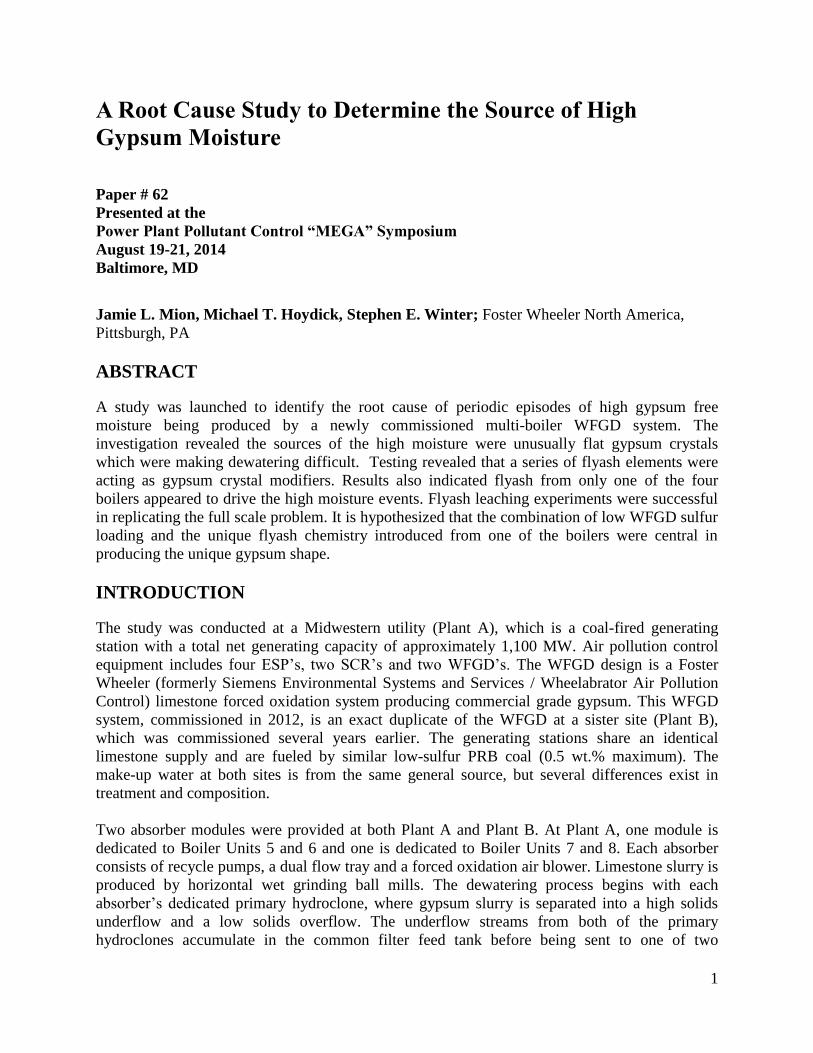
Test data showed that aluminum was an element that trended well with Unit 56 gypsum
moisture. Figure 5 shows increased aluminum concentrations were observed during gypsum
moisture excursions. It also shows that increases in pH reduced the liquid phase aluminum
concentration, which subsequently improved gypsum moisture.
11
Figure 5. Unit 56 Gypsum Moisture and Aluminum Concentration in Relation to pH
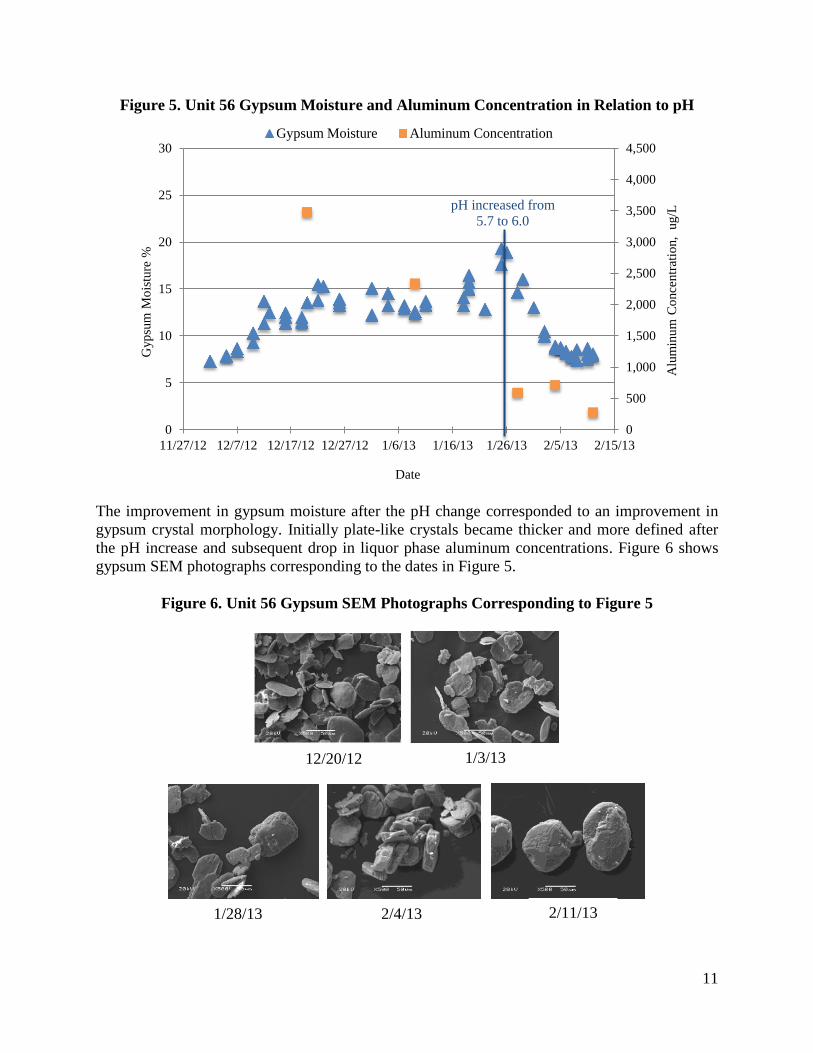
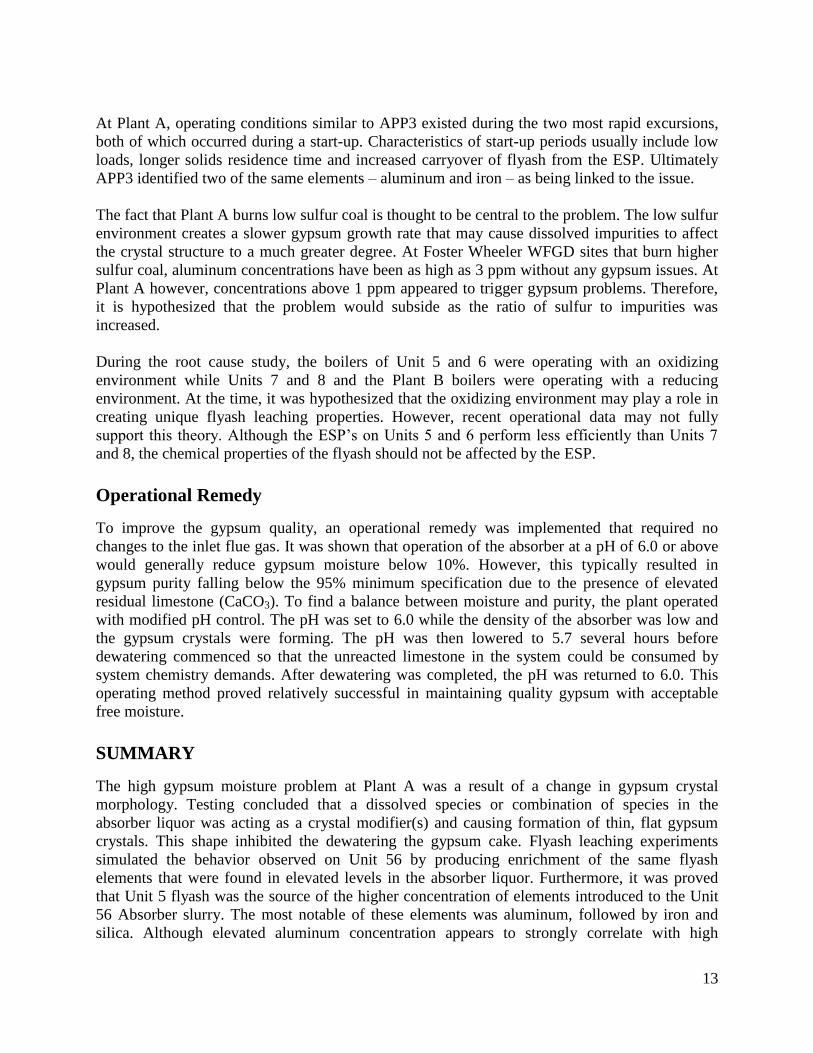
The improvement in gypsum moisture after the pH change corresponded to an improvement in
gypsum crystal morphology. Initially plate-like crystals became thicker and more defined after
the pH increase and subsequent drop in liquor phase aluminum concentrations. Figure 6 shows
gypsum SEM photographs corresponding to the dates in Figure 5.
Figure 6. Unit 56 Gypsum SEM Photographs Corresponding to Figure 5
0
500
1,000
1,500
2,000
2,500
3,000
3,500
4,000
4,500
0
5
10
15
20
25
30
11/27/12 12/7/12 12/17/12 12/27/12 1/6/13 1/16/13 1/26/13 2/5/13 2/15/13
Alu
min
um
Co
nce
ntr
atio
n,
ug/L
Gyp
sum
Mo
istu
re %
Date
Gypsum Moisture Aluminum Concentration
pH increased from
5.7 to 6.0
12/20/12 1/3/13
1/28/13 2/4/13 2/11/13

12
Review of all data collected from Unit 56 showed that the aluminum and gypsum moisture trend
existed prior to the Stage 2 study, as seen in Figure 7. For clarity, pH changes were omitted from
this chart.
Figure 7. Unit 56 Gypsum Moisture and Aluminum Concentration
Although aluminum appears to have a strong relationship with gypsum crystal deformation, it
cannot be concluded definitively that aluminum is the problem. Aluminum could be a tracker for
another element, or it may be a particular combination of elements that act together to inhibit or
modify the growth of gypsum crystals. However, it can be concluded that these species leached
from the Unit 5 flyash are modifying gypsum crystals and that a higher operating pH will reduce
their concentration in the absorber liquor.
DISCUSSION
At least one other similar episode of a high gypsum moisture excursion has been reported2.
Amager Power Plant Unit 3 (APP3) in Denmark is fueled by a bituminous coal with 0.41-0.71
wt.% sulfur. The problem at this site began during a start-up period during which plugged pipes
were limiting the purge capacity and the ESP was allowing increased amounts of flyash into the
absorber. Foaming had interfered with the online density measurement, so the solids
concentration had built beyond normal dewatering limits. As such, the solids residence time
increased to greater than twice the normal amount. Additionally, the plant was operating at low
load and burning lower-than-design sulfur content coal. Microscopy of the gypsum during the
excursion showed the same thin, plate-like structure that was observed in Unit 56 Absorber at
Plant A. The morphology change at APP3 was associated with high levels of dissolved
aluminum, fluoride and iron in the scrubber liquor.
0
500
1,000
1,500
2,000
2,500
3,000
3,500
4,000
4,500
0
5
10
15
20
25
30
3/2/12 3/22/12 4/11/12 5/1/12 5/21/12 6/10/12 6/30/12 7/20/12 8/9/12 8/29/12
Alu
min
um
Co
nce
ntr
atio
n,
ug/L
Gyp
sum
Mo
istu
re,
%
Date
Gypsum Moisture Aluminum Concentration
13
At Plant A, operating conditions similar to APP3 existed during the two most rapid excursions,
both of which occurred during a start-up. Characteristics of start-up periods usually include low
loads, longer solids residence time and increased carryover of flyash from the ESP. Ultimately
APP3 identified two of the same elements – aluminum and iron – as being linked to the issue.
The fact that Plant A burns low sulfur coal is thought to be central to the problem. The low sulfur
environment creates a slower gypsum growth rate that may cause dissolved impurities to affect
the crystal structure to a much greater degree. At Foster Wheeler WFGD sites that burn higher
sulfur coal, aluminum concentrations have been as high as 3 ppm without any gypsum issues. At
Plant A however, concentrations above 1 ppm appeared to trigger gypsum problems. Therefore,
it is hypothesized that the problem would subside as the ratio of sulfur to impurities was
increased.
During the root cause study, the boilers of Unit 5 and 6 were operating with an oxidizing
environment while Units 7 and 8 and the Plant B boilers were operating with a reducing
environment. At the time, it was hypothesized that the oxidizing environment may play a role in
creating unique flyash leaching properties. However, recent operational data may not fully
support this theory. Although the ESP’s on Units 5 and 6 perform less efficiently than Units 7
and 8, the chemical properties of the flyash should not be affected by the ESP.
Operational Remedy
To improve the gypsum quality, an operational remedy was implemented that required no
changes to the inlet flue gas. It was shown that operation of the absorber at a pH of 6.0 or above
would generally reduce gypsum moisture below 10%. However, this typically resulted in
gypsum purity falling below the 95% minimum specification due to the presence of elevated
residual limestone (CaCO3). To find a balance between moisture and purity, the plant operated
with modified pH control. The pH was set to 6.0 while the density of the absorber was low and
the gypsum crystals were forming. The pH was then lowered to 5.7 several hours before
dewatering commenced so that the unreacted limestone in the system could be consumed by
system chemistry demands. After dewatering was completed, the pH was returned to 6.0. This
operating method proved relatively successful in maintaining quality gypsum with acceptable
free moisture.
SUMMARY
The high gypsum moisture problem at Plant A was a result of a change in gypsum crystal
morphology. Testing concluded that a dissolved species or combination of species in the
absorber liquor was acting as a crystal modifier(s) and causing formation of thin, flat gypsum
crystals. This shape inhibited the dewatering the gypsum cake. Flyash leaching experiments
simulated the behavior observed on Unit 56 by producing enrichment of the same flyash
elements that were found in elevated levels in the absorber liquor. Furthermore, it was proved
that Unit 5 flyash was the source of the higher concentration of elements introduced to the Unit
56 Absorber slurry. The most notable of these elements was aluminum, followed by iron and
silica. Although elevated aluminum concentration appears to strongly correlate with high

14
moisture events at Plant A, it may be a combination of elements causing the crystal modification.
Increasing the operating pH of the absorber lowered the concentration of aluminum and other
elements in the absorber liquor, subsequently improving the gypsum crystal shape and
dewatering abilities. Using this knowledge, an operating plan was implemented that fluctuated
the operating pH, thus providing a reliable and effective solution to the problem.
It is believed that the low-sulfur nature of the plant contributes to the problem due to a low ratio
of sulfur to impurities. More research is required to determine the cause of the unique leaching
properties of Unit 5 flyash, although it is theorized that the boiler combustion process may play a
role in altering the chemical properties of the flyash.
ACKNOWLEDGEMENTS
Foster Wheeler would like to thank RJ Lee Group for flyash testing and SEM analysis and
Siemens Water Enviroscan for chemical characterization of slurry samples.
REFERENCES
1. Hamdona, S.K.; Al Hadad, U.A. Crystallization of Calcium Sulfate Dihydrate in the Presence
of Some Metal Ions. J. Crystal Growth. 2007, 299, 146-151.
2. Hansen, B.B. Crystallisation of Gypsum and Prevention of Foaming in Wet Flue Gas
Desulphurisation (FGD) Plants. Ph.D. Thesis, Technical University of Denmark,
Copenhagen, Denmark, 2009.
KEYWORDS
Gypsum moisture, crystal modifier, flyash leaching, wet scrubber, WFGD