Embed Size (px)
Citation preview
HAL Id: hal-02349117https://hal.archives-ouvertes.fr/hal-02349117
Submitted on 7 Dec 2020
HAL is a multi-disciplinary open accessarchive for the deposit and dissemination of sci-entific research documents, whether they are pub-lished or not. The documents may come fromteaching and research institutions in France orabroad, or from public or private research centers.
L’archive ouverte pluridisciplinaire HAL, estdestinée au dépôt et à la diffusion de documentsscientifiques de niveau recherche, publiés ou non,émanant des établissements d’enseignement et derecherche français ou étrangers, des laboratoirespublics ou privés.
A robust implicit measure of facial attractivenessdiscrimination
Qiuling Luo, Bruno Rossion, Milena Dzhelyova
To cite this version:Qiuling Luo, Bruno Rossion, Milena Dzhelyova. A robust implicit measure of facial attractivenessdiscrimination. Social Cognitive and Affective Neuroscience, Oxford University Press (OUP), 2019,14 (7), pp.737-746. �10.1093/scan/nsz043�. �hal-02349117�
Received: 29 May 2018; Revised: 3 June 2019; Accepted: 10 June 2019
© The Author(s) 2019. Published by Oxford University Press.This is an Open Access article distributed under the terms of the Creative Commons Attribution NonCommercial-NoDerivs licence (http://creativecommons.org/licenses/by-nc-nd/4.0/), which permits non-commercial reproduction and distribution of the work, in any medium, providedthe original work is not altered or transformed in any way, and that the work properly cited. For commercial re-use, please contact [email protected]
737
Social Cognitive and Affective Neuroscience, 2019, 737–746
doi: 10.1093/scan/nsz043Advance Access Publication Date: 18 July 2019Original article
A robust implicit measure of facial attractivenessdiscriminationQiuling Luo,1,2 Bruno Rossion,2,3,4 and Milena Dzhelyova 2
1Institute of Psychology, School of Teacher Education, Zhejiang Normal University, 321004, Jinhua, China2Psychological Sciences Research Institute and Institute of Neuroscience, University of Louvain, 1348, Louvainla Neuve, Belgium 3Université de Lorraine, Centre Hospitalier Régional Universitaire-Nancy, Service deNeurologie, F-54000 Nancy, France 4Centre de Recherche en Automatique de Nancy, Université de Lorraine, LeCentre national de la recherche scientifique, F-54000 Nancy, France
Correspondence should be addressed to Milena Dzhelyova, Université catholique de Louvain (UCL), Institut de Recherche en Sciences Psychologiques(IPSY), Place du Cardinal Mercier, 10 B-1348 Louvain-la-Neuve, Belgium. E-mail: [email protected].
Abstract
Decisions of attractiveness from the human face are made instantly and spontaneously, but robust implicit neural measuresof facial attractiveness discrimination are currently lacking. Here we applied fast periodic visual stimulation coupled withelectroencephalography (EEG) to objectively measure the neural coding of facial attractiveness. We presented differentpictures of faces at 6 Hz, i.e. six faces/second, for a minute while participants attended to a central fixation cross andindicated whether the cross shortly changed color. Every other face in the stimulation was attractive and was replaced by arelatively less attractive face. This resulted in alternating more/less attractive faces at a 3 Hz rate, eliciting a significant in-crease in occipito-temporal EEG amplitude at 3 Hz both at the group and the individual participant level. This response wasabsent in two control conditions where either only attractive or only less attractive faces were presented. These observationssupport the view that face-sensitive visual areas discriminate attractiveness implicitly and rapidly from the human face.
Key words: facial attractiveness perception; FPVS
Introduction
Within a split second, human observers can extract a wealthof information from the face of an individual to categorize thisperson according to age, gender, ethnicity, emotional expression,etc. Observers even rapidly attribute social traits to a person,such as the degree to which the person can be trusted (e.g.Bar et al., 2006; Willis and Todorov, 2006; Todorov et al., 2009).Even though the validity of personality judgments has beenquestioned (e.g. Alley, 1988; Cook, 1939; but see also Penton-Voaket al., 2006; Stirrat & Perrett, 2010), people generally agree onthese judgments. Yet, trait attributions often have real-life con-sequences (e.g. Hassin and Trope, 2000; Langlois et al., 2000;Zebrowitz and Montepare, 2008), impacting cooperation (Stirratand Perrett, 2010), political elections (Todorov et al., 2005; Littleet al., 2007), court verdicts (Zebrowitz and McDonald, 1991; Blair
et al., 2004), job interviews (Langlois et al., 2000), career success(Mueller and Mazur, 1996; Rule and Ambady, 2008), etc. In partic-ular, attractiveness perception has a far-reaching influence onsocial behavior. It does not only affect mate choice and choiceof friends, but it also influences the impressions we form aboutan individual—‘the attractiveness halo effect’ (Dion et al., 1972;Nisbett and Wilson, 1977). As a result, attractive individuals aremore likely to be hired (for a review, see Hosoda et al., 2003),tend to earn more money (Hamermesh and Biddle, 1993) andexperience greater dating success (Walster et al., 1966; Woll, 1986)as well as social success (Prestia et al., 2002) than their less attrac-tive counterparts. Facial traits (e.g. symmetry and gender typi-cality) indicating the biological fitness of an individual are cross-culturally perceived as attractive (Perrett et al., 1999; Rhodes et al.,2001), and preferences for attractive faces are shown early in life
Dow
nloaded from https://academ
ic.oup.com/scan/article/14/7/737/5520404 by IC
L-Alexis Vautrin user on 07 Decem
ber 2020
738 Social Cognitive and Affective Neuroscience, 2019, Vol. 14, No. 7
with infants looking more towards attractive faces (Slater et al.,1998; Slater et al., 2000). Given the association of beauty and themotivational value it has, it is not surprising that processing ofattractiveness recruits brain regions involved in face processingbut also regions involved in the reward circuit (Aharon et al., 2001;Berridge and Kringelbach, 2008; O’Doherty et al., 2003; Winstonet al., 2007; for a review see Senior, 2003), which implies thatphysical attractiveness may hold incentive salience (Kawabataand Zeki, 2004; Vartanian and Goel, 2004; Cupchik et al., 2009).
Despite the importance of attractiveness perception in real-life decision, a single glance at one’s face appears to be enoughto make an attractiveness decision of a face stimulus (Olson andMarshuetz, 2005; Willis and Todorov, 2006). Moreover, judgmentsmade after limited time exposure are correlated with judgmentsmade after prolonged stimulus presentation. The consensusrapidly increases as time exposure increases and reaches aplateau at presentation duration of about 200 ms, suggestingthat if people are given longer viewing periods, they would onlybe more confident about their judgments instead of changingthem (Willis and Todorov, 2006). In addition, these decisions arealso mandatory, i.e. they cannot be avoided (Ritchie et al., 2017).
Similarly to behavioral data, some electrophysiological stud-ies suggest that attractiveness is extracted automatically at anearly perceptual level, as indicated by differences in ampli-tude or peak latencies of a negativity peaking over posterior-occipital sites ∼170 ms (i.e. the face-sensitive N170) for more orless attractive faces (Pizzagalli et al., 2002; Marzi and Viggiano,2010; van Hooff et al., 2011; Zhang and Deng, 2012; Hahn et al.,2016). Yet, the direction of the modulation of N170 is equivocal,with some studies reporting increased amplitudes for attractivefaces (e.g. Marzi and Viggiano, 2010), others finding increasedamplitudes for unattractive faces (e.g. Hahn et al., 2016) and stillothers reporting effects of facial attractiveness only for latercomponents (early posterior negativity, late positive component;e. g. Werheid et al., 2007; Wiese et al., 2014). The latter componentsreflect heightened processing referring to emotional, motiva-tional and attentional aspects of the stimuli (e.g. Werheid et al.,2007; Zhang and Deng, 2012; Wiese et al., 2014). Some of thesediscrepancies could result from different task requirements,as evidence for the automatic processing of attractiveness isusually found in explicit tasks (e.g. Willis and Todorov, 2006;Zhang and Deng, 2012; Hahn et al., 2016). Furthermore, stimulipresented in electrophysiological studies often appear for fairlylong intervals ranging from 450 ms (Pizzagalli et al., 2002) to 5 s(Wiese et al., 2014), allowing early perceptual coding as well asdeeper emotional and motivational processing and thus provid-ing only indirect and/or limited information about the automaticprocessing of attractiveness.
What would be highly desirable is an unambiguous implicitmeasure of facial attractiveness discrimination that could beidentified objectively and relatively rapidly. To this end, weprobed the automatic (i.e. effortless and without the intentionto do so or being able to suppress this visual discriminationprocess) and implicit processing of facial attractiveness with asimple fast periodic visual stimulation (FPVS) approach coupledwith electroencephalography (EEG). More attractive and lessattractive faces were presented alternating at a fixed rate of 6 Hz(∼167 ms), permitting only a single glance at each stimulus. Thisstimulation mode leads to clear frequency-tagged responses at6 Hz and harmonics in the EEG spectrum (Adrian and Matthews,1934; Regan, 1966; Norcia et al., 2015). Critically, if the two typesof stimuli are coded by distinct spatio-temporal patterns ofneural activity, an asymmetrical response in the EEG frequencydata should be recorded at exactly 6 Hz/2 = 3 Hz (e.g. Ales et
al., 2012; Liu-Shuang et al., 2015 for asymmetrical responsesbetween faces and scrambled faces). Thus, for example, apopulation of neurons responding preferentially to one stimuluscategory (either the more or the less attractive faces) will firemore or only when this coded category is presented, namelyevery 333 ms, resulting in 3 Hz response. This additional3 Hz response can be directly quantified in the EEG frequencydomain through Fourier transform and may provide an indexfor the perception of facial attractiveness. In earlier studiesexamining face identity perception with this paradigm (Retterand Rossion, 2016, 2017) given that there was no reason toexpect a differential neural response at the population levelbetween different individual faces, an asymmetrical responsewas generated by introducing adaptation to one of the stimuli(see also Ales and Norcia, 2009; Hoffmann et al., 2001; Tyler andKaitz, 1977 for motion coding). Here, based on studies showingdifferential processing of attractive and unattractive faces, wepredicted that the alternation of more and less attractive faceswould generate asymmetrical responses in the EEG spectrum,even without adaptation. More importantly, in comparison toprevious studies using this paradigm where only two stimulihave been alternated, we presented variable individual faces ateach stimulation cycle to allow ruling out the contribution ofspecific characteristics of an individual face.
Methods
Participants
A total of 15 volunteers (6 males, mean ± s.d. age = 23.13 ±1.81 years) participated in the study. They were all right-handed,free of neurological or psychiatric problems and had normal orcorrected-to-normal vision. All participants provided signed andinformed consent and were paid an amount according to theirtesting time. The study was approved by the Biomedical EthicalCommittee of the University of Louvain. Behavioral data fromone participant were excluded due to a saving failure, yet theEEG recordings were included in the final analysis.
Stimuli
A total of 80 color photographs of female and male facesfrom several databases were initially evaluated on attractive-ness (1 = extremely unattractive; 7 = extremely attractive) byan independent participant sample (10 males, 16 females,mean ± s.d. age = 21.46 ± 1.88 years). Subsequently, faces fromFace Categorization database used in previous studies (Laguesseet al., 2012; with FPVS: Liu-Shuang et al., 2014; Dzhelyova andRossion, 2014a, 2014b) with the six highest and the six lowestattractiveness ratings for each sex were selected for the presentstudy to avoid physical discrepancy in the image set (Figure 1).The ratings for the more attractive faces (M = 3.79, s.d.= 0.42)were significantly higher than those for the less attractive faces(M = 2.47, s.d.= 0.17), P < 0.001. All 24 faces were in a frontal viewwith forward eye gaze, with masked external features such asears and hair. The image size was set to 8.04 deg (width) × 16.00deg (height) at an 80 cm distance from the monitor (800 × 600),placed against a grey background (RGB: 153, 153, 153).
Several facial characteristics could influence perceptionof facial attractiveness: sexual dimorphism (e.g. Perrett et al.,1998; Rhodes et al., 2000; Debruine et al., 2010; Scott et al., 2010),averageness (e.g. Langlois & Roggman, 1990; Little and Hancock,2002; Rhodes et al., 2002) or facial expression (e.g. Mueseret al., 1984). To evaluate if these characteristics impact the
Dow
nloaded from https://academ
ic.oup.com/scan/article/14/7/737/5520404 by IC
L-Alexis Vautrin user on 07 Decem
ber 2020
Q. Luo et al. 739
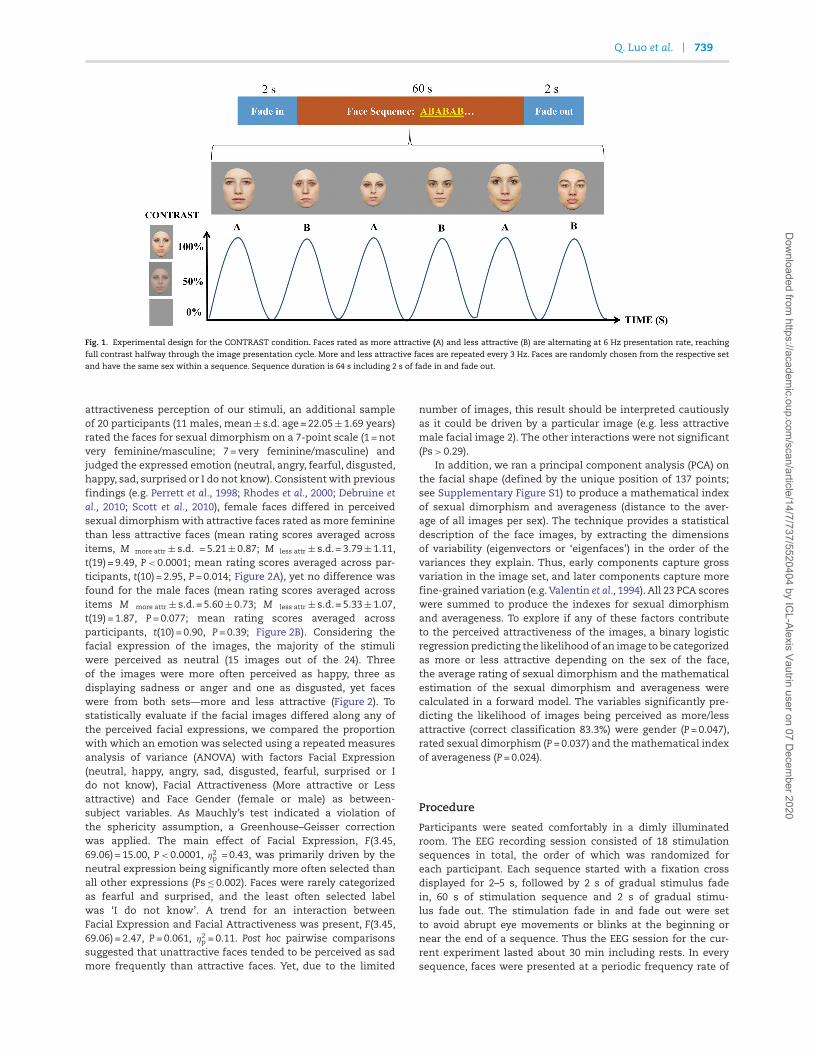
Fig. 1. Experimental design for the CONTRAST condition. Faces rated as more attractive (A) and less attractive (B) are alternating at 6 Hz presentation rate, reaching
full contrast halfway through the image presentation cycle. More and less attractive faces are repeated every 3 Hz. Faces are randomly chosen from the respective set
and have the same sex within a sequence. Sequence duration is 64 s including 2 s of fade in and fade out.
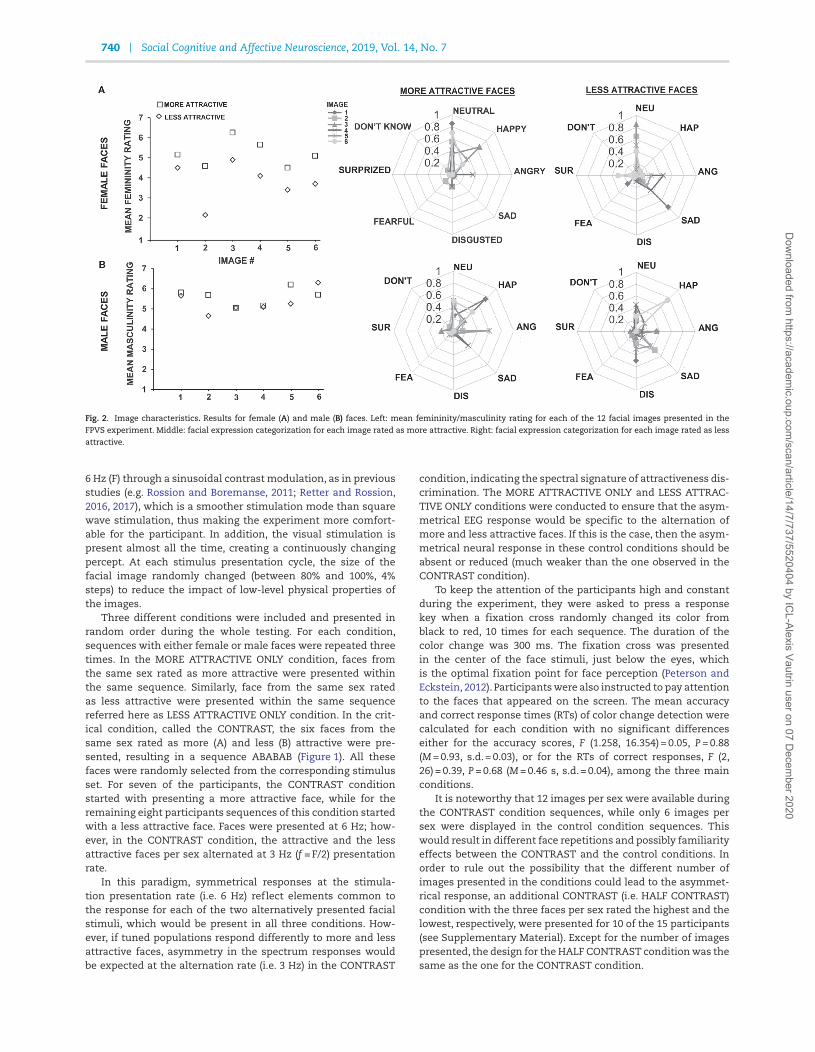
attractiveness perception of our stimuli, an additional sampleof 20 participants (11 males, mean ± s.d. age = 22.05 ± 1.69 years)rated the faces for sexual dimorphism on a 7-point scale (1 = notvery feminine/masculine; 7 = very feminine/masculine) andjudged the expressed emotion (neutral, angry, fearful, disgusted,happy, sad, surprised or I do not know). Consistent with previousfindings (e.g. Perrett et al., 1998; Rhodes et al., 2000; Debruine etal., 2010; Scott et al., 2010), female faces differed in perceivedsexual dimorphism with attractive faces rated as more femininethan less attractive faces (mean rating scores averaged acrossitems, M more attr ± s.d. = 5.21 ± 0.87; M less attr ± s.d.= 3.79 ± 1.11,t(19) = 9.49, P < 0.0001; mean rating scores averaged across par-ticipants, t(10) = 2.95, P = 0.014; Figure 2A), yet no difference wasfound for the male faces (mean rating scores averaged acrossitems M more attr ± s.d.= 5.60 ± 0.73; M less attr ± s.d.= 5.33 ± 1.07,t(19) = 1.87, P = 0.077; mean rating scores averaged acrossparticipants, t(10) = 0.90, P = 0.39; Figure 2B). Considering thefacial expression of the images, the majority of the stimuliwere perceived as neutral (15 images out of the 24). Threeof the images were more often perceived as happy, three asdisplaying sadness or anger and one as disgusted, yet faceswere from both sets—more and less attractive (Figure 2). Tostatistically evaluate if the facial images differed along any ofthe perceived facial expressions, we compared the proportionwith which an emotion was selected using a repeated measuresanalysis of variance (ANOVA) with factors Facial Expression(neutral, happy, angry, sad, disgusted, fearful, surprised or Ido not know), Facial Attractiveness (More attractive or Lessattractive) and Face Gender (female or male) as between-subject variables. As Mauchly’s test indicated a violation ofthe sphericity assumption, a Greenhouse–Geisser correctionwas applied. The main effect of Facial Expression, F(3.45,69.06) = 15.00, P < 0.0001, η2
p = 0.43, was primarily driven by theneutral expression being significantly more often selected thanall other expressions (Ps ≤ 0.002). Faces were rarely categorizedas fearful and surprised, and the least often selected labelwas ‘I do not know’. A trend for an interaction betweenFacial Expression and Facial Attractiveness was present, F(3.45,69.06) = 2.47, P = 0.061, η2
p = 0.11. Post hoc pairwise comparisonssuggested that unattractive faces tended to be perceived as sadmore frequently than attractive faces. Yet, due to the limited
number of images, this result should be interpreted cautiouslyas it could be driven by a particular image (e.g. less attractivemale facial image 2). The other interactions were not significant(Ps > 0.29).
In addition, we ran a principal component analysis (PCA) onthe facial shape (defined by the unique position of 137 points;see Supplementary Figure S1) to produce a mathematical indexof sexual dimorphism and averageness (distance to the aver-age of all images per sex). The technique provides a statisticaldescription of the face images, by extracting the dimensionsof variability (eigenvectors or ‘eigenfaces’) in the order of thevariances they explain. Thus, early components capture grossvariation in the image set, and later components capture morefine-grained variation (e.g. Valentin et al., 1994). All 23 PCA scoreswere summed to produce the indexes for sexual dimorphismand averageness. To explore if any of these factors contributeto the perceived attractiveness of the images, a binary logisticregression predicting the likelihood of an image to be categorizedas more or less attractive depending on the sex of the face,the average rating of sexual dimorphism and the mathematicalestimation of the sexual dimorphism and averageness werecalculated in a forward model. The variables significantly pre-dicting the likelihood of images being perceived as more/lessattractive (correct classification 83.3%) were gender (P = 0.047),rated sexual dimorphism (P = 0.037) and the mathematical indexof averageness (P = 0.024).
Procedure
Participants were seated comfortably in a dimly illuminatedroom. The EEG recording session consisted of 18 stimulationsequences in total, the order of which was randomized foreach participant. Each sequence started with a fixation crossdisplayed for 2–5 s, followed by 2 s of gradual stimulus fadein, 60 s of stimulation sequence and 2 s of gradual stimu-lus fade out. The stimulation fade in and fade out were setto avoid abrupt eye movements or blinks at the beginning ornear the end of a sequence. Thus the EEG session for the cur-rent experiment lasted about 30 min including rests. In everysequence, faces were presented at a periodic frequency rate of
Dow
nloaded from https://academ
ic.oup.com/scan/article/14/7/737/5520404 by IC
L-Alexis Vautrin user on 07 Decem
ber 2020
740 Social Cognitive and Affective Neuroscience, 2019, Vol. 14, No. 7
Fig. 2. Image characteristics. Results for female (A) and male (B) faces. Left: mean femininity/masculinity rating for each of the 12 facial images presented in the
FPVS experiment. Middle: facial expression categorization for each image rated as more attractive. Right: facial expression categorization for each image rated as less
attractive.
6 Hz (F) through a sinusoidal contrast modulation, as in previousstudies (e.g. Rossion and Boremanse, 2011; Retter and Rossion,2016, 2017), which is a smoother stimulation mode than squarewave stimulation, thus making the experiment more comfort-able for the participant. In addition, the visual stimulation ispresent almost all the time, creating a continuously changingpercept. At each stimulus presentation cycle, the size of thefacial image randomly changed (between 80% and 100%, 4%steps) to reduce the impact of low-level physical properties ofthe images.
Three different conditions were included and presented inrandom order during the whole testing. For each condition,sequences with either female or male faces were repeated threetimes. In the MORE ATTRACTIVE ONLY condition, faces fromthe same sex rated as more attractive were presented withinthe same sequence. Similarly, face from the same sex ratedas less attractive were presented within the same sequencereferred here as LESS ATTRACTIVE ONLY condition. In the crit-ical condition, called the CONTRAST, the six faces from thesame sex rated as more (A) and less (B) attractive were pre-sented, resulting in a sequence ABABAB (Figure 1). All thesefaces were randomly selected from the corresponding stimulusset. For seven of the participants, the CONTRAST conditionstarted with presenting a more attractive face, while for theremaining eight participants sequences of this condition startedwith a less attractive face. Faces were presented at 6 Hz; how-ever, in the CONTRAST condition, the attractive and the lessattractive faces per sex alternated at 3 Hz (f = F/2) presentationrate.
In this paradigm, symmetrical responses at the stimula-tion presentation rate (i.e. 6 Hz) reflect elements common tothe response for each of the two alternatively presented facialstimuli, which would be present in all three conditions. How-ever, if tuned populations respond differently to more and lessattractive faces, asymmetry in the spectrum responses wouldbe expected at the alternation rate (i.e. 3 Hz) in the CONTRAST
condition, indicating the spectral signature of attractiveness dis-crimination. The MORE ATTRACTIVE ONLY and LESS ATTRAC-TIVE ONLY conditions were conducted to ensure that the asym-metrical EEG response would be specific to the alternation ofmore and less attractive faces. If this is the case, then the asym-metrical neural response in these control conditions should beabsent or reduced (much weaker than the one observed in theCONTRAST condition).
To keep the attention of the participants high and constantduring the experiment, they were asked to press a responsekey when a fixation cross randomly changed its color fromblack to red, 10 times for each sequence. The duration of thecolor change was 300 ms. The fixation cross was presentedin the center of the face stimuli, just below the eyes, whichis the optimal fixation point for face perception (Peterson andEckstein, 2012). Participants were also instructed to pay attentionto the faces that appeared on the screen. The mean accuracyand correct response times (RTs) of color change detection werecalculated for each condition with no significant differenceseither for the accuracy scores, F (1.258, 16.354) = 0.05, P = 0.88(M = 0.93, s.d.= 0.03), or for the RTs of correct responses, F (2,26) = 0.39, P = 0.68 (M = 0.46 s, s.d.= 0.04), among the three mainconditions.
It is noteworthy that 12 images per sex were available duringthe CONTRAST condition sequences, while only 6 images persex were displayed in the control condition sequences. Thiswould result in different face repetitions and possibly familiarityeffects between the CONTRAST and the control conditions. Inorder to rule out the possibility that the different number ofimages presented in the conditions could lead to the asymmet-rical response, an additional CONTRAST (i.e. HALF CONTRAST)condition with the three faces per sex rated the highest and thelowest, respectively, were presented for 10 of the 15 participants(see Supplementary Material). Except for the number of imagespresented, the design for the HALF CONTRAST condition was thesame as the one for the CONTRAST condition.
Dow
nloaded from https://academ
ic.oup.com/scan/article/14/7/737/5520404 by IC
L-Alexis Vautrin user on 07 Decem
ber 2020
Q. Luo et al. 741
EEG acquisition
EEG activity was recorded via a BIOSEMI Active two amplifiersystem (Biosemi, Amsterdam, Netherlands), with 128 Ag/AgClelectrodes sampled at 512 Hz. The electrodes include standard10–20 system locations as well as additional intermediate posi-tions. Eye movements were monitored with four electrodes, oneplaced at the outer canthi of each eye (HEOG) and one placedabove and one below the right eye (VEOG).
EEG pre-processing
All EEG pre-processing steps were carried out by using Letswave6 (http://nocions.webnode.com/letswave) and Matlab (R2014a,Math works) following a similar procedure as in previous studieswith this approach (e.g. Retter and Rossion, 2016, 2017). EEG datawas segmented to include 4 s before and after each sequence,resulting in 72 s segments (−4–68 s). Then it was digitally band-pass filtered at 0.10–120 Hz with a Butterworth filter (fourthorder). A fast Fourier transform (FFT) multi-notch filter with awidth of 0.5 Hz was implemented to remove electrical noise at50 Hz and its two harmonics. Artifact-ridden or noisy channelswere replaced using linear interpolation of the three neighboringchannels; less than 2% of the channels were interpolated per par-ticipant, on average only two channels for each participant. Afterthat, a common average reference computation was applied toall channels for each participant.
Frequency domain analysis
Pre-processed data segments were cropped to an integer numberof 3 Hz cycles, beginning 2 s after the onset of the sequence until∼62 s (60 s, corresponding to 179 cycles of 3 Hz, 30 554 time bins intotal). The first 2 s of each sequence (i.e. fade in) were excludedto avoid any contamination by the initial transient responses.Segments of the same condition were averaged separately forsequences with female and male images. An FFT was thenapplied to these averaged segments, and normalized amplitudespectra were extracted for all channels (square root of the sumof squares of the real and imaginary parts divided by the numberof data points). Thanks to the long time window (60 s), frequencyanalysis yielded spectra with a high frequency resolution of0.0167 Hz (1/60), thus increasing the signal-to-noise ratio (SNR;Regan, 1989) and allowing unambiguous identification of theresponse at the frequency bins of interest (i.e. 3–3.0167 Hz and6–6.0167 Hz).
In order to identify the presence of statistically significantresponses at the frequencies of interest, Z-scores were calcu-lated (the difference between amplitude at the frequency ofinterest and mean amplitude of 20 surrounding frequency bins,divided by the standard deviation of the 20 surrounding bins).The 20 bins were the 12 bins on each side, excluding the imme-diately adjacent bin to avoid contamination in case of spectralleakage and the local maximum and minimum amplitude binsto avoid projecting the signal in the noise estimation. Thus,baseline correction was applied by taking into account a signalof roughly 0.2 Hz on each side of the bin of interest. Only signif-icant responses were taken for analysis (Z-score > 2.32, P < 0.01one-tailed, i.e. signal > noise). Firstly, amplitude spectra acrosssubjects were averaged separately for each condition (i.e. grandaveraged), and then the resulting grand-averaged spectra werepooled across all 128 channels. The asymmetrical responses at3 Hz were only significant in the CONTRAST condition, withno significant harmonics. The symmetrical responses at 6 Hz
were significant in all conditions, along with seven consecutivelysignificant harmonics, up to 48 Hz.
For data visualization, the SNR spectra, expressed as theproportion of the signal of interest divided by the average noisemeasured from the 20 surrounding frequency bins (same selec-tion criterion as above), were computed for each condition andelectrode separately. To quantify the response, the baseline-corrected amplitudes for the symmetrical and asymmetricalresponses were calculated by subtracting the average amplitudeof the 20 surrounding bins (same selection criterion as above)and summed for the significant harmonics. The final valueswere obtained by averaging the responses for sequences withfemale and male images.
To define the regions of interest (ROIs) we normalized thebaseline-corrected amplitudes for the CONTRAST condition,showing the strongest asymmetrical response (see results), bydividing the value at each electrode by the scalp-wide root-mean-square value (i.e. the square root of the sum of squaresfor all 128 electrodes) (McCarthy and Wood, 1985). This procedureequalizes the scalp-wide global magnitude of the response.Then 15 regions were formed based on the proximity of thechannels (Supplementary Figure S2). Maximal activation wasobserved over the right occipito-temporal (OT) region followedby the occipital region (Supplementary Figure S2). Furthermore,the highest Z-scores were found for channels in the middleoccipital (MO) region: Oz (z = 7.20) and Oiz (z = 7.29), followedby channels in the right occipito-temporal (ROT) region: PO10(z = 7.14) and P10 (z = 6.99), as well as channel PO9 (z = 6.74) inthe left occipito-temporal (LOT) region. These observations werealso confirmed with a visual examination of the topographicaldistribution of the response on the grand–averaged data. Thus,three ROIs were defined: ROT, the corresponding LOT and MO.The summed baseline-subtracted amplitudes were averagedacross five electrodes for each ROI: LOT- PO7, PO9, PO11, P7,P9; MO- POz, POOz, Oz, Oiz, Iz; ROT- PO8, PO10, PO12, P8, P10.The response was evaluated with a repeated measures ANOVAwith factors Condition (CONTRAST, MORE ATTRACTIVE ONLYand LESS ATTRACTIVE ONLY) and ROI (ROT, LOT and MO). AGreenhouse–Geisser correction for degrees of freedom wasapplied if Mauchly’s test of sphericity was significant. Correctionfor multiple comparisons was conducted via the Bonferroni–Holm method (Hochberg & Tamhane, 1987). To further quantifythe evidence for observed differences, accompanying Bayesfactors (BFs) were calculated using Bayes-paired samples t-testas implemented in JASP (Love et al., 2015) with a Cauchy priordistribution (width = 0.707). The BF represents the likelihoodof the data under H1 relative to H0. For example, a BF of 2.00indicates that the data is twice more likely under the alternativehypothesis than under the null hypothesis, while a BF of 0.50indicates that the data is twice more likely under the nullhypothesis than under the alternative hypothesis. As such, theBF allows us to quantify evidence in favor of the alternativeas well as the null hypothesis. As a rule of thumb, 1 < BF ≤ 3indicates anecdotal evidence, 3 < BF ≤ 10 indicates substantialevidence and BF > 10 indicates strong evidence (Jeffreys, 1961).A directional hypothesis was tested with the Bayesian analysis;the asymmetrical 3 Hz response will be larger for the CONTRASTcondition than for the other two control conditions.
Results
Frequency domain analysis
Symmetrical responses (6 Hz) . Grand–averaged SNR spectrashowed clear symmetrical responses at 6 Hz and its harmonics.
Dow
nloaded from https://academ
ic.oup.com/scan/article/14/7/737/5520404 by IC
L-Alexis Vautrin user on 07 Decem
ber 2020
742 Social Cognitive and Affective Neuroscience, 2019, Vol. 14, No. 7
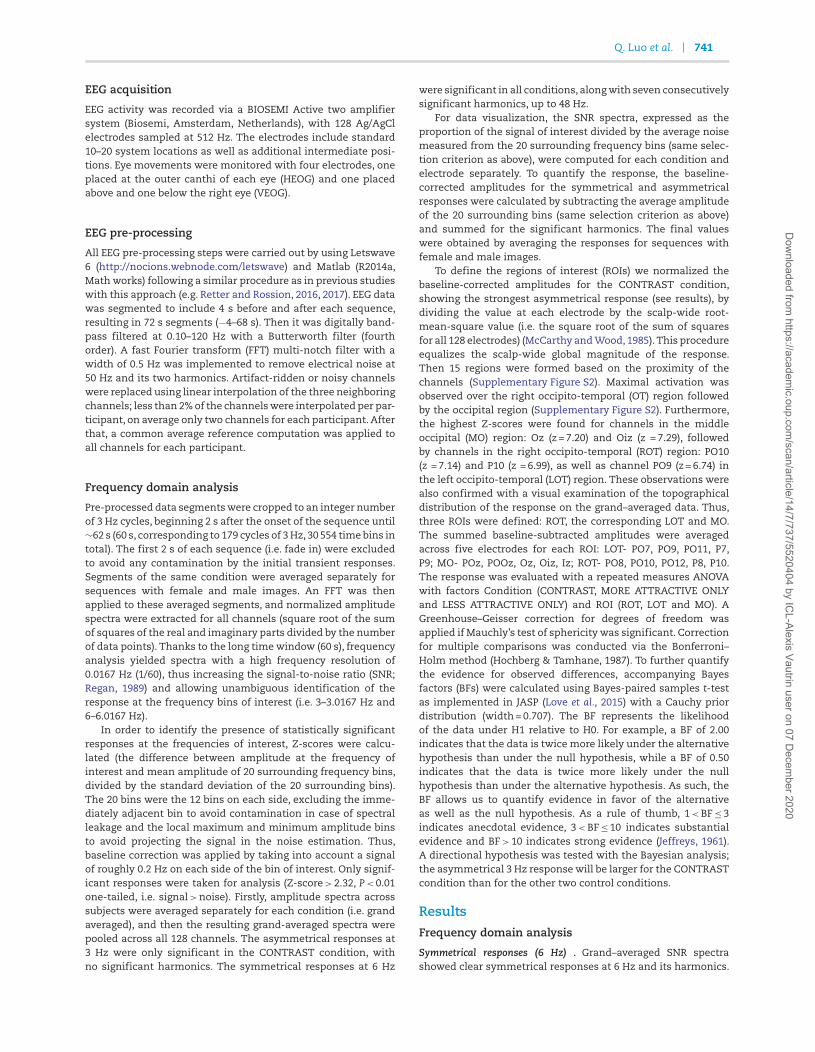
Fig. 3. Spectral representation and scalp distribution of EEG signal during FPVS. (A) Symmetrical response. Grand-averaged SNR spectra at 6 Hz at electrode Oz
for CONTRAST (red), MORE ATTRACTIVE ONLY (yellow) and LESS ATTRACTIVE ONLY (brown) conditions. Topographical maps illustrate the distribution of the 6 Hz
responses. Bar graph (Mean ± SEM) displaying summed baseline-corrected amplitudes (μV) for the 6 Hz response and its harmonics for each condition across the three
ROIs, MO, LOT and ROT, indicates that the symmetrical response is largest over MO sites with no significant differences across conditions. (B) Asymmetrical response.
Grand-averaged SNR spectra at 3 Hz at P10 for the CONTRAST (red), MORE ATTRACTIVE ONLY (yellow) and LESS ATTRACTIVE ONLY (brown) conditions. Topographical
maps illustrate the distribution of the 3 Hz responses. Bar graph (Mean ± SEM), displaying baseline-corrected amplitudes (μV) for the 3 Hz response for each condition
across the three ROIs, MO, LOT and ROT, indicates that the asymmetrical response is observed only for the CONTRAST condition, particularly over the ROT region.
The symmetrical response represents elements common to theresponse for stimulus and background alternation, which wasexpected to dominate over the MO area and not to differ acrossconditions.
As predicted, the repeated measures ANOVA with within-subject factors Condition and ROI on the summed baseline-corrected amplitudes for the symmetrical response indicated asignificant main effect of ROI, F(2, 28) = 41.85, P < 0.001, η2
p = 0.75,with larger responses over the MO than LOT and ROT regions,Ps < 0.001. No significant main effect of Condition, F(2, 28) = 0.34,P = 0.71, nor an interaction with ROI, F(2.603, 36.445) = 0.55,P = 0.63, were found (Figure 3A).
Asymmetrical response (3 Hz) . The 3 Hz response, indicating anasymmetry (i.e. differentiation) in the response to more and lessattractive faces, was significant for the CONTRAST condition(z = 4.98 over all 128 channels) but not for the control condi-tions: MORE ATTRACTIVE ONLY (z = 2.12 over all 128 channels)1
and LESS ATTRACTIVE ONLY (z = −0.48 over all 128 channels)conditions. In the CONTRAST condition, this response was dis-tributed over ROT channels, peaking at the low OT channel P10(SNR = 2.13) but also spreading to MO sites (Figure 3B).
To further evaluate the distribution across the scalp of theasymmetrical responses for attractiveness discrimination anROI analysis was performed. Repeated measures ANOVA withfactors ROI (LOT, MO and ROT) and Condition (CONTRAST, MOREATTRACTIVE ONLY and LESS ATTRACTIVE ONLY) was performed
1 The asymmetrical response in the MORE ATTRACTIVE ONLY conditionwas dispersedly distributed, with the largest response localized atfronto-central channels FC3h, FCz and FCC1.
on the baseline-corrected amplitude of the asymmetricalresponse (3 Hz). The main effect of Condition was significant,F(2, 28) = 7.46, P = 0.003, η2
p = 0.35. Post hoc pairwise comparisonsindicated that the largest asymmetrical response was in theCONTRAST condition, which was significantly larger than thatin the LESS ATTRACTIVE ONLY (P = 0.017, BF10 = 15.18) and MOREATTRACTIVE ONLY (P = 0.029, BF10 = 3.61) conditions (Figure 3B).The response amplitudes between the latter two conditionswere not significantly different, P = 0.32, BF10 = 0.69. No ROIdifference was found, F(2, 28) = 0.69, P = 0.51. The interactionbetween ROI and Condition also did not reach significance,F(2.155, 30.174) = 1.97, P = 0.15.
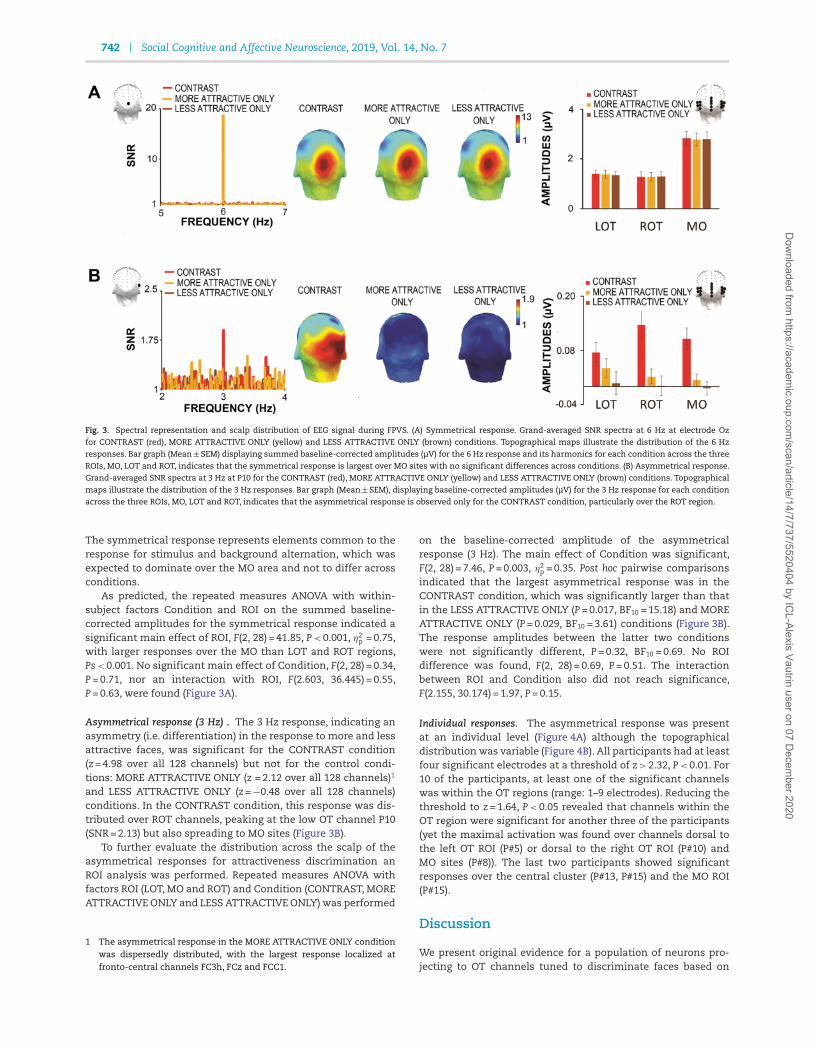
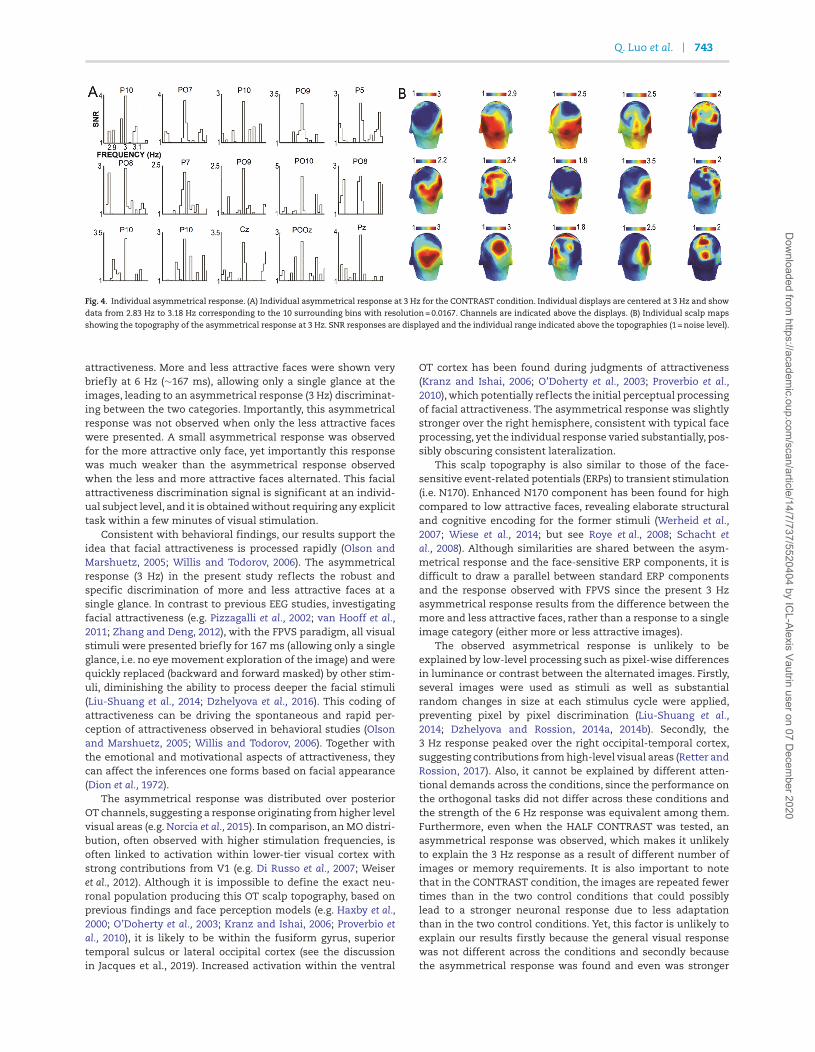
Individual responses. The asymmetrical response was presentat an individual level (Figure 4A) although the topographicaldistribution was variable (Figure 4B). All participants had at leastfour significant electrodes at a threshold of z > 2.32, P < 0.01. For10 of the participants, at least one of the significant channelswas within the OT regions (range: 1–9 electrodes). Reducing thethreshold to z = 1.64, P < 0.05 revealed that channels within theOT region were significant for another three of the participants(yet the maximal activation was found over channels dorsal tothe left OT ROI (P#5) or dorsal to the right OT ROI (P#10) andMO sites (P#8)). The last two participants showed significantresponses over the central cluster (P#13, P#15) and the MO ROI(P#15).
Discussion
We present original evidence for a population of neurons pro-jecting to OT channels tuned to discriminate faces based on
Dow
nloaded from https://academ
ic.oup.com/scan/article/14/7/737/5520404 by IC
L-Alexis Vautrin user on 07 Decem
ber 2020
Q. Luo et al. 743
Fig. 4. Individual asymmetrical response. (A) Individual asymmetrical response at 3 Hz for the CONTRAST condition. Individual displays are centered at 3 Hz and show
data from 2.83 Hz to 3.18 Hz corresponding to the 10 surrounding bins with resolution = 0.0167. Channels are indicated above the displays. (B) Individual scalp maps
showing the topography of the asymmetrical response at 3 Hz. SNR responses are displayed and the individual range indicated above the topographies (1 = noise level).
attractiveness. More and less attractive faces were shown verybriefly at 6 Hz (∼167 ms), allowing only a single glance at theimages, leading to an asymmetrical response (3 Hz) discriminat-ing between the two categories. Importantly, this asymmetricalresponse was not observed when only the less attractive faceswere presented. A small asymmetrical response was observedfor the more attractive only face, yet importantly this responsewas much weaker than the asymmetrical response observedwhen the less and more attractive faces alternated. This facialattractiveness discrimination signal is significant at an individ-ual subject level, and it is obtained without requiring any explicittask within a few minutes of visual stimulation.
Consistent with behavioral findings, our results support theidea that facial attractiveness is processed rapidly (Olson andMarshuetz, 2005; Willis and Todorov, 2006). The asymmetricalresponse (3 Hz) in the present study reflects the robust andspecific discrimination of more and less attractive faces at asingle glance. In contrast to previous EEG studies, investigatingfacial attractiveness (e.g. Pizzagalli et al., 2002; van Hooff et al.,2011; Zhang and Deng, 2012), with the FPVS paradigm, all visualstimuli were presented briefly for 167 ms (allowing only a singleglance, i.e. no eye movement exploration of the image) and werequickly replaced (backward and forward masked) by other stim-uli, diminishing the ability to process deeper the facial stimuli(Liu-Shuang et al., 2014; Dzhelyova et al., 2016). This coding ofattractiveness can be driving the spontaneous and rapid per-ception of attractiveness observed in behavioral studies (Olsonand Marshuetz, 2005; Willis and Todorov, 2006). Together withthe emotional and motivational aspects of attractiveness, theycan affect the inferences one forms based on facial appearance(Dion et al., 1972).
The asymmetrical response was distributed over posteriorOT channels, suggesting a response originating from higher levelvisual areas (e.g. Norcia et al., 2015). In comparison, an MO distri-bution, often observed with higher stimulation frequencies, isoften linked to activation within lower-tier visual cortex withstrong contributions from V1 (e.g. Di Russo et al., 2007; Weiseret al., 2012). Although it is impossible to define the exact neu-ronal population producing this OT scalp topography, based onprevious findings and face perception models (e.g. Haxby et al.,2000; O’Doherty et al., 2003; Kranz and Ishai, 2006; Proverbio etal., 2010), it is likely to be within the fusiform gyrus, superiortemporal sulcus or lateral occipital cortex (see the discussionin Jacques et al., 2019). Increased activation within the ventral
OT cortex has been found during judgments of attractiveness(Kranz and Ishai, 2006; O’Doherty et al., 2003; Proverbio et al.,2010), which potentially reflects the initial perceptual processingof facial attractiveness. The asymmetrical response was slightlystronger over the right hemisphere, consistent with typical faceprocessing, yet the individual response varied substantially, pos-sibly obscuring consistent lateralization.
This scalp topography is also similar to those of the face-sensitive event-related potentials (ERPs) to transient stimulation(i.e. N170). Enhanced N170 component has been found for highcompared to low attractive faces, revealing elaborate structuraland cognitive encoding for the former stimuli (Werheid et al.,2007; Wiese et al., 2014; but see Roye et al., 2008; Schacht etal., 2008). Although similarities are shared between the asym-metrical response and the face-sensitive ERP components, it isdifficult to draw a parallel between standard ERP componentsand the response observed with FPVS since the present 3 Hzasymmetrical response results from the difference between themore and less attractive faces, rather than a response to a singleimage category (either more or less attractive images).
The observed asymmetrical response is unlikely to beexplained by low-level processing such as pixel-wise differencesin luminance or contrast between the alternated images. Firstly,several images were used as stimuli as well as substantialrandom changes in size at each stimulus cycle were applied,preventing pixel by pixel discrimination (Liu-Shuang et al.,2014; Dzhelyova and Rossion, 2014a, 2014b). Secondly, the3 Hz response peaked over the right occipital-temporal cortex,suggesting contributions from high-level visual areas (Retter andRossion, 2017). Also, it cannot be explained by different atten-tional demands across the conditions, since the performance onthe orthogonal tasks did not differ across these conditions andthe strength of the 6 Hz response was equivalent among them.Furthermore, even when the HALF CONTRAST was tested, anasymmetrical response was observed, which makes it unlikelyto explain the 3 Hz response as a result of different number ofimages or memory requirements. It is also important to notethat in the CONTRAST condition, the images are repeated fewertimes than in the two control conditions that could possiblylead to a stronger neuronal response due to less adaptationthan in the two control conditions. Yet, this factor is unlikely toexplain our results firstly because the general visual responsewas not different across the conditions and secondly becausethe asymmetrical response was found and even was stronger
Dow
nloaded from https://academ
ic.oup.com/scan/article/14/7/737/5520404 by IC
L-Alexis Vautrin user on 07 Decem
ber 2020
744 Social Cognitive and Affective Neuroscience, 2019, Vol. 14, No. 7
when presenting only the six images in the HALF CONDITIONthan in the CONTRAST condition.
Furthermore, we have observed this asymmetrical responseusing an implicit task, which does not require the participantsto form impressions of attractiveness or to judge any otheraspect of the faces. This manipulation provides some initialevidence that attractiveness is processed capacity free by tunedpopulations of neurons. Further studies could embark on thisresearch avenue and explore how task manipulation and cog-nitive load modulate the automatic processing of attractive-ness. Nevertheless, the use of an implicit task and the robustresponses obtained within a few minutes provide the uniqueopportunity to investigate, independently of linguistic abilities,facial attractiveness processing through development or cross-culturally.
Which facial cues, differing between more and less attractivefaces, could explain the symmetrical response? Our imageanalysis suggests that facial averageness (distinctiveness) andperceived sexual dimorphism differed between the more attrac-tive and less attractive faces and thus could possibly account forthe observed asymmetries. These two facial aspects have beenshown to influence perception of facial attractiveness in numer-ous studies (e.g. Little and Hancock, 2002; Langlois and Roggman,1990; Perrett et al.,1998; Rhodes et al., 2002) and also to modulateEEG waveforms (e.g. Halit et al., 2000; Freeman et al., 2010). Otheraspects like facial expression have been also shown to affectperceived attractiveness with happy faces perceived as moreattractive than faces with negative expressions (e.g. Mueser etal., 1984), yet in our set the individuals were photographed withneutral facial expression, thus there was no clear influenceof perceived expression on attractiveness. Nevertheless, ourinitial attempt to understand which features contribute to thediscrimination of more and less attractive faces indicate thatfacial aspects impacting on attractiveness perception differedfor our stimuli and thus can be driving the asymmetricalprocessing of attractiveness. Admittedly, determining whichof these features contributed to the observed asymmetricalresponse is beyond the scope of the reported study. Therefore,future studies could look more precisely if a particularaspect of facial attractiveness—averageness/distinctiveness,sex typicality, etc.—impacts mostly on the automatic coding ofattractiveness.
In summary, by rapidly alternating between high and lowattractive faces, we provide evidence for tuned populationsof neurons within higher visual face-sensitive areas codingfor attractiveness discrimination. Importantly, this effect isnot observed when only high or low attractive faces werepresented. Thus, this technique may be considered as a simpleand powerful tool to investigate the perceptual underpinningsof attractiveness discrimination by carefully manipulatingdifferent facial aspects contributing to attractiveness. Giventhe short experimental duration, the lack of explicit responserequired and the robustness of the response with the FPVS–EEGtechnique, this paradigm may also be extended to test infants,children and cross-cultural populations.
Acknowledgments
This work was supported by a grant from the EuropeanResearch Council (facessvep 284025) to B.R. and a postdoc-toral FNRS fellowship to M.D. The authors would like tothank Prof. David Perrett and Patrick Cairns for helpingwith the structural analysis of the facial stimuli and to the
editor and the two anonymous reviewers for their helpfulcomments on an earlier version of the manuscript.
ReferencesAdrian, E.D., Matthews, B.H. (1934). The Berger rhythm: poten-
tial changes from the occipital lobes in man. Brain, 57(4),355–85.
Aharon, I., Etcoff, N., Ariely, D., Chabris, C.F., O’Connor, E., Breiter,H.C. (2001). Beautiful faces have variable reward value: fMRIand behavioral evidence. Neuron, 32(3), 537–51.
Ales, J.M., Norcia, A.M. (2009). Assessing direction-specific adap-tation using the steady-state visual evoked potential: resultsfrom EEG source imaging. Journal of Vision, 9(7), 8–8.
Ales, J.M., Farzin, F., Rossion, B., Norcia, A.M. (2012). An objectivemethod for measuring face detection thresholds using thesweep steady-state visual evoked response. Journal of Vision,12(10), 18–8.
Alley, T.R. (1988). Physiognomy and social perception. In: Socialand Applied Aspects of Perceiving Faces, pp. 167–86.
Bar, M., Neta, M., Linz, H. (2006). Very first impressions. Emotion,6(2), 269.
Berridge, K.C., Kringelbach, M.L. (2008). Affective neuroscience ofpleasure: reward in humans and animals. Psychopharmacology,199(3), 457–80.
Blair, I.V., Judd, C.M., Chapleau, K.M. (2004). The influence ofAfrocentric facial features in criminal sentencing. PsychologicalScience, 15(10), 674–9.
Cook, S.W. (1939). The judgment of intelligence from pho-tographs. The Journal of Abnormal and Social Psychology, 34(3),384.
Cupchik, G.C., Vartanian, O., Crawley, A., Mikulis, D.J. (2009). View-ing artworks: contributions of cognitive control and perceptualfacilitation to aesthetic experience. Brain & Cognition, 70(1),84–91.
DeBruine, L.M., Jones, B.C., Smith, F.G., Little, A.C. (2010). Areattractive men’s faces masculine or feminine? The impor-tance of controlling confounds in face stimuli. Journal of Exper-imental Psychology: Human Perception and Performance, 36(3),751.
Di Russo, F., Pitzalis, S., Aprile, T., et al. (2007). Spatiotemporalanalysis of the cortical sources of the steady-state visualevoked potential. Human Brain Mapping, 28(4), 323–34.
Dion, K., Berscheid, E., Walster, E. (1972). What is beautiful is good.Journal of Personality and Social Psychology, 24(3), 285.
Dzhelyova, M., Jacques, C., Rossion, B. (2016). At a single glance:fast periodic visual stimulation uncovers the Spatio-temporaldynamics of brief facial expression changes in the humanbrain. Cerebral Cortex, 27, 4106–23.
Dzhelyova, M., & Rossion, B. (2014a). The effect of paramet-ric stimulus size variation on individual face discriminationindexed by fast periodic visual stimulation. BMC Neuroscience,15, 1–12. doi: 10.1186/1471-2202-15-87
Dzhelyova, M. & Rossion, B. (2014b). Supra-additive contributionof shape and surface information to individual face discrimi-nation as revealed by fast periodic visual stimulation. Journalof Vision, 14(14):15. doi:10.1167/14.14.15
Freeman, J.B., Ambady, N., Holcomb, P.J. (2010). The face-sensitiveN170 encodes social category information. Neuroreport, 21(1),24.
Hahn, A.C., Symons, L.A., Kredel, T., et al. (2016). Early and lateevent-related potentials are modulated by infant and adultfaces of high and low attractiveness. Social Neuroscience, 11(2),207–20.
Dow
nloaded from https://academ
ic.oup.com/scan/article/14/7/737/5520404 by IC
L-Alexis Vautrin user on 07 Decem
ber 2020
Q. Luo et al. 745
Halit, H., de Haan, M., Johnson, M.H. (2000). Modulation of event-related potentials by prototypical and atypical faces. Neurore-port, 11(9), 1871–5.
Hamermesh, D.S., Biddle, J.E. (1993). Beauty and the labor market(no. w4518). National Bureau of Economic Research.
Hassin, R., Trope, Y. (2000). Facing faces: studies on the cognitiveaspects of physiognomy. Journal of Personality and Social Psychol-ogy, 78(5), 837.
Haxby, J.V., Hoffman, E.A., Gobbini, M.I. (2000). The distributedhuman neural system for face perception. Trends in CognitiveSciences, 4(6), 223–33.
Hochberg, J., Tamhane, A.C. (1987). Multiple comparison proce-dures (No. 519.535 H655m Ej. 1). John Wiley & Sons,.
Hoffmann, M.B., Unsöld, A.S., Bach, M. (2001). Directional tuningof human motion adaptation as reflected by the motion VEP.Vision Research, 41(17), 2187–94.
van Hooff, J.C., Crawford, H., Van, V.M. (2011). The wanderingmind of men: ERP evidence for gender differences in attentionbias towards attractive opposite sex faces. Social Cognitive &Affective Neuroscience, 6(4), 477.
Hosoda, M., Stone-Romero, E.F., Coats, G. (2003). The effectsof physical attractiveness on job-related outcomes: a meta-analysis of experimental studies. Personnel Psychology, 56(2),431–62.
Jacques, C., Jonas, J., Maillard, L., Colnat-Coulbois, S., Koessler,L., Rossion, B. (2019). The inferior occipital gyrus as a majorcortical source of the face-evoked N170: evidence from simul-taneous scalp and intracerebral human recordings. HumanBrain Mapping, 40, 1403–1419.
Jeffreys, H. (1961). Theory of probability, 3rd edn, New York, NY:Oxford University Press.
Kawabata, H., Zeki, S. (2004). Neural correlates of beauty. Journalof Neurophysiology, 91(4), 1699.
Kranz, F., Ishai, A. (2006). Face perception is modulated by sexualpreference. Current Biology, 16(1), 63–8.
Laguesse, R., Dormal, G., Biervoye, A., Kuefner, D., Rossion, B.(2012). Extensive visual training in adulthood significantlyreduces the face inversion effect. Journal of Vision, 12(14), 1–13.
Langlois, J.H., Roggman, L.A. (1990). Attractive faces are onlyaverage. Psychological Science, 1(2), 115–21.
Langlois, J.H., Kalakanis, L., Rubenstein, A.J., Larson, A., Hallam,M., Smoot, M. (2000). Maxims or myths of beauty? A meta-analytic and theoretical review. Psychological Bulletin, 126(3),390.
Little, A.C., Hancock, P.J. (2002). The role of masculinity anddistinctiveness in judgments of human male facial attractive-ness. British Journal of Psychology, 93(4), 451–64.
Little, A.C., Burriss, R.P., Jones, B.C., Roberts, S.C. (2007). Facialappearance affects voting decisions. Evolution and HumanBehavior, 28(1), 18–27.
Liu-Shuang, J., Norcia, A. M., & Rossion, B. (2014). Anobjective index of individual face discrimination in theright occipito-temporal cortex by means of fast periodicoddball stimulation. Neuropsychologia, 52, 57–72. doi:10.1016/j.neuropsychologia.2013.10.022
Liu-Shuang, J., Ales, J.M., Rossion, B., Norcia, A.M. (2015). Theeffect of contrast polarity reversal on face detection: evidenceof perceptual asymmetry from sweep VEP. Vision Research, 108,8–19.
Love, J., Selker, R., Marsman, M. et al. (2015). Jasp (version 0.7).[computer software]. Retrieved from https://jasp-stats.org
Marzi, T., Viggiano, M.P. (2010). When memory meets beauty:insights from event-related potentials. Biological Psychology,84(2), 192–205.
McCarthy, G., Wood, C.C. (1985). Scalp distributions of event-related potentials: an ambiguity associated with analysis ofvariance models. Electroencephalography and Clinical Neurophys-iology, 62(3), 203–8.
Mueller, U., Mazur, A. (1996). Facial dominance of West Pointcadets as a predictor of later military rank. Social Forces, 74(3),823–50.
Mueser, K.T., Grau, B.W., Sussman, S., Rosen, A.J. (1984). You’reonly as pretty as you feel: facial expression as a determinantof physical attractiveness. Journal of Personality and Social Psy-chology, 46(2), 469.
Nisbett, R.E., Wilson, T.D. (1977). The halo effect: evidence forunconscious alteration of judgments. Journal of Personality andSocial Psychology, 35(4), 250.
Norcia, A.M., Appelbaum, L.G., Ales, J.M., Cottereau, B.R., Rossion,B. (2015). The steady-state visual evoked potential in visionresearch: a review. Journal of Vision, 15(6), 4.
O’Doherty, J., Winston, J., Critchley, H., Perrett, D., Burt, D.M.,Dolan, R.J. (2003). Beauty in a smile: the role of medialorbitofrontal cortex in facial attractiveness. Neuropsychologia,41(2), 147–55.
Olson, I.R., Marshuetz, C. (2005). Facial attractiveness is appraisedin a glance. Emotion, 5(4), 498.
Penton-Voak, I.S., Pound, N., Little, A.C., Perrett, D.I. (2006). Per-sonality judgments from natural and composite facial images:more evidence for a ‘kernel of truth’ in social perception. SocialCognition, 24(5), 607–40.
Perrett, D.I., Lee, K.J., Penton-Voak, I., et al. (1998). Effects ofsexual dimorphism on facial attractiveness. Nature, 394(6696),884.
Perrett, D.I., Burt, D.M., Penton-Voak, I.S., Lee, K.J., Rowland, D.A.,Edwards, R. (1999). Symmetry and human facial attractiveness.Evolution and Human Behavior, 20(5), 295–307.
Peterson, M.F., Eckstein, M.P. (2012). Looking just below the eyes isoptimal across face recognition tasks. Proceedings of the NationalAcademy of Sciences of the United States of America, 109(48),E3314–23.
Pizzagalli, D.A., Lehmann, D., Hendrick, A.M., Regard, M., Pascual-Marqui, R.D., Davidson, R.J. (2002). Affective judgments of facesmodulate early activity (approximately 160 ms) within thefusiform gyri. NeuroImage, 16(3), 663–77.
Prestia, S., Silverston, J., Wood, K., Zigarmi, L. (2002). The effects ofattractiveness on popularity; an observational study of socialinteraction among college students. Perspectives in Psychology,40, 3–11.
Proverbio, A.M., Riva, F., Martin, E., Zani, A. (2010). Face coding isbilateral in the female brain. PLoS One, 5(6), e11242.
Regan, D. (1966). Some characteristics of average steady-state and transient responses evoked by modulated light.Electroencephalography and Clinical Neurophysiology, 20(3),238–48.
Regan, D. (1989). Human Brain Electrophysiology: Evoked Potentialsand Evoked Magnetic Fields in Science and Medicine.
Retter, T.L., Rossion, B. (2016). Visual adaptation provides objec-tive electrophysiological evidence of facial identity discrimi-nation. Cortex, 80, 35–50.
Retter, T. L., & Rossion, B. (2017). Visual adaptation revealsan objective electrophysiological measure of high-level indi-vidual face discrimination. Scientific Reports, 7, 1–10. doi:10.1038/s41598-017-03348-x
Rhodes, G., Hickford, C., Jeffery, L. (2000). Sex-typicalityand attractiveness: are supermale and superfemalefaces super-attractive? British Journal of Psychology, 91(1),125–40.
Dow
nloaded from https://academ
ic.oup.com/scan/article/14/7/737/5520404 by IC
L-Alexis Vautrin user on 07 Decem
ber 2020
746 Social Cognitive and Affective Neuroscience, 2019, Vol. 14, No. 7
Rhodes, G., Yoshikawa, S., Clark, A., Lee, K., McKay, R., Akamatsu,S. (2001). Attractiveness of facial averageness and symmetryin non-Western cultures: in search of biologically based stan-dards of beauty. Perception, 30(5), 611–25.
Rhodes, G., Geddes, K., Jeffery, L., Dziurawiec, S., Clark, A.(2002). Are average and symmetric faces attractive to infants?Discrimination and looking preferences. Perception, 31(3),315–21.
Ritchie, K.L., Palermo, R., Rhodes, G. (2017). Forming impressionsof facial attractiveness is mandatory. Scientific Reports, 7(1), 469.
Rossion, B., Boremanse, A. (2011). Robust sensitivity to facialidentity in the right human occipito-temporal cortex asrevealed by steady-state visual-evoked potentials. Journal ofVision, 11(2), 16–6.
Roye, A., Höfel, L., Jacobsen, T. (2008). Aesthetics of faces:behavioral and electrophysiological indices of evaluative anddescriptive judgment processes. Journal of Psychophysiology,22(1), 41–57.
Rule, N.O., Ambady, N. (2008). The face of success: inferencesfrom chief executive officers’ appearance predict companyprofits. Psychological Science, 19(2), 109–11.
Schacht, A., Werheid, K., Sommer, W. (2008). The appraisal offacial beauty is rapid but not mandatory. Cognitive, Affective, &Behavioral Neuroscience, 8(2), 132–42.
Scott, I.M., Pound, N., Stephen, I.D., Clark, A.P., Penton-Voak, I.S.(2010). Does masculinity matter? The contribution of mascu-line face shape to male attractiveness in humans. PLoS One,5(10), e13585.
Senior, C. (2003). Beauty in the brain of the beholder. Neuron,38(4), 525–8.
Slater, A., Von der Schulenburg, C., Brown, E., et al. (1998). New-born infants prefer attractive faces. Infant Behavior and Develop-ment, 21(2), 345–54.
Slater, A., Bremner, G., Johnson, S.P., Sherwood, P., Hayes, R.,Brown, E. (2000). Newborn infants’ preference for attractivefaces: the role of internal and external facial features. Infancy,1(2), 265–74.
Stirrat, M., Perrett, D.I. (2010). Valid facial cues to cooperationand trust: male facial width and trustworthiness. PsychologicalScience, 21(3), 349–54.
Todorov, A., Mandisodza, A.N., Goren, A., Hall, C.C. (2005). Infer-ences of competence from faces predict election outcomes.Science, 308(5728), 1623–6.
Todorov, A., Pakrashi, M., Oosterhof, N.N. (2009). Evaluating faceson trustworthiness after minimal time exposure. Social Cogni-tion, 27(6), 813–33.
Tyler, C., Kaitz, M. (1977). Movement adaptation in the visualevoked response. Experimental Brain Research, 27(2), 203–9.
Valentin, D., Abdi, H., O’Toole, A.J. (1994). Categorization andidentification of human face images by neural networks:a review of the linear autoassociative and principalcomponent approaches. Journal of Biological Systems, 2(03),413–29.
Vartanian, O., Goel, V. (2004). Neuroanatomical correlates of aes-thetic preference for paintings. Neuroreport, 15(5), 893–7.
Walster, E., Aronson, V., Abrahams, D., Rottman, L. (1966). Impor-tance of physical attractiveness in dating behavior. Journal ofPersonality and Social Psychology, 4(5), 508.
Werheid, K., Schacht, A., Sommer, W. (2007). Facial attractivenessmodulates early and late event-related brain potentials. Biolog-ical Psychology, 76(1–2), 100.
Wiese, H., Altmann, C.S., Schweinberger, S.R. (2014). Effects ofattractiveness on face memory separated from distinctive-ness: evidence from event-related brain potentials. Neuropsy-chologia, 56(1), 26.
Wieser, M.J., McTeague, L.M., Keil, A. (2012). Competition effectsof threatening faces in social anxiety. Emotion, 12(5), 1050–1060.http://dx.doi.org/10.1037/a0027069
Willis, J., Todorov, A. (2006). First impressions: making up yourmind after a 100-ms exposure to a face. Psychological Science,17(7), 592–8.
Winston, J.S., O’Doherty, J., Kilner, J.M., Perrett, D.I., Dolan, R.J.(2007). Brain systems for assessing facial attractiveness. Neu-ropsychologia, 45(1), 195.
Woll, S. (1986). So many to choose from: decision strategies invideodating. Journal of Social and Personal Relationships, 3(1),43–52.
Zebrowitz, L.A., McDonald, S.M. (1991). The impact of litigants’baby-facedness and attractiveness on adjudications in smallclaims courts. Law and Human Behavior, 15(6), 603.
Zebrowitz, L.A., Montepare, J.M. (2008). Social psychological faceperception: why appearance matters. Social and Personality Psy-chology Compass, 2(3), 1497–517.
Zhang, Z., Deng, Z. (2012). Gender, facial attractiveness, andearly and late event-related potential components. Journal ofIntegrative Neuroscience, 11(4), 477–87.
Dow
nloaded from https://academ
ic.oup.com/scan/article/14/7/737/5520404 by IC
L-Alexis Vautrin user on 07 Decem
ber 2020

![Computational Photography - TU Wien · 7 Beautification [Deussen et al.] DataData--Driven Enhancement Driven Enhancement of Facial Attractiveness Tommer Leyvand, Daniel Cohen-Or,](https://img.pdfslide.us/doc/110x75/5b80fcee7f8b9aeb088e75cc/computational-photography-tu-wien-7-beautification-deussen-et-al-datadata-driven.jpg)


![Relative Ranking of Facial Attractiveness€¦ · alized relative ranking, especially of facial attractiveness. This section reviews this related work. Bottino and Laurentini [4]](https://img.pdfslide.us/doc/110x75/5fc31abc8e5af5565c7dcc10/relative-ranking-of-facial-attractiveness-alized-relative-ranking-especially-of.jpg)