Embed Size (px)
Citation preview
A Robust and Efficient Anti Spoofing Method for Facial Recognition Systems using the Fusion of Fresnel Transform and Micro-Texture Analysis
Farhood Mousavizadeh1, Keivan Maghooli1, Emad Fatemizadeh2 and Mohammad Moin3 1Department of Biomedical Engineering, Islamic Azad University, Iran
2School of Electrical Engineering, Sharif University of Technology, Iran 3Faculty of IT, ICT Research Institute (Iran Telecom Research Center), Iran
Abstract: Face biometric systems provide automatic verification or identification of a person. But nowadays using hacked or stolen photographs or videos is one of the most common manners for spoofing such systems. This problem can be solved by using some specific hardware’s like IR or stereoscopic cameras. However, the additional hardware should be low cost and applicable for the facial recognition purposes. To deal with the spoofing problem, we present single image and real-time method that can work with conventional cameras. Facial images commonly contain surface textures and the dept characteristics that cannot be found in a photograph and also there are some differences in the frequency distribution of a real face and a fake one. These two properties are the basic features of the most liveness detection systems. In this paper, we aim to utilize an automatically facial liveness detection method that combines these two features to have a robust and reliable method for single image liveness detection. We use the fusion of the Zernike moments of Fresnel transformed images and multi-scale Local Binary Patterns (LBP) histogram and fed them to Principal Components Analysis (PCA) and Fisher’s Discriminant Ratio (FDR) analyzers to obtain efficient and rich sets of features. The results show that we can achieve to the features that are half/quarter the size of original feature sets using FDR /PCA respectively. The results show that we could have liveness detection features stronger in performance and smaller in dimension in comparison with the common and state-of-the-art methods like LBP.
Keywords: Liveness detection, fresnel transform, local binary patterns, zernike moments analysis, FDR, PCA.
Received July 28, 2014; accepted May 11, 2015
1. Introduction
Facial recognition methods automatically identify a person from his or her digital images [1, 3, 5]. In contrast with other biometrics systems that use biometrics such as iris [7, 22, 33] finger print [9, 21, 27] and vain pattern, facial recognition has preference because of its simplicity and non-contact process [2, 24, 25]. Unfortunately these biometric systems can easily be spoofed using fake samples. Such attacks are most commonly found in facial recognition and identification systems. A physiological biometric such as face image can be easily hacked or downloaded through internet or simply captured using hidden cameras. There are some different clues for attack detection. Anti-spoofing techniques for facial biometric systems can be classified as movement of the facial components, texture analysis and liveness detection.
The movement detection techniques are based on the difference between the manner of head, eyes and lip movement in a 2-D fake image and a real face [4, 18]. Pan et al. [26] presents an involuntary eye-blinking detection method that is proposed by integrating a
structured prediction method. Kollreider et al. [15] used the evaluation of the head movement and the facial components trajectory from the sequence of facial images. The system was based on the measurement of the nose and the ears lateral movement during the head rotation around its vertical axis. A simplified optical flow analysis that is one of the Liveness detection methods investigates the trajectories of selected parts during the movement. The other anti-spoofing method using movement detection is investigated by Jee et al. [11]. The system detects and use centre points of both eyes in order to extract the eye movement. Five sequential images are utilized and the eye regions quantized to be binary pictures. The hamming distances between the five images are calculated to distinguish between a live face and a photograph.
The texture analysis algorithms are based on the image quality, the printing failures and the blurring of the images. Li et al. [18] analyze the 2-D Fourier spectra of the fake printed photos and real faces. The method doesn’t works properly for the high quality samples. Maatta et al. [23] proposed an approach to detect and analyze the facial images texture using multi-scale Local Binary Patterns (LBP). Most of the
IAJIT First Online Publication
LBP-based algorithms use a face image divided into a grid of small and overlapping regions, where a histogram of the LBP for each region is constructed.
The concept of LBP anti-spoofing method is based on the idea that the human faces and prints reflects lights in different ways because a human face has a lot of complexity and 3D object whereas the spoofing photograph that can be seen as a planar rigid object. Nonetheless, the LBP descriptors concentrate on the micro-texture and surface properties of real faces and prints and not the 3D nature of the real faces.
Liveness detection focuses on the detection of attacks by using the signs of life such as eye-blinks and leap movements [16, 26]. In this research, using the fusion of holography and multi-scale LBP of face pictures together, leads to a strong feature for the facial anti-spoofing systems.
The LBP ability and its applications in facial expression recognition algorithms and also facial anti spoofing methods has already been proven. But using LBP without envisaging the 3-D structure of human faces is not completely helpful [23]. To overcome this issue we use the Fresnel transformation because of its 3-D interpretation ability of light diffraction detection of pictures. [30]. Using such features could be helpful when we want to detect the existence of different details in a 3D real face in comparison to the hacked or stolen printed pictures. The remainder of this paper is organized as follows. Section 2 discusses pre-processing and our proposed algorithm on Liveness detection and face recognition using a publically available database. The feature extraction and experimental results in Liveness detection are described in section 3. The experimental results are discussed in section 4 and our discussion can be found in section 5. The conclusions are shown in section 6.
2. Proposed Algorithm
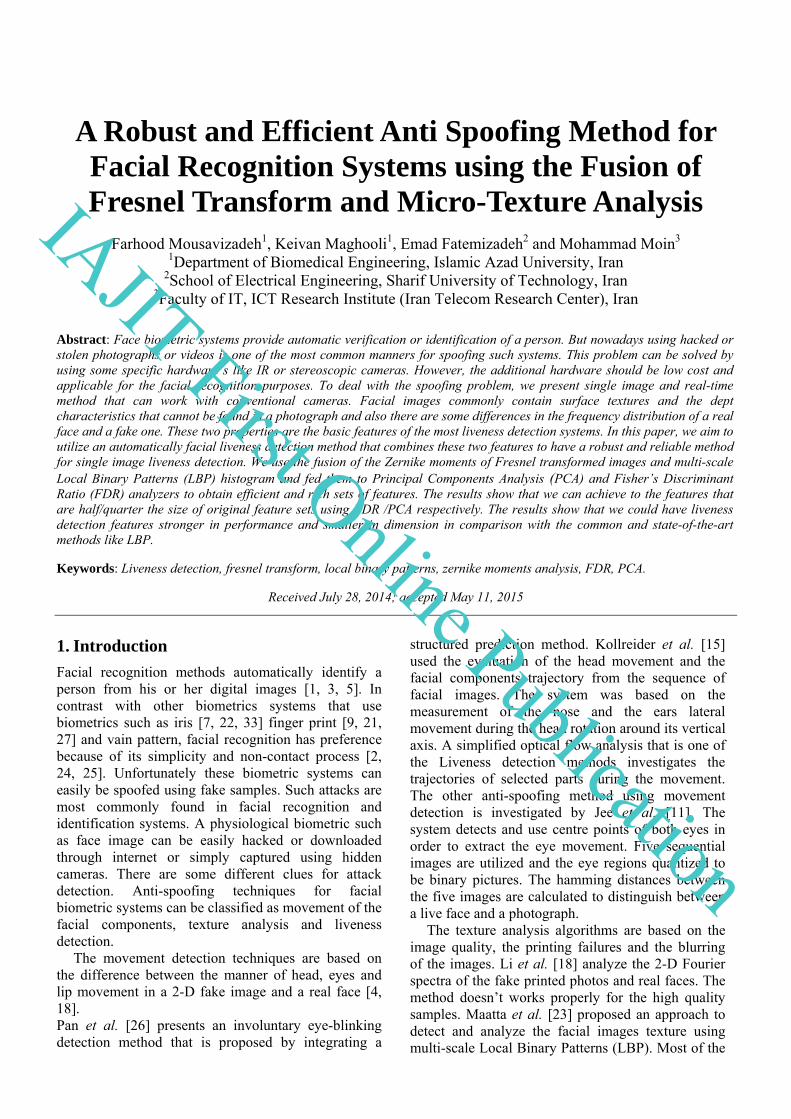
In this research, the histograms of LBP and the Zernike moments of Fresnel diffraction of planner pictures are both used to identify two real and fake optical subjects. Figure 1 shows the stages of separating the original picture from the fake one. Making the data base is the first step.
Figure 1. diafram of an anti-spoofing system using the fusion of Fresnel diffraction and LBP pattern features
We evaluated our algorithm using the publicly available PRINT-ATTACK database. It contains 400 videos of 50 clients, 200 videos for real clients and the same number for spoofing photographs. Hence, we have 400 videos of real and spoof attempts. There are two different record conditions:
1. Controlled videos: The condition with a uniform background scene and a fluorescent lamp as light source
2. Adverse videos: The second case with the non-uniform background scene and the day light illumination.
The real videos are captured with a resolution of 320 by 240 pixels at 25fps and are 15 seconds each (375 frames). The printout of each client displayed by the other person and the spoofing video clips are generated. The spoofing videos are taken under the same condition of real-client accesses and of about 10 seconds. We have two different attack modes for each spoof attempt:
1. The operator holds the printed photograph (hand-attacks).
2. The prints are glued to the wall (fixed-attacks).
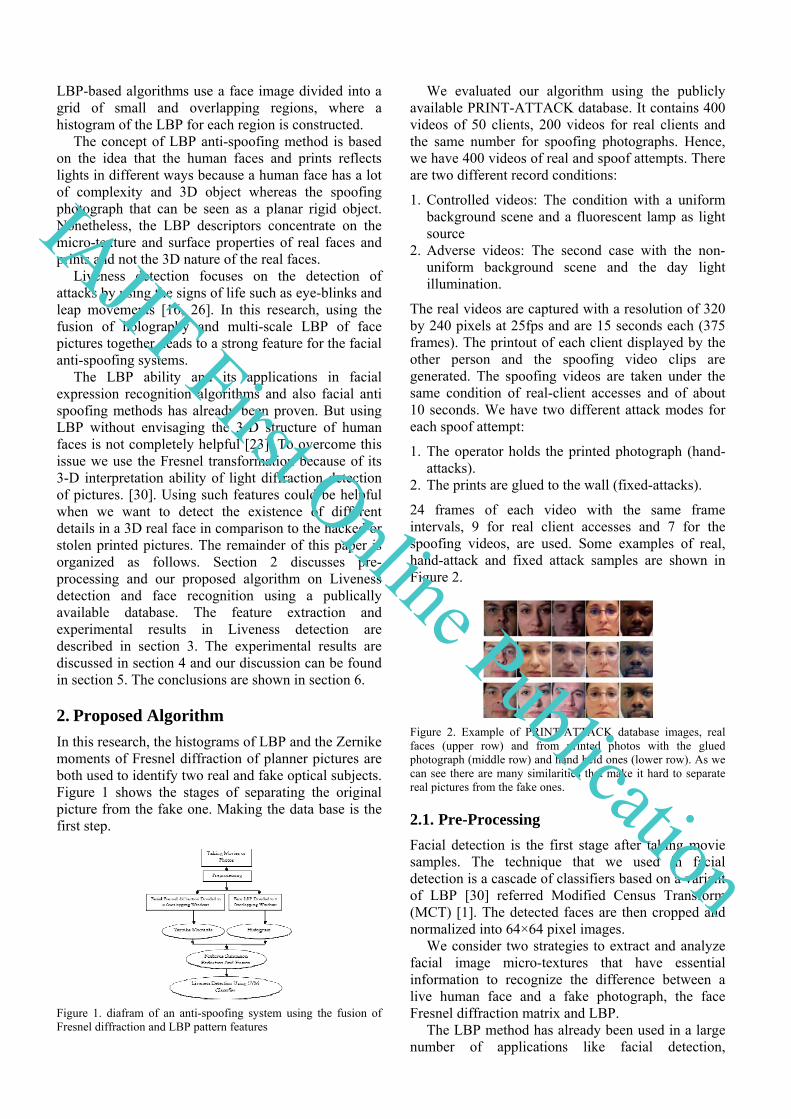
24 frames of each video with the same frame intervals, 9 for real client accesses and 7 for the spoofing videos, are used. Some examples of real, hand-attack and fixed attack samples are shown in Figure 2.
Figure 2. Example of PRINT-ATTACK database images, real faces (upper row) and from printed photos with the glued photograph (middle row) and hand held ones (lower row). As we can see there are many similarities that make it hard to separate real pictures from the fake ones.
2.1. Pre-Processing
Facial detection is the first stage after taking movie samples. The technique that we used in facial detection is a cascade of classifiers based on a variant of LBP [30] referred Modified Census Transform (MCT) [1]. The detected faces are then cropped and normalized into 64×64 pixel images.
We consider two strategies to extract and analyze facial image micro-textures that have essential information to recognize the difference between a live human face and a fake photograph, the face Fresnel diffraction matrix and LBP.
The LBP method has already been used in a large number of applications like facial detection,
IAJIT First Online Publication
recognition and Liveness detection. [1, 8, 23] As we will see in the following sections , there are significant differences in LBP images that can be seen in examples of real images and fake ones. These differences occur in facial areas where there are some dissidences between the light reflected by a flat printout surface compared to the real face images.
2.2. Local Binary Patterns
LBP is one of the best nonparametric descriptors, which efficiently describes the local structures of images. Nowadays, the LBP applications in many areas of image processing and computer vision are proved. It has been exploited for facial tasks which include face detection, face recognition and facial Liveness detection [17, 28, 32].
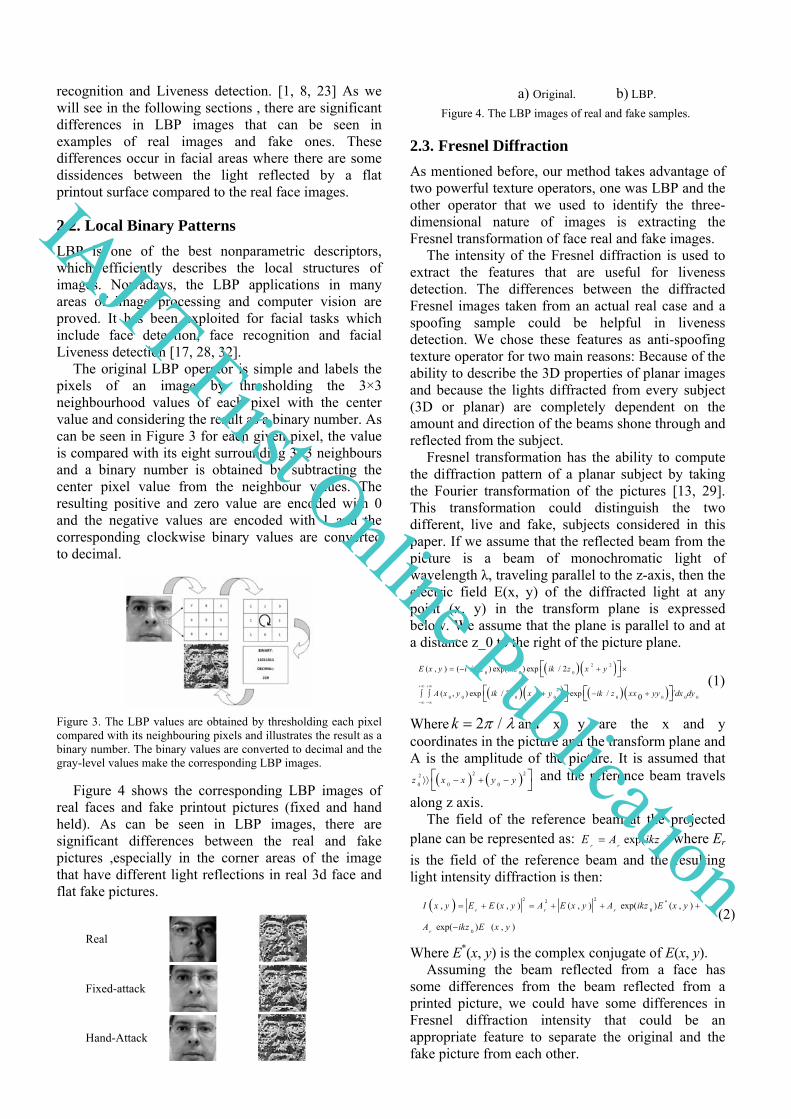
The original LBP operator is simple and labels the pixels of an image by thresholding the 3×3 neighbourhood values of each pixel with the center value and considering the result as a binary number. As can be seen in Figure 3 for each given pixel, the value is compared with its eight surrounding 3×3 neighbours and a binary number is obtained by subtracting the center pixel value from the neighbour values. The resulting positive and zero value are encoded with 0 and the negative values are encoded with 1 and the corresponding clockwise binary values are converted to decimal.
Figure 3. The LBP values are obtained by thresholding each pixel compared with its neighbouring pixels and illustrates the result as a binary number. The binary values are converted to decimal and the gray-level values make the corresponding LBP images.
Figure 4 shows the corresponding LBP images of real faces and fake printout pictures (fixed and hand held). As can be seen in LBP images, there are significant differences between the real and fake pictures ,especially in the corner areas of the image that have different light reflections in real 3d face and flat fake pictures.
Real
Fixed-attack
Hand-Attack
a) Original. b) LBP. Figure 4. The LBP images of real and fake samples.
2.3. Fresnel Diffraction
As mentioned before, our method takes advantage of two powerful texture operators, one was LBP and the other operator that we used to identify the three-dimensional nature of images is extracting the Fresnel transformation of face real and fake images.
The intensity of the Fresnel diffraction is used to extract the features that are useful for liveness detection. The differences between the diffracted Fresnel images taken from an actual real case and a spoofing sample could be helpful in liveness detection. We chose these features as anti-spoofing texture operator for two main reasons: Because of the ability to describe the 3D properties of planar images and because the lights diffracted from every subject (3D or planar) are completely dependent on the amount and direction of the beams shone through and reflected from the subject.
Fresnel transformation has the ability to compute the diffraction pattern of a planar subject by taking the Fourier transformation of the pictures [13, 29]. This transformation could distinguish the two different, live and fake, subjects considered in this paper. If we assume that the reflected beam from the picture is a beam of monochromatic light of wavelength λ, traveling parallel to the z-axis, then the electric field E(x, y) of the diffracted light at any point (x, y) in the transform plane is expressed below. We assume that the plane is parallel to and at a distance z_0 to the right of the picture plane.
2 2
0 0 0
2 2
0 0 0 0 0 0 0 0 0
( , ) ( / ) exp( ) exp / 2
( , ) exp / 2 exp / `0
E x y i z ikz ik z x y
A x y ik z x y ik z xx yy dx dy
Where /2k and x, y are the x and y coordinates in the picture and the transform plane and A is the amplitude of the picture. It is assumed that
2 22
0 0 0z x x y y
and the reference beam travels
along z axis. The field of the reference beam at the projected
plane can be represented as: 0
exp( )r r
E A ikz where Er
is the field of the reference beam and the resulting light intensity diffraction is then:
2 22
0
0
, ( , ) ( , ) exp( ) ( , )
exp( ) ( , )
r r r
r
I x y E E x y A E x y A ikz E x y
A ikz E x y
Where E*(x, y) is the complex conjugate of E(x, y). Assuming the beam reflected from a face has
some differences from the beam reflected from a printed picture, we could have some differences in Fresnel diffraction intensity that could be an appropriate feature to separate the original and the fake picture from each other.
(1)
(2)
IAJIT First Online Publication
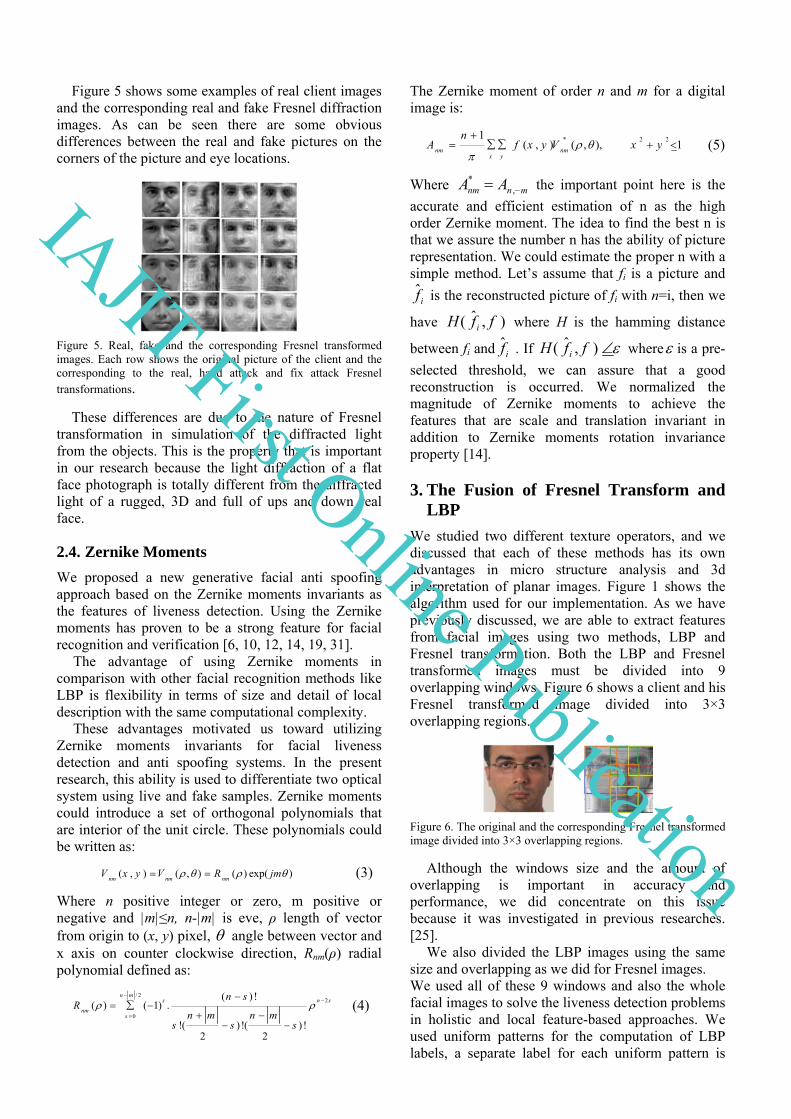
Figure 5 shows some examples of real client images and the corresponding real and fake Fresnel diffraction images. As can be seen there are some obvious differences between the real and fake pictures on the corners of the picture and eye locations.
Figure 5. Real, fake and the corresponding Fresnel transformed images. Each row shows the original picture of the client and the corresponding to the real, hand attack and fix attack Fresnel transformations.
These differences are due to the nature of Fresnel transformation in simulation of the diffracted light from the objects. This is the property that is important in our research because the light diffraction of a flat face photograph is totally different from the diffracted light of a rugged, 3D and full of ups and down real face.
2.4. Zernike Moments
We proposed a new generative facial anti spoofing approach based on the Zernike moments invariants as the features of liveness detection. Using the Zernike moments has proven to be a strong feature for facial recognition and verification [6, 10, 12, 14, 19, 31].
The advantage of using Zernike moments in comparison with other facial recognition methods like LBP is flexibility in terms of size and detail of local description with the same computational complexity.
These advantages motivated us toward utilizing Zernike moments invariants for facial liveness detection and anti spoofing systems. In the present research, this ability is used to differentiate two optical system using live and fake samples. Zernike moments could introduce a set of orthogonal polynomials that are interior of the unit circle. These polynomials could be written as:
( , ) ( , ) ( ) exp( )nm nm nm
V x y V R jm
Where n positive integer or zero, m positive or negative and |m|≤n, n-|m| is eve, ρ length of vector from origin to (x, y) pixel, angle between vector and x axis on counter clockwise direction, Rnm(ρ) radial polynomial defined as:
/ 2
2
0
( ) !( ) ( 1) .
!( ) !( ) !2 2
n ms n s
nms
n sR
n m n ms s s
The Zernike moment of order n and m for a digital image is:
* 2 21( , ) ( , ), 1
nm nmx y
nA f x y V x y
Where mnnm AA ,* the important point here is the
accurate and efficient estimation of n as the high order Zernike moment. The idea to find the best n is that we assure the number n has the ability of picture representation. We could estimate the proper n with a simple method. Let’s assume that fi is a picture and
if̂ is the reconstructed picture of fi with n=i, then we
have ),ˆ( ffH i where H is the hamming distance
between fi and if̂ . If ),ˆ( ffH i where is a pre-
selected threshold, we can assure that a good reconstruction is occurred. We normalized the magnitude of Zernike moments to achieve the features that are scale and translation invariant in addition to Zernike moments rotation invariance property [14].
3. The Fusion of Fresnel Transform and LBP
We studied two different texture operators, and we discussed that each of these methods has its own advantages in micro structure analysis and 3d interpretation of planar images. Figure 1 shows the algorithm used for our implementation. As we have previously discussed, we are able to extract features from facial images using two methods, LBP and Fresnel transformation. Both the LBP and Fresnel transformed images must be divided into 9 overlapping windows. Figure 6 shows a client and his Fresnel transformed image divided into 3×3 overlapping regions.
Figure 6. The original and the corresponding Fresnel transformed image divided into 3×3 overlapping regions.
Although the windows size and the amount of overlapping is important in accuracy and performance, we did concentrate on this issue because it was investigated in previous researches. [25].
We also divided the LBP images using the same size and overlapping as we did for Fresnel images. We used all of these 9 windows and also the whole facial images to solve the liveness detection problems in holistic and local feature-based approaches. We used uniform patterns for the computation of LBP labels, a separate label for each uniform pattern is
(3)
(4)
(5)
IAJIT First Online Publication
used and all the non-uniform patterns are labelled with
a single label. The notation u2
P,RLBP is used for LBP
operator that indicates using P and R neighbourhood. The u2 index implies only uniform patterns and all remaining patterns are labelled with a single label. We
applied u2
8,2LBP and u2
16,2LBP operators for extracting the
corresponding LBP pictures. Both LBP operators are
used for the whole picture and u2
8,1LBP for the nine
overlapping sub images. Figure 7 shows the LBP
image of real and fake pictures using u2
8,1LBP and
u2
16,2LBP operators. As we can see both operators, Fresnel
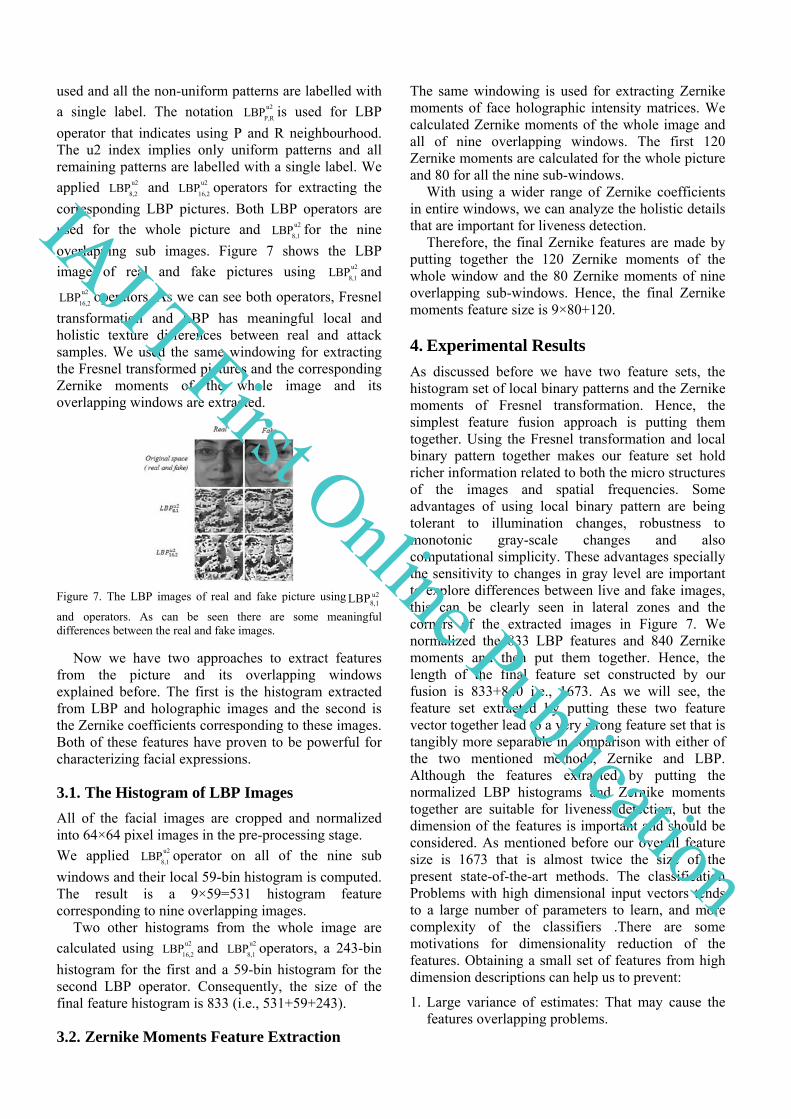
transformation and LBP has meaningful local and holistic texture differences between real and attack samples. We used the same windowing for extracting the Fresnel transformed pictures and the corresponding Zernike moments of the whole image and its overlapping windows are extracted.
Figure 7. The LBP images of real and fake picture using u2
8,1LBP
and operators. As can be seen there are some meaningful differences between the real and fake images.
Now we have two approaches to extract features from the picture and its overlapping windows explained before. The first is the histogram extracted from LBP and holographic images and the second is the Zernike coefficients corresponding to these images. Both of these features have proven to be powerful for characterizing facial expressions.
3.1. The Histogram of LBP Images
All of the facial images are cropped and normalized into 64×64 pixel images in the pre-processing stage.
We applied u2
8,1LBP operator on all of the nine sub
windows and their local 59-bin histogram is computed. The result is a 9×59=531 histogram feature corresponding to nine overlapping images.
Two other histograms from the whole image are
calculated using u2
16,2LBP and u2
8,1LBP operators, a 243-bin
histogram for the first and a 59-bin histogram for the second LBP operator. Consequently, the size of the final feature histogram is 833 (i.e., 531+59+243).
3.2. Zernike Moments Feature Extraction
The same windowing is used for extracting Zernike moments of face holographic intensity matrices. We calculated Zernike moments of the whole image and all of nine overlapping windows. The first 120 Zernike moments are calculated for the whole picture and 80 for all the nine sub-windows.
With using a wider range of Zernike coefficients in entire windows, we can analyze the holistic details that are important for liveness detection.
Therefore, the final Zernike features are made by putting together the 120 Zernike moments of the whole window and the 80 Zernike moments of nine overlapping sub-windows. Hence, the final Zernike moments feature size is 9×80+120.
4. Experimental Results
As discussed before we have two feature sets, the histogram set of local binary patterns and the Zernike moments of Fresnel transformation. Hence, the simplest feature fusion approach is putting them together. Using the Fresnel transformation and local binary pattern together makes our feature set hold richer information related to both the micro structures of the images and spatial frequencies. Some advantages of using local binary pattern are being tolerant to illumination changes, robustness to monotonic gray-scale changes and also computational simplicity. These advantages specially the sensitivity to changes in gray level are important to explore differences between live and fake images, this can be clearly seen in lateral zones and the corners of the extracted images in Figure 7. We normalized the 833 LBP features and 840 Zernike moments and then put them together. Hence, the length of the final feature set constructed by our fusion is 833+840 i.e., 1673. As we will see, the feature set extracted by putting these two feature vector together lead to a very strong feature set that is tangibly more separable in comparison with either of the two mentioned methods, Zernike and LBP. Although the features extracted by putting the normalized LBP histograms and Zernike moments together are suitable for liveness detection, but the dimension of the features is important and should be considered. As mentioned before our overall feature size is 1673 that is almost twice the size of the present state-of-the-art methods. The classification Problems with high dimensional input vectors tends to a large number of parameters to learn, and more complexity of the classifiers .There are some motivations for dimensionality reduction of the features. Obtaining a small set of features from high dimension descriptions can help us to prevent:
1. Large variance of estimates: That may cause the features overlapping problems.
IAJIT First Online Publication
2. Overfiting of the learning algorithm: If the number of features is large, the number of samples may be too small for accurate parameter estimation.
3. Irrelevant attributes (near duplicates, poor predictors): Dimensionality reduction finds irrelevant attributes. Therefore, we can reduce the volume and improve the efficiency of the data mining process.
4. Processing time: Results show that dimensionality reductions significantly shorten the processing time due to the low amount of memory resources needed and provide the simpler feature extraction techniques.
Dimensionality reduction can be achieved either by feature selection or transformation to a low dimensional space. In this paper we investigate two methods of dimensionally reduction: One is sorting the features in descending order of the separability ratio using Fisher’s Discriminant Ratio (FDR); the other is Principle Component Analysis (PCA).
4.1. Dimension Reduction using FDR
The FDR is calculated for scoring the reparability capabilities of our individual features. The FDR is calculated as follow:
2
1 2
2 2
1 2
( )
( )FDR
The FDR takes large values when samples in the l-dimensional space are well clustered around their means, within each class, and the clusters of the different classes are well separated.
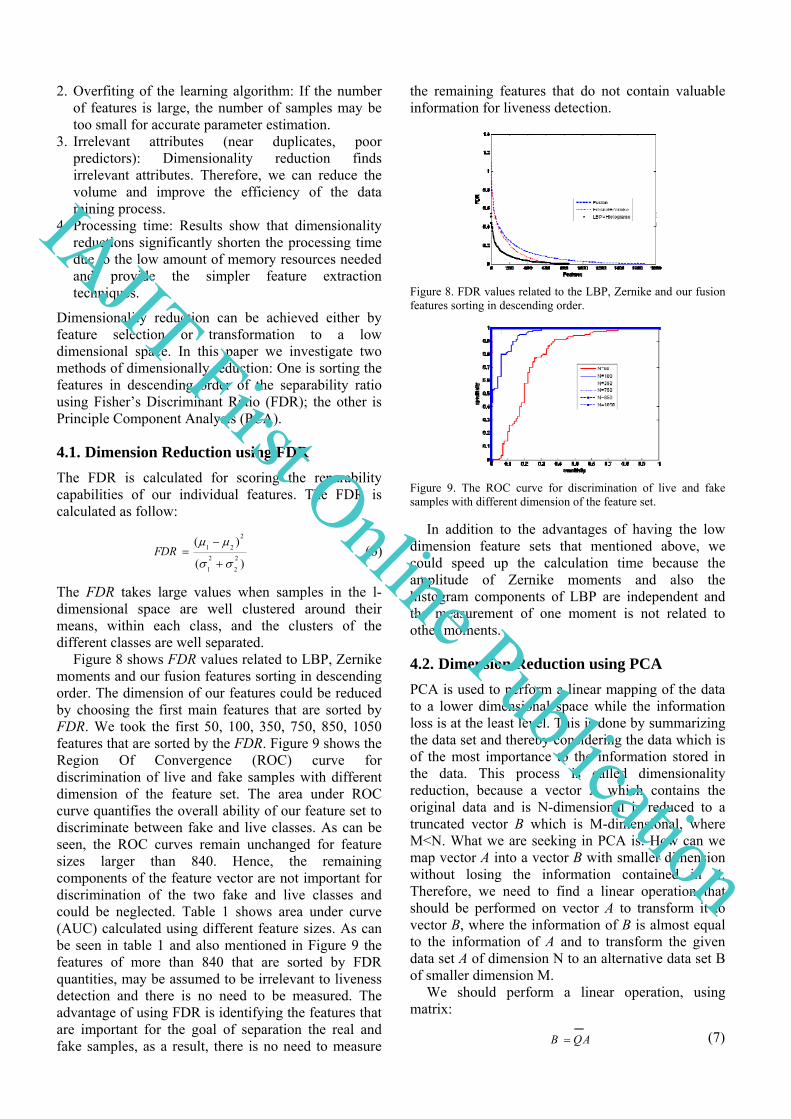
Figure 8 shows FDR values related to LBP, Zernike moments and our fusion features sorting in descending order. The dimension of our features could be reduced by choosing the first main features that are sorted by FDR. We took the first 50, 100, 350, 750, 850, 1050 features that are sorted by the FDR. Figure 9 shows the Region Of Convergence (ROC) curve for discrimination of live and fake samples with different dimension of the feature set. The area under ROC curve quantifies the overall ability of our feature set to discriminate between fake and live classes. As can be seen, the ROC curves remain unchanged for feature sizes larger than 840. Hence, the remaining components of the feature vector are not important for discrimination of the two fake and live classes and could be neglected. Table 1 shows area under curve (AUC) calculated using different feature sizes. As can be seen in table 1 and also mentioned in Figure 9 the features of more than 840 that are sorted by FDR quantities, may be assumed to be irrelevant to liveness detection and there is no need to be measured. The advantage of using FDR is identifying the features that are important for the goal of separation the real and fake samples, as a result, there is no need to measure
the remaining features that do not contain valuable information for liveness detection.
Figure 8. FDR values related to the LBP, Zernike and our fusion features sorting in descending order.
Figure 9. The ROC curve for discrimination of live and fake samples with different dimension of the feature set.
In addition to the advantages of having the low dimension feature sets that mentioned above, we could speed up the calculation time because the amplitude of Zernike moments and also the histogram components of LBP are independent and the measurement of one moment is not related to other moments.
4.2. Dimension Reduction using PCA
PCA is used to perform a linear mapping of the data to a lower dimensional space while the information loss is at the least level. This is done by summarizing the data set and thereby considering the data which is of the most importance to the information stored in the data. This process is called dimensionality reduction, because a vector A which contains the original data and is N-dimensional is reduced to a truncated vector B which is M-dimensional, where M<N. What we are seeking in PCA is: How can we map vector A into a vector B with smaller dimension without losing the information contained in A. Therefore, we need to find a linear operation that should be performed on vector A to transform it to vector B, where the information of B is almost equal to the information of A and to transform the given data set A of dimension N to an alternative data set B of smaller dimension M.
We should perform a linear operation, using matrix:
B QA
(6)
(7)
IAJIT First Online Publication
In PCA dimensionality reduction process, the best data to eliminate from data vector A with a given correlation matrix R, is the data with the smallest variance. This is the data determined by the smallest eigenvalues of the matrix R. A correlation matrix R of a random vector A is the expectation of the outer product of vector A with itself:
[ ]T
R = E A A
Given a random vector A of dimension N and its correlation matrix R we can reduce its dimension to M (with M<N) by PCA in five steps:
1. Calculate the eigenvectors Q and eigenvalues λi of
correlation matrix R: i ii
R q q . Where i
q 's are N
eigenvectors of the correlation matrix R. 2. Sort the eigenvalues in decreasing order: λ1>λ2>..>λM >..>λN.
3. Choose the eigenvectors which belong to the first M largest eigenvalues.
4. Calculate truncated vector B by T
i ib A q for i=1,
..., M 5. Use B as the feature vector.
As mentioned before, our features are constructed by 833 LBP histograms and 840 Zernike moments, therefore, the length of the final enhanced feature is 1863 (i.e., 833+840).
The PCA can be used to reduce the feature vector dimension. The idea is to investigate the PCA for the LBP and Zernike moments separately and then putting the results together as the overall feature of liveness detection.
Now we can run PCA for the both data sets. We first apply PCA to the LBP data set. Figure 10 shows ROC curves corresponding to the different sizes of PCA applied to LBP.
Figure 10. ROC curves corresponding to the different sizes of PCA applied to LBP histograms. As can be seen in the ROC curves, there is not any significant change in accuracy and ROC curves of the features extracted by PCA with the N greater than 250.
It can obviously be seen that there is no major difference between the ROC and corresponding AUC of the feature sizes greater than 250 for the LBP data set. It means that we could have a dimensionally reduced feature data vectors that are three times smaller than the actual LBP feature vectors and with the same efficiency.
The main reason that makes it possible to have such a significant dimension reduction is the existence of the unwanted histogram values that are not important in liveness detection.
The major differences between the live and fake LBP extracted pictures are occurred in the lateral regions and the corners.
The histogram values that are related to the central parts of facial images have not the same importance as the corners and lateral regions but they should not be easily neglected. Sometimes, during the face detection phase, the extracted faces are not exactly in the center of the image frame. Therefore, the illumination of unwanted values is not possible without investigating the whole feature sets and getting help from a suitable dimensionality reduction technique like PCA.
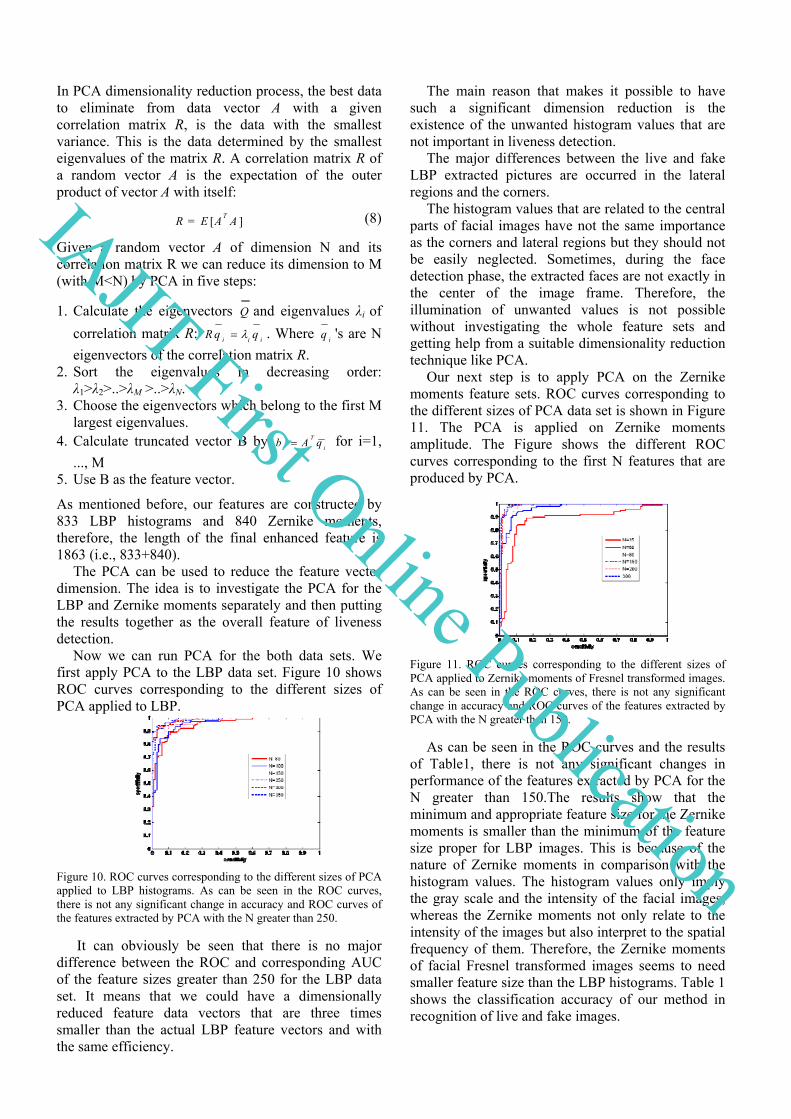
Our next step is to apply PCA on the Zernike moments feature sets. ROC curves corresponding to the different sizes of PCA data set is shown in Figure 11. The PCA is applied on Zernike moments amplitude. The Figure shows the different ROC curves corresponding to the first N features that are produced by PCA.
Figure 11. ROC curves corresponding to the different sizes of PCA applied to Zernike moments of Fresnel transformed images. As can be seen in the ROC curves, there is not any significant change in accuracy and ROC curves of the features extracted by PCA with the N greater than 150.
As can be seen in the ROC curves and the results of Table1, there is not any significant changes in performance of the features extracted by PCA for the N greater than 150.The results show that the minimum and appropriate feature size for the Zernike moments is smaller than the minimum of the feature size proper for LBP images. This is because of the nature of Zernike moments in comparison with the histogram values. The histogram values only imply the gray scale and the intensity of the facial images, whereas the Zernike moments not only relate to the intensity of the images but also interpret to the spatial frequency of them. Therefore, the Zernike moments of facial Fresnel transformed images seems to need smaller feature size than the LBP histograms. Table 1 shows the classification accuracy of our method in recognition of live and fake images.
(8) IAJIT First Online Publication
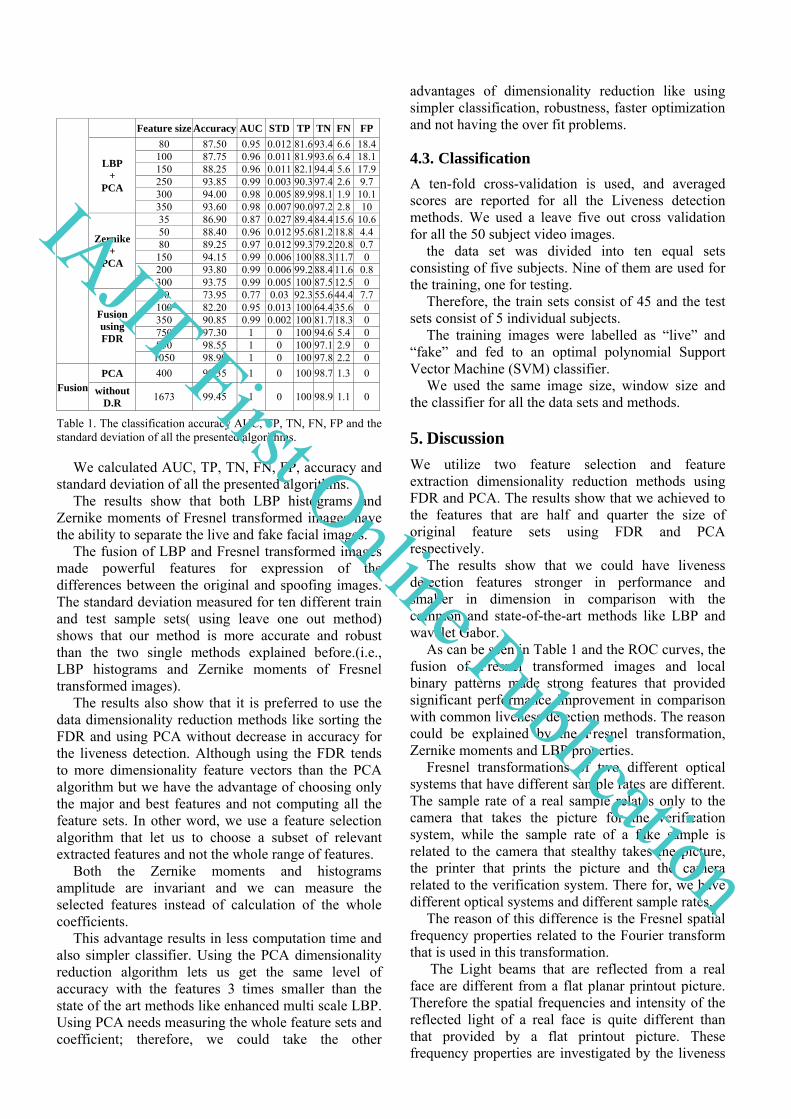
Table 1. The classification accuracy AUC, TP, TN, FN, FP and the standard deviation of all the presented algorithms.
We calculated AUC, TP, TN, FN, FP, accuracy and standard deviation of all the presented algorithms.
The results show that both LBP histograms and Zernike moments of Fresnel transformed images have the ability to separate the live and fake facial images.
The fusion of LBP and Fresnel transformed images made powerful features for expression of the differences between the original and spoofing images. The standard deviation measured for ten different train and test sample sets( using leave one out method) shows that our method is more accurate and robust than the two single methods explained before.(i.e., LBP histograms and Zernike moments of Fresnel transformed images).
The results also show that it is preferred to use the data dimensionality reduction methods like sorting the FDR and using PCA without decrease in accuracy for the liveness detection. Although using the FDR tends to more dimensionality feature vectors than the PCA algorithm but we have the advantage of choosing only the major and best features and not computing all the feature sets. In other word, we use a feature selection algorithm that let us to choose a subset of relevant extracted features and not the whole range of features.
Both the Zernike moments and histograms amplitude are invariant and we can measure the selected features instead of calculation of the whole coefficients.
This advantage results in less computation time and also simpler classifier. Using the PCA dimensionality reduction algorithm lets us get the same level of accuracy with the features 3 times smaller than the state of the art methods like enhanced multi scale LBP. Using PCA needs measuring the whole feature sets and coefficient; therefore, we could take the other
advantages of dimensionality reduction like using simpler classification, robustness, faster optimization and not having the over fit problems.
4.3. Classification
A ten-fold cross-validation is used, and averaged scores are reported for all the Liveness detection methods. We used a leave five out cross validation for all the 50 subject video images.
the data set was divided into ten equal sets consisting of five subjects. Nine of them are used for the training, one for testing.
Therefore, the train sets consist of 45 and the test sets consist of 5 individual subjects.
The training images were labelled as “live” and “fake” and fed to an optimal polynomial Support Vector Machine (SVM) classifier.
We used the same image size, window size and the classifier for all the data sets and methods.
5. Discussion
We utilize two feature selection and feature extraction dimensionality reduction methods using FDR and PCA. The results show that we achieved to the features that are half and quarter the size of original feature sets using FDR and PCA respectively.
The results show that we could have liveness detection features stronger in performance and smaller in dimension in comparison with the common and state-of-the-art methods like LBP and wavelet Gabor.
As can be seen in Table 1 and the ROC curves, the fusion of Fresnel transformed images and local binary patterns made strong features that provided significant performance improvement in comparison with common liveness detection methods. The reason could be explained by the Fresnel transformation, Zernike moments and LBP properties.
Fresnel transformations of two different optical systems that have different sample rates are different. The sample rate of a real sample relates only to the camera that takes the picture for the verification system, while the sample rate of a fake sample is related to the camera that stealthy takes the picture, the printer that prints the picture and the camera related to the verification system. There for, we have different optical systems and different sample rates.
The reason of this difference is the Fresnel spatial frequency properties related to the Fourier transform that is used in this transformation.
The Light beams that are reflected from a real face are different from a flat planar printout picture. Therefore the spatial frequencies and intensity of the reflected light of a real face is quite different than that provided by a flat printout picture. These frequency properties are investigated by the liveness
FP FNTNTP STD AUC AccuracyFeature size
18.46.693.481.6 0.012 0.95 87.50 80
LBP +
PCA
18.16.493.681.9 0.011 0.96 87.75 100 17.95.694.482.1 0.011 0.96 88.25 150 9.7 2.697.490.3 0.003 0.99 93.85 250 10.11.998.189.9 0.005 0.98 94.00 300 10 2.897.290.0 0.007 0.98 93.60 350
10.615.684.489.4 0.027 0.87 86.90 35
Zernike +
PCA
4.4 18.881.295.6 0.012 0.96 88.40 50 0.7 20.879.299.3 0.012 0.97 89.25 80 0 11.788.3100 0.006 0.99 94.15 150
0.8 11.688.499.2 0.006 0.99 93.80 200 0 12.587.5100 0.005 0.99 93.75 300
7.7 44.455.692.3 0.03 0.77 73.95 50
Fusion using FDR
0 35.664.4100 0.013 0.95 82.20 100 0 18.381.7100 0.002 0.99 90.85 350 0 5.494.6100 0 1 97.30 750 0 2.997.1100 0 1 98.55 850 0 2.297.8100 0 1 98.90 1050
0 1.398.7100 0 1 99.35 400 PCA Fusion
0 1.198.9100 0 1 99.45 1673 without
D.R
IAJIT First Online Publication
detection methods like Gabor wavelet and Fourier spectra analysis. LBP liveness detection methods concentrate on the light intensity and reflection differences between live and fake samples. Our method takes the advantage of using both frequency and intensity properties by using the fusion of LBP and Fresnel transformation. As can be seen in Table 1, both FDR and PCA fusion liveness detection methods, had 0 false positive rates. This is an advantage of our algorithm that is able to distinguish all the fake clients and fake samples are not permitted. Our method presents a real time single image liveness detection algorithm without using any sequential image sets or complicated classification algorithms. Using the dimensionality reduction method utilities features with the same performance and smaller in size. We could have simpler classifiers using the features two times smaller than the state of the art methods like LBP.
6. Conclusions
This manuscript addresses the advantages of using the fusion of the Zernike moments of Fresnel transformed images in one hand and the LBP histogram on the other hand. As our investigations, both of these algorithms have the ability to express the differences between live and spoofing facial images. We also used two dimensionality reduction methods that let us to get the feature vectors with the same resolution and separability and less in dimensionality. The results show that we can have a significant improvement in separation of the real and spoofing facial biometric samples. The research presents the features with smaller dimension and even better in two class separation. Our research concentrates on single image anti-spoofing methods and the other liveness detection methods using extra accessories or sequential images are not included. We used a publically available data base and the same classifier for having a fair comparison. Our research focuses on having an evaluation of our features quality in separation of the real and fake facial images. The results could be further improved by using the sequential images and the more complex classifiers and features. Nevertheless, in some of the test sets, we were able to achieve the accuracy of 100% without any excessive complexity and developments.
Acknowledgments
The database of this paper used the Print-Attack Corpus made available by the Idiap Research Institute, Martigny, Switzerland. The authors would like to thank the financial support provided by Research Institute for ICT (formerly ITRC). References
[1] Ahonen T., Hadid A., and Pietikainen M., “Face Recognition with Local Binary Patterns”, LectureNotes in Computer Science, pp.469-481, 2004.
[2] Azeem A, Sharif M, Raza M., and Murtaza M, “A Survey: Face Recognition Techniques Under Partial Occlusion”, The International Arab Journal of Information Technology (IAJIT), Vol. 11, No. 1, 2014.
[3] Bartlett M.S., Movellan J.R., and Sejnowski T.J., “Face Recognition by Independent Component Analysis”,IEEE Transaction on Neural Networks., vol. 13, no. 6,pp.1450-1464, 2002.
[4] Bigun J., Fronthaler H., and Kollreider K., “Assuring liveness in biometric identity authentication by real-time face tracking”, IEEE Conference on Computational Intelligence for Homeland Security and Personal Safety , pp.104-111, 2004.
[5] Bronstein M., and Kimmel R., “Three-Dimensional Face Recognition”, International Journal of Computer Vision, vol.64, no.1, pp.5-30, 2005.
[6] Broumandnia A., and Shanbehzadeh J., “Fast Zernike wavelet moments for Farsi character recognition,” Image and Vision Computing, vol. 25, no. 5, pp. 717–726, 2007.
[7] Czajka A., “Database of Iris Printouts and its Application. Development of Liveness Detection Method for Iris Recognition”, The 18th International Conference on Methods and Models in Automation and Control (MMAR2013), Miedzyzdroje, Poland, pp.26-29, 2013.
[8] Froba B., and Ernst A., “Face detection with the modified census transform”, IEEE International Conference on Automatic Face and Gesture Recognition, pp. 91-96, 2004.
[9] Galbally J. ,Alonso-Fernandez F., Fierrez J. , and Ortega-Garcia J., “A high perfomancefingerprint liveness detection method based on quality related features”, Future Generation Computer Systems, Vol. 28, Issue 1, pp. 311–321, 2012.
[10] Iscan Z., Dokur Z., and Ölmez T.,“Tumor detection by using Zernike moments on segmented magnetic resonance brain images,” Expert Systems with .Applications, vol. 37, no. 3, pp. 2540–2549, 2010
[11] Jee H.-K.., Jung S.-U., Yoo J.-H., “Liveness detection for embedded face recognition system,” World Academy of Science, Engineering and Technology, vol. 18, pp.941-943 , 2008.
[12] Kim H.J., and Kim W.Y., “Eye detection in facial images using Zernike moments with SVM,” ETRI Journal, vol. 30, no. 2, pp. 335–
IAJIT First Online Publication
337, 2008. [13] Kim M.K.: Digital Holographic Microscopy:
Principles, Techniques, and Applications, Springer Series in Optical Sciences 162, Chapter 2 Diffraction and Fourier Optics, 2011.
[14] Khotanzad A., Hong Y.H., “Invarient Image Recognition by Zernike moments”, IEEE Transaction on Pattern Analysis and Machine Inteligence, vol.12, no.5,pp. 489-497, 1990.
[15] Kollreider K., Fronthaler H., and Bigun J: “Evaluating liveness by face images and the structure tensor”, Fourth IEEE Workshop on Automatic Identification Advanced Technologies,pp.17–18 , 2005.
[16] komogortsev.O.V, karpov.A .liveness detection via oculomotor plant characteristics:attack of mechanical replicas,international conference on biometrics(ICB),pp:1-8,4-7 June 2013.
[17] Lajevardi S.M., and Hussain Z.M., “Automatic facial expression recognition: feature extraction and selection”, Signal, Image and Video Processing ,Vol .6,no.1, pp.159-169, 2012.
[18] Li J., Wang Y., Tan T., and Jain A.K., “Live Face Detection based on the Analysis of Fourier Spectra”, In: SPIE Proceedings on Biometric Technology for Huma n Identification, pp 296-303, 2004.
[19] Li S., Lee M.C., and Pun C.M., “Complex Zernike moments features for shape-based image retrieval,” IEEE Transaction on Systems Man and Cybernetics, vol. 39, no. 1, pp. 227–237, 2009.
[20] Liyun W., Hefei L., Fuhao Z., Zhengding L., and Zhendi W., “Spermatogonium image recognition using Zernike moments,” Computer Methods and Programs in Biomedicine, vol. 95, no. 1, pp. 10–22, 2009.
[21] Long T.B., Thai L.H., Hanh T., “Multimodal Biometric Person Authentication Using Fingerprint, Face Features”,Lecture Notes in Computer Science ,Vol. 7458 ,pp.613-624, 2012.
[22] Lu C. and Lu Z. :“Zernike moment invariants based iris recognition”, Lecture Notes in Computer Science, vol. 3338, pp. 554–561, 2004.
[23] Määttä J., Hadid A., and Pietikäinen M., “Face spoofing detection from single images using micro-texture analysis”, The International Joint Conference on Biometrics, pp.1-7, 2011.
[24] Murtaza M., Sharif M., Raza M., and Shah J.H, “Face Recognition Using Adaptive Margin Fisher’s Criterion Linear Discriminant Analysis (AMFC-LDA)”, The International Arab Journal of Information Technology (IAJIT), Vol. 11, No. 2, 2014.
[25] Murtaza M., Sharif M., Raza M., and Shah J.H, “Analysis of Face Recognition under Varying Facial Expression: A Survey”, The International Arab Journal of Information Technology (IAJIT)
Vol. 10, No.4 , 2013. [26] Pan G., Wu, Z., Sun, L.: Liveness detection for
face recognition. In: Recent Advances inFace Recognition. pp. 236–252 , 2008.
[27] Parvathi R, Sankar M: “Fingerprint Authentication System using Hybrid Classifiers”,International Journal of Soft Computingand Engineering, Vol.2, pp.185-190 , 2012.
[28] Shan C., “ Learning local binary patterns for gender classification on real-world face images”, Pattern Recognition Letters, Vol.33,no.4,pp. 431–437, 2012.
[29] Shimobaba T., Kakue T., Okada N.,Oikawa M.,Yamaguchi Y.,Ito T., “Aliasing-reduced Fresnel diffraction with scale and shift operations ”,Journal of Optics, vol.15, no.7, 2013.
[30] Trester S., “Computer-Simulated Fresnel Holography”, European Journal of Physics, vol .21,no.4, pp.317-331, 2000.
[31] Wang L. and Healey G., “Using Zernike moments for the illumination and geometry invariant classification of multispectral texture,” IEEE Transaction on Image Processing, vol. 7, no. 2, pp. 196–203, 1998.
[32] Xie Zh., Liu G., Fang Zh., “Face Recognition Based on Combination of Human Perception and Local Binary Pattern”, Lecture Notes in Computer Science, Vol.7202,pp. 365-373, 2012.
[33] Zhang H., Sun Z., Tan T : “Learning Hierarchical Visual Codebook for Iris Liveness Detection”, The International Joint Conference on Biometrics,pp.11-13, 2011.
Seyed Farhood Mousavizadeh holds Ms degree in biomedical engineering and is Ph.D student at department of Biomedical Engineering,Science and research branch,Islamic Azad University,Tehran,Iran. He has
more than 7 years of experience in teaching graduate and undergraduate courses. He has been head of the Electrical and Electronic Engineering Department in Semnan Azad University for five years. His research interests in biomedical engineering are medical image and signal processing ,Bioinformatics and Biometrics like face,voice,iris and finger print recognition.
IAJIT First Online Publication
Keivan Maghooli has been the Assistant Professor at Department of Biomedical Engineering, Science and Research Branch, Islamic Azad University, Tehran, Iran. He is a PhD Scholar at mentioned Department. He holds MS(CS)
degree in Biomedical Engineering from Tarbiat Modares University, Tehran, Iran. He has more than 10 years of experience including teaching graduate and undergraduate classes. He also leads and teaches modules at BSc, MSc and PhD levels in Biomedical Engineering.
Emad Fatemizadeh is faculty member of Biomedical Engineering in the Department of Electrical Engineering at Sharif University of Technology since 2004. He received a B.S. degree in Electrical Engineering from Sharif University
of technology, and an M.S. degree in Biomedical Engineering from Amir-Kabir University of Technology, and PhD degree from Tehran University. His research interests in biomedical engineering are in the areas of medical image, signal, and date analysis and processing, bioinformatics, statistical pattern recognition, medical data mining, and medical images database systems, and machine learning. Emad Fatemizadeh leads the group of medical image analysis and Processing (MIAP) and bioinformatics in Biomedical Signal and Images Analysis Lab (BiSIPL in Sharif University of Technology.
Mohammad Shahram Moin received his B.Sc. degree in electrical engineering from Amir Kabir University of Technology, Tehran, Iran, in 1988; M.Sc. degree in electrical engineering from Tehran University, Tehran, Iran, in
1991; and Ph.D. degree in electrical engineering from École Polytechnique de Montréal, Montréal, Canada, in 2000. Dr. Moin is assistant professor and lecturer of Data Compression, Pattern Recognition Artificial Neural Networks and Stochastic Processes courses in graduate levels. He has published 21 journal papers, 7 book chapters and 64 conference papers. Dr. Moin is IEEE Senior member and former member of directing board of IEEE Iran Section. His current research interests are applications of image processing, signal processing and pattern recognition in multimedia information security (including biometrics, watermarking, steganography and steganalysis), multimedia information retrieval, human-computer interaction and multimedia information coding.
IAJIT First Online Publication