Embed Size (px)
Citation preview
International Journal of Engineering Business Management, Vol. 3, No. 2 (2011)
A Risk Management Model for Merger and Acquisition B. S. Chui Sage International Group Limited, Hong Kong
Abstract In this paper, a merger and acquisition risk management model is proposed for considering risk factors in the merger and acquisition activities. The proposed model aims to maximize the probability of success in merger and acquisition activities by managing and reducing the associated risks. The modeling of the proposed merger and acquisition risk management model is described and illustrated in this paper. The illustration result shows that the proposed model can help to screen the best target company with minimum associated risks in the merger and acquisition activity. Keywords Merger and Acquisition, Risk Analysis, Risk Management
1. Introduction Driven by globalization, international business looks for a bigger market to achieve the scale of economy, so as to overcome the economic barriers. Many organizations adopt merger and acquisition (M&A) as a part of their corporate strategy to achieve their business objectives. M&A is a kind of transaction that can upgrade and optimize the capital structure of companies with a transfer of ownership and property rights. M&A has already been developed with one century of history in the world and give rise to merger and acquisition waves over the world sixth times since the 1990s. Benefits of M&A include increased economies of scale, increased market share, enhanced efficient resource allocations, expanded a larger asset base, increased reputation or added name recognition, and instantly adopted expert talent lacking
in one to the other organization. Moreover, organizations use M&A to penetrate into new markets and new geographic regions, gain technical/management expertise and knowledge, or allocate capital. Even though business organizations often utilize corporate M&A strategy to expand their business, many poorly understood and managed M&A result in failure. Systematic corporate M&A research can help to understand the M&A activities. However, Sirower (1997) emphasized the lack of clear understanding of how to maximize the probability of success in M&A despite a decade of empirical research. Financial economics and strategic management literature are the two main streams of literature framework to understand the M&A activities (Datta, D., et al., 1992). Financial economists view M&A as contests between competing management teams for the control of corporate entities (Datta, D., et al., 1992). Strategic management researchers use a different approach by analyzing M&A via examining management controlled factors, such as: diversification strategies (i.e., related vs. unrelated diversification), different types of acquisitions (i.e., merger vs. tender offer), or different types of payments (i.e., cash vs. stock). Nonetheless, neither of these disciplines provides sufficient explanation for the failure of M&A. Therefore, in order to minimize the failure in M&A, a risk management perspective is proposed in this paper, i.e. an approach that attempts to maximize the probability of success in M&A by managing and reducing the risks that associated in the M&A activities. For this reason, this paper attempts to propose a risk management model for the M&A activities, and is organized as follows. Section 2 discusses
International Journal of Engineering Business Management, Vol. 3, No. 2 (2011)37 www.intechweb.orgwww.intechopen.com
International Journal of Engineering Business Management,Vol. 3, No. 2 (2011) ISSN 1847-9790, pp 37-44
the current theories and models of M&A activities in the literature. Section 3 proposes a theoretical framework for the M&A risk management model while section 4 illustrates the mechanism of the proposed model with data. Finally, a conclusion is given in section 5. 2. Theories and Models of M&A There has been a long history for M&A activities, and different types of models and theories have been developed. In most M&A studies in the literature, they are about the acquisition of all of a target organization while the remainders are about either partial acquisitions of a target, or completing acquisitions where part of the target was previously owned by the acquirer. The M&A research findings from the earlier studies showed that most targets significantly increase in value whereas acquirers typically experience small declines in values. These transactions have been extensively examined from perspectives such as auction theory and the “winner’s curse” is an established part of the literature. Subsequent studies have added refinement to the understanding of the earlier studies in M&A (Andrade, G., et al., 2001). Other studies in M&A include analyzing the economic monetary effects in addition to the percentage abnormal returns (Bradley, M., Desai, A. & Kim, E., 1988). The significance of the type of consideration in M&A was noted and has been extensively examined (Heron, R. & Lie, E., 2002). The extensive series of method-of-payment in M&A studies are succinctly summarized by Bharadwaj and Shivdansi (2003). They carried out empirical examination in determining the distribution of gains between bidders and targets in M&A. Theoretical work pertaining to M&A has also been studied, including the findings of average negative returns to acquirers led to theories pertaining to agency considerations and free cash flow (Jensen, M., 1986), and the role of hubris (Roll, R., 1986). Behavioral finance theories have also been put forward to structure the examination of M&A in which acquisitions are motivated by stock market conditions (Schleifer, A. & Vishney, R., 2003). Other M&A studies have explained the activity by the “tariff-jumping” argument that investing via M&A is an alternative mode to enter other markets or expand the market. These ideas have been formalized in theoretical models in terms of trade costs (Carr et, D., et al., 2001; Markusen, J., 2002; Blonigen, B., et al., 2003). Another strand of literature has investigated the determinants of international M&A activities from a more industrial organization oriented background. For example, Horn and Persson (2001), Bjorvatn (2004) and Norback and Persson (2004) provided theoretical models where foreign organizations may acquire domestic acquisition targets, with the acquisition price being determined endogenously in a bargaining process. In these models,
contrary to the tariff-jumping argument, high trade costs do not necessarily induce cross-border M&A. High trade costs not only encourage tariff-jumping mergers, but also increase the incentives for domestic mergers as they reduce the degree of competition in the domestic market, thereby increasing the acquisition price domestic acquirers are prepared to pay for domestic targets. Furthermore, Neary (2007) developed a model of mergers in a two-country oligopoly in general equilibrium. Moreover, a number of studies have examined the consequences cross-border M&A activities. Doukas and Travlos (1988) found generally insignificant valuation consequences for acquirers with the exception of when the acquisition was the first major step of the acquirer into the target’s country. Lin, Madura, and Picou (1994) found material variation in acquirer valuation reactions according to the domicile of the target. Kang (1993) examined matched-pairs of acquisitions in cross border M&A activities. He found statistically significant wealth gains for both organizations. As is appropriate for cross-border acquisitions, he placed his analysis in the context of Direct Foreign Investment (DFI). The M&A studies in, Barros and Cabral (1994), Head and Ries (1997), Kabiraj and Chaudhuri (1999), and Horn and Levinshon (2001) analyzed the welfare effects of M&A and derive policy implications. The positive issue of equilibrium market structure via M&A in an international context has been analyzed by Horn and Persson (2001), NorbKack and Persson (2004). For the analysis of M&A performance, Beena (2000) analyzed the significance of mergers and its characteristics, and reported that the most mergers were dominated by mergers between companies belonging to the same business group or house with similar product lines. The study also revealed that mergers between unrelated companies were gaining ground but mergers contributed significantly to asset growth in only one-fifth of the sampled companies studied. Langhe and Ooghe (2001) examined the M&A performance of smaller companies involved in the takeover, and their findings showed that following the takeover, profitability, solvency and liquidity of most of the merged companies declined. Pawaskar (2001) analyzed the post-merger operating performance of the acquiring companies and attempted to identify the sources of merger-induced changes. The study reported that as indicated by all the profitability measure, mergers had a negative impact on the acquirers’ performance. Moreover, no significant improvement in profitability was found when comparing the profitability difference between the pre and post M&A activity. Sharma and Ho (2002) reported a decline in operating performance after M&A activity when carried out studies on the operating performance of 36 Australian companies involved in mergers. Rahman and Limmack (2004) analyzed control-adjusted operating cash flow performance using a sample of Malaysian
International Journal of Engineering Business Management, Vol. 3, No. 2 (2011)38 www.intechweb.orgwww.intechopen.com
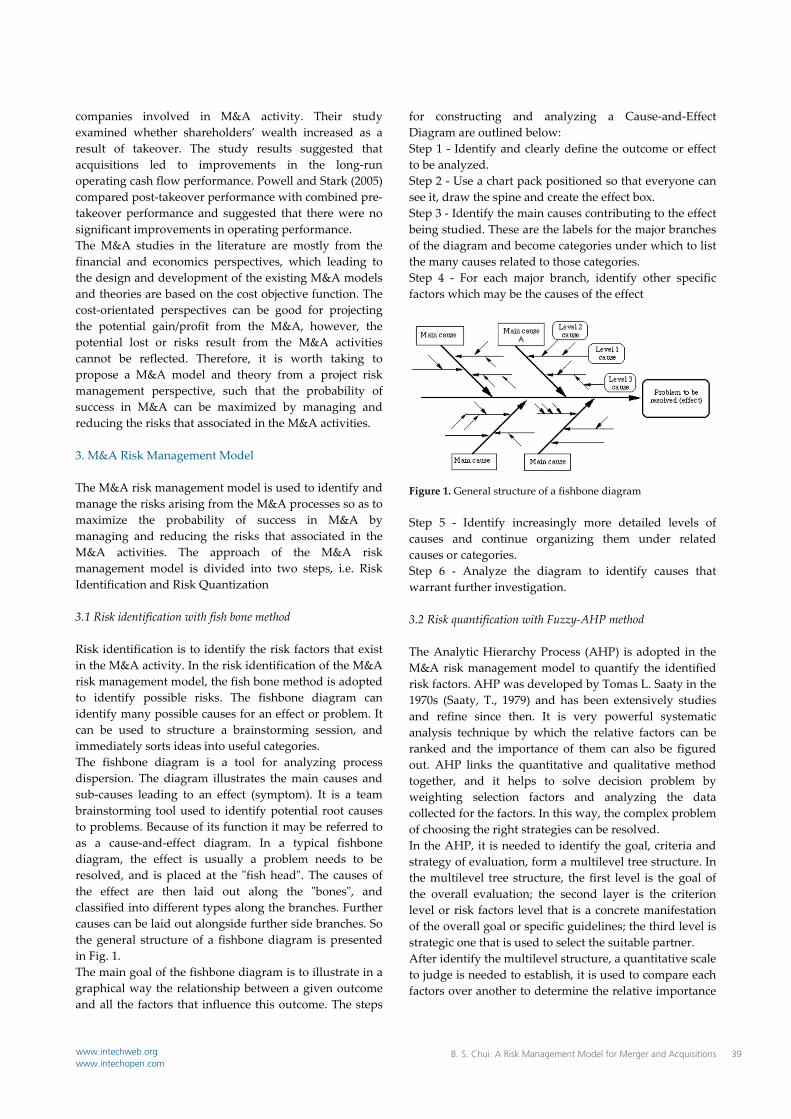
companies involved in M&A activity. Their study examined whether shareholders’ wealth increased as a result of takeover. The study results suggested that acquisitions led to improvements in the long-run operating cash flow performance. Powell and Stark (2005) compared post-takeover performance with combined pre-takeover performance and suggested that there were no significant improvements in operating performance. The M&A studies in the literature are mostly from the financial and economics perspectives, which leading to the design and development of the existing M&A models and theories are based on the cost objective function. The cost-orientated perspectives can be good for projecting the potential gain/profit from the M&A, however, the potential lost or risks result from the M&A activities cannot be reflected. Therefore, it is worth taking to propose a M&A model and theory from a project risk management perspective, such that the probability of success in M&A can be maximized by managing and reducing the risks that associated in the M&A activities. 3. M&A Risk Management Model The M&A risk management model is used to identify and manage the risks arising from the M&A processes so as to maximize the probability of success in M&A by managing and reducing the risks that associated in the M&A activities. The approach of the M&A risk management model is divided into two steps, i.e. Risk Identification and Risk Quantization 3.1 Risk identification with fish bone method Risk identification is to identify the risk factors that exist in the M&A activity. In the risk identification of the M&A risk management model, the fish bone method is adopted to identify possible risks. The fishbone diagram can identify many possible causes for an effect or problem. It can be used to structure a brainstorming session, and immediately sorts ideas into useful categories. The fishbone diagram is a tool for analyzing process dispersion. The diagram illustrates the main causes and sub-causes leading to an effect (symptom). It is a team brainstorming tool used to identify potential root causes to problems. Because of its function it may be referred to as a cause-and-effect diagram. In a typical fishbone diagram, the effect is usually a problem needs to be resolved, and is placed at the "fish head". The causes of the effect are then laid out along the "bones", and classified into different types along the branches. Further causes can be laid out alongside further side branches. So the general structure of a fishbone diagram is presented in Fig. 1. The main goal of the fishbone diagram is to illustrate in a graphical way the relationship between a given outcome and all the factors that influence this outcome. The steps
for constructing and analyzing a Cause-and-Effect Diagram are outlined below: Step 1 - Identify and clearly define the outcome or effect to be analyzed. Step 2 - Use a chart pack positioned so that everyone can see it, draw the spine and create the effect box. Step 3 - Identify the main causes contributing to the effect being studied. These are the labels for the major branches of the diagram and become categories under which to list the many causes related to those categories. Step 4 - For each major branch, identify other specific factors which may be the causes of the effect
Figure 1. General structure of a fishbone diagram Step 5 - Identify increasingly more detailed levels of causes and continue organizing them under related causes or categories. Step 6 - Analyze the diagram to identify causes that warrant further investigation. 3.2 Risk quantification with Fuzzy-AHP method The Analytic Hierarchy Process (AHP) is adopted in the M&A risk management model to quantify the identified risk factors. AHP was developed by Tomas L. Saaty in the 1970s (Saaty, T., 1979) and has been extensively studies and refine since then. It is very powerful systematic analysis technique by which the relative factors can be ranked and the importance of them can also be figured out. AHP links the quantitative and qualitative method together, and it helps to solve decision problem by weighting selection factors and analyzing the data collected for the factors. In this way, the complex problem of choosing the right strategies can be resolved. In the AHP, it is needed to identify the goal, criteria and strategy of evaluation, form a multilevel tree structure. In the multilevel tree structure, the first level is the goal of the overall evaluation; the second layer is the criterion level or risk factors level that is a concrete manifestation of the overall goal or specific guidelines; the third level is strategic one that is used to select the suitable partner. After identify the multilevel structure, a quantitative scale to judge is needed to establish, it is used to compare each factors over another to determine the relative importance
B. S. Chui: A Risk Management Model for Merger and Acquisitions 39www.intechweb.orgwww.intechopen.com
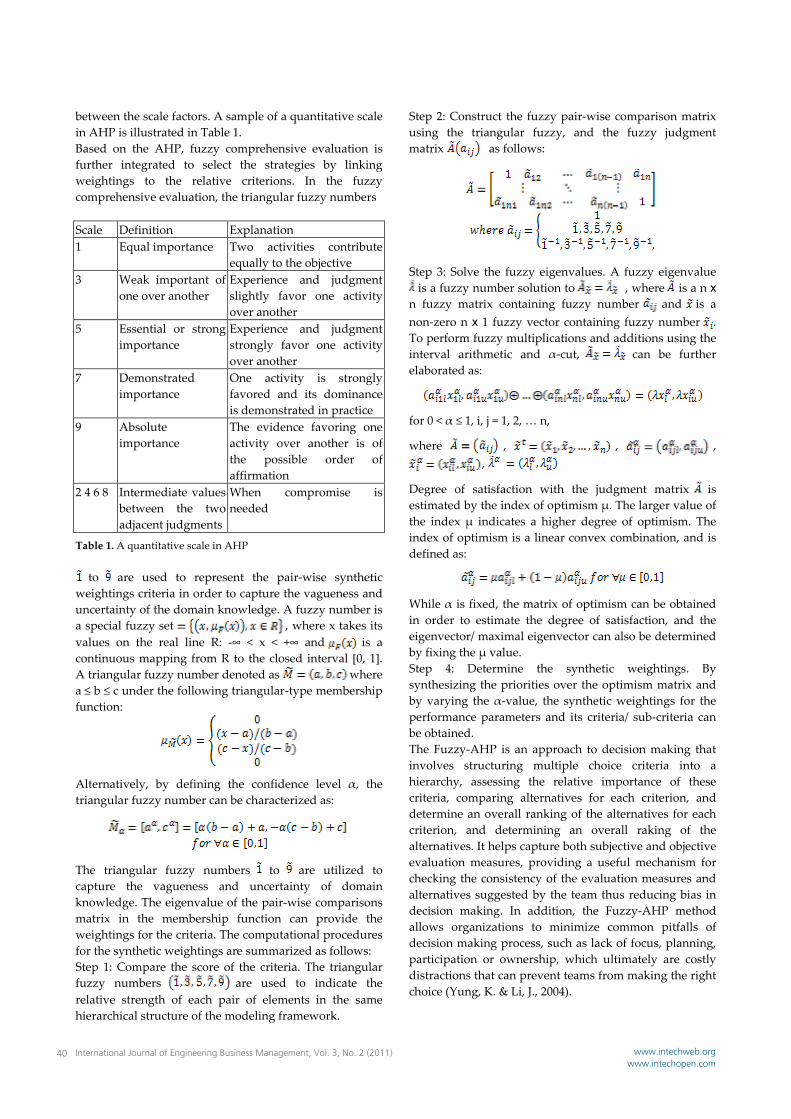
between the scale factors. A sample of a quantitative scale in AHP is illustrated in Table 1. Based on the AHP, fuzzy comprehensive evaluation is further integrated to select the strategies by linking weightings to the relative criterions. In the fuzzy comprehensive evaluation, the triangular fuzzy numbers Scale Definition Explanation 1 Equal importance Two activities contribute
equally to the objective 3 Weak important of
one over another Experience and judgment slightly favor one activity over another
5 Essential or strong importance
Experience and judgment strongly favor one activity over another
7 Demonstrated importance
One activity is strongly favored and its dominance is demonstrated in practice
9 Absolute importance
The evidence favoring one activity over another is of the possible order of affirmation
2 4 6 8 Intermediate values between the two adjacent judgments
When compromise is needed
Table 1. A quantitative scale in AHP
to are used to represent the pair-wise synthetic weightings criteria in order to capture the vagueness and uncertainty of the domain knowledge. A fuzzy number is a special fuzzy set , where x takes its values on the real line R: -∞ < x < +∞ and is a continuous mapping from R to the closed interval [0, 1]. A triangular fuzzy number denoted as where a ≤ b ≤ c under the following triangular-type membership function:
Alternatively, by defining the confidence level α, the triangular fuzzy number can be characterized as:
The triangular fuzzy numbers to are utilized to capture the vagueness and uncertainty of domain knowledge. The eigenvalue of the pair-wise comparisons matrix in the membership function can provide the weightings for the criteria. The computational procedures for the synthetic weightings are summarized as follows: Step 1: Compare the score of the criteria. The triangular fuzzy numbers are used to indicate the relative strength of each pair of elements in the same hierarchical structure of the modeling framework.
Step 2: Construct the fuzzy pair-wise comparison matrix using the triangular fuzzy, and the fuzzy judgment matrix as follows:
Step 3: Solve the fuzzy eigenvalues. A fuzzy eigenvalue is a fuzzy number solution to , where is a n x
n fuzzy matrix containing fuzzy number and is a non-zero n x 1 fuzzy vector containing fuzzy number . To perform fuzzy multiplications and additions using the interval arithmetic and α-cut, can be further elaborated as:
for 0 < α ≤ 1, i, j = 1, 2, … n,
where , , , ,
Degree of satisfaction with the judgment matrix is estimated by the index of optimism μ. The larger value of the index μ indicates a higher degree of optimism. The index of optimism is a linear convex combination, and is defined as:
While α is fixed, the matrix of optimism can be obtained in order to estimate the degree of satisfaction, and the eigenvector/ maximal eigenvector can also be determined by fixing the μ value. Step 4: Determine the synthetic weightings. By synthesizing the priorities over the optimism matrix and by varying the α-value, the synthetic weightings for the performance parameters and its criteria/ sub-criteria can be obtained. The Fuzzy-AHP is an approach to decision making that involves structuring multiple choice criteria into a hierarchy, assessing the relative importance of these criteria, comparing alternatives for each criterion, and determine an overall ranking of the alternatives for each criterion, and determining an overall raking of the alternatives. It helps capture both subjective and objective evaluation measures, providing a useful mechanism for checking the consistency of the evaluation measures and alternatives suggested by the team thus reducing bias in decision making. In addition, the Fuzzy-AHP method allows organizations to minimize common pitfalls of decision making process, such as lack of focus, planning, participation or ownership, which ultimately are costly distractions that can prevent teams from making the right choice (Yung, K. & Li, J., 2004).
International Journal of Engineering Business Management, Vol. 3, No. 2 (2011)40 www.intechweb.orgwww.intechopen.com
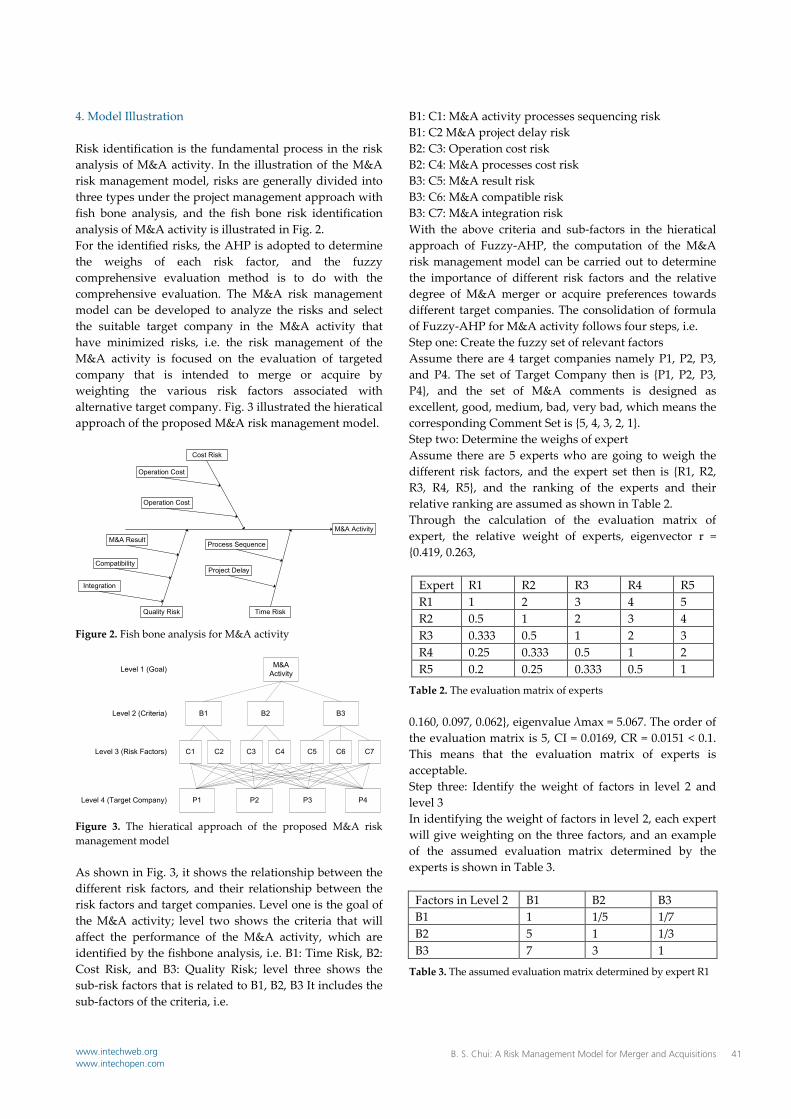
4. Model Illustration Risk identification is the fundamental process in the risk analysis of M&A activity. In the illustration of the M&A risk management model, risks are generally divided into three types under the project management approach with fish bone analysis, and the fish bone risk identification analysis of M&A activity is illustrated in Fig. 2. For the identified risks, the AHP is adopted to determine the weighs of each risk factor, and the fuzzy comprehensive evaluation method is to do with the comprehensive evaluation. The M&A risk management model can be developed to analyze the risks and select the suitable target company in the M&A activity that have minimized risks, i.e. the risk management of the M&A activity is focused on the evaluation of targeted company that is intended to merge or acquire by weighting the various risk factors associated with alternative target company. Fig. 3 illustrated the hieratical approach of the proposed M&A risk management model.
M&A Activity
Cost Risk
Quality Risk Time Risk
Operation Cost
Process Sequence
Operation Cost
Project Delay
M&A Result
Compatibility
Integration
Figure 2. Fish bone analysis for M&A activity
M&A Activity
B1 B2 B3
C1 C2 C3 C4 C5 C6 C7
P1 P2 P3 P4
Level 1 (Goal)
Level 2 (Criteria)
Level 3 (Risk Factors)
Level 4 (Target Company)
Figure 3. The hieratical approach of the proposed M&A risk management model As shown in Fig. 3, it shows the relationship between the different risk factors, and their relationship between the risk factors and target companies. Level one is the goal of the M&A activity; level two shows the criteria that will affect the performance of the M&A activity, which are identified by the fishbone analysis, i.e. B1: Time Risk, B2: Cost Risk, and B3: Quality Risk; level three shows the sub-risk factors that is related to B1, B2, B3 It includes the sub-factors of the criteria, i.e.
B1: C1: M&A activity processes sequencing risk B1: C2 M&A project delay risk B2: C3: Operation cost risk B2: C4: M&A processes cost risk B3: C5: M&A result risk B3: C6: M&A compatible risk B3: C7: M&A integration risk With the above criteria and sub-factors in the hieratical approach of Fuzzy-AHP, the computation of the M&A risk management model can be carried out to determine the importance of different risk factors and the relative degree of M&A merger or acquire preferences towards different target companies. The consolidation of formula of Fuzzy-AHP for M&A activity follows four steps, i.e. Step one: Create the fuzzy set of relevant factors Assume there are 4 target companies namely P1, P2, P3, and P4. The set of Target Company then is {P1, P2, P3, P4}, and the set of M&A comments is designed as excellent, good, medium, bad, very bad, which means the corresponding Comment Set is {5, 4, 3, 2, 1}. Step two: Determine the weighs of expert Assume there are 5 experts who are going to weigh the different risk factors, and the expert set then is {R1, R2, R3, R4, R5}, and the ranking of the experts and their relative ranking are assumed as shown in Table 2. Through the calculation of the evaluation matrix of expert, the relative weight of experts, eigenvector r = {0.419, 0.263,
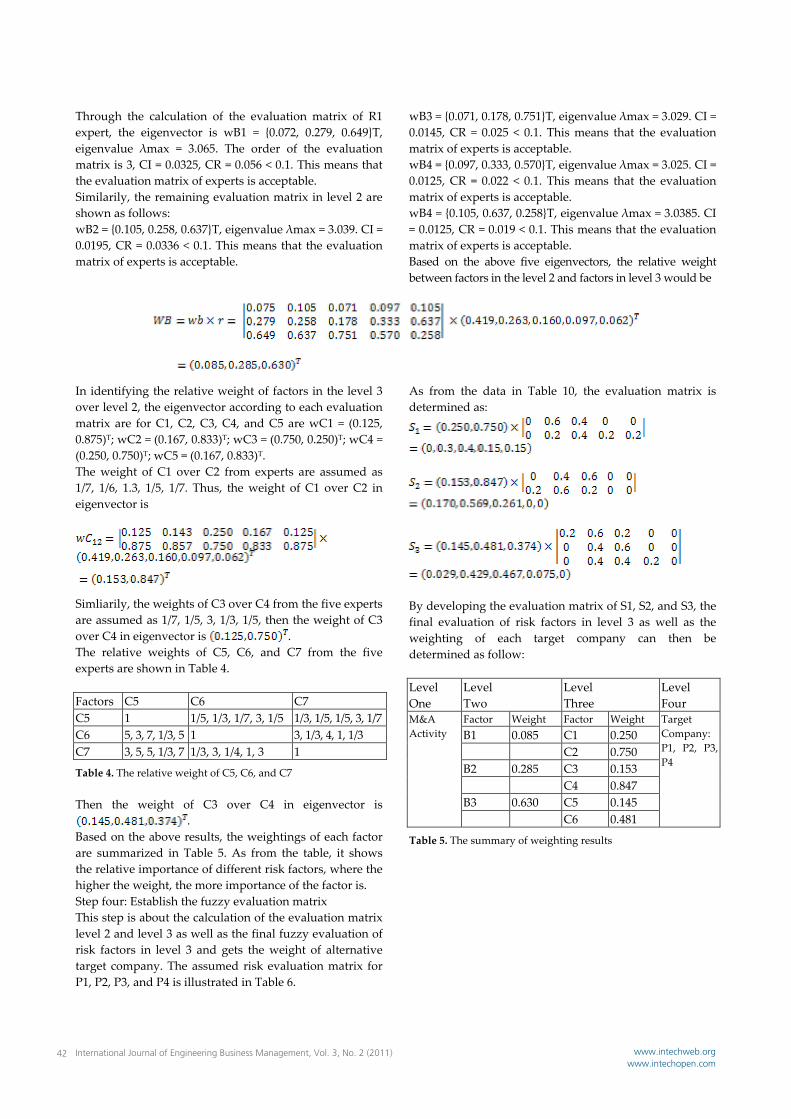
Expert R1 R2 R3 R4 R5 R1 1 2 3 4 5 R2 0.5 1 2 3 4 R3 0.333 0.5 1 2 3 R4 0.25 0.333 0.5 1 2 R5 0.2 0.25 0.333 0.5 1
Table 2. The evaluation matrix of experts 0.160, 0.097, 0.062}, eigenvalue λmax = 5.067. The order of the evaluation matrix is 5, CI = 0.0169, CR = 0.0151 < 0.1. This means that the evaluation matrix of experts is acceptable. Step three: Identify the weight of factors in level 2 and level 3 In identifying the weight of factors in level 2, each expert will give weighting on the three factors, and an example of the assumed evaluation matrix determined by the experts is shown in Table 3.
Factors in Level 2 B1 B2 B3 B1 1 1/5 1/7 B2 5 1 1/3 B3 7 3 1
Table 3. The assumed evaluation matrix determined by expert R1
B. S. Chui: A Risk Management Model for Merger and Acquisitions 41www.intechweb.orgwww.intechopen.com
Through the calculation of the evaluation matrix of R1 expert, the eigenvector is wB1 = {0.072, 0.279, 0.649}T, eigenvalue λmax = 3.065. The order of the evaluation matrix is 3, CI = 0.0325, CR = 0.056 < 0.1. This means that the evaluation matrix of experts is acceptable. Similarily, the remaining evaluation matrix in level 2 are shown as follows: wB2 = {0.105, 0.258, 0.637}T, eigenvalue λmax = 3.039. CI = 0.0195, CR = 0.0336 < 0.1. This means that the evaluation matrix of experts is acceptable.
wB3 = {0.071, 0.178, 0.751}T, eigenvalue λmax = 3.029. CI = 0.0145, CR = 0.025 < 0.1. This means that the evaluation matrix of experts is acceptable. wB4 = {0.097, 0.333, 0.570}T, eigenvalue λmax = 3.025. CI = 0.0125, CR = 0.022 < 0.1. This means that the evaluation matrix of experts is acceptable. wB4 = {0.105, 0.637, 0.258}T, eigenvalue λmax = 3.0385. CI = 0.0125, CR = 0.019 < 0.1. This means that the evaluation matrix of experts is acceptable. Based on the above five eigenvectors, the relative weight between factors in the level 2 and factors in level 3 would be
In identifying the relative weight of factors in the level 3 over level 2, the eigenvector according to each evaluation matrix are for C1, C2, C3, C4, and C5 are wC1 = (0.125, 0.875)T; wC2 = (0.167, 0.833)T; wC3 = (0.750, 0.250)T; wC4 = (0.250, 0.750)T; wC5 = (0.167, 0.833)T. The weight of C1 over C2 from experts are assumed as 1/7, 1/6, 1.3, 1/5, 1/7. Thus, the weight of C1 over C2 in eigenvector is
Simliarily, the weights of C3 over C4 from the five experts are assumed as 1/7, 1/5, 3, 1/3, 1/5, then the weight of C3 over C4 in eigenvector is . The relative weights of C5, C6, and C7 from the five experts are shown in Table 4. Factors C5 C6 C7 C5 1 1/5, 1/3, 1/7, 3, 1/5 1/3, 1/5, 1/5, 3, 1/7 C6 5, 3, 7, 1/3, 5 1 3, 1/3, 4, 1, 1/3 C7 3, 5, 5, 1/3, 7 1/3, 3, 1/4, 1, 3 1
Table 4. The relative weight of C5, C6, and C7 Then the weight of C3 over C4 in eigenvector is
. Based on the above results, the weightings of each factor are summarized in Table 5. As from the table, it shows the relative importance of different risk factors, where the higher the weight, the more importance of the factor is. Step four: Establish the fuzzy evaluation matrix This step is about the calculation of the evaluation matrix level 2 and level 3 as well as the final fuzzy evaluation of risk factors in level 3 and gets the weight of alternative target company. The assumed risk evaluation matrix for P1, P2, P3, and P4 is illustrated in Table 6.
As from the data in Table 10, the evaluation matrix is determined as:
By developing the evaluation matrix of S1, S2, and S3, the final evaluation of risk factors in level 3 as well as the weighting of each target company can then be determined as follow: Level One
Level Two
Level Three
Level Four
M&A Activity
Factor Weight Factor Weight Target Company: P1, P2, P3, P4
B1 0.085 C1 0.250 C2 0.750 B2 0.285 C3 0.153 C4 0.847 B3 0.630 C5 0.145 C6 0.481
Table 5. The summary of weighting results
International Journal of Engineering Business Management, Vol. 3, No. 2 (2011)42 www.intechweb.orgwww.intechopen.com
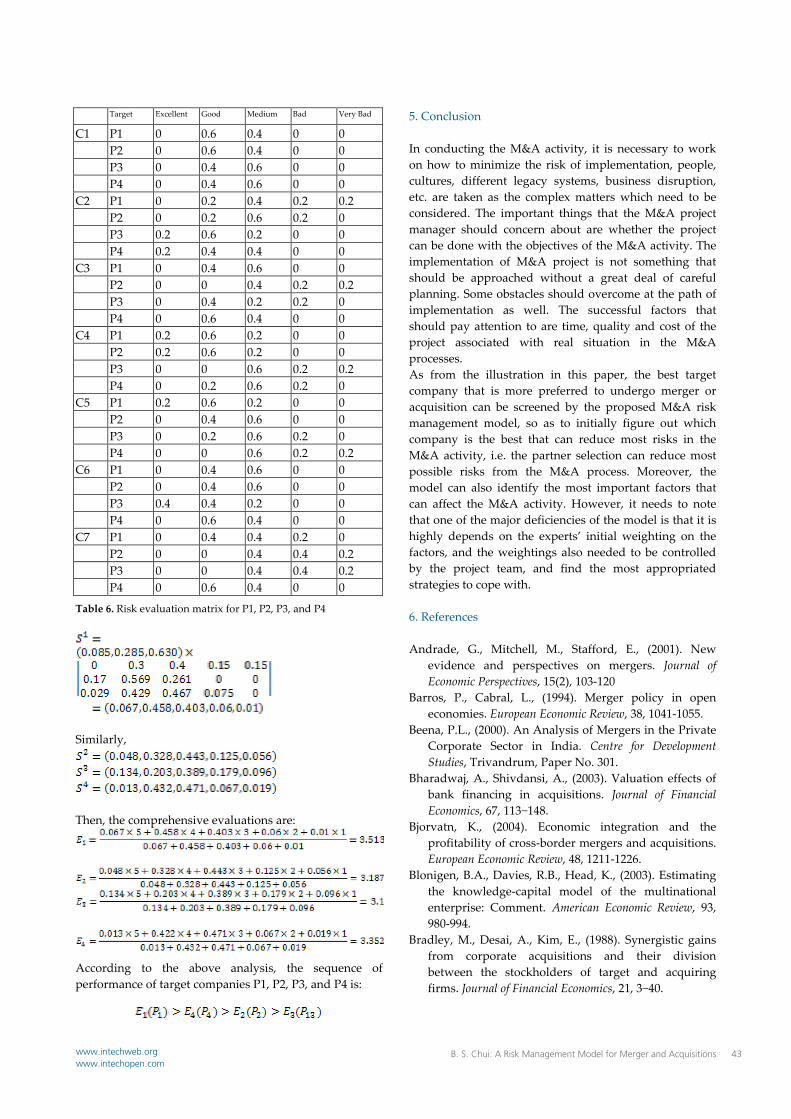
Target Excellent Good Medium Bad Very Bad
C1 P1 0 0.6 0.4 0 0 P2 0 0.6 0.4 0 0 P3 0 0.4 0.6 0 0 P4 0 0.4 0.6 0 0 C2 P1 0 0.2 0.4 0.2 0.2 P2 0 0.2 0.6 0.2 0 P3 0.2 0.6 0.2 0 0 P4 0.2 0.4 0.4 0 0 C3 P1 0 0.4 0.6 0 0 P2 0 0 0.4 0.2 0.2 P3 0 0.4 0.2 0.2 0 P4 0 0.6 0.4 0 0 C4 P1 0.2 0.6 0.2 0 0 P2 0.2 0.6 0.2 0 0 P3 0 0 0.6 0.2 0.2 P4 0 0.2 0.6 0.2 0 C5 P1 0.2 0.6 0.2 0 0 P2 0 0.4 0.6 0 0 P3 0 0.2 0.6 0.2 0 P4 0 0 0.6 0.2 0.2 C6 P1 0 0.4 0.6 0 0 P2 0 0.4 0.6 0 0 P3 0.4 0.4 0.2 0 0 P4 0 0.6 0.4 0 0 C7 P1 0 0.4 0.4 0.2 0 P2 0 0 0.4 0.4 0.2 P3 0 0 0.4 0.4 0.2 P4 0 0.6 0.4 0 0
Table 6. Risk evaluation matrix for P1, P2, P3, and P4
Similarly,
Then, the comprehensive evaluations are:
According to the above analysis, the sequence of performance of target companies P1, P2, P3, and P4 is:
5. Conclusion In conducting the M&A activity, it is necessary to work on how to minimize the risk of implementation, people, cultures, different legacy systems, business disruption, etc. are taken as the complex matters which need to be considered. The important things that the M&A project manager should concern about are whether the project can be done with the objectives of the M&A activity. The implementation of M&A project is not something that should be approached without a great deal of careful planning. Some obstacles should overcome at the path of implementation as well. The successful factors that should pay attention to are time, quality and cost of the project associated with real situation in the M&A processes. As from the illustration in this paper, the best target company that is more preferred to undergo merger or acquisition can be screened by the proposed M&A risk management model, so as to initially figure out which company is the best that can reduce most risks in the M&A activity, i.e. the partner selection can reduce most possible risks from the M&A process. Moreover, the model can also identify the most important factors that can affect the M&A activity. However, it needs to note that one of the major deficiencies of the model is that it is highly depends on the experts’ initial weighting on the factors, and the weightings also needed to be controlled by the project team, and find the most appropriated strategies to cope with. 6. References Andrade, G., Mitchell, M., Stafford, E., (2001). New
evidence and perspectives on mergers. Journal of Economic Perspectives, 15(2), 103-120
Barros, P., Cabral, L., (1994). Merger policy in open economies. European Economic Review, 38, 1041-1055.
Beena, P.L., (2000). An Analysis of Mergers in the Private Corporate Sector in India. Centre for Development Studies, Trivandrum, Paper No. 301.
Bharadwaj, A., Shivdansi, A., (2003). Valuation effects of bank financing in acquisitions. Journal of Financial Economics, 67, 113−148.
Bjorvatn, K., (2004). Economic integration and the profitability of cross-border mergers and acquisitions. European Economic Review, 48, 1211-1226.
Blonigen, B.A., Davies, R.B., Head, K., (2003). Estimating the knowledge-capital model of the multinational enterprise: Comment. American Economic Review, 93, 980-994.
Bradley, M., Desai, A., Kim, E., (1988). Synergistic gains from corporate acquisitions and their division between the stockholders of target and acquiring firms. Journal of Financial Economics, 21, 3−40.
B. S. Chui: A Risk Management Model for Merger and Acquisitions 43www.intechweb.orgwww.intechopen.com
Carr, D.L., Markusen, J.R., Maskus, K.E., (2001). Estimating the knowledge-capital model of the multinational enterprise. American Economic Review, 91, 693-708.
Datta, D.K., Pinches, G.E., Narayanan, V.K., (1992). Factors Influencing Wealth Creation from Mergers and Acquisitions: A Meta-Analysis. Strategic Management Journal, 13, 67-84.
Doukas, J., Travlos, N.G., (1988). The effect of corporate multi-nationalism on shareholder wealth: Evidence from international acquisitions. The Journal of Finance, 43, 1161−1175
Head, K., Ries, J., (1997). International mergers and welfare under decentralized competition policy. The Canadian Journal of Economics, 30(4), 1104-1123.
Heron, R., Lie, E., (2002). Operating performance and the method of payment in takeovers. Journal of Financial and Quantitative Analysis, 37, 137−155.
Horn, H., Levinshon, J., (2001). Merger policies and trade liberalization. Economic Journal, 111(470), 244-276.
Horn, H., Persson, L., (2001). The equilibrium ownership of an international oligopoly. Journal of International Economics, 53, 307-333.
Jensen, M.C., (1986). Agency costs of free cash flow, corporate finance, and takeovers. The American Economic Review, 76(2), 323-329.
Kabiraj, T., Chaudhuri, M., (1999). On the welfare analysis of a cross-border merger. The Journal of International Trade and Economic Development, 8(2), 195-207.
Kang, J., (1993). The international market for corporate control: Mergers and acquisitions of US firms by Japanese firms. Journal of Financial Economics, 34, 345−371.
Langhe, T.E., Ooghe, H., (2001). Are Acquisitions Worthwhile? An Empirical Study of the Post-Acquisition Performance of Privately Held Belgian Companies Involved in Take-Overs. Paper 12, Ghent University, Belgium.
Lin, J.W., Madura, J., Picou, A., (1994). The wealth effects of international acquisitions and the impact of the EEC integration. Global Finance Journal, 5(1), 65−74.
Markusen, J.R., (2002). Multinational Firms and the Theory of International Trade. MIT Press, Cambridge, MA.
Neary, J.P., (2007). Cross-border mergers as instruments of comparative advantage. Review of Economic Studies, 74(4), 1229-1257.
NorbKack, P.J., Persson, L., (2004). Privatization and foreign competition. Journal of International Economics, 62(2), 409-416.
Pawaskar, V., (2001). Effects of Mergers on Corporate Performance in India. Vikalpa, 26, 1, 19-32.
Powell, R.G., Stark, A.W., (2005). Do Takeovers Create “Real” Gains? Some UK Evidence. University of New South Wales, Sydney, Australia.
Rahman Abdul, R., Limmack, R.J., (2004). Corporate Acquisition and the Operating Performance of Malaysian Companies. Journal of Business Finance and Accounting, 31, 3-4, 359-400.
Roll, R., (1986). The Hubris hypothesis of corporate takeovers. Journal of Business, 59(2), 197-216.
Saaty, T.L., (1979). The Analytic Hierarchy Process, McGraw-hill, New York
Schleifer, A., Vishney, R.W., (2003). Stock market driven acquisitions. Journal of Financial Economics, 70, 295−311.
Sharma, D.S., Ho, J., (2002), The Impact of Acquisitions on Operating Performance: Some Australian Evidence. Journal of Business Finance & Accounting, 29, 1, 155-200.
Sirower, M.L., (1997). The Synergy Trap: How Companies Lose the Acquisition Game. The Free Press: New York.
Yung K, Li J., (2004). Application of fuzzy integrative evaluation method to risk management of virtual enterprises. Industrial Engineering Journal, 7(3), 40-44.
International Journal of Engineering Business Management, Vol. 3, No. 2 (2011)44 www.intechweb.orgwww.intechopen.com