Embed Size (px)
Citation preview
© 2017 The MITRE Corporation. All rights reserved. For internal MITRE use
For internal MITRE use
Risk Model Review
National Academies of Science
September 26th, 2017
MITRE Corporation
A Risk-Based Approach for Small Unmanned
Aircraft System (sUAS) Airworthiness and
Safety Certification
Jeff Breunig – Project Lead
Approved for Public Release, Distribution Unlimited. Case Nos. 17-3604. © 2017 The MITRE Corporation. ALL RIGHTS RESERVED.
| 2 |
© 2017 The MITRE Corporation. All rights reserved. For Internal MITRE Use.
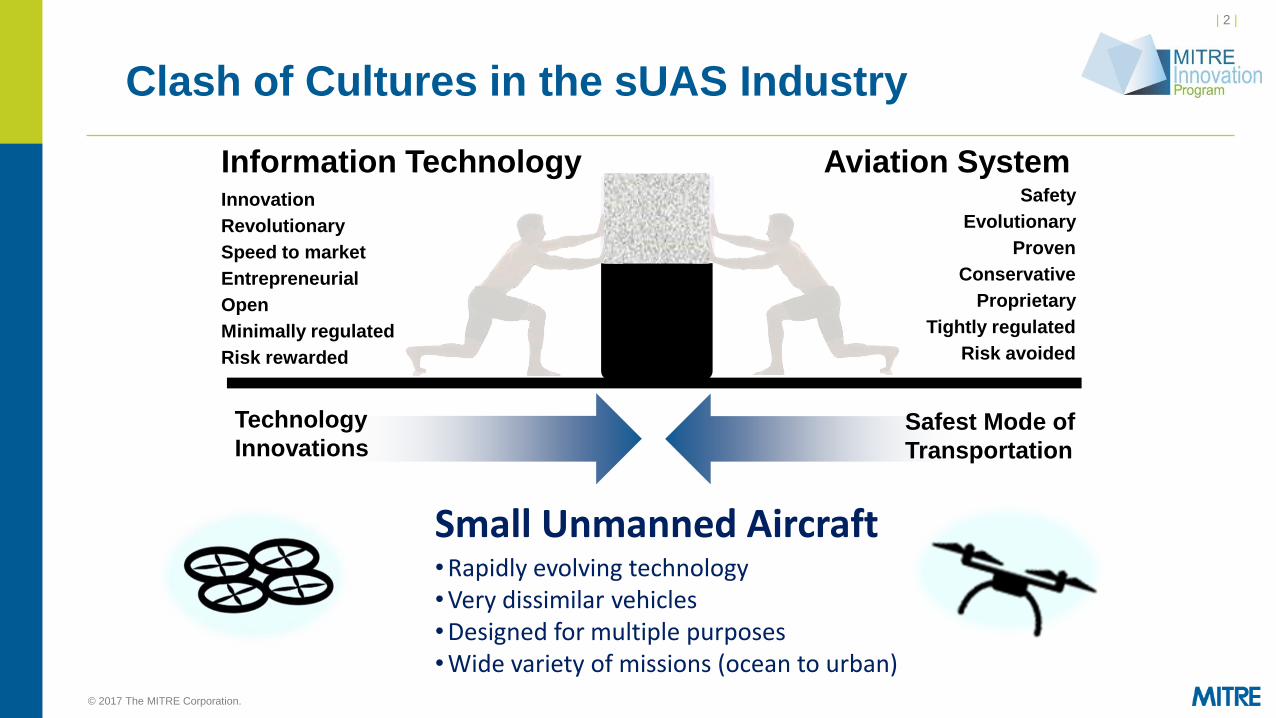
Clash of Cultures in the sUAS Industry
Information Technology Aviation System
Technology
Innovations Safest Mode of
Transportation
Small Unmanned Aircraft • Rapidly evolving technology • Very dissimilar vehicles • Designed for multiple purposes • Wide variety of missions (ocean to urban)
Innovation
Revolutionary
Speed to market
Entrepreneurial
Open
Minimally regulated
Risk rewarded
Safety
Evolutionary
Proven
Conservative
Proprietary
Tightly regulated
Risk avoided
| 3 |
The Problem To Be Solved
| 4 |
© 2017 The MITRE Corporation. All rights reserved. For Internal MITRE Use.
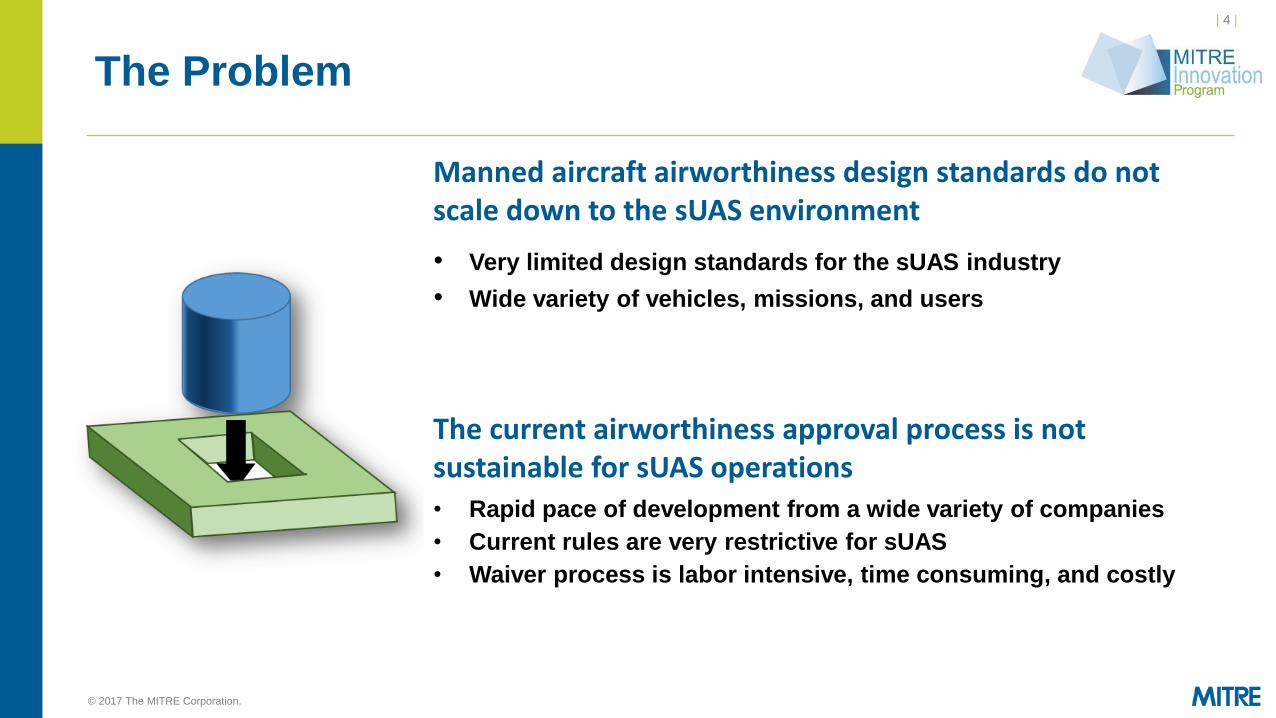
The Problem
The current airworthiness approval process is not sustainable for sUAS operations • Rapid pace of development from a wide variety of companies
• Current rules are very restrictive for sUAS
• Waiver process is labor intensive, time consuming, and costly
Manned aircraft airworthiness design standards do not scale down to the sUAS environment
• Very limited design standards for the sUAS industry
• Wide variety of vehicles, missions, and users
| 5 |
© 2017 The MITRE Corporation. All rights reserved. For Internal MITRE Use.
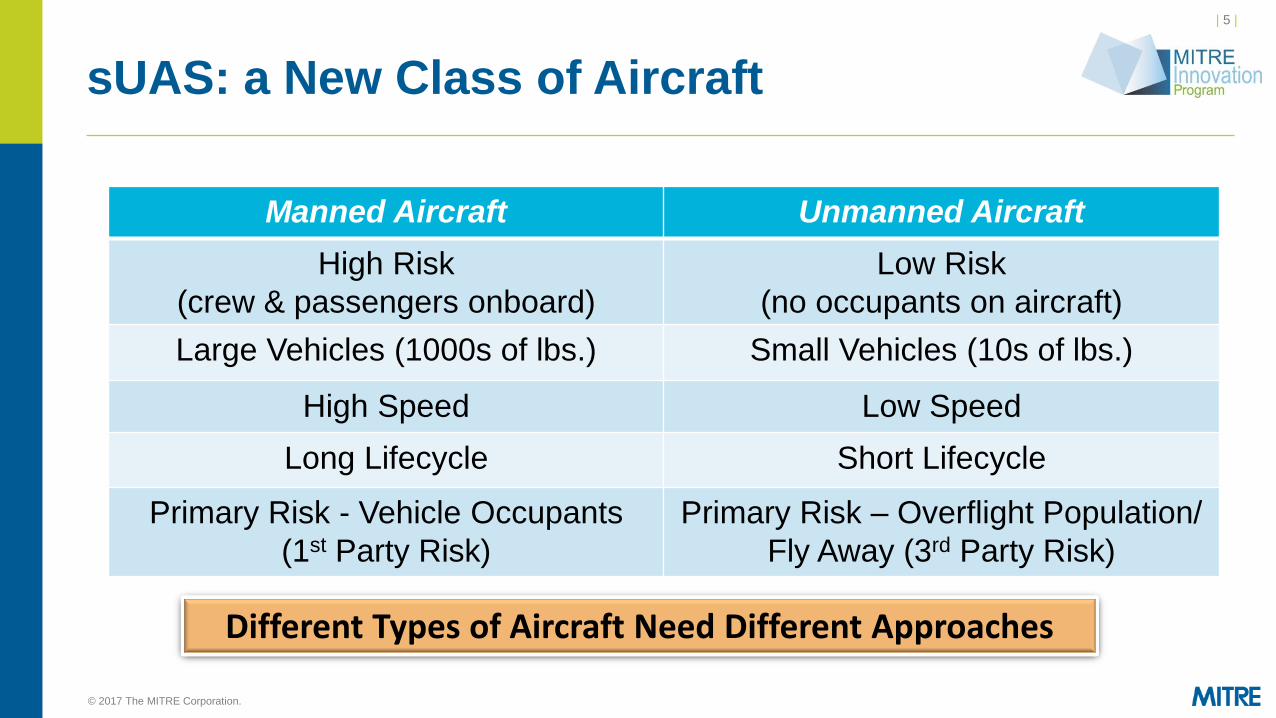
sUAS: a New Class of Aircraft
Different Types of Aircraft Need Different Approaches
Manned Aircraft Unmanned Aircraft
High Risk
(crew & passengers onboard)
Low Risk
(no occupants on aircraft)
Large Vehicles (1000s of lbs.) Small Vehicles (10s of lbs.)
High Speed Low Speed
Long Lifecycle Short Lifecycle
Primary Risk - Vehicle Occupants
(1st Party Risk)
Primary Risk – Overflight Population/
Fly Away (3rd Party Risk)
| 6 |
© 2017 The MITRE Corporation. All rights reserved. For Internal MITRE Use.
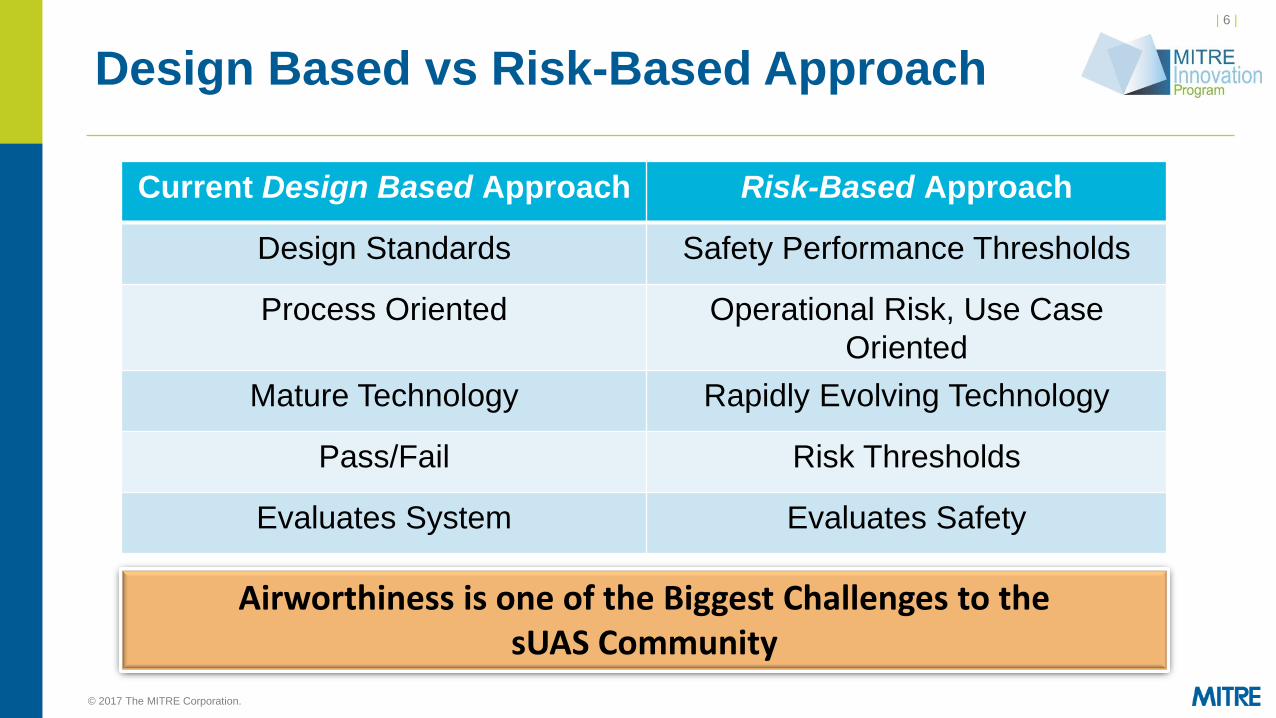
Design Based vs Risk-Based Approach
Current Design Based Approach Risk-Based Approach
Design Standards Safety Performance Thresholds
Process Oriented Operational Risk, Use Case
Oriented
Mature Technology Rapidly Evolving Technology
Pass/Fail Risk Thresholds
Evaluates System Evaluates Safety
Airworthiness is one of the Biggest Challenges to the sUAS Community
| 7 |
© 2017 The MITRE Corporation. All rights reserved. For Internal MITRE Use.
The Need
The sUAS stakeholder community needs a streamlined, repeatable
approach, designed for the unique risks of sUAS commercial operations
| 8 |
sUAS Risk-Based Airworthiness Safety
Model Concept
| 9 |
© 2017 The MITRE Corporation. All rights reserved. For Internal MITRE Use.
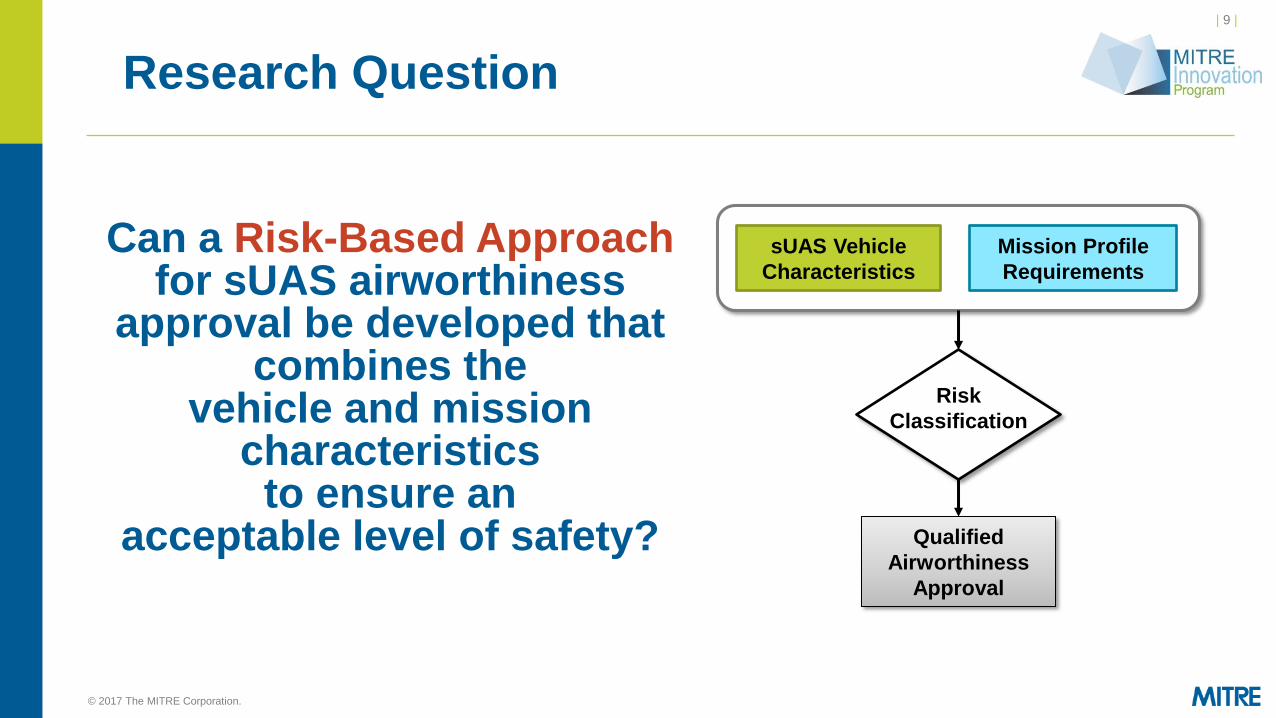
Can a Risk-Based Approach for sUAS airworthiness
approval be developed that combines the
vehicle and mission characteristics
to ensure an acceptable level of safety?
Research Question
sUAS Vehicle
Characteristics
Mission Profile
Requirements
Qualified
Airworthiness
Approval
Risk
Classification
| 10 |
© 2017 The MITRE Corporation. All rights reserved. For Internal MITRE Use.
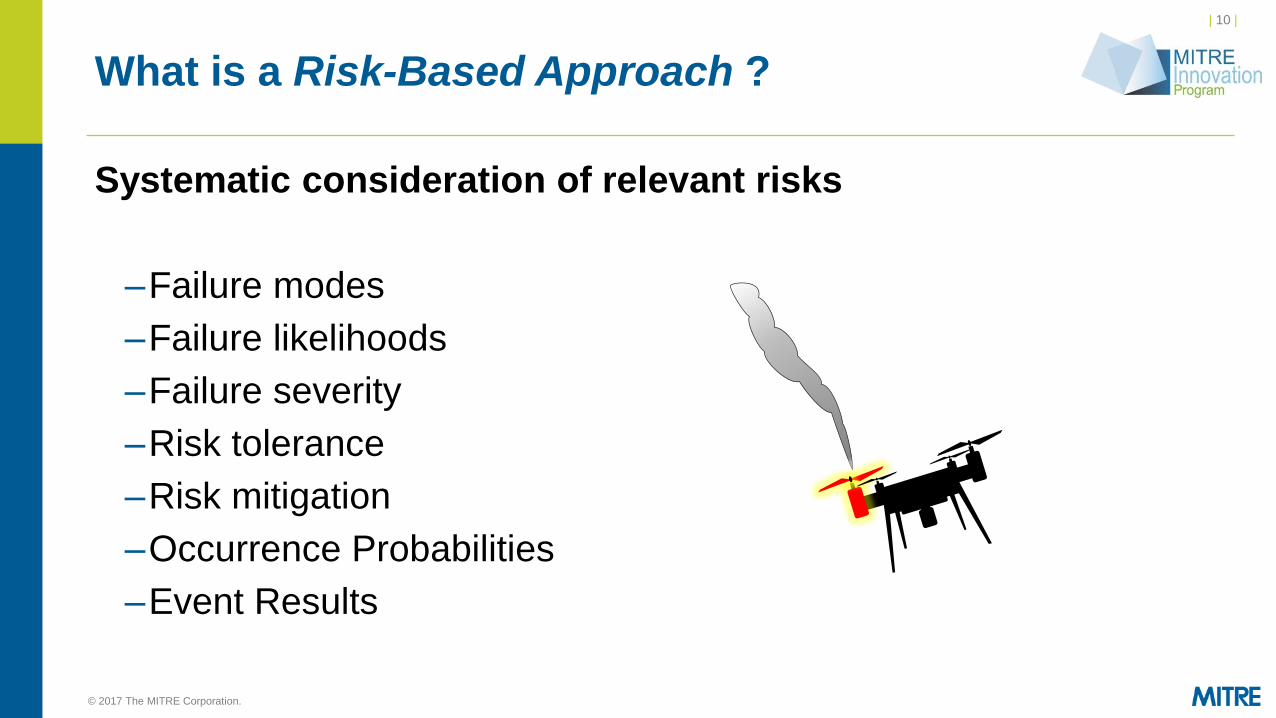
What is a Risk-Based Approach ?
Systematic consideration of relevant risks
–Failure modes
–Failure likelihoods
–Failure severity
–Risk tolerance
–Risk mitigation
–Occurrence Probabilities
–Event Results
| 11 |
© 2017 The MITRE Corporation. All rights reserved. For Internal MITRE Use.
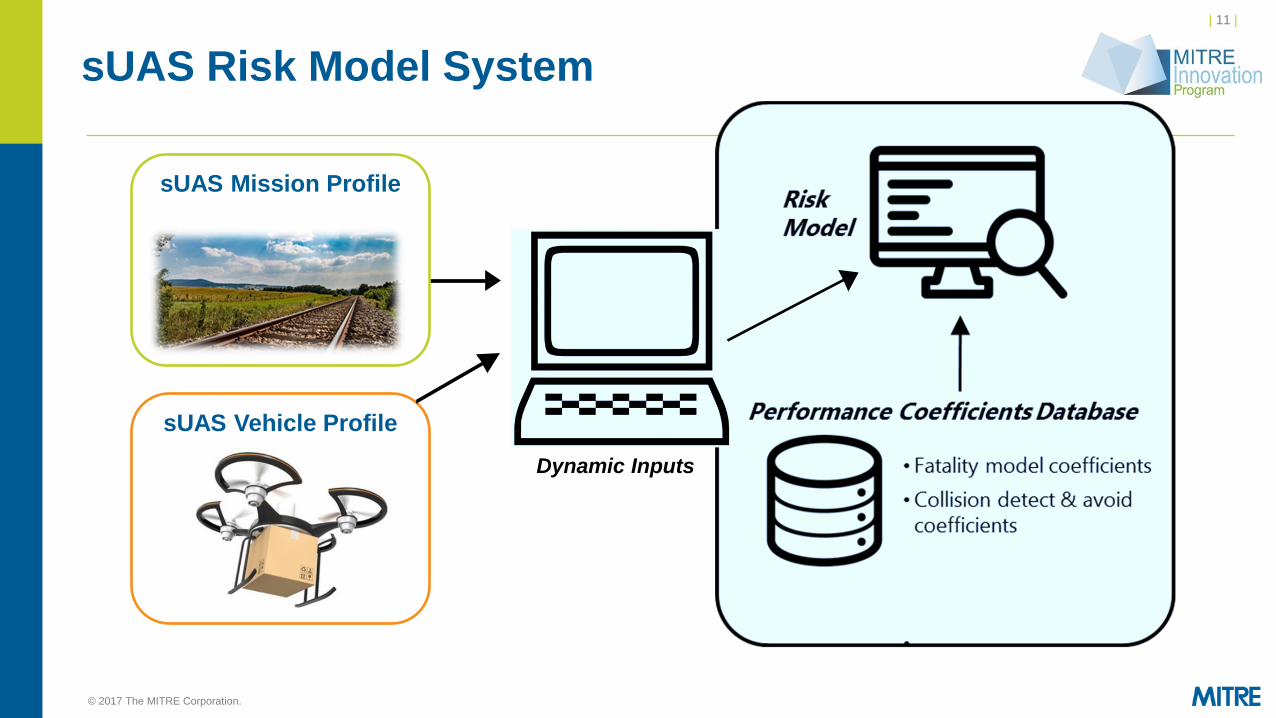
sUAS Vehicle Profile
sUAS Risk Model System
Dynamic Inputs
sUAS Mission Profile
| 12 |
Mission Profiles
| 13 |
© 2017 The MITRE Corporation. All rights reserved. For Internal MITRE Use.
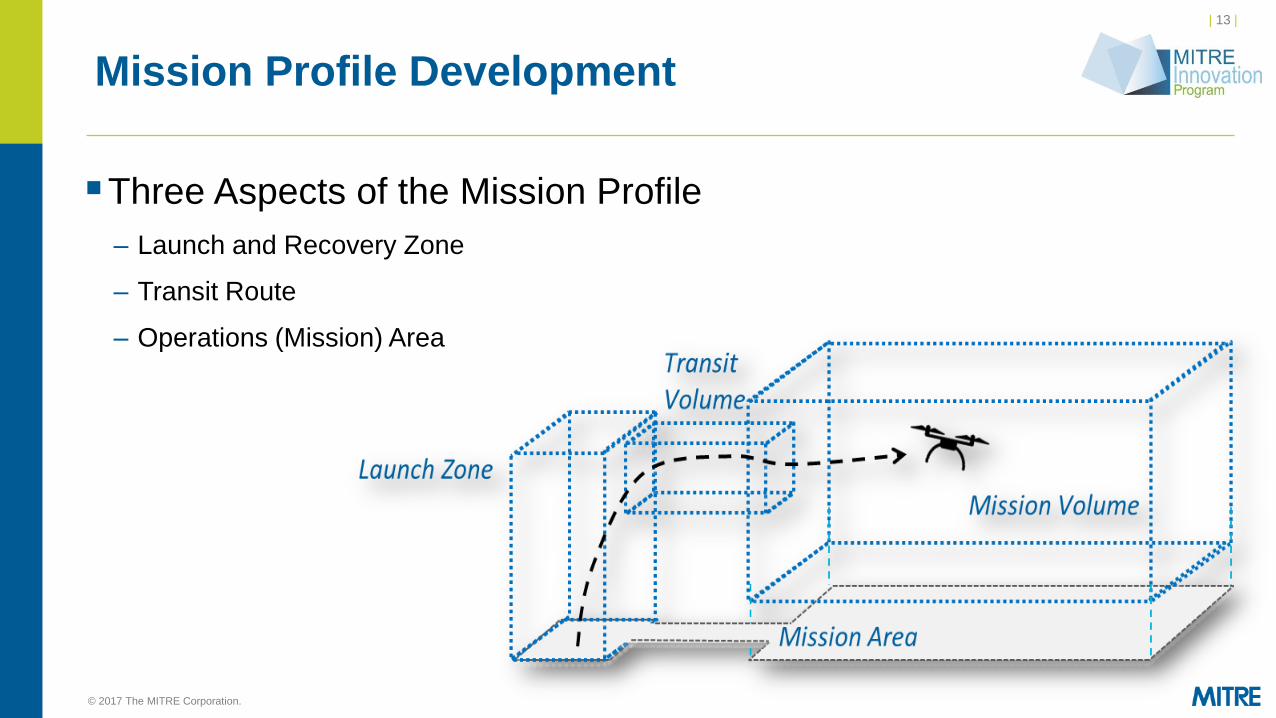
Mission Profile Development
Three Aspects of the Mission Profile
– Launch and Recovery Zone
– Transit Route
– Operations (Mission) Area
| 14 |
© 2017 The MITRE Corporation. All rights reserved. For Internal MITRE Use.
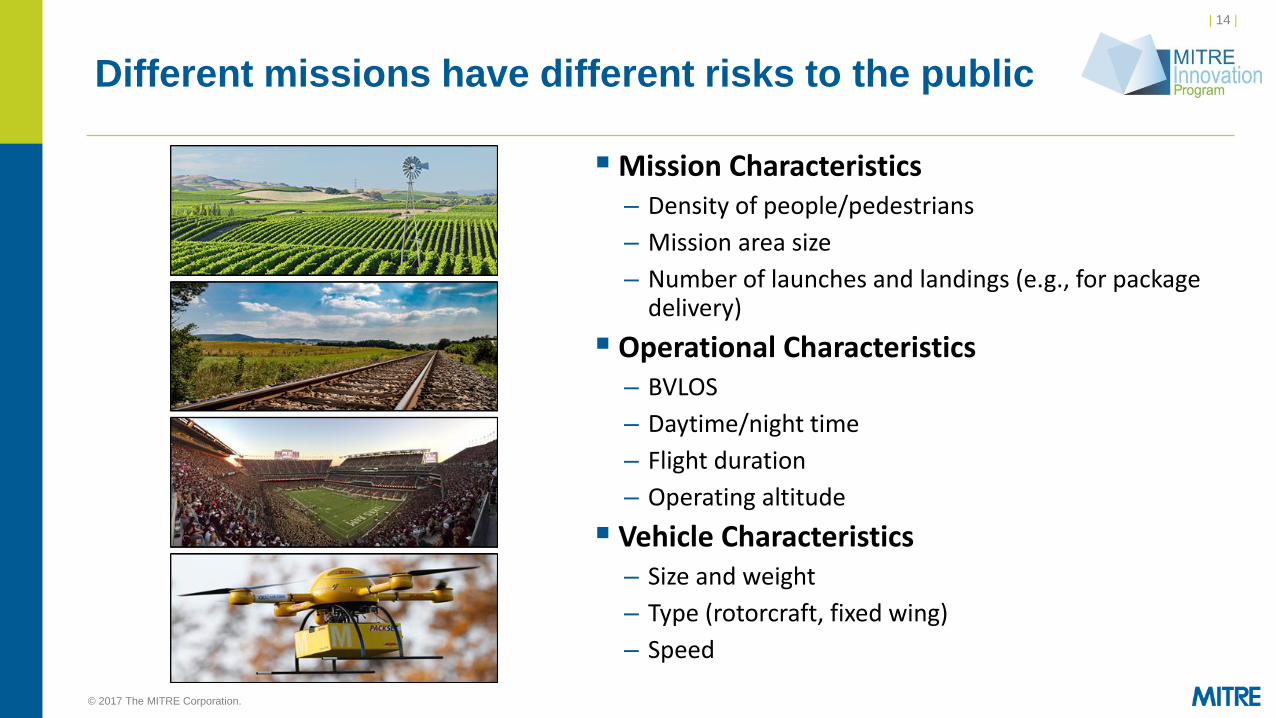
Different missions have different risks to the public
Mission Characteristics – Density of people/pedestrians
– Mission area size
– Number of launches and landings (e.g., for package delivery)
Operational Characteristics – BVLOS
– Daytime/night time
– Flight duration
– Operating altitude
Vehicle Characteristics – Size and weight
– Type (rotorcraft, fixed wing)
– Speed
| 15 |
© 2017 The MITRE Corporation. All rights reserved. For Internal MITRE Use.
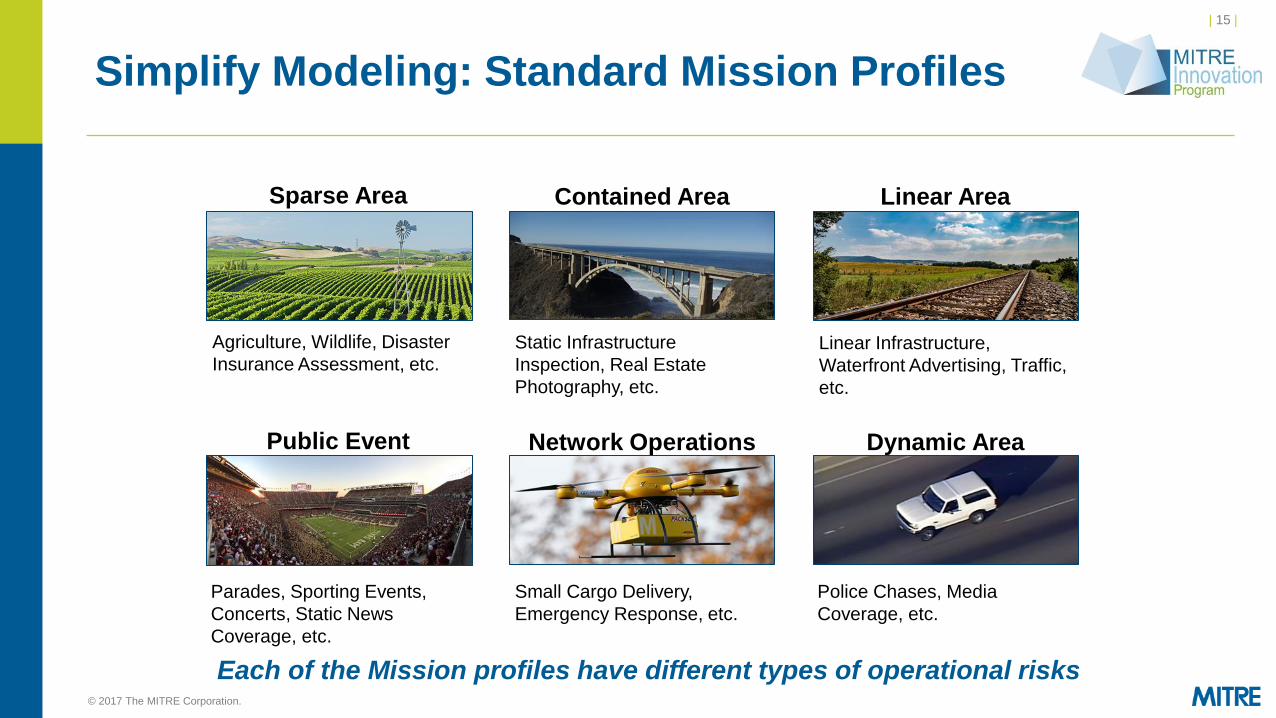
Simplify Modeling: Standard Mission Profiles
Sparse Area Contained Area Linear Area
Public Event Network Operations Dynamic Area
Police Chases, Media
Coverage, etc.
Static Infrastructure
Inspection, Real Estate
Photography, etc.
Small Cargo Delivery,
Emergency Response, etc.
Parades, Sporting Events,
Concerts, Static News
Coverage, etc.
Linear Infrastructure,
Waterfront Advertising, Traffic,
etc.
Agriculture, Wildlife, Disaster
Insurance Assessment, etc.
Each of the Mission profiles have different types of operational risks
| 16 |
© 2017 The MITRE Corporation. All rights reserved. For Internal MITRE Use.
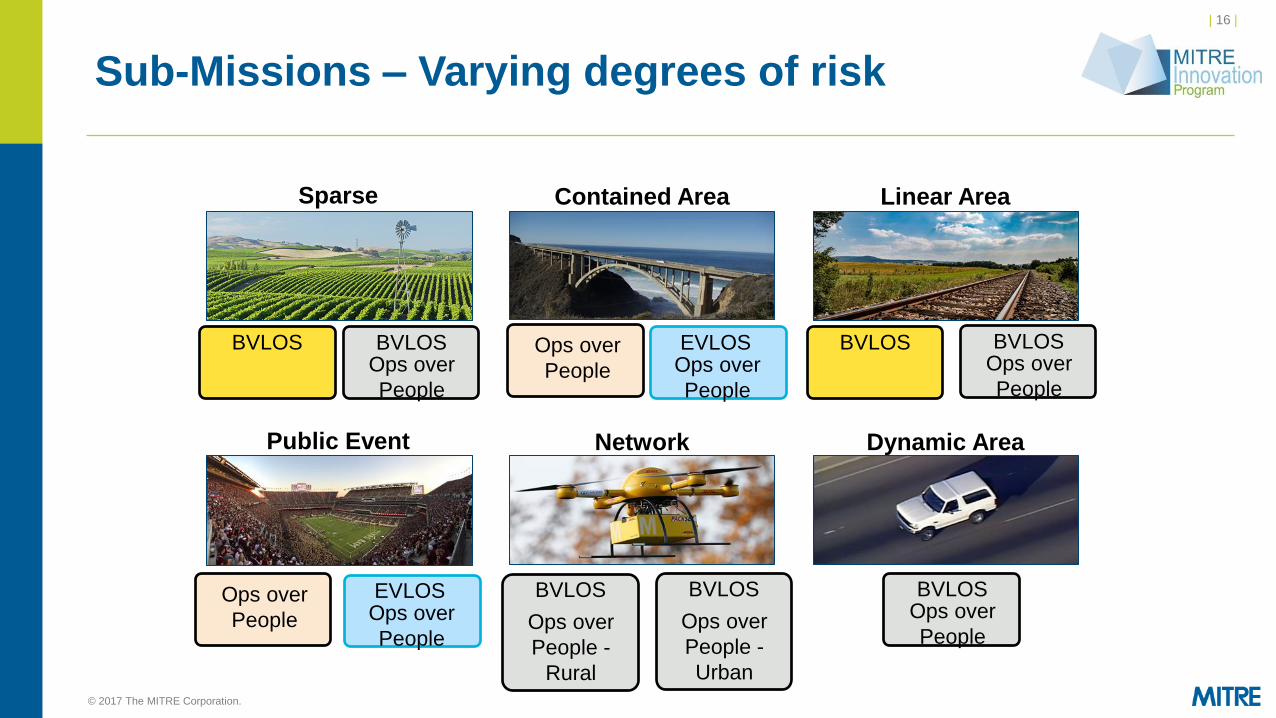
Sub-Missions – Varying degrees of risk
Sparse Contained Area Linear Area
Public Event Network Dynamic Area
BVLOS BVLOS Ops over
People
Ops over
People
EVLOS Ops over
People
BVLOS
BVLOS
Ops over
People -
Rural
BVLOS Ops over
People
BVLOS Ops over
People
EVLOS Ops over
People
Ops over
People
BVLOS
Ops over
People -
Urban
| 17 |
© 2017 The MITRE Corporation. All rights reserved. For Internal MITRE Use.
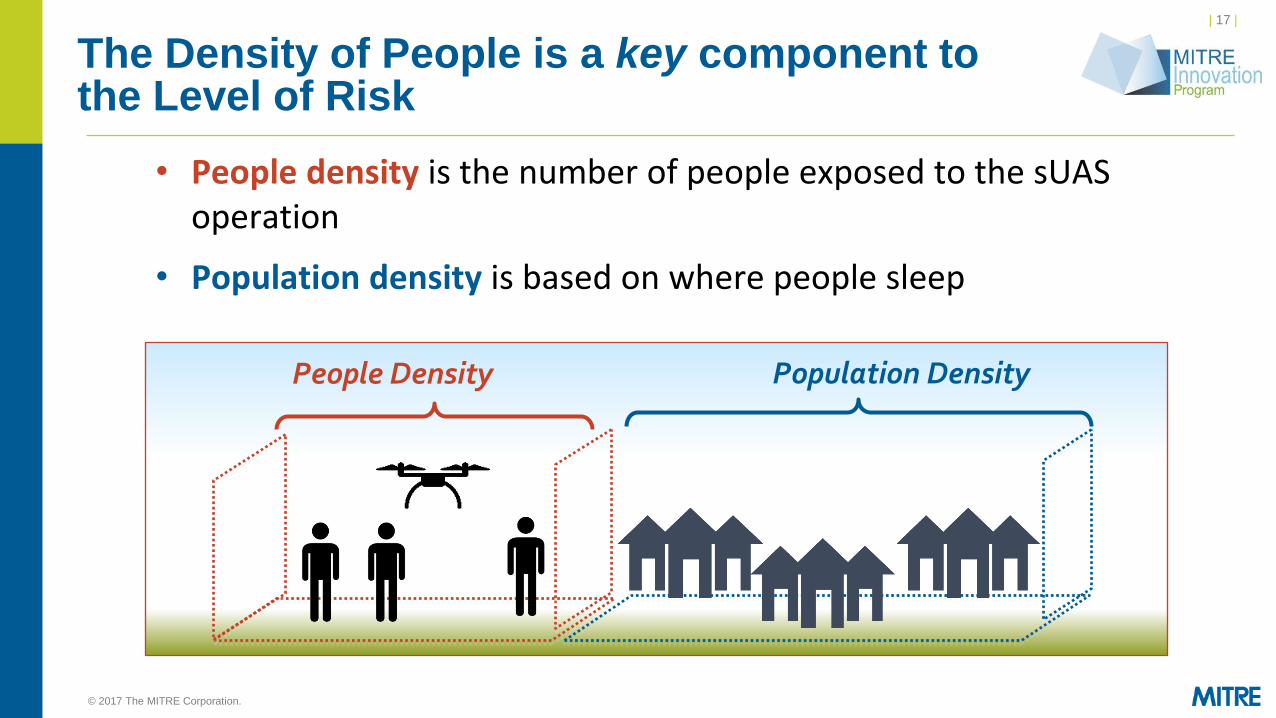
The Density of People is a key component to the Level of Risk
• People density is the number of people exposed to the sUAS
operation
• Population density is based on where people sleep
Population Density People Density
| 18 |
© 2017 The MITRE Corporation. All rights reserved. For Internal MITRE Use.
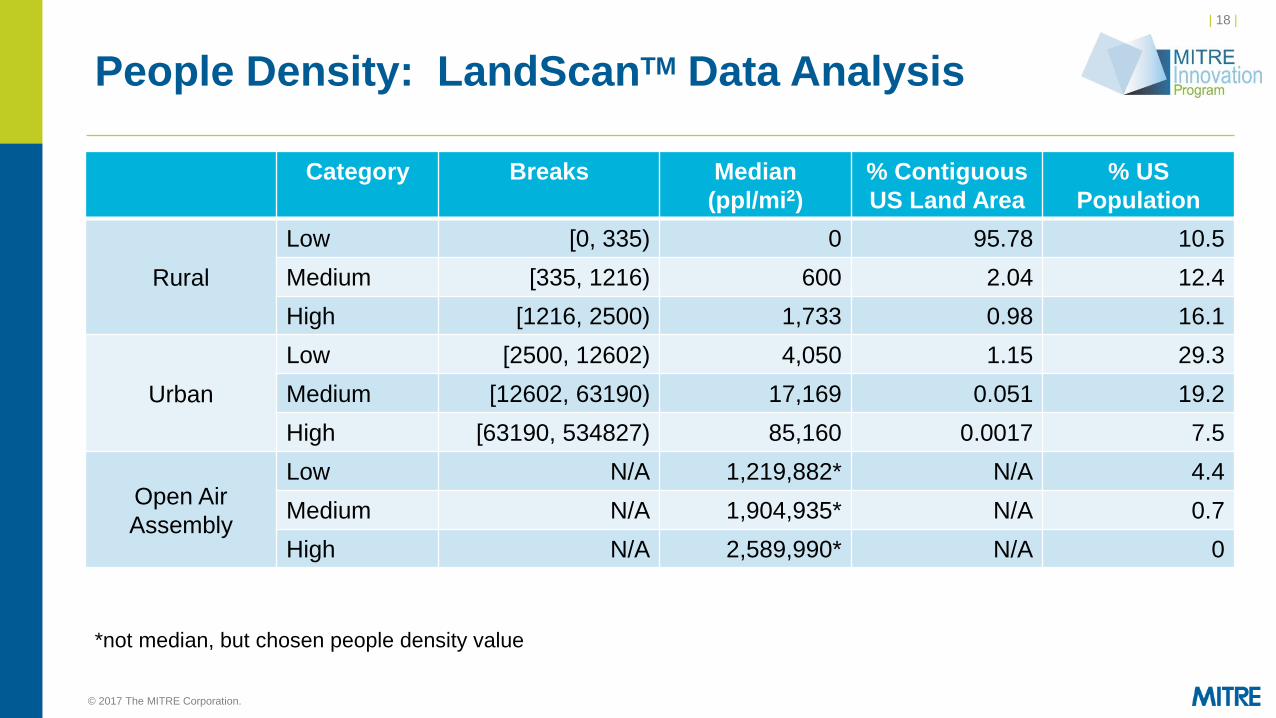
People Density: LandScanTM Data Analysis
Category Breaks Median
(ppl/mi2)
% Contiguous
US Land Area
% US
Population
Rural
Low [0, 335) 0 95.78 10.5
Medium [335, 1216) 600 2.04 12.4
High [1216, 2500) 1,733 0.98 16.1
Urban
Low [2500, 12602) 4,050 1.15 29.3
Medium [12602, 63190) 17,169 0.051 19.2
High [63190, 534827) 85,160 0.0017 7.5
Open Air
Assembly
Low N/A 1,219,882* N/A 4.4
Medium N/A 1,904,935* N/A 0.7
High N/A 2,589,990* N/A 0
*not median, but chosen people density value
| 19 |
© 2017 The MITRE Corporation. All rights reserved. For Internal MITRE Use.
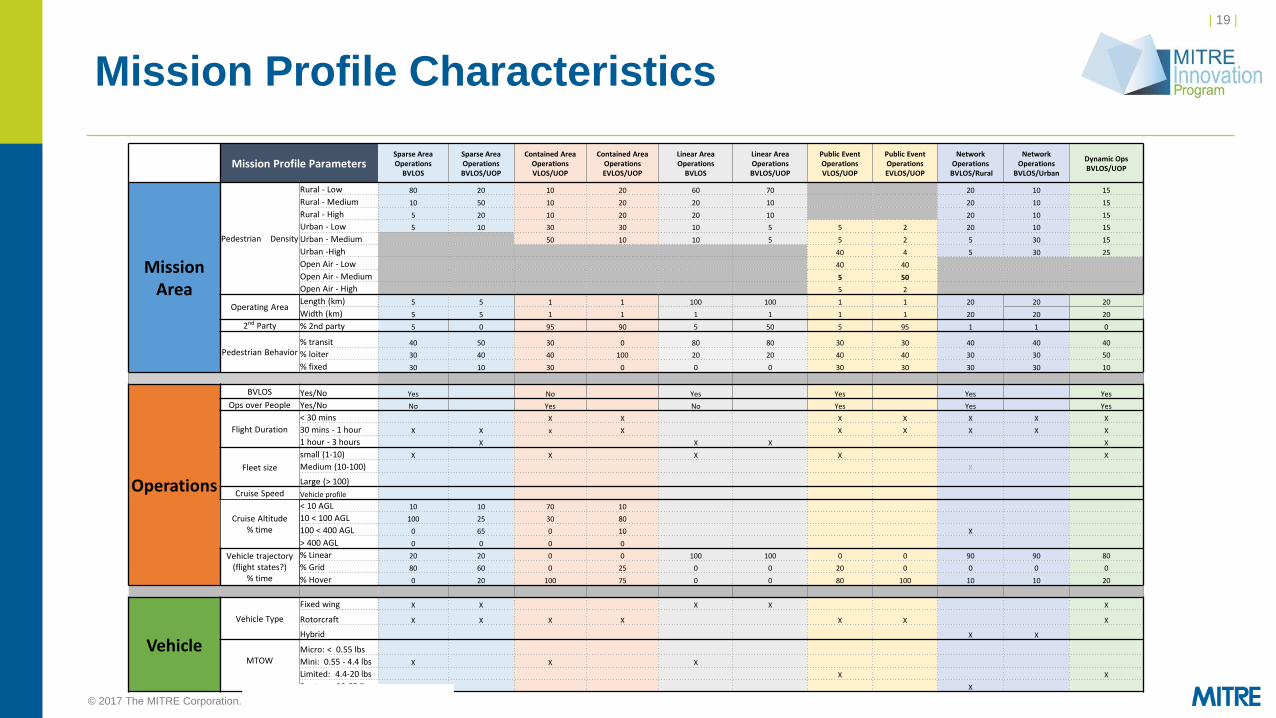
Mission Profile Characteristics
Mission Profile Parameters Sparse Area Operations
BVLOS
Sparse Area Operations BVLOS/UOP
Contained Area Operations VLOS/UOP
Contained Area Operations EVLOS/UOP
Linear Area Operations
BVLOS
Linear Area Operations BVLOS/UOP
Public Event Operations VLOS/UOP
Public Event Operations EVLOS/UOP
Network Operations
BVLOS/Rural
Network Operations
BVLOS/Urban
Dynamic Ops BVLOS/UOP
Mission Area
Pedestrian Density
Rural - Low 80 20 10 20 60 70 20 10 15
Rural - Medium 10 50 10 20 20 10 20 10 15
Rural - High 5 20 10 20 20 10 20 10 15
Urban - Low 5 10 30 30 10 5 5 2 20 10 15
Urban - Medium 50 10 10 5 5 2 5 30 15
Urban -High 40 4 5 30 25
Open Air - Low 40 40
Open Air - Medium 5 50
Open Air - High 5 2
Operating Area Length (km) 5 5 1 1 100 100 1 1 20 20 20
Width (km) 5 5 1 1 1 1 1 1 20 20 20
2nd Party % 2nd party 5 0 95 90 5 50 5 95 1 1 0
Pedestrian Behavior % transit 40 50 30 0 80 80 30 30 40 40 40
% loiter 30 40 40 100 20 20 40 40 30 30 50
% fixed 30 10 30 0 0 0 30 30 30 30 10
Operations
BVLOS Yes/No Yes No Yes Yes Yes Yes
Ops over People Yes/No No Yes No Yes Yes Yes
Flight Duration
< 30 mins X X X X X X X
30 mins - 1 hour X X x X X X X X X
1 hour - 3 hours X X X X
Fleet size
small (1-10) X X X X X
Medium (10-100) X
Large (> 100)
Cruise Speed Vehicle profile
Cruise Altitude % time
< 10 AGL 10 10 70 10
10 < 100 AGL 100 25 30 80
100 < 400 AGL 0 65 0 10 X
> 400 AGL 0 0 0 0
Vehicle trajectory (flight states?)
% time
% Linear 20 20 0 0 100 100 0 0 90 90 80
% Grid 80 60 0 25 0 0 20 0 0 0 0
% Hover 0 20 100 75 0 0 80 100 10 10 20
Vehicle
Vehicle Type
Fixed wing X X X X X
Rotorcraft X X X X X X X
Hybrid X X
MTOW
Micro: < 0.55 lbs
Mini: 0.55 - 4.4 lbs X X X
Limited: 4.4-20 lbs X X
Bantam: 20-55 lbs X
| 20 |
Vehicle Profiles
| 21 |
© 2017 The MITRE Corporation. All rights reserved. For Internal MITRE Use.
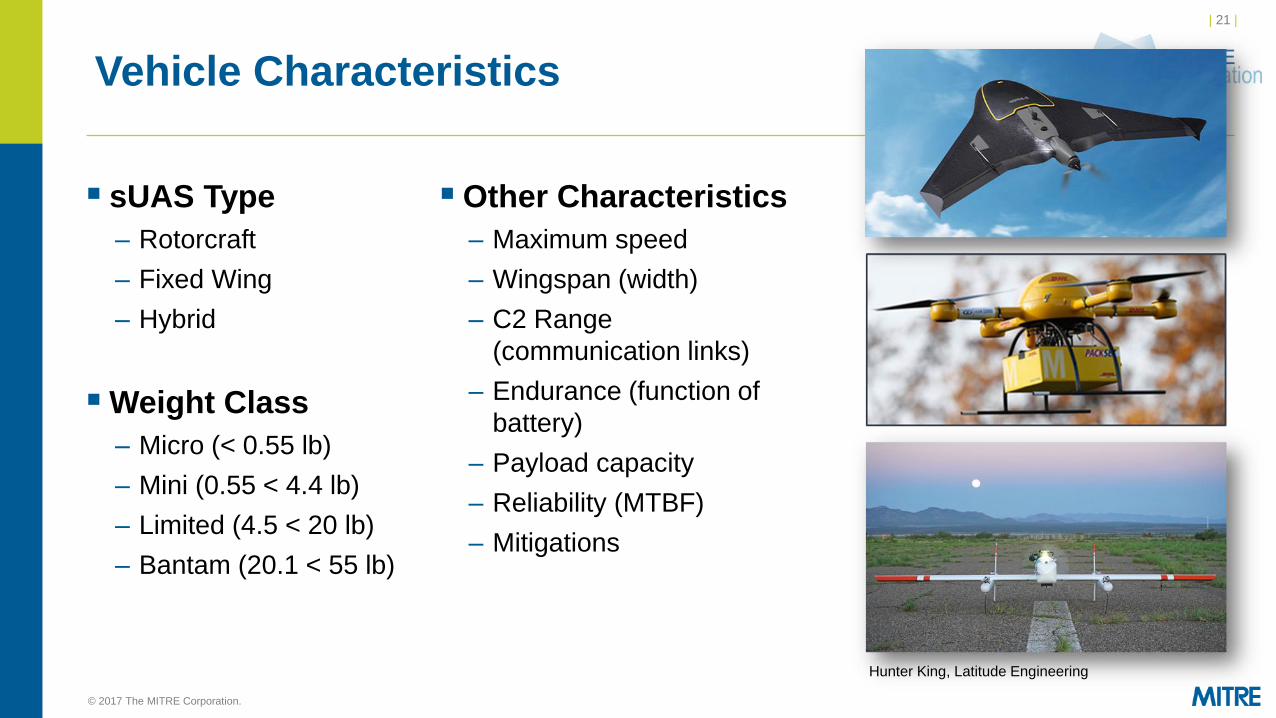
sUAS Type
– Rotorcraft
– Fixed Wing
– Hybrid
Weight Class
– Micro (< 0.55 lb)
– Mini (0.55 < 4.4 lb)
– Limited (4.5 < 20 lb)
– Bantam (20.1 < 55 lb)
Other Characteristics
– Maximum speed
– Wingspan (width)
– C2 Range
(communication links)
– Endurance (function of
battery)
– Payload capacity
– Reliability (MTBF)
– Mitigations
Vehicle Characteristics
Hunter King, Latitude Engineering
| 22 |
© 2017 The MITRE Corporation. All rights reserved. For Internal MITRE Use.
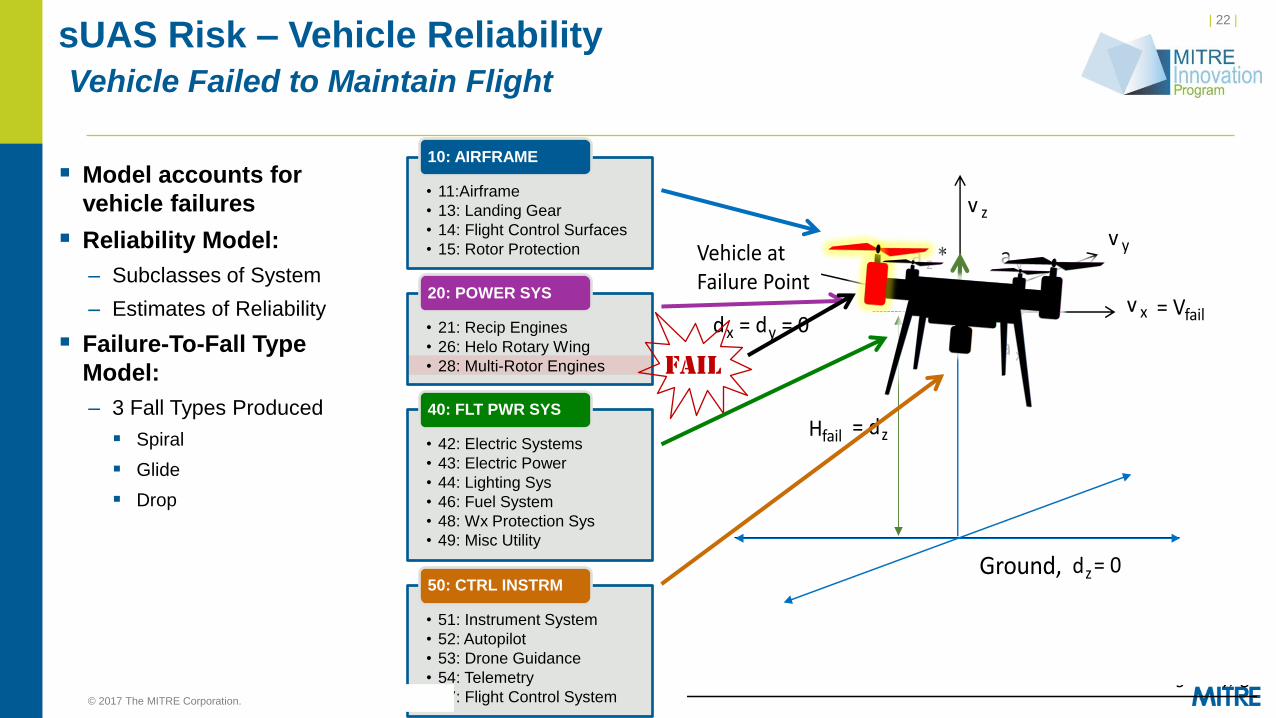
FAIL
= dz
Vehicle at Failure Point
Frame of Reference
v x
v y
v z
a ya *
a x
Ground,
dx = dy = 0
Hfail
= Vfail
dz= 0
z
* Note: a may include vertical acceleration in addition to acceleration due to gravity, g.
z
sUAS Risk – Vehicle Reliability
Vehicle Failed to Maintain Flight
Model accounts for
vehicle failures
Reliability Model:
– Subclasses of System
– Estimates of Reliability
Failure-To-Fall Type
Model:
– 3 Fall Types Produced
Spiral
Glide
Drop
• 11:Airframe
• 13: Landing Gear
• 14: Flight Control Surfaces
• 15: Rotor Protection
10: AIRFRAME
• 21: Recip Engines
• 26: Helo Rotary Wing
• 28: Multi-Rotor Engines
20: POWER SYS
• 42: Electric Systems
• 43: Electric Power
• 44: Lighting Sys
• 46: Fuel System
• 48: Wx Protection Sys
• 49: Misc Utility
40: FLT PWR SYS
• 51: Instrument System
• 52: Autopilot
• 53: Drone Guidance
• 54: Telemetry
• 57: Flight Control System
50: CTRL INSTRM
| 23 |
© 2017 The MITRE Corporation. All rights reserved. For Internal MITRE Use.
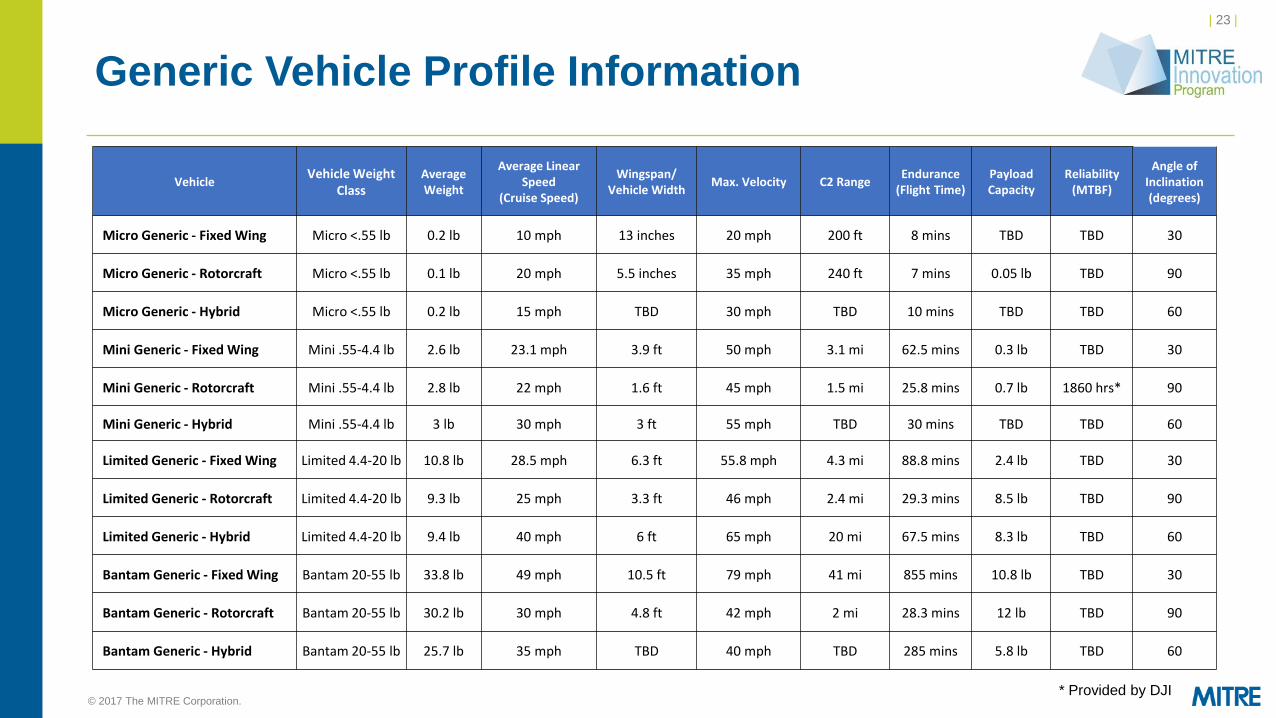
Generic Vehicle Profile Information
Vehicle Vehicle Weight
Class Average Weight
Average Linear Speed
(Cruise Speed)
Wingspan/ Vehicle Width
Max. Velocity C2 Range Endurance
(Flight Time) Payload Capacity
Reliability (MTBF)
Angle of Inclination (degrees)
Micro Generic - Fixed Wing Micro <.55 lb 0.2 lb 10 mph 13 inches 20 mph 200 ft 8 mins TBD TBD 30
Micro Generic - Rotorcraft Micro <.55 lb 0.1 lb 20 mph 5.5 inches 35 mph 240 ft 7 mins 0.05 lb TBD 90
Micro Generic - Hybrid Micro <.55 lb 0.2 lb 15 mph TBD 30 mph TBD 10 mins TBD TBD 60
Mini Generic - Fixed Wing Mini .55-4.4 lb 2.6 lb 23.1 mph 3.9 ft 50 mph 3.1 mi 62.5 mins 0.3 lb TBD 30
Mini Generic - Rotorcraft Mini .55-4.4 lb 2.8 lb 22 mph 1.6 ft 45 mph 1.5 mi 25.8 mins 0.7 lb 1860 hrs* 90
Mini Generic - Hybrid Mini .55-4.4 lb 3 lb 30 mph 3 ft 55 mph TBD 30 mins TBD TBD 60
Limited Generic - Fixed Wing Limited 4.4-20 lb 10.8 lb 28.5 mph 6.3 ft 55.8 mph 4.3 mi 88.8 mins 2.4 lb TBD 30
Limited Generic - Rotorcraft Limited 4.4-20 lb 9.3 lb 25 mph 3.3 ft 46 mph 2.4 mi 29.3 mins 8.5 lb TBD 90
Limited Generic - Hybrid Limited 4.4-20 lb 9.4 lb 40 mph 6 ft 65 mph 20 mi 67.5 mins 8.3 lb TBD 60
Bantam Generic - Fixed Wing Bantam 20-55 lb 33.8 lb 49 mph 10.5 ft 79 mph 41 mi 855 mins 10.8 lb TBD 30
Bantam Generic - Rotorcraft Bantam 20-55 lb 30.2 lb 30 mph 4.8 ft 42 mph 2 mi 28.3 mins 12 lb TBD 90
Bantam Generic - Hybrid Bantam 20-55 lb 25.7 lb 35 mph TBD 40 mph TBD 285 mins 5.8 lb TBD 60
* Provided by DJI
| 24 |
Risk Based Approach – Development of a
Probabilistic Model
| 25 |
© 2017 The MITRE Corporation. All rights reserved. For Internal MITRE Use.
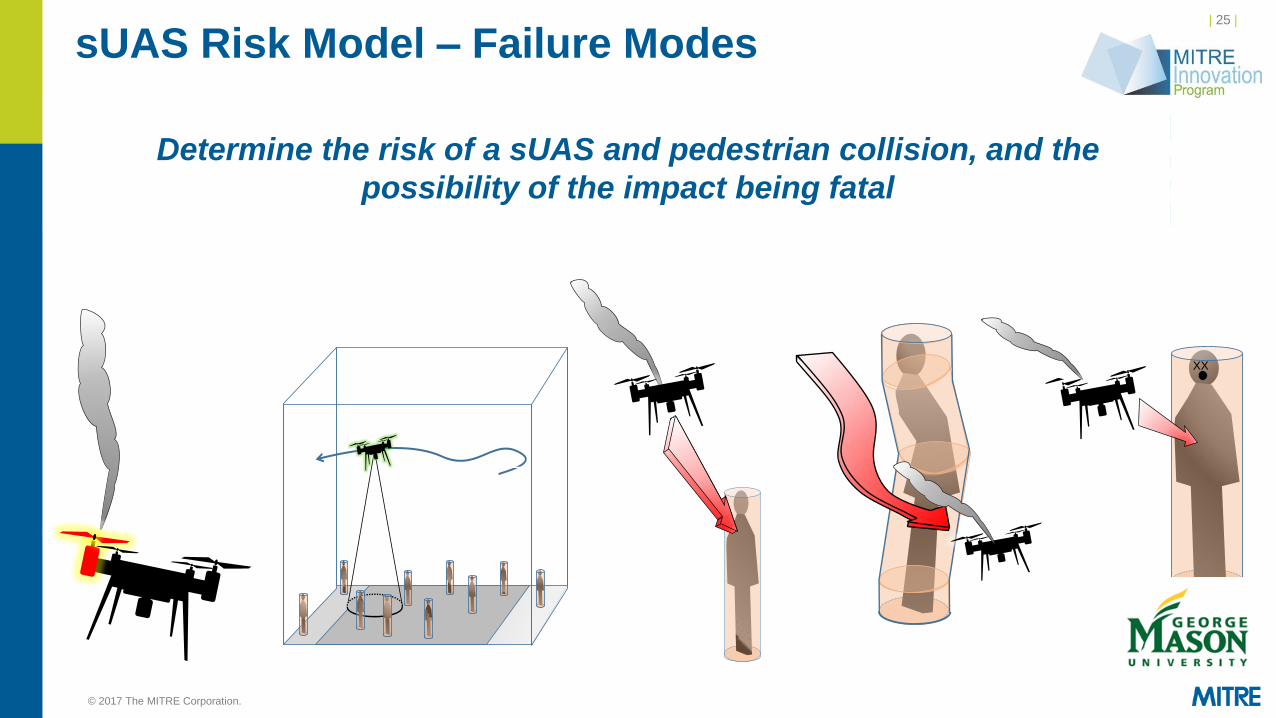
Vehicle Failed to Maintain Flight
Control AND
Individuals Exposed to
Vehicle Flight Ops
AND
Vehicle on Collision Course
AND Collision Not
Avoided AND
Collision Resulted in
Fatality
Vehicle failed
during flight. Flight operated over pedestrians. Vehicle’s fall path was on
target with a pedestrian. Collision was unavoidable by
pedestrian, operator or vehicle.
sUAS Risk Model – Failure Modes
Determine the risk of a sUAS and pedestrian collision, and the
possibility of the impact being fatal
XX
| 26 |
© 2017 The MITRE Corporation. All rights reserved. For Internal MITRE Use.
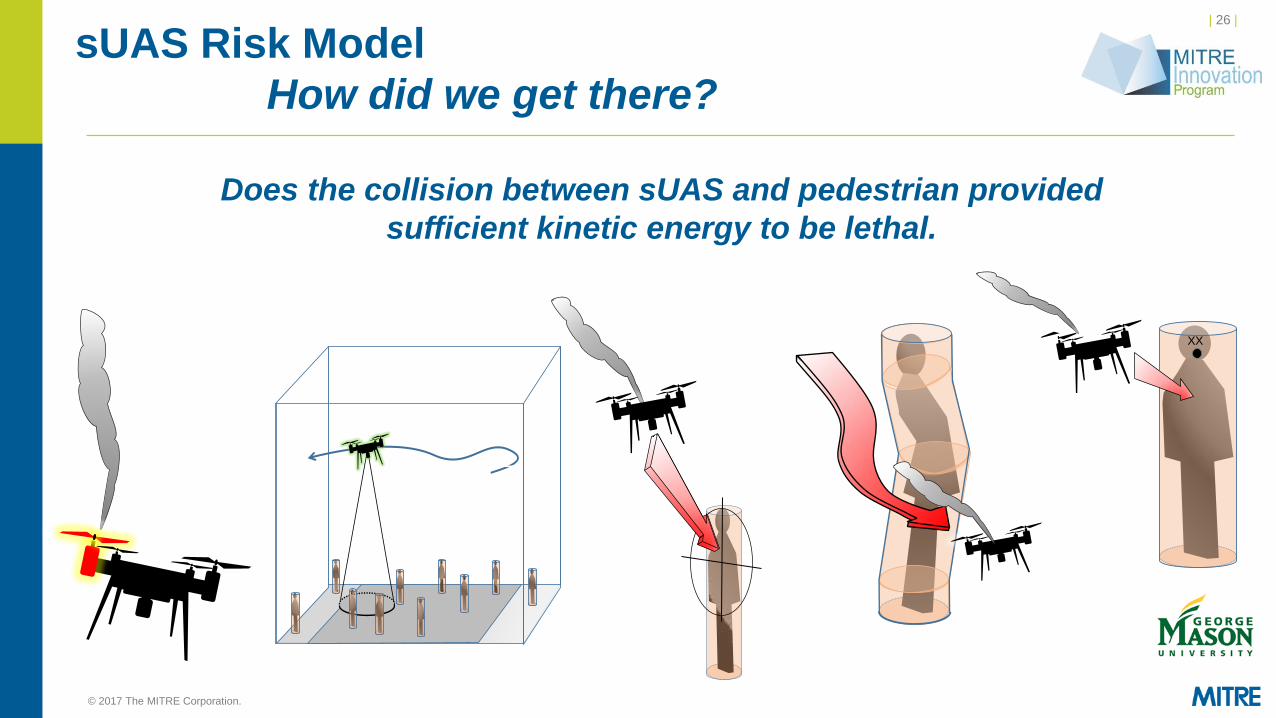
Pedestrian Failed to Maintain Flight
Control AND
Vehicle Exposed to Vehicle Flight
Ops AND
Vehicle on Collision
Course with Pedestrian
AND Collision Not
Avoided AND
Collision Resulted in
Fatality
Vehicle failed
during flight. Flight operated over pedestrians.
Vehicle’s fall path was on
target with a pedestrian. Collision was unavoidable by
pedestrian, operator or vehicle.
sUAS Risk Model
How did we get there?
Does the collision between sUAS and pedestrian provided
sufficient kinetic energy to be lethal.
XX
| 27 |
© 2017 The MITRE Corporation. All rights reserved. For Internal MITRE Use.
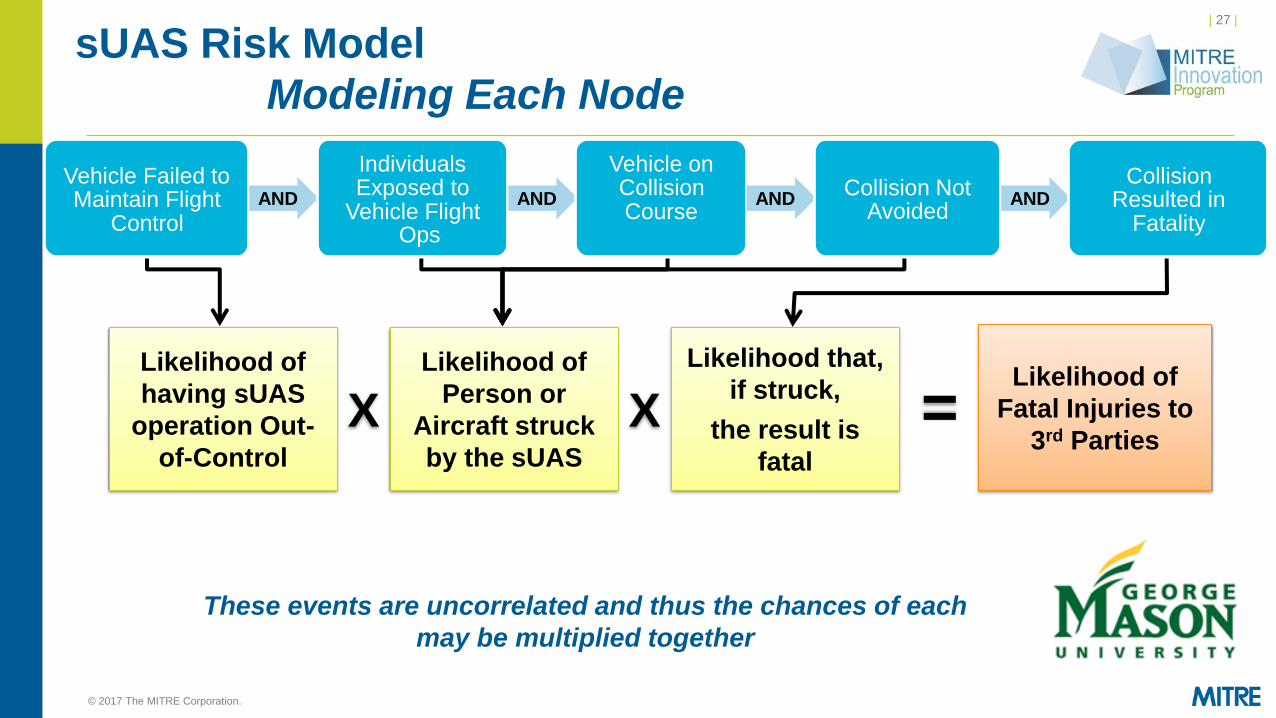
sUAS Risk Model
Modeling Each Node
Likelihood of
Fatal Injuries to
3rd Parties
Likelihood of
having sUAS
operation Out-
of-Control
Likelihood of
Person or
Aircraft struck
by the sUAS
Likelihood that,
if struck,
the result is
fatal
= X X
Vehicle Failed to Maintain Flight
Control AND
Individuals Exposed to
Vehicle Flight Ops
AND
Vehicle on Collision Course
AND Collision Not
Avoided AND
Collision Resulted in
Fatality
These events are uncorrelated and thus the chances of each
may be multiplied together
| 28 |
Quantifying the Risk Model
| 29 |
© 2017 The MITRE Corporation. All rights reserved. For Internal MITRE Use.
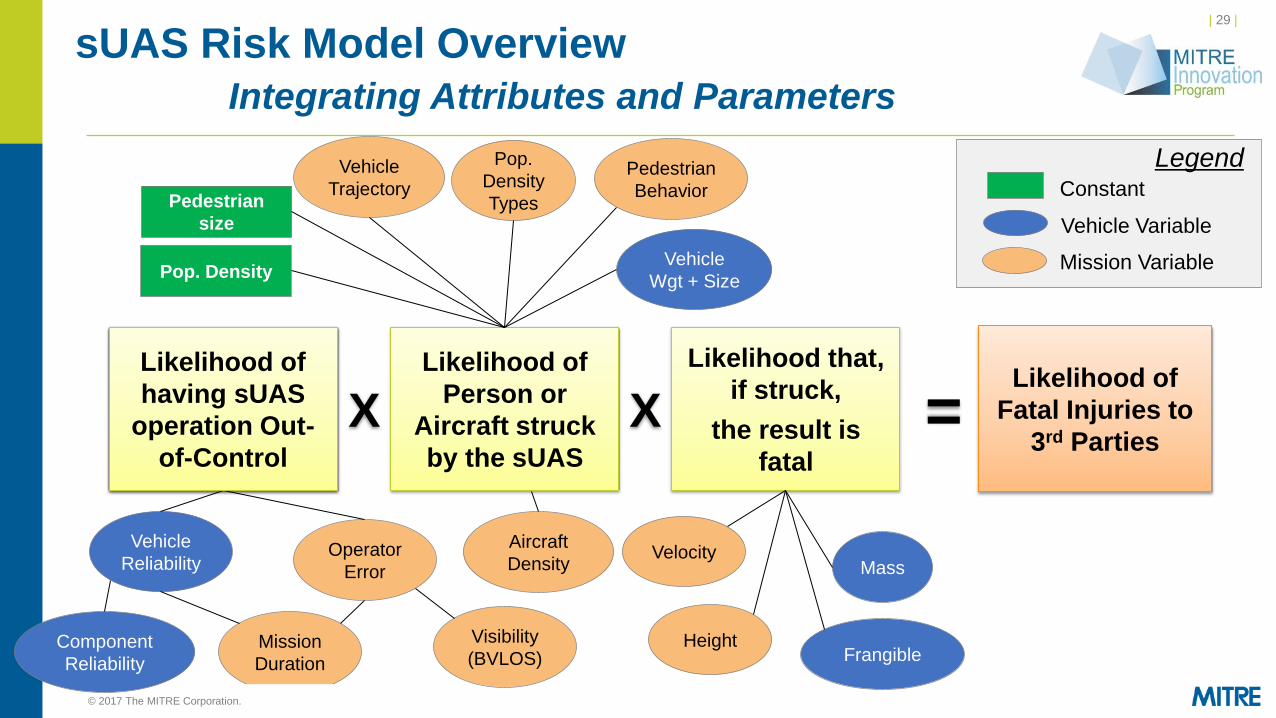
sUAS Risk Model Overview
Integrating Attributes and Parameters
Likelihood of
having sUAS
operation Out-
of-Control
Likelihood of
Person or
Aircraft struck
by the sUAS
Likelihood that,
if struck,
the result is
fatal
= X X
Legend
Vehicle Variable
Mission Variable
Constant
Vehicle
Reliability Operator
Error
Component
Reliability
Mission
Duration
Visibility
(BVLOS)
Pedestrian
size
Vehicle
Trajectory
Pop.
Density
Types
Pedestrian
Behavior
Vehicle
Wgt + Size
Velocity Mass
Frangible Height
Likelihood of
having sUAS
operation Out-
of-Control
Likelihood of
Fatal Injuries to
3rd Parties
Pop. Density
Aircraft
Density
| 30 |
© 2017 The MITRE Corporation. All rights reserved. For Internal MITRE Use.
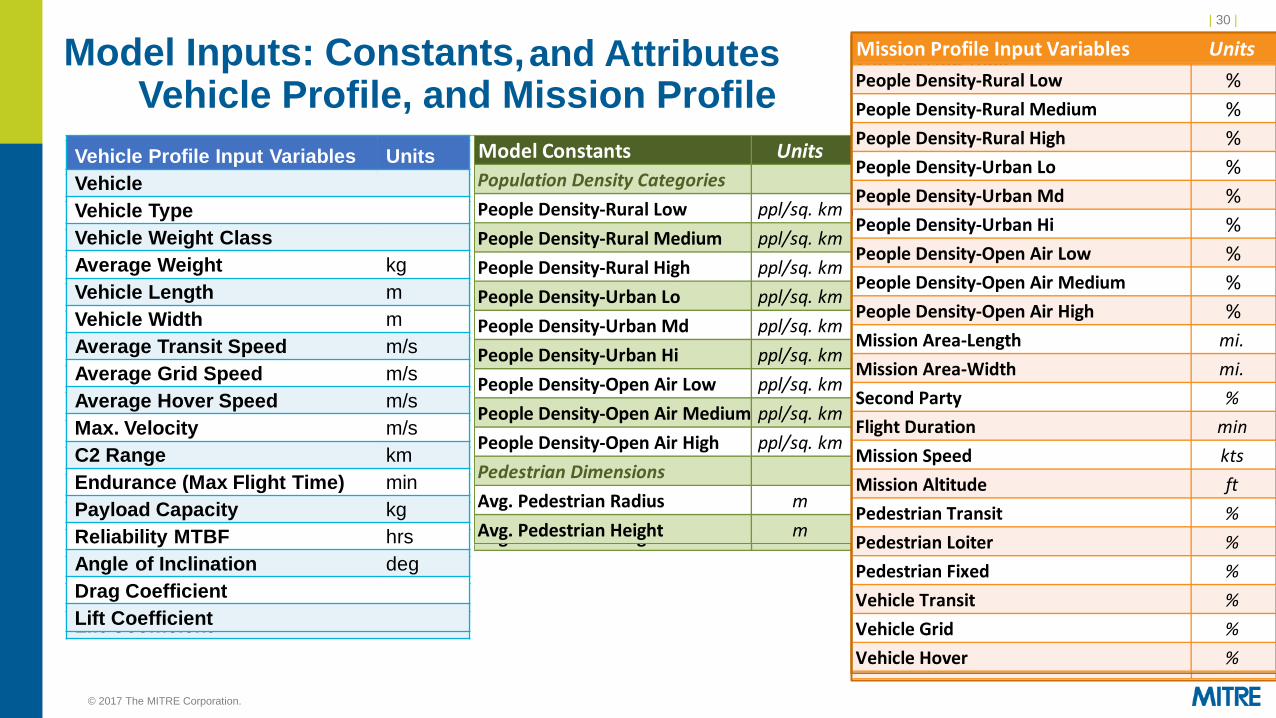
Model Inputs: Constants, Vehicle Profile, and Mission Profile
Vehicle Profile Input Variables Units
Vehicle
Vehicle Type
Vehicle Weight Class
Average Weight kg
Vehicle Length m
Vehicle Width m
Average Transit Speed m/s
Average Grid Speed m/s
Average Hover Speed m/s
Max. Velocity m/s
C2 Range km
Endurance (Max Flight Time) min
Payload Capacity kg
Reliability MTBF hrs
Angle of Inclination deg
Drag Coefficient
Lift Coefficient
Model Constants Units
Population Density Categories
People Density-Rural Low ppl/sq. km
People Density-Rural Medium ppl/sq. km
People Density-Rural High ppl/sq. km
People Density-Urban Lo ppl/sq. km
People Density-Urban Md ppl/sq. km
People Density-Urban Hi ppl/sq. km
People Density-Open Air Low ppl/sq. km
People Density-Open Air Medium ppl/sq. km
People Density-Open Air High ppl/sq. km
Pedestrian Dimensions
Avg. Pedestrian Radius m
Avg. Pedestrian Height m
Mission Profile Input Variables UnitsMission TypeSub-Mission TypePeople Density-Rural Low %
People Density-Rural Medium %
People Density-Rural High %
People Density-Urban Lo %
People Density-Urban Md %
People Density-Urban Hi %
People Density-Open Air Low %
People Density-Open Air Medium %
People Density-Open Air High %
Mission Area-Length mi.
Mission Area-Width mi.
Second Party %
Flight Duration min
Mission Speed kts
Mission Altitude ft
Pedestrian Transit %
Pedestrian Loiter %
Pedestrian Fixed %
Vehicle Transit %
Vehicle Grid %
Vehicle Hover %
People Density – Rural Low
People Density – Rural Low
Vehicle Profile Input Variables Units
Vehicle
Vehicle Type
Vehicle Weight Class
Average Weight kg
Vehicle Length m
Vehicle Width m
Average Transit Speed m/s
Average Grid Speed m/s
Average Hover Speed m/s
Max. Velocity m/s
C2 Range km
Endurance (Max Flight Time) min
Payload Capacity kg
Reliability MTBF hrs
Angle of Inclination deg
Drag Coefficient
Lift Coefficient
Model Constants Units
Population Density Categories
People Density-Rural Low ppl/sq. km
People Density-Rural Medium ppl/sq. km
People Density-Rural High ppl/sq. km
People Density-Urban Lo ppl/sq. km
People Density-Urban Md ppl/sq. km
People Density-Urban Hi ppl/sq. km
People Density-Open Air Low ppl/sq. km
People Density-Open Air Medium ppl/sq. km
People Density-Open Air High ppl/sq. km
Pedestrian Dimensions
Avg. Pedestrian Radius m
Avg. Pedestrian Height m
Mission Profile Input Variables UnitsMission TypeSub-Mission TypePeople Density-Rural Low %
People Density-Rural Medium %
People Density-Rural High %
People Density-Urban Lo %
People Density-Urban Md %
People Density-Urban Hi %
People Density-Open Air Low %
People Density-Open Air Medium %
People Density-Open Air High %
Mission Area-Length mi.
Mission Area-Width mi.
Second Party %
Flight Duration min
Mission Speed kts
Mission Altitude ft
Pedestrian Transit %
Pedestrian Loiter %
Pedestrian Fixed %
Vehicle Transit %
Vehicle Grid %
Vehicle Hover %
and Attributes
| 31 |
sUAS Risk Model Output & Application
| 32 |
© 2017 The MITRE Corporation. All rights reserved. For Internal MITRE Use.
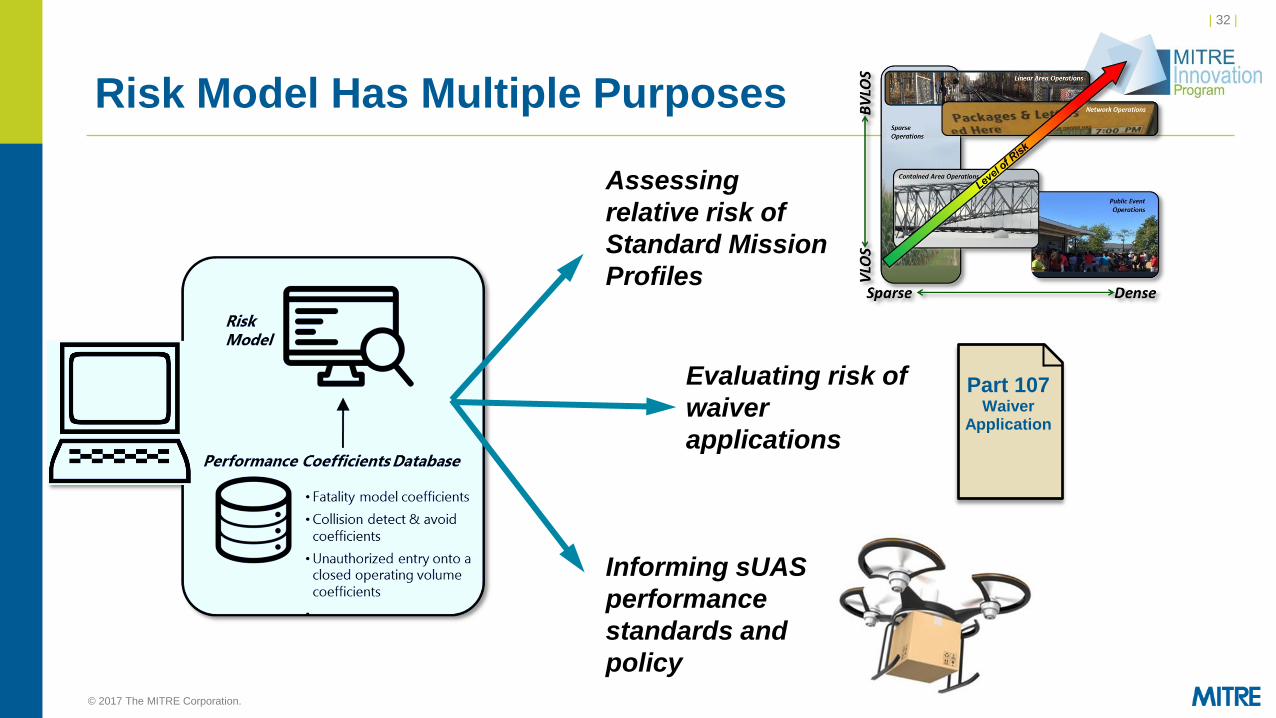
Risk Model Has Multiple Purposes
Assessing
relative risk of
Standard Mission
Profiles
Evaluating risk of
waiver
applications
Informing sUAS
performance
standards and
policy
Part 107 Waiver
Application
| 33 |
© 2017 The MITRE Corporation. All rights reserved. For Internal MITRE Use.
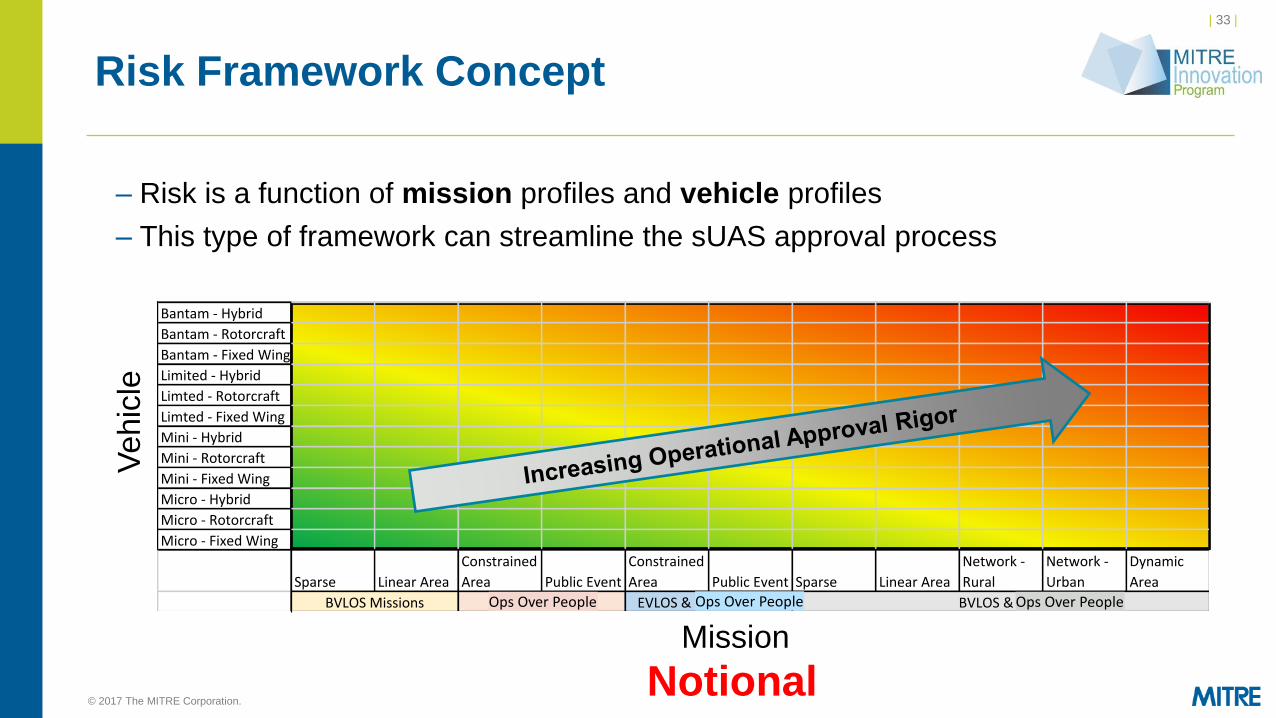
Risk Framework Concept
– Risk is a function of mission profiles and vehicle profiles
– This type of framework can streamline the sUAS approval process
Bantam-Hybrid
Bantam-Rotorcraft
Bantam-FixedWing
Limited-Hybrid
Limted-Rotorcraft
Limted-FixedWing
Mini-Hybrid
Mini-Rotorcraft
Mini-FixedWing
Micro-Hybrid
Micro-Rotorcraft
Micro-FixedWing
Sparse LinearArea
Constrained
Area PublicEvent
Constrained
Area PublicEvent Sparse LinearArea
Network-
Rural
Network-
Urban
Dynamic
Area
BVLOSMissions UOPMissions EVLOS&UOPMissions BVLOS&UOP
Vehic
le
Mission
Notional
Ops Over People Ops Over People Ops Over People
| 34 |
© 2017 The MITRE Corporation. All rights reserved. For Internal MITRE Use.
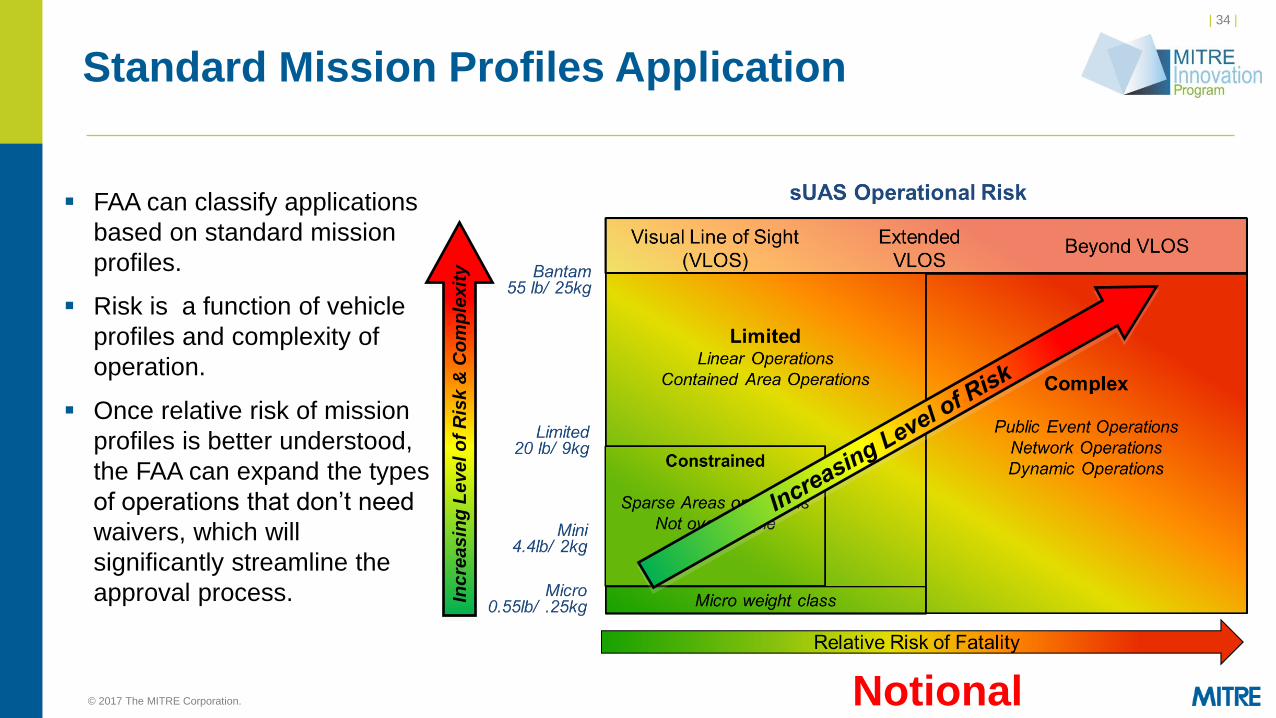
Standard Mission Profiles Application
FAA can classify applications
based on standard mission
profiles.
Risk is a function of vehicle
profiles and complexity of
operation.
Once relative risk of mission
profiles is better understood,
the FAA can expand the types
of operations that don’t need
waivers, which will
significantly streamline the
approval process. Inc
rea
sin
g L
ev
el o
f R
isk
& C
om
ple
xit
y
Notional
| 35 |
© 2017 The MITRE Corporation. All rights reserved. For Internal MITRE Use.
Bantam-Hybrid
Bantam-Rotorcraft
Bantam-FixedWing
Limited-Hybrid
Limted-Rotorcraft
Limted-FixedWing
Mini-Hybrid
Mini-Rotorcraft
Mini-FixedWing
Micro-Hybrid
Micro-Rotorcraft
Micro-FixedWing
Sparse LinearArea
Constrained
Area PublicEvent
Constrained
Area PublicEvent Sparse LinearArea
Network-
Rural
Network-
Urban
Dynamic
Area
BVLOSMissions UOPMissions EVLOS&UOPMissions BVLOS&UOP
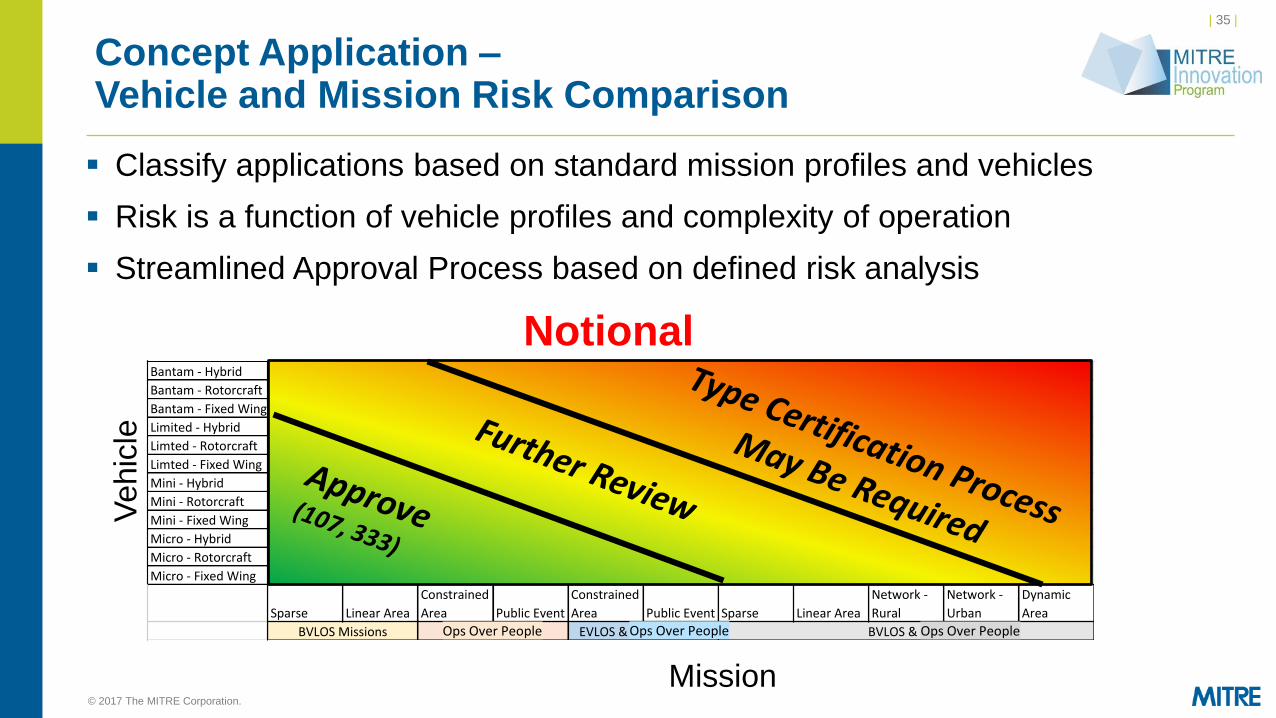
Concept Application – Vehicle and Mission Risk Comparison
Vehic
le
Mission
Notional
Classify applications based on standard mission profiles and vehicles
Risk is a function of vehicle profiles and complexity of operation
Streamlined Approval Process based on defined risk analysis
Ops Over People Ops Over People Ops Over People
| 36 |
© 2017 The MITRE Corporation. All rights reserved. For Internal MITRE Use.
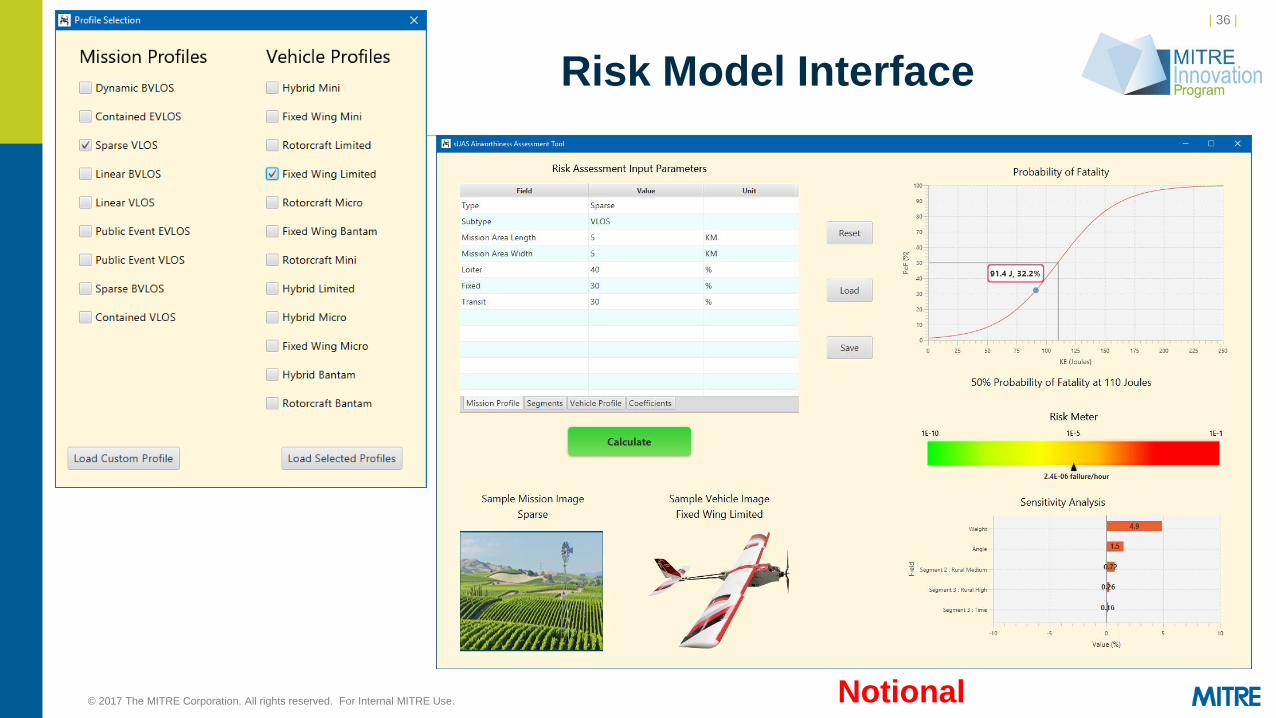
Risk Model Interface
Notional
| 37 |
© 2017 The MITRE Corporation. All rights reserved. For Internal MITRE Use.
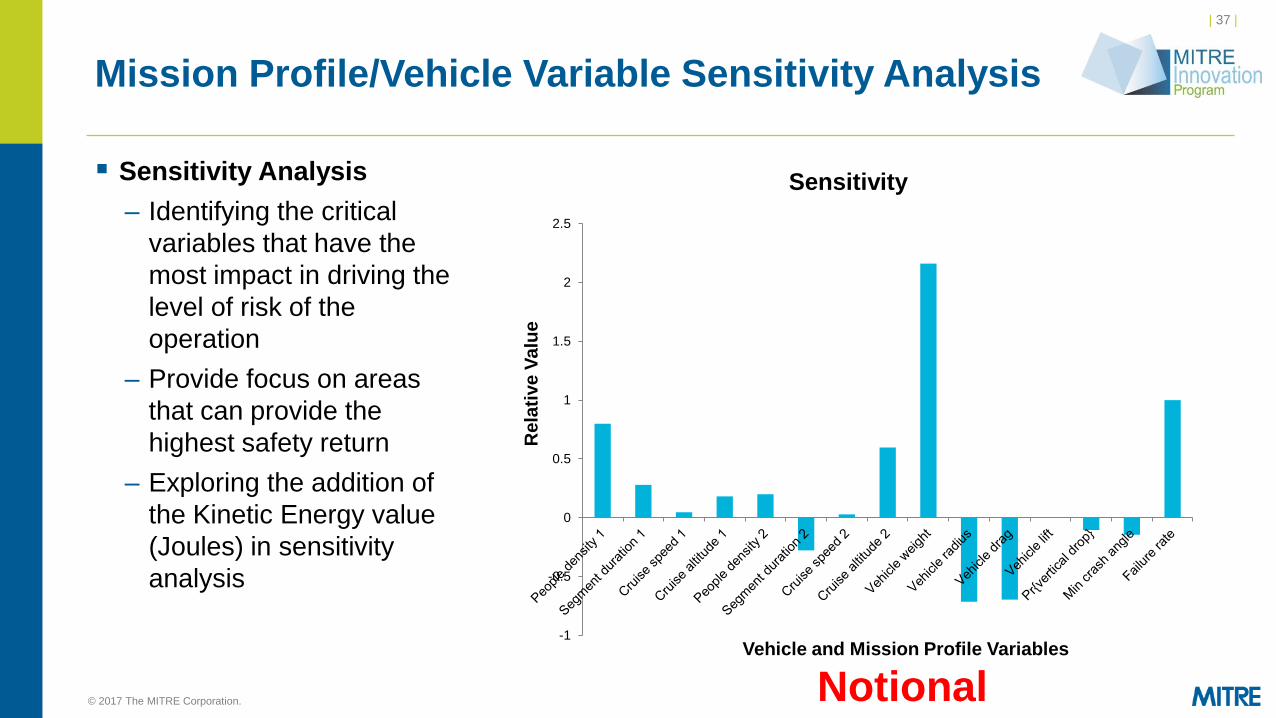
Mission Profile/Vehicle Variable Sensitivity Analysis
-1
-0.5
0
0.5
1
1.5
2
2.5
Sensitivity Sensitivity Analysis
– Identifying the critical
variables that have the
most impact in driving the
level of risk of the
operation
– Provide focus on areas
that can provide the
highest safety return
– Exploring the addition of
the Kinetic Energy value
(Joules) in sensitivity
analysis
Vehicle and Mission Profile Variables
Re
lati
ve
Va
lue
Notional
| 38 |
Next Steps
| 39 |
© 2017 The MITRE Corporation. All rights reserved. For Internal MITRE Use.
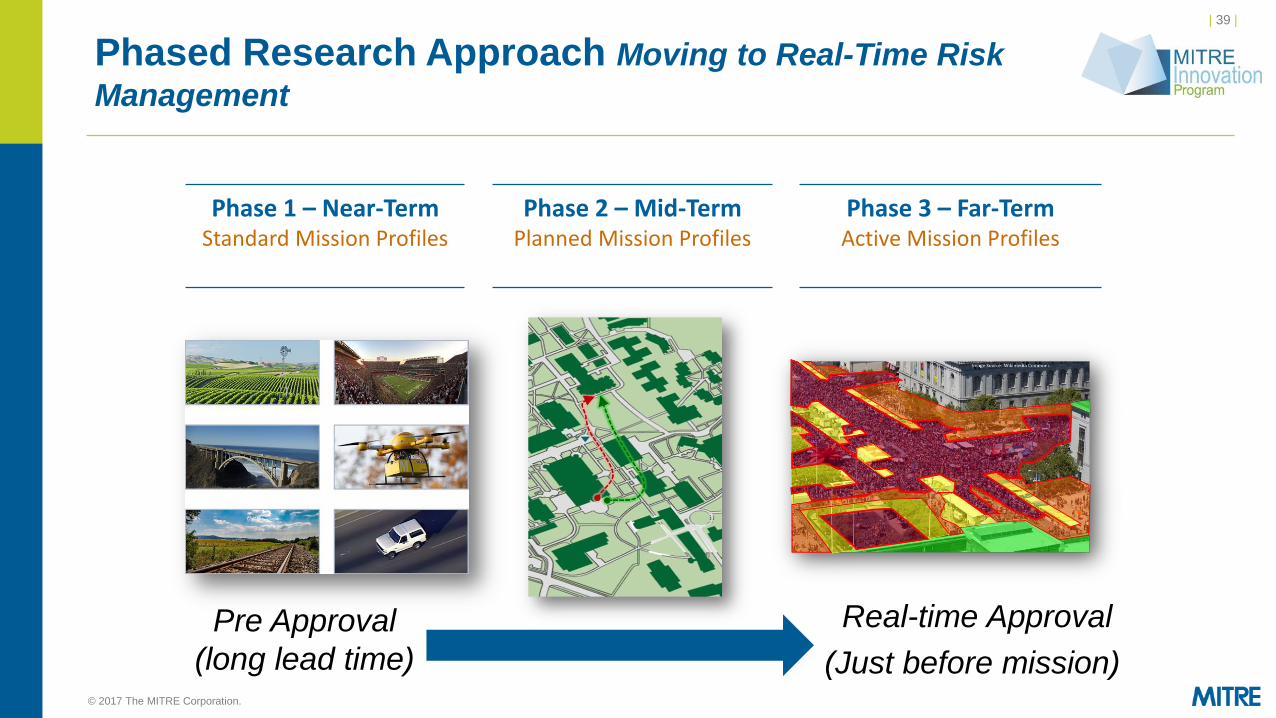
Phased Research Approach Moving to Real-Time Risk
Management
Phase 1 – Near-Term Standard Mission Profiles
Phase 2 – Mid-Term Planned Mission Profiles
Pre Approval
(long lead time)
Real-time Approval
(Just before mission)
Phase 3 – Far-Term Active Mission Profiles
| 40 |
© 2017 The MITRE Corporation. All rights reserved. For Internal MITRE Use.
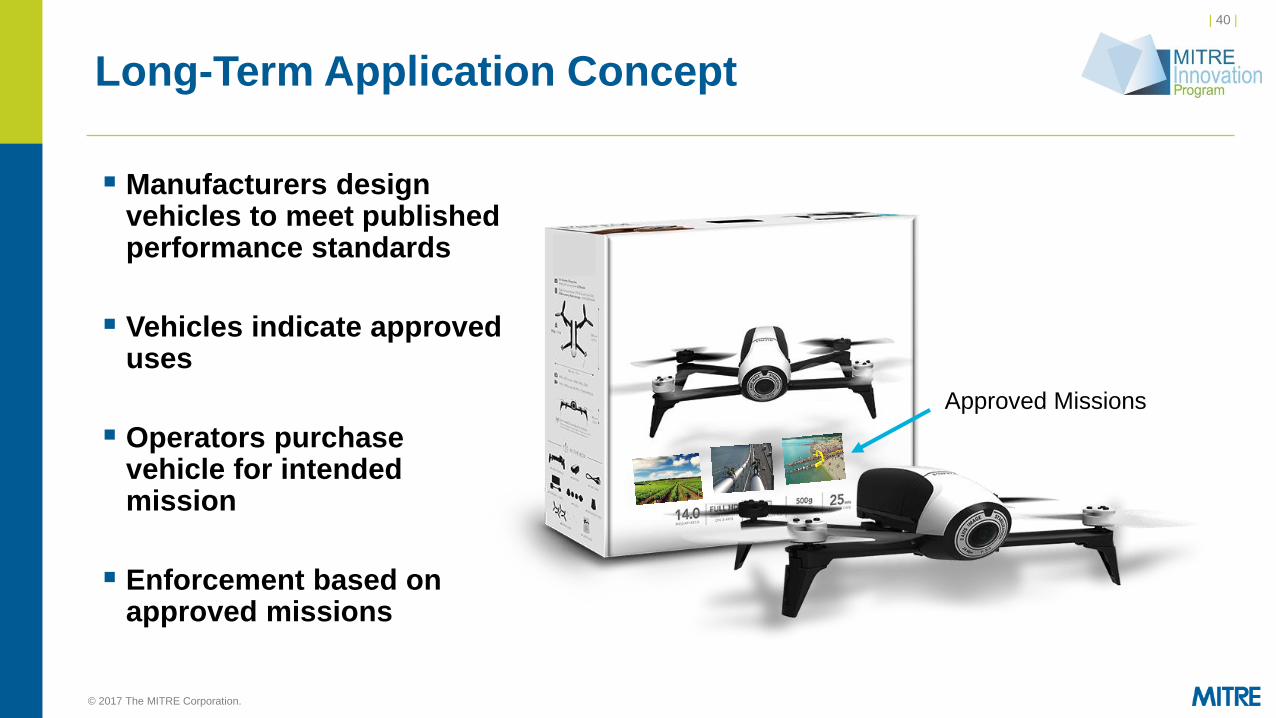
Long-Term Application Concept
Manufacturers design vehicles to meet published performance standards
Vehicles indicate approved uses
Operators purchase vehicle for intended mission
Enforcement based on approved missions
Approved Missions
| 41 |
© 2017 The MITRE Corporation. All rights reserved. For Internal MITRE Use.
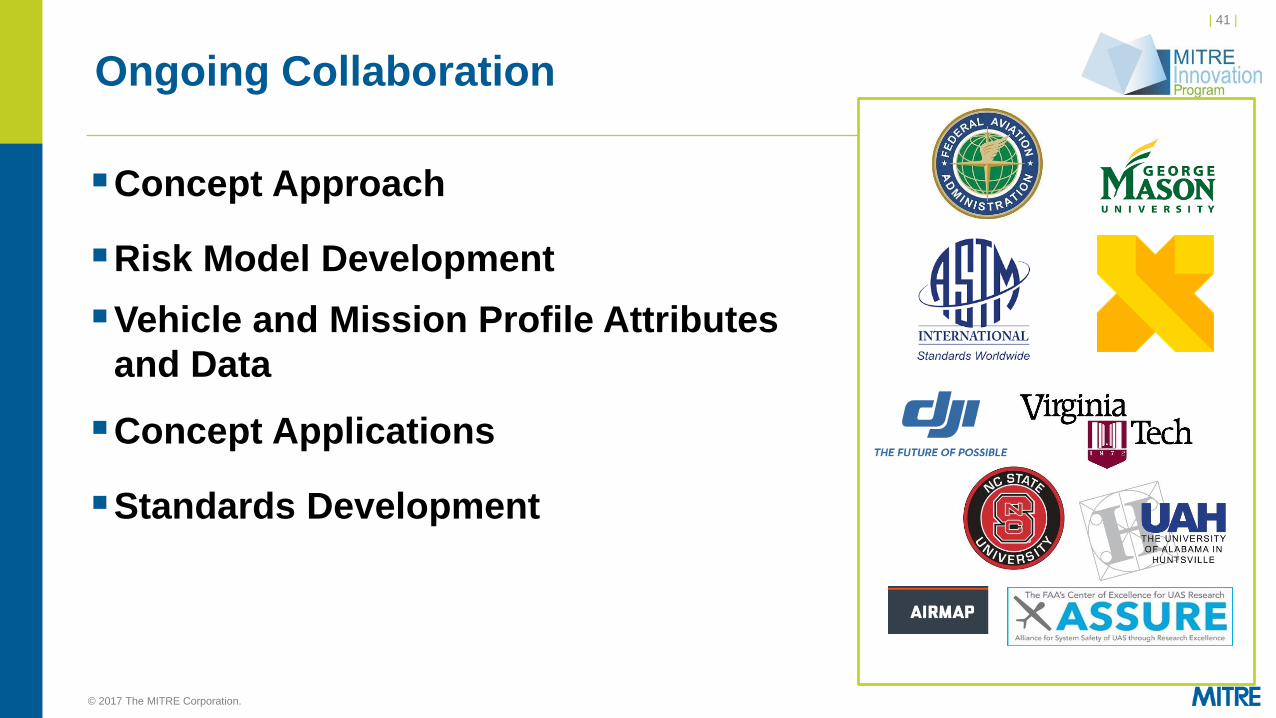
Ongoing Collaboration
Concept Approach
Risk Model Development
Vehicle and Mission Profile Attributes
and Data
Concept Applications
Standards Development
© 2017 The MITRE Corporation. All rights reserved. For internal MITRE use
For internal MITRE use
Questions
September 26th, 2017
MITRE Corporation
Jeff Breunig


![Welcome [sites.nationalacademies.org]sites.nationalacademies.org/.../documents/webpage/dbasse_084415.… · Development of Unconventional Hydrocarbon Resources in the Appalachian](https://img.pdfslide.us/doc/110x75/5fd6278e4d987d0e226382cf/welcome-sites-sites-development-of-unconventional-hydrocarbon-resources-in-the.jpg)