Embed Size (px)
Citation preview

7/27/2019 A Revolution in Interaction
http://slidepdf.com/reader/full/a-revolution-in-interaction 1/20
4 THE McKINSEY QUARTERLY 1997 NUMBER 1
STRATEGY
Pat Butler is a principal and Anupam Sahay is a consultant in McKinsey’s London oƒfice;Ted Hall isa director, Lenny Mendonca isa principal,and James Manyika isa consultantin the San
Francisco oƒfice; Ali Hanna isa director in theStamford oƒfice; and Byron Auguste is a consultantin the Los Angeles oƒfice. Copyright © 1997 McKinsey & Company. All rights reserved.
A revolution in interaction

7/27/2019 A Revolution in Interaction
http://slidepdf.com/reader/full/a-revolution-in-interaction 2/20

7/27/2019 A Revolution in Interaction
http://slidepdf.com/reader/full/a-revolution-in-interaction 3/20
Just such a change is now beginning to occur. A convergence of tech-nologies is set to increase our capacity to interact by a factor of betweentwo and five in the near future. This enhanced interactive capacity willcreate new ways to configure businesses, organize companies, and servecustomers, and have profound eƒfects on the structure, strategy, andcompetitive dynamics of industries.
Yet business leaders will find it diƒficult to anticipate the opportunitiesand threats this change will present because our assumptions and thinkingabout strategy and organization are based much more on the economics of transformation than on the economics of interaction. To recognize, under-stand, and act on the hidden power of interactions, we will need to adoptnew mindsets, new measurements, and new vocabularies.
What are interactions?
Economic interactions play a ubiquitous role in the world economy.Individuals and organizations interact to find the right party with which toexchange; to arrange, manage, and integrate the activities associated withthis exchange; and to monitor performance. These interactions occur withinfirms, between firms, and all the way through markets to the end consumer.They take many everyday forms – management meetings, conferences, phoneconversations, sales calls, problem solving, reports, memos – but theirunderlying economic purpose is always to enable the exchange of goods,services, or ideas.
A REVOLUTION IN INTERACTION
6 THE McKINSEY QUARTERLY 1997 NUMBER 1
The research underpinning this article is
part of a special initiative to deepen the
understanding of the impact of global forces
such as technology and deregulation. Drawing
on our proprietary industry database, we
measured how different types of workers
in different industries spend their time at amicrolevel. We estimated interaction costs
for 24 worker categories and 23 industry
types in the United States, and developed
similar estimates for G ermany and India.
Workers were classifi ed into eight generic
types – doers, caregivers, strategists,
coordinators, analytic knowledge workers,
interpersonal knowledge workers, data
manipulators, and data harvesters and
communicators – and a detailed
“ stereotypical” activity profile was
developed for each type. The activities were
divided into interactive and non-interactive,
and the costs associated with each group
were isolated. We then used national
statistics to gross up these calculationsto the industry and economy level.
In addition, we conducted a series of
experiments and simulations to gauge
the potential impact of new technologies
on the time and cost of routine economic
interactions. The simulations were selected to
provide surrogates for the 50 most commonly
performed activities identified by M cK insey
databases on worker activity.
ABOUT THE RESEARCH
7/27/2019 A Revolution in Interaction
http://slidepdf.com/reader/full/a-revolution-in-interaction 4/20
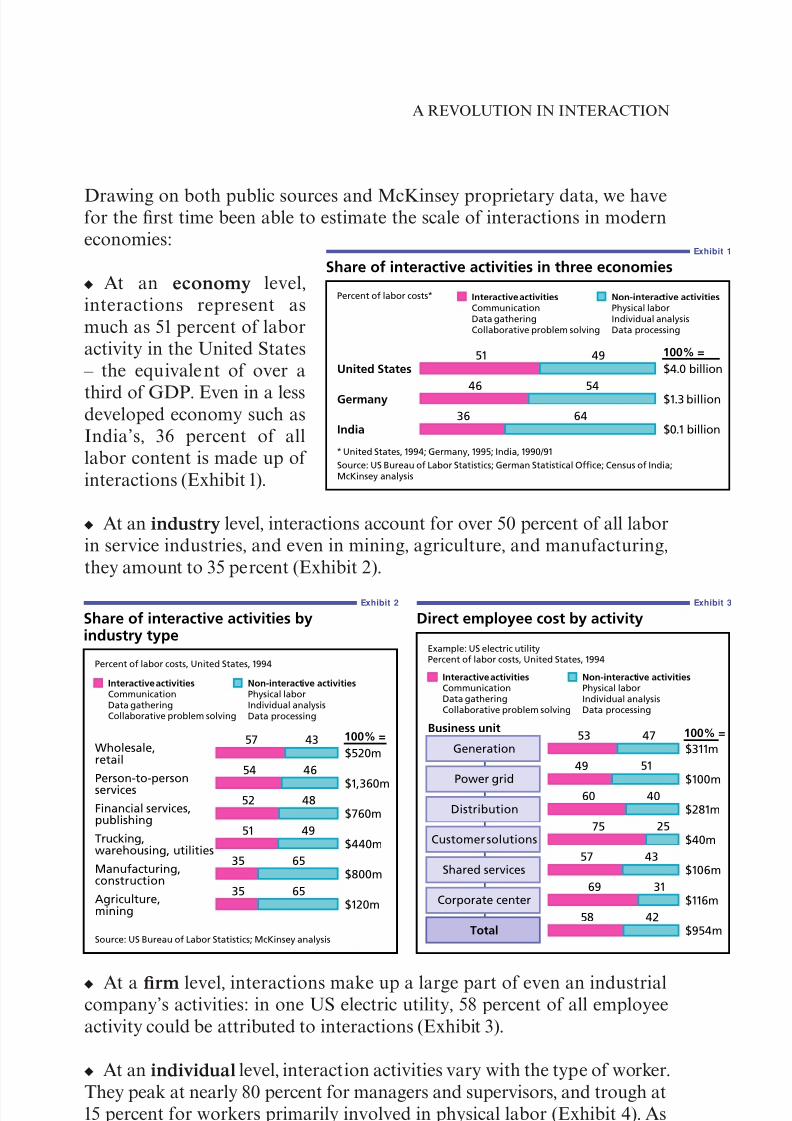
Drawing on both public sources and McKinsey proprietary data, we havefor the first time been able to estimate the scale of interactions in moderneconomies:
• At an economy level,interactions represent asmuch as 51 percent of laboractivity in the United States
– the equivalent of over a
third of GDP. Even in a lessdeveloped economy such asIndia’s, 36 percent of alllabor content is made up of interactions (Exhibit 1).
• At an industry level, interactions account for over 50 percent of all laborin service industries, and even in mining, agriculture, and manufacturing,they amount to 35 percent (Exhibit 2).
• At a firm level, interactions make up a large part of even an industrialcompany’s activities: in one US electric utility, 58 percent of all employeeactivity could be attributed to interactions (Exhibit 3).
• At an individual level, interaction activities vary with the type of worker.They peak at nearly 80 percent for managers and supervisors, and trough at15 percent for workers primarily involved in physical labor (Exhibit 4). Asthe labor mix continues its shiƒt toward information workers, interactionswill become still more important (Exhibit 5).
A REVOLUTION IN INTERACTION
THE McKINSEY QUARTERLY 1997 NUMBER 1 7
Exhibit 1
Share of interactive activities in three economies
Percent of labor costs* Interactive activitiesCommunicationData gatheringCollaborative problem solving
Non-interactive activitiesPhysical laborIndividual analysisData processing
* United States, 1994; Germany, 1995; India, 1990/91
Source: US Bureau of Labor Statistics; German Statistical Office; Census of India;McKinsey analysis
4951
5446
6436
United States
100% =
Germany
India
$4.0 billion
$1.3 billion
$0.1 billion
Exhibit 2
Share of interactive activities by industry type
Percent of labor costs, United States, 1994
Interactive activitiesCommunicationData gatheringCollaborative problem solving
Non-interactive activitiesPhysical laborIndividual analysisData processing
Source: US Bureau of Labor Statistics; McKinsey analysis
Wholesale, retail
Person-to-personservices
Financial services,publishing
Trucking,warehousing, utilities
Manufacturing,construction
Agriculture, mining
$520m
$1,360m
$760m
$440m
$800m
$120m
57 43
46
48
49
65
6535
35
51
52
54
100% =
Exhibit 3
Direct employee cost by activity
Example: US electric utilityPercent of labor costs, United States, 1994
Interactive activitiesCommunicationData gatheringCollaborative problem solving
Non-interactive activitiesPhysical laborIndividual analysisData processing
Generation
Power grid
Distribution
Customer solutions
Shared services
Corporate center
Total
Business unit
$311m
$100m
$281m
$40m
$106m
$954m
$116m
53
49
60
75
57
69
58
47
51
40
25
43
31
42
100% =

7/27/2019 A Revolution in Interaction
http://slidepdf.com/reader/full/a-revolution-in-interaction 5/20
How interactions shape economic activity
Given the ubiquitous nature of interactions, it is hardly surprising that theyare important determinants of how firms and industries are structured, andhow customers behave.
Firms trade oƒf the value of specialization against the interaction costs
associated with external suppliers when they set their boundariesand choose their focus. There is a balance to be struck between thetransformation costs of production and delivery, and the interaction costs of arranging and coordinating exchanges. Typically, interaction costs are lowerwhen production occurs within the firm, while production costs are lowerfor specialist outside suppliers. The structure of firms and industries at anygiven time is designed to minimize the total costs of transformation andinteraction.
Consider by way of analogy a two-person economy. Both participantscurrently hunt and fish for food, but one is better at hunting and the otherat fishing. Should they each hunt and fish for themselves? Or should one huntand the other fish, and trade part of their output at the end of the day? Whatif a third person joins the economy? Should they set up a market to exchangetheir wares, or should they barter in pairs?
The answers are naturally influenced by the participants’ relative skill (orcomparative advantage) at fishing and hunting. Equally, however, they are
A REVOLUTION IN INTERACTION
8 THE McKINSEY QUARTERLY 1997 NUMBER 1
Exhibit 4
Share of interactive activities by worker type
Percent of time spent, United States, 1994
Interactive activitiesCommunicationData gatheringCollaborative problem solving
Non-interactive activitiesPhysical laborIndividual analysisData processing
Interpersonal knowledge workerTeachers, doctors
Data harvesters and communicators
Retail workers, secretariesCoordinatorsSupervisors, administrators
StrategistsSenior managers
Analytic knowledge workersEngineers, scientists, technicians
Data manipulatorsBack office clerks, analysts
CaregiversNurses, waiters, hairdressers
DoersLine operators, truck drivers,construction workers
Worker typeExamples
78 22
22
23
32
58
63
81
8515
19
37
42
68
77
78
Exhibit 5
Share of information workers over time
Percent of employment, United States, 1994
Information workersStrategistsCoordinatorsAnalytic knowledge workersInterpersonal knowledge workersData manipulatorsData harvesters and communicators
Physical workersDoersCaregivers
1900
1930
1960
1994
17 83
30 70
49 51
62 38
Source: Bureau of the Census; Bureau of Labor
Statistics; McKinsey analysis

7/27/2019 A Revolution in Interaction
http://slidepdf.com/reader/full/a-revolution-in-interaction 6/20
shaped by the interaction costs associated with exchanges – the amount of time and eƒfort needed to search for the other party, negotiate the exchange,and monitor the other’s performance.
Similarly, companies trade oƒf the eƒfectiveness of alternative organi-
zational forms against the interaction costs involved in managing them.
Are departments the natural way to configure a modern corporation, forexample? Do they have to be co-located? Is a central structure needed tomonitor them? Are ad hoc teams more eƒfective than permanent structures?
Are flat or hierarchical structures easier to manage?
If interaction costs were negligible, an organization could in theory beatomized into a collection of individuals, geographically dispersed butconnected by a communications network. In reality, however, substantialinteraction costs and the human aspects of eƒfective interaction limit therange of realistic configurations.
Customers choose products and providers by trading oƒf the interaction
costs of additional search against the marginal value expected from it. Ina world where searching cost nothing, consumers would search exhaustivelyuntil they found the exact product of their choice at the lowest price available.Clearly, this is a hypothetical case, but what if today’s search costs fell by 90percent? Wouldn’t customers’ selection criteria and processes change too?
If providers anticipated this, wouldn’t they communicate and develop anddistribute products in a very diƒferent manner? What if their costs of interacting with customers also declined? Many of these circumstances
may soon come to pass. When they do, falling interaction costs will triggerdramatic changes in the relationship between companies and their customers.
The types of tradeoƒf described above are not made explicitly andtransparently. Rather, they have become hardwired with time into theassumptions made in designing organizations and setting strategies – assumptions about customer behavior, distribution economics, manufacturingscale, insourcing versus outsourcing, and a range of other variables. In eachcase, relative interaction cost is a key component of the assumption. This
variable is about to undergo radical change. We believe that the interactivecapacity of modern economies will at least double, and could increase asmuch as five-fold, over the next five to ten years.
How technology will revolutionize interactions
Technological progress is bringing about a massive increase in interactivecapability. All modern forms of interaction – whether they be as simple aswriting a letter or as complex as solving a problem in a team – are shaped
A REVOLUTION IN INTERACTION
THE McKINSEY QUARTERLY 1997 NUMBER 1 9
7/27/2019 A Revolution in Interaction
http://slidepdf.com/reader/full/a-revolution-in-interaction 7/20
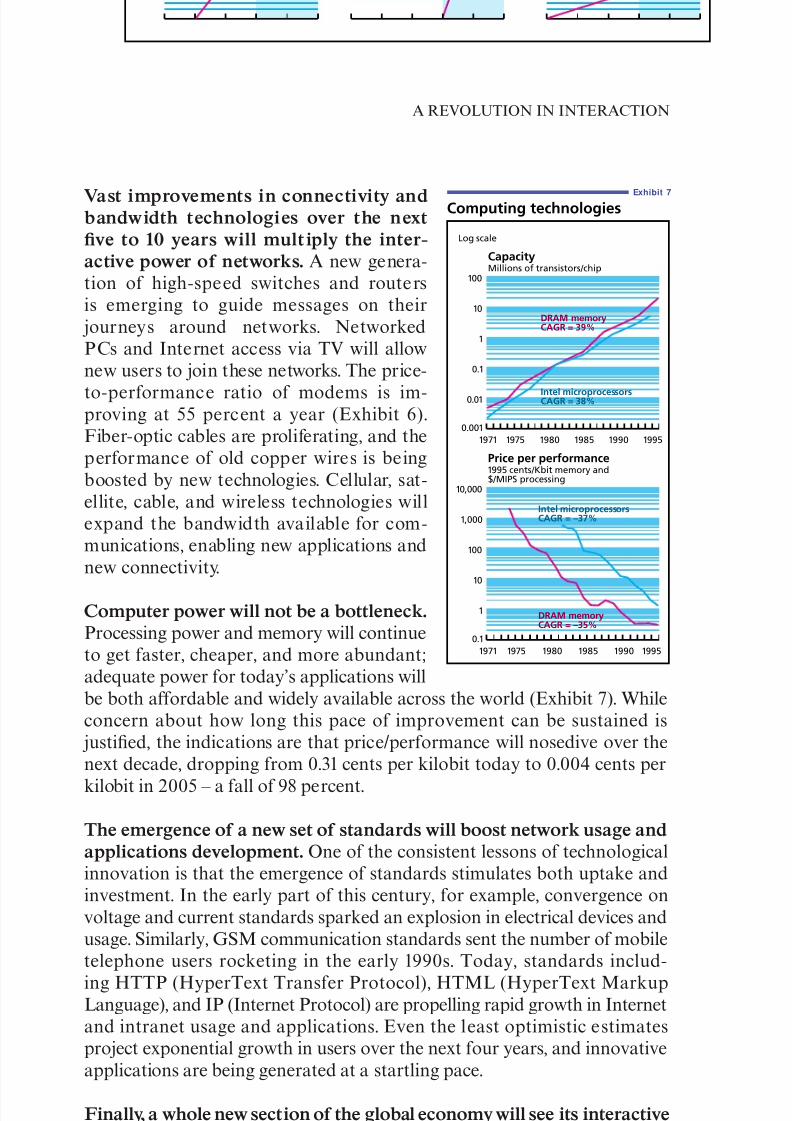
by computing and communications technologies. The past couple of decadeshave brought remarkable innovations in these fields, but modern economieshave yet to exploit opportunities to increase the quantity and quality of interactions and reduce their cost.
Until now, our ability to manipulate and process data has far outstripped ourability to communicate and interact. However, a number of convergingfactors are set to change this situation. New networking capabilities,technologies that enhance connectivity and bandwidth, and standards that
drive new applications are coming together in an environment of spiralingprocessing power and deepening technological penetration. This potentcombination heralds a new age of abundant interactive capability.
Underlying changes in interactive technologies
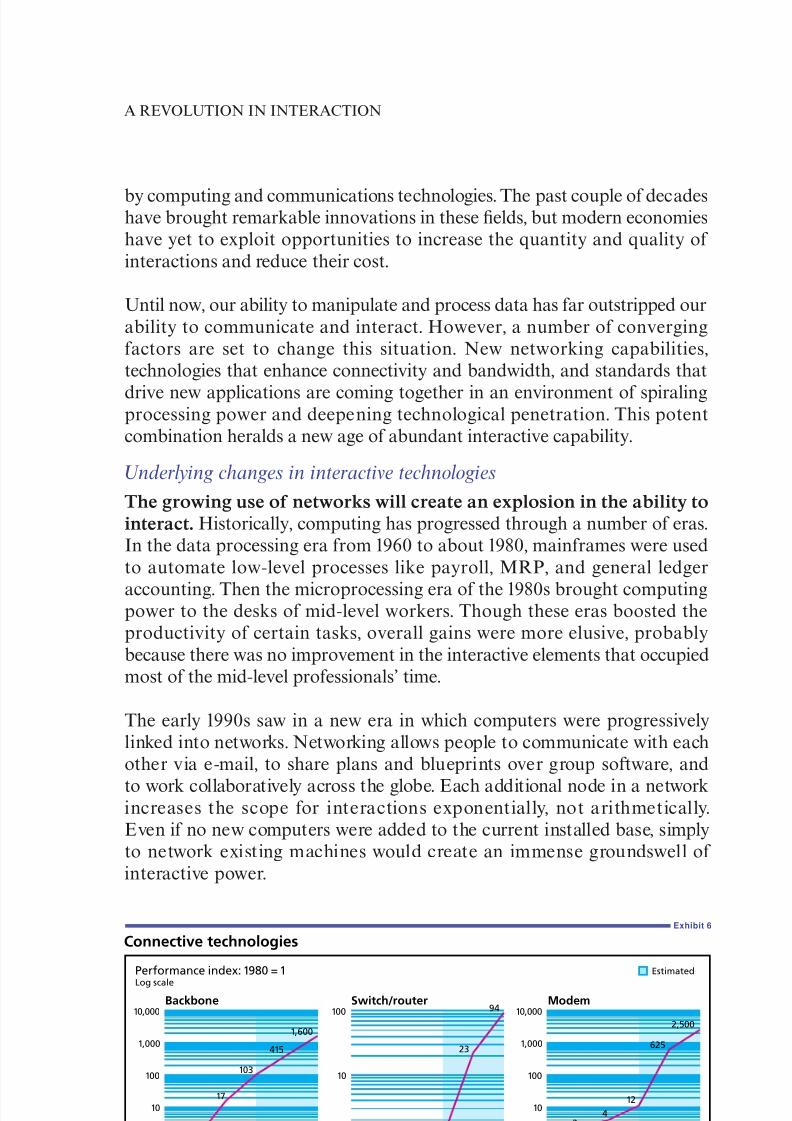
The growing use of networks will create an explosion in the ability to
interact. Historically, computing has progressed through a number of eras.In the data processing era from 1960 to about 1980, mainframes were usedto automate low-level processes like payroll, MRP, and general ledger
accounting. Then the microprocessing era of the 1980s brought computingpower to the desks of mid-level workers. Though these eras boosted theproductivity of certain tasks, overall gains were more elusive, probablybecause there was no improvement in the interactive elements that occupiedmost of the mid-level professionals’ time.
The early 1990s saw in a new era in which computers were progressivelylinked into networks. Networking allows people to communicate with eachother via e-mail, to share plans and blueprints over group soƒtware, and
to work collaboratively across the globe. Each additional node in a networkincreases the scope for interactions exponentially, not arithmetically.Even if no new computers were added to the current installed base, simplyto network existing machines would create an immense groundswell of interactive power.
A REVOLUTION IN INTERACTION
10 THE McKINSEY QUARTERLY 1997 NUMBER 1
Exhibit 6
Connective technologies
Performance index: 1980 = 1
Log scale
17
1 1
23
24
12
625
2,500
94
103
415
1,600
200520001995199019851980 200520001995199019851980 200520001995199019851980
Estimated
Backbone Switch/router Modem10,000
1,000
100
10
1
100
10
1
10,000
1,000
100
10
1
7/27/2019 A Revolution in Interaction
http://slidepdf.com/reader/full/a-revolution-in-interaction 8/20
7/27/2019 A Revolution in Interaction
http://slidepdf.com/reader/full/a-revolution-in-interaction 9/20
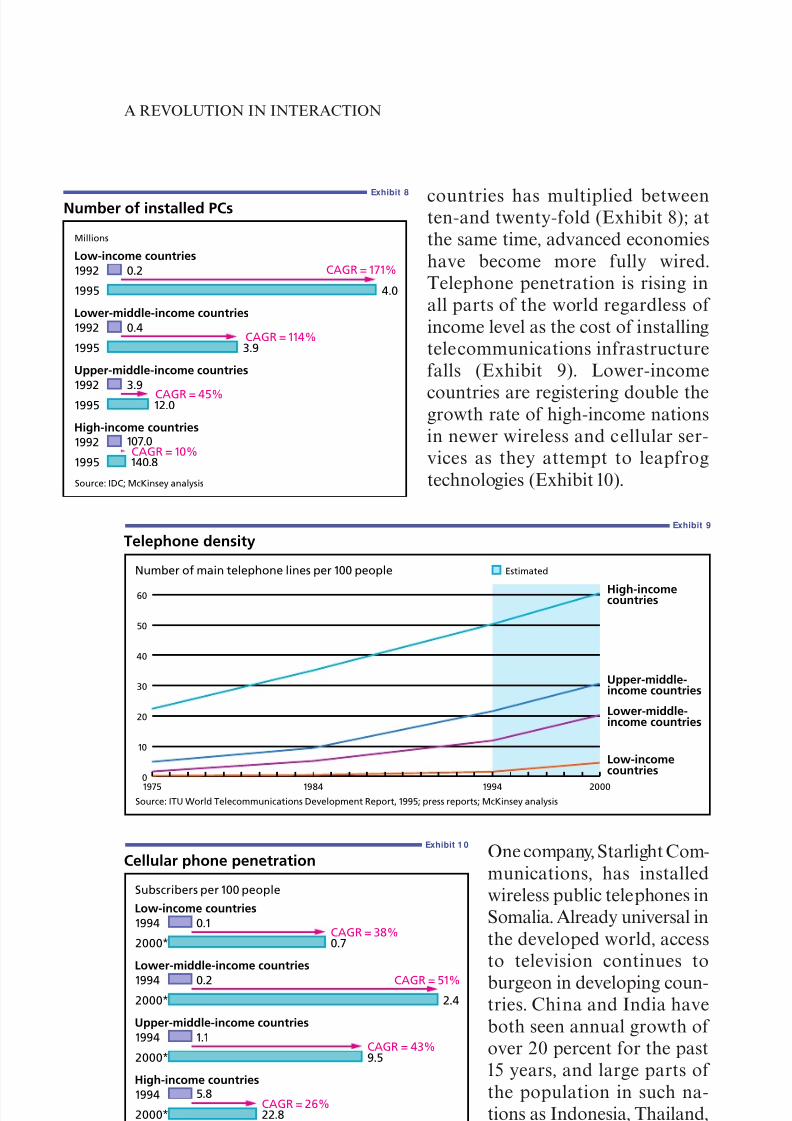
countries has multiplied betweenten-and twenty-fold (Exhibit 8); atthe same time, advanced economieshave become more fully wired.Telephone penetration is rising inall parts of the world regardless of income level as the cost of installingtelecommunications infrastructurefalls (Exhibit 9). Lower-income
countries are registering double thegrowth rate of high-income nationsin newer wireless and cellular ser-vices as they attempt to leapfrogtechnologies (Exhibit 10).
One company, Starlight Com-munications, has installedwireless public telephones inSomalia. Already universal inthe developed world, accessto television continues to
burgeon in developing coun-tries. China and India haveboth seen annual growth of over 20 percent for the past15 years, and large parts of the population in such na-tions as Indonesia, Thailand,and Malaysia now haveaccess to television.
A REVOLUTION IN INTERACTION
12 THE McKINSEY QUARTERLY 1997 NUMBER 1
Exhibit 8
Number of installed PCs
Millions
Low-income countries
Lower-middle-income countries
Upper-middle-income countries
High-income countries
Source: IDC; McKinsey analysis
CAGR = 171%
CAGR = 114%
CAGR = 45%
CAGR = 10%
0.2
4.0
0.4
3.9
3.9
12.0
107.0
140.8
1992
1995
1992
1995
1992
1995
1992
1995
Exhibit 9
Telephone density
Number of main telephone lines per 100 people
Source: ITU World Telecommunications Development Report, 1995; press reports; McKinsey analysis
60
50
40
30
20
10
0
Low-income countries
Lower-middle-income countries
Upper-middle-income countries
High-income countries
1975 1984 1994 2000
Estimated
Exhibit 1 0
Cellular phone penetration
Subscribers per 100 people
Low-income countries
Lower-middle-income countries
Upper-middle-income countries
High-income countries
* Estimated
Source: ITU Yearbook, 1995; McKinsey analysis
CAGR = 38%
CAGR = 51%
CAGR = 43%
CAGR = 26%
0.1
0.7
0.22.4
1.1
9.5
5.8
22.8
1994
2000*
19942000*
1994
2000*
1994
2000*
7/27/2019 A Revolution in Interaction
http://slidepdf.com/reader/full/a-revolution-in-interaction 10/20
The cumulative eƒfect on interactioncapability
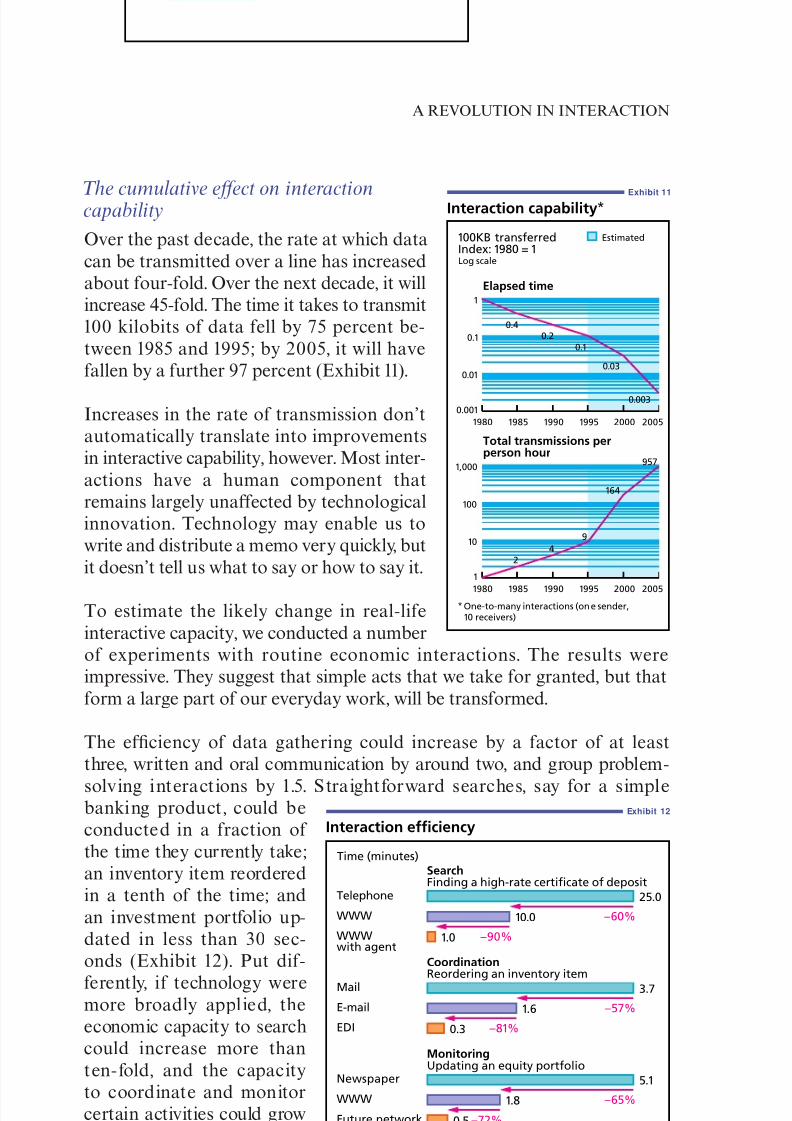
Over the past decade, the rate at which datacan be transmitted over a line has increasedabout four-fold. Over the next decade, it willincrease 45-fold. The time it takes to transmit100 kilobits of data fell by 75 percent be-tween 1985 and 1995; by 2005, it will havefallen by a further 97 percent (Exhibit 11).
Increases in the rate of transmission don’tautomatically translate into improvementsin interactive capability, however. Most inter-actions have a human component thatremains largely unaƒfected by technologicalinnovation. Technology may enable us towrite and distribute a memo very quickly, butit doesn’t tell us what to say or how to say it.
To estimate the likely change in real-lifeinteractive capacity, we conducted a numberof experiments with routine economic interactions. The results wereimpressive. They suggest that simple acts that we take for granted, but thatform a large part of our everyday work, will be transformed.
The eƒficiency of data gathering could increase by a factor of at leastthree, written and oral communication by around two, and group problem-
solving interactions by 1.5. Straightforward searches, say for a simplebanking product, could beconducted in a fraction of the time they currently take;an inventory item reorderedin a tenth of the time; andan investment portfolio up-dated in less than 30 sec-onds (Exhibit 12). Put dif-
ferently, if technology weremore broadly applied, theeconomic capacity to searchcould increase more thanten-fold, and the capacityto coordinate and monitorcertain activities could growby a factor of between twoand ten.
A REVOLUTION IN INTERACTION
THE McKINSEY QUARTERLY 1997 NUMBER 1 13
Exhibit 11
Interaction capability*
100KB transferredIndex: 1980 = 1Log scale
200520001995199019851980
200520001995199019851980
Estimated
Elapsed time
Total transmissions perperson hour
0.40.2
0.1
0.03
0.003
24
9
164
957
* One-to-many interactions (one sender, 10 receivers)
1
0.1
0.01
0.001
1,000
100
10
1
Exhibit 12
Interaction efficiency
Time (minutes)
Telephone
WWW
WWW with agent
SearchFinding a high-rate certificate of deposit
* Intelligent agents, high-speed access, and encryption
–60%
–90%
EDI
CoordinationReordering an inventory item
–57%
–81%
Newspaper
WWW
Future network(estimated)*
MonitoringUpdating an equity portfolio
–65%
–72%
25.0
10.0
1.0
3.7
1.6
0.3
5.1
1.8
0.5
7/27/2019 A Revolution in Interaction
http://slidepdf.com/reader/full/a-revolution-in-interaction 11/20
All in all, taking a conservative view and factoring human limitations intothe pace of technological change, we believe that the overall interactivecapability in developed economies could increase by a factor of two to fiveover the next five to 10 years.
A new economics for the age of interactions
In the face of a massive increase in interactive capability, many of ourtraditional assumptions about the natural forms of economic activity will
fall by the wayside. The tradeoƒfs that shape economic activity – firmstrading oƒf specialization against interaction costs, customers weighingcurrent selections against further search costs, organizations consideringalternative configurations – will each find a new point of balance as oneside of the scale tips down. New ways to configure businesses, servecustomers, and organize companies will emerge. Harbingers of some of these new models are already in evidence, but they tend to be seen asisolated exceptions. With greater interactive capacity, many of theseexceptions will become the norm.
New ways to enhance productivity
The most straightforward interpretation of the increase in interactivecapability is that workers could do their jobs in less than half of the time
they currently spend. This means that a salesman will be able to spend muchmore time with customers, for instance, while R&D staƒf will have to spendmuch less time collecting data and waiting for test results. For the USeconomy alone, such savings could translate into productivity gains worthat least $1 trillion, or a third of GDP.
At one level, interactive technology will be used to boost eƒficiency and cut jobs. However, we believe that in the long run there will be a net increase
in employment, generated by a rise in the overall demand for interactions
and the creation of new products and services that were previously un-economic to deliver. Consider the transport industry, where cheaper roadand air transport precipitated a surge in business trips, visits to friends andrelatives, and travel for pleasure. Similarly, electronic stock exchanges mayhave eliminated the jobber, but they have given market and underlying
corporate activity a fresh impetus.
New ways to configure business
Vertical integration will become less valuable and disaggregation,
outsourcing, and the use of external markets will increase. Whethera company makes or buys depends on the comparative costs of trans-formation (production and transportation) and interaction. Whileoutsourcing or purchasing from a market allows buyers to benefit fromthe superior economics of specialized suppliers, it tends to involve
A REVOLUTION IN INTERACTION
14 THE McKINSEY QUARTERLY 1997 NUMBER 1

7/27/2019 A Revolution in Interaction
http://slidepdf.com/reader/full/a-revolution-in-interaction 12/20
substantial interaction costs. As these costs fall, the relative attractivenessof arm’s-length purchases will rise.
Integrated business systems will give way to more specialized ones, and disag-gregation and outsourcing will burgeon. In textiles, for example, EDI hasallowed players to disaggregate procurement, spinning, weaving, finishing,logistics, and retailing, and contract them out to specialists along the industrychain. Similarly, the utility industry is fragmenting into separate generation,transmission, distribution, wholesale, and
energy services businesses, partly as a resultof the ease and economy of conductingarm’s-length transactions via Internet andwireless technologies. In outsourcing, thegrowth potential of specialized functionalbusinesses is illustrated by operations likeRosenbluth International, a $40 million company from Philadelphia that hasbuilt a $1 billion international business in outsourced corporate travel, andFederal Express’s logistics, electronics, commerce, and catalog business, which
expects to turn over more than $1 billion by 2000.
In contrast, horizontal integration and cooperation will become more
economically attractive. Horizontal integration brings benefits whencarrying out a set of activities jointly rather than separately yields economiesof scope in the form of higher returns or lower costs. As falling interactioncosts allow companies better to coordinate the marketing and distributionof a wider variety of products and services, the value of horizontal integrationshould increase. Mail-order firms such as Fingerhut are among the first to
exploit the new economies of scope by cross-selling over a single channel.
Growing standardization will also encourage horizontal integration. Just asthe expansion in transcontinental rail transport compelled US railways tostandardize track size in the early 1900s, the extra traƒfic created by lowerinteraction costs will force the emergence of new communication andinformation standards in the 1990s. The possibility of transmitting music,photographs, and video in standard formats over a single electronic channel,for example, lies behind much of the excitement raging in media, cable, and
telecommunications companies in recent months.
The strategic value of scale is likely to decline in many industries,
although it will rise for networked businesses. In businesses wheredistribution or logistics originally made scale essential, falling interactioncosts will reduce its importance. Outsourcing, alternative delivery channels,and the ability to variablize inputs will grow, reducing fixed costs. As a result,smaller firms will proliferate in such industries as consumer goods manu-facturing, applications soƒtware, specialty retailing, and design services.
A REVOLUTION IN INTERACTION
THE McKINSEY QUARTERLY 1997 NUMBER 1 15
For the US economy, theincrease in interactive capabilitycould translate into productivity
gains worth a third of GDP
7/27/2019 A Revolution in Interaction
http://slidepdf.com/reader/full/a-revolution-in-interaction 13/20

7/27/2019 A Revolution in Interaction
http://slidepdf.com/reader/full/a-revolution-in-interaction 14/20
and capacity limits, such as real estate and entertainment. Following thistrend to its logical conclusion, many present-day retail markets could assumethe pricing and transparency characteristics of wholesale markets if inter-action costs continue to fall over a long period.
The traditional role of intermediaries will disappear or be transformed
into market making or synthesis. Intermediaries have traditionallyexploited the lack of transparency in supply and demand in circumstanceswhere it is costly for buyers and suppliers to search for and communicate
directly with one another. But as these interaction costs fall, moreproviders will go directly to consumers via telephones and the Internet,and more consumers will do their own searching using the new media andon-line search agents. Brokers in the financial services industry and travelagents in the airline business will testify to the pressures this creates forintermediaries.
Some businesses, like banking, are by definition intermediary in nature.In time, their foundations will be threatened. If electronic cash comes of
age, it is diƒficult to imagine consumers being willing to pay for the high-cost infrastructure they currently have to use when they interact withbanks. Similarly, if consumers could obtain information directly fromcontent providers at low cost, many areasof information publishing might lose theirdistinctive value.
Nor is this type of change confined toinformation-related industries. The US motor
industry is right to be alarmed by RepublicIndustries’ snapping up of dealerships and its promises to make AutoNationUSA as recognizable as McDonald’s across the country. A large part of thevalue that Republic could create will come from reducing the interaction costof buying an automobile.
As the value they derive from searching declines, intermediaries will haveto enhance other aspects of their role, or create new roles to play. Some willbuild businesses around pure transaction channels. Schwab, with its range of
low-cost brokerage channels, is an outstanding example. Others may retreatto oƒfering specialized advice.
The most promising roles, however, will be that of integration and synthesis,and that of market making. The former includes the aggregation of third-party information, evaluation and filtering services, and the bundling of services from multiple providers. In the past, companies such as ConsumerReports in print media and tour packagers in travel provided such services;in the future, digital networks will open up a vast new set of related
A REVOLUTION IN INTERACTION
THE McKINSEY QUARTERLY 1997 NUMBER 1 17
As interaction costs fall,providers will go directly toconsumers, and consumerswill do their own searching
7/27/2019 A Revolution in Interaction
http://slidepdf.com/reader/full/a-revolution-in-interaction 15/20

7/27/2019 A Revolution in Interaction
http://slidepdf.com/reader/full/a-revolution-in-interaction 16/20
7/27/2019 A Revolution in Interaction
http://slidepdf.com/reader/full/a-revolution-in-interaction 17/20
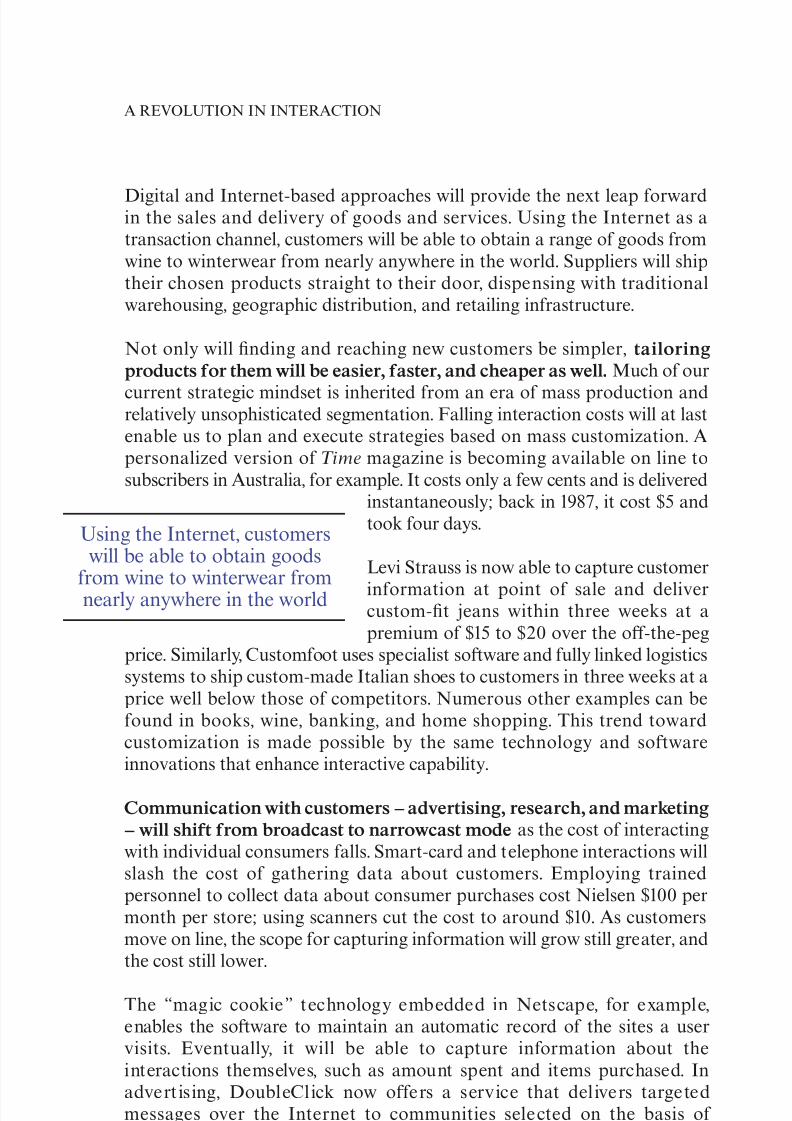
Digital and Internet-based approaches will provide the next leap forwardin the sales and delivery of goods and services. Using the Internet as atransaction channel, customers will be able to obtain a range of goods fromwine to winterwear from nearly anywhere in the world. Suppliers will shiptheir chosen products straight to their door, dispensing with traditionalwarehousing, geographic distribution, and retailing infrastructure.
Not only will finding and reaching new customers be simpler, tailoring
products for them will be easier, faster, and cheaper as well. Much of our
current strategic mindset is inherited from an era of mass production andrelatively unsophisticated segmentation. Falling interaction costs will at lastenable us to plan and execute strategies based on mass customization. Apersonalized version of Time magazine is becoming available on line tosubscribers in Australia, for example. It costs only a few cents and is delivered
instantaneously; back in 1987, it cost $5 andtook four days.
Levi Strauss is now able to capture customer
information at point of sale and delivercustom-fit jeans within three weeks at apremium of $15 to $20 over the oƒf-the-peg
price. Similarly, Customfoot uses specialist soƒtware and fully linked logisticssystems to ship custom-made Italian shoes to customers in three weeks at aprice well below those of competitors. Numerous other examples can befound in books, wine, banking, and home shopping. This trend towardcustomization is made possible by the same technology and soƒtwareinnovations that enhance interactive capability.
Communication with customers – advertising, research, and marketing
– will shiƒt from broadcast to narrowcast mode as the cost of interactingwith individual consumers falls. Smart-card and telephone interactions willslash the cost of gathering data about customers. Employing trainedpersonnel to collect data about consumer purchases cost Nielsen $100 permonth per store; using scanners cut the cost to around $10. As customersmove on line, the scope for capturing information will grow still greater, andthe cost still lower.
The “magic cookie” technology embedded in Netscape, for example,enables the soƒtware to maintain an automatic record of the sites a uservisits. Eventually, it will be able to capture information about theinteractions themselves, such as amount spent and items purchased. Inadvertising, DoubleClick now oƒfers a service that delivers targetedmessages over the Internet to communities selected on the basis of sophisticated user profiles, while companies like CyberGold pay people towatch advertisements developed to suit their specific profiles. Leading
A REVOLUTION IN INTERACTION
20 THE McKINSEY QUARTERLY 1997 NUMBER 1
Using the Internet, customerswill be able to obtain goods
from wine to winterwear fromnearly anywhere in the world
7/27/2019 A Revolution in Interaction
http://slidepdf.com/reader/full/a-revolution-in-interaction 18/20
7/27/2019 A Revolution in Interaction
http://slidepdf.com/reader/full/a-revolution-in-interaction 19/20
7/27/2019 A Revolution in Interaction
http://slidepdf.com/reader/full/a-revolution-in-interaction 20/20
As in all major economic shiƒts, the successful innovators will be those thatdevelop the best understanding of the underlying change and act upon it.Success in the next five to ten years will require a deep understanding of thepower of interactive capacity in both your own industry and the economyat large.
A REVOLUTION IN INTERACTION
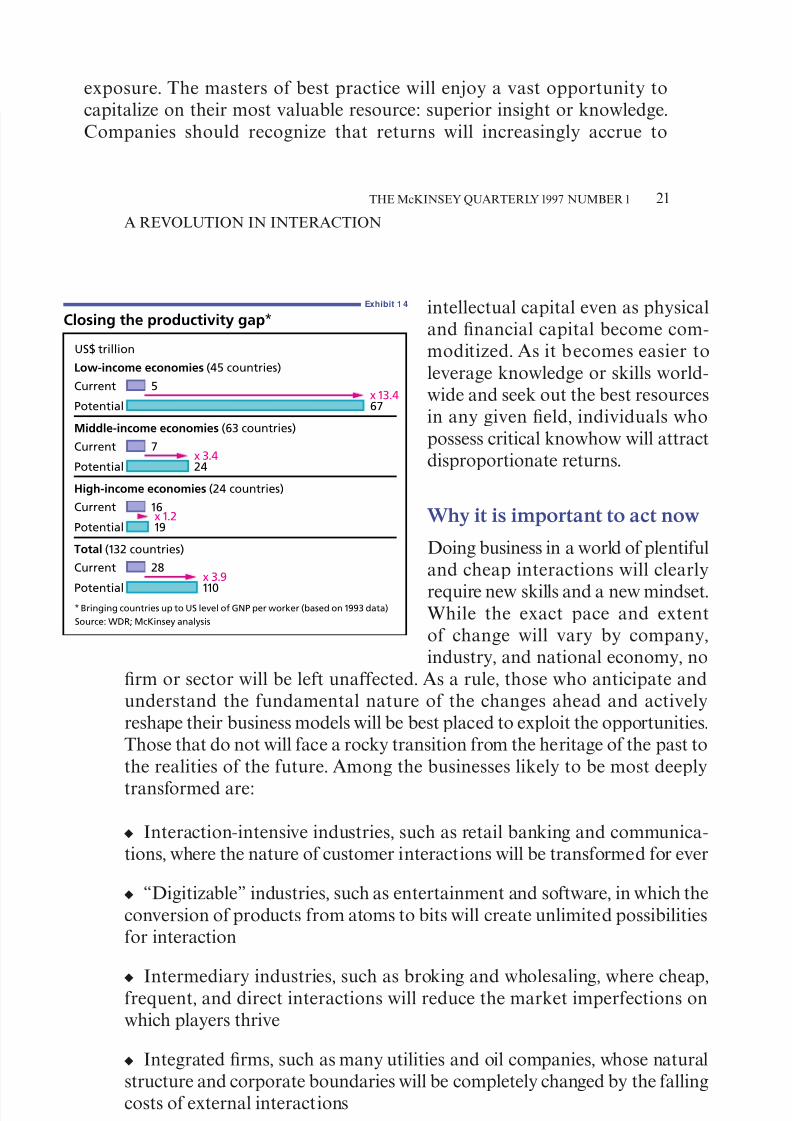
THE McKINSEY QUARTERLY 1997 NUMBER 1 23