Embed Size (px)
Citation preview
1
A REVIEW OF COMPARATIVE ADVANTAGE ASSESSMENT APPROACHES
IN RELATION TO AQUACULTURE DEVELOPMENT
PingSun Leung and Junning Cai
College of Tropical Agriculture and Human Resources
University of Hawaii at Manoa
October 2005
Abstract
The economic concept of “comparative advantage” can be a useful methodology in
providing valuable information for both commercial and policy decision makings
regarding aquaculture development. This paper appraises two approaches commonly used
in the economics literature for comparative advantage assessment. One is the “domestic
resource costs” (DRC) approach; and the other is the “revealed comparative advantage”
(RCA) approach. Several aquaculture-related empirical applications of the DRC and
RCA approaches are reviewed. Finally, the respective merits and problems of these two
complementary approaches and how they could be used to provide policy guidance are
also outlined.
Keywords: Aquaculture; Comparative Advantage; Domestic Resource Cost (DRC);
Revealed Comparative Advantage (RCA)

2
1. Introduction
The existing and potential contribution of aquaculture to economic growth and food
security has received increasing recognition in recent years (FAO 2002; 2004). Compared
to traditional agricultural activities, aquaculture is still at its early stage of development in
many countries or regions that have rich yet underexploited aquaculture resources
(Kapetsky 1994; Kapetsky and Nath 1997; Aguilar-Manjarrez and Nath 1998). In
designing aquaculture development strategies, policymakers as well as aquaculturists are
eager to have information about a country’s comparative advantage in aquaculture
activities that compete for limited aquaculture resources; such information can facilitate
efficient resource allocation to aquaculture activities most likely to succeed in the long
run.
Against this backdrop, this paper attempts to review the concept of comparative
advantage and discusses two approaches of comparative advantage assessment in the
context of aquaculture development. In the next section we first clarify the concept of
comparative advantage, which is one of the most important yet misunderstood ideas in
economics.1 Then in section 3 we review two approaches of comparative advantage
assessments, i.e., the “domestic resource costs” (DRC) approach and the “revealed
comparative advantage” (RCA) approach. We will introduce the rationales behind each
approach, explain their technicalities, point out their merits and limitations in generating
useful information for policy guidance. In section 4 we review several aquaculture-
related empirical applications of the DRC and RCA approaches. Finally, we provide a
summary discussion in section 5.
This paper is not intended to provide a comprehensive survey of the entire literature
on comparative advantage and its assessment. Rather, our goal is to clarify how the
concept of comparative advantage and its assessment can provide useful information for
policy as well as business decision-makings with respect to aquaculture development.
1 In response to a mathematician’s challenge of naming one theory in all of the social sciences which is both true and nontrivial, Paul Samuelson resorted to David Ricardo’s theory of comparative advantage: “That it is logically true need not be argued before a mathematician; that it is not trivial is attested by the thousands of important and intelligent men who have never been able to grasp the doctrine for themselves or to believe it after it was explained to them.” (Samuelson, 1969)
3
2. Comparative advantage: a conceptual clarification
The concept of comparative advantage was originally introduced by David Ricardo to
explain that the driving force behind international trade is not “absolute” but
“comparative” advantage. That is, even if an autarky country has absolute advantage in
all the goods (i.e., it can produce all the goods more efficiently than other countries), it
can still benefit from international trade through increasing specialization in the goods
where its comparative advantage lies.
In brief, a country has comparative advantage in the goods whose autarky relative
prices (in terms of other goods) are lower than other countries. Such lower autarky
relative prices reflect that the country is relatively more efficient in producing these
goods so that under free trade it would be better off allocating more resources to
producing them and then exporting them to pay for imports of other goods with less
production as a result of the resource reallocation.
The concept of comparative advantage goes beyond the domain of international trade.
That “someone has comparative advantage in (doing) something” is a common remark
often encountered in different contexts. In general, an entity is considered having
comparative advantage in one activity if it can do “relatively better” in that activity.
“Relatively better” does not mean that this entity must have a better performance in this
activity than other entities; neither does it mean that it must be better at this activity than
other activities. Indeed, comparative advantage is an intricate concept related to both of
these two comparative dimensions and involving an entity’s performance in one activity,
its performance in other activities, other entities’ performance in this activity, and their
performance in other activities.
Unless it is clear within a particular context, the two comparative dimensions of
comparative advantage need to be specified for it to be clearly meaningful. For example,
to say that “Brazil has comparative advantage in carp farming” is vague; to say that
“among all the possible freshwater aquaculture species, Brazil has comparative advantage
in carp farming” is a bit clearer; and to say that “among all the possible freshwater
aquaculture species and relative to other Latin American countries, Brazil has
comparative advantage in carp farming” is the most precise.
4
While it is difficult to precisely define what comparative advantage is, an alternative
way to appreciate the concept of comparative advantage is to understand what it implies.
Following the original concept of comparative advantage, to say that a country has
comparative advantage in one goods implies that this country would have higher
specialization in this goods under free trade than in autarky. Following a more general
concept of comparative advantage, to say that a country has comparative advantage in
one product implies that it is welfare improving for this country to allocate relatively
more of its resources to producing this product than a typical country does. Similarly, to
say that a person has comparative advantage in doing something implies that it is more
efficient for him or her to specialize more in this activity than an average individual does.
In sum, comparative advantage is a concept characterizing resource allocation and
specialization patterns.
From an equilibrium point of view, the concept of comparative advantage
characterizes equilibrium specialization patterns in the long run. For example, observing
the lasting pattern that shrimp exports from Latin America and Southeast Asia have
relatively high specialization in the US and Japan markets respectively, one can say that
shrimp producers in Latin America have comparative advantage in exporting to the US
market, while Southeast Asian shrimp producers have comparative advantage in
exporting to the Japan market.
From a dynamic point of view, the concept of comparative advantage explains
potential changes in specialization or trade patterns. For example, to say that an autarky
country has comparative advantage in one goods implies that under free trade this
country has tendency to increase specialization in that goods and export it. In light of
abundant yet underexploited aquaculture resources in Sub-Saharan Africa, to say that
Sub-Saharan African countries have comparative advantage in aquaculture implies that it
is welfare-improving for these countries to promote aquaculture development.
Both the equilibrium and dynamic aspects of comparative advantage provide useful
information: While the former reflects a country’s optimal specialization pattern in the
long run, the latter indicates its short-term development priorities. It should be noted that
“equilibrium” is always relative because under the influence of many changing factors,
comparative advantage can hardly be invariant over time.
5
Comparative advantage reflects the difference between benefits and (opportunity)
costs. A country can gain comparative advantage in an activity from an increase in the
benefits provided by this activity or a decline in its opportunity costs. Therefore,
comparative advantage depends on both demand-side factors (mainly consumer
preferences) and supply-side factors (mainly resource endowments and technologies);2
and a country’s comparative advantage in one activity is not only determined by its
competitiveness in this activity but also by its competitiveness in alternative activities.
It is worth clarifying some common confusion between “comparative advantage” and
“competitiveness” or “competitive advantage”. There is no unanimous agreement on the
exact definitions and the usage of these three terms. Competitiveness is usually
synonymous with a country’s (or firm’s) long-term performance (Buckley et al. 1988).
For example, in the “constant market share” (CMS) literature (see e.g., Bowen and
Pelzman, 1984; Chen et al., 2000; Richardson, 1971a, b), a country’s competitiveness in
a market is measured by its market share; the larger market share a country controls, the
greater its competitiveness in that market would be. However, there have been
controversies over whether it is meaningful to talk about the competitiveness of nations
(Krugman 1994; Yap 2004). In response to concerns that the US may lose from
international competition under free trade, some trade economists argue that it is
inappropriate to view each nation “like a big corporation competing in the global
marketplace”; rather, international trade is “not a zero-sum game” but one that allows all
the players to gain from exploiting their respective comparative advantages (Krugman,
1994). Competitive advantage usually refers to a country’s (or firm’s) characteristics that
give it competitive edge to enhance its competitiveness (Porter, 1990). While competitive
advantage and comparative advantage are often used synonymously, they are sometimes
used in parallel for denoting different concepts. For example, in some empirical studies
(e.g. Siggel and Ssemogerere, 2000; Kannapiran and Fleming, 1999; Warr, 1994; USAID
1996, 1999a-f, 2000a, b), competitive advantage is used to measure profitability under
“market” prices that could be distorted by policy or other non-market forces, while
2 Oftentimes when one uses the term “comparative advantage”, what he or she means are actually the sources of comparative advantage. For example, while it is convenient to say that “low-cost labor is developing countries’ comparative advantage”, the exact meaning of this statement is “low cost labor is a source of developing countries’ comparative advantage in labor-intensive goods”.

6
comparative advantage is used to reflect profitability under “shadow” prices that reflect
the social value of resources.
To avoid such semantic confusion, which may continue to exist for some time,
authors should clearly define how they use those three terms; and readers are also
responsible for respecting the authors’ “freedom” in terminology. For example, in our
recent study (Cai and Leung, 2005), we follow the CMS literature using market share to
measure a country’s “competitiveness” in exporting shrimps to each of the three major
international markets (i.e., Japan, the US and the EU), and the “revealed comparative
advantage” literature using RCA indices to measure a country’s shrimp export
“comparative advantage” in the three markets. Thus, we essentially use
“competitiveness” to reflect countries’ shrimp export performance in a market in the
same spirit as “absolute advantage”, and use “comparative advantage” to compare their
export structures (i.e., their differences in specialization among the three markets). For
example, as a major shrimp farming country, Thailand tends to have large market shares
and hence great competitiveness in all the three markets. However, the magnitude of its
competitiveness tends to be different for each market, which reflects the differences
between its shrimp export structure and that of other countries. Comparative advantage is
to capture such differences. In short, the more specialized a country is in a market
compared to other countries, the greater comparative advantage it has in it.
3. Comparative advantage in aquaculture: an assessment framework
Comparative advantage can be used as a descriptive (or positive) concept to provide “a
basic explanation of the international pattern of specialization in production and trade”
(UNIDO, 1986, p.1). On the other hand, it also “plays an important role in prescriptive
(or ‘normative’) economics” by “providing guidelines for government policies on
resource allocation and trade” (ibid). Thus, assessing a country’s comparative advantage
in different aquaculture activities can provide useful information for decision makings
regarding efficient resource allocation in aquaculture development.
There are two complementary approaches for comparative advantage assessment in
the literature. One is the “domestic resource costs” (DRC) approach; the other is the
“revealed comparative advantage” (RCA) approach.

7
Domestic resource costs (DRC)
In brief, the DRC approach uses social profitability to measure comparative advantage;
the greater the profitability, the stronger the advantage (Monke and Pearson, 1989).
Specifically, country i’s comparative advantage in good j can be measured by a DRC
ratio:
fijij
dij
ij cpcDRC
−= , (1)
where dijc and f
ijc represent the costs of (domestic) non-tradable and tradable inputs for
country i to produce one unit of good j; and pij represents the price of good j.
With the numerator ( dijc ) and denominator ( f
ijij cp − ) measuring respectively country
i’s domestic opportunity costs and value-added in producing good j, the DRC ratio is an
inverse measure of its social profitability in the production. Specifically, 1<ijDRC
indicates that the production of good j is socially profitable in country i in the sense that
domestic resources allocated to the production have generated greater value-added than
their domestic costs. In contrast, 1>ijDRC indicates that resources have been
inefficiently allocated to producing j in the sense that the value-added is less than the
opportunity costs of these resources.
Therefore, 1<ijDRC reflects country i’s “comparative advantage” in good j in the
sense that country i can increase its welfare through allocating more resources to
producing good j. On the other hand, 1>ijDRC reflects country i’s “comparative
disadvantage” in good j in that resources should be shifted from this sector to other more
profitable uses. In general, the smaller (or greater) the DRC ratio is, the greater (or the
smaller) the comparative advantage would be.
It should be noted that social profitability needs to be gauged under “shadow” instead
of market prices. As opposed to observable market prices, shadow prices are “social”
prices reflecting the value of social benefits or costs. For example, a country’s high
profitability in aquaculture may not reflect efficient resource utilization, but could result
from direct or indirect government interventions artificially lowering the production costs

8
or raising the output prices. Therefore, using distorted market prices to measure
profitability tends to result in a “false” indication of comparative advantage or
disadvantage; and shadow prices, which measure the true or social value of production
costs and revenues, should be used in calculating DRC ratios for comparative advantage
assessment.
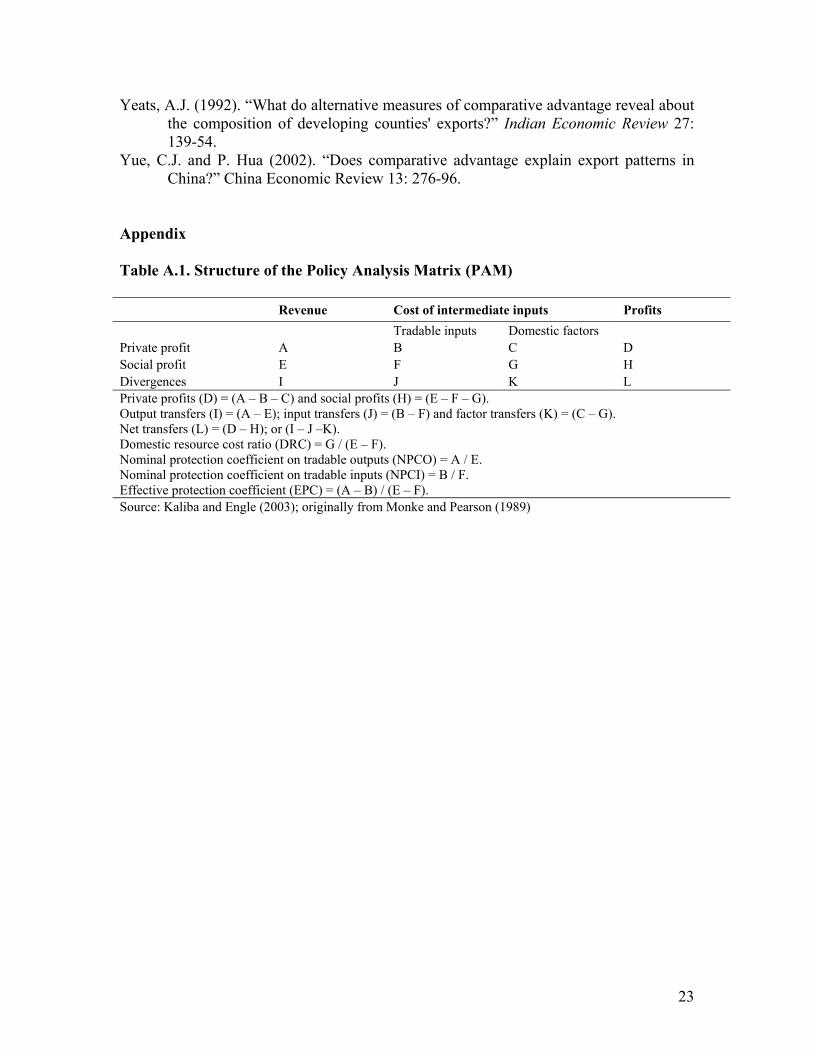
Empirical DRC analyses are often conducted based on the “Policy Analysis Matrix”
(PAM), 3 which is a standard apparatus for policy decision-makings (Monke and Pearson,
1989) and used widely in comparative advantage assessment related to agriculture
commodities (USAID 1996, 1999a-f, 2000a, b). We will review several aquaculture-
related DRC analyses (Ling et al., 1999; Lee et al., 2003; Kaliba and Engle, 2003; Cruz-
Trinidad, 1994) in detail in a later section.
Revealed comparative advantage (RCA)
While the DRC approach uses social profitability to measure comparative advantage, the
“revealed” comparative advantage (RCA) approach uses ex post specialization patterns to
infer comparative advantage patterns; i.e., a country’s actual high specialization in an
activity implies that it has strong comparative advantage in that activity (Balassa, 1965).
It is called “revealed” (as opposed to actual) comparative advantage because rather than
reflecting true comparative advantage, high specialization could reflect the influence of
policy interventions or other distortions such as tariffs or other trade barriers.
Based on the basic concept of revealed comparative advantage, many different RCA
indices have been suggested (Bowen, 1983; Yeat, 1985; Vollrath, 1991; Lafay, 1992;
Memedovic, 1994); yet the one most widely adopted in empirical studies remains to be
the standard Balassa’s RCA index (Balassa, 1965):
i
ijij s
sRCA = , (2)
where ∑=i
ijijij XXs / is the ratio between country i’s export of goods j (denoted as ijX )
and the world export of goods j; and ∑∑=ji
ijj
iji XXs,
/ is the ratio between country i’s
total exports and the total exports of the entire world. 3 An example PAM is presented in the Appendix.
9
According to the definition in equation (2), ijRCA measures country i’s comparative
advantage in goods j by comparing its competitiveness in market j (measured by its share
in the market) to its total export competitiveness (measured by its share in the entire
world export market).4 1>ijRCA , which indicates that country i’s share in market j is
greater than its share in the world market, implies that the country is relatively more
competitive in market j than in other markets and hence has a “revealed” comparative
advantage in goods j. Conversely, 1<ijRCA implies that country i is less competitive in
market j than in other markets and hence has a “revealed” comparative disadvantage in
goods j.
It is not difficult to verify that Balassa’s RCA index can be equivalently defined in
another form as
j
ijij c
cRCA = , (3)
where ∑=j
ijijij XXc / is the ratio between country i’s export of goods j and its total
export; and ∑∑=ji
iji
ijj XXc,
/ is the ratio between the world export of goods j and the
total world export. According to this definition, 1>ijRCA indicates that country i’s
export specialization in goods j (measured by ijc ) is higher than the world average
(measure by jc ), which implies that (compared to other countries) country i has allocated
relatively more of its resources to good j and hence reveals its comparative advantage in
it. Conversely, 1<ijRCA indicates that country i has below-averaged specialization and
hence comparative disadvantage in goods j.
Following the basic methodology of using specialization patterns to infer comparative
advantage patterns, many RCA indices can be constructed to compare countries’
specialization patterns in many activities (Richardson and Zhang, 1999). Beyond the
standard application of the RCA approach to compare countries’ comparative advantage
in exporting different products, it can also be applied to assess countries’ comparative 4 According to the “constant market share” (CMS) literature (e.g., Bowen and Pelzman, 1984; Chen et al., 2000; Richardson, 1971a, b), a country gaining (or losing) market share is considered increasing (or reducing) its competitiveness in the market.
10
advantage in exporting differentiated products under the same species or same products
to different markets. We will review several aquaculture-related RCA analyses (Ling et
al., 1996; Traesupap et al., 1999; Cai and Leung, 2005; Cai et al., 2005) in detail later.
DRC and RCA: merits and limitations
The DRC and RCA approaches are complementary and have respective merits and
limitations. Their proper application can provide useful information for both business and
policy decision-makings.
The DRC approach uses social profitability to measure comparative advantage from
the dynamic point of view. That is, more resources should be allocated to producing
goods with a below-unity DRC ratio (i.e., positive social profitability); and fewer
resources should be allocated to those with an above-unity DRC ratio (i.e., negative
social profitability). Such direct policy implications are the main appeal of the DRC
approach. However, two limitations of its application need to be cautioned.
It should be stressed that short-term dynamic comparative advantage indicated by a
low DRC ratio is not necessarily consistent with comparative advantage in the long run.
For example, a low DRC ratio may merely reflect transitory comparative advantage
derived from temporary absence of forthcoming competition. Therefore, applying DRC
ratios dogmatically yet neglecting the dynamic nature of the comparative advantage or
disadvantage they indicate could result in misleading policy recommendations. One way
to avoid this problem is to conduct sensitivity analysis to examine social profitability
under different scenarios and let decision-makers themselves decide which scenario is
most applicable.
Another problem of the DRC approach is methodological. Recall that when
calculating DRC ratios, the costs of production need to be valued under shadow prices.
However, the problem is that the actual cost structure is influenced not by shadow (input)
prices but by actual prices. For example, when feed prices are distortedly kept at a low
level, aquaculturists would tend to adopt more feed-intensive production systems. Then,
when feeds are valued under shadow prices, those species that react to the artificial low
feed prices more significantly would be more likely to have seemingly comparative
“disadvantage”, even though they could actually be socially efficient were farmers’

11
behaviors not distorted by the non-market feed prices in the first place. One way to avoid
such biases is to compute social profitability based on an econometrically estimated
production function rather than simply applying shadow prices to the actually observed
cost structure.
While unavailability of data is a major constraint to empirical application of the DRC
approach, the RCA approach is less data-demanding. The spirit of the RCA approach is
to infer comparative advantage patterns through systematically comparing specialization
patterns; i.e., a country’s relatively high specialization (compared to other countries) in
one species reveals its comparative advantage in that species.
However, a well-recognized limitation of the RCA approach is that high
specialization may not reveal true comparative advantage but result from policy or other
distortions (Balassa 1965). One way to mitigate this problem is to examine specialization
patterns in time series rather than merely at a point in time.
Another limitation of the RCA approach is that it does not have straightforward
policy implications. A country’s high RCA index in one species indicates that it has
comparative advantage in this species and hence has devoted relatively more of its
resources to it. However, it is unclear whether the observed high specialization level is
already optimal, still not high enough, or already excessive. Conversely, a low RCA
index may not indicate comparative disadvantage but could reflect comparative
advantage being unexploited. Therefore, once again, it is important to examine RCA
indices over time rather than at a point of time.
Notwithstanding these limitations, the RCA approach can still be very useful since it
provides a systematic framework for comparing specialization patterns across countries.
Such comparisons can allow young aquaculture countries to learn from the lessons and
experience of those at more advanced stages. In the era of globalization, information
about the global comparative advantage pattern can be invaluable to designing
development strategies at both national and farm levels.
4. Aquaculture-related DRC and RCA studies: a brief review
There are an entire body of studies applying the DRC approach (e.g., Masters 1995;
Monke and Pearson 1989; Pearson and Meyer 1974; USAID 1996, 1999a-f, 2000a, b;
12
and Yao 1997) or the RCA approach ( e.g., Baldwin 1971; Bender and Li 2002; Bojnec
2001; Bowen and Pelzman 1984; Donges and Riedel 1977; Ferto and Hubbard 2003;
Havrila and Gunawardana 2003; Hiley 1999; Maule 1996; Memedovic 1994; UNIDO
1982, 1985, 1986; Wolter 1977; Yeats, 1992; and Yue and Hua 2002) to assessing
comparative advantage (or competitiveness) in agriculture or manufacturing products.
However, aquaculture-related applications are limited. In the following we will review
four aquaculture-related studies applying the DRC approach and another four applying
the RCA approach.
A study by Ling et al. (1999) applied the DRC approach to examine Asian countries’
comparative advantage in shrimp exports. Since data availability allowed them to
compute DRC ratios for shrimp products categorized according to production systems
(i.e., intensive, semi-intensive, and extensive) and destination markets (i.e., Japan, the
US, and the EU), they are able to compare these ratios by countries, markets, and
production systems for information about Asian countries’ comparative advantage in
specific shrimp farming activities, which provides a good example of the flexibility of the
DRC approach.
While the authors focused on comparing shrimp producers’ competitiveness, the
DRC ratios they computed also exposed some interesting issues regarding resource
allocation.5 For example, one of their main findings is that “nearly all the Asian shrimp
producers have a larger comparative advantage in exporting shrimp to Japan than to the
US and the EU markets, largely because of the premium price received in the Japanese
market”. However, the questions remain why such a pattern exists and what it implies.
Since a basic hypothesis is that resource reallocation under free market mechanism would
tend to equalize the profitability of different shrimp farming activities, it would be
interesting to find out whether there are certain constraints (e.g., technology, market
access, funding, etc.) preventing countries from allocating their shrimp farming resources
more efficiently to exploit their relatively large comparative advantage in shrimp exports
to Japan. A similar example is regarding production systems. As the results in Ling et al.
5 DRC ratios can measure both competitiveness and comparative advantage. Low DRC ratios indicate large profit margins. From the point of view of competition, large profit margins are a sign of strong competitiveness. From the point of view of resource allocation, large profit margins imply ample development potential.

13
(1999) indicate that the DRC ratio for the Philippines’ intensive shrimp farming was
much higher than its semi-intensive shrimp farming, shrimp farmers in the country may
be interested in finding out whether they have overlooked more resource-efficient and
hence profitable production systems. More importantly, policymakers should find out
whether there are distortions motivating shrimp farmers to adopt less resource-efficient
farming systems or constraints which do not allow them to switch system without
difficulty.
Another study by Lee et al. (2003) applied the DRC approach to examine the
competitiveness of eel aquaculture in Taiwan, Japan, and China. Data availability allows
them to compute DRC ratios over time, which make it possible to examine the dynamics
of comparative advantage. Although the focus of this study was on cross-countries
comparison of eel aquaculture competitiveness, its results also provide rich information
and raise several issues regarding comparative advantage and resource allocation.
In Table 3 of the paper we find that the eel farming DRC ratios have been on an
upward trend in all the three countries during most of the time in the 1990s, which is
consistent with the conjecture that profit margins tend to diminish as an industry becomes
mature. The results also indicate that Japan had comparative disadvantage in eel farming
for most of the 1990s, with DRC ratios greater than unity as well as negative private
profitability. This situation should alarm policymakers in Japan to consider whether and
how eel farming could be sustainable in the long run and if not, how the government can
help reallocate the resources to more efficient uses. Taiwan faced a similar situation,
mostly because of the competition from China. What made the situation even more
ominous for eel farmers in Japan and Taiwan is the fact that China’s eel DRC ratios were
still distant from the unity benchmark, which indicates its ample development potential in
eel farming. Interestingly, due to a significant decline in the price of tradable inputs
(mostly seed and feed), the eel DRC ratios in both Japan and Taiwan were below unity in
1999. This reflects the dynamic nature of comparative advantage revealed by DRC ratios.
Besides, it also emphasizes the importance of examining DRC ratios over time instead of
at a point in time.
Kaliba and Engle (2003) provided a case study using the Policy Analysis Matrix
(PAM) to examine the impact of market failures on the private and social profitability of

14
catfish farming in Chicot County, Arkansas. Unlike the foregoing two studies that use the
domestic market prices of non-tradable inputs to compute DRC ratios, this study
demonstrates that significant divergences between market and shadow prices can exist
because of market failures and provides a good illustration of shadow price estimation.
Table 1 Policy Analysis Matrix for catfish farms in Chicot County, Arkansas 20011
Cost of tradable inputs Cost of factor of production
Size (ha) Mean acreage Revenue
Chemical Energy Overhead Feeds Labor Land Capital Net
profit
Private values2 <40 53 1.20 0.04 0.23 0.10 0.72 0.10 0.26 0.45 -0.69
40<81 136 1.24 0.06 0.17 0.11 0.73 0.20 0.09 0.35 -0.47 81<121 244 1.24 0.03 0.15 0.06 0.59 0.20 0.10 0.27 -0.17 121-202 378 1.32 0.03 0.17 0.05 0.66 0.21 0.10 0.24 -0.13 >202 869 1.48 0.01 0.21 0.05 0.60 0.21 0.06 0.16 0.18 Social values <40 53 2.50 0.04 0.23 0.10 1.00 0.11 0.50 0.47 0.06
40<81 136 2.50 0.06 0.17 0.11 0.97 0.23 0.60 0.37 0.00 81<121 244 2.50 0.03 0.15 0.06 0.69 0.23 0.74 0.28 0.32 121-202 378 2.50 0.03 0.17 0.05 0.67 0.24 0.94 0.25 0.16 >202 869 2.50 0.01 0.21 0.05 0.56 0.24 0.80 0.17 0.47
Divergences <40 53 -1.30 0.00 0.00 0.00 -0.28 -0.01 -0.24 -0.02 -0.75 40<81 136 -1.26 0.00 0.00 0.00 -0.24 -0.03 -0.51 -0.02 -0.47
81<121 244 -1.26 0.00 0.00 0.00 -0.09 -0.03 -0.64 -0.01 -0.49 121-202 378 -1.18 0.00 0.00 0.00 -0.01 -0.03 -0.84 -0.01 -0.29 >202 869 -1.02 0.00 0.00 0.00 0.04 -0.03 -0.73 -0.01 -0.29
Notes: 1. Price and cost values are in nominal terms and presented in $/kg. 2. Cost calculations are based on Chicot County catfish farms survey data
Source: Kaliba and Engle (2003)
The results of Kaliba and Engle (2003) show that while catfish farming in the region
had negative profits under market prices, its social profitability under shadow prices is
positive with below-unity DRC ratios. As shown in Table 1, the market prices of live
catfish in the US during 2001 were below 1.5 $/kg, under which most of catfish farming
in Chicot County had negative private profits. However, when the distortions on the
catfish output prices (alleged to be caused by dumping) and production costs (caused by
implicit subsidies) are accounted for, the shadow prices of catfish would be 2.5 $/kg; and
the shadow value of production costs would be higher as well. However, under these
shadow output prices and production costs, catfish farming in Chicot County would have
had positive social profits (i.e. their DRC ratios less than unity). Table 1 also shows that
large-scale catfish farming in the region tends to be more socially profitable, which raises

15
the question whether there are constraints (e.g., lack of funding sources) hindering more
efficient resource utilization.
Cruz-Trinidad (1994) applied the DRC approach to examine the comparative
advantage of three types of (penaeid) shrimp farming (i.e., extensive, semi-intensive, and
intensive) in the Philippines. This paper provides a detailed demonstration of the
empirical procedure of the DRC approach, which mainly includes “conversion of
financial cost to economic cost” (i.e., shadow price estimation), “disaggregation of
economic cost into its domestic and foreign components”, and “translation of imported
inputs into its border prices”. In particular, the author calculated the “adjusted” DRC
ratios that account for environment externalities as implicit domestic resource costs of
shrimp farming. The results show that the Philippines had comparative advantage in
shrimp farming even when environmental costs were accounted for; and the advantage
was the greatest for the semi-intensive farming system and the smallest for the extensive
system. The author mentioned that currency devaluation has helped the Philippines
preserve its comparative advantage in shrimp farming when shrimp prices started going
down. This raises the issue that whether such comparative “advantage” due to cheap
currency is a true advantage or merely a result of government promoting or protecting
export-oriented industries through currency devaluation. The answer perhaps depends on
whether the devaluation is permanent or transitory.
Now we switch to the RCA approach. Ling et al. (1996) applied the RCA approach to
assess the export performance of major cultured shrimp producers in the Japanese and US
markets. Based on the international trade statistics during 1989-1991, they computed the
RCA indices for 9 major cultured shrimp producers in the Japan and US markets
respectively. The results reveal countries’ comparative advantage in differentiated shrimp
export products (e.g., Taiwan’s strong comparative advantage in live shrimp export to
Japan and fresh shrimp export to the US; the Philippines’ strong advantage in
dried/salted/in brine shrimp export to Japan; Ecuador’s strong advantage in fresh/shell-on
shrimp export to the US, etc.). Identifying such comparative advantage patterns is only
the first step, what is more important is to understand the driving forces behind them. As
pointed out by Ling et al. (1996), Taiwan’s remarkable comparative advantage in live
shrimp export to Japan comes from its “well-established, integrated network of live

16
shipping, packing and transporting techniques and facilities”. Thus, other countries that
wish to develop similar comparative advantage would know where to spend their effort.
Similar to Ling et al. (1996), Traesupap et al. (1999) also applied the RCA approach
to assess major shrimp producers’ comparative advantage in exporting shrimps to Japan
and the US, yet they used more updated data (1991-1996) and considered more categories
of differentiated shrimp products.
Cai and Leung (2005) is our recent study applying the RCA approach to assessing
shrimp export comparative advantage. Instead of examining the comparative advantage
of shrimp producers in differentiated shrimp products, we were interested in their
comparative advantage in exporting shrimps to different markets. The main purpose of
this study is to demonstrate a systematic framework for comparative export performance
assessment. Methodologically, we use market share to measure a country’s
competitiveness in a market and identify “size advantage” and “comparative advantage”
as two contributing factors; the former captures the competitiveness due to a country’s
total export capacity, while the latter captures the competitiveness due to the degree of its
specialization in the market. We emphasized on examining the dynamics of comparative
advantage and developed a more accurate index for its measurement compared to the
common practice of directly using the difference between RCA indices at two points in
time to measure the comparative variation between them, which is not precise and could
cause misleading results.
Table 2 illustrates some results of this study. It shows that in the mid-1990s,
Southeast Asia as a whole has strong comparative advantage (i.e. RCA index greater than
unity) in exporting cultured shrimp to the Japan market, relatively weak advantage (i.e.
RCA index less than unity) to the US market, and the weakest advantage to the EU
market. This is not surprising considering the geographic proximity of the region to
Japan. However, the results show that the region has increased its comparative advantage
in the US market at the expenses of the other two markets between the mid-1990s and the
early-2000s. The results also indicate that 5 major shrimp farming countries in the region
(including Indonesia, Malaysia, the Philippines, Thailand, and Viet Nam) have different
comparative advantage patterns. For example, unlike the other four countries in the
region, Thailand had weak comparative advantage in the Japan market in the mid-1990s;

17
and the advantage has declined significantly between the mid-90s and the early-2000s.
Although Thailand was the only one with strong comparative advantage in the US
market, all of the five countries except the Philippines have increased their comparative
advantage in the US market; and the growth of Viet Nam was the most impressive. In the
EU market, Malaysia was the only one with strong comparative advantage, while
Indonesia and the Philippines have increased their comparative advantage. The RCA
indices and their dynamics are not the end but a means to systematically characterize
countries’ specialization patterns. More fruitful tasks would be to uncover the possible
underlying causes of these patterns and their implications.
Table 2. Cultured shrimp export RCA and RCA dynamics of 5 Southeast Asian countries
RCA indices in Japan RCA indices in the US RCA indices in the EU
Countries Initial (Mid-90s)
Variation (Mid-90s to early-2000s)
Initial (Mid-90s)
Variation (Mid-90s to early-2000s)
Initial (Mid-90s)
Variation (Mid-90s to early-2000s)
Indonesia 2.4 -0.37 0.3 0.03 0.2 0.41
Malaysia 1.0 0.17 0.1 0.09 2.5 -0.21
Philippines 2.3 0.21 0.3 -0.04 0.0 0.19
Thailand 0.9 -0.22 1.1 0.23 0.7 -0.42
Viet Nam 1.9 -0.54 0.2 0.59 0.3 0.03
Southeast Asia 1.4 -0.17 0.8 0.15 0.6 -0.17
Source: Cai and Leung (2005)
In another recent study (Cai et al., 2005), we applied the RCA approach to examine
the comparative advantage of Asian, Latin American, and Sub-Saharan countries’
comparative advantage in the farming of three major freshwater aquaculture species (i.e.,
carp, catfish, and tilapia). Our purpose is to provide a systematic assessment of these
countries specialization patterns regarding those three species. Due to lack of applicable
trade data, we use production data for this assessment; hence such “production”
comparative advantage would be different from the conventional “trade” comparative
advantage revealed by trade specialization patterns. The main difference is that a
country’s production serves both domestic and foreign markets. Thus, it is possible that
even when a country has relatively high specialization in farming one species, its trade
specialization in this species could be low if most of the production are consumed
domestically. Comparing “trade” comparative advantage is more straightforward than
comparing “production” comparative advantage because while countries face similar

18
conditions in the international trade markets, the conditions in their domestic markets
could differ significantly. However, while trade specialization patterns reflect the export
performance of different species (i.e., their ability to earn foreign exchanges), production
specialization patterns provide more general information about the importance of
different species regarding economic development.
5. Summary
Originally introduced to explain the benefits of international trade, comparative
advantage has become a powerful concept widely applied to address development issues.
In the context of aquaculture development, policymakers in a country always want to
know about the country’s comparative advantages in aquaculture so that they can design
proper policies to foster these advantages into sustainable competitiveness. Information
about comparative advantage is also important for individual aquaculturists to devote to
promising aquaculture activities and avoid untenable enterprises.
There are two approaches for comparative advantage assessment. The DRC approach
uses social profitability to measure comparative advantage; i.e., the higher the social
profitability, the stronger the comparative advantage, while the RCA approach uses
observed specialization patterns to reveal comparative advantage patterns; i.e., high
specialization reveals strong comparative advantage.
The purpose of these two approaches is to provide systematic information for policy
guidance; such information should be correctly understood and used with discretion in
policy decision-making regarding aquaculture development.
DRC ratios can provide information about the true economic viability and resource
utilization efficiency of aquaculture activities, which is useful for determining
aquaculture development priority. Other things being equal, priority should be given to
aquaculture activities with relatively low DRC ratios because such activities not only use
domestic resources more efficiently, but also tend to be more economically viable due to
their relatively larger profit margins. However, it should be borne in mind that the
comparative advantage reflected by low DRC ratios may be transitory and unsustainable
in the long run. On the other hand, regarding an aquaculture activity with high DRC
ratios (i.e., low social profitability), the proper policy reaction is not to simply give it a

19
low development priority, but to identify the underlying causes of such low profitability
and help improve it.
While the DRC approach should be used with discretion, the application of the RCA
approach is more of an art. It should be borne in mind that RCA indices use relative
specialization level to measure “revealed” comparative advantage. While a country’s
high RCA index in one aquaculture activity indicates the importance of this activity to its
aquaculture development, it does not necessarily imply that the country should further
promote the activity since the high specialization may already be optimal. Indeed, DRC
analysis should be applied to make sure that a country’s high revealed comparative
advantage does not reflect over commitment of resources beyond the efficient level of
allocation. The dynamics of a country’s RCA pattern would be highly informative since it
reveals the country’s special features in aquaculture development. Comparing its own
RCA dynamics to other countries’ experience can help a country to determine whether its
aquaculture development properly reflects its underlying comparative advantage. RCA
analysis is especially useful for a country whose aquaculture development is still at its
“infancy” stage. When designing its aquaculture development strategy, this country can
learn from the comparative advantage patterns of other countries with similar resource
endowments yet more advanced aquaculture development. Understanding the driving
forces behind these patterns and their transition can help the country avoid making
similar mistakes and design a more sensible aquaculture development blueprint.

20
References Aguilar-Manjarrez, J. and S.S. Nath (1998). “A strategic reassessment of fish farming
potential in Africa,” CIFA Technical Paper No. 32. Rome Balassa, B. (1965). “Trade liberalization and "reveal" comparative advantage,”
Manchester School of Economic and Social Studies 33: 92-123. Baldwin, E.R. (1971). “Determinants of the Commodity Structure of US Trade,”
American Economic Review 61: 126-146. Bender, S. and K.W. Li (2002) “The changing trade and revealed comparative advantages
of Asian and Latin American manufacture exports,” Yale Economic Growth Center Discussion Paper 843.
Bojnec, S. (2001). “Trade and revealed comparative advantage measures: regional and Central and East European agricultural trade,” Eastern European Economics 39: 72-98.
Bowen, H.P. (1983). “On the theoretical interpretation of indices of trade intensity and revealed comparative advantage,” Weltwirtschaftliches Archiv 119: 464-72.
Bowen, H. and J. Pelzman (1984). “US export competitiveness: 1962-77,” Applied Economics 16: 461-73.
Buckley, P.J., Pass, C.L., and K. Prescott (1988). “Measures of international competitiveness: a critical survey,” Journal of Marketing Management 4: 175-200.
Cai, J. and P.S. Leung (2005). “Export Performance of Frozen Cultured Shrimp in the Japan, US and EU markets: A Global Assessment,” unpublished manuscript.
Cai, J., Leung, P.S., and N. Hishamunda (2005). “Comparative advantage in aquaculture: an assessment framework,” Report submitted to Food and Agriculture Organization of the United Nations.
Chen, K., Xu, L. and Y. Duan (2000). “Ex-post competitiveness of china’s export in agri-food products: 1980-96,” Agribusiness 16: 281-294.
Cruz-Trinidad, A. (1994). “Modifying domestic resource cost to reflect environmental cost of shrimp farming in the Philippines,” in L.M. Chou et al., ed., The Third Asian Fisheries Forum. Asian Fisheries Society, Manila, Philippines.
Donges, J. and J. Riedel (1977). “The expansion of manufactured exports in developing countries: An empirical assessment of supply and demand issues,” Weltwirtschaftliches Archiv 113: 58-85.
FAO (2002). The State of World Fisheries and Aquaculture (SOFIA 2002). Rome, FAO. FAO (2004). The State of World Fisheries and Aquaculture (SOFIA 2004). Rome, FAO. Ferto, I. and L.J. Hubbard (2003). “Revealed comparative advantage and competitiveness
in Hungarian Agri-food Sectors,” World Economy 26: 247-59. Havrila, I. and P. Gunawardana (2003). “Analyzing comparative advantage and
competitiveness: an application to Australia's textile and clothing industries,” Australian Economic Papers 42: 103-17.
Hiley, M. (1999). “The dynamics of changing comparative advantage in the Asia-Pacific region,” Journal of the Asia Pacific Economy 4: 446-76.
Kaliba, R. and C.R. Engle (2003). “Impact of different policy options on profits of private catfish farms in Chicot County, Arkansas,” Aquaculture Economics and Management 7:309-318.

21
Kannapiran, C.A. and E.M. Fleming (1999). “Competitiveness and comparative advantage of tree crop smallholdings in Papua New Guinea,” Working Paper Series (No. 99-10) in Agricultural and Resource Economics, University of New England.
Kapetsky, J.M. (1994). “A strategic assessment of warm-water fish farming potential in Africa,” CIFA Technical Paper No. 27, FAO, Rome.
Kapetsky, J.M. and S.S. Nath (1997). “A strategic assessment of the potential for freshwater fish farming in Latin America,” COPESCAL Technical Paper No. 10, FAO, Rome.
Krugman, P. (1994). “Competitiveness: a dangerous obsession,” Foreign Affairs 73: 28–44.
Lafay, G. (1992). “The measurement of revealed comparative advantages,” in M.G. Dagenais and P.A. Muet eds., International Trade Modeling. London: Chapman & Hill.
Lee, W.C., Chen, Y.H., Lee, Y.C., and I.C. Liao (2003). “The competitiveness of the eel aquaculture in Taiwan, Japan, and China,” Aquaculture 221: 115-124.
Ling, B.H., Leung, P.S. and Y.C. Shang (1999). “Comparing Asian shrimp farming: the domestic resource cost (DRC) approach,” Aquaculture 175: 31-48.
Ling, B.H., Leung, P.S. and Y.C. Shang (1996). “Export performance of major cultured shrimp producers in the Japanese and US markets,” Aquaculture Research 27: 775-785.
Masters, W.A. (1995). Guidelines on national comparative advantage and agricultural trade. Agricultural Policy Analysis Project, Phase III, Methods and Guidelines, No. 2001, USAID, Washington, D.C.
Maule, A. (1996). “Some implications of AFTA for Thailand: a revealed comparative advantage approach,” ASEAN Economic Bulletin 13: 14-38.
Memedovic, O. (1994). On the Theory and Measurement of Comparative Advantage: An Empirical Analysis of Yugoslav Trade in Manufactures with the OECD Countries, 1970-1986. Amsterdam: Thesis.
Monke E.A. and S.R. Pearson (1989). The Policy Analysis Matrix for Agricultural Development. Cornell University Press.
Pearson, S.R. and R.K. Meyer (1974). “Comparative advantage among African coffee producers,” American Journal of Agricultural Economics 56: 310-313.
Porter, M. (1990). The Competitive Advantage of Nations. New York: The Free Press. Richardson, D. and C. Zhang (1999). “Revealing comparative advantage: Chaotic or
coherent patterns across time and sector and US trading partner?” NBER Working Paper 7212.
Richardson, J.D. (1971a). “Constant-market-shares analysis of export growth,” Journal of international economics 1: 227-39.
Richardson, J. D. (1971b). “Some sensitivity tests for a ‘constant-market-shares’ analysis of export growth,” Review of Economics and Statistics 53: 300-04.
Samuelson, P.A. (1969). "The way of an economist," in P.A. Samuelson, ed., International Economic Relations: Proceedings of the Third Congress of the International Economic Association. London: Macmillan.

22
Siggel, E., and G. Ssemogerere (2000). “Uganda's policy reforms, industry competitiveness and regional integration: a comparison with Kenya,” African Economic Policy Discussion Paper No. 24.
Traesupap, S., Matsuda, Y., and H. Shima (1999) “Diversification of Shrimp Products in the Japanese and US Markets during the 1990s,” Aquaculture Economics and Management 3:167-75.
UNIDO (1982) Changing Patterns of Trade in World Industry. New York, United Nations.
UNIDO (1985). Industry in the 1980s: Structural Change and Independence. New York, United Nations.
UNIDO (1986). International Comparative Advantage in Manufacturing: Changing Profiles of Resources and Trade. Vienna: Author.
USAID (1996). Comparative cost of production analysis in East Africa: Implications for competitiveness and comparative advantage.
USAID (1999a). “Comparative economic advantage in agricultural trade and production in Malawi,” SD Publication Series: Technical Paper No. 93, 1999.
USAID (1999b). “Regional agriculture trade and changing comparative advantage in South Africa,” SD Publication Series: Technical Paper No. 94, 1999.
USAID (1999c). “Analyzing comparative advantage of agricultural production and trade options in Southern Africa: Guidelines for a unified approach,” SD Publication Series: Technical Paper No. 100.
USAID (1999d). “Analysis of the comparative economic advantage of alternative agricultural production options in Tanzania,” SD Publication Series: Technical Paper No. 102, 1999.
USAID (1999e). “Comparative economic advantage of alternative agricultural production options in Swaziland,” SD Publication Series: Technical Paper No. 103, 1999.
USAID (1999f). “Comparative economic advantage of alternative agricultural Production activities in Zambia,” SD Publication Series: Technical Paper No. 104, 1999.
USAID (2000a). “Comparative economic advantage of crop production in Zimbabwe,” SD Publication Series: Technical Paper No. 99.
USAID (2000b). “Analysis of comparative advantage and agricultural trade in Mozambique,” SD Publication Series: Technical Paper No. 107.
Vollrath, L.T. (1991). “A theoretical evaluation of alternative trade intensity measures of revealed comparative advantage,” Weltwirtschaftliches Archiv 127: 265-279.
Warr, P.G. (1994). “Comparative and competitive advantage,” Asia-Pacific Economic Literature 8: 1-14.
Wolter, F. (1977). “Factor proportion, technology and West German industry’s international trade patterns,” Weltwirtschaftliches Archiv 113: 251-267.
Yao, S. (1997). “Comparative advantages and crop diversification: a Policy Analysis Matrix for Thai agriculture,” Journal of Agricultural Economics 48: 211-22.
Yap, J.T. (2004). “A note on the competitiveness debate,” Discussion Paper Series No. 2004-39, Philippine Institute for Development Studies.
Yeats, A.J. (1985). “On the appropriate interpretation of the revealed comparative advantage index: implications of a methodology based on industry sector analysis,” Weltwirtschaftliches Archiv 121: 61-73.
23
Yeats, A.J. (1992). “What do alternative measures of comparative advantage reveal about the composition of developing counties' exports?” Indian Economic Review 27: 139-54.
Yue, C.J. and P. Hua (2002). “Does comparative advantage explain export patterns in China?” China Economic Review 13: 276-96.
Appendix Table A.1. Structure of the Policy Analysis Matrix (PAM) Revenue Cost of intermediate inputs Profits Tradable inputs Domestic factors Private profit A B C D Social profit E F G H Divergences I J K L Private profits (D) = (A – B – C) and social profits (H) = (E – F – G). Output transfers (I) = (A – E); input transfers (J) = (B – F) and factor transfers (K) = (C – G). Net transfers (L) = (D – H); or (I – J –K). Domestic resource cost ratio (DRC) = G / (E – F). Nominal protection coefficient on tradable outputs (NPCO) = A / E. Nominal protection coefficient on tradable inputs (NPCI) = B / F. Effective protection coefficient (EPC) = (A – B) / (E – F). Source: Kaliba and Engle (2003); originally from Monke and Pearson (1989)