Embed Size (px)
Citation preview
Dr. Allen Hershkowitz Senior Scientist
Natural Resources
Defense Council
A Review of Waste to Energy & Recycling Take Back
Legislation
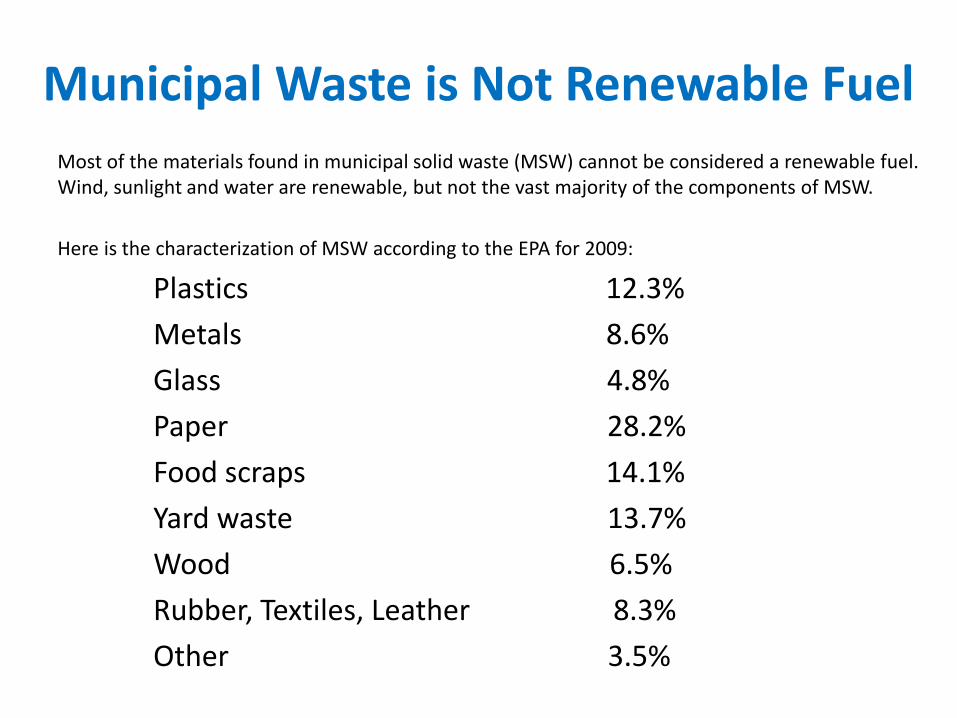
Municipal Waste is Not Renewable Fuel
Most of the materials found in municipal solid waste (MSW) cannot be considered a renewable fuel. Wind, sunlight and water are renewable, but not the vast majority of the components of MSW.
Here is the characterization of MSW according to the EPA for 2009:
Plastics 12.3%
Metals 8.6%
Glass 4.8%
Paper 28.2%
Food scraps 14.1%
Yard waste 13.7%
Wood 6.5%
Rubber, Textiles, Leather 8.3%
Other 3.5%
The Majority of MSW Should Be Recycled
About 75% - 80%, of the materials that make up MSW should be recycled for ecological and economic reasons.
The non-renewable petroleum, ores, minerals and other materials that comprise MSW, and that are refined and manufactured through polluting processes that rely on the use of fossil fuels, are not renewable fuels.
About 12% of all MSW is currently combusted in the U.S. for energy recovery, (as of 2009). Of that amount, NRDC would estimate that more than half of all the material being sent to existing combustors is either recyclable, compostable, non-renewable, or non-combustible. These materials should be diverted away from combustors through a process we call “fuel cleaning”.
Plastics (12.3% of MSW)
Plastics are petroleum and are not a renewable fuel.
Some are made from natural gas, and a small amount might be made from coal.
Although plastics contain about 12,000 Btus/lbs, they are fossil fuels and cannot be classified as a renewable energy source. Petroleum based plastics should be recycled.
Recycling one ton of plastics produces 100 times more jobs than combustion.
Metals (8.6% of MSW)
Metals are made from non-renewable ores and minerals.
They cannot be classified as a renewable fuel. Nor are they well suited for combustion.
Metals are low in Btus (300 Btus/lbs compared with 12,000 Btus/lbs for plastics) and should be recycled. It is as a secondary raw material at the manufacturing sector, not in a combustor, that metals provide the greatest energy benefit.
Recycling one ton of metals produces 1700 times more jobs than combustion.
Glass (4.8% of MSW)
Glass is manufactured using non-renewable fossil fuels, and is made from a non-renewable, albeit currently plentiful raw material.
Glass is also not ideally suited for energy recovery. It is not high in Btus, containing only 60 Btus/lbs. Glass should be recycled.
Recycling one ton of glass produces 785 times more jobs than combustion.
Paper (28.2% of MSW)
Paper, for many reasons other than those relating to energy calculations, should be recycled. We can debate whether all forests should be considered renewable, but certainly many that are being destroyed for paper making are ecologically rare and biologically irreplaceable.
The manufacture of paper involves the use of non-renewable energy, and pulp and paper mills are classified as a “major” source of hazardous air emissions by the EPA.
Most consumers would not consider as “renewable energy” or “environmentally preferable” a fuel whose production engenders the emission hazardous air pollutants (or wipes out vast tracts of natural forests, consuming more water than virtually any other industrial process). Paper should be recycled and should not be considered a renewable fuel.
Recycling one ton of paper produces 410 times more jobs than combustion.
Food Scraps (14.1% of MSW)
Food scraps that cannot be recovered for redistribution should be composted or sent to a sewage treatment plant.
They are high in moisture, not particularly high in Btus:
Plastics = 12,000 Btus/lbs
Food = 2,000 Btus/lbs VS. Paper = 7,200 Btus/lbs
Wood = 8,000 Btus/lbs
Food waste is also high in nitrogen, a GHG pollutant when emitted from waste combustors.
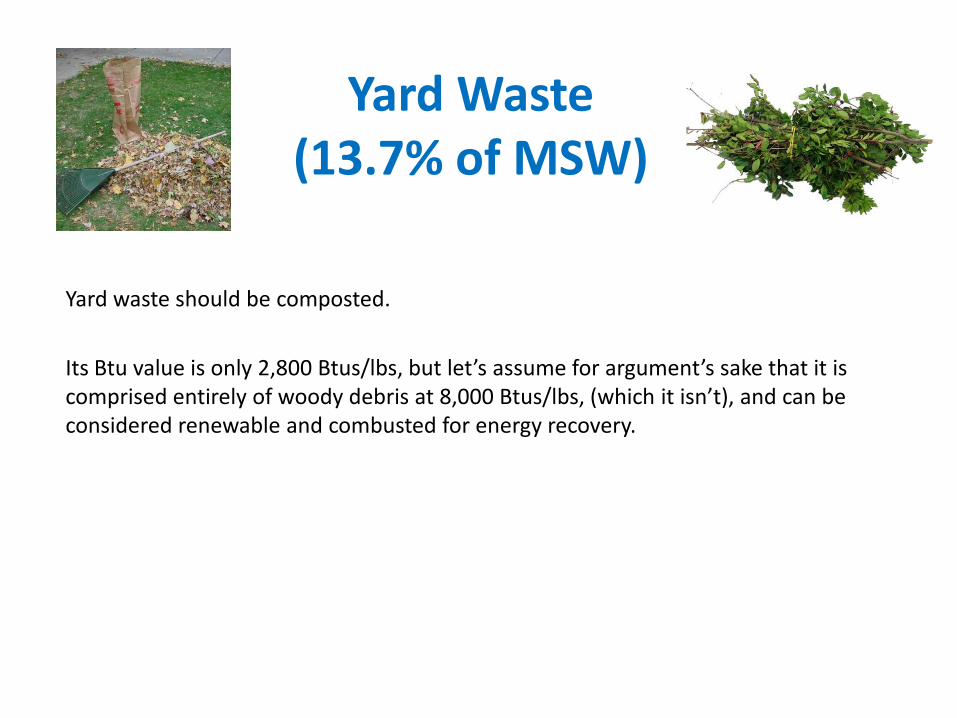
Yard Waste (13.7% of MSW)
Yard waste should be composted.
Its Btu value is only 2,800 Btus/lbs, but let’s assume for argument’s sake that it is comprised entirely of woody debris at 8,000 Btus/lbs, (which it isn’t), and can be considered renewable and combusted for energy recovery.
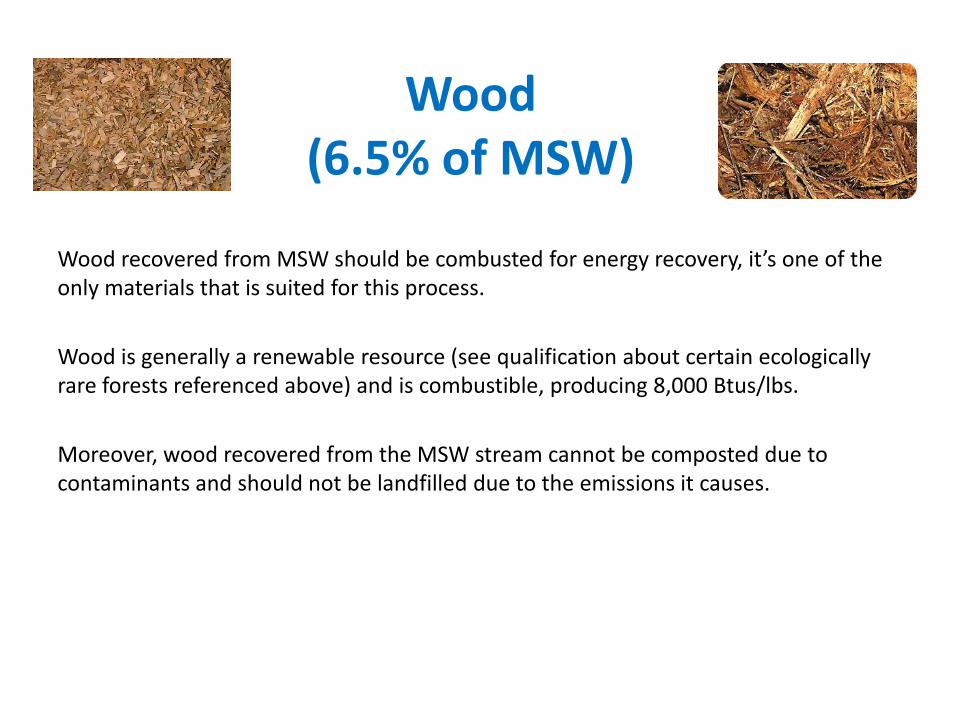
Wood (6.5% of MSW)
Wood recovered from MSW should be combusted for energy recovery, it’s one of the only materials that is suited for this process.
Wood is generally a renewable resource (see qualification about certain ecologically rare forests referenced above) and is combustible, producing 8,000 Btus/lbs.
Moreover, wood recovered from the MSW stream cannot be composted due to contaminants and should not be landfilled due to the emissions it causes.
Rubber, Textiles & Leather (8.3% of MSW)
Rubber, Textiles, and Leather are manufactured using fossil fuels and other non-renewable resources.
Given the nature of their manufacture, they cannot be considered a renewable fuel despite their high Btu value, ranging from 7,500 Btus/lbs (textiles and leather) to 10,000 Btus/lbs (rubber).
These materials should be recycled or composted, and the portion not recovered for recycling can be considered for combustion for energy recovery, but cannot be considered renewable fuel.
Recycling rubber and leather produces 920 times more jobs than combustion.
The Only Non-Recyclable Renewable Waste Options for Fuel
Wood and a portion of yard wastes are the only portions of the municipal waste stream that can be considered a non-recyclable renewable fuel.
If we inappropriately include all yard wastes in this category and correctly include all wood, they together total 20.2% of the waste stream (an over-estimate). That is why NRDC estimates that about 80% of the MSW stream is either recyclable, made from a non-renewable resource, or is otherwise not well suited for combustion due to low Btus (or a combination of all three).
NOTE: Even if we also unrealistically added in the entire 3.5% of the non-descript “other” category of MSW as being entirely a renewable material, combustible, and not recyclable, that would still only amount to 23.7% of the waste stream as being suitable for combustion, and that includes the assumption that all yard wastes should be combusted, none composted.
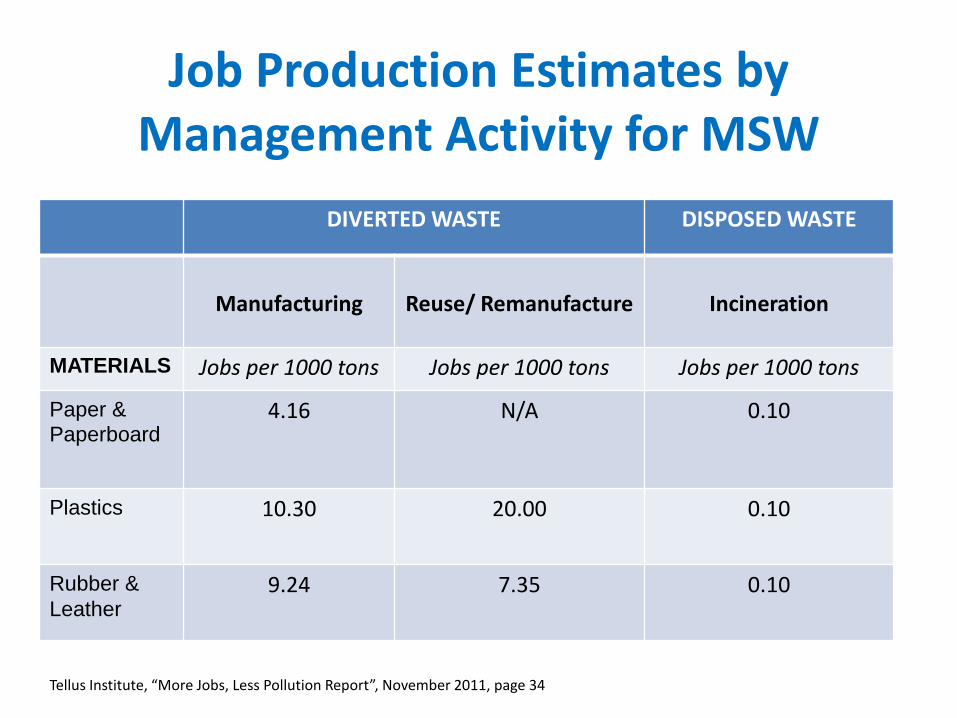
Job Production Estimates by Management Activity for MSW
DIVERTED WASTE DISPOSED WASTE
Manufacturing
Reuse/ Remanufacture
Incineration
MATERIALS Jobs per 1000 tons Jobs per 1000 tons Jobs per 1000 tons
Paper &
Paperboard 4.16 N/A 0.10
Plastics 10.30 20.00 0.10
Rubber &
Leather 9.24 7.35 0.10
Tellus Institute, “More Jobs, Less Pollution Report”, November 2011, page 34
Jobs Created by Recycling
Moving from the current 33% national recycling rate to a 75% national recycling rate would create 1.5 million new jobs.
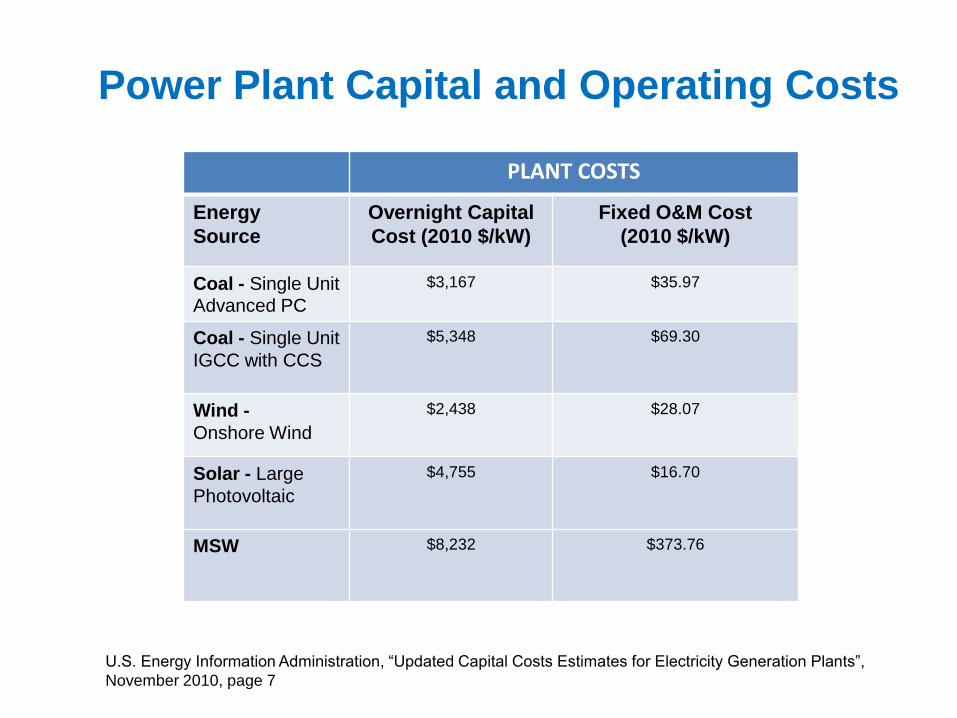
PLANT COSTS
Energy
Source
Overnight Capital
Cost (2010 $/kW)
Fixed O&M Cost
(2010 $/kW)
Coal - Single Unit Advanced PC
$3,167 $35.97
Coal - Single Unit
IGCC with CCS
$5,348 $69.30
Wind -
Onshore Wind
$2,438 $28.07
Solar - Large
Photovoltaic
$4,755 $16.70
MSW $8,232 $373.76
Power Plant Capital and Operating Costs
U.S. Energy Information Administration, “Updated Capital Costs Estimates for Electricity Generation Plants”,
November 2010, page 7
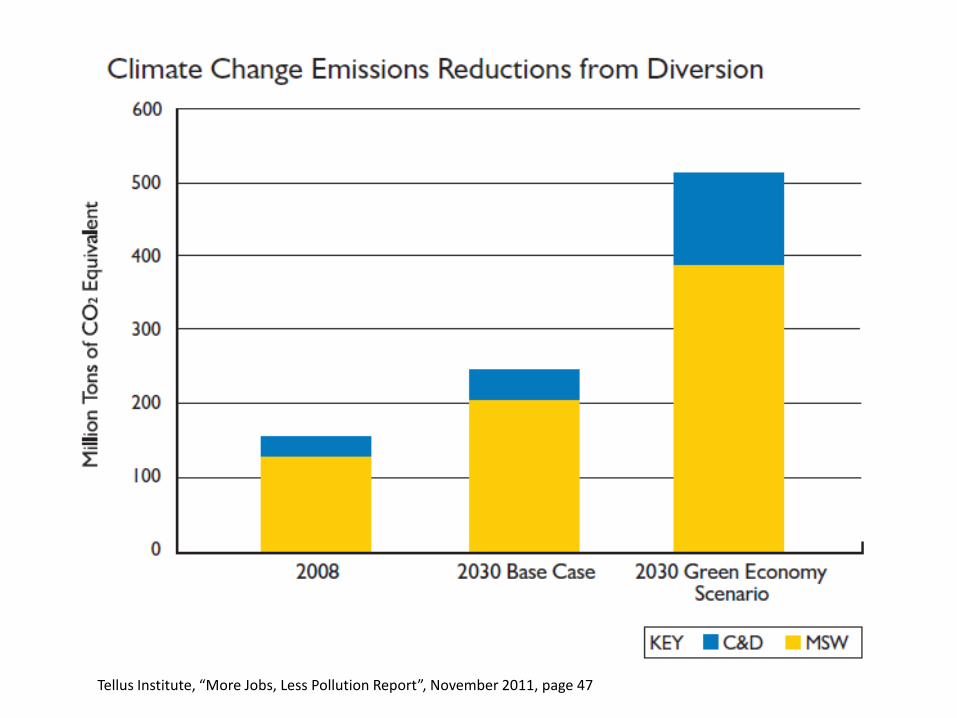
Tellus Institute, “More Jobs, Less Pollution Report”, November 2011, page 47
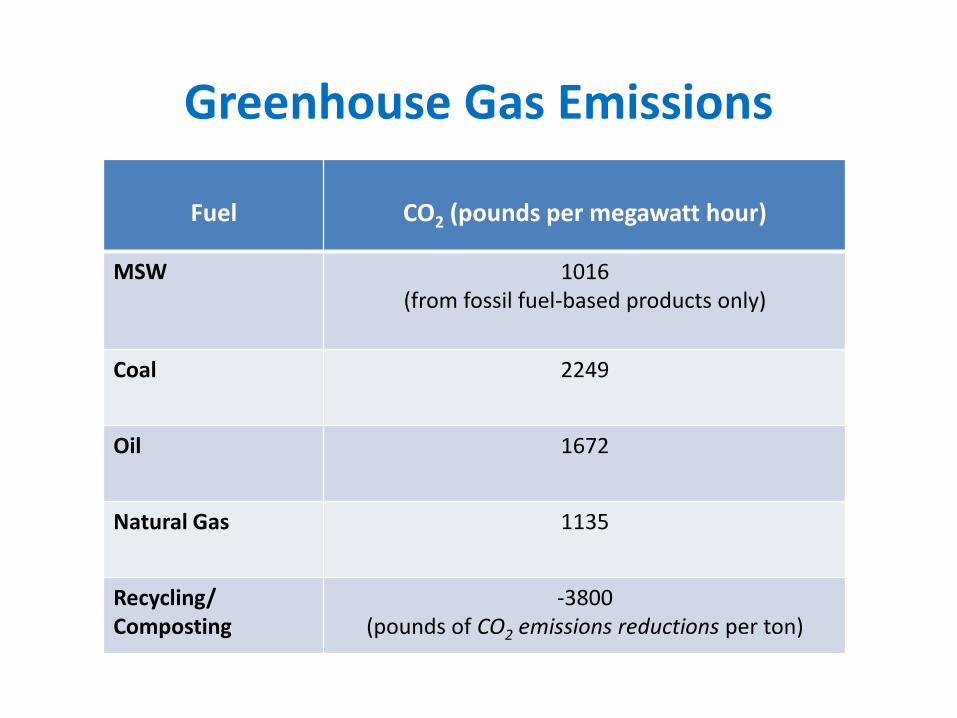
Greenhouse Gas Emissions
Fuel
CO2 (pounds per megawatt hour)
MSW 1016 (from fossil fuel-based products only)
Coal 2249
Oil 1672
Natural Gas 1135
Recycling/ Composting
-3800 (pounds of CO2 emissions reductions per ton)
Recycling Take Back Legislation & Extended Producer Responsibility
At the heart of America’s municipal-garbage problem is the fact that the consumer-products industry passes off to local governments, or “externalizes”, the economic and environmental consequences of the waste its products create.
Internalizing municipal waste-management costs associated with consumer goods with recycling take back or Extended Producer Responsibility legislation is an effective way to reduce the tax burden associated with the disposal of municipal solid waste.
The nation’s economy would be well served if municipal waste was reclassified as manufacturer’s waste and the waste itself became the financial obligation of the consumer-products companies.
This logic conforms with fundamental economic principles: those responsible for costs in competitive content have an incentive to manage them efficiently.
Sweden
Poland Germany
France
Spain
Portugal
Ireland
Norway
Latvia
Belgium
Austria Hungary
Greece
Luxembourg
Turkey
Lithuania
Slovenia
Czech Republic
Slovakia
Cyprus
Great Britain
Malta
Bulgaria
Estonia
Romania
Ukraine
Finland
Iceland
Netherlands
Croatia Italy
Serbia
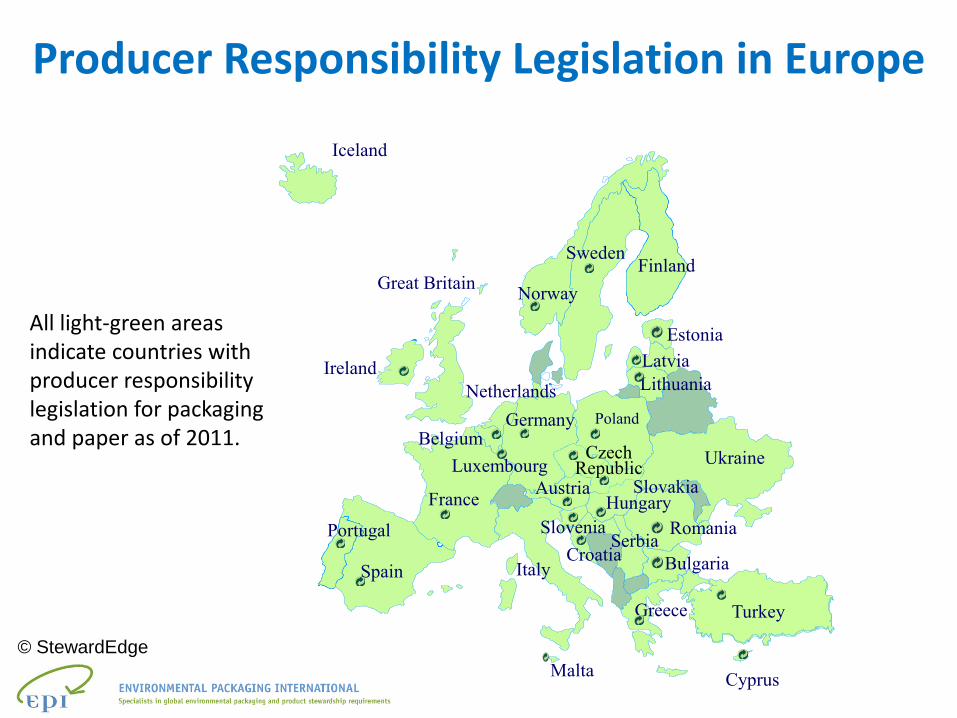
Producer Responsibility Legislation in Europe
All light-green areas indicate countries with producer responsibility legislation for packaging and paper as of 2011.
© StewardEdge
© StewardEdge
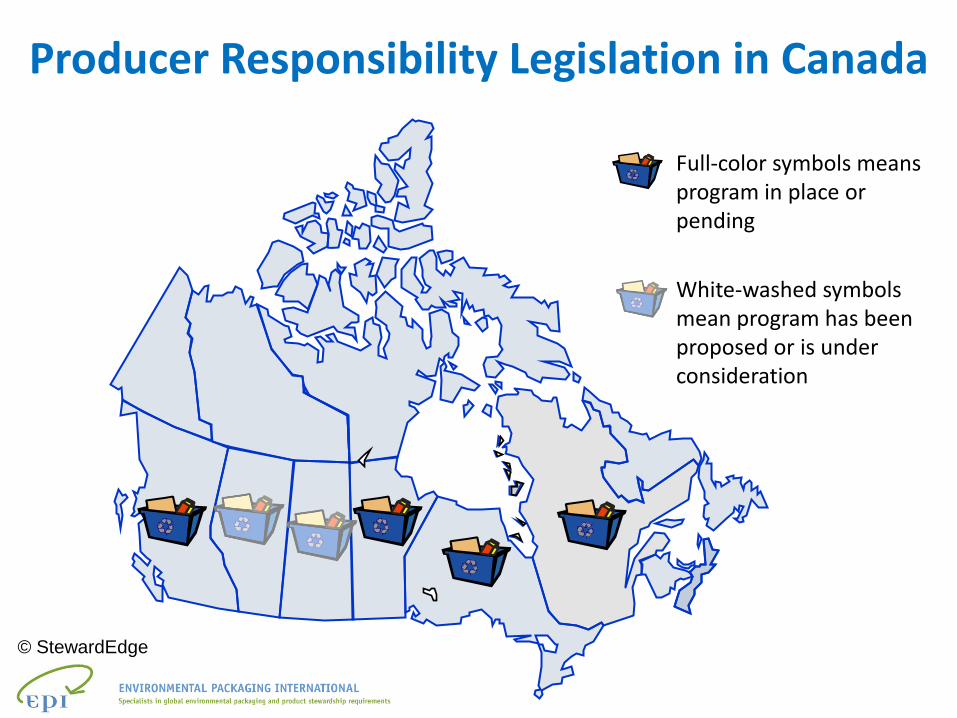
Producer Responsibility Legislation in Canada
Full-color symbols means program in place or pending
White-washed symbols mean program has been proposed or is under consideration
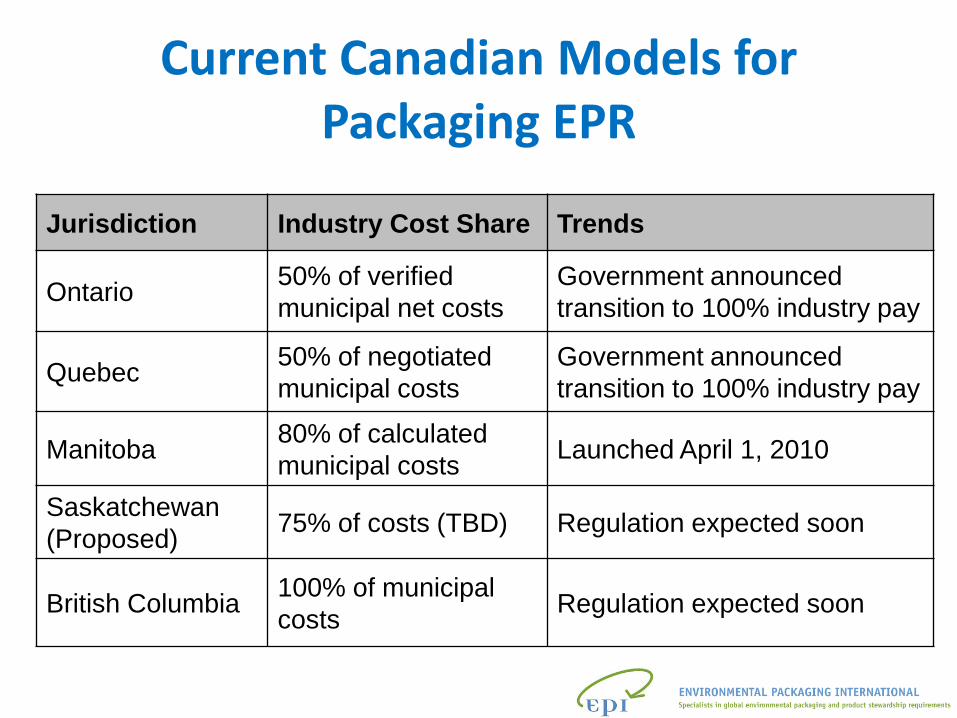
Current Canadian Models for Packaging EPR
Jurisdiction Industry Cost Share Trends
Ontario 50% of verified
municipal net costs
Government announced
transition to 100% industry pay
Quebec 50% of negotiated
municipal costs
Government announced
transition to 100% industry pay
Manitoba 80% of calculated
municipal costs Launched April 1, 2010
Saskatchewan
(Proposed) 75% of costs (TBD) Regulation expected soon
British Columbia 100% of municipal
costs Regulation expected soon
23
EPR for packaging in Uruguay is currently being implemented
Brazil’s President signed the Omnibus Waste law, which created a National Policy on Solid Waste. The bill calls for EPR of packaging. A committee to oversee implementation of an EPR program has been formed. It is expected that regulations to create producer take-back programs should be adopted later this year.
Argentina and Mexico piloting packaging waste integrated management systems in some regions
EPR in Latin America
24
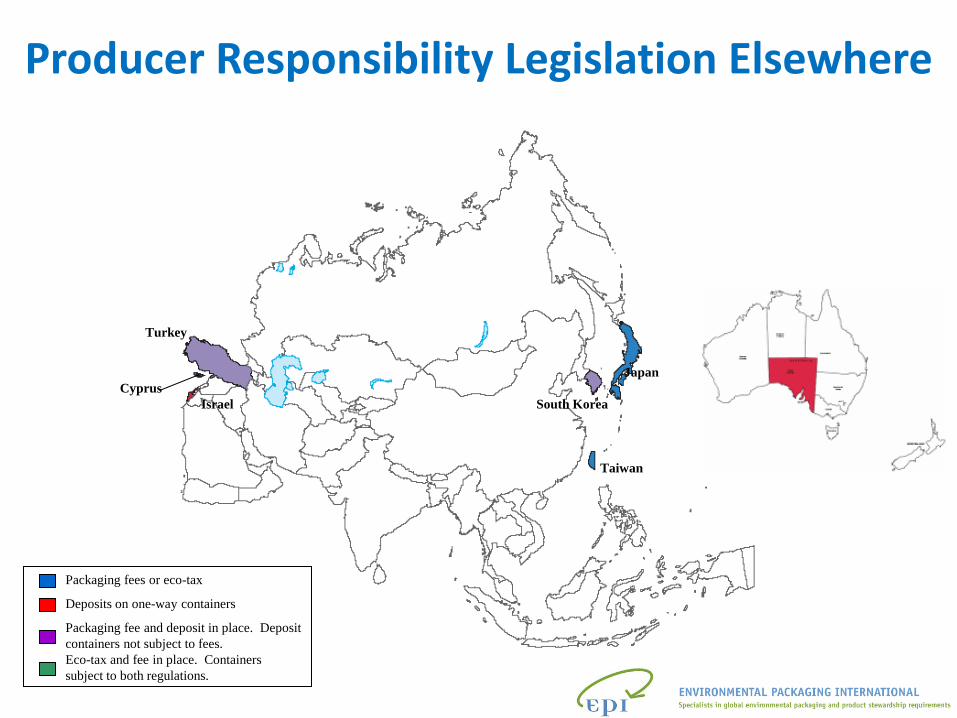
Packaging fees or eco-tax
Deposits on one-way containers
Packaging fee and deposit in place. Deposit
containers not subject to fees.
Eco-tax and fee in place. Containers
subject to both regulations.
South Korea
Japan
Turkey
Cyprus
Israel
Taiwan
Producer Responsibility Legislation Elsewhere
Case Study: Rhode Island EPR Savings
• Rhode Island is currently exploring an EPR program for Packaging and Printed
Paper in which producers and first importers for consumer products companies would be required to take on the costs of municipal recycling of packaging and printed paper.
• Rhode Island municipalities stand to save approximately $17.6 million annually if producers and first importers take on the costs associated with the curbside collection and drop-off recycling programs of their packaging and paper product waste.

Dr. Allen Hershkowitz Senior Scientist [email protected] Read more on my blog: http://switchboard.nrdc.org/blogs/ahershkowitz/