Embed Size (px)
Citation preview

8/3/2019 A Review of the Market Structure of the Louisiana Oyster Industry
http://slidepdf.com/reader/full/a-review-of-the-market-structure-of-the-louisiana-oyster-industry 1/42
http://www.biodiversitylibrary.org
Journal of shellfish research.[S.l. :National Shellfisheries Association,1981-
http://www.biodiversitylibrary.org/bibliography/2179
v. 23 (2004): http://www.biodiversitylibrary.org/item/22139 Page(s): Page 841, Page 842, Page 843, Page 844, Page 845, Page 846, Page 847, Page 848
Contributed by: MBLWHOI LibrarySponsored by: MBLWHOI Library
Generated 13 December 2009 9:20 PMhttp://www.biodiversitylibrary.org/pdf2/001722900022139

8/3/2019 A Review of the Market Structure of the Louisiana Oyster Industry
http://slidepdf.com/reader/full/a-review-of-the-market-structure-of-the-louisiana-oyster-industry 2/42
This page intentionally left blank.
8/3/2019 A Review of the Market Structure of the Louisiana Oyster Industry
http://slidepdf.com/reader/full/a-review-of-the-market-structure-of-the-louisiana-oyster-industry 3/42
8/3/2019 A Review of the Market Structure of the Louisiana Oyster Industry
http://slidepdf.com/reader/full/a-review-of-the-market-structure-of-the-louisiana-oyster-industry 4/42
8/3/2019 A Review of the Market Structure of the Louisiana Oyster Industry
http://slidepdf.com/reader/full/a-review-of-the-market-structure-of-the-louisiana-oyster-industry 5/42
8/3/2019 A Review of the Market Structure of the Louisiana Oyster Industry
http://slidepdf.com/reader/full/a-review-of-the-market-structure-of-the-louisiana-oyster-industry 6/42
8/3/2019 A Review of the Market Structure of the Louisiana Oyster Industry
http://slidepdf.com/reader/full/a-review-of-the-market-structure-of-the-louisiana-oyster-industry 7/42
8/3/2019 A Review of the Market Structure of the Louisiana Oyster Industry
http://slidepdf.com/reader/full/a-review-of-the-market-structure-of-the-louisiana-oyster-industry 8/42
8/3/2019 A Review of the Market Structure of the Louisiana Oyster Industry
http://slidepdf.com/reader/full/a-review-of-the-market-structure-of-the-louisiana-oyster-industry 9/42

8/3/2019 A Review of the Market Structure of the Louisiana Oyster Industry
http://slidepdf.com/reader/full/a-review-of-the-market-structure-of-the-louisiana-oyster-industry 10/42
8/3/2019 A Review of the Market Structure of the Louisiana Oyster Industry
http://slidepdf.com/reader/full/a-review-of-the-market-structure-of-the-louisiana-oyster-industry 11/42
The following text is generated from uncorrected OCR.
[Begin Page: Page 841]
Journal oj Shellfish Research, Vol. 23. No. 3, 841-847. 2004.
A REVIEW OF THE MARKET STRUCTURE OF THE LOUISIANA OYSTER INDUSTRY: A MICROCOSM OF THE UNITED STATES OYSTER INDUSTRY
FERDINAND F. WIRTH* AND TARA M. MINTON
Food and Resource Economics Department, Indian River Research and Education Center, University of Florida, IFAS. 2199 South Rock Road. Ft. Pierce. Florida 34945
ABSTRACT Louisiana enjoys the highest annual oyster production among all states, contributing over thirty percentof the total domestic supply of the eastern oyster. Crassostrea virginica. Over the last 2 decades, changes in oyster habitat,concerns over shellfish
safety and government regulations have seriously affected the oyster industry in Louisiana and the United States. Inan attempt to fill a research sold identified by the Gulf Oyster Industry Program, this analysis identifies and assesses the Louisianaoyster industry size and value, product lines, market structure, distribution, and distribution channels. Recommendations to theLouisiana oyster industry include offering an array of value-added products that fit today's busy lifestyle, and addressing safety concernsthrough quality
assurance to restore consumer confidence.
KEY WORDS: oyster, distribution. Louisiana, market structure, value-added products
INTRODUCTION
8/3/2019 A Review of the Market Structure of the Louisiana Oyster Industry
http://slidepdf.com/reader/full/a-review-of-the-market-structure-of-the-louisiana-oyster-industry 12/42
The eastern oyster. Crassostrea virginica. also known as the American oyster, is the principal oyster species being cultivated in the Gulf of Mexico and along the Atlantic coast. In the early 1800s, Louisiana's first commercial oyster operations began in the
estuaries near the present Mississippi River Delta. In the midlSTJOs, immigrant fishermen realized that high-quality oysters could be produced by transferring small "seed" oysters from the natural reefs near the delta to bedding grounds closer to the Gulf of Mexico. These higher salinity areas did not support substantial natural populations due to high predation, but were excellent for fattening and growth of transplanted seed (Perret & Chatry 1988).
By the turn of the 20th century. Louisiana's oyster-producing areas had been divided into public seed grounds (most productive natural reefs) and private bedding grounds. Public reefs are opened each year in the fall and winter both for collection of seed oysters
and harvesting of market oysters. Much of the remaining oyster- producing areas were made available for private leasing. Thus, the basic organization of the Louisiana oyster fishery was established. The state supplied the seed oysters, and the private leaseholders would transfer the seed to their leases for growth to market size. This growout of transplanted seed is a type of oyster production known as on-bottom or extensive culture and is the typical method
of farming oysters in the United States today (Supan 2002).
In many ways, the Louisiana oyster industry can be viewed as a microcosm of the entire United States oyster industry, with com- parable production and marketing challenges and opportunities. In
8/3/2019 A Review of the Market Structure of the Louisiana Oyster Industry
http://slidepdf.com/reader/full/a-review-of-the-market-structure-of-the-louisiana-oyster-industry 13/42
the last decade, changes in oyster habitat, production technology, concerns over shellfish safety, and government regulations have seriously affected the oyster industry in Louisiana and throughout the United States. High production costs are restricting expansion
by established culturists and serving as barriers to entry into the industry. Land for shore-side facilities is in demand by housing, recreational, and manufacturing companies, which can pay pre- mium prices to obtain choice sites. Many coastal activities and competing uses for areas suitable for oyster culture are not com- patible with oyster growout procedures.
This research was supported by the Florida Agricultural Experiment Sta- tion, and approved for publication as Journal Series No. R-09928. 'Corresponding author. E-mail: [email protected]
Determining market characteristics including sale, distribution,
and preferred product forms was identified as a major research need by the Gulf Oyster Industry Program (Supan 2000). This report was constructed in an effort to fill this research void, and reports the results of a review of the Louisiana oyster industry's market structure. The analysis identifies and assesses industry size and value, product lines, market structure, distribution, and distri-
bution channels. Key facets of the Louisiana oyster industry are also compared and contrasted with other major oyster-producing states.
INDUSTRY SIZE AND VALUE
8/3/2019 A Review of the Market Structure of the Louisiana Oyster Industry
http://slidepdf.com/reader/full/a-review-of-the-market-structure-of-the-louisiana-oyster-industry 14/42
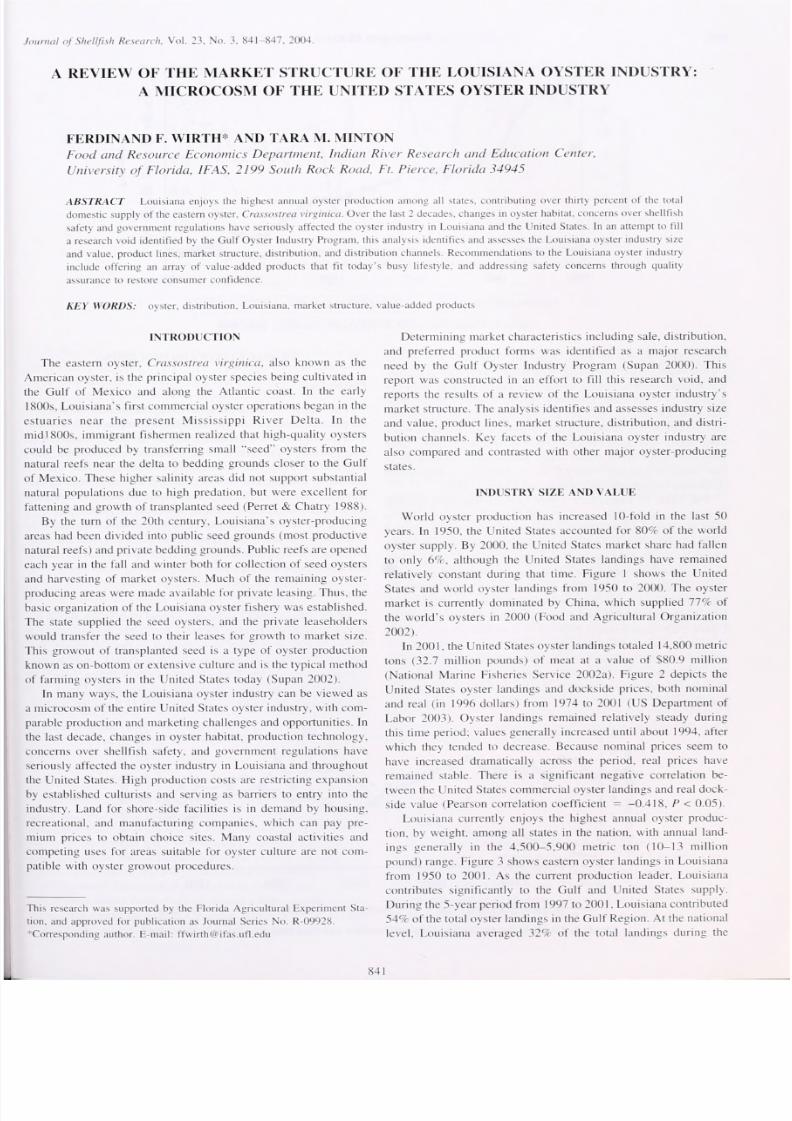
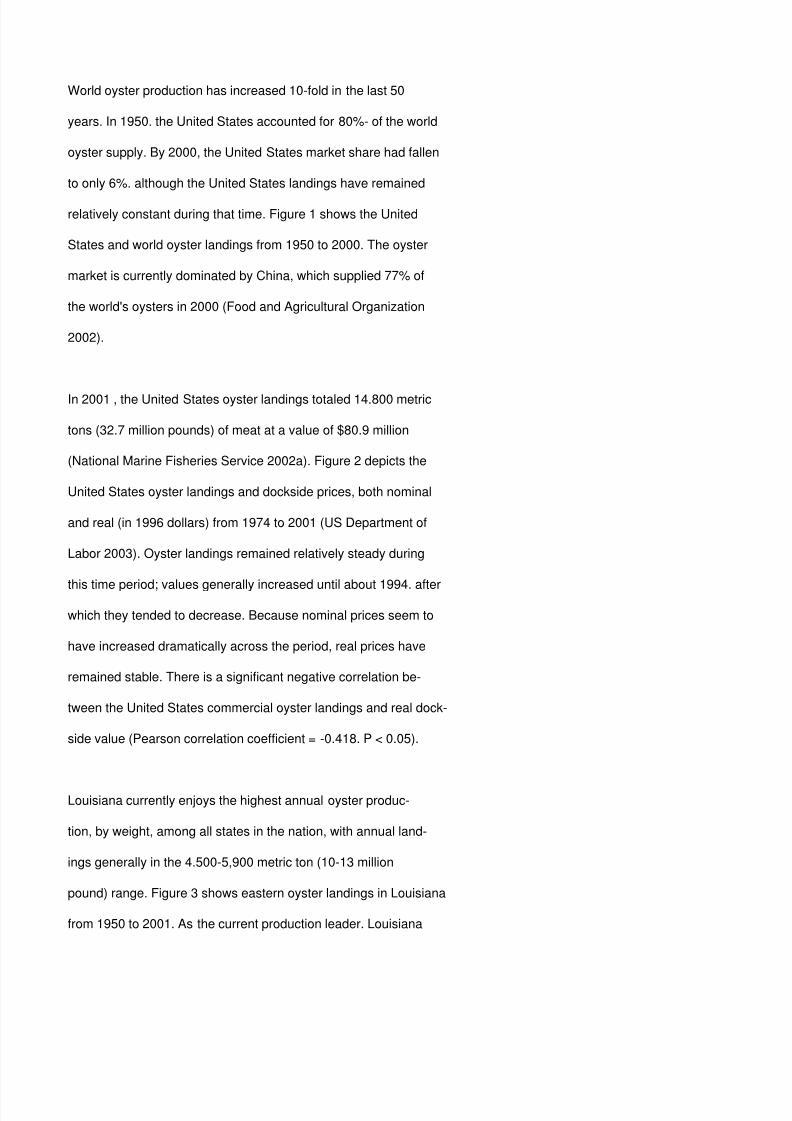
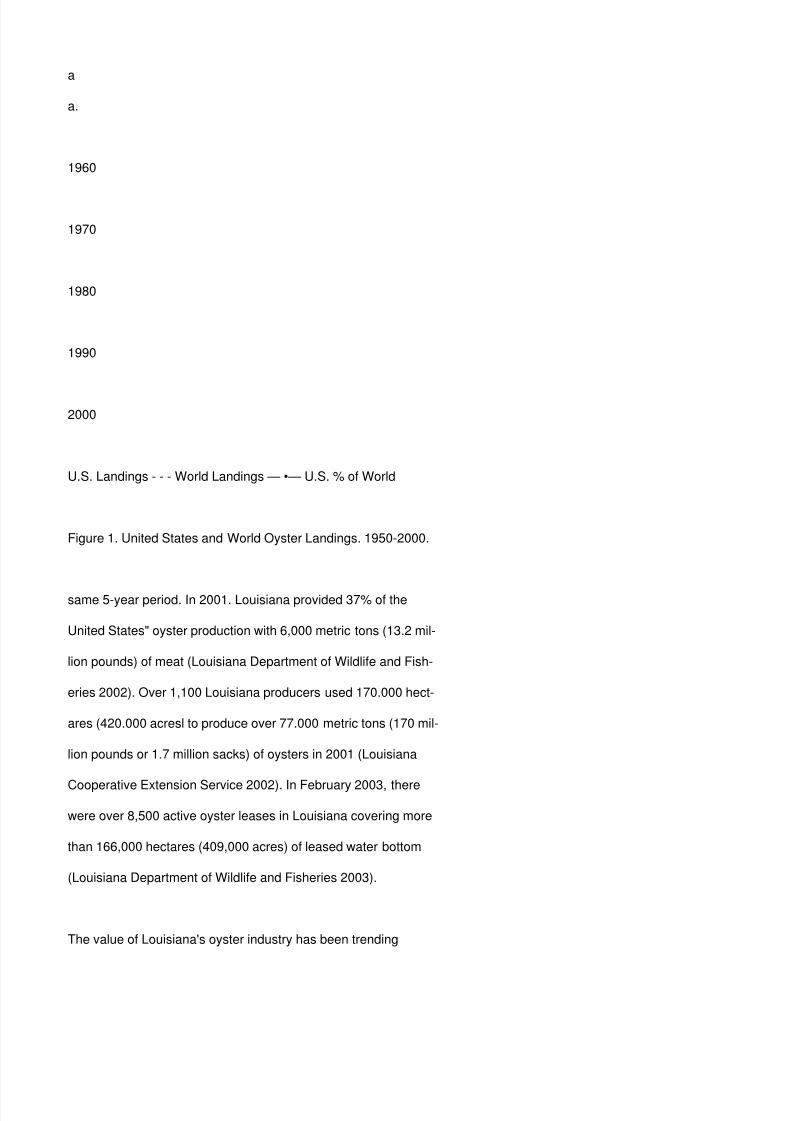
World oyster production has increased 10-fold in the last 50 years. In 1950. the United States accounted for 80%- of the world oyster supply. By 2000, the United States market share had fallen to only 6%. although the United States landings have remained
relatively constant during that time. Figure 1 shows the United States and world oyster landings from 1950 to 2000. The oyster market is currently dominated by China, which supplied 77% of the world's oysters in 2000 (Food and Agricultural Organization 2002).
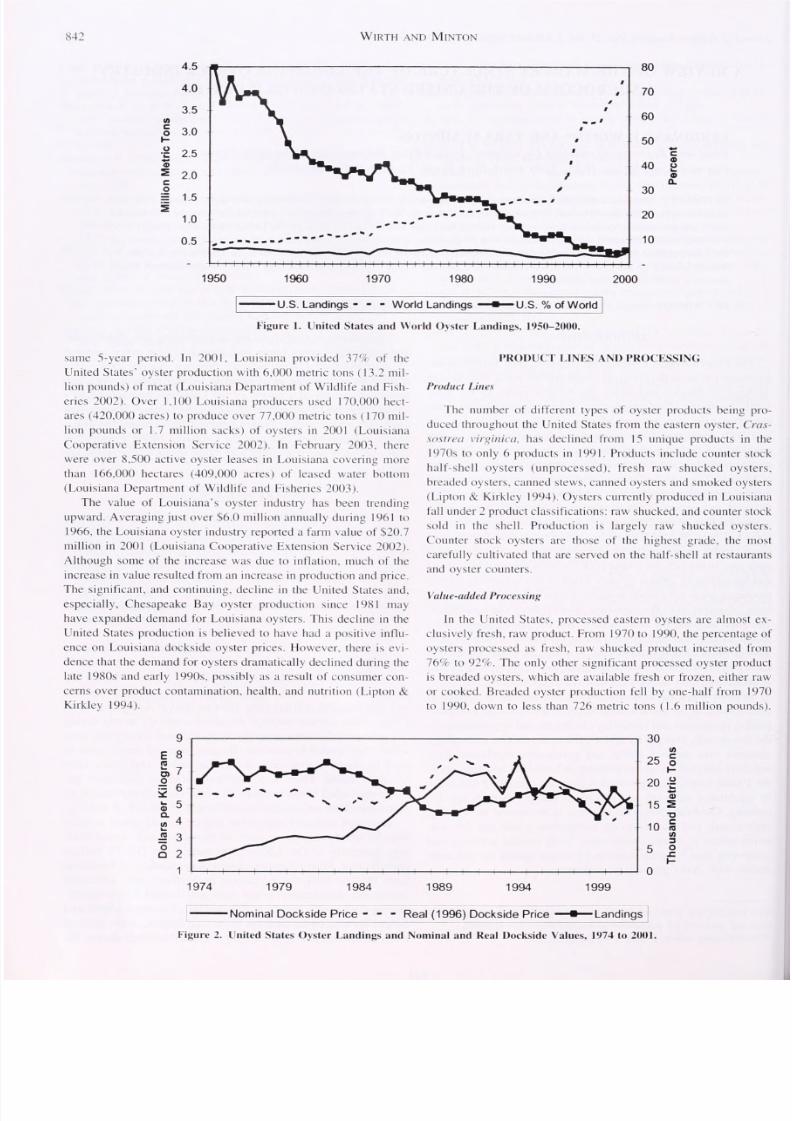
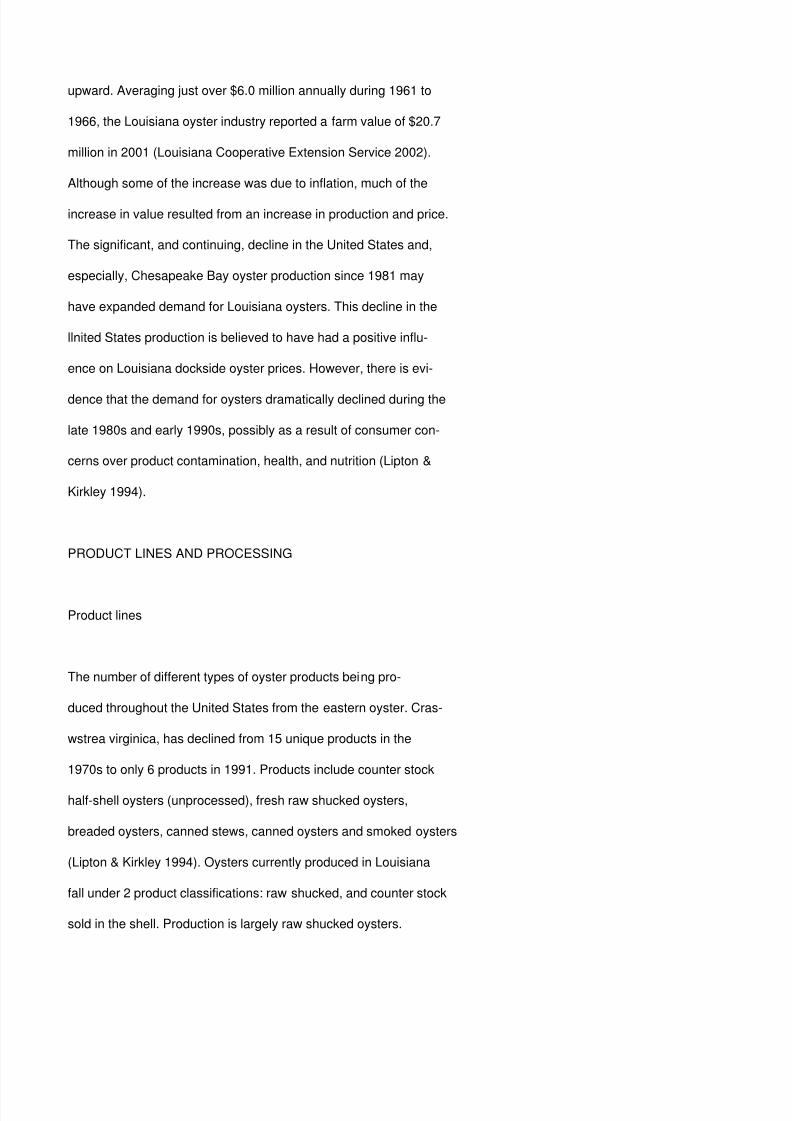
In 2001 , the United States oyster landings totaled 14.800 metric tons (32.7 million pounds) of meat at a value of $80.9 million (National Marine Fisheries Service 2002a). Figure 2 depicts the United States oyster landings and dockside prices, both nominal and real (in 1996 dollars) from 1974 to 2001 (US Department of Labor 2003). Oyster landings remained relatively steady during
this time period; values generally increased until about 1994. after which they tended to decrease. Because nominal prices seem to have increased dramatically across the period, real prices have remained stable. There is a significant negative correlation be- tween the United States commercial oyster landings and real dock- side value (Pearson correlation coefficient = -0.418. P < 0.05).
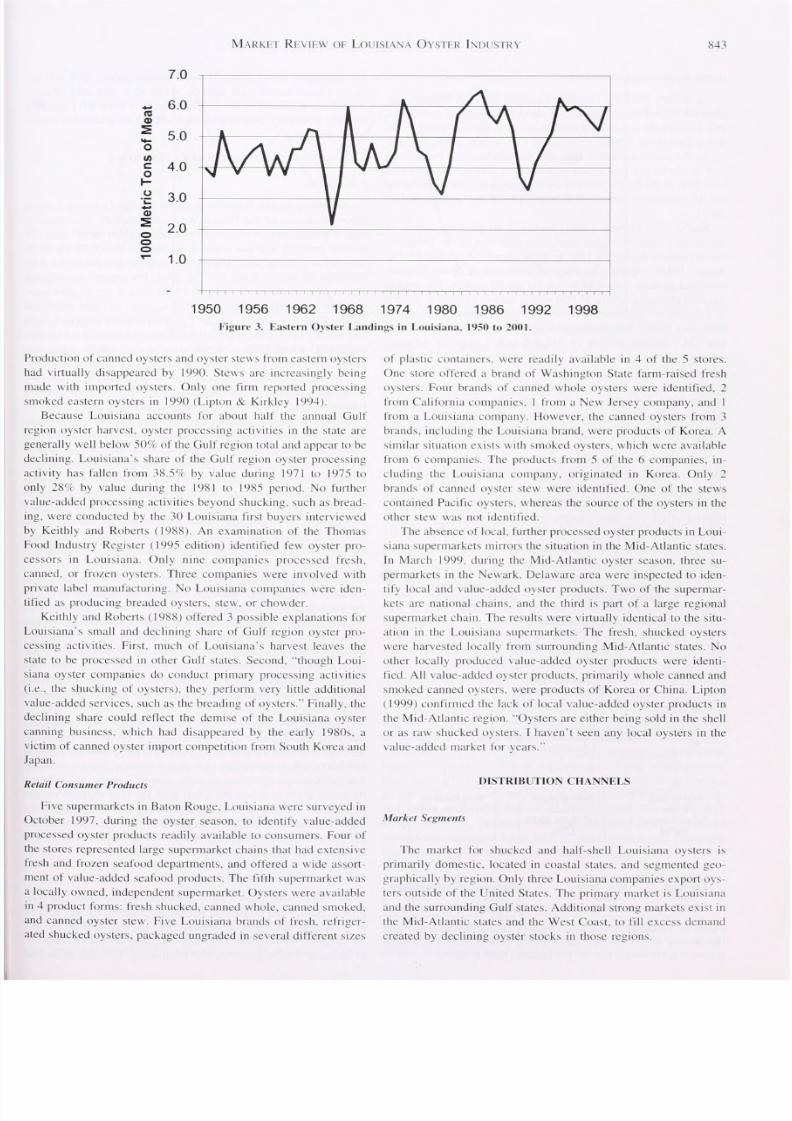
Louisiana currently enjoys the highest annual oyster produc- tion, by weight, among all states in the nation, with annual land- ings generally in the 4.500-5,900 metric ton (10-13 million pound) range. Figure 3 shows eastern oyster landings in Louisiana from 1950 to 2001. As the current production leader. Louisiana
8/3/2019 A Review of the Market Structure of the Louisiana Oyster Industry
http://slidepdf.com/reader/full/a-review-of-the-market-structure-of-the-louisiana-oyster-industry 15/42
contributes significantly to the Gulf and United States supply. During the 5-year period from 1997 to 2001, Louisiana contributed 54' . of the total oyster landings in the Gulf Region. At the national level. Louisiana averaged 32% of the total landings during the
841
[Begin Page: Page 842]
842
WlRTH AND MlNTON
a
5 c o
1 —
1950
c a u
8/3/2019 A Review of the Market Structure of the Louisiana Oyster Industry
http://slidepdf.com/reader/full/a-review-of-the-market-structure-of-the-louisiana-oyster-industry 16/42
a a.
1960
1970
1980
1990
2000
U.S. Landings - - - World Landings — •— U.S. % of World
Figure 1. United States and World Oyster Landings. 1950-2000.
same 5-year period. In 2001. Louisiana provided 37% of the United States" oyster production with 6,000 metric tons (13.2 mil- lion pounds) of meat (Louisiana Department of Wildlife and Fish- eries 2002). Over 1,100 Louisiana producers used 170.000 hect- ares (420.000 acresl to produce over 77.000 metric tons (170 mil- lion pounds or 1.7 million sacks) of oysters in 2001 (Louisiana
Cooperative Extension Service 2002). In February 2003, there were over 8,500 active oyster leases in Louisiana covering more than 166,000 hectares (409,000 acres) of leased water bottom (Louisiana Department of Wildlife and Fisheries 2003).
The value of Louisiana's oyster industry has been trending
8/3/2019 A Review of the Market Structure of the Louisiana Oyster Industry
http://slidepdf.com/reader/full/a-review-of-the-market-structure-of-the-louisiana-oyster-industry 17/42
upward. Averaging just over $6.0 million annually during 1961 to 1966, the Louisiana oyster industry reported a farm value of $20.7 million in 2001 (Louisiana Cooperative Extension Service 2002). Although some of the increase was due to inflation, much of the
increase in value resulted from an increase in production and price. The significant, and continuing, decline in the United States and, especially, Chesapeake Bay oyster production since 1981 may have expanded demand for Louisiana oysters. This decline in the llnited States production is believed to have had a positive influ- ence on Louisiana dockside oyster prices. However, there is evi- dence that the demand for oysters dramatically declined during the late 1980s and early 1990s, possibly as a result of consumer con- cerns over product contamination, health, and nutrition (Lipton & Kirkley 1994).
PRODUCT LINES AND PROCESSING
Product lines
The number of different types of oyster products being pro- duced throughout the United States from the eastern oyster. Cras- wstrea virginica, has declined from 15 unique products in the 1970s to only 6 products in 1991. Products include counter stock
half-shell oysters (unprocessed), fresh raw shucked oysters, breaded oysters, canned stews, canned oysters and smoked oysters (Lipton & Kirkley 1994). Oysters currently produced in Louisiana fall under 2 product classifications: raw shucked, and counter stock sold in the shell. Production is largely raw shucked oysters.
8/3/2019 A Review of the Market Structure of the Louisiana Oyster Industry
http://slidepdf.com/reader/full/a-review-of-the-market-structure-of-the-louisiana-oyster-industry 18/42
Counter stock oysters are those of the highest grade, the most carefully cultivated that are served on the half-shell at restaurants and oyster counters.
I 'alue-added Processing
In the United States, processed eastern oysters are almost ex- clusively fresh, raw product. From 1970 to 1990. the percentage of oysters processed as fresh, raw shucked product increased from 169c to 92%. The only other significant processed oyster product is breaded oysters, which are available fresh or frozen, either raw or cooked. Breaded oyster production fell by one-half from 1970 to 1990, down to less than 726 metric tons (1.6 million pounds).
1974
1979
1984
1989
1994
1999
| Nominal Dockside Price - - - Real (1996) Dockside Price — •— Landings
Figure 2. United States Oyster Landings and Nominal and Real Dockside Values. 1974 to 2001.
8/3/2019 A Review of the Market Structure of the Louisiana Oyster Industry
http://slidepdf.com/reader/full/a-review-of-the-market-structure-of-the-louisiana-oyster-industry 19/42
[Begin Page: Page 843]
Markkt Review of Louisiana Oyster Industry
843
1950 1956 1962 1968 1974 1980 1986 1992 1998
Figure 3. Eastern Oyster Landings in Louisiana. 1M5U to 2(101.
Production of canned oysters and oyster stews from eastern oysters had virtually disappeared by 1990. Stews are increasingly being made with imported oysters. Only one firm reported processing smoked eastern oysters in 1990 (Lipton & Kirkley 1994).
Because Louisiana accounts for about half the annual Gulf region oyster harvest, oyster processing activities in the state are generally well below 50% of the Gulf region total and appear to be declining. Louisiana's share of the Gulf region oyster processing activity has fallen from 38.5% by value during 1971 to 1975 to
only 287r by value during the 1981 to 1985 period. No further value-added processing activities beyond shucking, such as bread- ing, were conducted by the 30 Louisiana first buyers interviewed by Keithly and Roberts (1988). An examination of the Thomas Food Industry Register (1995 edition) identified few oyster pro- cessors in Louisiana. Only nine companies processed fresh,
8/3/2019 A Review of the Market Structure of the Louisiana Oyster Industry
http://slidepdf.com/reader/full/a-review-of-the-market-structure-of-the-louisiana-oyster-industry 20/42
canned, or frozen oysters. Three companies were involved with private label manufacturing. No Louisiana companies were iden- tified as producing breaded oysters, stew, or chowder.
Keithly and Roberts ( 1988) offered 3 possible explanations for Louisiana's small and declining share of Gulf region oyster pro- cessing activities. First, much of Louisiana's harvest leaves the state to be processed in other Gulf states. Second, "though Loui- siana oyster companies do conduct primary processing activities (i.e.. the shucking of oysters), they perform very little additional value-added services, such as the breading of oysters." Finally, the declining share could reflect the demise of the Louisiana oyster canning business, which had disappeared by the early 1980s, a victim of canned oyster import competition from South Korea and Japan.
Retail Consumer Products
Five supermarkets in Baton Rouge. Louisiana were surveyed in October 1997. during the oyster season, to identify value-added processed oyster products readily available to consumers. Four of the stores represented large supermarket chains that had extensive fresh and frozen seafood departments, and offered a wide assort-
ment of value-added seafood products. The fifth supermarket was a locally owned, independent supermarket. Oysters were available in 4 product forms: fresh shucked, canned whole, canned smoked, and canned oyster stew. Five Louisiana brands of fresh, refriger- ated shucked oysters, packaged ungraded in several different sizes
8/3/2019 A Review of the Market Structure of the Louisiana Oyster Industry
http://slidepdf.com/reader/full/a-review-of-the-market-structure-of-the-louisiana-oyster-industry 21/42
of plastic containers, were readily available in 4 of the 5 stores. One store offered a brand of Washington State farm-raised fresh oysters. Four brands of canned whole oysters were identified. 2
from California companies. 1 from a New Jersey company, and 1 from a Louisiana company. However, the canned oysters from 3 brands, including the Louisiana brand, were products of Korea. A similar situation exists with smoked oysters, which were available from 6 companies. The products from 5 of the 6 companies, in- cluding the Louisiana company, originated in Korea. Only 2 brands of canned oyster stew were identified. One of the stews contained Pacific oysters, whereas the source of the oysters in the other stew was not identified.
The absence of local, further processed oyster products in Loui- siana supermarkets mirrors the situation in the Mid-Atlantic states. In March 1999. during the Mid-Atlantic oyster season, three su-
permarkets in the Newark. Delaware area were inspected to iden- tify local and value-added oyster products. Two of the supermar- kets are national chains, and the third is part of a large regional supermarket chain. The results were virtually identical to the situ- ation in the Louisiana supermarkets. The fresh, shucked oysters were harvested locally from surrounding Mid-Atlantic states. No
other locally produced value-added oyster products were identi- fied. All value-added oyster products, primarily whole canned and smoked canned oysters, were products of Korea or China. Lipton ( 1999) confirmed the lack of local value-added oyster products in the Mid-Atlantic region. "Oysters are either being sold in the shell or as raw shucked oysters. I haven't seen any local oysters in the
8/3/2019 A Review of the Market Structure of the Louisiana Oyster Industry
http://slidepdf.com/reader/full/a-review-of-the-market-structure-of-the-louisiana-oyster-industry 22/42
value-added market for years."
DISTRIBUTION CHANNELS
Market Segments
The market for shucked and half-shell Louisiana oysters is primarily domestic, located in coastal states, and segmented geo- graphically by region. Only three Louisiana companies export oys- ters outside of the United States. The primary market is Louisiana and the surrounding Gulf states. Additional strong markets exist in the Mid-Atlantic states and the West Coast, to fill excess demand created by declining oyster stocks in those regions.
[Begin Page: Page 844]
844
WlRTH AND MlNTON
Dealer Numbers and Behavior
As of May 2003. the Interstate Certified Shellfish Shippers List reported 50 shellstock shippers. 48 shucker-packers, 18 reshippers. and 2 repackers as certified dealers in the Louisiana shellfish in- dustry (Interstate Shellfish Sanitation Conference 2003). Accord- ing to the National Marine Fisheries Service Seafood Processor's
8/3/2019 A Review of the Market Structure of the Louisiana Oyster Industry
http://slidepdf.com/reader/full/a-review-of-the-market-structure-of-the-louisiana-oyster-industry 23/42
Survey, the largest four oyster processors in Louisiana represented over 70% of the state's shucked oyster market in 2000 whereas the top 10 processors represented over 91% of the market (Isaacs 2003).
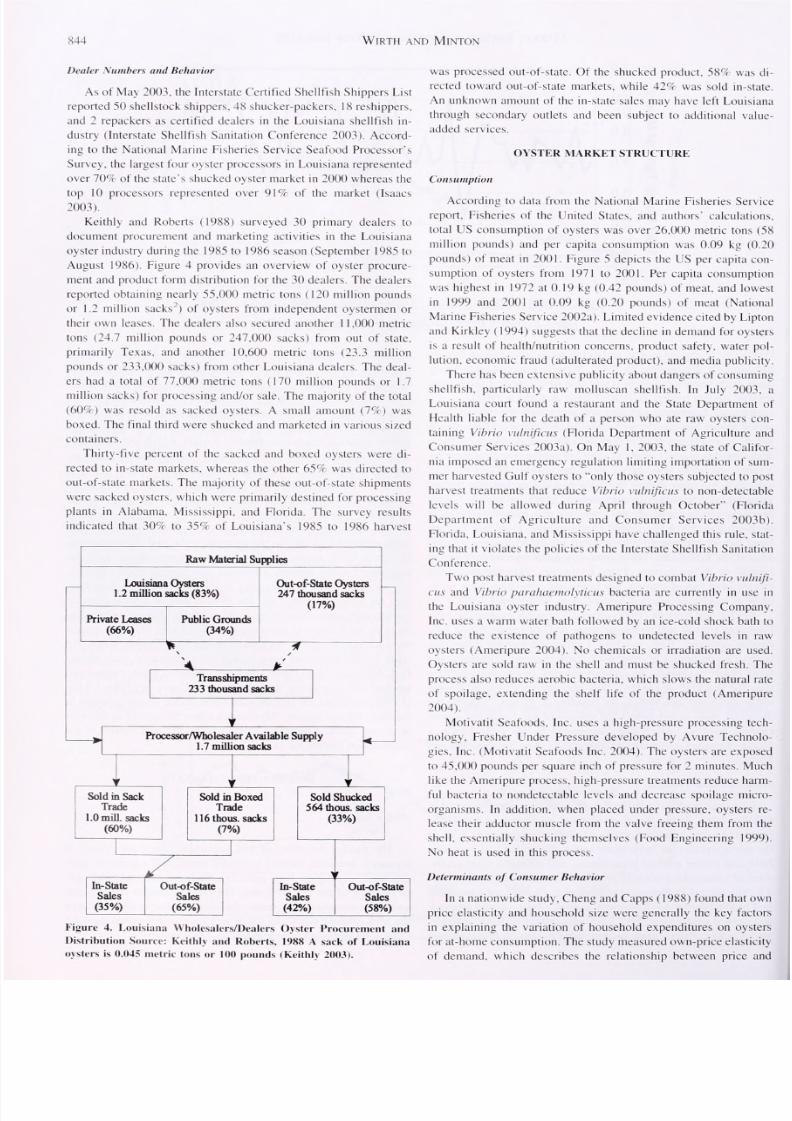
Keithly and Roberts (1988) surveyed 30 primary dealers to document procurement and marketing activities in the Louisiana oyster industry during the 1985 to 1986 season (September 1985 to August 1986). Figure 4 provides an overview of oyster procure- ment and product form distribution for the 30 dealers. The dealers reported obtaining nearly 55.000 metric tons (120 million pounds or 1.2 million sacks") of oysters from independent oystermen or their own leases. The dealers also secured another 1 1 .000 metric tons (24.7 million pounds or 247,000 sacks) from out of state, primarily Texas, and another 10,600 metric tons (23.3 million pounds or 233.000 sacks) from other Louisiana dealers. The deal-
ers had a total of 77,000 metric tons ( 170 million pounds or 1.7 million sacks) for processing and/or sale. The majority of the total (60%) was resold as sacked oysters. A small amount (7%) was boxed. The final third were shucked and marketed in various sized containers.
Thirty-five percent of the sacked and boxed oysters were di-
rected to in-state markets, whereas the other 65% was directed to out-of-state markets. The majority of these out-of-state shipments were sacked oysters, which were primarily destined for processing plants in Alabama, Mississippi, and Florida. The survey results indicated that 30% to 35% of Louisiana's 1985 to 1986 harvest

8/3/2019 A Review of the Market Structure of the Louisiana Oyster Industry
http://slidepdf.com/reader/full/a-review-of-the-market-structure-of-the-louisiana-oyster-industry 24/42
Raw Material Supplies
Louisiana Oysters
1.2 million sacks (83%)
Private Leases (66%)
I
Public Grounds (34%)
Out-of-State Oysters
247 thousand sacks
(17%)
Transshipments 233 thousand sacks
Processor/Wholesaler Available Supply 1.7 million sacks
Sold in Sack
Trade
8/3/2019 A Review of the Market Structure of the Louisiana Oyster Industry
http://slidepdf.com/reader/full/a-review-of-the-market-structure-of-the-louisiana-oyster-industry 25/42
1.0 mill, sacks
(60%)
Sold in Boxed
Trade
1 16 thous. sacks
(7%)
Sold Shucked
564 thous. sacks
(33%)
In-State Sales (35%)
Out-of-State
Sales
(65%)
8/3/2019 A Review of the Market Structure of the Louisiana Oyster Industry
http://slidepdf.com/reader/full/a-review-of-the-market-structure-of-the-louisiana-oyster-industry 26/42
In- State Sales (42%)
Out-of-State Sales (58%)
Figure 4. Louisiana Wholesalers/Dealers Oyster Procurement and Distribution Source: Keithly and Roberts, 1988 A sack of Louisiana oysters is 0.045 metric tons or 100 pounds (Keithly 2003],
was processed out-of-state. Of the shucked product. 58% was di- rected toward out-of-state markets, while 42% was sold in-state. An unknown amount of the in-state sales may have left Louisiana through secondary outlets and been subject to additional value- added services.
OYSTER MARKET STRUCTURE
Consumption
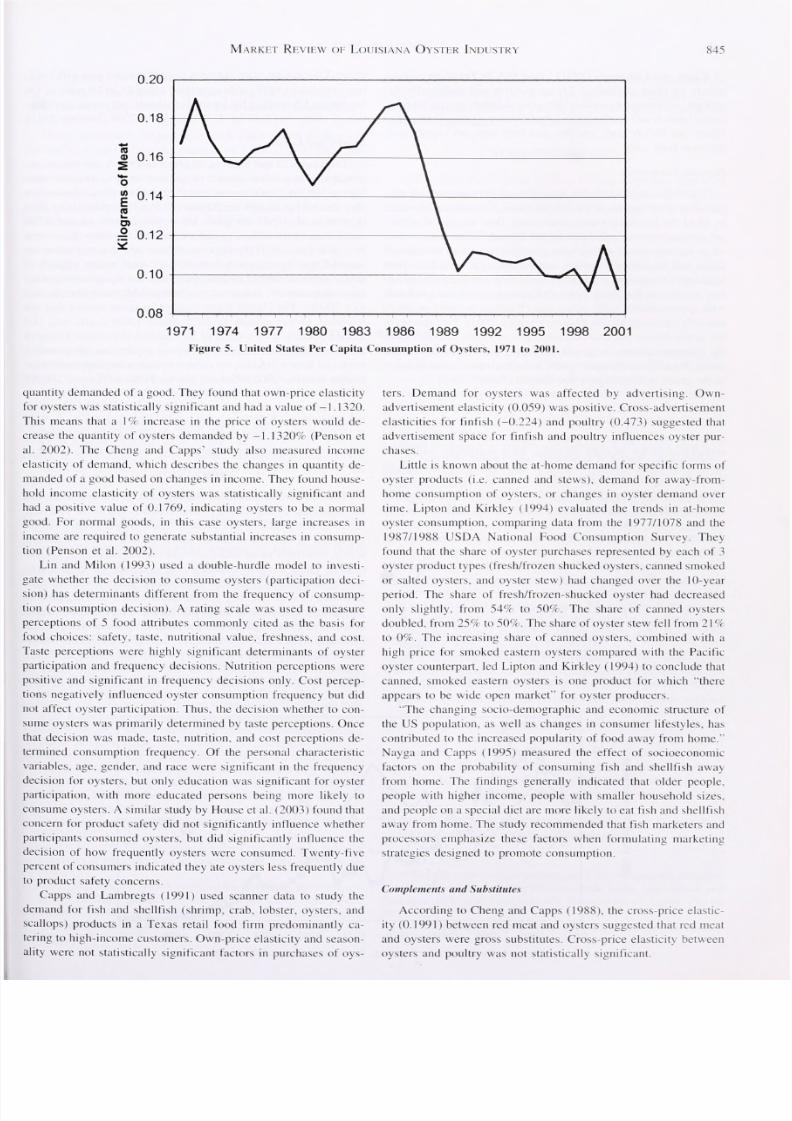
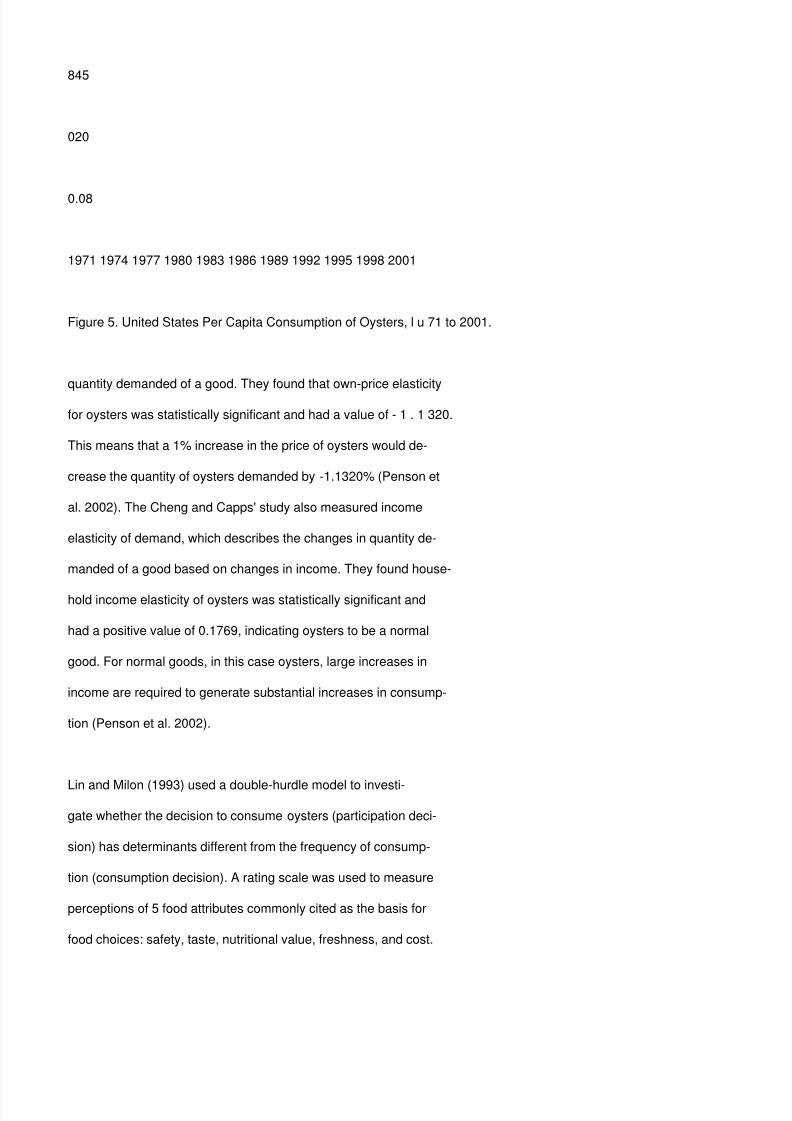
According to data from the National Marine Fisheries Service
report. Fisheries of the United States, and authors' calculations, total US consumption of oysters was over 26.000 metric tons (58 million pounds) and per capita consumption was 0.09 kg (0.20 pounds) of meat in 2001. Figure 5 depicts the US per capita con- sumption of oysters from 1971 to 2001. Per capita consumption was highest in 1972 at 0.19 kg (0.42 pounds) of meat, and lowest
8/3/2019 A Review of the Market Structure of the Louisiana Oyster Industry
http://slidepdf.com/reader/full/a-review-of-the-market-structure-of-the-louisiana-oyster-industry 27/42
in 1994 and 2001 at 0.09 kg (0.20 pounds) of meat (National Marine Fisheries Service 2002a). Limited evidence cited by Lipton and Kirkley ( 1994) suggests that the decline in demand for oysters is a result of health/nutrition concerns, product safety, water pol-
lution, economic fraud (adulterated product), and media publicity.
There has been extensive publicity about dangers of consuming shellfish, particularly raw molluscan shellfish. In July 2003, a Louisiana court found a restaurant and the State Department of Health liable for the death of a person who ate raw oysters con- taining Vibrio vulnificus (Florida Department of Agriculture and Consumer Services 2003a). On May 1, 2003, the state of Califor- nia imposed an emergency regulation limiting importation of sum- mer harvested Gulf oysters to "only those oysters subjected to post harvest treatments that reduce Vibrio vulnificus to non-detectable levels will be allowed during April through October" (Florida
Department of Agriculture and Consumer Services 2003b). Florida. Louisiana, and Mississippi have challenged this rule, stat- ing that it violates the policies of the Interstate Shellfish Sanitation Conference.
Two post harvest treatments designed to combat Vibrio vulnifi- cus and Vibrio parahaemolyticus bacteria are currently in use in
the Louisiana oyster industry. Ameripure Processing Company. Inc. uses a warm water bath followed by an ice-cold shock bath to reduce the existence of pathogens to undetected levels in raw oysters (Ameripure 2004). No chemicals or irradiation are used. Oysters are sold raw in the shell and must be shucked fresh. The
8/3/2019 A Review of the Market Structure of the Louisiana Oyster Industry
http://slidepdf.com/reader/full/a-review-of-the-market-structure-of-the-louisiana-oyster-industry 28/42
8/3/2019 A Review of the Market Structure of the Louisiana Oyster Industry
http://slidepdf.com/reader/full/a-review-of-the-market-structure-of-the-louisiana-oyster-industry 29/42
845
020
0.08
1971 1974 1977 1980 1983 1986 1989 1992 1995 1998 2001
Figure 5. United States Per Capita Consumption of Oysters, l u 71 to 2001.
quantity demanded of a good. They found that own-price elasticity for oysters was statistically significant and had a value of - 1 . 1 320. This means that a 1% increase in the price of oysters would de- crease the quantity of oysters demanded by -1.1320% (Penson et al. 2002). The Cheng and Capps' study also measured income elasticity of demand, which describes the changes in quantity de- manded of a good based on changes in income. They found house-
hold income elasticity of oysters was statistically significant and had a positive value of 0.1769, indicating oysters to be a normal good. For normal goods, in this case oysters, large increases in income are required to generate substantial increases in consump- tion (Penson et al. 2002).
Lin and Milon (1993) used a double-hurdle model to investi- gate whether the decision to consume oysters (participation deci- sion) has determinants different from the frequency of consump- tion (consumption decision). A rating scale was used to measure perceptions of 5 food attributes commonly cited as the basis for food choices: safety, taste, nutritional value, freshness, and cost.
8/3/2019 A Review of the Market Structure of the Louisiana Oyster Industry
http://slidepdf.com/reader/full/a-review-of-the-market-structure-of-the-louisiana-oyster-industry 30/42
Taste perceptions were highly significant determinants of oyster participation and frequency decisions. Nutrition perceptions were positive and significant in frequency decisions only. Cost percep- tions negatively influenced oyster consumption frequency but did
not affect oyster participation. Thus, the decision whether to con- sume oysters was primarily determined by taste perceptions. Once that decision was made, taste, nutrition, and cost perceptions de- termined consumption frequency. Of the personal characteristic- variables, age. gender, and race were significant in the frequency decision for oysters, but only education was significant for oyster participation, with more educated persons being more likely to consume oysters. A similar study by House et al. (2003) found that concern for product safety did not significantly influence whether participants consumed oysters, but did significantly influence the decision of how frequently oysters were consumed. Twenty-five percent of consumers indicated they ate oysters less frequently due
to product safety concerns.
Capps and Lambregts (1991) used scanner data to study the demand for fish and shellfish (shrimp, crab, lobster, oysters, and scallops) products in a Texas retail food firm predominantly ca- tering to high-income customers. Own-price elasticity and season- ality were not statistically significant factors in purchases of oys-
ters. Demand for oysters was affected by advertising. Own- advertisement elasticity (0.059) was positive. Cross-advertisement elasticities for finfish (-0.224) and poultry (0.473) suggested that advertisement space for finfish and poultry influences oyster pur-
8/3/2019 A Review of the Market Structure of the Louisiana Oyster Industry
http://slidepdf.com/reader/full/a-review-of-the-market-structure-of-the-louisiana-oyster-industry 31/42
chases.
Little is known about the at-home demand for specific forms of oyster products (i.e. canned and stews), demand for away-from-
home consumption of oysters, or changes in oyster demand over time. Lipton and Kirkley (1994) evaluated the trends in at-home oyster consumption, comparing data from the 1977/1078 and the 1987/1988 USDA National Food Consumption Survey. They found that the share of oyster purchases represented by each oi 3 oyster product types (fresh/frozen shucked oysters, canned smoked or salted oysters, and oyster stew) had changed over the 10-year period. The share of fresh/frozen-shucked oyster had decreased only slightly, from 54% to 50%. The share of canned oysters doubled, from 25% to 50%. The share of oyster stew fell from 21% to 0%. The increasing share of canned oysters, combined with a high price for smoked eastern oysters compared with the Pacific oyster counterpart, led Lipton and Kirkley ( 1994) to conclude that
canned, smoked eastern oysters is one product for which "there appears to be wide open market" for oyster producers.
"The changing socio-demographic and economic structure of the US population, as well as changes in consumer lifestyles, has contributed to the increased popularity of food away from home."
Nayga and Capps (1995) measured the effect of socioeconomic factors on the probability of consuming fish and shellfish away from home. The findings generally indicated that older people, people with higher income, people with smaller household sizes, and people on a special diet are more likely to eat fish and shellfish away from home. The study recommended that fish marketers and
8/3/2019 A Review of the Market Structure of the Louisiana Oyster Industry
http://slidepdf.com/reader/full/a-review-of-the-market-structure-of-the-louisiana-oyster-industry 32/42
processors emphasize these factors when formulating marketing strategies designed to promote consumption.
C (implements and Substitutes
According to Cheng and Capps ( 1988). the cross-price elastic- ity (0.1991 ) between red meat and oysters suggested that red meat and oysters were gross substitutes. Cross-price elasticity between oysters and poultry was not statistically significant.
[Begin Page: Page 846]
846
WlRTH AND MlNTON
Capps and Lambregts ( 1 99 1 ) found that, in Texas, cross-price effects for other shellfish (1.21) are positive and statistically sig- nificant, supporting the notion that other shellfish species (shrimp, crabs, lobster, and scallops) are substitutes for oysters. Cross-price effects for finfish, pork, poultry, and beef were not significantly
different from zero.
Domestic Competitors
The major competitor for Louisiana oysters are oysters pro- duced in other regions of the United States. Oysters are harvested
8/3/2019 A Review of the Market Structure of the Louisiana Oyster Industry
http://slidepdf.com/reader/full/a-review-of-the-market-structure-of-the-louisiana-oyster-industry 33/42
in 18 of the 21 contiguous coastal states. Four species of oysters are presently being cultivated in the United States. Crassostrea virginica, the eastern oyster, is the principal species on the Atlantic Coast and the Gulf of Mexico, and accounts for most US oyster
landings. Crassostrea gigas. the Pacific oyster, is the primary cul- ture species on the West Coast and second in volume produced, with approximately 3.600 metric tons (8 million pounds) produced annually (National Marine Fisheries Service 2003). Two species of the genus Ostrea are also cultivated at low levels. Ostrea edulis, the European oyster, is grown in Maine, and Ostrea lurida, the native West Coast Olympia oyster, is the basis for a small industry in the states of Washington and Oregon (Burrell 1985).
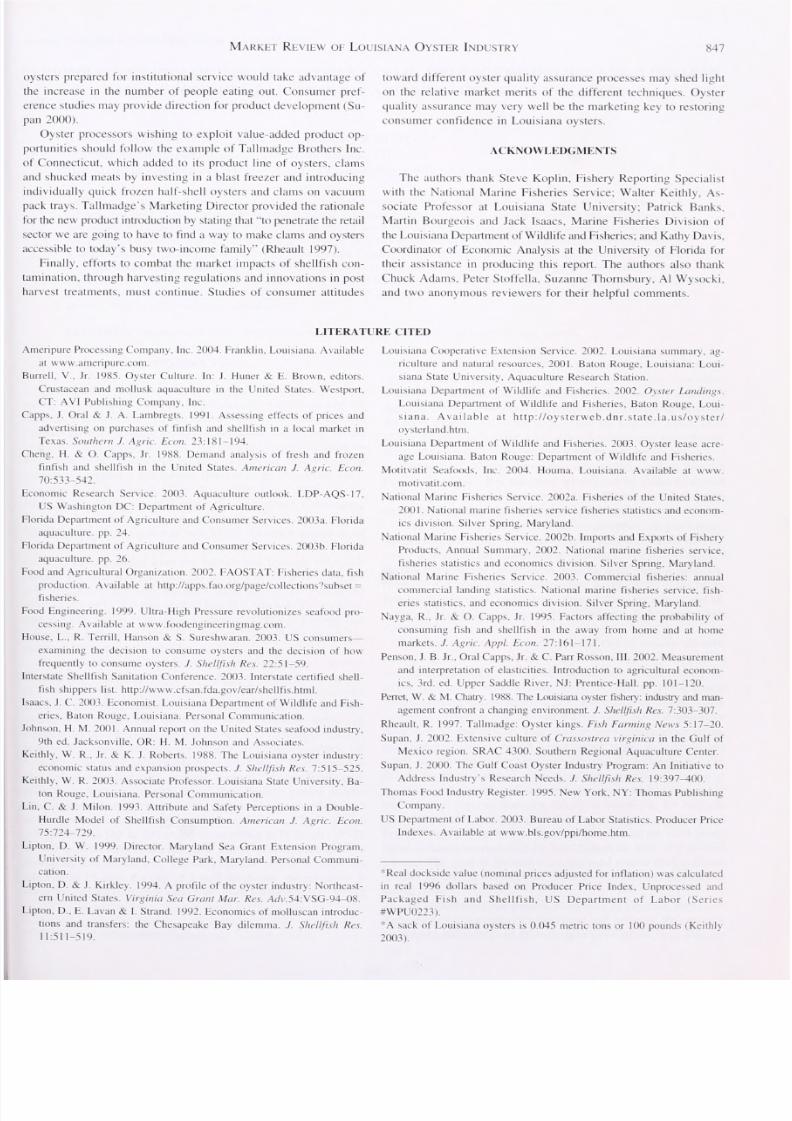
The catastrophic decline in natural eastern oyster populations in the Chesapeake Bay left the Maryland and Virginia oyster indus- tries in near collapse. Because the main cause of the historical
decline is most likely overharvesting. Dermo and MSX. occur- rences caused by parasitic protozoa, have essentially wiped out remaining natural stocks and made traditional culture methods in the region unproductive. Figure 6 shows eastern oyster harvests in Maryland. Virginia, and Louisiana from 1950 to 2001 . In Virginia, oyster production peaked in 1958 with 11.800 metric tons (26 million pounds) and has declined drastically ever since, reporting
just over 91 metric tons (0.2 million pounds) in 2001 . In Maryland, the harvest peaked in 1954 and again in 1973 with 9.000 metric tons (20 million pounds). The Maryland industry produced 590 metric tons (1.3 million pounds) in 2001 (National Marine Fish- eries Service 2003).
8/3/2019 A Review of the Market Structure of the Louisiana Oyster Industry
http://slidepdf.com/reader/full/a-review-of-the-market-structure-of-the-louisiana-oyster-industry 34/42
Other species of bivalves, including clams, mussels, and scal- lops also compete with Louisiana oysters for market share. The mam non-oyster bivalve competitor is the hard clam. Mercenaria
mercenaria, which is widely distributed throughout the Atlantic and Gulf of Mexico coastal waters, and has long supported a major commercial fishery in the New England and Mid-Atlantic coastal
states. US cultured clam output was 4,900 metric tons (10.7 mil- lion pounds) in 1999, with a reported value of $42.0 million. On the top ten US seafood list for the last decade, per capita consump- tion of clams was 0.22 kg (0.49 pounds) in 2000 (Johnson 2001 ).
Imports and Exports
The United States imports, largely from the Asian region, are principally low-value canned or smoked oysters. Imports were
high in 1987 at 23.600 metric tons (52.0 million pounds), however they declined to 12.500 metric tons (27.5 million pounds) by 1990 (Lipton et al. 1992). In 2002. US oyster imports totaled 8,700 metric tons ( 19.1 million pounds) worth $36.9 million (Economic Research Service 2003). Imports of fresh and frozen oysters ac- counted for approximately one-third of total oyster imports in
2002, whereas canned oysters accounted for the remaining two- thirds imported for consumption (National Marine Fisheries Ser- vice 2002b). The United States exports far fewer oysters than are imported. Oyster exports in 2002 totaled 1.800 metric tons (3.9 million pounds) with a value of $8.7 million (Economic Research Service 2003). The United States oyster exports are comprised of
8/3/2019 A Review of the Market Structure of the Louisiana Oyster Industry
http://slidepdf.com/reader/full/a-review-of-the-market-structure-of-the-louisiana-oyster-industry 35/42
fresh and frozen product; no canned oysters were exported by the United States in 2002 (National Marine Fisheries Service 2002b). Because little of the United States oyster harvest is canned, the degree of competition between imports and Louisiana oysters is
debatable. In a survey of United States oyster wholesalers by Lip- ton and Kirkley (1994), 44% of the Louisiana dealers believed imports posed a problem for increasing domestic sales.
CONCLUSION
This analysis has identified and explored several key issues that the Louisiana oyster industry must confront and solve to assure future industry growth and success. There seems to be room for expansion in the United States and Louisiana oyster-processing sector, especially value-added services such as breaded or smoked oysters. There are now basically only 2 eastern oyster products,
whole oysters and fresh-shucked oysters. As oyster production increases through industry revitalization efforts and aquaculture production, new product forms will have to be developed (Lipton & Kirkley 1994). Expansion of the processing sector will generate increased oyster industry revenues through time. Other value- added shellfish products (especially shrimp and clams) have been created for the institutional trade and as convenience items for
home use. Specialty products such as soups, stews, and breaded
a
5
8/3/2019 A Review of the Market Structure of the Louisiana Oyster Industry
http://slidepdf.com/reader/full/a-review-of-the-market-structure-of-the-louisiana-oyster-industry 36/42
o
12
10
0)
1 8
1950 1955 1960 1965 1970 1975 1980 1985 1990 Figure 6. Eastern Oyster Landings for Selected States, 195(1 to 20(11.
1995 2000
[Begin Page: Page 847]
Market Review of Louisiana Oyster Industry
847
oysters prepared for institutional service would take advantage of
the increase in the number of people eating out. Consumer pref- erence studies may provide direction for product development (Su- pan 2000).
Oyster processors wishing to exploit value-added product op-
8/3/2019 A Review of the Market Structure of the Louisiana Oyster Industry
http://slidepdf.com/reader/full/a-review-of-the-market-structure-of-the-louisiana-oyster-industry 37/42
portunities should follow the example of Tallmadge Brothers Inc. of Connecticut, which added to its product line of oysters, clams and shucked meats by investing in a blast freezer and introducing individually quick frozen half-shell oysters and clams on vacuum
pack trays. Tallmadge's Marketing Director provided the rationale for the new product introduction by stating that "to penetrate the retail sector we are going to have to find a way to make clams and oysters accessible to today*s busy two-income family" (Rheault 1997).
Finally, efforts to combat the market impacts of shellfish con- tamination, through harvesting regulations and innovations in post harvest treatments, must continue. Studies of consumer attitudes
toward different oyster quality assurance processes may shed light on the relative market merits of the different techniques. Oyster quality assurance may very well be the marketing key to restoring consumer confidence in Louisiana oysters
ACKNOWLEDGMENTS
The authors thank Steve Koplin, Fishery Reporting Specialist with the National Marine Fisheries Service; Walter Keithly. As- sociate Professor at Louisiana State University; Patrick Banks.
Martin Bourgeois and Jack Isaacs. Marine Fisheries Division of the Louisiana Department of Wildlife and Fisheries; and Kathy Davis, Coordinator of Economic Analysis at the University of Florida for then assistance in producing this report. The authors also thank Chuck Adams, Peter Stoffella, Suzanne Thornsbury. Al Wysocki. and two anonymous reviewers for their helpful comments.
8/3/2019 A Review of the Market Structure of the Louisiana Oyster Industry
http://slidepdf.com/reader/full/a-review-of-the-market-structure-of-the-louisiana-oyster-industry 38/42
LITERATURE CITED
Ameripure Processing Company, Inc. 2004. Franklin. Louisiana. Available
at www.ameripure.com.
Burrell. V., Jr. 1985. Oyster Culture. In: J. Huner & E. Brown, editors. Crustacean and mollusk aquaculture in the United States. Westport. CT: AVI Publishing Company, Inc.
Capps. J. Oral & J. A. Lambregts. 1991. Assessing effects of prices and advertising on purchases of finfish and shellfish in a local market in Texas. Soul/win J. Agric. Eton. 23:181-194.
Cheng, H. & O. Capps, Jr. 1988. Demand analysis of fresh and frozen finfish and shellfish in the United States. American .1. Agric. Econ.
70:533-342.
Economic Research Service. 2003. Aquaculture outlook. LDP-AQS-I7. US Washington DC: Department of Agriculture.
Florida Department of Agriculture and Consumer Services. 2003a. Florida aquaculture. pp. 24.
Florida Department of Agriculture and Consumer Services. 2003b. Florida aquaculture. pp. 26.
Food and Agricultural Organization. 2002. FAOSTAT: Fisheries data, fish
8/3/2019 A Review of the Market Structure of the Louisiana Oyster Industry
http://slidepdf.com/reader/full/a-review-of-the-market-structure-of-the-louisiana-oyster-industry 39/42
production. Available at http://apps.fao.org/page/collections7subset = fisheries.
Food Engineering. 1999. Ultra-High Pressure revolutionizes seafood pro-
cessing. Available at www.foodengineeringmag.coni.
House. L.. R. Terrill. Hanson & S. Sureshwaran. 2003. US consumers — examining the decision to consume oysters and the decision of how frequently to consume oysters. J. Shellfish Res. 22:51-59.
Interstate Shellfish Sanitation Conference. 2003. Interstate certified shell- fish shippers list. http://www.cfsan.Ida.gov/ear/shelltis.html.
Isaacs, J. C. 2003. Economist. Louisiana Department of Wildlife and Fish- eries. Baton Rouge. Louisiana. Persona] Communication.
Johnson. H. M. 2001. Annual report on the United States seafood industry.
9th ed. Jacksonville. OR: H. M. Johnson and Associates.
Keithly. W. R„ Jr. & K. J. Roberts. 1988. The Louisiana oyster industry: economic status and expansion prospects. J. Shellfish Res. 7:515-525.
Keithly. W. R. 2003. Associate Professor. Louisiana State University. Ba-
ton Rouge. Louisiana. Personal Communication.
Lin. C. & J. Milon. 1993. Attribute and Safety Perceptions in a Double- Hurdle Model of Shellfish Consumption. American J. Agric. Econ. 75:724-729.
8/3/2019 A Review of the Market Structure of the Louisiana Oyster Industry
http://slidepdf.com/reader/full/a-review-of-the-market-structure-of-the-louisiana-oyster-industry 40/42
Upton, D. W. 1999. Director. Maryland Sea Grant Extension Program, University of Maryland, College Park. Maryland. Personal Communi- cation.
Lipton. D. & J. Kirkley. 1994. A profile of the oyster industry: Northeast- ern United States. Virginia Sea Gram Mar. Res. /Wv.54:VSG-94-08.
Lipton. D„ E. Lavan & I. Strand. 1992. Economics of molluscan introduc- tions and transfers: the Chesapeake Bay dilemma. J. Shellfish Res. 11:511-519.
Louisiana Cooperative Extension Service. 2002. Louisiana summary, ag- riculture and natural resources, 2001. Baton Rouge. Louisiana: Loui- siana State University. Aquaculture Research Station.
Louisiana Department of Wildlife and Fisheries. 2002. Oyster Landings.
Louisiana Department of Wildlife and Fisheries. Baton Rouge. Loui- siana. Available at http://oysterweb.dnr.state.la.us/oyster/ oysterland.htm.
Louisiana Department of Wildlife and Fisheries. 2003. Oyster lease acre- age Louisiana. Baton Rouge: Department of Wildlife and Fisheries.
Motitvatit Seafoods, Inc. 2004. Houma. Louisiana. Available at www. motivatit.com.
National Marine Fisheries Service. 2002a. Fisheries of the United States. 2001. National marine fisheries service fisheries statistics and econom-

8/3/2019 A Review of the Market Structure of the Louisiana Oyster Industry
http://slidepdf.com/reader/full/a-review-of-the-market-structure-of-the-louisiana-oyster-industry 41/42
ics division. Silver Spring. Maryland.
National Marine Fisheries Service. 2002b. Imports and Exports of Fishery Products. Annual Summary, 2002. National marine fisheries service,
fisheries statistics and economics division. Silver Spring. Maryland.
National Marine Fisheries Service. 2003. Commercial fisheries: annual commercial landing statistics. National marine fisheries service, fish- eries statistics, and economics division. Silver Spring. Maryland.
Nayga. R.. Jr. & O. Capps. Jr. 1995. Factors affecting the probability of consuming fish and shellfish in the away from home and at home markets. J. Agric. Appl. Econ. 27:161-171.
Penson. J. B. Jr.. Oral Capps. Jr. & C. ParrRosson. III. 2002. Measurement and interpretation of elasticities. Introduction to agricultural econom- ics. 3rd. ed. Upper Saddle River. NJ: Prentice-Hall. pp. 101-120.
Penet, W. & M. Chatry. 1988. The Louisiana oyster fishery: industry and man- agement confront a changing environment. J. Shellfish Res. 7:303-307.
Rheault, R. 1997. Tallmadge: Oyster kings. Fish Farming News 5:17-20.
Supan, J. 2002. Extensive culture of Crassostrea virginica in the Gulf of Mexico region. SRAC 4300. Southern Regional Aquaculture Center.
Supan, J. 2000. The Gulf Coast Oyster Industry Program: An Initiative to Address Industry's Research Needs. J. Shellfish Res. 19:397-400.
8/3/2019 A Review of the Market Structure of the Louisiana Oyster Industry
http://slidepdf.com/reader/full/a-review-of-the-market-structure-of-the-louisiana-oyster-industry 42/42
Thomas Food Industry Register. 1995. New York. NY: Thomas Publishing Company.
US Department of Labor. 2003. Bureau of Labor Statistics. Producer Price
Indexes. Available at www.bls.gov/ppi/home.htm.
"Real dockside value (nominal prices adjusted for inflation) was calculated
in real 1996 dollars based on Producer Price Index. Unprocessed and
Packaged Fish and Shellfish. US Department of Labor (Series
#WPU0223).
*A sack of Louisiana oysters is 0.045 metric tons or 100 pounds I Keithl)
2003).
[Begin Page: Page 848]