Embed Size (px)
Citation preview

NCEO Report 408
A Review of the Literature on
Measuring English
Language Proficiency Progress of
English Learners with
Disabilities and English Learners

NCEO Report 408
A Review of the Literature on Measuring English Language Profi ciency Progress of English Learners with Disabilities and English Learners
Kristin K. Liu, Martha L. Thurlow, Anastasia M. Press, and Olivia Lickteig
July 2018
All rights reserved. Any or all portions of this document may be reproduced and distributed without prior permission, provided the source is cited as: Liu, K. K., Thurlow, M. L., Press, A. M., & Lickteig, O. (2018). A review of the literature on measuring English Language Profi ciency progress of English learners with disabilities and English learners (NCEO Report 408). Minneapolis, MN: University of Minnesota, National Center on Educational Outcomes.

National Center on Educational OutcomesUniversity of Minnesota • 207 Pattee Hall150 Pillsbury Dr. SE • Minneapolis, MN 55455Phone 612/626-1530 • Fax 612/624-0879http://www.nceo.info
The University of Minnesota shall provide equal access to and opportunity in its programs, facilities, and employment without regard to race, color, creed, religion, national origin, gender, age, marital status, disability, public assistance status, veteran status, sexual orientation, gender identity, or gender expression.
This document is available in alternative formats upon request.
NCEO Core Staff
Martha L. Thurlow, DirectorDeb A. AlbusAllyson CandeeLinda GoldstoneMaureen HawesSheryl S. LazarusKristi K. Liu
Charity Funfe Tatah Mentan Michael L. MooreDarrell PetersonChristopher Rogers Kathy StrunkYi-Chen Wu
The Center is supported through Cooperative Agreements (#H326G160001) with the Research to Practice Division, Office of Special Education Programs, U.S. Department of Education. The Center is affiliated with the Institute on Community Integration at the College of Education and Human Develop-ment, University of Minnesota. The contents of this report were developed under the Cooperative Agreement from the U.S. Department of Education, but does not necessarily represent the policy or opinions of the U.S. Depart-ment of Education or Offices within it. Readers should not assume endorse-ment by the federal government.
Project Officer: David Egnor
In collaboration with:

Executive Summary
The Every Student Succeed Act (ESSA) requires states to document progress of English learners (ELs) on the state’s English language proficiency (ELP) assessment as part of their Title I ac-countability system, and to disaggregate those results for ELs with disabilities. This requirement is in addition to the Title III requirement to report on the number and percentage of ELs making progress toward achieving English language proficiency, and to disaggregate those results, at a minimum, for ELs with disabilities.
The purpose of this literature review was to identify evidence-based practices used (or recommended for use) to measure progress of ELs with disabilities on ELP assessments. Due to the small body of literature on ELP progress for ELs with disabilities, we included articles that measured ELP progress for ELs more broadly.
In this report, we discuss how studies have defined ELP progress and the extent to which studies have examined ELP progress for ELs with disabilities. In addition, we examine the methodologies used to measure ELP progress, the evidence base for the studies, and findings specific to ELs with disabilities. The strength of the evidence base was evaluated based on: (a) transparency of study methods, (b) study samples, and (c) author-identified study limitations.
The literature search involved two steps. First, we searched online databases for relevant articles. Second, we conducted a hand search of eight relevant journals. We then reviewed and evaluated article abstracts according to a set of inclusion criteria. Twenty-four articles met the inclusion criteria. These articles were then coded for basic study information, sample characteristics, meth-odology details, major findings, findings specifically about students with disabilities, and author-identified limitations of the studies. We separated articles based on whether their primary topic was: (a) measuring time to being reclassified as English proficient and exited from EL services, or (b) measuring year-to-year progress in English language proficiency. Of the 24 articles that met the inclusion criteria, nineteen measured ELs’ time to proficiency (i.e., time-to-reclassification), 11 of which presented results on ELs with disabilities. Five studies measured year-to-year progress in English language proficiency, none of which included ELs with disabilities in the study sample.
Studies focusing on time-to-reclassification primarily relied on either survival analysis or descriptive analyses, with one study employing two other methodologies. Survival analysis was used to examine the likelihood that an average EL in a population would experience reclassification by a particular time. Descriptive analyses were used to report a number of statistics related to reclassification such as the average amount of time ELs were in EL services before being reclassified, the number of students who attained English language proficiency, the percentage of eligible students who were reclassified, the likelihood of a student becoming a long-term EL, and the cumulative percentage of students reclassified after a particular point in time. Researchers using either survival analysis

or descriptive analyses also compared groups of students based on variables such as policy factors, district and school factors, and student factors. One study of time-to-reclassification (Matta, 2016) did not use either descriptive analyses or survival analysis, and instead opted to utilize a multilevel, multivariate random effects model (MVREM), as well as a multilevel shared random effects model (SREM). Studies focusing on year-to-year progress in English language proficiency used a variety of methods including: Repeated measures ANOVA, t-tests, growth trajectories, and calculating the percentage of ELs who increased on overall performance levels on the state English language proficiency assessment.
Findings specific to ELs with disabilities were provided by 11 of the time-to-reclassification studies and by none of the year-to-year progress studies. A key finding from studies that pre-sented data on ELs with disabilities was that, when compared to ELs without disabilities, these students were less likely to achieve proficiency and reclassification during the study. Thus they were more likely to become long-term ELs.
None of the peer-reviewed literature examined methods currently in use (or being considered for use) by states to measure progress on ELP assessments. Despite this, the literature does have some important implications for the consideration of methodologies for measuring the ELP progress of ELs with disabilities on ELP assessments. First, the studies that included ELs with disabilities (time-to-reclassification studies) confirmed the importance of attending to, and documenting, how many ELs with disabilities are not included in the progress measure because of missing data or data censoring processes. The same recommendation applied to year-to-year progress studies, which also were limited by sample size, missing data, and non-random samples.
Recommendations for researchers include the need to conduct research more directly relevant to the methodologies that states might use to measure the progress of ELs with disabilities on state measures of English language proficiency. In part, this might be accomplished by working with states to analyze their data in terms of approaches to measuring progress, conducting both quantitative and qualitative studies. Of critical focus should be the documentation of whether there is differential censoring of data or missing data for ELs with disabilities compared to ELs without disabilities.
Recommendations for practitioners include the need to document the extent to which ELs with disabilities are included, noting both number and percentage of those in the population. States are encouraged to work with researchers to examine the state’s data to document the appropriateness of various approaches. Further, educators in the classroom are encouraged to use formative assessment approaches to provide a basis for intervening on the progress of ELs with disabilities on the state ELP assessment.

Table of Contents
Executive Summary ........................................................................................................................... iii
Overview ..............................................................................................................................................1
Federal Requirements to Measure ELP Progress .........................................................................1
Need for a Literature Review on ELP Progress of ELs with Disabilities ....................................3
Methods ................................................................................................................................................3
Literature Search Strategy ............................................................................................................3
Screening and Coding ..................................................................................................................4
Other Sources Used ......................................................................................................................5
Organization of Review ................................................................................................................5
Studies of Time-to-Reclassification .....................................................................................................6
Definitions of Progress in English Proficiency ...........................................................................8
Study Methodologies of Time-to-Reclassification Studies ..........................................................8
Findings of Time to Reclassification Studies .............................................................................12
Evidence Base for Time-to-Reclassification Studies .................................................................20
Studies of Year-to-Year Progress in English Language Proficiency ..................................................24
Definitions of Progress in English Language Proficiency .........................................................24
Study Methodologies of Year-to-Year Progress Studies ............................................................25
Findings of Year-to-Year Progress Studies ...............................................................................27
Evidence Base of Year-to-Year Progress Studies .......................................................................29
Discussion and Conclusion ................................................................................................................31
How to Measure ELP Progress of ELs with Disabilities ...........................................................32
Recommendations ......................................................................................................................33
References ..........................................................................................................................................35
Appendix A: Descriptive Information for Time-to-Reclassification Studies .....................................41
Appendix B: Descriptive Information for Year-to-Year Growth Studies ...........................................49
Appendix C: Reclassification Criteria Described by Reviewed Literature ........................................51

1NCEO
Overview
Schools in the United States serve a linguistically diverse population of students. The U.S. De-partment of Education estimates that 9.1 percent of public school students in the United States were English learners (ELs) in 2014-15. These are students who meet the federal definition of English learners, referred to in the Individuals with Disabilities Education Act (2004) as limited English proficient (LEP), and formerly referred to as LEP in the Elementary and Secondary Education Act of 1965 (Sec. 8101), or more recently as English language learners (ELLs), prior to their designation as ELs in the Every Student Succeeds Act (ESSA) of 2015.
Statistics about ELs, which generally include only those who are receiving EL services, indi-cate that the number of ELs is increasing and likely to continue to increase (U.S. Department of Education, National Center for Education Statistics [NCES], 2017). These 4.6 million ELs present unique instructional challenges for school districts, education agencies, and states as educators work to develop their English language proficiency.
Roughly 14% of ELs had a disability in 2014-15 (U.S. Department of Education, n.d.). ELs with disabilities may require increased capabilities in school professionals and education agen-cies to meet their needs to learn English skills at the same time they are acquiring content and expectations for behaviors or functioning in schools. These students, by definition, are students who must progress toward proficiency in speaking, reading, writing, or understanding English; they also have one or more disabilities that affect their academic and behavioral functioning and possibly their acquisition of the English language. Documenting how educators and poli-cymakers can determine the degree of progress in English proficiency that ELs with disabilities are making poses a significant problem. The purpose of this report is to review the literature on methods for measuring English language proficiency (ELP) “progress” for ELs with disabilities.
Federal Requirements to Measure ELP Progress
The Elementary and Secondary Education Act was reauthorized in 2015 as the Every Student Succeeds Act (ESSA). In a new provision, ESSA requires the inclusion of English language pro-ficiency as an accountability indicator for Title I (Improving Basic Programs Operated by State and Local Educational Agencies). Specifically, the indicator is described in this way in ESSA:
(B) INDICATORS. – …. (iv) For public schools in the State, progress in achieving English language profi-ciency, as defined by the State and measured by the assessments described in subsection (b)(2)(G), within a State-defined timeline for all English learners – (I) in each of the grades 3 through 8; and

2 NCEO
(II) in the grade for which such English learners are otherwise assessed under subsection (b)(2)(B)(v)(I) during the grade 9 through grade 12 period, with such progress being measured against the results of the assessments described in subsection (b)(2)(G) taken in the previous grade. (Sec. 1111(c)(4)(B))
Title I indicators are to be disaggregated by subgroup. Thus, states reporting on the ELP indica-tor for Title I must report the progress of ELs with disabilities in achieving English language proficiency.
For Title III (Language Instruction for English Learners and Immigrant Students), ESSA re-porting requirements focus on five measures in addition to a first measure of descriptions of programs and activities, and any other information the state thinks is relevant:
Sec. 3121. REPORTING…. (2) the number and percentage of English learners in the programs and activi-ties who are making progress toward achieving English language proficiency, as described in section 1111(c)(4)(A)(ii), in the aggregated and disaggregated, at a minimum, by English learners with a disability; (3) the number and percentage of English learners in the programs and activities attaining English language proficiency based on State English language proficiency standards established under section 1111(b)(I)(G) by the end of the school year, as de-termined by the State’s English language proficiency assessment under section 111(b)(2)(G); (4) the number and percentage of English learners who exit the language instruction educational programs based on their attainment of English language proficiency; (5) the number and percentage of English learners meeting challenging State academic standards for each of the 4 years after such children are no longer receiv-ing services under this part, in the aggregate and disaggregated, at a minimum, by English learners with a disability; (6) the number and percentage of English learners who have not attained English language proficiency within 5 years of initial classification as an English learner and first enrollment in the local educational system;…. (Sec 3121(a)) (emphasis added)
The new Title I indicator on the inclusion of EL progress in state accountability systems and the second and fifth Title III reporting requirements are most relevant to this review. They require states to measure and then report the ELP progress of ELs with disabilities. ESSA does not recommend specific methods to achieve the accountability objectives. Both Title I and Title III refer to progress in English language proficiency, although the literature also uses the term growth. In this report, we primarily use the term progress to reflect the requirements of Title I
3NCEO
and Title III that apply to ELs with disabilities. Yet, in our search of the literature, we used both terms to ensure the identification of all relevant literature.
Need for a Literature Review on ELP Progress of ELs with Disabilities
There is general consensus on the importance of measuring the progress of all ELs in reach-ing English proficiency. Each year that students remain ELs, they are more likely to have poor educational outcomes, including English skills that are too poorly developed for complex aca-demic tasks, a pattern of non-participation in classes, and limited access to grade-level content (Olsen, 2014). Although states have been measuring the progress of their total population of ELs in reaching English language proficiency, or the extent to which they are reclassified as no longer an EL, they have not necessarily been disaggregating the data for ELs with disabilities as now required by ESSA.
The purpose of this literature review is to identify evidence-based practices used (or recommended for use) to measure progress of ELs with disabilities on ELP assessments. Due to the small body of literature on ELP progress for ELs with disabilities, we also include articles that measured ELP progress for ELs more broadly. In this report, we discuss how studies have defined ELP progress and the extent to which studies have examined ELP progress for ELs with disabilities. In addition, we examine the methodologies used to measure ELP progress, the evidence base for the studies, and findings specific to ELs with disabilities.
In creating an evidence-based practice literature review, we needed to determine how we would describe the strength of the evidence for a non-intervention educational practice. We chose to adopt a definition of evidence-based practice as one that demonstrates a rationale based on high-quality research findings. Research findings in this review were evaluated for quality based on: (a) transparency of methods, (b) study limitations, and (c) study samples. These are defined in the Methods section.
Methods
Literature Search Strategy
The literature search involved two steps. First, the authors searched the following online da-tabases to identify articles: ERIC, Academic Search Premier, JSTOR, and PsychINFO. We used combinations of the following search terms: English language proficien*, limited English proficien*, improvement, progress, growth, disabilit*, special need*, special education, Eng-lish learner reclassification, reclassification, English language arts, English learner*, English language learner*, emergent bilingual*, dual language learner*, survival analysis, hazard
4 NCEO
analysis, and event history analysis. The presence of an asterisk at the end of a search term allows for the search engine to find any results that contain different variations of the stem word. For example, a search containing the term proficien* searches for the terms proficient, proficiency, and proficiencies.
Over the course of the search process, the authors made several decisions about key search terms. First, searches were run with and without the term “disability” (i.e., disabilit*) to look for studies that focused specifically on ELs with disabilities, our primary focus, as well as those studies examining a broader population of ELs that might include ELs with disabilities in the study sample. Second, English language arts was included as a search term because we hypoth-esized that relevant literature might also be available in this content area (e.g., studies of reading growth for ELs). Third, we added the term survival analysis to our search terms because this has been a common analytical method in research examining how long it takes ELs to develop sufficient proficiency to exit from EL services (R. Slama, personal communication, May 25, 2017). Other terms for survival analysis approaches, such as hazard analysis and event history analysis, were included. The database searches yielded 1,467 search results, with some articles showing up in more than one set of search terms.
After identifying potential articles through database searches, we verified the comprehensiveness of the search using several methods. We conducted a hand search of eight relevant journals: (a) Exceptional Children, (b) The Journal of Special Education, (c) TESOL Quarterly, (d) TESOL Journal, (e) Journal of Education for Students Placed at Risk (JESPAR), (f) Language Assess-ment Quarterly, (g) The Journal of Educational Research, (h) and the National Association for Bilingual Education (NABE) Bilingual Research Journal. These journals either focused on lan-guage assessment or on students from special populations (e.g., ELs, students with disabilities). Additionally, we checked the references of two relevant articles (Estrada & Wang, 2013; Kuti & Xu, 2012), used the ‘cited by’ function of Google Scholar to identify any missing studies on survival analysis, and checked ELP assessment consortia (e.g., WIDA, ELPA21) websites for research reports created by testing companies. These hand searches resulted in no articles or reports being added to our study.
Screening and Coding
The research team reviewed and evaluated article abstracts according to the following inclusion criteria: The study was: (a) published between January 2007 and June 2017; (b) published in the U.S.; (c) addressed a K-12 student population; (d) focused on ELs with disabilities specifi-cally, or ELs more generally; (e) used empirical research methods or reported student-centered empirical data; (f) included a standardized measure of English language proficiency or measured time-to-reclassification or likelihood of reclassification; and (g) focused on student progress in English proficiency over time. In the case of similar articles published by the same authors

5NCEO
using the same data set, we chose to include only the most recent one (e.g., Thompson, 2015, was included instead of Thompson, 2012). Twenty-four articles met the inclusion criteria.
All 24 articles were coded for basic study information such as author, title, year published, study design, participant demographics, and research questions. Two primary ways of measur-ing progress were evident in the collected articles and reports. We separated articles based on whether the primary topic was: (a) measuring time to reclassification as English proficient and exit from EL services, or (b) measuring year-to-year progress in English language proficiency. Nineteen articles measured ELs’ time to proficiency (i.e., time-to-reclassification) (see Appen-dix A for a complete listing). Five articles measured year-to-year progress in English language proficiency (see Appendix B for a complete listing).
When coding articles that addressed time-to-reclassification, we recorded information on study samples, the number of years of data included, assessments used to measure English language proficiency, criteria for reclassification, analysis method, major findings, findings specifically about students with disabilities, factors that affected time-to-reclassification, and author-identified limitations of the studies.
When coding articles addressing year-to-year progress, we recorded four types of information: (a) the definition of progress in English language proficiency (i.e., what criteria did ELs need to meet to be considered progressing); (b) the data, analyses, and methods used to determine whether ELs met this growth definition; (c) the reported trends in ELP progress, including vari-ables that affected ELP growth and overall ELP progress trends; and (d) the findings related to measuring progress of ELs with disabilities on the ELP assessment.
Other Sources Used
For this report, we used two additional sources to help guide and structure our presentation of various research methodologies used to measure progress, as well as our evaluation of the quality of individual studies. Cook, Linquanti, Chinen, and Jung (2012) outlined state approaches used to set ELP performance criteria and monitor EL progress, including descriptions of survival analysis and descriptive analysis. Hosmer, Lemeshow, and May (2008) provided additional detail on survival analysis.
Organization of Review
This review provides an overview of the analytical methods used to measure ELP progress for ELs with disabilities and all ELs using a narrative format that addresses the quality of the evidence base for the methods, as well as overall findings. We grouped the studies into sections based on analytical methods, under the umbrella of either time-to-reclassification or year-to-year

6 NCEO
progress. For each analytic approach, we first identified how many articles explicitly measured progress of ELs with disabilities. We then explored how each study defined progress in devel-oping English proficiency, how the studies measured ELP progress, general findings, and the evidence base of the methods. We evaluated the evidence base of the methods according to: (a) transparency of methods, (b) completeness of the description of the study sample, and (c) limitations identified by the authors (see Appendices A and B for more details). We conclude each method by presenting findings specific to ELs with disabilities.
Studies of Time-to-Reclassification
ELs are eligible to receive English language development services until they reach proficiency in English as defined by the state for which the data were examined. At that point, if they also meet any other district criteria, students are exited from EL services and reclassified as English proficient. Reclassified students exit EL services and must continue to be monitored for at least two years (U.S. Department of Education, 2016). Nineteen studies addressed the amount of time it takes ELs to reach the goal of proficiency and achieve reclassification as English profi-cient. Table 1 lists the methodology for each of the 21 analyses in 19 studies addressing time to reclassification and indicates whether ELs with disabilities were included in the study sample or directly addressed in the results.
Eleven of the studies shown in Table 1 presented results on ELs with disabilities. Another four studies included ELs with disabilities in the study sample but did not report findings for them.
Table 1. Summary of Time to Reclassification Methodologies and Inclusion of ELs with Disabilities
Study Methodology
ELs with Disabilities
IncludedResults for ELs with Disabilities Included
Beardsley (2015) Survival analysis N N
Beardsley (2015) Descriptive N N
Burke et al. (2016) Survival analysis Y Y
Conger (2008) Survival analysis Y Y
Conger et al. (2012) Survival analysis N N
Estrada & Wang (2013) Descriptive N N
Haas et al. (2015) Descriptive Y Y
Haas et al. (2016a) Descriptive Y Y
Haas et al. (2016b) Descriptive Y Y

7NCEO
Study Methodology
ELs with Disabilities
IncludedResults for ELs with Disabilities Included
Kieffer & Parker (2016) Survival analysis Y Y
Kim et al. (2014) Survival analysis Y N
Matta (2016) Other Y Y
Mavrogordato & White (2017) Survival analysis Y N
Motamedi (2016) Descriptive Y Y
Motamedi et al. (2016) Survival analysis N N
Rubio – Study 1 (2014) Survival analysis N N
Rubio – Study 2 (2014) Descriptive Y Y
Slama (2014) Survival analysis Y N
Slama et al. (2015) Survival analysis Y Y
Thompson (2015) Survival analysis Y Y
Umansky & Reardon (2014) Survival analysis Y N
Total analyses: 21Survival: n=13
Descriptive: n=7Other: n=1
Survival Y: n=9Descriptive Y: n=5
Other Y: n=1
Survival Y: n=5Descriptive Y: n=5
Other Y: n=1
The 19 studies described English proficiency progress for students in 11 states including: Arizona (Haas, Huang, Tran, & Yu, 2015; Matta, 2016), California (Estrada & Wang, 2013; Thompson, 2015; Umansky & Reardon, 2014), Florida (Conger, Hatch, McKinney, Atwell, & Lamb, 2012; Kim, Curby & Winsler, 2014), Indiana (Burke, Morita-Mullaney, & Singh, 2016), Kentucky (Beardsley, 2015), Massachusetts (Slama, 2014; Slama, Haynes, Sacks, Lee, & August, 2015), Nevada (Haas, Huang, Tran, & Yu, 2016a), New York (Conger, 2008; Conger et al., 2012; Kieffer & Parker, 2016; Rubio, 2014), Texas (Mavrogordato & White, 2017), Utah (Haas, Huang, Tran, & Yu, 2016b), and Washington (Motamedi, 2016; Motamedi, Singh, & Thompson, 2016).
Students in these studies spoke 27 non-English home languages. The four most commonly in-cluded language groups across studies were: (a) Spanish (Beardsley, 2015; Burke et al., 2016; Conger, 2008; Conger et al., 2012; Estrada & Wang, 2013; Kieffer & Parker, 2016; Kim et al., 2014; Matta, 2016; Mavrogordato & White, 2017; Motamedi, 2016; Motamedi et al., 2016; Rubio, 2014; Slama, 2014; Slama et al., 2015; Thompson, 2015; Umansky & Reardon, 2014); (b) Cantonese or Mandarin Chinese (Conger, 2008; Conger et al., 2012; Kieffer & Parker, 2016; Motamedi et al., 2016; Rubio, 2014; Slama et al., 2015); (c) Russian (Conger, 2008; Conger et al., 2012; Kieffer & Parker, 2016; Motamedi et al., 2016; Rubio, 2014), and; (d) Korean (Conger, 2008; Kieffer & Parker, 2016; Motamedi, 2016; Thompson, 2015). Appendix A con-tains a detailed list of the languages addressed by each study; the appendix also includes, when available, the disability categories of ELs with disabilities.
Table 1. Summary of Time to Reclassification Methodologies and Inclusion of ELs with Disabilities (continued)

8 NCEO
Definitions of Progress in English Proficiency
For this section of the review, we conceptualize English language proficiency as an EL meeting state or district criteria to be reclassified as English proficient and thus eligible to be exited from EL services. Reclassification criteria vary state-by-state and sometimes even district-by-district (Thurlow, Shyyan, Lazarus, & Christensen, 2016). In each of the 19 articles that measured time-to-reclassification, different EL exit criteria were applied (see Appendix C).
Achieving a pre-determined score or level of proficiency on a state ELP assessment, either alone or in combination with other types of data, was a criterion used in all studies reviewed. The exact nature of the required scores varied. Some states required students to reach a particular overall performance level, determined by overall raw or composite scores on the state ELP assessment (Beardsley, 2015; Burke et al., 2016; Haas et al., 2015, 2016a, 2016b; Kim et al., 2014; Matta, 2016, Motamedi et al., 2016; Rubio, 2014). In other studies, EL exit criteria included scores on specific domains (e.g., listening, speaking, reading, writing) of the state ELP assessment. For example, in Umansky and Reardon’s (2014) study, exit criteria required the student to attain at least Level 3 out of five possible levels on each domain of the state ELP assessment. Similarly, in Haas et al.’s (2016a) study, students had to attain at least Level 4 out of 5 on each domain. In other studies, both a specific state ELP assessment score and a specific state content assessment score were required for exit (Haas et al., 2016b; Mavrogordato & White, 2017; Slama, 2014). In some cases, other criteria besides test scores also informed exit decisions. These other criteria included parent input (Estrada & Wang, 2013; Slama, 2014), teacher approval or input (Estrada & Wang, 2013; Mavrogordato & White, 2017; Slama, 2014; Thompson, 2015), student grades (Slama, 2014), student class work (Slama, 2014), and other standardized test scores such as in math (Estrada & Wang, 2013).
Study Methodologies of Time-to-Reclassification Studies
Studies focusing on time to reclassification primarily relied on survival analysis or descriptive analyses, with one study (Matta, 2016) employing two other methodologies. One of Rubio’s (2014) dissertation studies employed survival analysis, and the other one used descriptive analysis. Beardsley (2015) used both descriptive analysis and survival analysis. Each of these methodologies is described in more detail here.
Survival analysis. Survival analysis was the most common method used to measure the time to students’ reclassification as English proficient and their exit from EL services. Survival analysis approaches included discrete-time survival analysis, discrete-time survival analytic methods, hazard analysis, and discrete-time event history analysis. For this review, we use the term survival analysis to include all of these approaches. Survival analysis examines the likeli-

9NCEO
hood that an average member of a population will experience an event, endpoint, or hazard by a particular time.
Within the 13 survival analysis studies in our review (Beardsley, 2015; Burke et al., 2016; Conger, 2008; Conger et al., 2012; Kieffer & Parker, 2016; Kim et al., 2014; Mavrogordato & White, 2017; Motamedi et al., 2016; Rubio-Study 1, 2014; Slama, 2014; Slama et al., 2015; Thompson, 2015; Umansky & Reardon, 2014), five of them discussed findings specific to ELs with disabilities (Burke et al., 2016; Conger, 2008; Kieffer & Parker, 2016; Slama et al., 2015; Thompson, 2015). Four studies included students with disabilities in their student sample without presenting findings specific to ELs with disabilities (Kim et al., 2014; Mavrogordato & White, 2017; Slama, 2014; Umansky & Reardon, 2014). Four studies contained no mention of ELs with disabilities (Beardsley, 2015; Conger et al., 2012; Motamedi et al., 2016; Rubio, 2014-Study 1).
The beginning point of a survival analysis study is unique to that study. In the studies we re-viewed researchers set the beginning point at the start of a specific grade level; these ranged from kindergarten (Kieffer & Parker, 2016; Kim et al., 2014; Motamedi et al., 2016; Rubio-Study 1, 2014; Slama, 2014; Slama et al., 2015; Thompson, 2015; Umansky & Reardon, 2014) to grade nine (Beardsley, 2015). The endpoint for these studies was exit from EL services and reclassification as English proficient. The time between that beginning point and the endpoint is referred to as the survival time, generally, or time-to-reclassification within the context of these studies (Hosmer et al., 2008). Survival analysis studies generally calculate the expected amount of time a student will be in EL services before reclassification.
An important component of survival analysis is the act of censoring, or excluding, some data for students in the original dataset. Thompson (2015) noted that “for survival analysis to be valid, censoring must be non-informative,” (p. 16) meaning that the data are missing in a random way rather than systematically. Data are typically censored for students who did not experi-ence reclassification during the research study (Cook et al., 2012). In the studies we reviewed, students were censored for three main reasons: (a) students did not achieve reclassification by the end of the study (Burke et al., 2016; Conger, 2008; Kieffer & Parker, 2016; Kim et al., 2014; Mavrogordato & White, 2017; Motamedi et al., 2016; Rubio-Study 1, 2014; Slama, 2014; Thompson, 2015); (b) students moved out of the district during the study (Kieffer & Parker, 2016; Motamedi et al., 2016; Rubio-Study 1, 2014; Slama, 2014); and (c) students dropped out of school (Kieffer & Parker, 2016).
Cook et al. (2012) explained that “a survival function estimate cannot be calculated for students who do not attain the English-proficient criterion” (p. 35). They also noted that by only includ-ing non-censored students in the final analyses it is possible that results underestimate the time it takes for ELs to achieve proficiency and reclassification. Cook et al. state that to correct for this, researchers can compare the results from two different procedures: Censored Adjustment

10 NCEO
1, which yields underestimated results, and Censored Adjustment 2, which yields overestimated results. For Censored Adjustment 1, it is assumed that censored students all achieve reclassifica-tion the following academic year. Because it is unlikely that all censored students will actually reach reclassification during that time, estimates of time-to-reclassification from this procedure are lower than actual time-to-reclassification. On the other hand, Censored Adjustment 2 as-sumes that “students who started at the lowest proficiency level… take seven years to attain” reclassification, which is the “maximum time frame” to reach English proficiency according to “prior empirical research” (Cook et al., 2012, p. 36). Because it is unlikely that all censored students would take the maximum number of years to reach proficiency, estimates of time-to-reclassification from this procedure are higher than actual time-to-reclassification.
Authors identified a few potential advantages of using survival analysis to describe English pro-ficiency progress for ELs, including that: (a) it has the potential to generate unbiased parameter estimates, using information from both censored and noncensored cases “to predict risk of an event occurring at a specific point in time” (Mavrogordato & White 2017, pp. 287-289); (b) it is applicable to a rapidly increasing, highly mobile student population (Beardsley, 2015), with student data included in analyses even if individuals are not present in the data set every year (Mavrogordato & White, 2017); (c) it can provide estimates of the most likely amount of time needed for average students to achieve proficiency (Thompson, 2015), and thus help to identify students who are taking more than the average amount of time; and (d) it can account for the fact that some students are not reclassified (Beardsley, 2015; Thompson, 2015). Some of these benefits depend on the choices that researchers make about study design and data analysis procedures.
Study authors also mentioned potential disadvantages to using survival analysis to describe students’ progress in English proficiency. As described previously, the possibility for large numbers of students to be excluded from analyses may underestimate the time it takes for the entire population of ELs to become English proficient (Cook et al., 2012). In addition, this methodology tends to overlook the connection between a student’s initial level of English pro-ficiency and the time to reclassification unless that level of English proficiency is specifically controlled for in analyses (Matta, 2016). Furthermore, not controlling for English proficiency can bias the estimates of other covariates (Matta, 2016).
Descriptive analysis. Seven studies described ELs’ time to proficiency and reclassification using descriptive statistics or descriptive analysis (Beardsley, 2015; Estrada & Wang, 2013; Haas et al., 2015, 2016a, 2016b; Motamedi, 2016; Rubio-Study 2, 2014). Of these seven studies, five of them had findings specific to ELs with disabilities (Haas et al., 2015, 2016a, 2016b; Motamedi, 2016; Rubio-Study 2, 2014). Two studies did not address ELs with disabilities or include them in the study population (Beardsley, 2015; Estrada & Wang, 2013).

11NCEO
Researchers used descriptive analysis to report a number of statistics related to reclassification. These included: (a) the average amount of time ELs were in EL services before being reclassified (Beardsley, 2015; Motamedi, 2016); (b) the number of students who attained English language proficiency (Beardsley, 2015); (c) the percentage of eligible students who were reclassified (Estrada & Wang, 2013); (d) the likelihood of a student becoming a long-term EL (Rubio-Study 2, 2014); and (e) the cumulative percentage of students reclassified after a particular point in time (Haas et al., 2015, 2016a, 2016b; Motamedi, 2016).
According to Cook et al. (2012), “the goal of [descriptive analysis] is to get a sense of percent-ages [of students who are] attaining language proficiency, by time, initial [English language proficiency], and grade span” (p. 30). Researchers can use descriptive statistics to compare groups of students based on these variables.
Studies in our review that used descriptive analysis examined three types of variables in relation to reclassification or English language proficiency: (a) policy factors such as reclassification criteria (Estrada & Wang, 2013); (b) district and school factors such as teacher recommenda-tions, knowledge of reclassification criteria among staff and families, administrative delays, philosophies regarding reclassification among staff, and timing of reclassification decisions once per year (Estrada & Wang, 2013); and (c) student factors such as grade level (Haas et al., 2015, 2016a, 2016b; Motamedi, 2016), initial English proficiency (Haas et al., 2015, 2016a, 2016b; Motamedi, 2016), gender (Haas et al., 2015, 2016a, 2016b; Motamedi, 2016), home language (Beardsley, 2015; Motamedi, 2016; Rubio-Study 2, 2014), race/ethnicity (Motamedi, 2016), special education status (Haas et al., 2015, 2016a, 2016b; Motamedi, 2016; Rubio-Study 2, 2014), eligibility for the school lunch program (Haas et al., 2015, 2016a, 2016b); and country of birth (Motamedi, 2016; Rubio-Study 2, 2014).
Other methods. One study of time to reclassification (Matta, 2016) used two methods to measure time to proficiency and reclassification, and presented findings specific to ELs with disabilities. The first method was “a multilevel, multivariate random effects model [MVREM], which [estimated] the student-specific and school-specific association between different domains of English language proficiency” (p. iv). The second was “a multilevel shared random effects model [SREM], which estimated English proficiency development and time-to-reclassification simultaneously and treated the student-specific random effects as latent covariates in the time-to-reclassification model” (p. iv). The student-specific variables in Matta’s study were home language, race/ethnicity, free and reduced price lunch status, special education status, and gender.
According to Matta (2016), one of the benefits of using a MVREM was that it resulted in predic-tions that were more accurate than conventional discrete-time survival analysis, but a MVREM can become more complex as more outcome variables are added to the model. Matta stated that one of SREM’s primary advantages is that it allows for a clearer examination of relationships

12 NCEO
between multiple processes that are harder to see when using a different model for each process. However, according to Matta, one disadvantage of SREM is “that the shared random effects influence the correlation between repeated measures and the dependency between the repeated measure and the time to event” (p. 13).
Findings of Time to Reclassification Studies
Findings for ELs with disabilities from studies using survival analysis. Five of the survival analysis articles discussed findings specific to ELs with disabilities (Burke et al., 2016; Con-ger, 2008; Kieffer & Parker, 2016; Slama et al., 2015; Thompson, 2015). A key finding from studies that presented data on ELs with disabilities was that, when compared to ELs without disabilities, these students were less likely to achieve proficiency and reclassification during the study (Burke et al., 2016; Conger, 2008; Thompson, 2015). Thus, they were more likely to become long-term ELs (Kieffer & Parker, 2016; Slama et al., 2015). Long-term ELs are “ELs who have not yet attained English language proficiency within five years” (U.S. Department of Education, 2016, p.2).
The actual data presented in support of this key point varied considerably in format. For example, Thompson (2015) found that students in special education were almost five times less likely to be reclassified as their non-special education peers, after controlling for other factors such as gender, home language, free or reduced-price lunch status, parent education level, initial English language proficiency, and initial first language proficiency. As another example, Burke et al. (2016) stated that ELs in special education were as much as 59% less likely to be reclassified compared to their peers who were not in special education. At the end of Slama et al.’s (2015) study, which followed a cohort of kindergartners for 11 years, nearly 60% of the students who were not reclassified were receiving special education services.
When ELs with disabilities were reclassified, authors stated that they took longer to do so than their peers without disabilities (Kieffer and Parker, 2016; Conger, 2008). No studies provided the median or average number of years that it took ELs with disabilities as a whole to achieve reclassification. However, Kieffer and Parker (2016) found that regardless of age of entry into the U.S. school system, “the median time to reclassification was approximately 8 years for [ELs] with specific learning disabilities [and] 6 years for [ELs] with speech or language impairments” (p. 9), while students without any disabilities took about 3.5 years to achieve reclassification.
Finally, some researchers were able to compare the likelihood of EL reclassification, or the likelihood of becoming a long-term EL, for ELs in a number of disability categories. There were few observable patterns in common across studies. Among the groups less likely to be reclas-sified were ELs with learning disabilities (Kieffer & Parker, 2016; Slama et al., 2015), speech and language impairments (Kieffer & Parker, 2016), and intellectual disabilities (Conger, 2008;

13NCEO
Slama et al., 2015). For example, Kieffer and Parker (2016) found that the median amount of time to reclassification for ELs with learning disabilities was about four years more than ELs without disabilities. This same study reported that slightly less than half of ELs with speech or language impairments (46%) and more than half of ELs with learning disabilities (63%) were not reclassified and became long-term ELs. Similarly, Slama et al. (2015) found that approxi-mately 39% of ELs in special education who had not been reclassified by the end of their study had learning disabilities, and an additional 21% of them had intellectual disabilities. Conger (2008) also found that ELs who were receiving “part-time special education services for mild or moderate disabilities” (p. 386), which were undefined in the article, were less likely to achieve proficient scores on the Language Assessment Battery (LAB) than ELs not receiving special education services. However, no specific disability categories were listed.
Findings for all ELs from studies using survival analysis. General findings for all ELs (includ-ing those with disabilities) in survival analysis studies address topics such as time to proficiency and reclassification, the timing of reclassification for students, and student characteristics that influence reclassification. For measures of time to proficiency and reclassification, researchers reported the amount of time students took to be reclassified in three ways.
First, seven studies reported time-to-reclassification as a median time, which ranged from 2 to 8 years. For these studies, the number of years to reclassification was: 2 years (Kim et al., 2014), 2.7 years (Slama et al., 2015), 3 years (Conger, 2008, Conger et al., 2012), 3.8 years (Motamedi et al., 2016), 3.9 years (Beardsley, 2015), and 8 years (Umansky & Reardon, 2014). Criteria for reclassification, the state in which the study was conducted, and the median years to reclassification (for all ELs and for ELs with disabilities) is shown in Table 2.
Table 2. Exit Criteria and Time-to-Reclassification (in Years) in Time-to-Reclassification Studies
Study Exit Criteria/Statea Years to Reclassification
Beardsley (2015) “Achievement of an Overall Composite Score of 5.0 or higher and an Overall Literacy Composite of 4.0 on Tier B and Tier C ACCESS for ELLs” (p. 13) [State: Kentucky]
Median time to proficiency for all students was 3.91 years.Not provided for SWD.
Burke et al. (2016) Obtain a score of Level 5 on the LAS Links. [State: Indiana]
Not provided a
Conger (2008) Score above the 40th percentile on the LAB [State: New York]
Median time to reclassification was 3 years for students overall. Not provided for SWD a
Conger et al. (2012) Score above the 40th percentile on the LAB [State: New York]Score a Level V Independent on M-DCOLPS-R [State: Florida]
After 3 years, most students had reached reclassification. Not provided for SWD.

14 NCEO
Study Exit Criteria/Statea Years to Reclassification
Estrada & Wang (2013)
Achievement of threshold scores on state ELP assessment and ELA assessment. Some districts use mathematics assess-ment as well. Parent opinion, teacher opinion. [State: California]
Not provided.
Haas et al. (2015) Achieve Level 5 on AZELLA [State: Ari-zona]
Not provided b
Haas et al. (2016a) Before 2009-2010, achieve overall test score of proficient (Level 5 out of 5). Since 2009-2010, students need intermediate score (Level 4 out of 5) in each domain: listening, speaking, reading, and writing. [State: Nevada]
Not provided b
Haas et al. (2016b) Before 2010-2011, achieve overall score of at least Level 4 of 5 on Utah Academic Language Proficiency Assessment and ELA content test score of Level 2 of 4 or above. Since 2010-2011, achieve overall score of Level 5 on Utah Academic Language Profi-ciency Assessment [State: Utah]
Not provided b
Kieffer & Parker (2016)
Achieve “predetermined cut score” (p. 2) that indicates proficiency [State: New York]
About half of students overall achieved reclassification within 4 years. The median time-to-reclassifi-cation for students with specific learning disabilities was 4 years longer, and 2 years lon-ger for students with speech or language impairments.
Kim et al. (2014) 2003 to 2007, score Level 5 on M-DCOLPS-RSince 2006-2007, achieve score of ESOL Level 5. Starting in 2008, students also needed to achieve a “minimum threshold of performance” (p. 2602) on FCAT. [State: Florida]
About half of students overall achieved reclassification after 2 years.Not provided for SWD.
Matta (2016) Achieve an “AZELLA total score in the pro-ficient category” (p. 21). [State: Arizona]
About half of students overall reached reclassification after 2 years. Students never identified with a disability were all reclassi-fied by the end of 6th grade (after 4 years), while some students with disabilities had not been reclassified by the end of 7th grade (after 5 years).
Table 2. Exit Criteria and Time-to-Reclassification (in Years) in Time-to-Reclassification Studies

15NCEO
Study Exit Criteria/Statea Years to Reclassification
Mavrogordato & White (2017)
Score at the Satisfactory level on “the district-selected English proficiency as-sessment” (p. 285), Proficient or Highly Proficient level on the state ELA assess-ment.Teachers’ recommendations [State: Texas]
Not provided for SWD.
Motamedi (2016) Must score at the highest level, Level 4 (Transitional), on a Washington English proficiency assessment [State: Washington]
Overall average of 3.2 years across all students in study. Average of 5.5 years for ELs in special education; 3.7 years for ELs in general education.
Motamedi et al. (2016)
Achieve a score at the Transitional Level (Level 4 of 4) on Washington English Language Proficiency Assessment. [State: Washington]
Overall, students took a median of 3.8 years to be reclassified. Not provided for SWD.
Rubio-Study 1 (2014)
Score at the Proficient Level (Level 4 of 4) for the listening/speaking and reading/writ-ing subtests on the NYSESLAT [State: New York]
On average, students reclassi-fied after 4 years.Not provided for SWD.
Slama (2014) “State English language proficiency as-sessment in addition to a student’s perfor-mance on the state content-area assess-ments, grades, teacher observations, class work, and parent input” (p. 223). [State: Massachusetts]
On average, students were reclassified after 3 years.Not provided for SWD.
Slama et al. (2015) Achieve a score of “Proficient” on MEPA or ACCESS [State: Massachusetts]
The median number of years to reclassification was 2.7 years for all students. Not provided for SWD.
Thompson (2015) Score at least 4 (out of 5) on overall CELDT, score at least 3 (out of 5) on do-mains of CELDT, score at least Basic Level on CST-ELA. [State: California]
Not provided a
Umansky & Rear-don (2014)
Score at least 4 (out of 5) on overall CELDT with no subscore below 3 (out of 5), score at least 325 (mid-basic) on CST-ELA, teacher approval, and GPA depend-ing on age [State: California]
Median time to reclassification for students overall was 8 years. Not provided for SWD.
a Full names of tests are included in Appendix C. b Study presented findings of time-to-reclassification in terms of percentages or likelihoods, not years
Second, two studies reported an average amount of time for ELs who entered U.S. schools in kindergarten to achieve reclassification. Average reclassification time ranged from roughly three (Slama, 2014) to a little over four years (Rubio-Study 1, 2014). All but one study that used sur-
Table 2. Exit Criteria and Time-to-Reclassification (in Years) in Time-to-Reclassification Studies

16 NCEO
vival analysis (Mavrogordato & White) used the third way of reporting time to reclassification, by stating the percentage of the sample that did or did not become English proficient during a certain period of time. There was a great deal of variability in the percentages reported, partly as a function of the age students entered the U.S. school system and the length of the study. Most studies examined reclassification rates for students starting in their early elementary years, typically in kindergarten. Rubio-Study 1 (2014), collecting data in New York, found that a small percentage (6.5%) of ELs were classified after their kindergarten year. In contrast, Conger (2008), also collecting data in New York, found that 40% of kindergartners were reclassified after one year. Several studies found that anywhere from 52% to 99% of ELs who began their study in early elementary school were reclassified after a period ranging from four to nine years. The two studies that examined older students (Beardsley, 2015; Conger, 2008) appeared to show smaller percentages of students being reclassified when compared to students who started in elementary school. Conger (2008) found that 14% of ELs starting school at age 10 were reclassified within a year (compared to 40% of kindergartners in the same study). Beardsley (2015) found that 23% of ELs in high school were reclassified while they were still in high school.
Several studies described the timing of reclassification decisions for the total EL population. Thompson (2015) found evidence for a reclassification window during the upper elementary grades, meaning that ELs who entered school in kindergarten were most likely to be reclas-sified at the end of elementary school. Umansky and Reardon (2014) found similar results at each schooling level (elementary, middle or junior high, senior high), with the students in their study tending to be more likely to reclassify toward the end of a school level (e.g., 5th grade, 8th grade, and 11th grade). In other words, the likelihood of a student being reclassified dropped in 6th and 7th grade, then again in 9th and 10th grade. The 5th grade peak in reclassification “[cor-responded] to higher reclassification eligibility in that grade” (p. 903). However, the 8th and 11th grade peaks were not correlated to higher reclassification eligibility as defined by reclas-sification criteria, meaning that their reclassification may have been due to “factors other than reclassification criteria [such as] a push on the part of teachers or administrators to reclassify students prior to entering high school [or because of] program design” (p. 903). Umansky and Reardon (2014) concluded that the speed of reclassification did not necessarily indicate the quality of a student’s English learning or academic progress.
Other researchers echoed this sentiment that time-to-reclassification may not be an accurate indicator of ability to perform on grade-level content or English language proficiency. Slama (2014) determined that more than half of reclassified ELs scored below proficient on statewide mathematics and English language arts assessments after they had been exited from EL services. In a second study, Slama et al. (2015), using a different data set from Slama (2014), found that while the median time-to-reclassification was 2.7 years, “more than 30% of former ELLs were not proficient in English language arts, and more than 60% were not proficient in mathematics” (p. ii). Furthermore, although ELs were, on average, exited from EL services after 2.7 years, the

17NCEO
authors reported that they did not actually have the opportunity to demonstrate proficiency on the state ELP test until it was given for the first time in grade 3. Thus, ELs in Slama et al.’s (2015) study did not actually demonstrate English proficiency on a statewide language proficiency as-sessment until after an average of 3.3 years. The authors pointed out that one reason the average reclassification rate was faster than the average time to proficiency was because some teachers exited students from EL services based on factors other than ELP test scores. A second reason was that student samples making up the average time to reclassification and average time to proficiency calculations were not the same. Average time to proficiency was calculated based on only those students who remained an EL in grade 3, when the authors reported that state ELP tests were given for the first time. Time to reclassification was based on the full sample of ELs.
Mavrogordato and White’s (2017) study also demonstrated that other factors besides a student’s English proficiency may influence time to reclassification. They found that students who were identical in academic performance, ELP level, demographic characteristics, and education characteristics had drastically different rates of reclassification depending on which school they attended in Texas. The researchers observed that if an EL attending school in the Rio Grande Valley region of Texas was compared to a similar student attending school in the El Paso region, the student in El Paso was nearly twice as likely to be reclassified at a certain point in time as the student in the Rio Grande area. These findings raised questions about the way that educators understood and implemented state policy on reclassification of ELs, suggesting that the time to reclassification data reflected factors beyond rates of language acquisition.
Finally, most of the studies that used survival analysis cited certain student characteristics that influenced time-to-reclassification. The six characteristics associated with a decreased likeli-hood of being reclassified were: (a) special education status, (b) language background other than English, (c) older age of entry in U.S. schools, (d) lower initial English proficiency, and (e) country of origin (born in U.S. rather than another country). These are not ordered because not all studies examined the same characteristics. We describe the findings associated with each of these characteristics.
First, every study that examined special education status as a variable found that students who were in special education took longer to be reclassified than students who were not (Burke et al., 2016; Conger, 2008; Kieffer & Parker, 2016; Slama et al., 2015; Thompson, 2015). This finding will be discussed in greater detail in a later section of this review. Second, students from some language groups took longer to be reclassified, on average, than students from other lan-guage groups. Spanish-speakers (Beardsley, 2015; Motamedi et al., 2016; Rubio-Study 1, 2014; Slama, 2014; Slama et al., 2015; Thompson, 2015), Somali-speakers (Motamedi et al., 2016), and Arabic-speakers (Rubio-Study 1, 2014) took more time to be reclassified than students who spoke other languages. Third, ELs with low socioeconomic status, often indicated by eligibility for free or reduced price lunch, were slower to be reclassified than their higher income peers

18 NCEO
(Burke et al., 2016; Conger et al., 2012; Kim et al., 2014; Slama, 2014). Fourth, students’ age of entry into U.S. schools was associated with different amounts of time to reclassification. Students who entered at later ages were slower to be reclassified than students who entered at younger ages (Conger, 2008; Conger et al., 2012; Kieffer & Parker, 2016). Fifth, students with high initial levels of English language proficiency at entry into U.S. schools became English proficient and were reclassified more quickly than their peers with lower levels of initial English language proficiency (Kieffer & Parker, 2016; Kim et al., 2014; Thompson, 2015). Sixth, a stu-dent’s country of origin played a role in time-to-reclassification, with students born in the United States taking longer to reclassify than students born in other countries (Rubio-Study 1, 2014).
Findings for ELs with disabilities from studies using descriptive analysis. Of the seven studies that used descriptive analysis, four presented findings specific to ELs with disabilities (Haas et al., 2015, 2016a, 2016b; Motamedi, 2016; Rubio-Study 2, 2014). Like the survival analysis studies, these studies found that ELs with disabilities, when compared to ELs without disabilities, were less likely to achieve proficiency (Haas et al., 2015, 2016a, 2016b) and took longer to be reclassified as English proficient (Motamedi, 2016; Rubio-Study 2, 2014). Haas et al. (2015, 2016a, 2016b) reported that the discrepancy in reclassification between ELs in special education and ELs not in special education was the highest out of all the student characteristics examined in their studies. Motamedi (2016) also reported a discrepancy between these two groups, stating that special education students tended to be reclassified after an average of 5.5 years, compared to 3.7 years for their peers who were not in special education. Another example comes from Rubio-Study 2 (2014), who found that students who were identified as having a disability in kindergarten were about twice as likely to remain an EL after five years (i.e., to become a long-term EL), compared to their peers without a disability.
Findings for all ELs from studies using descriptive analysis. Overall descriptive analysis findings, for all ELs, addressed the general themes of time-to-reclassification and factors that influence time to proficiency and reclassification. Each of the five studies reported its findings in terms of percentages of students who became proficient and reached reclassification during the study. Again, there was considerable variability in the percentages of ELs achieving profi-ciency and being reclassified as English proficient. By the end of Beardsley’s (2015) five-year analysis, 31% of students attained proficiency in English. The researcher did not state whether they were also reclassified. Haas et al.’s (2016b) study following three cohorts of students for six years showed that 59% to 73% of each cohort achieved reclassification. In a later study by Haas et al. (2016a) that followed another three cohorts of students for six years (2016a), at least 65% of ELs in each cohort reached reclassification. Motamedi’s (2016) results indicated that 82% of the sample was reclassified at some point during the study, after an average time of about 3.8 years. Finally, 90% of students achieved reclassification in Haas et al.’s (2015) study following three cohorts of students for six years.

19NCEO
Some descriptive analysis studies appeared to indicate that undefined factors other than test scores played a role in the decision to reclassify students. For example, Estrada and Wang’s (2013) study following ELs in grades two through eight for a total of four years showed that about 20% of students met the reclassification criteria after one year. However, of the students meeting all the criteria, including attaining English proficiency, eight percent were not reclassified.
The second set of findings addressed factors that affected time-to-reclassification. For the most part, results from studies using descriptive analyses corroborate findings from the survival analysis studies. Motamedi’s (2016) study examined rates of reclassification for students who entered school between kindergarten and grade 5. The percentage of students who achieved re-classification became lower as the grade in which students entered the school district increased. Results showed that 85% of ELs who entered the school district in kindergarten achieved reclas-sification by the end of the study, while 72% of ELs who entered the school district in grade 5 achieved reclassification by the end of the study.
The literature described four factors affecting time-to-reclassification. First, special education students took longer to reclassify than students not in special education (Haas et al., 2015, 2016a, 2016b). Second, descriptive analysis studies found that slower rates of reclassification were common for students from particular language backgrounds. Spanish-speakers (Beardsley, 2015; Motamedi, 2016) and Somali-speakers (Motamedi, 2016) had slower rates of reclassifica-tion than students from other language backgrounds. Third, students eligible for free or reduced price lunch (Haas et al., 2015, 2016a, 2016b) took longer to be reclassified in comparison to their higher income peers. Fourth, students with lower initial levels of English language proficiency (Haas et al., 2015, 2016a, 2016b) also took longer to be reclassified compared to students with higher initial levels of English proficiency.
The descriptive analysis studies did address the relationship between particular student char-acteristics and their likelihood of becoming English proficient. Motamedi (2016) used descrip-tive analysis to show that students born in foreign countries took longer to reclassify than their U.S.-born peers. Motamedi (2016) also showed that students who entered school at earlier ages were either more likely to reach reclassification or had quicker rates of reclassification. In Haas et al.’s (2016b) study following three cohorts of students in different grades over six years, students in older grades were less likely to be reclassified by the end of the study. However, in Haas et al.’s (2015, 2016a) studies that also followed three cohorts of students over six years, the results varied by cohort. The youngest cohorts had the lowest cumulative reclassification rates. The researchers did not explicitly state whether each cohort in Haas et al. (2015, 2016a, 2016b) entered U.S. schools the same year that data collection began.
Estrada and Wang (2013) examined factors other than student characteristics and assessment scores. The researchers found that, while students may have achieved a test score indicating

20 NCEO
they were English proficient, the timing of their actual reclassification may have been influ-enced by factors such as: (a) quality of language and content instruction; (b) teacher, student, and family understanding of, and attitudes toward, the reclassification process; (c) the clarity of reclassification criteria; (d) teacher recommendations for or against reclassification; (e) timing of assessments; and (f) requirements that all reclassification criteria be met in the same year.
Findings from studies using other methods. The findings from Matta’s (2016) study, which used a multilevel, multivariate random effects model and a multilevel shared random effects model, echoed many of the findings already discussed in other types of studies. Matta’s (2016) study included findings specific to ELs with disabilities, in addition to more general findings for ELs overall. Notably, Matta (2016) found that on average, students with disabilities took more time, about one year, to reclassify than students without a disability. All of the students without disabilities in the sample had reached English proficiency by 6th grade, whereas there were still some students with disabilities who had yet to meet the benchmark by the end of 7th grade. The author also examined specific ELP domains and found that ELs with disabilities fell the farthest behind in writing proficiency, as opposed to reading or oral proficiency.
Matta’s general findings applying to all ELs, with and without disabilities, primarily focused on the accuracy of the reclassification determination and to time periods for the greatest amount of progress in English proficiency. Some students in Arizona, for example, were reclassified despite the fact that they were not English proficient in each domain because reclassification decisions were based on a total score. Matta contrasts this observation with an example from California, where reclassification criteria were more stringent, possibly leading to students who are proficient remaining classified as ELs. In addition, the author found that English language proficiency dramatically increased between 3rd and 7th grade for ELs who entered school by grade 3.
Evidence Base for Time-to-Reclassification Studies
To gauge the strength of the evidence base for the different methods of measuring time to reclas-sification, we looked at three characteristics of the research. First, we examined the transparency of information about assessments studied, specific reclassification criteria applied, and method-ologies used. Second, we looked for detailed descriptions of study samples. Third, we analyzed the author-identified study limitations. Descriptions of each of these characteristics follows.
Transparency. Regardless of the methodology employed, each of the studies measuring time to proficiency, or time-to-reclassification, described the name of the ELP assessments adminis-tered and the specific reclassification criteria that students had to meet to be considered English proficient (see Table 3). (This information is provided in detail in Appendix B.)

21NCEO
Table 3. Assessment and Reclassification Information Provided by Time to Reclassification Studiesa
Information Provided
Survival Analysis Studies (n=13)
Descriptive Analysis Studies (n=7)
Other Methodology Studies (n=1)
Test administered 13 7 1
Reclassification criteria
11 7 1
a The total number of analyses in the table is 21 because two of the sources (Rubio, 2014; Beardsley, 2015) each reported both survival analysis and descriptive analysis approaches.
Study samples. The number of studies that described various sample characteristics differed dramatically, sometimes depending on study methodology (see Table 4).
Table 4. Sample Characteristics for Time-to-Proficiency Studiesa
Sample CharacteristicsSurvival Analysis
Studies (n=13)
Descriptive Analysis Studies
(n=7)Other Methodology
Studies (n=1)
Sample size 13 7 1
Location of sample 13 7 1
Grade levels of students 13 7 1
Home languages of students 13 4 1
When students entered U.S. schools
11 2 1
Special education status of students
9 5 1
Initial English proficiency levels of students
8 6 0
Race/ethnicity of students 7 3 1
Yearly sample attrition 4 5 1
Age of students 3 0 0a The total number of analyses in the table is 21 because two of the sources (Rubio, 2014; Beardsley, 2015) each reported both survival analysis and descriptive analysis approaches.
All of the studies, regardless of methodology, included information about sample sizes, the loca-tion of the samples, and grade levels of students. In addition, all of the survival analysis studies included information on students’ home languages. Further, the majority of survival analysis studies described when students entered U.S. schools (n=11), and students’ special education status (n=9). Just over half of the survival analysis studies mentioned the initial English profi-ciency levels of students, and the race or ethnicity of students (n=7). However, less than half of these studies addressed the degree of yearly sample attrition (n=4), or the age of students (n=3). For the descriptive analysis studies, the majority addressed the initial English proficiency levels
22 NCEO
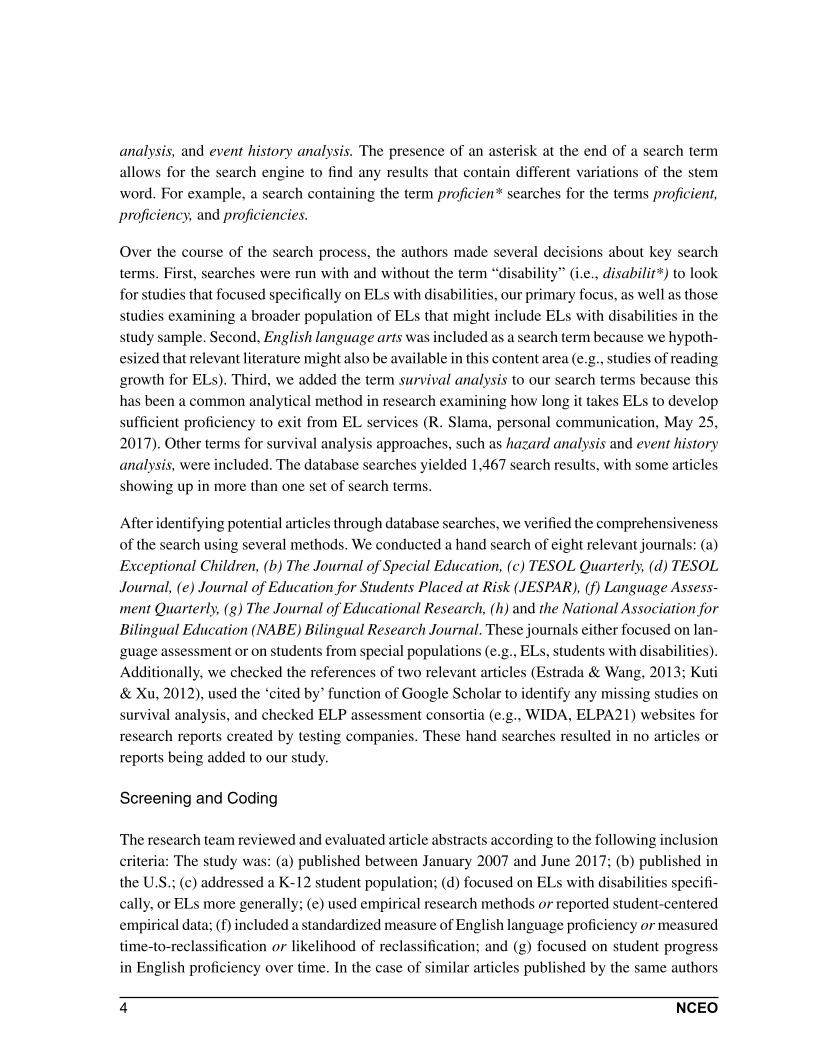
of students in the sample (n=6), students’ special education status (n=5), and yearly sample attrition (n=5). Slightly more than half of descriptive studies described the home language of students (n=4). Less than half of descriptive studies addressed students’ race/ethnicity (n=3), or when students entered U.S. schools (n=2), and no studies listed students’ ages. The one study with a different type of methodology (Matta, 2016) addressed all of the characteristics except the initial English proficiency level of students and students’ ages.
Survival analysis studies were more likely than descriptive studies to report sample characteris-tics. All (100%) of the studies using survival analysis reported the home languages of students in their samples, compared to only 4 (57%) of the studies using descriptive analysis. Similarly, the age at which students entered the U.S. school system was reported by 11 (85%) of the survival analysis studies and 2 (29%) of the descriptive analysis studies. On the other hand, 6 (86%) of the descriptive analysis studies reported initial ELP levels, compared to only 8 (62%) of the sur-vival analysis studies. As another example, only 4 (31%) of the survival analysis studies reported details about the yearly attrition of their samples, while these data were provided by 5 (71%) of studies using descriptive analysis. Some sample characteristic data were scarce, no matter what methodology was used by the studies. Notably, the ages of students in the samples was provided by three of the survival analysis studies, and none of the descriptive analysis studies.
Study limitations. Author-identified limitations were the third aspect of the evidence base evaluated for time-to-reclassification studies. Only limitations that were explicitly identified by authors are included in this review. Five studies identified no explicit limitations (Conger, 2008; Conger et al., 2012; Motamedi, 2016; Rubio, 2014; Thompson, 2015). The remaining 14 studies explicitly identified study limitations (see Table 5).
Table 5. Author-Identified Study Limitations for Time-to-Reclassification Studiesa
Study Limitations
Survival Analysis Studies (n=13)
Descriptive Analysis Studies
(n=7)
Other Methodology Studies (n=1)
Unmeasured variables may contribute to time to reclassifi-cation or proficiency
5 1 1
Cannot support causal infer-ences
4 0 0
Excluded mobile students or students who repeated or skipped grades
3 3 0
Small sample size 2 1 1
Sample did not include all grade levels
2 1 1
Limited generalizability 2 0 0
Missing data or error in data 2 0 1

23NCEO
Study Limitations
Survival Analysis Studies (n=13)
Descriptive Analysis Studies
(n=7)
Other Methodology Studies (n=1)
Sampling bias 2 0 0
Unable to observe program instruction
1 1 0
Measure of ELP changed over the course of the study
1 0 0
Sample not representative of most national trends
1 0 0
EL population is heterogeneous 1 0 0
Does not examine how reclas-sification impacts students
1 0 0
Reliability and validity of disabil-ity category and free/reduced lunch variables
0 0 1
Differences between cohorts 0 3 1a The total number of analyses in the table is 21 because two of the sources (Rubio, 2014; Beardsley, 2015) each reported both survival analysis and descriptive analysis approaches.
There were no commonly noted study limitations that applied to all studies. Overall, the most common author-identified limitations for survival analysis studies, noted by slightly less than half of them, were that unmeasured variables may have contributed to time to reclassification (n=5) and that the data could not support causal inferences (n=4). The unmeasured variables included time in an EL program or grade level (Beardsley, 2015), EL programs or practices (Kim et al., 2014; Matta, 2016; Motamedi et al., 2016), initial English proficiency (Burke et al., 2016), first language proficiency (Kim et al., 2014; Motamedi et al., 2016), socioeconomic status (Motamedi et al., 2016), schooling that occurred outside of the state (Motamedi et al., 2016), parent education levels (Motamedi et al., 2016; Slama, 2014), social capital (Slama, 2014), and generational status (Matta, 2016). A variety of other study limitations were noted for three or fewer studies. For descriptive studies, slightly less than half of them noted that the study excluded students who were mobile or who had skipped a grade (n=3), and that there were differences between student cohorts (n=3). In addition, there were four other limitations noted that applied to just one study.
Matta (2016), who did not use survival analysis or descriptive analysis, cited limitations in the analytic sample and other data sources. The first limitation was not having access to students’ specific disability classifications. Second was the study’s small sample size, which included only 277 students who started school in third grade from a single district. Another limitation was the fact that there is “limited testing [following reclassification] so alternative functional forms for language development based on the time-of-reclassification could not be adequately assessed”
Table 5. Author-Identified Study Limitations for Time-to-Reclassification Studies (continued)a

24 NCEO
(p. 68). During the time of the study, Arizona put in place an English-only law that mandated instruction in English and required ELs to be reclassified after one year. Students continued to develop their proficiency in English in mainstream classes and no longer participated in ELP testing. Finally, English language proficiency was measured by state ELP test scores, which the researcher believed to be flawed.
Studies of Year-to-Year Progress in English Language Proficiency
In addition to the time-to-reclassification studies that looked at data over time, five studies ad-dressed year-to-year ELP progress. These studies were:
• Burke (2015)• Linquanti and George (2007)• Marin (2015)• Martin (2009)• Slama (2012)
Only one of these five studies mentioned ELs with disabilities (Burke, 2015), and did so to explain that they were excluded from data analyses to avoid confounding variables that might have affected test performance. Thus, there were no findings specific to ELs with disabilities in the year-to-year ELP progress articles.
This group of studies focused on students in four states: California (Linquanti & George, 2007), Indiana (Burke, 2015), Massachusetts (Slama, 2012), and Mississippi (Marin, 2015; Martin, 2009). Sample sizes ranged from 64 students (Martin, 2009) to 862,000 students (Linquanti & George, 2007). Research covered multiple years, ranging from two years (Linquanti & George, 2007; Marin, 2015) to five years (Slama, 2012). Authors used four analytical methods to mea-sure year-to-year ELP progress: (a) ANOVA (Marin, 2015), (b) t-test (Martin, 2009), (c) growth trajectories (Slama, 2012), and (d) calculating the percent of ELs who increased one proficiency level (Burke, 2015; Linquanti & George, 2007). For details on these studies, see Appendix A.
In this section, we describe how the year-to-year studies defined ELP progress, the methodolo-gies they used, general findings, and the evidence base of the studies. As for the time-to-reclas-sification studies, we evaluated the evidence for quality, based on the transparency of methods, study samples, and limitations.
Definitions of Progress in English Language Proficiency
The year-to-year studies reflected two ways to define progress. Definitions were based on: (a) an increase in students’ ELP assessment scores from one year to the next (Marin, 2015; Martin,

25NCEO
2009; Slama, 2012), or (b) an increase in a student’s performance level (e.g., beginning to de-veloping) on an ELP assessment (Linquanti & George, 2007). One qualitative interview study by Burke (2015) did not explicitly describe what constituted progress in English proficiency. Instead, the researcher relied on educator interpretations of student progress in English profi-ciency, which seem to be associated with increasing a performance level on the ELP assessment from one academic year to the next.
For those studies that defined progress as an increase in student scores from year to year, there were two approaches to calculating progress. First, both Marin (2015) and Martin (2009) deter-mined students’ ELP progress by calculating the statistical significance of the increase in mean scores of the ELs in their studies on an ELP assessment from one year to the next. ELs in Marin’s (2015) study were administered ACCESS for ELLs, which provided raw scores, scale scores, and proficiency levels for each language domain (e.g., listening, speaking, reading, writing), as well as an overall proficiency score. Marin (2015) explicitly used scale scores for analysis, stating that these scores allowed for more precise data analysis than categorical data, such as proficiency scores. Marin preferred to use scale scores over raw scores because comparisons were possible within language domains and between overall scale scores. Similarly, ELs in Martin’s (2009) study took the Stanford English Language Proficiency Test (SELP), which provided raw scores and proficiency levels, and the researchers used raw scores to calculate year-to-year ELP progress. Second, Slama (2012) created growth plots based on change in a subsample of individual student’s ELP scores (in aggregate) over time.
As another way of measuring progress, Linquanti and George’s study (2007) used performance levels (e.g., beginning, early intermediate, intermediate, early advanced, advanced), rather than scores on the California English Language Development Test (CELDT). The degree of change in student’s performance levels that counted as progress depended on students’ initial English proficiency level for the academic year. California policymakers decided that an increase of one CELDT proficiency level per year would be considered progress if ELs were at the beginning to intermediate English proficiency levels. If a student scored at the advanced level overall, but still had one domain (reading, writing, listening, speaking) on which he or she scored below intermediate, progress occurred only if the student maintained his or her overall proficiency level and raised all domain scores to intermediate or above. However, if the EL scored at the early advanced or advanced level overall, and all domain scores were at intermediate or above, the student made progress if he or she maintained these proficiency levels.
Study Methodologies of Year-to-Year Progress Studies
The authors who measured ELP year-to-year progress used four analytical methods: (a) calcu-lating the percentage of ELs who had increased scores for overall proficiency or subskills of proficiency each year, depending on their initial proficiency level (Linquanti & George, 2007);

26 NCEO
(b) conducting repeated measures analysis of variance (ANOVA) (Marin, 2015); (c) conduct-ing a t-test (Martin, 2009); and (d) calculating growth trajectories (Slama, 2012). Each of these methods, as indicated in Table 6, was used to achieve a particular purpose, and some of the authors indicated advantages and disadvantages associated with the methodology used.
Table 6. Analytical Methods used by Year-to-Year Progress Studies, Purpose, and Advantages/Disadvantagesa
Study Analytical Method Purpose Advantages/Disadvantages
Linquanti & George (2007)
Percentage of ELs increasing an overall performance level over time. Increase defined differently depending on students’ English proficiency levels.
Calculate numbers of students reaching state definition of prog-ress on the CELDT for Annual Measurable Achievement Objec-tives
Advantage: Performance levels were the most feasible scores for calculating prog-ress due to limitations as-sociated with raw scores and incomplete vertical scaling process needed to compare scaled scores across the forms of the test at different grade levels.
Marin (2015) Repeated measures ANOVA
Scale scores on ACCESS for ELLs to measure change between two years
Advantage: Allowed for more precise data analysis than categorical data
Martin (2009) t-test Mean raw scores in two years to determine significant improve-ment
None stated
Slama (2012) Growth trajectories Scale scores on MEPA used to calculate growth plot and show score change over time
Advantage: Can fit a line for the average change for the group of ELs
a Burke (2015), a qualitative interview study, is not included in this table because it did not provide details on the analytical method for ELP progress data referenced in the study.
As shown in Table 6, Linquanti and George (2007) calculated the percent of ELs who increased in proficiency level from one year to the next. According to the authors, California school districts administered the CELDT in the summer or fall of each school year and compared fall-to-fall scores to determine whether students made progress in English. Therefore, the state determined progress by calculating the percentage of ELs who increased one performance level from the previous year. The authors provided the percentages of students meeting this defini-tion of progress, but did not provide a description of how percentages were calculated. They believed overall performance levels were the best metric to use for determining progress. The researchers had access to raw scores and scaled scores. However, changes in raw ELP assess-ment scores over time were difficult to interpret, and at the time of the study different forms of
27NCEO
the assessment for different grade levels had not been vertically equated. Further, the overall performance levels were more reliable than the performance levels for individual domains (e.g., listening, speaking, reading, writing).
Marin’s (2015) study used ANOVA to measure the change in scale scores between two academic years. ELs in the Marin study were administered the statewide ELP assessment, ACCESS for ELLs, which provided raw scores, scale scores, and proficiency levels for each language domain (e.g. listening, speaking, reading, writing), as well as an overall proficiency score. Marin used scaled scores for analysis because these scores allowed for more precise data analysis than categorical data, such as performance levels. Furthermore, scaled scores, unlike raw scores, “helped in determining students’ growth because comparisons are possible within language skills and between overall scale scores” (p. 76).
Martin (2009) used a t-test to calculate progress. The author used the mean raw scores on the SELP for all ELs in 2003 and 2004 and conducted a t-test to determine whether there was sig-nificant improvement between the two means. Martin (2009) stated that a statistically significant increase in mean scores illustrated that all students demonstrated significant improvement in English proficiency, as measured by the SELP. No advantages or disadvantages of using a t-test to measure ELP progress were cited.
Finally, Slama (2012) developed ELP growth trajectories based on scaled scores on the Mas-sachusetts English Proficiency Assessment (MEPA). By graphing ELP assessment scaled scores on the Y-axis and the number of years that had passed since entry into ninth grade on the X-axis, Slama examined how ELP changed over time. The researcher then superimposed curvilinear trajectories on the empirical growth plots. When presented as a collection, these fitted quadratic trajectories showed the growth trajectories of multiple ELs, enabling the researcher to fit a line for the average change trajectory for a group.
Findings of Year-to-Year Progress Studies
As noted previously, the year-to-year progress studies did not specifically address ELs with disabilities. Therefore, the findings of these studies relate only to the overall EL population. Research findings addressed two key topics related to progress in English proficiency: (a) prog-ress patterns or trends, including the shape of English proficiency progress over time; and (b) the relationship between student characteristics and English proficiency progress.
The five studies that measured year-to-year progress reported varied findings about the ELP progress trends of ELs. One study, Burke (2015), examined data from a relatively short time period and found that a much higher percentage (72%) of ELs’ met the definition of progress in 2007-08 than the state target of 40%. The study did not provide any explanations of how

28 NCEO
these percentages were calculated or where the numbers came from. No percentages from other academic years were provided for comparison.
Four studies documented steady increases in the number or percentage of ELs achieving whatever definition of progress was used. For example, Linquanti and George (2007) showed how California’s internal data analyses indicated a steady increase over time in the number of districts with students who made progress toward English language proficiency or attained English proficiency. In fact, the percentages of districts meeting the goals increased over time. Seventy-seven percent of districts met these goals in 2003-2004, which increased to 81% in 2004-2005, and increased again in 2005-2006 to 84%. Marin’s (2015) findings also indicated that students’ mean ELP scaled scores increased between the two years observed in the study. Similarly, Martin (2009) found that the total average ELP assessment score for all ELs in the study increased by about four points, which was found to be statistically significant using a t-test.
Three studies documented a more nuanced pattern of greater progress for students at some English proficiency levels compared to others. For example, Slama (2012) created ELP growth plots to explore the shape of participants’ ELP growth over time, finding that the shape was a curvilinear trajectory. She stated that the studied cohort, which was observed starting in ninth grade, appeared to begin high school just as they were beginning to develop English language proficiency. Analysis showed that these students acquired English language proficiency steadily until their last year of high school, when their growth began to decelerate. Data on when these students started school in the U.S. were not provided. Similarly, Linquanti and George (2007) found a larger percentage of ELs making progress from the beginning and early-intermediate performance levels compared to the more advanced performance levels. According to the researchers (Linquanti & George, 2007), more than two-thirds (70%) of students in the begin-ning level progressed to the early intermediate level, and slightly less than two-thirds (62%) of students in the early intermediate level progressed to the intermediate level. Still, fewer than half of ELs in the early advanced level moved to the advanced level (44%).
Burke’s (2015) qualitative interview findings documented teachers’ perceptions of the progress patterns of ELs. Educators interviewed had three key observations. First, ELs’ ELP progress plateaued when they reached performance Levels 3 and 4 (overall) and that it was particularly difficult for students to reach Level 5. Educators reported that between 2010 and 2012, 77 stu-dents’ ELP levels dropped from Level 5 to a lower level, typically Level 4. The drop may have been due to particular “skill area scores” (p. 326) dropping, which were averaged to calculate an overall score that was used to determine the students’ ELP levels. Second, teachers reported that ELs in lower grades attained higher English language proficiency levels more rapidly than students in higher grades. Finally, teachers observed that ELs demonstrated uneven progress across ELP assessment “skill areas” (p. 325), but exactly what “skill areas” these were was not defined.

29NCEO
Linquanti and George (2007) provided more documentation of fluctuations in students’ English proficiency performance levels at all grade levels tested. The researchers found that while 42% of ELs in their study with assessment scores at the advanced level remained at that level the following year, 58% of students at the advanced level decreased in proficiency. This type of fluctuation was largely not observed at the English proficient performance level on the CELDT. Eighty percent of ELs who had reached the English proficient level, but had not yet met all other reclassification criteria, maintained the same CELDT level the next year.
Some studies examined trends in EL demographics and their relationship to ELP progress. Two studies specifically examined the relationship of a student’s enrolled grade and the student’s English proficiency development over time (Martin, 2009; Slama, 2012). However, the results of these two studies were divergent. Martin (2009) reported that while students in grades two through eight made significant progress, students in higher grades were more likely to make progress. In Martin’s (2009) study, gender, first language, and number of years in an EL program did not significantly affect ELP assessment scores. In contrast, Slama (2012) found that students’ English language proficiency improved throughout high school, but slowed during the senior year. Slama (2012) also examined the relationship between students’ country of origin and their English proficiency development. Foreign-born ELs caught up to U.S.-born ELs by the end of high school, but overall proficiency for both groups of students remained low (Slama, 2012).
Evidence Base of Year-to-Year Progress Studies
We used the same characteristics to gauge the strength of the evidence base for the year-to-year progress studies as we used for the time-to-reclassification studies. These were: transparency; study samples; and study limitations.
Transparency. All of the five articles that measured ELP progress using year-to-year data pro-vided descriptions of the assessments administered. In addition, all but one study (Burke, 2015), defined progress in the context of the specific study. Table 7 shows the assessment information and reclassification criteria information provided by the five studies.
Table 7. Assessment and Reclassification Information Provided by Year-to-Year Studies
Information Provided Number of Year-to-Year Studies Including (n = 5)
Test administered 5
Definition of progress 4
Study samples. Studies measuring ELP progress using year-to-year data had varying levels of specificity when describing their samples in terms of sample sizes, the demographics of their sample, and the number of years of data collected for analysis. Table 8 summarizes the sample characteristics of the year-to year progress studies.

30 NCEO
Table 8. Sample Characteristics for Year-to-Year Studies
Sample CharacteristicsNumber of Year-to-Year Progress Studies
Including (n=5)
Location of sample 5
Sample size 4
Grade levels of students 4
Home language of students 2
Race/ethnicity of students 1
Age of students 0
Initial English proficiency levels of students 0
When students entered U.S. schools 0
Yearly student attrition 0
Special education status of students 0
All of the studies provided information about where their sample was located, and most of them listed their sample sizes and the grade levels of the ELs in their studies. Only two studies reported the home languages of ELs in the study samples, and only one described the race or ethnicity of its sample. No studies provided specific information about the age of students, initial levels of English language proficiency, when students entered U.S. schools, yearly student attrition, or special education status of students.
Study limitations. As we did for the time-to-reclassification studies, we examined the author-stated limitations of the year-to-year progress studies. With the exception of Linquanti and George (2007), the authors all identified limitations. The limitations are summarized in Table 9.
Table 9. Author-Identified Limitations from Year-to-Year Progress Studies
Limitation Number of Year-to-Year Progress Studies (n=5)
Limited sample or sub-sample size 3
Missing data 2
Non-random sample 1
Three of the studies (Burke, 2015; Marin, 2015; Martin, 2009) cited small sample or sub-sample sizes as a limitation, and two studies (Marin, 2015; Slama, 2012) cited missing data as a limi-tation. Two of these studies had data sets with fewer than 250 students (Marin, 2015; Martin, 2009). One study (Burke, 2015) had access to data on more than 1,200 ELs, but there were small numbers of students in some ELP levels that affected interpretations of the data. Missing data was also another limitation of the year-to-year progress studies. Slama (2012) had a large sample size of 3,702 students, but her study was limited by missing data caused by sample at-trition. Almost 28% of students who began as high school freshmen (n=1,036) in Slama’s study were missing assessment data by their junior year. Marin (2015) cited limitations that included

31NCEO
a loss of statistical power due to missing data, as well as threats to internal validity due to a small non-random sample.
Discussion and Conclusion
The purpose of this report was to review the literature on methods for calculating the prog-ress of ELs with disabilities in developing English language proficiency as measured by their state’s ELP assessment. The literature reviewed was limited to articles published in the U.S. between January 2007 and June 2017 that addressed K-12 ELs with and without disabilities. The articles also had to (a) use or report empirical research or data; (b) include a standardized measure of English language proficiency or a measure of time-to reclassification or likelihood of reclassification; and (c) focus on progress over time. Twenty-four articles were identified for inclusion in the review.
The research reviewed incorporated researcher-determined methods for demonstrating progress. None of the peer-reviewed literature addressed some of the growth models currently in use (or being considered for use) by states to measure progress on assessments. The discussion of growth models grew out of the growth model pilot program implemented in November 2005 for Title I accountability of adequate yearly progress (National Opinion Research Center, 2011). These models used three general approaches: (a) transition matrix, (b) trajectory, and (c) projection (Hoffer et al., 2011). Although numerous reports were developed to highlight how to differentiate and implement the various models (Castellano & Ho, 2013; CCSSO, 2017; Goldschmidt et al., 2005), they did not appear in the peer-reviewed research examined for this paper. Further, none of the reports specifically examined whether the models would be appropriate for measuring progress of ELs with disabilities on ELP assessments.
The 24 studies reviewed for this report supported Burke et al.’s (2016) findings that ELs are heterogeneous and require a range of time to achieve English proficiency. Limited data were available to document the ELP progress of ELs with disabilities. Only the time-to reclassification studies directly addressed the relationship between an EL’s special education status or disability and the student’s English proficiency progress. Of the five articles examining year-to-year ELP progress, none of them examined the relationship between an ELs’ special education status or disability and his or her English proficiency progress. Thus, there were no findings specific to ELs with disabilities in the year-to-year ELP progress articles.
Of the 19 time-to-reclassification article or dissertations examined, 11 explicitly stated find-ings specific to ELs with disabilities. Results from these articles suggested that students with disabilities were less likely to achieve proficiency and reclassification compared to their peers without disabilities, and that when they were reclassified they took longer to do so, with some

32 NCEO
variation in the length of time for students with different types of disabilities (e.g., more time for students with learning disabilities, speech-language disabilities, and intellectual disabilities). Students who did not reach proficiency during the time of the study often went on to become what educators call “long-term” ELs. With each year that long-term ELs remain an EL, they are more likely to have limited use of their home language, English skills that are too poorly developed for complex academic tasks, a pattern of non-participation in classes, limited access to grade-level content, and thus, poor grades and a low grade-point average (Olsen, 2014).
None of the articles we found addressed the measurement of progress of ELs with significant cognitive disabilities eligible to take an alternate ELP assessment. Still, research by Tindal and colleagues in the National Center on Assessment and Accountability for Special Education (NCAASE) has explored the measurement of growth on content assessments (Tindal, Nese, Farley, Saven, & Elliott, 2016). Their approach and findings may be applicable to the future study of the progress of ELs with significant cognitive disabilities on alternate ELP assessments.
How to Measure ELP Progress of ELs with Disabilities
Our primary question was to identify how the ELP progress of ELs with disabilities could be measured. This question was raised, in part, because of federal requirements to include the ELP progress of ELs as one indicator for Title I accountability, and the need to disaggregate the results of ELs with disabilities. In general, the response to this question is that it appears that the same methods that are used to measure the ELP progress of ELs can be used to measure the progress of ELs with disabilities. This conclusion is reached with several caveats.
One caveat is that there is not a strong research base for this conclusion. Relatively few stud-ies examined the ELP progress of ELs with disabilities, and when they did so, the focus of the research was to compare ELs with disabilities to ELs without disabilities rather than to test the efficacy and appropriateness of the methods used for ELs with disabilities. Nevertheless, in implementing specific approaches to measuring progress, authors typically identified limitations that are particularly relevant for ELs with disabilities.
A primary limitation identified in the research was the need for time-to-reclassification studies to censor data. The censoring of data is likely to affect ELs with disabilities disproportionately more than it is likely to affect ELs in general. This is the case because the factors identified as reasons for censoring (e.g., failure to reclassify by the end of the study) are more prevalent or likely to occur in the population of ELs with disabilities compared to the EL population overall. Although studies did not explicitly address this difference, some did discuss the problems due to this type of censoring. For example, in Thompson’s (2015) study, 67% of the censored stu-dents were censored because the study ended before they were reclassified. Thompson further noted that proving censored data are “noninformative” can be difficult. She recommended some

33NCEO
procedures for checking that censored data are truly noninformative, including communicating the percentage of students censored because the study ended. We would add to Thompson’s recommendation that researchers should report the number and percentage of ELs with dis-abilities who were censored because the study ended.
In addition to concerns about censored data, although not directly addressed in the research literature, are the complications created by the small n size of ELs with disabilities. This is a limitation that often precludes any focus of analyses on these students. There is a need for research on innovative methodologies to examine the ELP progress of small populations of students such as ELs with disabilities.
Finally, although interesting for research, it is important to recognize that time-to-proficiency is not a direct indicator of students’ performance on an ELP assessment, let alone a true measure of growth. It is based on an end-point (reclassification or proficiency) that is a broad categori-cal outcome; it fails to document changes that may occur within a category, an outcome that is important for states and practitioners when examining ELP progress of ELs with disabilities.
The year-to-year approach, which might be easier to adopt, is likely to suffer from limitations noted by the authors of these studies, including small sample sizes, missing data, and non-random samples of students. Although none of the year-to-year progress studies included ELs with disabilities, the limitations that were noted by the authors of these studies (limited sample size, missing data, non-random sample) are likely to be even more limiting for measuring the progress of ELs with disabilities.
Recommendations
The lack of peer-reviewed literature addressing ways to measure the progress of ELs with dis-abilities on ELP assessments, leads to a number of recommendations for future research and for practice.
Recommendations for research. A primary recommendation of the literature review we conducted is the need for research on appropriate ways to measure the progress of ELs with disabilities on ELP assessments. Given that there is a federal requirement for states to report on ELP progress and to disaggregate those results for ELs with disabilities, this is a recommendation that is past due. It is likely that states will need to adopt (or have already adopted) approaches based on their best professional judgment. It is imperative that researchers work with states to examine state data in terms of the extent to which the selected methodology allows for the state to report results for ELs with disabilities that are representative of the population of ELs with disabilities in the state. Both quantitative and qualitative studies should be conducted to explore the extent to which the methods adopted by states are appropriate for ELs with disabilities.

34 NCEO
Additional research should focus on the appropriateness of a method such as the time to reclas-sification method (or time to proficiency method) for use with state ELP assessment results. This methodology may be appropriate for answering questions about how much time students are taking to be reclassified, but its applicability may be different in states where the reclassi-fication decision is based solely on a test score and states where the reclassification decision is influenced by educators’ opinions about whether a student is ready for reclassification. Research might examine the differences in results based on the two approaches (state test score only or additional information added), for ELs with disabilities compared to ELs overall.
Regardless of the method under consideration, researchers should examine the extent to which censoring procedures or small n sizes make a method unusable. When this is the case, research should examine whether data from across years could be combined to make it possible to use a method to measure ELP growth of ELs with disabilities. If a method is usable, results also should more clearly state the potential non-representativeness of the results for all ELs with disabilities. Presenting information on the number and percentage of ELs with disabilities excluded from the results due to missing data, censoring, or small sample sizes is essential.
Recommendations for practitioners and policymakers. Practitioners may need to rely on their best judgment about how to measure progress on the ELP assessment of ELs with disabilities. According to Goldschmidt (2018), states have in the past two years increased their efforts to include an indicator of progress in English proficiency into their accountability systems. He notes that states must engage in data-based decision making about what constitutes sufficient progress in English language development for ELs overall, but also suggests that a challenging aspect of this is determining progress for ELs with disabilities when some of those disabilities affect language learning.
When determining how to measure progress of ELs with disabilities, states should learn from the limitations that were identified in the peer-reviewed literature. Specifically, they should be attuned to the extent to which their results might be affected by missing data, and whether miss-ing data are occurring in systematically different ways for ELs with disabilities and other ELs. As part of being aware of these potential differences, public reporting is critical. Documenting whether ELs with disabilities are missing from analyses and the reasons they are missing will be essential.
At the local level, the use of appropriate formative assessment methodologies (Brookhart & Lazarus, 2017; Montalvo-Balbed, 2012) should be considered as an essential part of measuring the ELP progress of ELs with disabilities in the classroom.

35NCEO
References
Beardsley, E. W. (2015). Survival analysis: Timelines to English language proficiency at the secondary school level (doctoral dissertation). Louisville, KY: Bellarmine University.
Brookhart, S., & Lazarus, S. (2017). Formative assessment for students with disabilities. Wash-ington, DC: CCSSO, Assessing Special Education Students, Formative Assessment.
Burke, A. (2015). The Impact of Educational Policy on English Learners in a Rural Indiana School Corporation. Mid-Western Educational Researcher, 27(4), 317-338.
Burke, A. M., Morita-Mullaney, T., & Singh, M. (2016). Indiana emergent bilingual student time to reclassification: A survival analysis. American Educational Research Journal, 53(5), 1310-1342.
Castellano, K. E., & Ho, A. D. (2013). A practitioner’s guide to growth models. Washington, DC: Council of Chief State School Officers, Technical Issues in Large-Scale Assessment (TILSA) and Accountability Systems & Reporting (ASR).
CCSSO. (2017). Considerations for including growth in ESSA state accountability systems. Washington, DC: Author.
Conger, D. (2008) Testing, time limits, and English learners: Does age of school entry affect how quickly students can learn English? Social Science Research 38, 383-396.
Conger, D., Hatch, M., McKinney, J., Atwell, M. S., & Lamb, A. (2012). Time to English pro-ficiency for English language learners in New York City and Miami-Dade County. New York: New York University, Institute for Educational and Social Policy. Retrieved from: https://files .eric.ed.gov/fulltext/ED556750.pdf
Cook, G., Linquanti, R., Chinen, M., & Jung, H. (2012). National evaluation of Title III imple-mentation supplemental report—Exploring approaches to setting English language proficiency performance criteria and monitoring English learner progress. Washington, D.C.: U.S. Depart-ment of Education. Retrieved from: https://www2.ed.gov/rschstat/eval/title-iii/implementation-supplemental-report.pdf
Estrada, P., & Wang, H. (2013). Reclassifying and not reclassifying English learners to fluent English proficient, year 1 findings: Factors impeding and facilitating reclassification and ac-cess to the core. (ERIC Document No. ED550098). Retrieved from: https://files.eric.ed.gov/ fulltext/ED550098.pdf

36 NCEO
Goldschmidt (2018). Handbook for developing and monitoring the English language proficiency indicator and English learner progress. Washington, DC: Council of Chief State School Officers.
Goldschmidt, P., Roschewski, P., Choi, K., Auty, W., Hebbler, S., Blank, R., & Williams, A. (2005). Policymakers’ guide to growth models for school accountability: How do accountability models differ? Washington, DC: Council of Chief State School Officers, Accountability Systems and Reporting.
Haas, E., Huang, M., Tran, L., & Yu, A. (2015). The achievement progress of English learner students in Arizona (REL 2015-098). Washington, DC: U.S. Department of Education, Institute of Education Sciences, National Center for Education Evaluation and Regional Assistance, Regional Educational Laboratory West. Retrieved from: https://ies.ed.gov/ncee/edlabs/regions/ west/pdf/REL_2015098.pdf
Haas, E., Huang, M., Tran, L., & Yu, A. (2016a). The achievement progress of English learner students in Nevada (REL 2016-154). Washington, DC: U.S. Department of Education, Institute of Education Sciences, National Center for Education Evaluation and Regional Assistance, Regional Educational Laboratory West. (ERIC Document No. ED568355). Retrieved from: https://files.eric.ed.gov/fulltext/ED568355.pdf
Haas, E., Huang, M., Tran, L., & Yu, A. (2016b). The achievement progress of English learner students in Utah (REL 2016-155). Washington, DC: U.S. Department of Education, Institute of Education Sciences, National Center for Education Evaluation and Regional Assistance, Regional Educational Laboratory West. Retrieved from: https://ies.ed.gov/ncee/edlabs/regions/ west/pdf/REL_2016155.pdf
Hoffer, T. B., Hedberg, E. C., Brown, K. L., Halverson, M. L., Reid-Brossard, P., Ho, A. D., & Furgol, K. (2011). Final report on the evaluation of the growth model pilot project. Chicago: National Opinion Research Center (NORC).
Hosmer, D. W., Jr., Lemeshow, S., & May, S. (2008). Applied survival analysis: Regression modeling of time to event data (2nd ed.). Hoboken, New Jersey: John Wiley & Sons, Inc.
Kieffer, M. J., & Parker, C. E. (2016). Patterns of English learner student reclassification in New York City public schools. Washington, DC: U.S. Department of Education, Institute of Educa-tion Sciences, National Center for Education Evaluation and Regional Assistance, Regional Education Laboratory Northeast and Islands. Retrieved from: https://ies.ed.gov/ncee/ edlabs/regions/northeast/pdf/REL_2017200.pdf

37NCEO
Kim, Y. K., Curby, T. W., & Winsler, A. (2014). Child, family, and school characteristics related to English proficiency development among low-income, dual language learners. Developmental Psychology, 50(12), 2600-2613.
Kuti, L. M., & Xu, Y. (2012). Accommodations for English language learners on statewide English language proficiency assessment. The Journal of Special Education Apprenticeship, 1(1), Article 1. Available at: http://scholarworks.lib.csusb.edu/josea/vol1/iss1/1
Linquanti, R., & George, C. (2007). Establishing and utilizing an NCLB Title III accountability system: California’s approach and findings to date. In J. Abedi (Ed.), English language profi-ciency assessment in the nation: Current status and future practice (pp. 105-118). Davis, CA: University of California, Davis, School of Education. Retrieved from: http://education.ucdavis .edu/sites/main/files/ELP_Report.pdf
Marin, A. M. (2015). Determining the academic achievement of English Language Learners (ELLs) by using additional measures of growth (Order No. 3712655). Available from ProQuest Dissertations and Theses. (1707683394). Retrieved from http://login.ezproxy.lib.umn.edu/ login?url=https://search.proquest.com/docview/1707683394?accountid=14586
Martin, M. K. (2009). An empirical evaluation of the progress and achievement of English language learners in a suburban school district (Order No. 3386337). Available from Pro-Quest Dissertations and Theses. (304941150). Retrieved from http://login.ezproxy.lib.umn.edu/ login?url=https://search.proquest.com/docview/304941150?accountid=14586
Matta, T. H. (2016). A joint modeling approach to studying English language proficiency devel-opment and time-to-reclassification (Doctoral dissertation). Eugene, OR: University of Oregon.
Mavrogordato, M., & White, R. S. (2017). Reclassification variation: How policy implementa-tion guides the process of exiting students from English learner status. Educational Evaluation and Policy Analysis, 39(2), 281-310.
Montalvo-Balbed, M. (2012). Using formative assessment to help English language learners (PD Online, Module 4). Washington, DC: ASCD.
Motamedi, J. G. (2016). Time to reclassification: How long does it take English language learners in seven Washington districts to develop English proficiency? (ERIC Document No. ED567496). Retrieved from https://files.eric.ed.gov/fulltext/ED567496.pdf
Motamedi, J. G., Singh, M., & Thompson, K. D. (2016). English learner student characteristics and time to reclassification: An example from Washington state. U.S. Department of Educa-tion, Institute of Education Sciences, National Center for Education Evaluation and Regional
38 NCEO
Assistance, Regional Education Laboratory Northwest. Retrieved from https://ies.ed.gov/ncee/ edlabs/projects/project.asp?projectID=434
National Opinion Research Center (NORC). Final report on the evaluation of the growth model pilot project. Washington, DC: U.S. Department of Education, Office of Planning, Evaluation and Policy Development. Retrieved from https://www2.ed.gov/rschstat/eval/disadv/growth-model-pilot/gmpp-final.pdf
Olsen, L. (2014). Meeting the unique needs of long term English language learners: A guide for educators. Washington, D.C.: National Education Association.
Rubio, E. V. (2014). English language learners in an accountability landscape: Examining re-classification, long-term ELLs, language programs, and grade retention (doctoral dissertation). Cambridge, MA: Harvard University.
Slama, R. B. (2012). A longitudinal analysis of academic English proficiency outcomes for adolescent English language learners in the United States. Journal of Educational Psychology, 104(2), 265-285. doi:10.1037/a0025861
Slama, R. B. (2014). Investigating whether and when English learners are reclassified into main-stream classrooms in the United States: A discrete-time survival analysis. American Educational Research Journal, 51(2), 220-252.
Slama, R. B., Haynes, E., Sacks, L., Lee, D. H., & August, D. (2015). Massachusetts Eng-lish language learners’ profiles and progress: A report for the Massachusetts Department of Elementary and Secondary Education. Washington, D.C.: American Institutes for Research, Center for English language learners. Retrieved from: http://www.doe.mass.edu/research/ reports/2015/10MA-ELLStudyReport.docx
Thompson, K. (2012). Are we there yet? Exploring English learners’ journey to reclassifica-tion and beyond (Doctoral dissertation). Retrieved from Stanford Digital Repository: http://purl .stanford.edu/qd054zq1735
Thompson, K. D. (2015). English learners’ time to reclassification: An analysis. Educational Policy, 31(3), 330-363.
Thurlow, M. L., Shyyan, V. V., Lazarus, S. S., & Christensen, L. L. (2016). Providing English language development services to English learners with disabilities: Approaches to making exit decisions (NCEO Report 404). Minneapolis, MN: University of Minnesota, National Center on Educational Outcomes.

39NCEO
Tindal, G., Nese, J. F. T., Farley, D., Saven, J. L., & Elliott, S. N. (2016). Documenting read-ing achievement and growth for students taking alternate assessments. Exceptional Children, 82(3), 321-336.
Umansky, I. M., & Reardon, S. F. (2014). Reclassification patterns among Latino English learner students in bilingual, dual immersion, and English immersion classrooms. American Educational Research Journal, 51(5), 879-912.
U.S. Department of Education. (n.d.). Fast Facts: English learners. Retrieved from: https://nces .ed.gov/fastfacts/display.asp?id=96
U.S. Department of Education. (2016). English learner toolkit for state and local education agencies (SEAs and LEAs). Washington, D.C.: National Center for English Language Acquisition (NCELA). Retrieved from: https://www2.ed.gov/about/offices/list/oela/english-learner-toolkit/index.html
U.S. Department of Education. (2017). Condition of Education 2017 (2017-144), English Lan-guage Learners in Public Schools. Washington, DC: National Center for Education Statistics. Retrieved from https://nces.ed.gov/programs/coe/indicator_cgf.asp
U.S. Department of Education. (2017). Resource guide: Accountability for English learners under the ESEA. Washington, DC: Office of Elementary and Secondary Education. Retrieved from: http://www2.ed.gov/programs/sfgp/eseatitleiiiresourceaccountelsguide.docx

40 NCEO

41NCEO
Appendix A
Descriptive Information for Time-to-Reclassification Studies

42 NCEO
Stu
dy
Stu
den
ts w
ith
Dis
-ab
iliti
es (
Dis
abili
ty
Cat
ego
ries
)S
tate
(s)
An
alys
is
met
ho
dS
amp
leG
rad
e L
evel
Ho
me
Lan
-g
uag
es in
S
amp
lea
Year
s o
f D
ata
Bea
rdsl
ey(2
015)
Not
incl
uded
Ken
tuck
yS
urvi
val a
nal-
ysis
, des
crip
-tiv
e an
alys
is
1,87
8 hi
gh
scho
ol s
tude
nts
from
a la
rge
urba
n sc
hool
di
stric
t
Gra
des
9—12
MM
, Ne,
So,
S
p20
09-2
010,
201
3-20
14
Bur
ke e
t al.
(201
6)In
clud
ed fi
ndin
gs
spec
ific
to S
WD
(no
di
sabi
lity
cate
gorie
s)
Indi
ana
Sur
viva
l an
alys
isO
ne c
ohor
t of
4,01
0 st
uden
tsG
rade
3 fo
l-lo
wed
unt
il G
rade
7
Sp
2008
-200
9, 2
012-
2013
Con
ger
(200
8)In
clud
ed fi
ndin
gs s
pe-
cific
to S
WD
(“m
ild o
r m
oder
ate
disa
bilit
ies,
” bu
t no
disa
bilit
y ca
tego
-rie
s lis
ted)
New
Yor
kS
urvi
val
anal
ysis
“Fou
r pa
nel
data
sets
of E
L st
uden
ts w
ho
wer
e ne
w e
n-tr
ants
from
199
6 th
roug
h 19
99…
[H
owev
er] t
he
anal
ysis
focu
ses
on th
e 8,
976
stud
ents
who
en
tere
d in
199
7.”
Gra
des
1—8,
fol-
low
ed fo
r a
min
imum
of
3 ye
ars
and
a m
axim
um
of 8
yea
rs
Be,
C, H
a,
Ko,
R, S
p19
96, 2
004
Con
ger
et a
l. (2
012)
Not
incl
uded
New
Yor
k,
Flo
rida
Sur
viva
l an
alys
isO
ne c
ohor
t of
9,10
8 st
uden
ts
ages
5 th
roug
h 10
from
NY
C
Ano
ther
co-
hort
of 1
2,15
8 st
uden
ts a
ges
5 th
roug
h 10
from
M
iam
i-Dad
e C
ount
y P
ublic
S
choo
ls
Defi
ned
stud
ents
in
term
s of
ag
es, n
ot
grad
es
C, H
a, R
, Sp
1997
-199
8, 2
003
2003
-200
4, 2
008

43NCEO
Stu
dy
Stu
den
ts w
ith
Dis
-ab
iliti
es (
Dis
abili
ty
Cat
ego
ries
)S
tate
(s)
An
alys
is
met
ho
dS
amp
leG
rad
e L
evel
Ho
me
Lan
-g
uag
es in
S
amp
lea
Year
s o
f D
ata
Est
rada
&
Wan
g(2
013)
Not
incl
uded
Cal
iforn
iaD
escr
iptiv
e st
atis
tics
7 co
hort
s of
st
uden
t fro
m
two
CA
dis
tric
ts
(N1=
687,
534
and
N2=
48,1
55)
who
w
ere
in g
rade
s 2-
8 at
the
begi
n-ni
ng o
f the
stu
dy
Gra
des
2—8,
fol-
low
ed fo
r 4
year
s
Hm
, Sp
2009
-201
0, 2
013-
2014
Haa
s et
al.
(201
5)In
clud
ed fi
ndin
gs
spec
ific
to S
WD
(no
di
sabi
lity
cate
gorie
s)
Ariz
ona
Des
crip
tive
stat
istic
sA
ll A
Z s
tude
nts
who
had
ELP
re
sults
. One
kin
-de
rgar
ten
coho
rt
(N1=
16,3
77),
on
e 3rd
gra
de c
o-ho
rt (
N2=
7,93
8),
and
one
6th
grad
e co
hort
(N
3=4,
287)
K, G
rade
3,
and
Gra
de
6 ea
ch fo
l-lo
wed
for
6 ye
ars
n/a
2006
-200
7, 2
011-
2012
Haa
s et
al.
(201
6a)
Incl
uded
find
ings
sp
ecifi
c to
SW
D (
no
disa
bilit
y ca
tego
ries)
Nev
ada
Des
crip
tive
stat
istic
sO
ne k
inde
r-ga
rten
coh
ort
(N1=
6,62
0), o
ne
3rd g
rade
coh
ort
(N2=
5,13
8), a
nd
one
6th g
rade
co-
hort
(N
3=2,
306)
fr
om tw
o N
V
scho
ol d
istr
icts
K, G
rade
3,
and
Gra
de
6 ea
ch fo
l-lo
wed
for
6 ye
ars
n/a
2006
-200
7,20
11-2
012
Haa
s et
al.
(201
6b)
Incl
uded
find
ings
sp
ecifi
c to
SW
D (
no
disa
bilit
y ca
tego
ries)
Uta
hD
escr
iptiv
e st
atis
tics
All
AZ
stu
dent
s w
ho h
ad E
LP
and
mat
h/E
LA
test
res
ults
. O
ne k
inde
r-ga
rten
coh
ort
(N1=
3,23
7), o
ne
3rd
grad
e co
hort
(N
2=2,
088)
, an
d on
e 6t
h gr
ade
coho
rt
(N3=
1,15
2)
K, G
rade
3,
and
Gra
de
6 ea
ch fo
l-lo
wed
for
6 ye
ars
n/a
2006
-200
7, 2
011-
2012
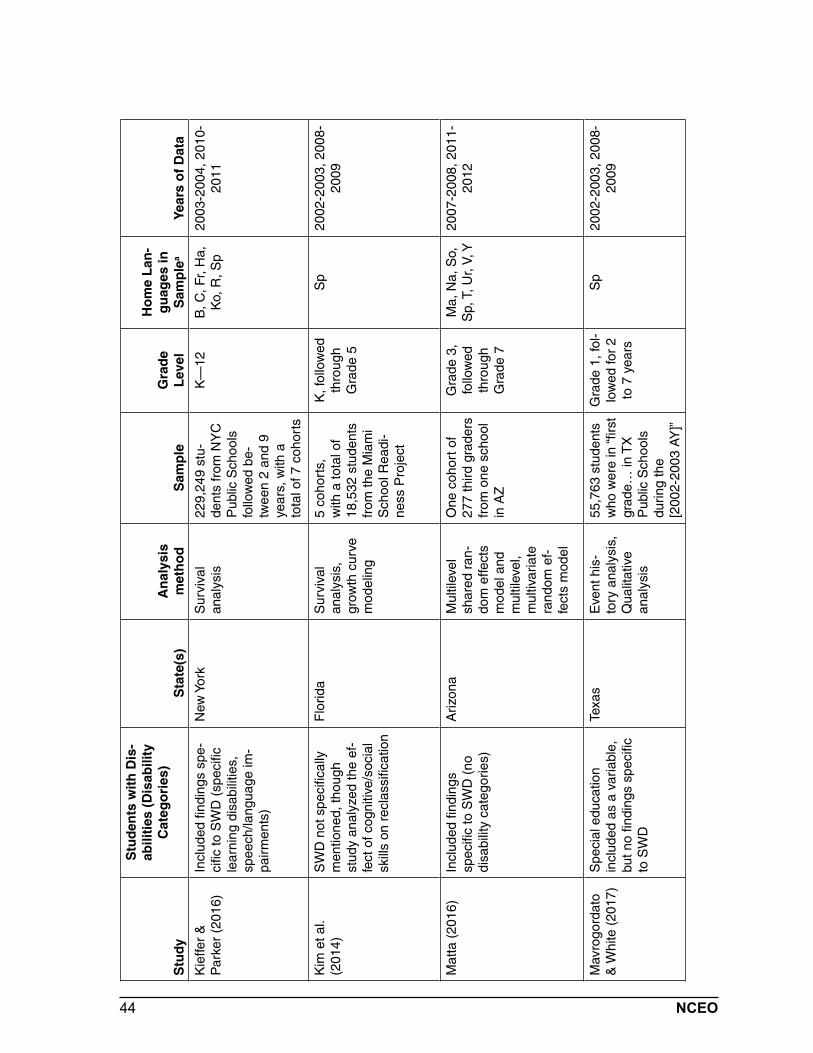
44 NCEO
Stu
dy
Stu
den
ts w
ith
Dis
-ab
iliti
es (
Dis
abili
ty
Cat
ego
ries
)S
tate
(s)
An
alys
is
met
ho
dS
amp
leG
rad
e L
evel
Ho
me
Lan
-g
uag
es in
S
amp
lea
Year
s o
f D
ata
Kie
ffer
&
Par
ker
(201
6)In
clud
ed fi
ndin
gs s
pe-
cific
to S
WD
(sp
ecifi
c le
arni
ng d
isab
ilitie
s,
spee
ch/la
ngua
ge im
-pa
irm
ents
)
New
Yor
kS
urvi
val
anal
ysis
229,
249
stu-
dent
s fr
om N
YC
P
ublic
Sch
ools
fo
llow
ed b
e-tw
een
2 an
d 9
year
s, w
ith a
to
tal o
f 7 c
ohor
ts
K—
12B
, C, F
r, H
a,
Ko,
R, S
p20
03-2
004,
201
0-20
11
Kim
et a
l. (2
014)
SW
D n
ot s
peci
fical
ly
men
tione
d, th
ough
st
udy
anal
yzed
the
ef-
fect
of c
ogni
tive/
soci
al
skill
s on
rec
lass
ifica
tion
Flo
rida
Sur
viva
l an
alys
is,
grow
th c
urve
m
odel
ing
5 co
hort
s,
with
a to
tal o
f 18
,532
stu
dent
s fr
om th
e M
iam
i S
choo
l Rea
di-
ness
Pro
ject
K, f
ollo
wed
th
roug
h G
rade
5
Sp
2002
-200
3, 2
008-
2009
Mat
ta (
2016
)In
clud
ed fi
ndin
gs
spec
ific
to S
WD
(no
di
sabi
lity
cate
gorie
s)
Ariz
ona
Mul
tilev
el
shar
ed r
an-
dom
effe
cts
mod
el a
nd
mul
tilev
el,
mul
tivar
iate
ra
ndom
ef-
fect
s m
odel
One
coh
ort o
f 27
7 th
ird g
rade
rs
from
one
sch
ool
in A
Z
Gra
de 3
, fo
llow
ed
thro
ugh
Gra
de 7
Ma,
Na,
So,
S
p, T
, Ur,
V, Y
2007
-200
8, 2
011-
2012
Mav
rogo
rdat
o &
Whi
te (
2017
)S
peci
al e
duca
tion
incl
uded
as
a va
riabl
e,
but n
o fin
ding
s sp
ecifi
c to
SW
D
Texa
sE
vent
his
-to
ry a
naly
sis,
Q
ualit
ativ
e an
alys
is
55,7
63 s
tude
nts
who
wer
e in
“fir
st
grad
e… in
TX
P
ublic
Sch
ools
du
ring
the
[200
2-20
03 A
Y]”
Gra
de 1
, fol
-lo
wed
for
2 to
7 y
ears
Sp
2002
-200
3, 2
008-
2009

45NCEO
Stu
dy
Stu
den
ts w
ith
Dis
-ab
iliti
es (
Dis
abili
ty
Cat
ego
ries
)S
tate
(s)
An
alys
is
met
ho
dS
amp
leG
rad
e L
evel
Ho
me
Lan
-g
uag
es in
S
amp
lea
Year
s o
f D
ata
Mot
amed
i (2
016)
Incl
uded
find
ings
sp
ecifi
c to
SW
D (
no
disa
bilit
y ca
tego
ries)
Was
hing
ton
Des
crip
tive
stat
istic
s“1
7,73
3 cu
r-re
nt a
nd fo
rmer
E
LLs
who
wer
e m
embe
rs o
f 8
coho
rts
that
at-
tend
ed s
choo
ls
in 7
dis
tric
ts”
K—
Gra
de
5, fo
llow
ed
for
6 to
13
year
s
Am
, K, S
a,
Sp
2005
-200
6, 2
012-
2013
, alth
ough
da
ta in
clud
es
info
rmat
ion
abou
t re
clas
sific
atio
n fo
r 20
00-2
001,
201
2-20
13
Mot
amed
i et a
l. (2
016)
Not
incl
uded
Was
hing
ton
Sur
viva
l an
alys
is7
coho
rts,
with
a
tota
l of 1
6,95
7 E
Ls
K, f
ollo
wed
fo
r 2
to 8
ye
ars
C, R
, So,
Sp,
U
k, V
2005
-200
6, 2
012-
2013
Rub
io (
2014
)In
clud
ed fi
ndin
gs
spec
ific
to S
WD
in
Stu
dy 2
of d
isse
rtat
ion
(“au
tistic
, em
otio
nally
di
stur
bed,
har
d of
hea
r-in
g, le
arni
ng d
isab
ility
, m
ultip
le h
andi
caps
, m
enta
lly r
etar
ded,
oth
er
heal
th im
pair
men
t, or
-th
oped
ical
ly im
paire
d,
pre-
scho
ol d
isab
ility
, sp
eech
impa
ired,
and
vi
sual
ly im
paire
d” p
. 83)
New
Yor
kS
tudy
1:
Dis
cret
e-tim
e su
rviv
al
anal
ysis
S
tudy
2:
Des
crip
tive
stat
istic
s
Stu
dy 1
: 7,4
35
stud
ents
from
62
0 sc
hool
s in
NY
C p
ublic
sc
hool
s
Stu
dy 2
: 5,7
44
stud
ents
in N
YC
pu
blic
sch
ools
Stu
dy 1
: K,
follo
wed
for
9 ye
ars
S
tudy
2: K
, fo
llow
ed fo
r 6
year
s
C, B
, R, S
p,
Ur
2003
-200
4, 2
011-
2012

46 NCEO
Stu
dy
Stu
den
ts w
ith
Dis
-ab
iliti
es (
Dis
abili
ty
Cat
ego
ries
)S
tate
(s)
An
alys
is
met
ho
dS
amp
leG
rad
e L
evel
Ho
me
Lan
-g
uag
es in
S
amp
lea
Year
s o
f D
ata
Sla
ma
(201
4)S
peci
al e
duca
tion
sta-
tus
incl
uded
in d
emo-
grap
hics
, but
no
find-
ings
spe
cific
to S
WD
Mas
sach
uset
tsD
iscr
ete-
time
surv
ival
an
alys
is
5,35
4 E
Ls
K, f
ollo
wed
fo
r 8
year
sS
p20
02-2
003,
201
0-20
11
Sla
ma
et a
l. (2
015)
Incl
uded
find
ings
spe
-ci
fic to
SW
D (
Dis
abili
ty
cate
gorie
s: in
telle
ctua
l, se
nsor
y/he
arin
g, c
om-
mun
icat
ion,
em
otio
nal,
heal
th, s
peci
fic le
arn-
ing
disa
bilit
ies,
mul
tiple
di
sabi
litie
s, a
utis
m,
neur
olog
ical
)
Mas
sach
uset
tsD
iscr
ete-
time
surv
ival
an
alys
is
4,99
7 E
LL s
tu-
dent
s at
tend
ing
MA
pub
lic s
choo
l di
stric
ts
K, f
ollo
wed
th
roug
h G
rade
10
C, K
h, P
, Sp,
V
2003
-200
4, 2
013-
2014
Tho
mps
on
(201
5)In
clud
ed fi
ndin
gs
spec
ific
to S
WD
(no
di
sabi
lity
cate
gorie
s)
Cal
iforn
iaD
iscr
ete-
time
surv
ival
an
alys
is
202,
931
stu-
dent
s w
ho
ente
red
Los
Ang
eles
Uni
ted
Sch
ool D
istr
ict
as E
Ls
K, f
ollo
wed
fo
r 9
year
sA
r, F
i, K
o, S
p20
01-2
002,
200
9-20
10
Um
ansk
y &
Rea
rdon
(2
014)
Spe
cial
edu
catio
n st
a-tu
s in
clud
ed in
dem
o-gr
aphi
cs, b
ut n
o fin
d-in
gs s
peci
fic to
SW
D
Cal
iforn
iaD
iscr
ete-
time
even
t his
tory
an
alys
is
5,43
2 La
tinx
stud
ents
who
en
tere
d a
CA
sc
hool
dis
tric
t in
kin
derg
arte
n be
twee
n fa
ll 20
00 a
nd s
prin
g 20
09
K, f
ollo
wed
th
roug
h th
e en
d of
G
rade
3—
Gra
de 1
2
Sp
2000
-200
1, 2
012-
2013

47NCEO
a Am
: Am
haric
A
r: A
rmen
ian
B: B
enga
li B
a: B
anga
la
Be:
“Ben
gale
se”
C: C
hine
se
Fi: F
ilipi
no
Fr: F
renc
h G
: Guj
arat
i H
a: H
aitia
n H
i: H
indi
H
m: H
mon
g
I: Ita
lian
Ko:
Kor
ean
Kh:
Khm
er
Ma:
Mal
ay
MM
: Mai
N
a: N
avaj
o
Ne:
Nep
ali
P: P
ortu
gues
e R
: Rus
sian
S
a: S
amoa
n S
o: S
omal
i S
p: S
pani
sh
T: T
hai
Uk:
Ukr
aini
an
Ur:
Urd
u V:
Vie
tnam
ese
Y: Y
aqui

48 NCEO

49NCEO
Appendix B
Descriptive Information for Year-to-Year Growth Studies

50 NCEO
Stu
dy
Stu
den
ts w
ith
Dis
-ab
iliti
es (
Dis
abili
ty
Cat
ego
ries
)
Sta
te(s
)A
nal
ysis
Met
ho
dS
amp
leG
rad
e L
evel
Ho
me
Lan
gu
ages
in
Sam
ple
aYe
ars
of
Dat
a
Bur
ke (
2015
)N
ot in
clud
edIn
dian
aP
erce
nt o
f ELs
who
in
crea
sed
one
profi
-ci
ency
leve
l
Unk
now
n nu
mbe
rG
rade
s 3—
8 n/
a20
09, 2
012
Linq
uant
i &
Geo
rge
(200
7)N
ot in
clud
edC
alifo
rnia
Per
cent
of E
Ls w
ho
incr
ease
d on
e pr
ofi-
cien
cy le
vel
862,
000
stud
ents
K—
Gra
de
12n/
a20
04-2
005,
20
05-2
006
Mar
in (
2015
)N
ot in
clud
edM
issi
ssip
piA
NO
VA
211
stud
ents
Gra
des
3—8
n/a
2012
-201
3,
2013
-201
4
Mar
tin
(200
9)N
ot in
clud
edM
issi
ssip
piT-
test
64 s
tude
nts
Gra
des
2—8
Ar,
Ba,
C, F
r, G
, Hi,
Ko,
P, R
, Sp,
V20
02, 2
005
Sla
ma
(201
2)N
ot in
clud
edM
assa
chus
etts
Gro
wth
traj
ecto
ries
3,70
2 st
u-de
nts
Gra
de 9
Sp
2004
, 200
8
a Am
: Am
haric
A
r: A
rmen
ian
B: B
enga
li B
a: B
anga
la
Be:
“Ben
gale
se”
C: C
hine
se
Fi: F
ilipi
no
Fr: F
renc
h G
: Guj
arat
i H
a: H
aitia
n H
i: H
indi
H
m: H
mon
g
I: Ita
lian
Ko:
Kor
ean
Kh:
Khm
er
Ma:
Mal
ay
MM
: Mai
N
a: N
avaj
o
Ne:
Nep
ali
P: P
ortu
gues
e R
: Rus
sian
S
a: S
amoa
n S
o: S
omal
i S
p: S
pani
sh
T: T
hai
Uk:
Ukr
aini
an
Ur:
Urd
u V:
Vie
tnam
ese
Y: Y
aqui

51NCEO
Appendix C Reclassification Criteria Described by Reviewed Literature
State ELP test(s) Required scores Other criteria
Arizona Arizona English Language Learner Assessment (AZELLA)
Level 5 (Proficient) (Haas, et al., 2015; Matta, 2016)
None listed
California California English Language De-velopment Test (CELDT), California Standards Tests-English Language Arts (CST-ELA)
“No subscore [can be] below 3 (out of 5)” (Umansky & Reardon, 2014).
Sometimes mathematics scores (Estrada & Wang, 2013)
Parent opinion (Estrada & Wang, 2013)
Teacher approval and grades (Estrada & Wang, 2013; Thompson, 2015)
FloridaMiami-Dade County Oral Lan-guage Proficiency Scale-Revised (M-DCOLPS-R), Com-prehensive English Language Learn-ing Assessment (CELLA), Florida Comprehensive Assessment Test (FCAT)
Between 2003 and 2007 (Kim, et al., 2014): “Score a Level V Independent (non-ESOL), which is equivalent to a raw score of 20 out of 20, on the M-DCOLPS-R” (Conger, et al., 2012).
Starting in 2006/07: Separate K-2 and grades 3-5 versions of CELLA used. “As done with the [M-DCOLPS-R], raw scores place children in one of the five ordinal ESOL levels.”
Starting in 2008, third-grade (or higher) students must also reach a minimum threshold of performance on the high stakes (English) read-ing… FCAT in addition to reaching ESOL Level 5” (Kim, et al., 2014)
None listed
Indiana LAS Links Proficiency Level 5 (Fluent) (Burke et al., 2016)
None listed
Kentucky Assessing Com-prehension and Communication in English State-to-State (ACCESS) for ELs
Overall Composite score of 5.0 or higher
Overall Literacy Composite score of 4.0 on Tier B or Tier C (Beardsley, 2015)
None listed

52 NCEO
State ELP test(s) Required scores Other criteria
Massachusetts Massachusetts English Profi-ciency Assessment (MEPA), ACCESS for ELs
“Proficient” on MEPA or ACCESS (Slama et al., 2015)
“State content-area as-sessments, grades, teacher observations, class work, and parent input” (Slama, 2014).
New York New York State English as a Second Language Achievement Test (NYSESLAT), Lan-guage Assessment Battery (LAB)
Score above the 40th percentile on the LAB (Conger, 2008; Conger et al., 2012)
“Reclassification… is based on a single English proficiency assess-ment.” Level 4 out of 4 (“proficient”) on NYSESLAT (Rubio, 2014)
None listed
Texas Test of English Language Learning (TELL), LAS Links, IDEA, Stanford English Language Proficiency Test 2 (SELP 2), Texas English Language Proficiency Assess-ment System (TEL-PAS), Woodcock-Muñoz Language Survey-Revised, Woodcock-Muñoz Language Survey III
“’Satisfactory’ level on the district-selected English proficiency as-sessment, ‘proficient’ or ‘highly proficient’ level on the state English language arts assessment” (Mav-rogordato and White, 2017).
Each district is allowed to choose their own ELP assessment from a list of approved assessments (see left)
“Teachers’ recommenda-tions… should factor into reclassification decisions;” however, “there is little guid-ance at to the weight that these.... evaluations should carry in the reclassification process” (Mavrogordato and White, 2017)
Utah Utah Academic Language Profi-ciency Assessment
Before 2010/11: Overall score of Level 4 or above on ELP, and an English Language Arts content score of Level 2 or above, “which is one level below passing”
Since 2010/11: Level 5 on ELP as-sessment (Haas et al., 2016b)
None listed
Washington Washington Lan-guage Proficiency Test II, Washington Language Profi-ciency Assess-ment, The English Language Profi-ciency Assessment for the 21st Cen-tury
Level 4 out of 4 (“proficient”)
“Washington state uses the defini-tions of English language proficien-cy development performance that were developed by TESOL” (Mota-medi et al., 2016).
None listed

NCEO is an affiliated center of the Institute on Community Integration


![District Guide for the English Learners Program · English Learners (ELs) are those students whose primary language is a language other than English [See ESSA 8101(20) for full definition]](https://img.pdfslide.us/doc/110x75/5e5f464952cdb711d11210be/district-guide-for-the-english-learners-program-english-learners-els-are-those.jpg)