Embed Size (px)
Citation preview
Available online at www.sciencedirect.com
Wave Motion 45 (2008) 675–722
www.elsevier.com/locate/wavemoti
A review of the current understanding of seismicshear-wave splitting in the Earth’s crust and
common fallacies in interpretation
Stuart Crampin a,b,c,*, Sheila Peacock d
a School of GeoSciences, University of Edinburgh, West Mains Road, Edinburgh EH9 3JW, Scotland, UKb Edinburgh Anisotropy Project, British Geological Survey, Edinburgh EH9 3LA, Scotland, UK
c Institute of Earthquake Science, China Earthquake Administration, 100036 Beijing, Chinad AWE Blacknest, Brimpton, Reading RG7 4RS, UK
Received 17 January 2007; received in revised form 14 December 2007; accepted 24 January 2008Available online 1 February 2008
Abstract
Azimuthally-aligned shear-wave splitting is widely observed in the Earth’s crust. The splitting is diagnostic of someform of seismic anisotropy, although the cause of this anisotropy has been sometimes disputed. The evidence in thisreview unquestionably indicates cracks, specifically stress-aligned fluid-saturated microcracks, as the predominant causeof the azimuthally-aligned shear-wave splitting in the crust. Although, in principle, shear-wave splitting is simple in con-cept and easy to interpret in terms of systems of anisotropic symmetry, in practice there are subtle differences from iso-tropic propagation that make it easy to make errors in interpretation. Unless authors are aware of these differences,misinterpretations are likely which has led to incorrect conclusions and charges of controversy where only misinterpre-tations exist. As a consequence, stress-aligned fluid-saturated microcracks as the cause of azimuthally-aligned shear-wavesplitting in the crust is still not universally accepted despite there being distinguishing features that directly indicatecrack-induced anisotropy. This paper reviews observations and interpretations of crack-induced shear-wave splittingand demonstrates that claims for aligned crystals and other sources of shear-wave splitting are due to fallacies in inter-pretation. This review shows how previous contrary interpretations are resolved and discusses common fallacies and mis-interpretations. It is suggested that this new interpretation of shear-wave splitting has such fundamental implications foralmost all solid-earth geoscience that it amounts to a New Geophysics with applications to particularly exploration andearthquake geoscience but also to almost to all other branches of solid Earth geoscience.Crown copyright � 2008 Published by Elsevier B.V. All rights reserved.
Keywords: Fallacies in interpretation; New Geophysics; New understanding of fluid/rock deformation; Shear-wave splitting
0165-2125/$ - see front matter Crown copyright � 2008 Published by Elsevier B.V. All rights reserved.doi:10.1016/j.wavemoti.2008.01.003
* Corresponding author. Address: School of GeoSciences, University of Edinburgh, West Mains Road, Edinburgh EH9 3JW, Scotland,UK. Tel.: +44 131 650 5110; fax: +44 131 668 3184.
E-mail addresses: [email protected] (S. Crampin), [email protected] (S. Peacock).URL: http://www.geos.ed.ac.uk/homes/scrampin/opinion (S. Crampin).
676 S. Crampin, S. Peacock / Wave Motion 45 (2008) 675–722
1. Introduction
Shear-waves propagating in anisotropic rocks split into two approximately orthogonal polarisations thattravel at different velocities and write characteristic easily-identifiable signatures into three-component seismicwave trains [1]. Such shear-wave splitting (seismic birefringence) aligned azimuthally is widely observed inalmost all igneous, metamorphic, and sedimentary rocks in the Earth’s crust in almost all geological and tec-tonic regimes [2–6]. There are only a few well-understood exceptions where azimuthally-aligned shear-wavesplitting has not been observed in the crust [7]. Such azimuthally-aligned shear-wave splitting was first iden-tified in 1981, in both the crust [8] and the upper-mantle [9]; coincidently and independently, both reported inthe same volume of Nature. However, despite 25 years of observations, the causes and interpretation of shear-wave splitting in the Earth’s crust are still often misunderstood. This review attempts to resolve some of thesemisunderstandings.
Note that the phrase ‘azimuthally-aligned shear-wave splitting’ refers to splitting where the faster splitshear-waves are approximately parallel as illustrated schematically in Fig. 1. This distinguishes it from thesplitting, observed particularly in exploration seismology in finely-layered sedimentary strata, where the polar-isations are controlled by the direction of propagation and are strictly SV and SH.
Anisotropic symmetries are discussed in Section 2.1, below. The evidence suggests azimuthally-aligned shear-wave splitting observed in the Earth’s crust is invariably caused by stress-aligned parallel vertical microcracks.This mechanism has the enormous benefit that the crack geometry has comparatively simple anisotropic sym-metry that can be specified by three parameters: (1) orientation of the parallel vertical microcracks, imaged bythe strike of the nearly-parallel shear-wave polarisations; (2) crack density imaged, by one hundredth of the per-centage of shear-wave velocity anisotropy; and (3) changes in crack aspect-ratios, imaged (less easily) by changesin average time-delays between split shear-waves in a particular range of angles of incidence to the free-surface[7]. Changes in crack aspect-ratios are important as we have shown in a recent more formal review of theory andinterpretation in Wave Motion [10] that their behaviour in the Earth’s crust demonstrates that the microcracksare so closely-spaced they are critical-systems monitoring the low-level pre-fracturing deformation of in situ
rock. Consequently, shear-wave splitting is caused by stress-aligned near-vertical microcracks [2–6], and isthe key diagnostic of the New Geophysics: a new understanding of fluid-rock deformation which has profoundimplications for many properties of in situ rocks [7,10,11]. This review provides the consistent interpretation ofshear-wave splitting necessary for understanding and promoting the New Geophysics.
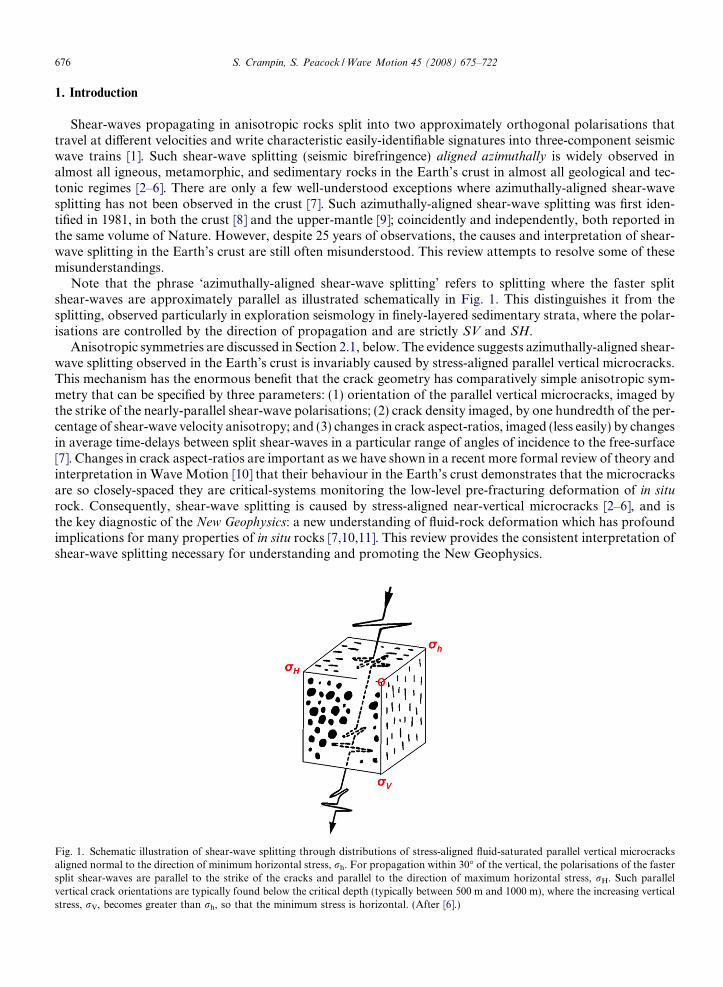
Fig. 1. Schematic illustration of shear-wave splitting through distributions of stress-aligned fluid-saturated parallel vertical microcracksaligned normal to the direction of minimum horizontal stress, rh. For propagation within 30� of the vertical, the polarisations of the fastersplit shear-waves are parallel to the strike of the cracks and parallel to the direction of maximum horizontal stress, rH. Such parallelvertical crack orientations are typically found below the critical depth (typically between 500 m and 1000 m), where the increasing verticalstress, rV, becomes greater than rh, so that the minimum stress is horizontal. (After [6].)
S. Crampin, S. Peacock / Wave Motion 45 (2008) 675–722 677
1.1. Background
In 1981, one of us published in Wave Motion [1] a review of theoretical and numerical aspects of wavepropagation in cracked and anisotropic media, particularly with reference to observations of anisotropy inthe Earth’s crust. The most diagnostic feature of azimuthally-aligned anisotropic wave propagation isshear-wave splitting (seismic birefringence), where shear-waves split into differently polarised phases whichare azimuthally-aligned, travel at different velocities, and write easily-recognised symbols into polarisation dia-grams (PDs), or hodograms, of three-dimensional particle motion. Shear-wave polarisations and time-delaysbetween split shear-waves, the two distinctive parameters in Fig. 1, can easily be identified and measured inPDs.
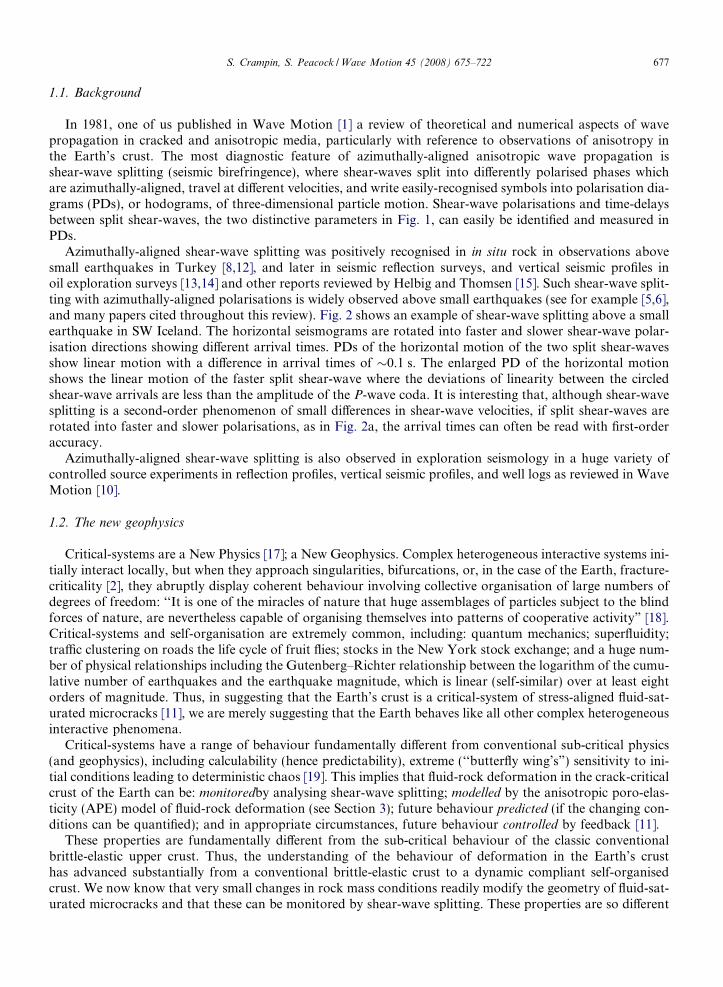
Azimuthally-aligned shear-wave splitting was positively recognised in in situ rock in observations abovesmall earthquakes in Turkey [8,12], and later in seismic reflection surveys, and vertical seismic profiles inoil exploration surveys [13,14] and other reports reviewed by Helbig and Thomsen [15]. Such shear-wave split-ting with azimuthally-aligned polarisations is widely observed above small earthquakes (see for example [5,6],and many papers cited throughout this review). Fig. 2 shows an example of shear-wave splitting above a smallearthquake in SW Iceland. The horizontal seismograms are rotated into faster and slower shear-wave polar-isation directions showing different arrival times. PDs of the horizontal motion of the two split shear-wavesshow linear motion with a difference in arrival times of �0.1 s. The enlarged PD of the horizontal motionshows the linear motion of the faster split shear-wave where the deviations of linearity between the circledshear-wave arrivals are less than the amplitude of the P-wave coda. It is interesting that, although shear-wavesplitting is a second-order phenomenon of small differences in shear-wave velocities, if split shear-waves arerotated into faster and slower polarisations, as in Fig. 2a, the arrival times can often be read with first-orderaccuracy.
Azimuthally-aligned shear-wave splitting is also observed in exploration seismology in a huge variety ofcontrolled source experiments in reflection profiles, vertical seismic profiles, and well logs as reviewed in WaveMotion [10].
1.2. The new geophysics
Critical-systems are a New Physics [17]; a New Geophysics. Complex heterogeneous interactive systems ini-tially interact locally, but when they approach singularities, bifurcations, or, in the case of the Earth, fracture-criticality [2], they abruptly display coherent behaviour involving collective organisation of large numbers ofdegrees of freedom: ‘‘It is one of the miracles of nature that huge assemblages of particles subject to the blindforces of nature, are nevertheless capable of organising themselves into patterns of cooperative activity” [18].Critical-systems and self-organisation are extremely common, including: quantum mechanics; superfluidity;traffic clustering on roads the life cycle of fruit flies; stocks in the New York stock exchange; and a huge num-ber of physical relationships including the Gutenberg–Richter relationship between the logarithm of the cumu-lative number of earthquakes and the earthquake magnitude, which is linear (self-similar) over at least eightorders of magnitude. Thus, in suggesting that the Earth’s crust is a critical-system of stress-aligned fluid-sat-urated microcracks [11], we are merely suggesting that the Earth behaves like all other complex heterogeneousinteractive phenomena.
Critical-systems have a range of behaviour fundamentally different from conventional sub-critical physics(and geophysics), including calculability (hence predictability), extreme (‘‘butterfly wing’s”) sensitivity to ini-tial conditions leading to deterministic chaos [19]. This implies that fluid-rock deformation in the crack-criticalcrust of the Earth can be: monitoredby analysing shear-wave splitting; modelled by the anisotropic poro-elas-ticity (APE) model of fluid-rock deformation (see Section 3); future behaviour predicted (if the changing con-ditions can be quantified); and in appropriate circumstances, future behaviour controlled by feedback [11].
These properties are fundamentally different from the sub-critical behaviour of the classic conventionalbrittle-elastic upper crust. Thus, the understanding of the behaviour of deformation in the Earth’s crusthas advanced substantially from a conventional brittle-elastic crust to a dynamic compliant self-organisedcrust. We now know that very small changes in rock mass conditions readily modify the geometry of fluid-sat-urated microcracks and that these can be monitored by shear-wave splitting. These properties are so different
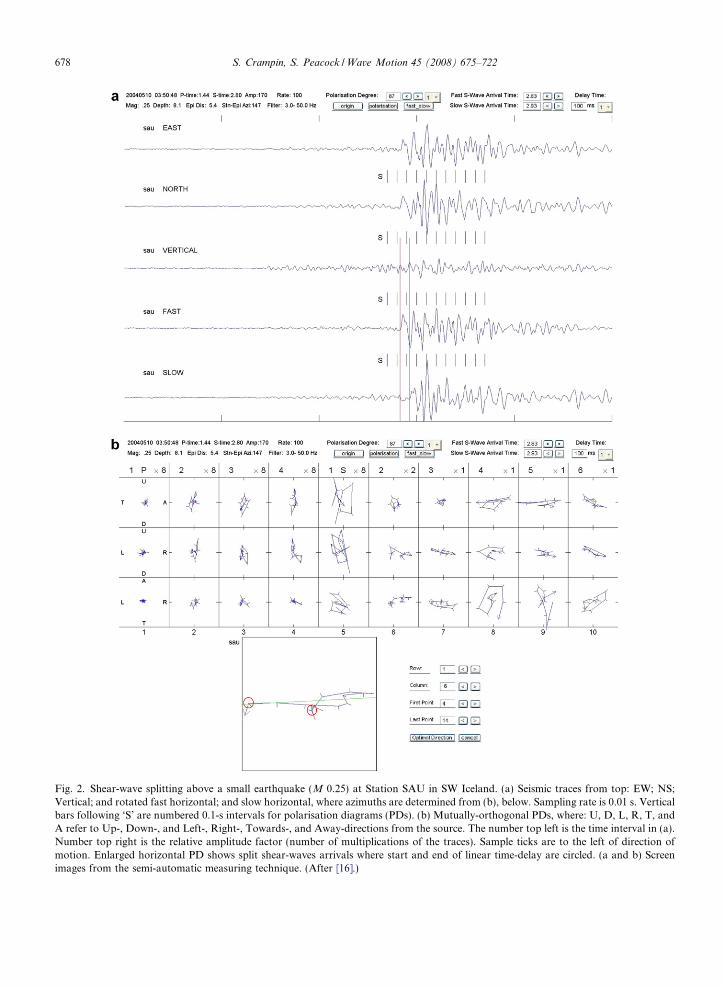
Fig. 2. Shear-wave splitting above a small earthquake (M 0.25) at Station SAU in SW Iceland. (a) Seismic traces from top: EW; NS;Vertical; and rotated fast horizontal; and slow horizontal, where azimuths are determined from (b), below. Sampling rate is 0.01 s. Verticalbars following ‘S’ are numbered 0.1-s intervals for polarisation diagrams (PDs). (b) Mutually-orthogonal PDs, where: U, D, L, R, T, andA refer to Up-, Down-, and Left-, Right-, Towards-, and Away-directions from the source. The number top left is the time interval in (a).Number top right is the relative amplitude factor (number of multiplications of the traces). Sample ticks are to the left of direction ofmotion. Enlarged horizontal PD shows split shear-waves arrivals where start and end of linear time-delay are circled. (a and b) Screenimages from the semi-automatic measuring technique. (After [16].)
678 S. Crampin, S. Peacock / Wave Motion 45 (2008) 675–722
S. Crampin, S. Peacock / Wave Motion 45 (2008) 675–722 679
from conventional sub-critical behaviour, that many geoscientists are (understandably) reluctant to accept theidea of a highly compliant crack-critical crust of fluid-saturated stress-aligned microcracks, (see for example, arecent book on rock mechanics [20]). A major difficulty for many geoscientists is that the diagnostic effects arealmost entirely confined to shear-wave splitting and shear-waves, and the behaviour of shear-wave splitting isonly now becoming understood.
1.3. Evidence summarised in this review
This review of azimuthally-aligned shear-wave splitting (seismic birefringence) shows three things:
(1) Azimuthally-aligned stress-aligned shear-wave splitting is almost invariably caused by propagationthrough distributions of stress-aligned fluid-saturated microcracks, which are highly compliant to smallchanges of stress.
(2) Stress-induced changes to microcrack geometry can be monitored by variations in shear-wave splittingso that, in particular, at the approach of fracture-criticality, the times and magnitudes of impending lar-ger earthquakes can be estimated by analysing shear-wave splitting.
(3) Characteristic temporal variations of shear-wave time-delays (typically, increases in normalised time-delays, monitoring stress-accumulation, where the logarithm of the duration of the increase is propor-tional to the magnitude of the impending earthquake) are now seen before earthquakes worldwide(Table 1a).
We refer to such linear log–log relationships as self-similar. When there is sufficient seismicity before theimpending earthquake to provide shear-wave source events within the shear-wave window (9 cases out of15 in Table 1b), the increasing time-delays show an abrupt precursory decrease (interpreted as stress relaxationdue to cracks coalescing onto the eventual fault break) immediately before the larger earthquake [6]. The dura-tions of these decreases of time-delays are also self-similar with respect to the magnitudes of the impendingearthquakes [6,30]. There has been one successful real-time stress-forecast of time, magnitude and fault breakof a M 5 earthquake in SW Iceland, when the increase in time-delays was recognised before the earthquakehad occurred [25]. There are no contrary observations where adequate data sets have not shown characteristicchanges before large earthquakes.
We show in the next section (summarised in Table 2) that azimuthally-aligned shear-wave splitting in thecrust is almost invariably caused by propagation through stress-aligned fluid-saturated microcracks as illus-trated schematically in Fig. 1. Fluid-saturated microcracks are the most compliant elements of the rock massand crack geometry will readily respond to changes in stress [1,7,41–43]. Consequently, variations in shear-wave splitting are the most sensitive diagnostic indicators of variations in in situ microcrack geometry, andsuch changes have been observed whenever there have been sufficient appropriate shear-wave ray paths beforelarger earthquakes [5,21–31]. Changes in shear-wave splitting have also been observed before volcanic erup-tions [5,32,33,47], and in hydrocarbon reservoirs following fluid-injection [34,35] and possible variations withocean tides [37].
However, claims that the rock mass is sensitive to small changes of stress is contrary to the concept of theconventional brittle-elastic upper crust and some papers suggest aligned crystal mineralisation as the source ofthe anisotropy. Some papers suggesting mineral alignments as the cause of shear-wave splitting [48], [49], and[50], have been answered by Crampin [51], [52], and [31], respectively. These various exchanges are summa-rised in Table 3. Papers [57] and [58] also questioned observations and interpretations of shear-wave splitting,and were answered by Crampin et al. [29]. (Note that [59] suggests that all wholly-automatic measurements ofshear-wave splitting are likely to be inadequate.) Paper [60] questioned the statistics of the stress-forecastearthquake [25] and was answered by Crampin et al. [61].
Unfortunately, detailed refutations, however well-founded, seldom receive as much attention as the originalcriticisms, and misunderstandings and misinterpretations still persist [20,50]. This review discusses a furtherrange of papers reporting shear-wave splitting, and outlines the current understanding. The review demon-strates that the only viable interpretation of azimuthally-aligned shear-wave splitting in the crust is propaga-tion through compliant stress-aligned fluid-saturated microcracks that allow temporal changes in stress to be

Table 1Reports of temporal variations in shear-wave splitting time-delays in Band-1a directions [7]
Earthquake (EQ) location and date Magnitude Approx.duration (days)
Approx.distance (km)
Ref.
a) Observations of inferred stress-accumulation before earthquakes
1 Swarm at BRE, N Iceland, 2002 Mb 1.7 P 0.055 7 [6]2 Swarm at BRE, N Iceland, 2002 M 2.5 P 0.21 7 [6]3 SW Iceland, 1997 M 3.4 47 10 [5]4 Dongfang, Hainan, China, 1992 ML 3.6 21 9 [21]5 Enola Swarm, Arkansas, USA, 1982 ML 3.8 4 3 [6,22]6 SW Iceland, 1997 M 3.8 40 14 [5]7 Parkfield, California, USA, 1989 ML 4 P 220 14 [23]8c SW Iceland, 1997 M 4.4 83, 77 10, 43 [5]9c SW Iceland, 1998 M 4.7 123, 106 10, 43 [5]10c Grımsey Lineament, Iceland, 2002 M 4.9 247, 263, 0 50, 92, 96 [20]11c SW Iceland (successful forecast), 1998 M 5d 127, 121 2, 36 [6,25]12 Shidan, Yunnan, China, 1992 Ms 5.9 400 35 [6,26]13 N Palm Springs, California, USA, 1988 Ms 6 1100 33 [6,27–29]14c SW Iceland, 2001 Ms6.6/M 5.6 75, 151 3, 46 [30]15 Chi–Chi Earthquake, Taiwan, 1999 Mw 7.7 600 55 [31]
(b) Observations of inferred crack coalescence before earthquakes
1 Swarm at BRE, N Iceland, 2002 M 1.7 0.0306 7 [6]2 Swarm at BRE, N Iceland, 2002 M 2.5 0.0465 7 [6]3 Enola Swarm, Arkansas, USA, 1982 ML 3.8 0.123 3 [6,22]4 Grımsey Lineament, Iceland, 2002 M 4.9 24 50 [24]5 SW Iceland (successful forecast), 1998 M 5 4.4 2 [6,25]6 Shidan, Yunnan, China, 1992 Ms 5.3 38 35 [6,26]7 N Palm Springs, California, USA, 1988 Ms 6 69 33 [6]8c SW Iceland, 2001 M 5.6/Ms6.6 38, 21 3, 46 [30]9 Chi–Chi Earthquake, Taiwan, 1999 Mw 7.7 131 55 [31]
c) Observations of inferred stress-accumulation before volcanic eruptions
1c Gjalp,Vatnajokull Ice Field, Iceland,(increasing time-delays), 1996
Large fissureeruption
120, 120, 120 230 S, 240 SW, 245WSW
[5]
2c Mount Etna, Sicily (increasing and decreasingtime-delays and 90�-flips), 2001
Minor eruption 66e 1, 5 [32]
3c Mount Ruapehu, New Zealand (90�-flips),1992–2002
Minor eruption – 2–15 [33]
Location Observations and interpretation
d) Observations of changes in time-delays elsewhere
1 Vacuum Field, New Mexico, USA Changes in split shear-waves in reflection surveys afterhigh-pressure and low-pressure CO2-injections in ahydrocarbon reservoir. High-pressure injections cause90�-flips in shear-wave polarisation. Shear-wave splittingexactly modelled by APE at correct injected pressures.
[34,35]
2 Observations at 4–9-km depth in the KTBwell, SE Germany
Fluid-injection at 9-km depth induced microseismicitywhich showed a � 2% decrease in time-delays to recordersat 4-km depth.
[36]
3 Borehole observations of induced eventsin N. Sea oil field
Analysis of borehole records of shear-wave splitting fromacoustic events during hydrocarbon production showevidence of changes with ocean tides.
[37]
4 SMSITES experiment: cross-boreholetransmission parallel to Husavık-Flatey(Mid-Atlantic Ridge) transform fault inN Iceland
Travel times of P-, SH-, SV-, SV-SH-waves at 500-mdepth between boreholes offset 315 m, NS and EW GPS,and water-well level changes all show great sensitivity tolow-level seismicity (106 events M 6 2.8 approximatelyequivalent to one M3.5, say) at 70 km distance.
[38]
680 S. Crampin, S. Peacock / Wave Motion 45 (2008) 675–722
Table 1 (continued)
Location Observations and interpretation
5 Surface observations of small events inducedby hydraulic pumping in a hot-dry-rockexperiment, Cornwall, UK
Initial pumping tests showed shear-wave polarisationsparallel to measured stress directions, whereaspolarisations after hydraulic fracturing began were7� different and parallel to joints and fractures ingranite outcrops.
[39]
6 Variation of time-delays with fluid-injectionnear Krafla Volcano, Iceland, and atCocos Geothermal Field, CA, USA.
Initially large values of time-delays (normalised topath length) are found to decrease during fluid-injectionboth at Krafla Volcano, Iceland, and Cocos GeothermalField, California. This behaviour is not yet understood,but attributed to effects of high pore-fluid pressures.
[40]
a Band-1 directions are ray paths in the double-leafed solid angle between 15� and 45� to the plane of the average crack.b Iceland Seismic Network Bulletins magnitude where M � mb.c Observed at a network of stations.d Older magnitude value compatible with other listed magnitudes, given as M 4.9 in current catalogue.e As interpreted by this paper.
S. Crampin, S. Peacock / Wave Motion 45 (2008) 675–722 681
monitored by changes in shear-wave splitting. This review also establishes that, whenever there are adequatesource data, characteristic patterns of behaviour of shear-wave time-delays are observed before larger earth-quakes. Again there are no contrary observations.
2. Azimuthally-aligned shear-wave splitting
The polarisations of split shear-waves in a homogeneous anisotropic medium vary in three dimensions butare fixed for propagation along any particular ray path direction. The time-delays depend on the length andthe degree of velocity anisotropy along the ray path. For shear-waves observed within the shear-wave win-dow at the free-surface there are three distinct discriminatory patterns of anisotropic shear-wave polarisa-tions. The first is in hexagonal symmetry (transverse isotropy) with a vertical axis of cylindrical symmetrywhere split shear-wave are always strictly SV- and SH-wave polarisations, and hence are always parallelor perpendicular to the direction of propagation. The second pattern (the subject of this review) is in hex-agonal symmetry with a horizontal axis of symmetry where split shear-wave polarisations are parallel in abroad band of directions across the centre of the shear-wave window. We refer to this as azimuthally-alignedshear-wave splitting. The seldom observed third pattern is where polarisations vary with azimuth and inci-dence angle of the ray path to the surface. These variations are found in all other symmetry systems and inall other orientations of hexagonal symmetry. In this pattern, polarisations usually vary rapidly with anglesof incidence and azimuth, and cannot be mistaken for the first two patterns, unless the anisotropic symmetrysystems are very similar.
2.1. Origins of azimuthally-aligned shear-wave splitting
Note the caveat azimuthally-aligned. Horizontally-stratified structures display shear-wave splitting intopurely SV- and SH-polarisations with no azimuthal variations. Such media include propagation in finely-lay-ered sedimentary sequences in hydrocarbon exploration surveys [62–64]; shales, clays, mudstones, where pore-space is typically constrained between horizontal platelets frequently of mica aligned during deposition [65,66];and horizontal layering in crust and the upper-mantle [67]. When the wavelength of the shear-wave is greaterthan the dimensions of the inclusions or the separation of the layers, the anisotropic symmetry of these con-figurations leads to transverse isotropy (hexagonal anisotropic symmetry) with a vertical axis of symmetry,sometimes referred to as TIV- or VTI-anisotropy. In such TIV media, shear-waves split into strictly SH-and SV-polarisations, where the SV-polarisation radiates with the ray path from the source with no velocityvariation in the horizontal plane and with no anisotropy-induced azimuthal variations. Since hydrocarbon res-ervoirs are often in finely-layered sedimentary basins, TIV-anisotropy is frequently observed in seismicexploration.
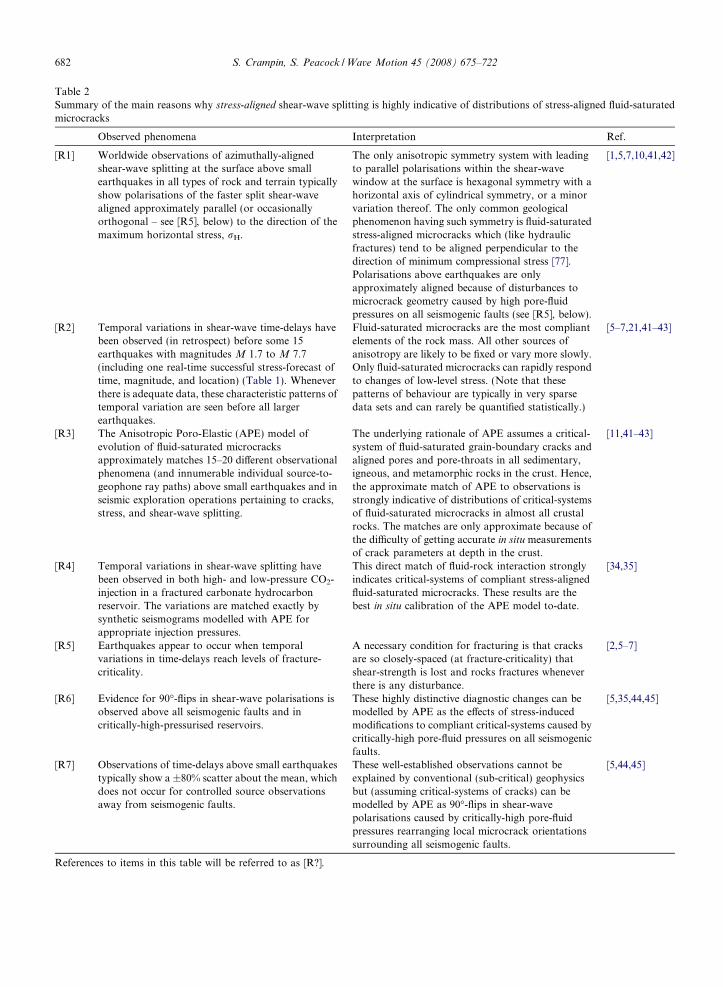
Table 2Summary of the main reasons why stress-aligned shear-wave splitting is highly indicative of distributions of stress-aligned fluid-saturatedmicrocracks
Observed phenomena Interpretation Ref.
[R1] Worldwide observations of azimuthally-alignedshear-wave splitting at the surface above smallearthquakes in all types of rock and terrain typicallyshow polarisations of the faster split shear-wavealigned approximately parallel (or occasionallyorthogonal – see [R5], below) to the direction of themaximum horizontal stress, rH.
The only anisotropic symmetry system with leadingto parallel polarisations within the shear-wavewindow at the surface is hexagonal symmetry with ahorizontal axis of cylindrical symmetry, or a minorvariation thereof. The only common geologicalphenomenon having such symmetry is fluid-saturatedstress-aligned microcracks which (like hydraulicfractures) tend to be aligned perpendicular to thedirection of minimum compressional stress [77].Polarisations above earthquakes are onlyapproximately aligned because of disturbances tomicrocrack geometry caused by high pore-fluidpressures on all seismogenic faults (see [R5], below).
[1,5,7,10,41,42]
[R2] Temporal variations in shear-wave time-delays havebeen observed (in retrospect) before some 15earthquakes with magnitudes M 1.7 to M 7.7(including one real-time successful stress-forecast oftime, magnitude, and location) (Table 1). Wheneverthere is adequate data, these characteristic patterns oftemporal variation are seen before all largerearthquakes.
Fluid-saturated microcracks are the most compliantelements of the rock mass. All other sources ofanisotropy are likely to be fixed or vary more slowly.Only fluid-saturated microcracks can rapidly respondto changes of low-level stress. (Note that thesepatterns of behaviour are typically in very sparsedata sets and can rarely be quantified statistically.)
[5–7,21,41–43]
[R3] The Anisotropic Poro-Elastic (APE) model ofevolution of fluid-saturated microcracksapproximately matches 15–20 different observationalphenomena (and innumerable individual source-to-geophone ray paths) above small earthquakes and inseismic exploration operations pertaining to cracks,stress, and shear-wave splitting.
The underlying rationale of APE assumes a critical-system of fluid-saturated grain-boundary cracks andaligned pores and pore-throats in all sedimentary,igneous, and metamorphic rocks in the crust. Hence,the approximate match of APE to observations isstrongly indicative of distributions of critical-systemsof fluid-saturated microcracks in almost all crustalrocks. The matches are only approximate because ofthe difficulty of getting accurate in situ measurementsof crack parameters at depth in the crust.
[11,41–43]
[R4] Temporal variations in shear-wave splitting havebeen observed in both high- and low-pressure CO2-injection in a fractured carbonate hydrocarbonreservoir. The variations are matched exactly bysynthetic seismograms modelled with APE forappropriate injection pressures.
This direct match of fluid-rock interaction stronglyindicates critical-systems of compliant stress-alignedfluid-saturated microcracks. These results are thebest in situ calibration of the APE model to-date.
[34,35]
[R5] Earthquakes appear to occur when temporalvariations in time-delays reach levels of fracture-criticality.
A necessary condition for fracturing is that cracksare so closely-spaced (at fracture-criticality) thatshear-strength is lost and rocks fractures wheneverthere is any disturbance.
[2,5–7]
[R6] Evidence for 90�-flips in shear-wave polarisations isobserved above all seismogenic faults and incritically-high-pressurised reservoirs.
These highly distinctive diagnostic changes can bemodelled by APE as the effects of stress-inducedmodifications to compliant critical-systems caused bycritically-high pore-fluid pressures on all seismogenicfaults.
[5,35,44,45]
[R7] Observations of time-delays above small earthquakestypically show a ±80% scatter about the mean, whichdoes not occur for controlled source observationsaway from seismogenic faults.
These well-established observations cannot beexplained by conventional (sub-critical) geophysicsbut (assuming critical-systems of cracks) can bemodelled by APE as 90�-flips in shear-wavepolarisations caused by critically-high pore-fluidpressures rearranging local microcrack orientationssurrounding all seismogenic faults.
[5,44,45]
References to items in this table will be referred to as [R?].
682 S. Crampin, S. Peacock / Wave Motion 45 (2008) 675–722

Table 3Summary of earlier contrary interpretations denying compliant fluid-saturated microcracks; previous comments, and originator’sresponses
Contrary interpretations Summary of previous comments Summary of originator’s response
1) Brocher and Christensen [48] interpreted20% P-wave velocity anisotropy in anazimuthally-varying reflection–refractionsurvey in the highly irregular topography ofthe Chugach Terrane in Southern Alaska ascaused by heavily-foliated schists.
Crampin [51] suggested that P-wave arrivaltimes are sensitive to so many differentphenomena that wandering multidirectionalsurveys in extreme topography are difficultto interpret reliably. Several possiblemisinterpretations in [48] are suggested byCrampin [51]. In particular, foliated schistscausing P-wave velocity anisotropy requirenearly uniform alignments over a largecomplicated area. This is highly unlikely andunproven. Aligned cracks are the defaultinterpretation.
Brocher and Christensen [51] repeated theiroriginal arguments for heavily-foliatedschists. This review’s comments: Table 2 [R1,
R2] suggests that crack anisotropy must be the
default interpretation for azimuthally-aligned
anisotropy in the crust unless there is direct
evidence otherwise. Neither the original Paper
[48] nor their response to our comments
(included in) [51] presented other evidence.
2) do Nascimento et al. [49] observed shear-wave polarisations, above very shallowearthquakes in Brazil, which were orthogonalto the direction of maximum tectonic stressand hence, they suggest, cannot be caused bystress-aligned fluid-saturated microcracks,which are parallel to stress.
Crampin [52] notes that all the earthquakes of[49] are exceptionally shallow (2–5-km deep).Most studies of shear-wave splitting usesource earthquakes below 5-km depth. Thusthe orthogonal polarisations in [49] are likelyto be 90�-flips, caused by the critically-high-pressures found on all seismogenic faults,where the normally pressurised paths abovethe faults are too short to remove flippedpolarisations around the fault [44,45].
The response of do Nascimento et al. [53]does not counter arguments of [52], but
In contrast, whenever there are appropriate source-to-receiver geometries, near-parallel azimuthally-aligned shear-wave splitting, the second pattern, is always observed throughout the Earth’s crust with the fas-ter split shear-waves polarised typically in the direction of maximum horizontal stress. There are two inescap-able implications. Firstly, the only anisotropic symmetry system that produces such parallel polarisations(within the shear-wave window at the surface) is transverse isotropy of (hexagonal anisotropic symmetry) with
a horizontal axis of symmetry, or a minor variation thereof [1,7,68]. This is often referred to as TIH- or HTI-anisotropy. Secondly, the only geological configuration common to sedimentary, igneous, and metamorphicrocks that has TIH-anisotropy, is stress-aligned fluid-saturated microcracks [15,69], at one time referred toas extensive-dilatancy anisotropy or EDA-cracks [70]. These two implications are paramount. Azimuthally-aligned shear-wave splitting, where the leading polarisation is parallel (or occasionally orthogonal) to thestress-field, is almost invariably caused by parallel vertical stress-aligned microcracks. No other mechanismsare possible except in exceptional conditions. Consequently, the default interpretation of azimuthally-alignedshear-wave splitting with parallel polarisations is necessarily in terms of systems of stress-aligned fluid-satu-rated microcracks.
Such fluid-saturated microcracks are the most compliant elements of in situ rocks. In principle, microcracksin strongly aligned minerals might modify microcrack orientations, but this has not been demonstrated inpractice. With minor exceptions, we know of no adequate demonstrations of other sources of shear-wave split-ting for wholly crustal ray paths, except for well-understood observations of the first polarisation pattern ofTIV-anisotropy in exploration seismology. Henceforth, all references to shear-wave splitting in this paper willrefer to azimuthally-aligned crack-aligned shear-wave splitting with TIH-anisotropy.
Anisotropy caused by fluid-saturated microcracks is confirmed by observations of temporal variations in
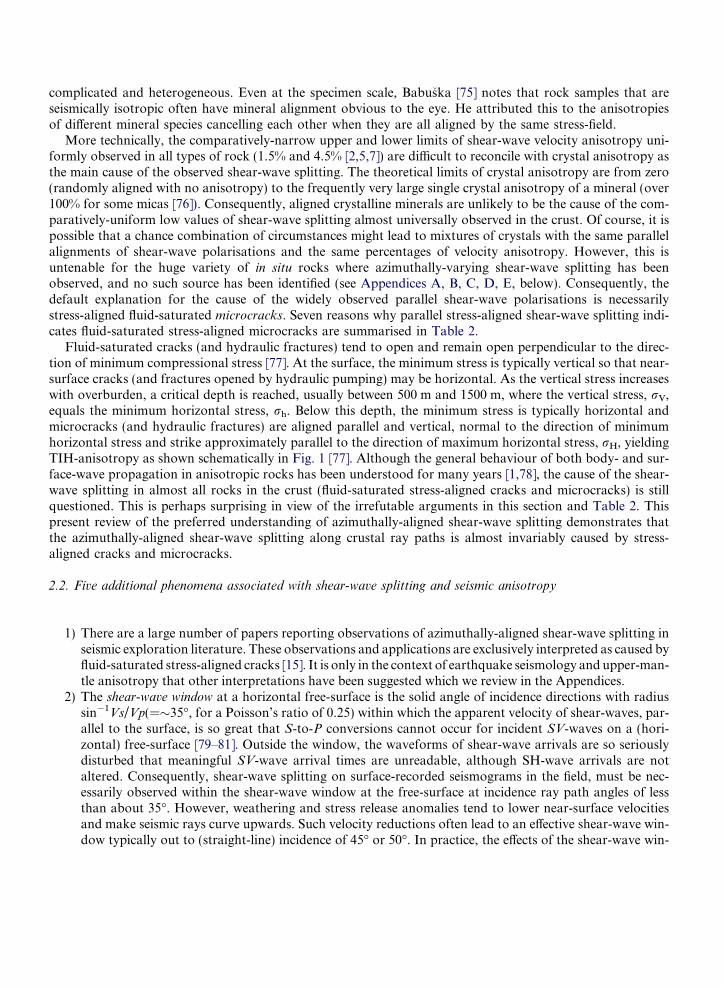
complicated and heterogeneous. Even at the specimen scale, Babuska [75] notes that rock samples that areseismically isotropic often have mineral alignment obvious to the eye. He attributed this to the anisotropiesof different mineral species cancelling each other when they are all aligned by the same stress-field.
More technically, the comparatively-narrow upper and lower limits of shear-wave velocity anisotropy uni-formly observed in all types of rock (1.5% and 4.5% [2,5,7]) are difficult to reconcile with crystal anisotropy asthe main cause of the observed shear-wave splitting. The theoretical limits of crystal anisotropy are from zero(randomly aligned with no anisotropy) to the frequently very large single crystal anisotropy of a mineral (over100% for some micas [76]). Consequently, aligned crystalline minerals are unlikely to be the cause of the com-paratively-uniform low values of shear-wave splitting almost universally observed in the crust. Of course, it ispossible that a chance combination of circumstances might lead to mixtures of crystals with the same parallelalignments of shear-wave polarisations and the same percentages of velocity anisotropy. However, this isuntenable for the huge variety of in situ rocks where azimuthally-varying shear-wave splitting has beenobserved, and no such source has been identified (see Appendices A, B, C, D, E, below). Consequently, thedefault explanation for the cause of the widely observed parallel shear-wave polarisations is necessarilystress-aligned fluid-saturated microcracks. Seven reasons why parallel stress-aligned shear-wave splitting indi-cates fluid-saturated stress-aligned microcracks are summarised in Table 2.
Fluid-saturated cracks (and hydraulic fractures) tend to open and remain open perpendicular to the direc-tion of minimum compressional stress [77]. At the surface, the minimum stress is typically vertical so that near-surface cracks (and fractures opened by hydraulic pumping) may be horizontal. As the vertical stress increaseswith overburden, a critical depth is reached, usually between 500 m and 1500 m, where the vertical stress, rV,equals the minimum horizontal stress, rh. Below this depth, the minimum stress is typically horizontal andmicrocracks (and hydraulic fractures) are aligned parallel and vertical, normal to the direction of minimumhorizontal stress and strike approximately parallel to the direction of maximum horizontal stress, rH, yieldingTIH-anisotropy as shown schematically in Fig. 1 [77]. Although the general behaviour of both body- and sur-face-wave propagation in anisotropic rocks has been understood for many years [1,78], the cause of the shear-wave splitting in almost all rocks in the crust (fluid-saturated stress-aligned cracks and microcracks) is stillquestioned. This is perhaps surprising in view of the irrefutable arguments in this section and Table 2. Thispresent review of the preferred understanding of azimuthally-aligned shear-wave splitting demonstrates thatthe azimuthally-aligned shear-wave splitting along crustal ray paths is almost invariably caused by stress-aligned cracks and microcracks.
2.2. Five additional phenomena associated with shear-wave splitting and seismic anisotropy
1) There are a large number of papers reporting observations of azimuthally-aligned shear-wave splitting inseismic exploration literature. These observations and applications are exclusively interpreted as caused byfluid-saturated stress-aligned cracks [15]. It is only in the context of earthquake seismology and upper-man-tle anisotropy that other interpretations have been suggested which we review in the Appendices.
2) The shear-wave window at a horizontal free-surface is the solid angle of incidence directions with radiussin�1Vs/Vp(=�35�, for a Poisson’s ratio of 0.25) within which the apparent velocity of shear-waves, par-allel to the surface, is so great that S-to-P conversions cannot occur for incident SV-waves on a (hori-zontal) free-surface [79–81]. Outside the window, the waveforms of shear-wave arrivals are so seriouslydisturbed that meaningful SV-wave arrival times are unreadable, although SH-wave arrivals are notaltered. Consequently, shear-wave splitting on surface-recorded seismograms in the field, must be nec-essarily observed within the shear-wave window at the free-surface at incidence ray path angles of lessthan about 35�
686 S. Crampin, S. Peacock / Wave Motion 45 (2008) 675–722
3) P-waves, unlike shear-waves, do not have distinctive diagnostic behaviour indicating propagationthrough anisotropic solids. Anisotropy does cause P-wave velocity anisotropy, but P-wave travel timesare sensitive to so many phenomena that purely anisotropy-induced effects are difficult to isolate. P-waves are usually only marginally affected by thin fluid-saturated microcracks [83] and small changesin microcrack geometry are generally invisible to P-wave propagation through thin cracks. Conse-quently, variations in shear-wave splitting are key observables for recognising and quantifying stress-aligned anisotropy in the crust.
4) The human eye has little ability to interpret polarisation information in multi-component ‘‘wiggly-line”
seismograms. However, shear-wave splitting writes characteristic signatures into polarisation diagrams(PDs, or hodograms) of abrupt nearly-orthogonal changes in particle motion direction, and the humaneye does have the ability to recognise patterns in two-dimensional PDs (as in Fig. 2) in many differencecircumstances. Experience of interpreting both field and synthetic seismograms suggests that visualinspection of PDs is an optimal way to identify and measure shear-wave splitting arrivals.
5) However, plotting and measuring PDs is time-consuming and tedious. Consequently, many authors havedevised various automatic or semi-automatic techniques for measuring the parameters of shear-wavesplitting. In a review of such techniques, [59] suggests that wholly-automatic techniques are never likelyto be wholly successful except on high signal-to-noise ratio near-classic examples of shear-wave splitting,which in most circumstances are infrequent. This means that data has to pass rigorous selection criteriathat sometimes exclude 50% to 70% of the original arrivals before fully automatic techniques can be usedto reliably measure shear-wave splitting [84]. Such severe selection can seriously bias any interpretationand such wholly automatic techniques are best avoided.
Consequently, Gao et al. [12] have developed a Shear-Wave Analysis System (SWAS) for semi-automatic
measurement of shear-wave splitting. Using an Expert Analysis System for initial picks of shear-wave arrivals,the picks are optimised by switching between screen images of: PDs; original NS and EW horizontal seismo-grams; and seismograms rotated into preferred orientations, in a user-friendly environment, thus combiningthe advantages of previous techniques (Fig. 2 shows screen images of this process). SWAS reduces the timetaken for visual measurements by a factor between 10 and 50, and obtains satisfactory measurements for�85% of arrivals [16]. Developed for interpreting seismograms from the SIL seismic network in Iceland[85,86] via Internet data, it is intended that SWAS will be generally available for measuring and analysingshear-wave splitting.
3. A brief review of the properties of fluid-saturated microcracks in the earth’s crust
The crack density of a uniform distribution of parallel microcracks is e = N a3/V, where N is the number ofcracks of radius a in volume V [2,46,88–90]. This crack density is approximately equal to one hundredth of thepercentage of shear-wave velocity anisotropy in aligned cracks in a medium with a Poisson’s ratio of 0.25[2,87]. Thus, the observed percentage of shear-wave velocity anisotropy in intact unfractured rock, the narrowrange 1.5–4.5%, can be equated to the narrow range of crack density e = 0.015–0.045 [2,7,88].
Fig. 3 is a schematic (dimensionless) illustration of observed distributions of fluid-saturated microcracks inostensibly intact rock [2] that have the observed shear-wave velocity anisotropy of 1.5–4.5%. Fig. 3 suggeststhat between crack densities of e = 0.045 and 0.1 there is a level of fracture-criticality when cracks are so clo-sely-spaced that shear-strength is lost and rocks fracture if there is any disturbance. Fracture-criticality is nowapproximately identified with fluid-percolation threshold when cracks are so closely-spaced there are through-going fractures [2,10,42,43]. At fracture-criticality, fracturing and earthquakes necessarily occur whenever therock mass is disturbed in any way.
3.1. Modelling fluid-rock evolution with anisotropic poro-elasticity (APE)
The evolution of such highly compliant fluid-saturated microcracks in response to changing conditions canbe modelled by anisotropic poro-elasticity (APE) [41,42], where the mechanism for deformation is fluidmovement by flow or dispersion along pressure gradients between neighbouring microcracks at different

Fig. 3. Cross-sections of uniform dimensionless distributions of parallel stress-aligned fluid-saturated microcracks representing observedshear-wave velocity anisotropies in percent (�1.5% to �4.5%), crack density e, and crack radius a, where e is equal to one hundredth ofpercent shear-wave velocity anisotropy. Fracture-criticality is at e = �0.055 (�5.5% shear-wave velocity anisotropy) [38]. (After [2].)
S. Crampin, S. Peacock / Wave Motion 45 (2008) 675–722 687
orientations to the stress-field. Fig. 4 gives a schematic (dimensionless) illustration of APE-modelling increas-ing stress in distributions of vertical randomly aligned fluid-saturated microcracks. Hexagons are elasticallyisotropic so that the two solid hexagons in Fig. 4 are a small selection of randomly oriented cracks.
APE-modelling helps to explain the lower and upper bounds of shear-wave velocity anisotropy: as increas-ing stress begins to align fluid-saturated intergranular cracks for initially very low-levels of stress, althoughsome fluid moves round each grain there is initially no crack closure and no effective anisotropy. However,when a critical stress, normalised to one in Fig. 4, bottom left, is reached and cracks first begin to close,the anisotropy immediately jumps from isotropy (no splitting) to approximately the 1.5% minimum shear-wave velocity anisotropy actually observed. The lower left image in Fig. 4 is similar to the left-hand image
Fig. 4. Schematic illustration of APE-modelling the evolution of crack aspect-ratios in an initially random distribution of vertical cracks(solid lines) for four values of increasing maximum horizontal differential stress, rH, normalised to the critical value at which cracks firstbegin to close. Minimum horizontal stress, rh, is zero. Pore-fluid mass is preserved and aspect-ratios are chosen to give a porosity of /� 5%. Paper [39] gives a detailed interpretation. (After [39].)
688 S. Crampin, S. Peacock / Wave Motion 45 (2008) 675–722
in Fig. 3, showing that the two approaches are compatible. The upper bound in intact unfractured rock,�4.5%, is close to the fluid-percolation threshold, which for parallel cracks is approximately 5.5%,e = 0.055 [42].
Note that conventional dilatancy, stress-induced opening of new cracks, is a high stress phenomenon.Whereas APE-modelling is an extremely low-stress phenomenon: the critical stress in Fig. 4 must be low asstress-aligned shear-wave splitting is observed in almost all in situ rocks, regardless of the level of tectonicstress.
APE-modelling in Fig. 4 is highly constrained yet approximately matches a large (20+) range of differentphenomena [7,10,11,42–45]. The reason for this universality is that microcracks in the Earth’s crust are so clo-sely-spaced they verge on fracture-criticality and fracturing, as indicated in Fig. 3. Verging on critical points(singularities or bifurcations) is one of the defining characteristics of critical-systems. Critical-systems are aNew Physics, a New Geophysics, where the statistics are nearer to those of other critical-systems than theyare to the specific sub-critical physics and much of the behaviour is calculable [7,10,11,18,19,41,42,91,92].The universality of critical-systems is the underlying reason that APE-modelling, with minimal parameters,matches such a wide range of phenomena. This behaviour has been reviewed by Crampin and Peacock [10].
The clearest quantifiable demonstration of stress-induced changes in shear-wave splitting in explorationseismology is during hydraulic pumping in a hydrocarbon reservoir [34], where the response was accuratelymodelled by APE [35].
3.2. Variation of time-delays with direction: band-1 and band-2
The most sensitive response of fluid-saturated stress-aligned microcrack geometry to low-level increases ofstress during stress-accumulation before earthquakes is increasing crack aspect-ratios [7,42,43]. Such changesin aspect-ratio can be monitored by changes in the average time-delay in Band-1 directions within the shear-wave window [7]. Band-1 is the double-leafed solid angle of ray path directions making angles 15� to 45� to theaverage crack plane. For thin cracks, Band-1 has a range of positive time-delays, but also includes a smallsolid angle of negative time-delays, so that averages need to be taken to estimate increases or decreases whenthe actual ray paths cannot be exactly identified. Band-2 is the solid angle of ray path directions ±15� to eitherside of the average crack plane which is sensitive to crack density but is insensitive to changes in aspect-ratio.Fig. 5 shows the ray path geometry for Band-1 and Band-2 directions. Only changes in crack density will sig-nificantly change time-delays in Band-2 [7], and crack density is insensitive to low-level deformation [42,43].
Fig. 6 shows temporal increases and precursory decreases in normalised time-delays before six earthquakesranging in magnitude from a M 1.7 swarm event in Northern Iceland [6], to the Ms 6 1986 North Palm SpringsEarthquake in California [27–29]. The consistency of the left-hand and right-hand images is strong confirma-tion that shear-wave splitting is modelling earthquake source related phenomena.
3.3. Negative time-delays
The shear-wave time-delay is the difference in arrival time between the two split shear-waves. Positive time-delays are usually taken as those when the polarisation of the faster split shear-waves are parallel to the planesof the parallel cracks. When the faster and slower arrivals exchange polarisations, as in 90�-flips [35,37,44], thesign of the time-delays reverses. There are several common situations when this occurs.
(1) When the velocity variations of the two waves intersect at the point-singularities common to all systemsof anisotropic symmetry (except hexagonal symmetry, which has line-singularities) [93]. This behaviourshowing exchanges of polarisations has been theoretically modelled [94,95] and has been observed andmodelled in multi-offset VSPs in the Paris Basin [96].
(2) When the directions of shear-wave ray paths cross line-singularities in systems of hexagonal symmetry,such as that of parallel microcracks [94]; see observations in Sections B2.5, D2.2 and D2.3.
(3) When microcrack orientations are re-arranged in the presence of critically-high pore-fluid pressures inhydrocarbon reservoirs causing 90�-flips in shear-wave polarisations [35,95] and on seismically-activefault lines [38,44,45].
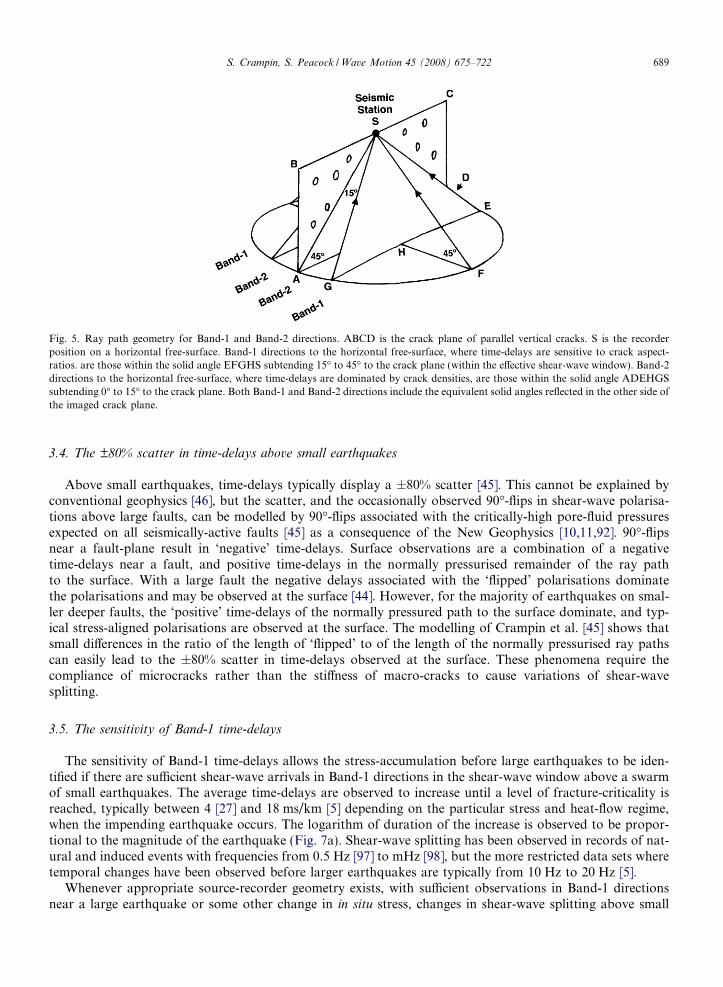
Fig. 5. Ray path geometry for Band-1 and Band-2 directions. ABCD is the crack plane of parallel vertical cracks. S is the recorderposition on a horizontal free-surface. Band-1 directions to the horizontal free-surface, where time-delays are sensitive to crack aspect-ratios. are those within the solid angle EFGHS subtending 15� to 45� to the crack plane (within the effective shear-wave window). Band-2directions to the horizontal free-surface, where time-delays are dominated by crack densities, are those within the solid angle ADEHGSsubtending 0� to 15� to the crack plane. Both Band-1 and Band-2 directions include the equivalent solid angles reflected in the other side ofthe imaged crack plane.
S. Crampin, S. Peacock / Wave Motion 45 (2008) 675–722 689
3.4. The ±80% scatter in time-delays above small earthquakes
Above small earthquakes, time-delays typically display a ±80% scatter [45]. This cannot be explained byconventional geophysics [46], but the scatter, and the occasionally observed 90�-flips in shear-wave polarisa-tions above large faults, can be modelled by 90�-flips associated with the critically-high pore-fluid pressuresexpected on all seismically-active faults [45] as a consequence of the New Geophysics [10,11,92]. 90�-flipsnear a fault-plane result in ‘negative’ time-delays. Surface observations are a combination of a negativetime-delays near a fault, and positive time-delays in the normally pressurised remainder of the ray pathto the surface. With a large fault the negative delays associated with the ‘flipped’ polarisations dominatethe polarisations and may be observed at the surface [44]. However, for the majority of earthquakes on smal-ler deeper faults, the ‘positive’ time-delays of the normally pressured path to the surface dominate, and typ-ical stress-aligned polarisations are observed at the surface. The modelling of Crampin et al. [45] shows thatsmall differences in the ratio of the length of ‘flipped’ to of the length of the normally pressurised ray pathscan easily lead to the ±80% scatter in time-delays observed at the surface. These phenomena require thecompliance of microcracks rather than the stiffness of macro-cracks to cause variations of shear-wavesplitting.
3.5. The sensitivity of Band-1 time-delays
The sensitivity of Band-1 time-delays allows the stress-accumulation before large earthquakes to be iden-tified if there are sufficient shear-wave arrivals in Band-1 directions in the shear-wave window above a swarmof small earthquakes. The average time-delays are observed to increase until a level of fracture-criticality isreached, typically between 4 [27] and 18 ms/km [5] depending on the particular stress and heat-flow regime,when the impending earthquake occurs. The logarithm of duration of the increase is observed to be propor-tional to the magnitude of the earthquake (Fig. 7a). Shear-wave splitting has been observed in records of nat-ural and induced events with frequencies from 0.5 Hz [97] to mHz [98], but the more restricted data sets wheretemporal changes have been observed before larger earthquakes are typically from 10 Hz to 20 Hz [5].
Whenever appropriate source-recorder geometry exists, with sufficient observations in Band-1 directionsnear a large earthquake or some other change in in situ stress, changes in shear-wave splitting above small
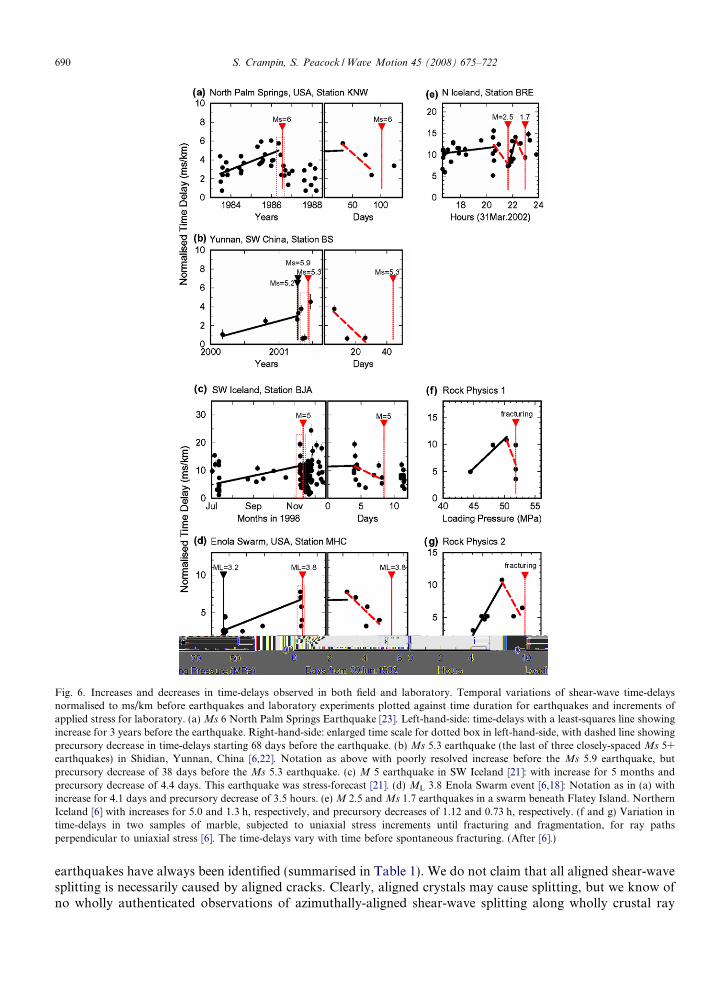
Fig. 6. Increases and decreases in time-delays observed in both field and laboratory. Temporal variations of shear-wave time-delaysnormalised to ms/km before earthquakes and laboratory experiments plotted against time duration for earthquakes and increments ofapplied stress for laboratory. (a) Ms 6 North Palm Springs Earthquake [23]. Left-hand-side: time-delays with a least-squares line showingincrease for 3 years before the earthquake. Right-hand-side: enlarged time scale for dotted box in left-hand-side, with dashed line showingprecursory decrease in time-delays starting 68 days before the earthquake. (b) Ms 5.3 earthquake (the last of three closely-spaced Ms 5+earthquakes) in Shidian, Yunnan, China [6,22]. Notation as above with poorly resolved increase before the Ms 5.9 earthquake, butprecursory decrease of 38 days before the Ms 5.3 earthquake. (c) M 5 earthquake in SW Iceland [21]: with increase for 5 months andprecursory decrease of 4.4 days. This earthquake was stress-forecast [21]. (d) ML 3.8 Enola Swarm event [6,18]: Notation as in (a) withincrease for 4.1 days and precursory decrease of 3.5 hours. (e) M 2.5 and Ms 1.7 earthquakes in a swarm beneath Flatey Island. NorthernIceland [6] with increases for 5.0 and 1.3 h, respectively, and precursory decreases of 1.12 and 0.73 h, respectively. (f and g) Variation intime-delays in two samples of marble, subjected to uniaxial stress increments until fracturing and fragmentation, for ray pathsperpendicular to uniaxial stress [6]. The time-delays vary with time before spontaneous fracturing. (After [6].)
690 S. Crampin, S. Peacock / Wave Motion 45 (2008) 675–722
earthquakes have always been identified (summarised in Table 1). We do not claim that all aligned shear-wavesplitting is necessarily caused by aligned cracks. Clearly, aligned crystals may cause splitting, but we know ofno wholly authenticated observations of azimuthally-aligned shear-wave splitting along wholly crustal ray
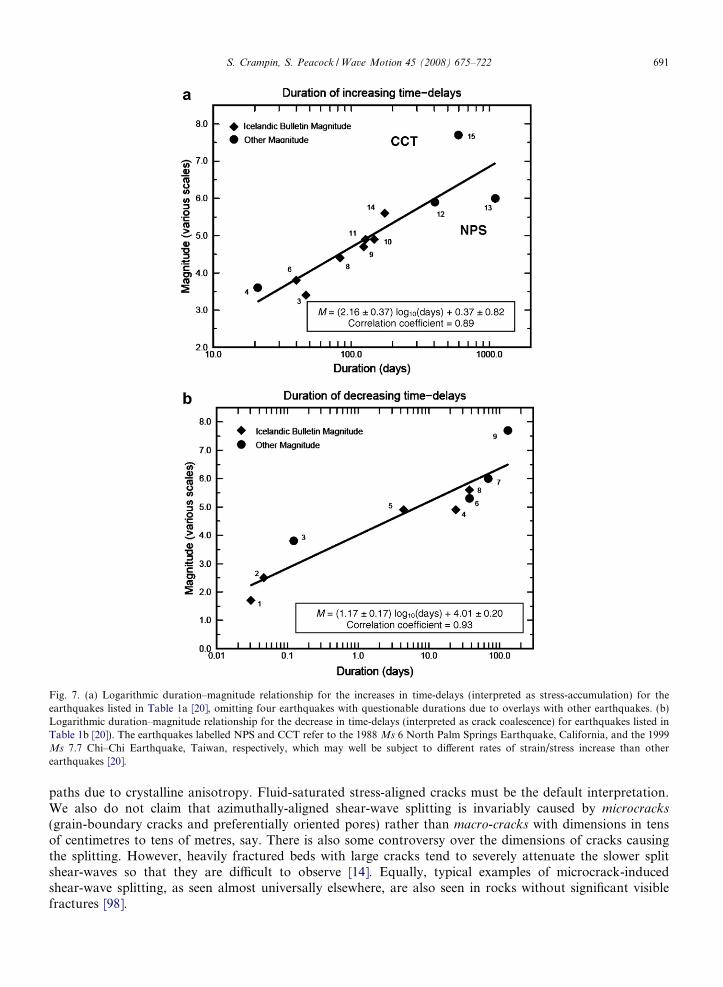
Fig. 7. (a) Logarithmic duration–magnitude relationship for the increases in time-delays (interpreted as stress-accumulation) for theearthquakes listed in Table 1a [20], omitting four earthquakes with questionable durations due to overlays with other earthquakes. (b)Logarithmic duration–magnitude relationship for the decrease in time-delays (interpreted as crack coalescence) for earthquakes listed inTable 1b [20]). The earthquakes labelled NPS and CCT refer to the 1988 Ms 6 North Palm Springs Earthquake, California, and the 1999Ms 7.7 Chi–Chi Earthquake, Taiwan, respectively, which may well be subject to different rates of strain/stress increase than otherearthquakes [20].
S. Crampin, S. Peacock / Wave Motion 45 (2008) 675–722 691
paths due to crystalline anisotropy. Fluid-saturated stress-aligned cracks must be the default interpretation.We also do not claim that azimuthally-aligned shear-wave splitting is invariably caused by microcracks
(grain-boundary cracks and preferentially oriented pores) rather than macro-cracks with dimensions in tensof centimetres to tens of metres, say. There is also some controversy over the dimensions of cracks causingthe splitting. However, heavily fractured beds with large cracks tend to severely attenuate the slower splitshear-waves so that they are difficult to observe [14]. Equally, typical examples of microcrack-inducedshear-wave splitting, as seen almost universally elsewhere, are also seen in rocks without significant visiblefractures [98].

Table 4Common fallacies in measuring and interpreting azimuthally-aligned shear-wave splitting above small earthquakes
Fallacies Summarya of preferred interpretation Ref.
[F1] Polarisations of split shear-waves areorthogonal.
Shear-waves propagating along seismic rays at the group velocityhave polarisations which are not strictly orthogonal except in a fewspecific symmetry directions. Body-wave polarisations areorthogonal in all phase-velocity directions, but phase-velocitypropagation is difficult to observe.
[1,7]
[F2] Polarisations of split shear-waves arefixed, parallel to cracks, or normal tospreading centres.
Polarisations of shear-wave splitting always vary (three-dimensionally) with azimuth and incidence within the shear-wavewindow, even when propagating through parallel cracks, or normalto spreading centres.
[1,7,11]
[F3] There is the same percentage of shear-wave velocity anisotropy in all directions,through any given set of parallel cracks,or through upper-mantle anisotropy.
Percentage of shear-wave velocity anisotropy always varies (three-dimensionally) with azimuth and incidence angle. When propagatingthrough parallel cracks, or parallel to spreading centres, percentagesmay vary from positive to negative, within the shear-wave window.(Time-delays become negative when faster and slower split shear-waves exchange polarisations.) These may lead to very low ornegative time-delays in some directions of propagation, and maximalvalues in other directions separated by as little as 30�.
[1,7]
[F4] Polarisations observed at the free-surfaceare the polarisations along the ray path.
Incident polarisations are wholly preserved for surfaceobservations only at normal incidence to a horizontal free-surface.Polarisations and orthogonality may be seriously disturbed at allother angles of incidence, where horizontal observations areprojections of original polarisations onto the horizontal plane.
[1,7]
[F5] Temporal changes in shear-wave splitting,caused by any plausible stress-inducedchanges in crack geometry, cause changesin time-delays for all ray paths within theshear-wave window.
Small changes in low-level stress are only likely to affect crack aspect-ratios, which will change the average time-delay in Band-1b
directions of the shear-wave window (values may be positive ornegative in particular directions within Band-1). Band-1 has mostlypositive, say, time-delays but has a small solid angle of negative time-delays, so that averages need to be taken to measure overallvariations in amplitude. Only large changes in stress will changecrack density and modify time-delays in Band-2.
[7,11]
[F6] The shear-wave window, in which shear-waves can be observed at the free-surfaceundistorted by S-to-P conversions, isaligned normal to the horizontal plane.
The shear-wave window is normal to the free-surface within abouta wavelength of the seismic recorder. Since earthquakes aretypically beneath irregular surface- (and subsurface-) topography,shear-wave splitting observed above small earthquakes may beseverely distorted even within the nominal shear-wave window.Irregular topography may seriously modify shear-wavepolarisations but has less effect on time-delays.
[80,81]
[F7] Large percentages of crack-inducedshear-wave velocity anisotropy, exceeding5%, are possible.
Assuming crack-induced anisotropy (as we must for azimuthally-aligned shear-wave splitting; see Table 2, particularly [R1, R2]), onlyshear-wave velocity anisotropy in the range 1.5% to 4.5% (crackdensities 0.015 to 0.045) is permissible in ostensibly intact rock.Higher crack densities imply such disaggregated rock that the slowersplit shear-wave is likely to be highly attenuated and probablyunobservable [14]. Note, however, that higher levels of shear-wavevelocity anisotropy are found in areas of high heat-flow in Icelandand near volcanoes. The cause of these high values is not yet fullyunderstood.
[7,41,42]
[F8] Shear-wave splitting observed at the free-surface is confined to the uppermost fewkilometres.
Assuming crack-induced anisotropy, confining the anisotropy tothe near-surface often would imply impossibly-high crack densities[F7]. Although there may be higher crack-induced anisotropy nearthe surface, there appears to be pervasive shear-wave splittingthroughout most levels of the crust. *Saiga [104], observed shear-wave splitting down to 30 km in Tokai, Japan, and *Gledhill [54]observed uniform shear-wave splitting down to 34.8 km inWellington Peninsular, New Zealand.
[7]
692 S. Crampin, S. Peacock / Wave Motion 45 (2008) 675–722
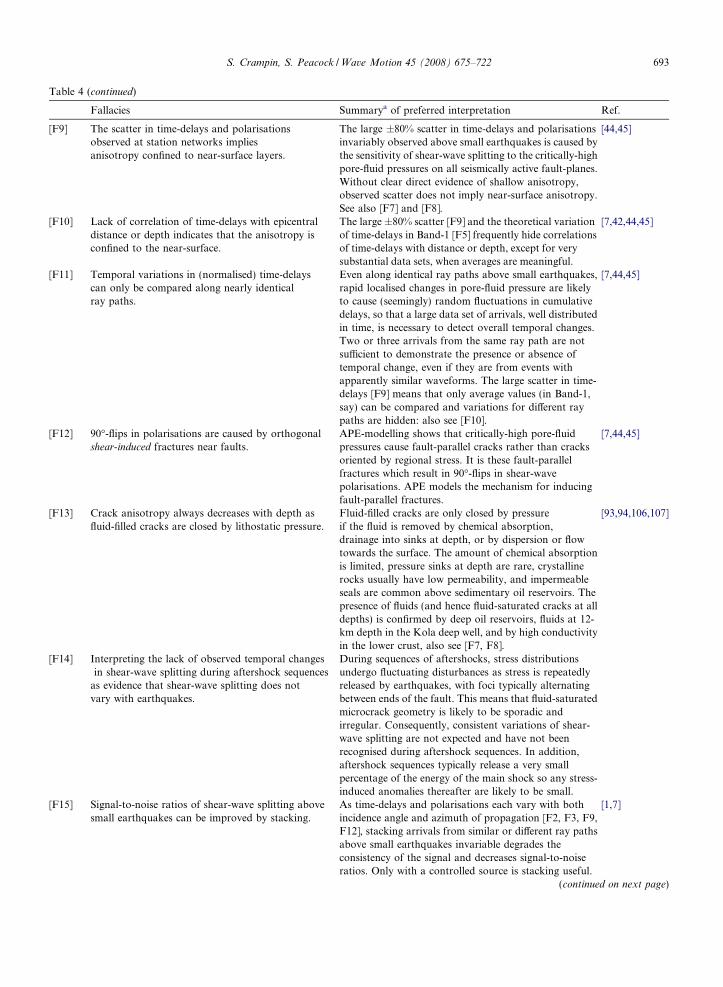
Table 4 (continued)
Fallacies Summarya of preferred interpretation Ref.
[F9] The scatter in time-delays and polarisationsobserved at station networks impliesanisotropy confined to near-surface layers.
The large ±80% scatter in time-delays and polarisationsinvariably observed above small earthquakes is caused bythe sensitivity of shear-wave splitting to the critically-highpore-fluid pressures on all seismically active fault-planes.Without clear direct evidence of shallow anisotropy,observed scatter does not imply near-surface anisotropy.See also [F7] and [F8].
[44,45]
[F10] Lack of correlation of time-delays with epicentraldistance or depth indicates that the anisotropy isconfined to the near-surface.
The large ±80% scatter [F9] and the theoretical variationof time-delays in Band-1 [F5] frequently hide correlationsof time-delays with distance or depth, except for verysubstantial data sets, when averages are meaningful.
[7,42,44,45]
[F11] Temporal variations in (normalised) time-delayscan only be compared along nearly identicalray paths.
Even along identical ray paths above small earthquakes,rapid localised changes in pore-fluid pressure are likelyto cause (seemingly) random fluctuations in cumulativedelays, so that a large data set of arrivals, well distributedin time, is necessary to detect overall temporal changes.Two or three arrivals from the same ray path are notsufficient to demonstrate the presence or absence oftemporal change, even if they are from events withapparently similar waveforms. The large scatter in time-delays [F9] means that only average values (in Band-1,say) can be compared and variations for different raypaths are hidden: also see [F10].
[7,44,45]
[F12] 90�-flips in polarisations are caused by orthogonalshear-induced fractures near faults.
APE-modelling shows that critically-high pore-fluidpressures cause fault-parallel cracks rather than cracksoriented by regional stress. It is these fault-parallelfractures which result in 90�-flips in shear-wavepolarisations. APE models the mechanism for inducingfault-parallel fractures.
[7,44,45]
[F13] Crack anisotropy always decreases with depth asfluid-filled cracks are closed by lithostatic pressure.
Fluid-filled cracks are only closed by pressureif the fluid is removed by chemical absorption,drainage into sinks at depth, or by dispersion or flowtowards the surface. The amount of chemical absorptionis limited, pressure sinks at depth are rare, crystallinerocks usually have low permeability, and impermeableseals are common above sedimentary oil reservoirs. Thepresence of fluids (and hence fluid-saturated cracks at alldepths) is confirmed by deep oil reservoirs, fluids at 12-km depth in the Kola deep well, and by high conductivityin the lower crust, also see [F7, F8].
[93,94,106,107]
[F14] Interpreting the lack of observed temporal changesin shear-wave splitting during aftershock sequences
as evidence that shear-wave splitting does notvary with earthquakes.
During sequences of aftershocks, stress distributionsundergo fluctuating disturbances as stress is repeatedlyreleased by earthquakes, with foci typically alternatingbetween ends of the fault. This means that fluid-saturatedmicrocrack geometry is likely to be sporadic andirregular. Consequently, consistent variations of shear-wave splitting are not expected and have not beenrecognised during aftershock sequences. In addition,aftershock sequences typically release a very smallpercentage of the energy of the main shock so any stress-induced anomalies thereafter are likely to be small.
[F15] Signal-to-noise ratios of shear-wave splitting abovesmall earthquakes can be improved by stacking.
As time-delays and polarisations each vary with bothincidence angle and azimuth of propagation [F2, F3, F9,F12], stacking arrivals from similar or different ray pathsabove small earthquakes invariable degrades theconsistency of the signal and decreases signal-to-noiseratios. Only with a controlled source is stacking useful.
[1,7]
(continued on next page)
S. Crampin, S. Peacock / Wave Motion 45 (2008) 675–722 693
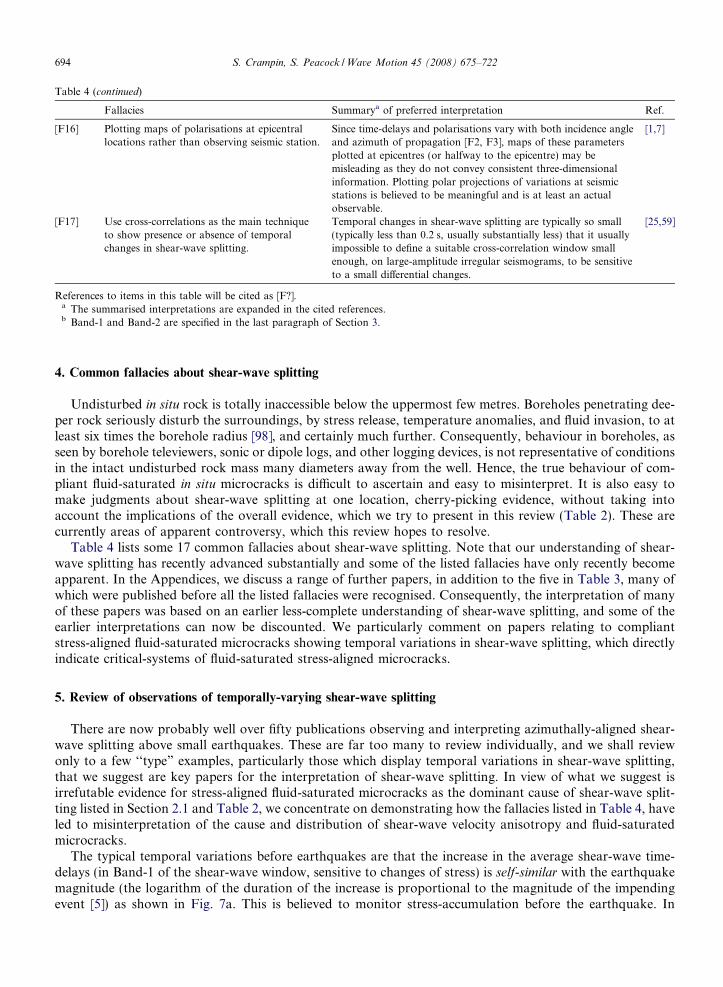
Table 4 (continued)
Fallacies Summarya of preferred interpretation Ref.
[F16] Plotting maps of polarisations at epicentrallocations rather than observing seismic station.
Since time-delays and polarisations vary with both incidence angleand azimuth of propagation [F2, F3], maps of these parametersplotted at epicentres (or halfway to the epicentre) may bemisleading as they do not convey consistent three-dimensionalinformation. Plotting polar projections of variations at seismicstations is believed to be meaningful and is at least an actualobservable.
[1,7]
[F17] Use cross-correlations as the main techniqueto show presence or absence of temporalchanges in shear-wave splitting.
Temporal changes in shear-wave splitting are typically so small(typically less than 0.2 s, usually substantially less) that it usuallyimpossible to define a suitable cross-correlation window smallenough, on large-amplitude irregular seismograms, to be sensitiveto a small differential changes.
[25,59]
References to items in this table will be cited as [F?].a The summarised interpretations are expanded in the cited references.b Band-1 and Band-2 are specified in the last paragraph of Section 3.
694 S. Crampin, S. Peacock / Wave Motion 45 (2008) 675–722
4. Common fallacies about shear-wave splitting
Undisturbed in situ rock is totally inaccessible below the uppermost few metres. Boreholes penetrating dee-per rock seriously disturb the surroundings, by stress release, temperature anomalies, and fluid invasion, to atleast six times the borehole radius [98], and certainly much further. Consequently, behaviour in boreholes, asseen by borehole televiewers, sonic or dipole logs, and other logging devices, is not representative of conditionsin the intact undisturbed rock mass many diameters away from the well. Hence, the true behaviour of com-pliant fluid-saturated in situ microcracks is difficult to ascertain and easy to misinterpret. It is also easy tomake judgments about shear-wave splitting at one location, cherry-picking evidence, without taking intoaccount the implications of the overall evidence, which we try to present in this review (Table 2). These arecurrently areas of apparent controversy, which this review hopes to resolve.
Table 4 lists some 17 common fallacies about shear-wave splitting. Note that our understanding of shear-wave splitting has recently advanced substantially and some of the listed fallacies have only recently becomeapparent. In the Appendices, we discuss a range of further papers, in addition to the five in Table 3, many ofwhich were published before all the listed fallacies were recognised. Consequently, the interpretation of manyof these papers was based on an earlier less-complete understanding of shear-wave splitting, and some of theearlier interpretations can now be discounted. We particularly comment on papers relating to compliantstress-aligned fluid-saturated microcracks showing temporal variations in shear-wave splitting, which directlyindicate critical-systems of fluid-saturated stress-aligned microcracks.
5. Review of observations of temporally-varying shear-wave splitting
There are now probably well over fifty publications observing and interpreting azimuthally-aligned shear-wave splitting above small earthquakes. These are far too many to review individually, and we shall reviewonly to a few ‘‘type” examples, particularly those which display temporal variations in shear-wave splitting,that we suggest are key papers for the interpretation of shear-wave splitting. In view of what we suggest isirrefutable evidence for stress-aligned fluid-saturated microcracks as the dominant cause of shear-wave split-ting listed in Section 2.1 and Table 2, we concentrate on demonstrating how the fallacies listed in Table 4, haveled to misinterpretation of the cause and distribution of shear-wave velocity anisotropy and fluid-saturatedmicrocracks.
The typical temporal variations before earthquakes are that the increase in the average shear-wave time-delays (in Band-1 of the shear-wave window, sensitive to changes of stress) is self-similar with the earthquakemagnitude (the logarithm of the duration of the increase is proportional to the magnitude of the impendingevent [5]) as shown in Fig. 7a. This is believed to monitor stress-accumulation before the earthquake. In
S. Crampin, S. Peacock / Wave Motion 45 (2008) 675–722 695
addition, in all cases where there is sufficient data to show the phenomenon, the increase in time-delaysabruptly begins to decrease shortly before the earthquake [6], where the logarithm of the duration of thedecrease is again self-similar to the magnitude of the impending event as shown in Fig. 7b. This stress relax-ation is believed to monitor crack coalescence before the actual fault break. Fifteen earthquakes whereincreases have been seen are listed in Table 1a. Of these, nine, where there were sufficient source events, alsoshow precursory decreases (Table 1b). We refer to these increases and decreases as classic examples of self-sim-ilar time-delay variations before earthquakes. Fig. 6 shows typical examples of increases and precursorydecreases in Band-1 time-delays for seven earthquakes and two laboratory stress cells.
There have been extensive studies in two regions: California, where temporal variations in shear-wave split-ting before earthquakes were first identified; and Iceland, where recent studies form the background to muchof our current understanding of shear-wave splitting. Observations and interpretations of shear-wave splittingincluding those where classic temporal variations before earthquakes have been observed are summarised inAppendices: (A) California; (B) Iceland; and (C) elsewhere. We also add Appendix D): temporal changes inshear-wave splitting observed before, during, and after volcanic eruptions, and Appendix E): temporalchanges in shear-wave splitting observed during other phenomena.
For convenience, throughout the appendices and the reference list, papers reporting shear-wave splittingwhere temporal variations have been recognised, either by the authors or by our re-interpretations, havethe citation and reference marked by an asterisk ‘�’. The section heading for each paper discussed in theappendices will include those crack properties [R?] (Table 2) and/or fallacies [F?] (Table 4) most relevant tothe particular paper or papers. Note that papers published on data from Iceland, Italy, and China, have gen-erally known and avoided the fallacies listed in Table 2.
6. Summaries of appendices
6.1. Temporal changes in shear-wave splitting before earthquakes in California
Appendix A cites more than ten papers referring to observations of shear-wave splitting in California,where temporal variations were first identified. These various observations, when examined in the contextof worldwide observations of shear-wave splitting, are without exception consistent with distributions of com-pliant stress-aligned fluid-saturated microcracks pervading the crust. The classic self-similar temporal varia-tions of increases and decreases in Band-1 time-delays are seen before two earthquakes, the MS 6, 1986,North Palm Springs Earthquake [6,27–29], and a ML 4, 1989, Parkfield Earthquake [23]. Other less classicexamples of temporal changes are also seen above small earthquakes in the Los Angeles Basin [99] and in var-ious analyses above earthquakes observed by the seismic network of Parkfield Earthquake Prediction Project[100,101].
6.2. Temporal changes in shear-wave splitting before earthquakes in Iceland
Appendix B briefly outlines the extensive observations of shear-wave splitting in Iceland, where much ofthe current understanding of shear-wave splitting was first established. Iceland has persistent swarm-typeseismicity associated with transform faults of the Mid-Atlantic Ridge which unusually run onshore andprovide ideal sources for studying shear-wave splitting within the shear-wave window above the source.Classic stress-accumulation increases have been identified in retrospect before some eight earthquakes inIceland [5,6,24,30] and one M 5 earthquake was successfully stress-forecast in real-time [25] (Table 1).It is likely that had the improved seismic catalogue (with magnitudes down to M 0 and below) been avail-able at the time, the pair of Ms �6.6, June 2001, earthquakes, the largest in Iceland for some decades,would also have been stress-forecast in real time [30]. Iceland is highly active tectonically, and shear-wavesplitting time-delays have been shown to be sensitive to changes in stress due to magmatic as well as seis-mic activity. Small magmatic episodes disrupt the classic variations in time-delays before earthquakes,except for long duration increases before larger earthquakes, short duration increases before very smallearthquakes, and during the 2-year stress adjustment following the large Vatnajokull eruption when minormagmatic disturbances were absent [5].
696 S. Crampin, S. Peacock / Wave Motion 45 (2008) 675–722
6.3. Temporal changes in shear-wave splitting before earthquakes elsewhere
Appendix C reports that temporal changes in shear-wave splitting time-delays before earthquakes are awidespread phenomenon that has been observed in a variety of different regions worldwide. Classic examplesof temporal changes in shear-wave splitting before earthquakes have been observed in: Arkansas, USA; twoareas in China; two areas in Italy; and probably before distant earthquakes near the Wellington Peninsula,New Zealand. There are no contrary observations where adequate source earthquakes have not shown vari-ations in time-delays before larger earthquakes.
There are several studies from New Zealand, Gledhill [54,102] and Balfour et al. [103], where the shear-wave splitting has complicated polarisations, almost certainly caused by the severe topographic irregularitiesin both locations. Gledhill and Balfour et al. did not find evidence for temporal changes. This was at leastpartly because the significance of Band-1 and Band-2 directions had not been established when Gledhill’s mea-surements were originally made. However, Gledhill’s data may show both increases and precursory decreasesbefore distant offshore earthquakes.
6.4. Temporal changes in shear- wave splitting before volcanic eruptions
Appendix D reports temporal changes in shear-wave splitting time-delays before three volcanic erup-tions. The 1996, Gjalp eruption, in the Vatnajokull Ice Field, in Iceland showed increases in Band-1time-delays at �240-km distance in three directions (Table 1c). Gjalp did not show a precursory decrease,but following the eruption the time-delays showed a gradual decrease over about 2 years [5]. Bianco et al.[32] report several 90�-flips in shear-wave polarisations before a flank eruption on Mt. Etna which alsoshowed precursory decreases immediately before the eruption. The interesting feature of this behaviouris that the increase in time-delays and the precursory decrease is very similar to the classic increaseand decrease in Band-1 time-delays observed by Del Pezzo et al. [104] before an earthquake on Mt. Vesu-vius. Miller and Savage [33] report 90�-flips in shear-wave polarisations at Mt. Ruapehu, New Zealand,which they attribute to the effects of high-pressures before magma erupts at the surface, and speculate thateruptions can be predicted by such behaviour [47].
Clearly, more observations of temporal variations in shear-wave splitting before eruptions are needed todetermine whether both the stress-accumulation increase and the precursory decrease in time-delays are uni-versal for all eruptions, as they appear to be for all earthquakes. There is a wide variety of different types oferuption and it is possible that shear-wave splitting may show behaviour distinguishing types of eruption.
6.5. Other observations of temporal variations in shear-wave splitting
Appendix E reports six other examples of temporal changes in shear-wave splitting. Angerer et al. [35]use APE to successfully model the response of a fractured carbonate reservoir to both high- and low-pres-sure CO2-injections. This is the most direct in situ calibration of APE-modelling to-date and confirms theexistence of critical-systems of fluid-saturated stress-aligned microcracks. Bokelmann and Harjes [36]report changes in shear-wave splitting following fluid-injection at 9-km depth in the KTB Fracture Exper-iment in SE Germany caused systematic changes in splitting at 4-km depth in the 190-m offset pilot well.Teanby et al. [37] report possible tidal variations in borehole observations of shear-wave splitting in pro-duction-induced events in the North Sea. Crampin et al. [38] report the SMSITES cross-hole seismicexperiment in Iceland where well-recorded anomalies coincide with distant low-level seismic activity whichindicates the great sensitivity of the crack-critical crust to minor disturbances. Crampin and Booth [39]report changes in polarisations of shear-wave splitting during hydraulic pumping in a hot-dry-rock exper-iment in Cornwall. In initial pumping tests, shear-wave polarisations were parallel to joints and fracturesin outcrop rocks, whereas when hydraulic fracturing began, polarisations changed by �7� to became par-allel to the measured direction of maximum horizontal stress. Tang et al. [40] report anomalies duringfluid-injection near the Krafla volcano, Iceland, and in the Cocos Geothermal Field, California. The causeof these anomalies, see Section E2.6, is not understood but is believed to be due to local behaviour in theproximity of the injection points.
S. Crampin, S. Peacock / Wave Motion 45 (2008) 675–722 697
6.6. Overall summary
The appendices discuss some 30 reports of temporal changes in shear-wave splitting at some 20 differentlocations. Many of which are the classic variations of longer term increases in Band-1 shear-wave time-delaysand shorter precursory decreases immediately before the impending events. There are no contrary observa-tions, and we conclude that the immediate effect of low-level changes of stress on the rock mass, as in thestress-accumulation before earthquakes or the inferred crack coalescence stress relaxations, is to modifymicrocrack geometry that can be monitored by shear-wave splitting.
7. Discussion
Since the interior of the Earth is largely inaccessible it is difficult to directly prove even the existence of fluid-saturated stress-aligned compliant microcracks at depth in the crust. The arguments in Table 2 [especially R1]and Section 2 that parallel shear-wave splitting polarisations imply TIH-anisotropy, and that stress-alignedvertical cracks are the only cause of TIH common to almost all rocks, are diagnostic and compelling, but tech-nical. The most direct demonstrations of in situ cracks are: (1) fluid-saturated microcracks are the only imme-diately compliant element of in situ rocks; and (2) since shear-wave splitting monitors microcrack geometry,the observed short-term temporal variations in shear-wave splitting necessarily imply distributions of fluid-sat-urated microcracks. This raises the question of whether we can distinguish between temporal and spatial vari-ations, and whether the anisotropy is shallow or deep in the crust.
7.1. Temporal versus spatial variations of shear-wave splitting?
The appendices report changes in shear-wave time-delays before 15 earthquakes, before three volcaniceruptions, and changes during six other investigations. A crucial question is whether these changes are dueto temporal variations in shear-wave splitting caused by stress-induced changes to microcrack geometry as sug-gested above, or whether the changes are caused by spatial migration of shear-wave source events, as suggestedby Liu et al. [50,56].
The locations of swarms of earthquakes used as the shear-wave source events are seldom wholly randomdistributed and sometimes display migration of foci with time. However, the effect of changes of source loca-tion on measurements of time-delays to seismic stations is difficult to evaluate because, even in a wholly uni-form stable anisotropic structure, the degree of seismic anisotropy varies with direction of propagation inthree dimensions, as well as varying temporally as the local stress-field is modified by every small earthquake[45].
Enlarging on the arguments summarised in Table 2, we discuss evidence for changes being temporal vari-ations in anisotropy rather than spatial variations in shear-wave source events.
(1) All 15 earthquakes (Table 1a), where temporal changes have been observed, show similar variations witha long-term increase of normalised time-delays (in Band-1 of the shear-wave window) before largerearthquakes, which can be modelled as stress-accumulation [7].
(2) Whenever there are sufficient source events (nine cases out of 15, Table 1b), the normalised time-delaysalso display a precursory decrease immediately before the larger earthquake. Fig. 6 shows six examplesof increases and precursory decreases scaled with time.
(3) The logarithms of durations of both increases and decreases are self-similar with the magnitude of theimpending earthquakes [5,6,24,30].
For the effects of source migration to give characteristic self-similar patterns of systematic behaviour in 15different source zones (Table 1) along paths to arbitrary distributions of seismic stations (as in Fig. 6) would beextremely unlikely coincidences. We conclude that the observations of temporal variations in shear-wave split-ting are monitoring (at least partially understood) temporal variations in microcrack geometry.
Two controlled source experiments directly confirm temporal changes in shear-wave splitting and hence ofthe compliance of fluid-saturated microcracks. Angerer et al. [35] (Section E2.1) used APE to model the effects
698 S. Crampin, S. Peacock / Wave Motion 45 (2008) 675–722
of both high-pressure and low-pressure CO2-injections on shear-wave splitting, and Crampin et al. [38] (Sec-tion E2.4) reported measurements of cross-hole seismics showing temporal variations of the rock massresponding to seismic release equivalent to a M 3.5 earthquake at an epicentral distance of �70 km.
7.2. Shallow versus deep anisotropy?
Observations of azimuthally-aligned velocity variations and shear-wave splitting are always a combinationof the anisotropy along the whole of the ray paths and do not directly identify the depth-range where theanisotropy occurs. Consequently, other information must be used to infer depths. The association of theanisotropy with stress-aligned microcracks (Table 2) imposes limits on depths. Since cracks are generallyaligned perpendicular to the direction of minimum compressional stress, near the free-surface where the min-imum stress is vertical, horizontal cracks may be expected in the uppermost 500–1500 m of the crust [5,7,43],and anomalous observations must be expected above these depths. Since observations of velocity variationsand shear-wave splitting of TIH-anisotropy are consistently aligned with the direction of horizontal stress,whenever this can be identified or inferred, stress-aligned anisotropy is indicated below 500–1500 m world-wide. Observations suggest that such stress-aligned anisotropy is uniformly distributed below such depthsthroughout at least the upper half of the crust.
Several of the papers reviewed in the appendices argue that, because shear-wave time-delays and polarisa-tions change rapidly between neighbouring seismic stations, and because the time-delays do not uniformlyincrease with length of ray path, the anisotropy is necessarily confined to the near-surface. It is difficult to eval-uate the depth-range because observed shear-wave time-delays are the cumulative sum of the time-delaysalong the whole of the ray path (assuming similar anisotropic orientations, as is often the case). Any observedtime-delay may be caused by stronger anisotropy at either end of the ray path, or by uniform but weakeranisotropy along the whole length of the ray path. There are two main causes of variations in surface obser-vations: (1) shear-waves have strong reactions with surface topography, so that irregular topography modifiesthe effective slope of the free-surface in the shear-wave window. Most small earthquakes, and hence mostshear-wave source events, tend to be in hilly and mountainous areas, where the slope around the seismic recor-der may seriously modify observed shear-wave polarisations; and (2) the scatter in time-delays caused by high-pressure-induced 90�-flips in shear-wave polarisations above small earthquakes introduces a ±80% scatter inobservations of time-delays [45]. This means that shear-wave time-delays are heavily scattered. Consequently,variations in time-delays are only statistically valid in averages of substantial data sets, and substantial datasets of seismic data before larger earthquakes are scarce, with perhaps only one wholly adequate statisticallyvalid example to-date [27]. However, in all cases where there are sufficient source events (Table 1a and 1b),despite the scatter least-squares averages indicate stress-accumulation increases, and crack coalescencedecreases. In addition, concentrations of anisotropy in the near-surface would typically lead to unacceptablyhigh crack densities. Arguments for the preferred interpretation of similar anisotropy along the whole of theray path are summarised in Table 4 in fallacies [F6, F8,F9,F10].
Japan and New Zealand have both shallow and intermediate depth earthquakes which allow specificationof the depth-ranges for anisotropy. *Saiga et al. [105] observed consistent shear-wave splitting down to 30 kmin the Tokai region, Honshu, Japan. *Gledhill [54] found consistent shear-wave splitting throughout the crustdown to 35 km. Elsewhere, both Graham and Crampin [106] in Turkey, and Yegorkina et al. [107] in Armenia,observed consistent polarisations of shear-wave splitting throughout the whole thickness of the crust fromshear-waves from regional earthquakes refracted from the Moho estimated as 29-km deep in Turkey, and anotional 33-km deep in Armenia. In both cases, shear-wave time-delays of 1 s or more throughout the crustimply anisotropy of the lower crust at least twice as strong as in the upper crust.
A comprehensive P-wave refraction experiment beneath Mount Hood, Oregon [108] provides informationabout possible crack fluid content at depth [109]. The P-wave anisotropic velocity variations could be inter-preted in terms of stress-aligned fluid-filled cracks filled with, successively from the surface: liquid water;super-critical water [110]; and fluid melt. Equating temperatures beneath Mount Hood with equivalent tem-peratures elsewhere in the crust suggests that shear-wave splitting in the lower half of the crust is, at least par-tially, due to cracks filled with super-critical water which has temperature- and pressure-sensitive acousticvelocities [109]. Cracks filled with super-critical water in high-temperature regimes in the crust is the probable
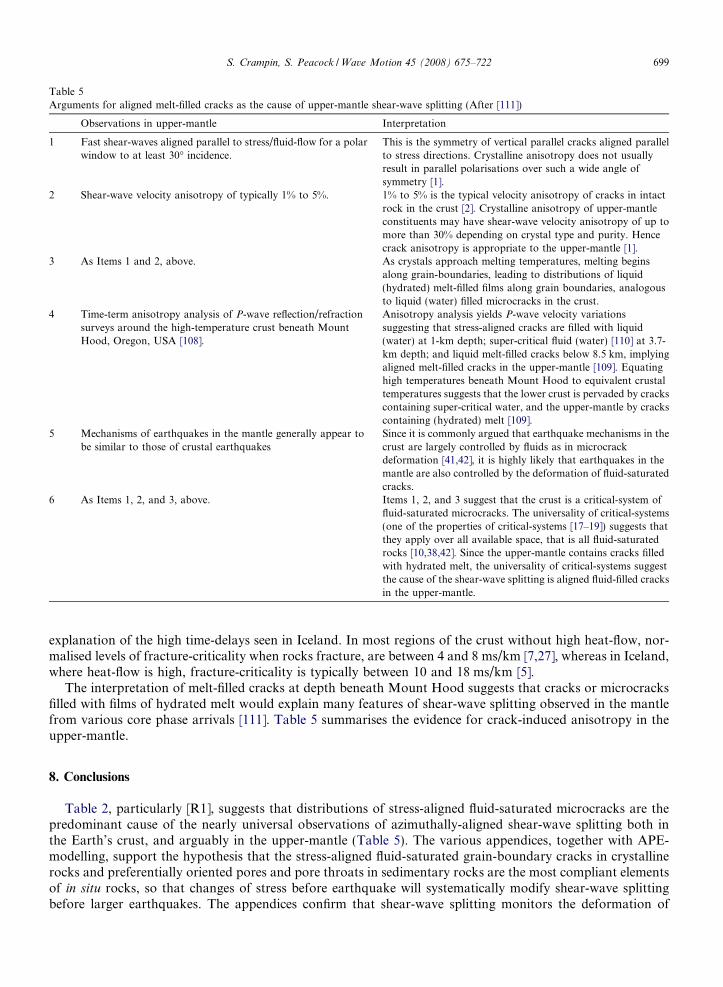
Table 5Arguments for aligned melt-filled cracks as the cause of upper-mantle shear-wave splitting (After [111])
Observations in upper-mantle Interpretation
1 Fast shear-waves aligned parallel to stress/fluid-flow for a polarwindow to at least 30� incidence.
This is the symmetry of vertical parallel cracks aligned parallelto stress directions. Crystalline anisotropy does not usuallyresult in parallel polarisations over such a wide angle ofsymmetry [1].
2 Shear-wave velocity anisotropy of typically 1% to 5%. 1% to 5% is the typical velocity anisotropy of cracks in intactrock in the crust [2]. Crystalline anisotropy of upper-mantleconstituents may have shear-wave velocity anisotropy of up tomore than 30% depending on crystal type and purity. Hencecrack anisotropy is appropriate to the upper-mantle [1].
3 As Items 1 and 2, above. As crystals approach melting temperatures, melting beginsalong grain-boundaries, leading to distributions of liquid(hydrated) melt-filled films along grain boundaries, analogousto liquid (water) filled microcracks in the crust.
4 Time-term anisotropy analysis of P-wave reflection/refractionsurveys around the high-temperature crust beneath MountHood, Oregon, USA [108].
Anisotropy analysis yields P-wave velocity variationssuggesting that stress-aligned cracks are filled with liquid(water) at 1-km depth; super-critical fluid (water) [110] at 3.7-km depth; and liquid melt-filled cracks below 8.5 km, implyingaligned melt-filled cracks in the upper-mantle [109]. Equatinghigh temperatures beneath Mount Hood to equivalent crustaltemperatures suggests that the lower crust is pervaded by crackscontaining super-critical water, and the upper-mantle by crackscontaining (hydrated) melt [109].
5 Mechanisms of earthquakes in the mantle generally appear tobe similar to those of crustal earthquakes
Since it is commonly argued that earthquake mechanisms in thecrust are largely controlled by fluids as in microcrackdeformation [41,42], it is highly likely that earthquakes in themantle are also controlled by the deformation of fluid-saturatedcracks.
6 As Items 1, 2, and 3, above. Items 1, 2, and 3 suggest that the crust is a critical-system offluid-saturated microcracks. The universality of critical-systems(one of the properties of critical-systems [17–19]) suggests thatthey apply over all available space, that is all fluid-saturatedrocks [10,38,42]. Since the upper-mantle contains cracks filledwith hydrated melt, the universality of critical-systems suggestthe cause of the shear-wave splitting is aligned fluid-filled cracksin the upper-mantle.
S. Crampin, S. Peacock / Wave Motion 45 (2008) 675–722 699
explanation of the high time-delays seen in Iceland. In most regions of the crust without high heat-flow, nor-malised levels of fracture-criticality when rocks fracture, are between 4 and 8 ms/km [7,27], whereas in Iceland,where heat-flow is high, fracture-criticality is typically between 10 and 18 ms/km [5].
The interpretation of melt-filled cracks at depth beneath Mount Hood suggests that cracks or microcracksfilled with films of hydrated melt would explain many features of shear-wave splitting observed in the mantlefrom various core phase arrivals [111]. Table 5 summarises the evidence for crack-induced anisotropy in theupper-mantle.
8. Conclusions
Table 2, particularly [R1], suggests that distributions of stress-aligned fluid-saturated microcracks are thepredominant cause of the nearly universal observations of azimuthally-aligned shear-wave splitting both inthe Earth’s crust, and arguably in the upper-mantle (Table 5). The various appendices, together with APE-modelling, support the hypothesis that the stress-aligned fluid-saturated grain-boundary cracks in crystallinerocks and preferentially oriented pores and pore throats in sedimentary rocks are the most compliant elementsof in situ rocks, so that changes of stress before earthquake will systematically modify shear-wave splittingbefore larger earthquakes. The appendices confirm that shear-wave splitting monitors the deformation of
700 S. Crampin, S. Peacock / Wave Motion 45 (2008) 675–722
microcracks and shows systematic changes before impending earthquakes. The precision of controlled sourceobservations (Sections E2.1 and E2.4), as opposed to the scatter associated with earthquake sources, indicatesthat cross-hole seismics in borehole stress-monitoring sites (SMSs) can monitor the accumulation of stressbefore impending earthquakes and estimate the time, magnitude, and estimated location of impending largeearthquakes (see Section E2.4). Although the quality of the various data sets varies widely, there are no con-trary events where appropriate data do not show temporal changes before large earthquakes.
This means that in principle, cross-hole seismics at appropriate directions and depths can monitor thebuild-up and precursory decrease of stress before earthquakes and stress-forecast the time and magnitudeof the impending event where other precursory phenomena indicate the approximate location.
Finally, as an aside, it is fortunate for geoscientists that the observed pattern of shear-wave splitting polar-isations in the Earth are typically oriented either parallel, the result of TIH-anisotropy, or radial, the result ofTIV-anisotropy Hexagonal symmetry (transverse isotropy) in these two orientations is a particularly simpleeasily-specified easily-understood symmetry system. All other anisotropic symmetry systems with the thirdpolarisation pattern are much more complicated and would be much harder to interpret and exploit.
Acknowledgement
This work was partially supported by the European Commission SMSITES and PREPARED Projects, con-tract numbers EVR1-CT1999-40002 and EVG1-CT2002-00073, respectively. We thank two reviewers whose de-tailed comments greatly improved the manuscript. The contents of this paper are Crown Copyright (C).
Appendix A. Temporal changes in shear-wave splitting before earthquakes in California (Appendix A is
summarised in Section 6.1.)
Note that throughout the appendices and reference list, papers where temporal changes in shear-wave split-ting have been recognised, either by the original authors or by our re-interpretations, are marked by ‘�’.
A.1. Introduction
*Peacock et al. [27] and *Crampin et al. [28] measured shear-wave time-delays in polarisation diagrams atStation KNW of the Anza Seismic Network, Southern California, before the Ms 6, 1986, North Palm SpringsEarthquake, �30 km from KNW, and were the first to identify temporal variations in shear-wave splittingbefore earthquakes. The variations in polar projections of time-delays were attributed to increases in crackaspect-ratios in distributions of stress-aligned fluid-saturated microcrack, as strain accumulated (now referredto as ‘stress-accumulation’) for 3 years before the earthquake. This behaviour, initially hypothetical, was the-oretically confirmed when the anisotropic poro-elastic (APE) model of fluid-rock evolution was developed byZatsepin and Crampin [41] and Crampin and Zatsepin [42]. (Later, *Gao and Crampin [6] also identified, onthe same data set, an abrupt decrease in time-delays some 70 days before the onset of the earthquake.) Thehypothesis for the sensitivity of shear-wave splitting to stress changes before earthquakes generated a numberof papers by Aster, Shearer, Fletcher, and others reported in this Appendix, investigating surface seismic andborehole evidence for distributions of fluid-saturated stress-aligned microcracks. This appendix will discusskey papers relevant to temporal variations of shear-wave splitting in California in chronological order.
A.2. Observations and interpretations of shear-wave splitting
A.2.1. Aster et al. [57] (subject to fallacies: [F4,F8,F9,F10,F13,F17], Table 4)
Aster et al. [57] used an automatic technique to analyse shear-wave splitting in the same data set where*Peacock et al. [27] and *Crampin et al. [28,29] recognised temporal variations of time-delays before the1986, Ms 6, North Palm Springs Earthquake in Southern California. However, no satisfactory wholly-auto-matic technique for measuring shear-wave splitting has yet been developed [59], and *Crampin et al. [29]showed that the automatic technique of [57] gave errors of up to 200% (factors of 3) in shear-wave time-delays.Such errors are so severe that results and conclusions based on these automatic evaluations of time-delays in
S. Crampin, S. Peacock / Wave Motion 45 (2008) 675–722 701
[57] can be discounted. The comment and response is summarised in Item 4 of Table 3. The misinterpretationsof Aster et al. [57] may be attributed to fallacies [F4,F8,F9, F10,F13,F17] in Table 4.
A.2.2. Fletcher et al. [112] ([R1], Table 2. There are no notable fallacies.)Fletcher et al. [112] studied near-surface site effects at two 300-m deep boreholes. One borehole, KNW-BH,
was 391 m from the surface seismic station KNW near the San Jacinto Fault in Southern California, where*Peacock et al. [27] and *Crampin et al. [28] had observed temporal changes. Both KNW and KNW-BHare in areas of irregular surface topography. The other borehole (at Pinon Flat) did not record local earth-quakes and is irrelevant to this discussion.
Conclusions of Fletcher et al. [112] relevant to this review.
(1) Deeper granitic rocks at KNW-BH are competent and have few obvious cracks or discontinuities, butnear-surface structure at KNW-BH, particularly above 70-m depth, is highly disturbed. Fletcher et al.conclude that this is likely to complicate observations of shear-wave splitting at the surface, wherehigh-frequencies from recordings of local earthquakes may mask the lower-frequency split shear-wavearrivals.
(2) Consequently, they suggest that interpretations using only particle motion diagrams (polarisation dia-grams, PDs) as used by *Peacock et al. [27], and many papers by *Crampin et al., at single stations,are suspect as it is impossible to separate deep effects from local structure.
(3) Fletcher et al. also conclude that shear-wave splitting studies should concentrate on data sets where thereare multiple arrivals from neighbouring stations (or borehole arrays) to identify the effects of near-sur-face interference.
Comments:
(1) Recognition of competent basement rocks agrees with the interpretations of *Peacock et al. [27] and*Crampin et al. [28,29], where the characteristic temporal variations they observed are now seenworldwide ([5,6,43,45], Table 1, and throughout this review). Surface observations of shear-wavesplitting above small earthquakes typically have frequencies of 10–20 Hz with wavelengths of severalhundred metres, and are unlikely to be heavily disturbed by the uppermost 70 m (unless the rock iswholly incompetent). However, near-surface interactions may contribute to the ±20� scatter in polarisa-tions and the ±80% scatter in time-delays typically observed above small earthquakes [2,5,45] andhigh-frequencies could mask slower split shear-wave arrivals on seismograms as Fletcher et al. suggest.Abrupt changes of particle motion direction write characteristic signatures into PDs, and the uniformityof the observations of scatter, seen in a wide variety of source zones and surface conditions worldwide(Table 1), suggests that local conditions are not the primary source of the scatter. The effect of critically-high pore-fluid pressures on all seismogenic faults in a crack-critical crust is the preferred explanation ofthe scatter [45].
(2) The key diagnostic for identifying the arrival of both faster and, particularly, slower split shear-waves isthe abrupt nearly-orthogonal change in particle motion direction which are most clearly seen in PDs (seediscussion in Item 4 of Section 2.2). It is certainly true that shallow and deeper effects cannot be easilydistinguished in PDs, but this is true of all measures of shear-wave splitting.
(3) It is certainly desirable to study shear-wave splitting at arrays of stations rather than single stations.Unfortunately, the geometrical source-to-recorder constraints on observing shear-wave arrivals withinthe shear-wave window, particularly with the need for large earthquakes to be nearby if temporalchanges are to be investigated, are extremely constrained [7]. Consequently, there are few earthquakeswarms and few individual earthquakes that are in the shear-wave window of more than one seismic sta-tion, and little progress would be made if studies of shear-wave splitting were restricted to multiple sta-tion observations.
Summary: The borehole observations of Fletcher et al. [112] are generally compatible with fluid-saturatedstress-aligned microcracks causing shear-wave splitting.
A.2.3. Daley and McEvilly [113] [F3]
Daley and McEvilly [113] report a three-offset multi-azimuth VSP with orthogonal orientations of shear-wave vibrators to a permanently-installed string of three-component geophones to 1.4-km depth in the VarianWell of the Parkfield Earthquake Prediction Experiment on the San Andreas Fault, Southern California. Thiswas intended to be the first of a series of repeated VSPs to monitor temporal changes in shear-wave splittingassociated with what appeared to be a regular �20-year sequence of M 6 earthquakes at Parkfield. Unfortu-nately, the cable to the cemented geophones failed, so that the VSP study of Daley and McEvilly [113] couldnot be repeated. The anticipated M 6 earthquake did not occur until 28th September, 2004, some 12 years late.However Daley and McEvilly showed that the Varian VSP displayed clear near fault anisotropy which theyassign to fluid-saturated cracks.
Conclusions of Daley and McEvilly [113] relevant to this review. Daley and McEvilly conclude that shear-wave splitting at Varian displayed TIH-anisotropy with a horizontal axis of symmetry perpendicular toSan Andreas Fault. They found increasing time-delays as ray paths approach the vertical, which they interpretas implying more pronounced cracking in the stronger shear-fabric nearer the fault.
Comments. The polarisations and time-delays of the TIH-anisotropy observed at Varian are consistent withshear-wave splitting reported elsewhere in this review implying pervasive distributions of stress-aligned fluid-saturated microcracks. Note that in a uniform distribution of TIH-anisotropy, time-delays would theoreticallyincrease as ray paths become closer to the vertical [7]
S. Crampin, S. Peacock / Wave Motion 45 (2008) 675–722 703
(2) The polarisations at KNW are N40�W, approximately fault-parallel, and the shear-wave splittingobserved at KNW and the neighbouring borehole KNW-BH ‘‘most likely results from palaeo-strainmineral alignment . . . perhaps abetted by similarly aligned cracks near the surface . . . and that initialshear-wave particle motion directions do not necessarily indicate the present maximum compressivestress orientation”.
(3) Aster and Shearer suggest that the 2.3 ± 1.7% shear-wave velocity anisotropy estimated for unweatheredrock between 150 and 300 m can be accounted for by 3% per volume of aligned biotite crystals along theray paths.
Comments:
(1) The shear-wave splitting at five of the Anza Stations is compatible with that caused by stress-alignedfluid-saturated microcracks as now observed extensively elsewhere.
(2) There are two phenomena that argue strongly against mineral alignment as the source of the anom-alous polarisations at KNW (see Section 2.1 and Table 2). Anisotropy caused by mineral alignmentdoes not typically lead to the near-parallel shear-wave polarisations within the shear-wave windowindicative of TIH-anisotropy [R1] [1,7]. For mineral alignments to lead to the observed TIH-anisot-ropy, the minerals must have either hexagonal symmetry, or orthorhombic or other symmetry withmutual alignment along one axis but random orientation of the others. Furthermore, the axis of align-ment would need to be horizontal and parallel to the slow shear-wave polarisation so that the perpen-dicularly polarised waves arrive first.Secondly, the anisotropies of mineral crystals typically haveshear-wave velocity anisotropy much greater than the 1.5–5.5% shear-wave velocity anisotropy typi-cally observed in most unfractured rocks in the crust [7] [F7]. Certainly, an unusual combination ofminerals could lead to TIH-anisotropy with appropriate velocity anisotropy, but it would be an unu-sual and would be unlikely to lead to the almost universal observations of azimuthally-varying shear-wave splitting observed elsewhere.
(3) The elastic moduli of biotite (in the 3% per volume of biotite suggested by Aster and Shearer [116]) haveexceptionally large �70% shear-wave velocity anisotropy (for pure biotite). For 3% biotite to be thecause the shear-wave splitting observed at KNW would require an exceptional coincidence: the proposed3% mix of this highly anisotropic mineral with an isotropic matrix leading to the shear-wave velocityanisotropy of 1.5–5.5%, as observed by shear-wave splitting worldwide [2,5,7], would need to be stablethroughout most of the crust. This seems unlikely.
Again the results of Aster and Shearer [116] are generally compatible with the compliant stress-alignedfluid-saturated cracks advocated in this review. Note that the fault-parallel shear-wave polarisations are some40� from the directions of tectonic stress-aligned shear-wave polarisations observed at other stations of theAnza Seismic Network [27–29]. These can be attributed to the complicated effects of 90�-flips in shear-wavepolarisations caused by the high pore-fluid pressures on all seismogenic faults [44,45]. Such polarisation anom-alies can be observed at the surface near such major tectonic features as the San Andreas Fault in Californiaand the Husavık-Flatey Fault in Iceland, where major faults traverse most of the thickness of the crust [44]. Atsmaller faults the anomalies cause scatter in time-delays [45]. Fallacies [F7, F8,F9,F10,F12,F13] contribute tothe misinterpretations of Aster and Shearer [116].
A.2.6. *Li et al. [99] [F9]*Li et al. [99] examined shear-wave splitting above small earthquakes in the Los Angeles Basin. Assuming
crack-induced anisotropy, they observed stress-aligned shear-wave splitting with the typical ±80% scatterobserved elsewhere. Unfortunately, the time-delay data points are too sparse in time to show temporal vari-ations before the several M 4 and M 5 earthquakes recorded during the observations, however there areenough source earthquakes to show that time-delays did decrease following a Montebello double-event,and then gradually rose to the average level. These observations are consistent with the presumed crack-induced observations seen elsewhere.
704 S. Crampin, S. Peacock / Wave Motion 45 (2008) 675–722
A.2.7. Zhang and Schwartz [117] [F2,F7,F8,F9,F10]
Zhang and Schwartz [117] examined shear-wave splitting above aftershocks of the 1989 Loma Prieta earth-quake on a segment of the San Andreas Fault system. The aftershocks are scattered over a 30 km by 50 kmarea divided lengthwise by the nearly-parallel San Andreas, Zayante, and Sargent Faults. The polarisations ofthe leading split shear-waves are approximately fault-parallel (NW–SE) except at Station WAWA, some 7 kmSW away from the Zayante Fault on the SW edge of the Basin, which are approximately NE–SW and parallelto the regional maximum direction of stress, rH. Zhang and Schwartz did not report temporal variations(which in any case are not expected and have not yet been observed during aftershock sequences [F14]).
Conclusions of Zhang and Schwartz [117] relevant to this review:
(1) The varying polarisations indicate anisotropy confined to the very shallow (uppermost 2 km) of the crust.There is a contrast between NE–SW at WAWA outside the fault zone and NW–SE within the fault zone.
(2) The lack of correlation of time-delays with depth and hypocentral distance also indicates shallow anisot-ropy above 2 km. Principally on the basis of these two conclusions, Zhang and Schwartz [117] infer thatthe cause of the fault-parallel polarisations is not wholly stress-aligned microcracks throughout the rockmass but also ‘‘may result from mineral or fracture alignment caused by shearing along the plateboundary”.
Comments:
(1) The shallow crust would need to have such strong fracture-induced anisotropy to achieve the observedtime-delays over short near-surface ray paths that the slower split shear-wave would be severely atten-uated [F7]. The consistency of the many similar waveforms of the faster and slower split shear-wavesillustrated by Zhang and Schwartz suggest this is not the case. If fluid-saturated cracks are the sourceof the anisotropy, as evidence in this review suggests, then the crack densities in the shallow crust sug-gested by Zhang and Schwartz would need to be so high that the crust would be close to disaggregationand the passage of any coherent shear-wave would be unlikely [F7]. The more consistent explanation isthat the fault-parallel polarisations are 90�-flips caused by the high pore-fluid pressures near all seism-ogenic faults, which are observed at the surface only along major tectonic faults reaching nearly tothe surface [43,44]. Station WAWA outside the fault zone has polarisations parallel to the regional stressfield. This is exactly analogous to the pattern of polarisations at Parkfield [23] and at the Husavık-FlateyFault in Iceland [38]. The polarisations of shear-wave splitting at most stations of the Parkfield Networkare parallel to the regional stress-field, whereas the polarisations at Station MM immediately above theSan Andreas Fault, which at this point has a narrow fault zone, show 90�-flips and are fault-parallel andinterpreted as the result of the critically-high-pressures on all seismogenic faults [44]. There is similarbehaviour at the Husavık-Flatey Fault [38].
(2) The ±80% scatter of time-delays and lack of correlation of time-delays with distance is typical of shear-wave splitting observed above all small earthquakes [5,6,45,46]. When the time-delays have such a largescatter, and a shear-wave velocity anisotropy that varies from positive to negative within the shear-wavewindow, any detailed correlation with distance or depth is likely to be hidden [F9, F10].
We suggest that the interpretations of Zhang and Schwartz [117] are subject to several fallacies particularly[F2,F7, F8,F9,F10]. The observed shear-wave splitting appears to be typical of that seen elsewhere, whosebehaviour can be comprehensively interpreted as the result of compliant stress-aligned fluid-saturated micro-cracks throughout at least the upper half of the crust.
A.2.8. *Nadeau et al. [100] [F17]*Nadeau et al. [100], as part of the Parkfield Earthquake Prediction Project, identified clusters of nearly iden-
tical earthquakes (doublets) for the years 1987–1992 within 5 km of a 25-km segment of the San Andreas Fault.They classified clusters by high cross-correlation coefficients in 63% of some 1700 earthquakes localised ontoabout 300 doublet-clusters of closely-spaced earthquakes. The analysis showed no progressive changes in wave-form similarity amongst cluster members. The conclusion was that the structure around the cluster was stable.
S. Crampin, S. Peacock / Wave Motion 45 (2008) 675–722 705
Comments. The cross-correlation cluster analysis, as reported in [100], was principally aimed at identifyingdifferences in P- and S-wave arrival times and was restricted to vertical component seismograms, includingboth P-wave and S-wave arrivals, where S–P time-delays were about 2 s. S-wave arrivals on vertical seismo-grams of local earthquakes are highly disturbed and cannot be used for reliable measurements [118]. Horizon-tal shear-wave seismograms within the shear-wave window are much more sensitive to small changes in stress,as a result of the critical nature of the distributions of stress-aligned fluid-saturated microcracks [7,38] but, asalways, are subjected to the ±80% scatter in all observations of time-delays above small earthquakes [45].Later (unpublished) discussions with Robert Nadeau confirmed that there were small, less than 0.1 s, changesbetween shear-wave arrivals on horizontal seismograms arrivals in each cluster which were too small to sig-nificantly affect the cross-correlation coefficients of the vertical components in the comparatively large timewindows but are compatible with the time-delays reported elsewhere in this review [F17]. Thus, the seismo-grams analysed by *Nadeau et al. [100] are consistent with distributions of stress-aligned fluid-saturated micro-cracks showing temporal variations as suggested in this review. As far as we know, the horizontal seismogramsof this data set have not been specifically examined for temporal changes in shear-wave splitting.
A.2.9. *Karageorgi et al. [101]*Karageorgi et al. [101] analysed P- and S-wave recordings (1987–1995) at the 10-station Parkfield Earth-
quake Prediction Experiment network by repeated excitation of a shear-wave vibrator at up to six sites. Search-ing for evidence of temporal changes, they apparently did not specifically examine shear-wave splitting, butfound several (20 to 30 ms) anomalies in P- and S-wave travel times that appear to be associated withearthquake source behaviour, such as variations in creep rate. They attribute these changes to variations in fluidcontent and are able to exclude near-surface water table changes. Although they do not mention cracks (orshear-wave splitting), the observations are generally compatible with changes due to the stress-sensitive fluid-saturated stress-aligned microcracks advocated in this review (also see Section A2.8, and *Nadeau et al. [99]).
A.2.10. Zinke and Zoback [119] [F2,F3,F4,F7, F8,F9,F10]
Zinke and Zoback [119] examined shear-wave splitting at Station HQR above small earthquakes before andafter the 1986 Tres Pinos earthquake in the South San Francisco Bay Area, California. The Tres Pinos earth-quake on the Quien Sabe Fault was 10 km east of the Calaveras Fault. Zinke and Zoback monitor splittingfrom two swarms. One small swarm (CP) is immediately beneath Cibo Peak �2 km west of the CalaverasFault; and a larger swarm (QS) spanning the approximately parallel Quien Sabe fault system 10 km westof the Calaveras Fault. The polarisations of the CP swarm average NE–SW, approximately in the directionof the maximum horizontal compressional stress, rH, whereas polarisations at the QS swarm are approxi-mately orthogonal and fault-parallel, averaging WNW-ESE.
Conclusions of Zinke and Zoback [119] relevant to this review.
(1) The upper layer of the crust (2–4 km) appears to be isotropic, as two different but stable polarisationdirections are observed at the same station.
(2) The anisotropy around the Quien Sabe Fault appears to be controlled by the fault itself and probablycaused by high pore-fluid pressures.
(3) In contrast, the anisotropy of the CP swarm, 4 km east of the Quien Sabe Fault system, appears to becontrolled by the regional stress-field and is consistent with fluid-saturated microcracks.Comments:
(1) The two swarms, CP and QS, with different polarisations can be interpreted as the effects of uniformcrack distributions on the 3D variations in directions of propagation. Polarisations from CP events, wellwithin Band-1 directions to HQR [7], are parallel to the maximum horizontal stress direction rH, whereaspolarisations from QS at the edge of the shear-wave window, on the edge of Band-1, are approximatelyparallel to the minimum horizontal stress, rh [7]. This is analogous to the 3D polarisations variationsinterpreted by *Gao and Crampin [24] (Section B2.5) and the 3D borehole observations of*Teanby et al. [37] (Section E2.3), where the effects of the 3D variations in polarisations were recognised.However, as always with shear-wave splitting, it is difficult to exclude alternative explanations, but
Table A1Other observations of shear-wave splitting in California interpreted in terms of fluid-saturated stress-aligned microcracks
Reference Source Location and date Possible temporal changes in shear-wavesplitting time-delays.
Shih and Meyer[120]
Local earthquakes South Moat of Long ValleyCaldera (3 months, 1982).
Shih and Meyer [120] were not searching fortemporal variations and time-delays are not plottedagainst time, but observations are generallyconsistent with stress-aligned fluid-saturatedmicrocracks.
*Liu et al. [23] Local earthquakes Parkfield, San Andreas Fault(SAF) (1988–1990).
*Liu et al. [23] observed characteristic increases andprecursory decreases before a ML 4 earthquakecomparable with those seen elsewhere, consistentwith fluid-saturated stress-aligned microcracks.
Cochran et al. [121] Local earthquakes recordedby six linear 800m arraysspanning the SAF.
Aftershocks of 1999, M 7.1,Hector Mine Earthquakeduring 1 year, 1999–2000).
Cochran et al. [121] did not observe temporalvariations, but systematic changes are not expectedin aftershock sequences [F14].
706 S. Crampin, S. Peacock / Wave Motion 45 (2008) 675–722
interpreting the observations as the expected azimuthal variations of a single widespread crack distribu-tion, seems more likely than proposing the first known example of two differently polarised stress ori-ented anisotropic materials immediately next to each other. (Note that the other phenomenaimposing orthogonal changes, 90�-flips associated with high pore-fluid pressures on seismogenic faultscan probably be excluded. Such flips only occur within the immediate volume surrounding the fault,and paths from QS showing flips would need to pass immediately above the CP swarm which doesnot show flips.)
(2) Comment 1 suggests that the anisotropy around the Quien Sabe Fault is not fault controlled.(3) Comment 1 also suggests that the anisotropy is almost certainly controlled by fluid-saturated microcracks.
A.2.11. Other observations of shear-wave splitting in California
Table A1 summarises three other studies of shear-wave splitting in California interpreted in terms of fluid-saturated stress-aligned microcracks, one of which showed temporal variations. *Liu et al. [23] observed char-acteristic (stress-accumulation) increases and (crack coalescent) decreases before a M 4 earthquake at Park-field on the San Andreas Fault.
Appendix B. Temporal changes in shear-wave splitting before earthquakes in Iceland (Appendix B is summarised
in Section 6.2)
B.1. Introduction
Iceland is above an offset of the Mid-Atlantic Ridge where, probably uniquely, two transform zones runonshore. Transform zones are highly seismic, and since there is an efficient seismic network and analysis sys-tem in Iceland [85], now accessible over the Internet, Iceland is a good place for studies of shear-wave splittingabove earthquakes. Since 1996, there have been several EC-funded projects, PRENLAB 1 and 2, SMSITES,and PREPARED, during which shear-wave splitting has been continuously monitored. The monitoring stillcontinues, but intermittently. Temporal variations in shear-wave time-delays monitoring stress-accumulationbefore earthquakes were recognised in Iceland by [5,46], and in 1988, the time, magnitude, and location of a M
5 earthquake in SW Iceland was successfully stress-forecast in a tight magnitude/time window [25].As a result of some 10 years of monitoring in a region of persistent seismicity, much of our current under-
standing of shear-wave splitting above small earthquakes has come from analysis of shear-wave splittingrecorded in Iceland. There are sufficient observations elsewhere to show that the Iceland results commonlyapply worldwide (Appendices A, C, D and E). These studies pioneered the current understanding of shear-wave splitting as the result of propagation through distributions of stress-aligned fluid-saturated microcracksso closely-spaced that they are critical-systems verging on fracture-criticality, fracturing, and earthquakes[10,11,41,42]. Many aspects of this study are summarised in Table 2 of the main text, and will not be repeatedhere. Only the more significant items are listed below.
S. Crampin, S. Peacock / Wave Motion 45 (2008) 675–722 707
B.2. Observations of shear-wave splitting
B.2.1. Menke et al. [55] [R1]
Menke et al. [55] were probably the first to report shear-wave splitting in SW Iceland. The splitting wasattributed to vertical stress-aligned cracks. The results and conclusions are generally compatible with theobservations of *Volti and Crampin [5,46] and others in SW Iceland suggesting the cause is stress-alignedmicrocracks. The possibility of temporal variations was not examined.
B.2.2. *Crampin et al. [25] [R1,R2,R3, R6]
The first successful stress-forecast earthquake. In October 1998, *Crampin et al. [25] recognised during the4-year study reported in Section B2.3, below, that shear-wave time-delays were increasing in Band-1 directionsat stations BJA and SAU in SW Iceland. The rate of increase was similar to that before a M 5.1 earthquake some 6months earlier near BJA [5]. Based on the estimated duration of the increase and approach to levels of fracture-criticality, an email alert was sent to the Iceland Meteorological Office (IMO) on 10th November, 1998, statingthat ‘‘. . . an event could any time between now (M P 5) and end of February (M P 6).” Following an earlier emailon 27th October, 1998, Ragnar Stefansson (IMO) had suggested that the increase might be linked to the contin-uing seismic activity associated with the previous M 5.1 earthquake. Three days later, on 13th November IMOreported ‘‘. . . there was a magnitude 5 earthquake just near to BJA (preliminary epicentre 2 km west of BJA) this
morning 10 38 GMT”, fulfilling the forecast in a narrow time/magnitude window [25]. We suggest that this is thefirst scientifically, as opposed to precursory or statistically, predicted earthquake, and provides direct proof thatvariations of shear-wave splitting can forecast earthquakes. Logarithms of the duration of the increases areapproximately proportional (self-similar) to the magnitudes of the eventual earthquakes.
Note that Seher and Main [60] commented adversely on the statistics underlying the forecast. *Crampinet al. [61], in response, demonstrated that the criticisms of Seher and Main were invalid for analysing isolatedincreases superimposed on a continuous time series (see Item 5, Table 3).
Note that the successful stress-forecast [25] has not been repeated because the severe restrictions on appropri-ate source–geophone-earthquake geometry are difficult to meet. (The appropriate geometry requires sufficientshear-wave ray paths in Band-1 directions with in the shear-wave window.) The only other suitable earthquakewas not stress-forecast because of seismic quiescence at a critical time so that there were insufficient shear-wavesource events and the stress-accumulation was not recognised [30] (see discussion in Section B2.6, below).
B.2.3. *Volti and Crampin [5,46] [R1,R2, R3,R6]*Volti and Crampin [5,46] reported a 4-year study of shear-wave splitting in Iceland. This study and its asso-
ciated papers established much of the current understanding of shear-wave splitting. Changes of shear-wavetime-delays were observed before five earthquakes (the last of which was the successfully stress-forecast earth-quake, see previous section). These five earthquakes occurred during a 2-year approximately linear decrease innormalised time-delays of �2 ms/km/year following the 1996, Gjalp eruption, on the Vatnajokull Ice Cap,during which extraneous magma-induced disturbances were minimal (Section D2.1). Since that time, minormagmatic activity has considerably disturbed the typical self-similar behaviour of time-delays before earth-quakes and no further earthquakes have been stress-forecast in real-time, but see Section B2.6, below.
B.2.4. *Gao and Crampin [6] [R1, R3,R6]*Gao and Crampin [6] recognised that, at the ends of the increases of time-delays in Band-1 directions inter-
preted as monitoring stress-accumulation before larger earthquakes, there are also decreases in time-delaysimmediately before impending earthquakes. These occur in all cases where there were sufficient source databefore the event. Such a decrease was first recognised in the Enola Swarm, Arkansas by *Booth et al. [22].*Gao and Crampin initially interpreted these decreases as some form of (unspecified) stress relaxation. How-ever, it is now recognised [24,30,44,45] that the decrease is the result of coalescence of microcracks into largercracks as the eventual fault-plane is identified during the stress-accumulation. Fig. 6 is a key figure from [6]showing the consistency of the increases and decreases of time-delays before larger earthquakes. Thelogarithms of the durations of both stress-accumulation increases and crack coalescence decreases are self-sim-
708 S. Crampin, S. Peacock / Wave Motion 45 (2008) 675–722
ilar and separately proportional to the earthquake magnitudes (Fig. 7). Note that this paper [6] is included inthis Appendix on Iceland as three of the six earthquakes are in Iceland.
B.2.5. *Gao and Crampin [24] [R1, R2, R3, R5, R6]*Gao and Crampin [24] showed that spatial changes in the location of shear-wave source earthquakes, show-
ing temporal variations before a M 4.9 earthquake in N Iceland, could cause anomalies in shear-wave polar-isations, which are not caused by high-pressure-generated 90�-flips. For thin parallel stress-aligned fluid-saturated microcracks the polarisations of the faster split shear-waves are parallel to the direction of maximumhorizontal stress in a ±�30�-wide band across the centre of the shear-wave window [7]. Outside this band, butstill within the shear-wave window, the polarisations are approximately orthogonal to the stress direction.Gao and Crampin show that the spatial variations in locations of the source earthquakes are compatible withthis interpretation. Zinke and Zoback [119] (see our re-interpretation, Section A2.10) and *Teanby et al. [37](Section E2.3) display similar ray path-dependent variations in polarisation.
B.2.6. *Wu et al. [30] [R1, R2, R3, R5, R6]*Wu et al. [30] re-examined shear-wave splitting before a pair (4 days apart) of Ms �6.6 earthquakes in June
2001 in SW Iceland. These were the largest earthquakes in Iceland for several decades and had not been stress-forecast by variations in shear-wave splitting. This was because there was a 2-month quiescence of the sourceevents at the beginning of the (now identified) 6-month stress-accumulation. Without shear-wave source earth-quakes the increase was not recognised. *Wu et al. [30] showed that quiescence before this earthquake wasextensive over most of Iceland. In order to examine this earthquake in more detail the Iceland MeteorologicalOffice extended the seismic catalogue (and Internet seismograms) to include earthquakes down to magnitudeM 0 and below. Using this extended data set, *Wu et al. [30] showed that the Ms �6.6 earthquakes displayedthe characteristic stress-accumulation increase and the crack coalescence decrease typical of earthquakesworldwide. *Wu et al. also showed that durations of both the increase and decrease were (separately) self-sim-ilar with those of the other Iceland earthquakes (Fig. 7).
Appendix C. Temporal changes in shear-wave splitting before earthquakes elsewhere (Appendix C is summarised
in Section 6.3)
C.1. Introduction
Apart from California (Appendix A) and Iceland (Appendix B), and to a lesser extent Italy (C2.4) and NewZealand (C2.7 and C2.8), below, the Band-1 constraints on observing temporal changes, studies of shear-wavesplitting elsewhere are met only for chance coincidence of swarms of earthquakes, seismic stations within theshear-wave window, and suitable larger earthquakes nearby. These larger earthquakes were sometimes withinthe swarm sequence itself and sometimes nearby.
C.2. Observations of shear-wave splitting
C.2.1. Arkansas, USA: *Booth et al. [22] [R1, R2,R3]
The first observation of precursory (crack coalescence) decreases: *Booth et al. [22] observed shear-wavesplitting at a temporary network operating for 12 days above a swarm of small earthquakes near Enola,Arkansas. *Booth et al. identified an increase in time-delays in Band-1 of the shear-wave window, on a sparsedata set, 4 days before a magnitude ML 3.8 swarm earthquake interpreted as monitoring stress-accumulation.*Booth et al. [22] also identified a precursory decrease starting 12 h before the earthquake. This was the firsttime a decrease indicating some form of precursory stress relaxation had been recognised. (The precursorydecrease before the North Palm Springs Earthquake, *Peacock et al. [27], was not recognised until *Gaoand Crampin [6] identified precursory decreases before five other earthquakes, see Section B2.4, above.) Thesedecreases are now interpreted as the effects of crack coalescence as micro- and macro-cracks converge on theimpending fault break. Such decreases have now been identified before some nine earthquakes worldwide(Table 1b). The logarithms of the durations of both increases representing stress-accumulation, and decreases
S. Crampin, S. Peacock / Wave Motion 45 (2008) 675–722 709
representing precursory crack coalescence, are self-similar and approximately proportional to the earthquakemagnitudes (Fig. 7).
C.2.2. China: *Gao et al. [21]; *Gao et al. [6,26] [R1,R2,R3]There have been two observations of temporal changes in shear-wave splitting before earthquakes in
China. *Gao et al. [21] observed temporal changes before a magnitude ML 3.6 earthquake above a swarmof small earthquakes near Dongfang, Hainan Island, China, but the data are sparse. The logarithm ofthe duration of the stress- accumulation increase has a similar self-similar relationship with magnitudeas those observed elsewhere. The data were too sparse to indicate a consistent decrease. *Gao et al.[6,26], in another sparse data set, observed temporal increase in time-delays before a MS 5.9 earthquakein Shidan, Yunnan, China and a precursory decrease before a MS 5.3 earthquake nearby. Both increaseand decrease have similar self-similarity relationships with magnitude to those seen elsewhere. In bothcases, observations and interpretations are consistent with the fluid-saturated microcracks reported in thisreview.
C.2.3. Hawaii: Munson et al. [122] [F2,F5,F6, F7,F8,F9,F10]
Munson et al. [122] examined shear-wave splitting recorded at a permanent Station AIN before and afterthe 1983 ML 6.6 Kaoiki Earthquake in Southern Hawaii and also later at four temporary arrays. The tempo-rary arrays were deployed within 30 km of the earthquake epicentre for several months in 1990, some 7 yearsafter the Kaoiki Earthquake.
Conclusions of Munson et al. [122] relevant to this review.
(1) The observed shear-wave polarisations are generally consistent with information on stress orientationand indicate crack-induced anisotropy. However, although the polarisations are generally consistentwithin each array, there are ‘‘sharp” variations in polarisations at different arrays, which [122] interpretas indicating shallow anisotropy.
(2) A weak correlation of time-delays with epicentral distance and focal depth also suggest shallow anisot-ropy with shear-wave velocity anisotropy exceeding 10%. This indicates a highly fractured upper crustsuggesting the possibility of strong near-surface structural anisotropy.
(3) There was no evidence reported for temporal variations in delay-times before and after the main shock.
Comments:
(1) Shear-wave polarisations are extremely sensitive to surface topography. The free-surface beneath thetemporary arrays on Hawaii has highly irregular topography, as demonstrated by ‘‘gulch” in thenames of two of the four arrays, and the polarisations necessarily display topography-induced scat-ter. Shear-wave polarisations, and the effective shear-wave window, are highly dependent on the inci-dence angle to the free-surface. The overall topographic slope of �1/8 (�7�) at the arrays on the sideof the volcano, as well as the local irregularities, will modify the edge of the effective shear-wavewindow and disturb polarisations. The overall directions of polarisation of three of the arrays pointare approximately up-slope towards Mauna Loa, the highest volcano in Southern Hawaii. This sug-gests: that either polarisations are controlled by the topographic slope rather than the subsurfaceanisotropy [F6]; or that maximal horizontal stress radiates from the summit; or most likely a com-bination of both phenomena. The exception is Bird Park Array, which is within 5 km of the largecaldera of the highly active Kilauea volcano, where local movement of magma is expected to modifythe stress-field, modify microcrack orientations, and hence modify shear-wave polarisations. Thesevarious anomalies suggest that polarisations are dominated by topographic irregularities rather thanstress orientations.
(2) The known ±80% scatter in time-delays, typically observed above small earthquakes due to 90�-flips inshear-wave polarisations [45], is so large that correlation of time-delays with epicentral distances or focaldepths are typically weak or hidden as in Hawaii [F10]. Consequently, strong shallow anisotropy cannotnecessarily be inferred.

710 S. Crampin, S. Peacock / Wave Motion 45 (2008) 675–722
(3) Observations of temporal variations in time-delays require stringent source-to-recorder geometry. Onlytime-delays in Band-1 directions of the shear-wave window are sensitive to the low-level changes ofstress accumulation before earthquakes [7]. Time-delays were recorded at Station AIN for 230 daysbefore and 10 days after the main shock. Band-1 and Band-2 data points are not identified, butthe equal-area polar projections indicate that there are very few, perhaps 6–10 data points (5–10%of the total), with Band-1 directions, and temporal variations in time-delays would not be expectedin substantially Band-2 directions which do not typically display temporal variations for low-levelchanges of stress [7].
We suggest that the interpretations of Munson et al. [122] are subject to several fallacies particularly[F2,F5, F6,F7,F8,F9,F10] in Table 4. Again the shear-wave splitting observed by Munson et al. appearsto be typical of that seen elsewhere, whose behaviour can be comprehensively interpreted as the result of com-pliant stress-aligned fluid-saturated microcracks.
C.2.4. Italy: *Del Pezzo et al. [104] [R1, R2,R3,R6]*Del Pezzo et al. [104] monitored shear-wave splitting at a network of seismic stations above a swarm of
small earthquakes 2–4 km lower than the summit crater of Mt. Vesuvius. Both the surface and internal topog-raphies are irregular. The two stations, BKN and BKE, nearest to the summit are on an approximately hor-izontal surface within the larger ancient caldera (Mt. Somma) and earthquakes within the shear-wave windowdisplay fast split shear-wave polarisations approximately in line with the summit cone suggesting maximumstress radiating from the central volcano pile. Time-delays, normalised to s/km, in Band-1 directions at thenearest station, BKN, 1 km to the north of the summit crater, display a �86-day increase (our interpretation)and precursory �10-day decrease, before a larger magnitude ML 3.6 earthquake (October 1999), which wasthe largest earthquake within the Vesuvius region since 1944. *Del Pezzo et al. [104] recognise that theshear-wave splitting is monitoring crack deformation.
The Band-1 time-delays at the next-nearest station, BKE, 1.5 km to the east of the summit, are much morescattered. They show an irregular less-pronounced increase, no precursory decrease, and another more minorincrease �30 days after the 3.6 earthquake.
Note that *Del Pezzo et al. [104] also report temporal changes in the b-value of the Gutenberg–Richter rela-tionship and the coda decay rate for this ML 3.6 earthquake.
Comments. The increase in Band-1 time-delays at BKN, interpreted as stress-accumulation, and thedecrease, interpreted as crack coalescence, are typical of those observed elsewhere as reported throughoutthis review and are compatible with shear-wave splitting monitoring fluid-saturated microcrack geometry.However, the values of the normalised time-delays of up to �40 ms/km are much larger than are usuallyobserved elsewhere. Larger values, up to �20 ms/km are found in Iceland, where they are attributed theeffects of the generally high heat-flow [5,46]. The size of time-delays depends on many parameters includ-ing: Poisson’s ratio; P- and S-wave velocities of the rock matrix; and temperature [83]. High heat-flow isbelieved to be the cause of high values on Vesuvius. The reason for the exceptionally large duration of�86 days before a small ML 3.6 earthquake again is not understood. It is probably related to the excep-tional stability of Vesuvius, which has minimal seismic and volcanic activity. The durations of theincreases in time-delays are thought to be related to the rate of stress/strain increase in the surroundingarea, and there is no known reason why the rates should be similar for earthquakes and volcanoes in dif-ferent regions.
Note that only 18-point moving averages of time-delays are plotted. This leads to simplification of varia-tions with time, but hides the ±80% scatter which appears to be a diagnostic and characteristic feature of time-delays above all small earthquakes [10,45]. 18-point moving averages could also hide significant variations,such as the duration of increasing stress, if the variations are only represented by a few data points. Thiscan be compared to plotting a least-squares line without plotting the data points: valuable inferences maybe hidden.
Note also that the plots of temporal changes of time-delays before the ML 3.6 earthquake on Vesuvius of*Del Pezzo et al. [104] are almost identical to the variations seen before a flank eruption at Mt. Etna, Sicily by*Bianco et al. [32], discussed in Section D2.3 of Appendix D.
S. Crampin, S. Peacock / Wave Motion 45 (2008) 675–722 711
C.2.5. Japan: Kaneshima [123] [R1,R3]; Volti et al. [124]; *Saiga et al. [105]; *Hiramatsu et al. [125]
Kaneshima [123], in 1990, in an early review of extensive observations of shear-wave splitting reportedshear-wave splitting in Honshu and Shikoku, Japan. Kaneshima did not seek nor report evidence of temporalchanges. Volti et al. [124] identified sea-mounts in the Nankai Trough by their effect on shear-wave polarisa-tions but did not seek temporal changes. Two papers studied temporal changes associated with the 1997, MW
5.7, Aichi-ken Tobu earthquake beneath the Tokai region of Honshu, Japan [105,125].*Saiga et al. [105] monitored shear-wave splitting above small earthquakes for �11 years before and �2
years after Aichi-ken Tobu earthquake. The shear-wave polarisations are consistent with the regionalstress-field from earthquake fault-plane mechanisms. *Saiga et al. did not report temporal changes beforethe earthquake but identified increases in time-delays (in seconds) at the time of the MW 5.7 earthquake inboth Band-1 and Band-2 directions for source earthquakes in both the crust (depth <25 km) and the subduct-ing slab (depth P25 km). A neighbouring station INU showed shear-wave splitting but did not show temporalvariations at the time of the earthquake. Both stations showed the typical ±80% scatter about the mean. Thelevel of shear-wave velocity anisotropy at 0.6% was very low, and *Saiga et al. concluded that the Aichi-kenTobu earthquake was too deep at 39 km and the velocity anisotropy too small to show precursory changes intime-delays as identified in [27–29].
*Hiramatsu et al. [125], continuing the analysis of *Saiga et al., studied the increase of (normalised) time-delays following the Aichi-ken Tobu earthquake. The time-delays for both crustal and slab source earthquakespeaked in value and in both cases decreased to the ambient level over about 18 months. Hiramatsu et al. inter-preted this as indicating crack healing similar to that reported in laboratory experiments.
Comments: *Saiga et al. [105] did not report changes in time-delays before the Aichi-ken Tobu earthquake,however, Fig. 7 of that paper shows five-point moving averages of time-delays (in seconds) at STN before theevent where both crustal and slab source events show increases from the average ambient level. For both crus-tal and slab sources, the time-delays approximately double in value over about 18 months before the event.Thus the time-delays show similar stress-accumulation increases with rates of increase as those observed else-where. The data is sparse and it is difficult to access the exact duration of the increase. Crack coalescentdecreases are not visible.
*Hiramatsu et al. [125] did not separate Band-1 and Band-2 directions, and this is the first time that peaks oftime-delays have been identified after earthquake. It may be the shear-wave splitting behaves differently in sub-ducting slabs. The combined directions do not show the stress-accumulation increase of *Saiga et al. [105].
C.2.6. Kamchatka: Krasnova and Chesnokov [126]; Luneva and Lee [127] [R1,F6]
Krasnova and Chesnokov [126] monitor shear-wave splitting at ten stations near Petropavlovsk, Kam-chatka, for shear-wave arrivals from 35- to 55-km deep earthquakes up to 100 km offshore in the Gulf of Ava-cha. One station, PET, shows orthogonal changes in rose-diagrams of shear-wave polarisations before andafter an offshore M 4.5 earthquake. Other stations show minor variations in shear-wave polarisations, butnot orthogonal changes. Krasnova and Chesnokov [126] suggest these changes are temporal variations inshear-wave splitting.
Comments. Many of the earthquakes are outside the straight-line shear-wave window (see Item 2, Section2.2) for some or all of the stations. For shear-wave propagation in distributions of thin vertical cracks, thefaster split shear-wave is theoretically polarised parallel to the direction of maximum horizontal stress in a typ-ically ±40�-wide band across the centre of a polar projection [7] (allowing for refraction through low-velocitylayers). This was observed by *Teanby et al. [37], *Gao and Crampin [24], and in our interpretation of Zinkeand Zoback [119]. For arrivals outside this band, the shear-wave polarisations are approximately perpendic-ular to the polarisations within the band. Epicentres of the earthquakes in the [126] data set have different dis-tributions before and after the M 4.5 event, and the changes in polarisation are almost certainly caused byspatial rather than temporal variations, as demonstrated by *Gao and Crampin [24]. If the [126] data set doesshow temporal changes, it is the only occasion that changes in polarisations have been observed to occur dur-ing earthquake preparation (as opposed to 90�-flips before volcanic eruptions [32,33]), and this seems unlikely.All other examples of temporal changes before earthquakes only show changes in time-delays.
Luneva and Lee [127] also monitor shear-wave splitting at Station PET using shear-waves from 40- to 184-km deep earthquakes off-shore at less than 100 km from PET and are within the shear-wave window. They
712 S. Crampin, S. Peacock / Wave Motion 45 (2008) 675–722
divide their shear-wave source earthquakes into two sets above and below 80-km depth. The normalised time-delay points are sparse: 19 earthquakes above and 32 below 80 km, set in our Band-1 (their Band-2) directionsin 3 years. Their three-point moving averages of statistical interpolation show variations with time that areinterpreted as indicating temporal changes in shear-wave splitting.
Comments. The association of variations with large earthquakes is weak and suspect, because the data aresparse and the ±80% scatter always observed above earthquakes [45] is ignored. Hence temporal variations inshear-wave splitting in Kamchatka are unproven in both [126] and [127] data sets.
C.2.7. New Zealand I [R1,F2,F7, F8,F9,F10]
Shear-wave splitting in the Wellington Peninsula. There have been several studies of shear-wave splitting inthe crust in New Zealand (*Gledhill [54,102,128], Audoine et al. [129,130], amongst others), but temporal vari-ations were not identified and were specifically denied. *Gledhill [54] records nearly-parallel shear-wave polar-isations above 15- to 60-km deep earthquakes at a temporary deployment of seismic stations on thetopographically-irregular Wellington Peninsula, New Zealand. The Wellington Peninsula has irregular topog-raphy varying in height from sea level to 500 m.
*Gledhill [54] conclusions relevant to this review:
(1) Large station-to-station changes in polarisations are observed, even for stations as close as 3.5 km, whichis interpreted as indicating anisotropy confined to the uppermost few km of the crust.
(2) Similar polarisations (and time-delays) are seen for direct arrivals from an earthquake at 34.8-km depthas for P-to-S conversions at the plate boundary implying consistent shear-wave anisotropy throughoutthe crust.
(3) Gledhill finds no evidence for temporal changes.
Comments:
(1) The variations in polarisations are almost certainly due to the highly irregular surface topographyaround each station disturbing the effective shear-wave window [118].
(2) The observed consistency of splitting throughout the crust is an important indication of the depth-rangeof crack-induced shear-wave splitting. See discussion in Section 7.2 of the main text.
(3) *Gledhill [54] plots the variation of time-delays with time duration at four stations but does notidentify temporal variations in the typical ±80% scatter. However, the plots at three of the stationsshow initially high values of time-delays within the first 45 days of the deployment, a drop in val-ues, and all four stations show an average increase from day 45 for the whole of the remaining�160 days duration of the network. *Gledhill [102] continuing the study of shear-wave splittingin the Wellington Peninsula lists large earthquakes nearby. The two largest events associated withthe recording period of the *Gledhill [54] deployment were a M 5.1, 151-km deep, earthquake at157 km epicentral distance immediately after the drop in time-delays at about day 45 in the plots of*Gledhill [54], and a M 6, 122-km deep, earthquake at 135 km distance some 30 days after the endof the recording period at day 164. Thus it is possible that the increase in time-delays monitors thestress-accumulation before the M 6 earthquake. Certainly, evidence elsewhere suggests that a M 6earthquake would be expected to modify shear-wave splitting at such distances [5,24,46], and the115 days duration of the increase is compatible with the self-similarity seen elsewhere [24,30]. Plotsat three of the stations also show evidence for precursory decreases monitoring crack coalescencebefore the M 5.1 event. Thus it appears that *Gledhill [54] presents plots showing examples of tem-poral variations in shear-wave splitting before earthquakes compatible with those observedelsewhere.
Note that the plots in *Gledhill [54] cannot be interpreted directly as the plot includes arrivals within thewhole of the shear-wave window. Most of the data points appear to be in Band-2 directions which are typi-cally not sensitive to small changes of stress, and only a small proportion of the data points are Band-1 direc-tions, which are sensitive to stress-accumulation [7].

S. Crampin, S. Peacock / Wave Motion 45 (2008) 675–722 713
Note also that shear-wave polarisations at the three stations showing temporal variations are approxi-mately WSW-ENE close to the orientation of the pervasive faults, SW-NE, throughout the Peninsula, whereaspolarisations at the other station are approximately orthogonal at NNW-SSE in the direction of the ambientregional stress-field. These temporal variations in time-delays for both fault-parallel and stress-parallel polar-isations confirm that the shear-wave splitting is caused by microcracks, as at KNW, California [27], despite thereasons for the changes in polarisations not being wholly understood.
C.2.8. New Zealand II [R1, F1,F2,F7,F8,F9, F10]
Shear-wave splitting in the Marlborough Region. Balfour et al. [103] is a comprehensive study ofstress and shear-wave splitting in the Marlborough Region of South Island, New Zealand, some�50 km across the Cook Straight from the Wellington Peninsula, North Island [54]. Balfour et al.make very consistent stress-inversions of fault-plane mechanism, which lead to a WNW-ESE maximumhorizontal stress making an angle of about 60� to the dominant WSE-ENE faulting throughout theMarlborough Region. They analyse shear-wave splitting for earthquakes less than 25 km in depth.There is a wide scatter in shear-wave polarisations but the average polarisation is approximatelyfault-parallel at about 60� to the stress direction. Balfour et al. do not search for temporal variationsin time-delays.
Conclusions of Balfour et al. [103] relevant to this review:
(1) Since the stress is �60� to the average fault strike, they conclude that the faults are weak due to a lowcoefficient of friction or a high pore-fluid pressure.
(2) The spatial variations in shear-wave polarisations suggest that the anisotropy is in the uppermost 15 kmof the crust.
(3) The shear-wave polarisations are �60� to the stress-field and are thought to be not induced by crackgeometry but ‘‘related predominately to the geological structure and not to the ambient stress-field”
(and crack geometry).
Comments:
(1) Weak faults due to high pore-fluid pressures agrees with the interpretation and modelling ofshear-wave splitting time-delays by Crampin et al. [44,45] and many other studies throughout thisreview.
(2) The Marlborough Region is highly irregular topographically with mountains over 2000 m and manyslopes of 10� to 20�. The sensitivity of shear-wave polarisations to irregular topography is almostcertainly the cause of the observed scatter. A large scatter, in particularly of shear-wave polarisa-tions, is one of the inescapable penalties of recording shear-wave splitting in mountainous areas[5,45,46,118].
(3) The geological structure-parallel polarisations and stress-parallel polarisations in the MarlboroughRegion are broadly similar to the polarisations in the neighbouring Wellington Peninsula of *Gledhill[54], see previous section, which we suggest shows evidence of temporal changes in time-delays thatare necessarily caused by crack anisotropy. The shear-wave polarisations in the shear-wave windowdirectly imply TIH-anisotropy, or a minor variation thereof, and strongly suggests stress-alignedmicrocracks. Other anisotropic symmetries may lead to very different polarisations. Polarisationsin the Marlborough Region are generally restricted to parallel rose-diagrams which are strongly diag-nostic of distributions of parallel vertical cracks [R1]. (The principal exceptions are Stations GOHM2and ALIE5 which display a wide range of polarisations, typical of stations sited near mountainouspeaks where scatter in polarisations is expected due to the interaction of shear-waves with surfacetopography [5,24].)
Note the nearly-parallel polarisations and corresponding nearly-parallel rose-diagrams for ray paths overthe whole range of the shear-wave window. It is highly unlikely that geological configurations other thanstress-aligned microcracks could lead to the observed polarisations.
714 S. Crampin, S. Peacock / Wave Motion 45 (2008) 675–722
Appendix D. Temporal changes in shear-wave before volcanic eruptions (Appendix D is summarised in Section
6.4.)
D.1. Introduction
Changes in Band-1 time-delays are believed to monitor low-level changes of stress [7,43]. Such stresschanges are expected to occur before earthquakes (Appendices A, B, C), but also before other changes ofstress during other tectonic activity such as preparations for volcanic eruptions. This appendix presents evi-dence for temporal changes in shear-wave splitting before eruptions at three volcanoes: a major eruption ofGjalp. beneath the Vatnajokull Icefield, Iceland; and more minor volcanic episodes on Mt. Ruapehu, NewZealand, and Mt. Etna, Sicily.
D.2. Temporal changes before volcanic eruptions
D.2.1. Iceland [R1, R2,R3,R6]*Volti and Crampin [5] observed temporal increases in Band-1 time-delays for 5 months at �240-km dis-
tance in directions N, SW, and WSW before the 1996 Gjalp Eruption on the Vatnajokull Icefield, whichwas the largest eruption in Iceland for several decades. The eruption opened a 10 km, approximately NS fis-sure. The increasing time-delays were interpreted as indicating the accumulation of stress as the ascendingmagma magma fractures the upper crustal surface layers (presumed to be equivalent to hydraulic fracturingin the oil industry).
The pattern of increase in time-delays was typical of the increases now seen before many earthquakes inIceland and elsewhere, except that time-delays before earthquakes characteristically decrease immediatelystress is released at the time of the earthquake or (when data is available) in a crack coalescence stress relax-ation immediately before the earthquake. However, the increase in normalised time-delays at Gjalp does notdecrease at the time of the eruption but gradually declines at about 2 ms/km/year over the following 2 yearsvisible in both Band-1 and Band-2 directions at four widely separated Stations BJA, GRI, KRI, and SAU inIceland. The expanded magma-filled fracture (dyke) is a permanent feature and the 2-year decrease in time-delays following the eruption is interpreted as the Mid-Atlantic Ridge adjusting to the movement of Icelandimposed by the massive dyke injection.
Iceland is highly active tectonically. Following Gjalp, there have been several changes of time-delayswhich appear to be associated with minor volcanic episodes but are difficult to evaluate, particularly asthe magnitude of magmatic activity is difficult to assess and quantify. This magmatic activity also makesit more difficult to interpret the increases before earthquakes. The 2-year decrease in time-delays wasapproximately linear, and there appeared to be no other significant magmatic disturbances during thistime, which was the interval when changes before five earthquakes, some small, were recognised (Table1) [5,25].
D.2.2. New Zealand [R1,R2,R3, R5,R6] [F2,F5, F12]*Miller and Savage [33] report orthogonal changes in shear-wave polarisations during an eruption of Mt.
Ruapehu, New Zealand, where the shear-waves are from earthquakes deeper than 50 km. Their conclusionsare that increased magmatic pressure in injected vertical dykes, striking parallel to the regional stress direction,caused 90�-flips in shear-wave polarisations which are reversed, when the eruption releases some of the pres-sure. Such shear-wave polarisations orthogonal to regional stress are claimed to be a possible indicator ofimpulsive andesite eruptions, which are otherwise difficult to predict.
Comments. These changes in polarisation appear to be the magmatic equivalent of the 90�-flipsobserved and modelled when there are critically-high hydraulic pressures [35,44,45]. In a later paper,*Gerst and Savage [47] prefer to argue for magmatic pressure-induced reorientation of large fracturesas the cause of the orthogonal changes in shear-wave polarisations, rather than the microcrack 90�-flipmodel. Since effective shear-wave splitting requires wavelengths greater than crack dimensions, distribu-tions of large fractures are unlikely to yield effective shear-wave splitting from high-frequency crustal
S. Crampin, S. Peacock / Wave Motion 45 (2008) 675–722 715
earthquakes. Fixed orientations, inducing sufficient 90� changes in orientation to alter shear-wave polari-sations also seems unlikely.
Note that the changes in polarisation in the 90�-flip model of Crampin and Zatsepin [42] are the result offluid pressures modifying the directions of maximum horizontal stress in a (usually) small volume surroundingthe source of the pressure by critically-high-pressure fluids on the impending fault. This suggests that the vol-ume will also display fault-plane mechanisms with anomalous stress directions as well as 90�-flips in shear-wave splitting. Such 90�-flips as crack reorientations above 50-km deep earthquakes as observed beneathMt. Ruapehu also supports the suggestion of Crampin [111] that shear-wave splitting in the upper-mantleis, at least partially, caused by crack-induced anisotropy, where the cracks are films of hydrated melt aroundpartially melted grains.
D.2.3. Italy [R1, R2,R3,R5, R6]*Bianco et al. [32] monitored shear-wave splitting recorded by two stations of a permanent seismic network,
above a swarm of earthquakes on Mt. Etna, Sicily, before and after a flank fissure eruption. One station, MNTwas very close to the fissure and was damaged by the erupted lava. The other station, ESP, was further fromthe fissure but still within Band-1 directions in the shear-wave window above an earthquake swarm below thefissure. Note that, as with *Del Pezzo et al. [104], only 18-point moving averages of time-delays are plotted,which lead to simplified more-easily interpretable variations but hide the characteristic ±80% scatter intime-delays.
There are changes in time-delays at MNT and ESP, and changes in shear-wave polarisations at MNT. Theplot of time-delays shows the typical characteristic behaviour: a long-term increase at both stations starting‘‘at least 20 days before the eruption” and a decrease ‘‘starting 2–3 days before” the eruption. These are similarto those observed before earthquakes elsewhere [5,6]. (Our preferred interpretation of the plots suggests thatthe increase starts �66 days before the eruption and the decrease some 5 days before, however the 18-pointmoving average tends to hide these details.)
The polarisations of the faster split shear-wave at ESP showed little variation. However, the polarisations atMNT show several abrupt 90� changes interpreted as the effects of 90�-flips in crack orientations caused byhigh fluid pressure, as in the critically-high pore-fluid pressures on all seismically-active faults [42–44]. Themost persistent 90�-flip starts �66 days before the eruption when the time-delays begin to increase, andreverses (to the initial polarisation oriented towards the volcanic cone) at the time of the eruption, just beforeMNT was damaged by the eruption.
Comments. 90�-flips can be interpreted as reorientations of fluid-saturated microcracks in the immediatevicinity of the dyke injection as the pressures approach levels inducing fracture-criticality when the magmafractures the surface layers as the eruption begins. This is similar to the 90�-flips seen before the eruptionof Mt. Ruapehu by *Miller and Savage [33], see previous section. The flips are also seen above major faultscutting the crust [40] and can be modelled as the cause of the ±80% scatter in time-delays observed aboveall seismically-active faults [45].
These observations are compatible with the anisotropy-induced by stress-aligned fluid-saturated micro-cracks. One interesting feature of these observations, is that the variation of time-delays with time beforethe eruption is almost identical with variations before the M 3.6 earthquake in the swarm of earthquakeson Mt. Vesuvius (BKN in Fig. 9 of *Del Pezzo et al. [104], see Section C2.4). This suggests two phenomena:(1) shear-wave splitting monitors the effects of stress on the fluid-saturated microcracks in almost all rocksindependent of the source of the stress change; and (2) the strong similarity of both the accumulation ofstress and the suggested crack coalescence suggests that the stress regimes in the source zones of earth-quakes and, at least some, volcanic eruptions are similar. However, a major difference is that followingan earthquake, time-delays (and inferred crack geometries) abruptly return to the background values asstress is released by fault slip, whereas following eruptions time-delays do not immediately return to back-ground levels, but relax more slowly as the crust responds to the injected magma. Following this eruption,the time-delays at ESP on Mt. Etna [32] returned to the background level in a two-stage process over �50days. Following the much larger Gjalp Eruption in Iceland, the return to the background level took 2 years[5] (Section D2.1, above).
716 S. Crampin, S. Peacock / Wave Motion 45 (2008) 675–722
Appendix E. Other observations of temporal variations in shear-wave splitting (Appendix E is summarised in
Section 6.5.)
E.1. Introduction
When small earthquakes are used as a source of shear-waves, the source is poorly understood and uncon-trollable. Consequently, controlled source experiments are valuable for monitoring changes in shear-wavesplitting, and are also free of the anomalous ±80% scatter in time-delays caused by 90�-flips in shear-wavepolarisations as a result of the critically-high pore-fluid pressures on seismically-active faults [44,45]. If exper-iments are sufficiently below the surface in bore holes, the observations are also free of the constraints imposedby the shear-wave window at a free-surface, although they may be disturbed by the usually more minor effectsof the internal shear-wave windows at each interface [82].
E.2. Observations of shear-wave splitting
E.2.1. Fluid-injection I: *Angerer et al. [35] [R1,R2,R4, R5]*Angerer et al. [35] used APE to model the time-lapse response of a fractured carbonate reservoir to both
high-pressure and low-pressure CO2-injections as imaged by reflection surveys of an areal array of a 25-m gridof three-component geophones recording a similar grid of shear-wave vibrators. The dominant seismic effectswere on the arrival times and time-delays of the split shear-waves [34]. *Angerer et al. [45] selected an initialmodel with a distribution of cracks to match the initial observations of shear-wave splitting with synthetic seis-mograms calculated by ANISEIS [131,132], a commercially-available programme for calculating full-wavesynthetic seismograms propagating through a plane-layered multi-layered anisotropic halfspace. *Angereret al. [35] then inserted the exact values of the injected pressures into APE, recalculated the modified reservoirstructure, and recalculated the synthetic seismograms with the modified parameters, obtaining an almost exactmatch of observed to calculated shear-wave splitting for both high- and low-pressure injections. This showsthat APE appears to be a satisfactory model of cracked fluid-rock deformation, and *Angerer et al. [35] isthe best in situ calibration of APE-modelling to-date.
E.2.2. Fluid-injection II: *Bokelmann and Harjes [36] [R1,R2, R3,F9,F12] [F9,F12]*Bokelmann and Harjes [36] report the effects on shear waves of fluid injection at 9-km depth in the KTB
deep drilling site [133] in SE Germany. *Bokelmann and Harjes observed shear-wave splitting from injection-induced events at a borehole recorder at 4000-m depth in a pilot well offset 190 m from the KTB well.
Conclusions of *Bokelmann and Harjes [36]relevant to this review:
(1) There are temporal variations in shear-wave splitting from injection-induced events. In particular, theinitial �1% shear-wave splitting decreases by 2.5% in the �12 h following the injection with the biggestdecrease occurring within 2 h. These measurements appear to be very accurate.
(2) No direct interpretation of the decrease is proposed but it is suggested that the decrease is associatedwith stress release by the induced events.
Comments. The observations are generally consistent with the effects of fluid-injection as observed else-where [35], except that the recorded shear-wave velocity anisotropy is exceptionally low. Typical values else-where are 1.5–4.5% in intact rock, or greater in areas of high heat-flow [5,7]. A major difference is that*Angerer et al. [35] used a controlled source, whereas *Bokelmann and Harjes [36] used injection-inducedmicro-earthquakes. The probable explanation of both the exceptionally low values of anisotropy and thedecrease in time-delays is that the critically-high pore-fluid pressures on the seismically-active faults of theinjection-induced events cause 90�-flips in the shear-wave polarisation near the source [44,45]. This means thatin highly pressurised rocks, very close to the small seismically-active fault-planes, shear-wave splitting time-delays have negative values. The sum of the larger positive fixed time-delays along the normally pressurisedremainder of the path to the borehole recorder, �4000 m above the seismic events, with small but increasing
S. Crampin, S. Peacock / Wave Motion 45 (2008) 675–722 717
negative time-delays means that the initial time-delay decreases with time. Fallacies [F9] and [F12] contributeto the original interpretation.
E.2.3. Oil field production: *Teanby et al. [37] [R1, R2, R3]*Teanby et al. [37] analyse borehole recordings of two separate clusters of microseismic events induced by
production processes in a North Sea oil reservoir. The two clusters show approximately orthogonal polarisa-tions at a 100-m string of geophones in a single well some 250-m above the clusters of earthquakes. Thesepolarisations were interpreted as the effect of three-dimensional variations of polarisations above distributionsof parallel vertical fluid-saturated microcracks, as expected theoretically for propagation through thin parallelvertical fluid-saturated microcracks [7].
In addition: ‘‘There appears to be a superficial temporal correlation between variations in per cent anisot-ropy, seismicity and ocean tides.” The most important overall conclusion is that it is possible to monitorchanges in crack properties induced by changes in pore pressure and/or stress during hydrocarbon productionprocesses.
Comments. Similar to *Angerer et al. [35], *Teanby et al. [37] is another oil field demonstration that shear-wave splitting can monitor pressure- and stress-induced changes to microcrack geometry. To our knowledge,this is the first observation of (possible) changes in shear-wave splitting associated with tides. Another detailedborehole measurement of shear-wave arrival times onshore in Iceland [38] (next section) did not show tidalchanges. The reason for this difference is not wholly understood but one factor may be that the ray pathsof *Teanby et al. [37] tend towards vertical, whereas the ray paths [38] are strictly horizontal. Another factormay be that the observations in Iceland were at 500-m depth, whereas the KTB well geophones were muchdeeper at �4000 m.
E.2.4. SMSITES experiment: *Crampin et al. [38] [R1,R3,R5, R6]*Crampin et al. [38] report the SMSITES experiment between boreholes in Northern Iceland where con-
trolled source cross-hole seismics recorded P-, SV-, and SH-wave travel times, SV–SH travel times, horizon-tally at 500-m depth between boreholes 315-m apart, in directions parallel to and offset �100 m from theHusavık-Flatey Fault (HFF), where it runs onshore in North-Central Iceland. HFF is a transform fault ofthe Mid-Atlantic Ridge. Also recorded were well-pressures in a water-well on Flatey Island immediately abovethe HFF, and NS and EW Global Positioning-system (GPS) measurements of horizontal displacements.Repeated sweeps of the Downhole Orbital Vibrator (DOV) source [134,135] every 12–20 s, were stacked every100 sweeps continuously for 13 days (11–24 August 2001). All seven parameters: four seismic (P-, SH-, SV-,and SV-SH travel times), water-well level, and NS and EW GPS measurements showed well-recorded anom-alies coinciding exactly with the onset of a swarm of 106 small (ML < 2.8) earthquakes 70-km distant on aneighbouring transform fault [38]. The total seismic energy was approximately equivalent to one ML 3.5 earth-quake with a source radius of �100 m, at most, which is a small earthquake. Thus the sensitivity at SIMITESto low-level seismicity at several hundred times the effective source diameter is far beyond that expected in abrittle-elastic upper crust, and is believed to be direct evidence for the sensitivity expected in critical-systems offluid-saturated cracks [41–43].
E.2.5. Geothermal Field I: *Crampin and Booth [39] [R1, R4]*Crampin and Booth [39] observed, small but consistent, 7� changes in shear-wave polarisations at the sur-
face between those from small acoustic events induced by an initial low-pressure water-injection, when equip-ment was being tested, and those induced by routine hydraulic fracturing operations in a hot-dry-rockgeothermal-heat experiment by Cambourne School of Mines at Rosemanowes Quarry in Cornwall, UK.The initial polarisations were parallel to stress directions measured by overcoring techniques at depth, whereasthe polarisations of the hydraulic fracturing induced events were parallel to joints and fractures in granite insurface outcrops. This was interpreted as pumping-induced hydraulic dilation of pre-existing joints in thegranite.
Comments. The separation between stress directions and pre-existing joints suggests that hydraulic fractur-ing in low-porosity crystalline rocks may open existing joints and fractures in preference to wholly stress-aligned fractures, when they are separated by only a small angle. It is interesting that observations of
718 S. Crampin, S. Peacock / Wave Motion 45 (2008) 675–722
shear-wave splitting away these induced events on seismically-active faults appear to be highly accurate [35],can be calculated with APE, and avoid the ±80% scatter associated with earthquake sources.
E.2.6. Geothermal Field II: *Tang et al. [40] [R1], [F6]*Tang et al. [40] report large values of time-delays (normalised by path length) above small events in two
regions of high heat-flow: close to fluid-injection wells near the Krafla Volcano, Iceland; and near the CocosGeothermal Field, California. In both cases the values of normalised time-delays are exceptionally high(greater than 25 ms/km) during the fluid-injection. When the injection was stopped, the normalised time-delays dropped to less than �20 ms/km, which is typical of the values elsewhere in Iceland where it is attrib-uted to the effects of high heat-flow [5,46]. Typical values in areas without high heat-flow are usually less than8 ms/km, some times less than 4 ms/km [7]. *Tang et al. [40] do not give any physical explanation for the highvalues, but suggest that they are monitoring the effects of changes in fluid pressures. *Tang et al. also showrose-diagrams of shear-wave polarisations which appear to show a wide range of different polarisations.All time-delays show the typical ±80% always associated with measurements above earthquakes [45].
Comments. The only viable explanation for the larger time-delays during injection is spatial variations. Theevents during injection with large normalised time-delays are identified as being close to and above the injec-tion points at both Krafla and Cocos [40]. Cracks at very shallow depths under greatly-reduced lithostaticpressure are likely to have higher crack densities than deeper cracks, and the shorter ray paths in the normal-isation would exaggerate any minor increase in time-delays.
Note that the rose-diagrams in *Tang et al. [40] are in equal-degree polar projections which accentuate anypreferential alignment as larger petals are preferentially over-weighted. Plotted in equal-area rose-diagrams, asin [5,7], the rose-diagrams of *Tang et al. would show less alignment and a much higher degree of scattering.The topography of the Krafla seismic network is irregular with many abrupt 22� to 14� slopes which wouldseriously disturb the edge of the shear-wave widow. Everywhere else, oddly aligned or scattered polarisationscan typically be explained by topographic irregularities [5,7].
References
*Papers where temporal variations in shear-wave splitting time-delays have been identified either by the authors or
by re-interpretations in this review, �Papers available at <http://www.geos.ed.ac.uk/homes/scrampin/opinion>
[1] S. Crampin, A review of wave motion in anisotropic and cracked elastic-media, Wave Motion 3 (1981) 343–391.[2] *�
S. Crampin, The fracture-criticality of crustal rocks, Geophys. J. Int. 118 (1994) 428–438.[3] *S. Crampin, Anisotropists Digest 149 and 150, [email protected] (1996).[4] *D. Winterstein, Anisotropists Digest 147, [email protected] (1996).[5] *�
T. Volti, S. Crampin, A four-year study of shear-wave splitting in Iceland: 2. Temporal changes before earthquakes and volcaniceruptions, in: D.W. Nieuwland (Ed.), New Insights into Structural Interpretation and Modelling, vol. 212, Geol. Soc. Lond., Spec.Publ., London, 2003, pp. 135–149.
[6] *�Y. Gao, S. Crampin, Observations of stress relaxation before earthquakes, Geophys. J. Int. 157 (2004) 578–582.
[7]�S. Crampin, Calculable fluid-rock interactions, J. Geol. Soc. 156 (1999) 501–514.
[8] S. Crampin, R. Evans, B. Uc�er, M. Doyle, J.P. Davis, G.V. Yegorkina, A. Miller, Observations of dilatancy-induced polarizationanomalies and earthquake prediction, Nature 286 (1980) 874–877.
[9] M. Ando, Y. Ishikawa, H. Wada, S-wave anisotropy in the upper-mantle under a volcanic area in Japan, Nature 286 (1980) 43–46.[10]
�S. Crampin, S. Peacock, A review of shear-wave splitting in the compliant crack-critical anisotropic Earth, Wave Motion 41 (2005)
59–77.[11]
�S. Crampin, The New Geophysics: a new understanding of fluid-rock deformation, in: A. Van Cotthem, R. Charlier, J.-F. Thimus,
J.-P. Tshibangu (Eds.), Eurock 2006: Multiphysics Coupling and Long Term Behaviour in Rock Mechanics, Taylor & Francis,London, 2006, pp. 539–544.
[12] S. Crampin, R. Evans, S.B. Uc�er, Analysis of records of local earthquakes: the Turkish Dilatancy Projects (TDP1 and TDP2),Geophys. J.R. Astron. Soc. 83 (1985) 1–16 (see also pages: 17–30; 31–46; 47–60; 61–74; and 75–92).
[13] R.M. Alford, Shear data in the presence of azimuthal anisotropy, Dilley, Texas, 56th Ann. Int. Mtg., Soc. Expl. Geophys. Houston(1986) 379–476, Expanded Abstracts.
[14] M.C. Mueller, Prediction of lateral variability in fracture intensity using multicomponent shear-wave surface seismic as a precursorto horizontal drilling in the Austin chalk, Geophys. J. Int. 107 (1991) 409–415.
[15] K. Helbig, L. Thomsen, 75-plus years of anisotropy in exploration and reservoir seismics: a historical review of concepts andmethods, Geophysics 70 (2006) 9ND–23ND.

S. Crampin, S. Peacock / Wave Motion 45 (2008) 675–722 719
[16]�Y. Gao, P. Hao, S. Crampin, SWAS: a shear-wave analysis system for semi-automatic measurement of shear-wave splitting above
small earthquakes, Phys. Earth. Planet. Inter. 159 (2006) 71–89.[17] P. Davis (Ed.), The New Physics, Cambridge University Press, 1989.[18] P. Davis, The New Physics: a synthesis, in: P. Davis (Ed.), The New Physics, Cambridge University Press, Cambridge, 1989, pp. 1–6.[19] A. Bruce, D. Wallace, Critical point phenomena: universal physics at large length scale, in: P. Davis (Ed.), The New Physics,
Cambridge University Press, Cambridge, 1989, pp. 236–267.[20] N. Barton, Rock Quality, Seismic Velocity, Attenuation and Anisotropy, Taylor & Francis, London, 2007.[21] *Y. Gao, P. Wang, S. Zheng, M. Wang, Y.-T. Chen, Temporal changes in shear-wave splitting at an isolated swarm of small
earthquakes in 1992 near Dongfang, Hainan Island, Southern China, Geophys. J. Int. 135 (1998) 102–112.[22] *D.C. Booth, S. Crampin, J.H. Lovell, J.-M. Chiu, Temporal changes in shear wave splitting during an earthquake swarm in
Arkansas, J. Geophys. Res. 95 (1990) 11151–11164.[23] *Y. Liu, S. Crampin, I. Main, Shear-wave anisotropy: spatial and temporal variations in time delays at Parkfield, Central California,
Geophys. J. Int. 130 (1997) 771–785.[24] *�
Y. Gao, S. Crampin, A further stress-forecast earthquake (with hindsight), where migration of source earthquakes causesanomalies in shear-wave polarizations, Tectonophysics 426 (2006) 253–262.
[25] *�S. Crampin, T. Volti, R. Stefansson, A successfully stress-forecast earthquake, Geophys. J. Int. 138 (1999) F1–F5.
[26] *Y. Gao et al., Changes in characteristics of shear-wave splitting of earthquakes in Shidian, Yunnan, China, Acta Seism. Sinica 17(2004) 635–641.
[27] *S. Peacock, S. Crampin, D.C. Booth, J.B. Fletcher, Shear-wave splitting in the Anza seismic gap, Southern California: temporalvariations as possible precursors, J. Geophys. Res. 93 (1988) 3339–3356.
[28] *S. Crampin, D.C. Booth, R. Evans, S. Peacock, J.B. Fletcher, Changes in shear wave splitting at Anza near the time of the NorthPalm Springs Earthquake, J. Geophys. Res. 95 (1990) 11197–11212.
[29] *S. Crampin, D.C. Booth, R. Evans, S. Peacock, J.B. Fletcher, Comment on ‘‘Quantitative measurements of shear wavepolarizations at the Anza seismic network, Southern California: implications for shear wave splitting and earthquake prediction” byR.C. Aster, P.M. Shearer, J. Berger, J. Geophys. Res. 96 (1991) 6403–6414.
[30] *J. Wu, Y. Gao, S. Crampin, T. Volti, Y.-T. Chen, Smaller source earthquakes and improved measuring techniques allow the largestearthquakes in Iceland to be stress-forecast (with hindsight), Geophys. J. Int. 166 (2006) 1293–1298.
[31] *�S. Crampin, Y. Gao, Comment on ‘‘Systematic analysis of shear-wave splitting in the aftershock zone of the 1999 Chi–Chi,
Taiwan, earthquake: shallow crustal anisotropy and lack of precursory changes, by Liu, Teng, Ben-Zion, Bull. Seismol. Soc. Am. 95(2005) 354–360.
[32] *F. Bianco, L. Scarfi, E. Del Pezzo, D. Patane, Shear wave splitting time variation by stress-induced magma uprising at Mt. Etnavolcano, Geophys. J. Int. 167 (2006) 959–967.
[33] *V. Miller, M. Savage, Changes in seismic anisotropy after volcanic eruptions: evidence from Mount Ruapehu, Science 293 (2001)2231–2235.
[34] *T.L. Davis, R.D. Benson, S.L. Roche, D. Talley, 4-D 3-C seismology and dynamic reservoir characterization – a geophysicalrenaissance, 67th Ann. Mtg. Soc. Explor. Geophys., Dallas 1 (1997) 880–882 (Expanded Abstracts, see also 883–885, 886–889).
[35] *�E. Angerer, S. Crampin, X.-Y. Li, T.L. Davis, Processing, modelling, and predicting time-lapse effects of overpressured fluid-
injection in a fractured reservoir, Geophys. J. Int. 149 (2002) 267–280.[36] *G.H.R. Bokelmann, H.-P. Harjes, Evidence for temporal variation of seismic velocity within the upper continental crust, J.
Geophys. Res. 105 (2000) 23879–23894.[37] *N. Teanby, J.-M. Kendall, R.H. Jones, O. Barkved, Stress-induced temporal variations in seismic anisotropy observed in
microseismic data, Geophys. J. Int. 156 (2004) 459–466.[38] *�
S. Crampin, S. Chastin, Y. Gao, Shear-wave splitting in a critical crust: III – preliminary report of multi-variable measurements inactive tectonics, J. Appl. Geophys. 54 (2003) 265–277 (Spec. Issue).
[39] *�S. Crampin, D.C. Booth, Shear-wave splitting showing hydraulic dilation of pre-existing joints in granite, Sci. Drilling 1 (1989) 21–
26.[40] *C. Tang, J.A. Rial, J.M. Lees, Shear-wave splitting: a diagnostic tool to monitor fluid pressure in geothermal fields, Geophys. Res.
Lett. 32 (2005) L21317, doi:10.1029/2005GL023551.[41]
�S.V. Zatsepin, S. Crampin, Modelling the compliance of crustal rock: I – response of shear-wave splitting to differential stress,
Geophys. J. Int. 129 (1997) 477–494.[42]
�S. Crampin, S.V. Zatsepin, Modelling the compliance of crustal rock: II – response to temporal changes before earthquakes,
Geophys. J. Int. 129 (1997) 495–506.[43]
�S. Crampin, S. Chastin, A review of shear-wave splitting in the crack-critical crust, Geophys. J. Int. 155 (2003) 221–240.
[44]�S. Crampin, T. Volti, S. Chastin, A. Gudmundsson, R. Stefansson, Indication of high pore-fluid pressures in a seismically-active
fault zone, Geophys. J. Int. 151 (2002) F1–F5.[45] S. Crampin, S. Peacock, Y. Gao, S. Chastin, The scatter of time-delays in shear-wave splitting above small earthquakes, Geophys. J.
Int. 156 (2004) 39–44.[46] *�
T. Volti, S. Crampin, A four-year study of shear-wave splitting in Iceland: 1. Background and preliminary analysis, in: D.W.Nieuwland (Ed.), New Insights into Structural Interpretation and Modelling, vol. 212, Geol. Soc. Lond., Spec. Publ., 2003, pp. 117–133.
[47] *A. Gerst, M. Savage, Seismic anisotropy beneath Ruapehu volcano: a possible eruption forecasting tool, Science 306 (2004) 1543–1547.
720 S. Crampin, S. Peacock / Wave Motion 45 (2008) 675–722
[48] T.M. Brocher, N.I. Christensen, Seismic anisotropy due to preferred mineral orientation observed in shallow crustal rocks insouthern Alaska, Geology 18 (1989) 737–740.
[49] A.F. do Nascimento, R.G. Pearce, M.K. Takeya, Local shear wave observations in Joao Camara, northeast Brazil, J. Geophys. Res.107 (2002) 2232, doi:10.1029/2001JB000560.
[50] *Y. Liu, T.-L. Teng, Y. Ben-Zion, Systematic analysis of shear-wave splitting in the aftershock zone of the 1999 Chi–Chi, Taiwan,Earthquake: shallow crustal anisotropy and lack of precursory changes, Bull. Seismol. Soc. Am. 94 (2004) 2330–2347.
[51] S. Crampin, Comment and reply on ‘‘Seismic anisotropy due to preferred mineral orientation observed in shallow crustal rocks insouthern Alaska” by T.M. Brocher, N.I. Christensen, Geology 19 (1991) 859–860.
[52]�S. Crampin, Comments on ‘‘Local shear wave observations in Joao Camara, northeast Brazil” by A.F. do Nascimento, R.G.
Pearce, M.K. Takeya, J. Geophys. Res. 109 (2004) B02313, doi:10.1029/2003JB002681.[53] A.F. do Nascimento, R.G. Pearce, M.K. Takeya, Reply to comments by Crampin, S. on ‘‘Local shear wave observations in Joao
Camara, northeast Brazil”, J. Geophys. Res. 109 (2004) B023104, doi:10.1029/2003JB002754.[54] *K.R. Gledhill, Evidence for shallow and pervasive seismic anisotropy in the Wellington Region, New Zealand, J. Geophys. Res. 96
(1991) 21503–21516.[55] W.B. Menke, B. Brandsdottir, S. Jakobsdottir, R. Stefansson, Seismic anisotropy in the crust at the mid-Atlantic plate boundary in
south-west Iceland, Geophys. J. Int. 119 (1994) 783–790.[56] *Y. Liu, Y. Ben-Zion, T.-L. Teng, Reply to ‘‘Comments on ‘Systematic analysis of shear-wave splitting in the aftershock zone of the
1999 Chi–Chi, Taiwan, Earthquake: shallow crustal anisotropy and lack of precursory changes,’ by Y. Liu, T.-L. Teng, Y. Ben-Zion,” by S. Crampin, Y. Gao, Bull. Seismol. Soc. Am. 95 (2005) 361–366.
[57] R. Aster, P. Shearer, J. Berger, Quantitative measurements of shear-wave polarizations at the Anza seismic network, southernCalifornia: implications for shear-wave splitting and earthquake prediction, J. Geophys. Res. 95 (1990) 12449–12473.
[58] R.C. Aster, P.M. Shearer, J. Berger, Reply, J. Geophys. Res. 96 (1991) 6415–6419.[59]
�S. Crampin, Y. Gao, A review of techniques for measuring shear-wave splitting above small earthquakes, Phys. Earth. Planet. Inter.
159 (2006) 1–14.[60] T. Seher, I.G. Main, A statistical evaluation of a ‘stress-forecast’ earthquake, Geophys. J. Int. 157 (2004) 187–193.[61] *�
S. Crampin, T. Volti, R. Stefansson, Response to ‘‘A statistical evaluation of a ‘stress-forecast’ earthquake” by T. Seher, I.G.Main, Geophys. J. Int. 157 (2004) 194–199.
[62] F.K. Levin, Seismic velocities in transversely isotropic media I, Geophysics 44 (1979) 918–936.[63] F. Levin, Seismic velocities in transversely isotropic media II, Geophysics 45 (1980) 3–17.[64] I. Tsvankin, Seismic Signatures and Analysis of Reflection Data in Anisotropic Media, Pergamon, Amsterdam, 2001.[65] E.A. Kaarsberg, Introductory studies of natural and artificial argillaceous aggregates by sound propagation and X-ray diffraction
methods, J. Geol. 67 (1959) 447–472.[66] E.A. Kaarsberg, Elasticity studies of isotropic and anisotropic rock, Trans. Soc. Min. Eng. 241 (1968) 470–475.[67] A.M. Dziewonski, D.L. Anderson, Preliminary reference earth model (PREM), Phys. Earth Planet. Inter. 25 (1981) 297–356.[68] S. Crampin, S.C. Kirkwood, Velocity variations in systems of anisotropic symmetry, J. Geophys. 49 (1981) 35–42.[69] S. Crampin, Arguments for EDA, Can. J. Expl. Geophys. 29 (1993) 18–30.[70] S. Crampin, R. Evans, B.K. Atkinson, Earthquake prediction: a new physical basis, Geophys. J.R. Astron. Soc. 76 (1984) 147–156.[71] W.A. Deer, R.A. Howie, J. Zussman, An Introduction to the Rock-Forming Minerals, Longman, London, 1996.[72] S. Crampin, D. Bamford, Inversion of P-wave velocity anisotropy, Geophys. J.R. Astron. Soc. 49 (1977) 123–132.[73] N.I. Christensen, Compressional wave velocities in metamorphic rocks at pressures to 10 kilobars, J. Geophys. Res. 70 (1965) 6147–
6164.[74] N.I. Christensen, Shear wave velocities in metamorphic rocks at pressures to 10 kilobars, J. Geophys. Res. 71 (1966) 3549–3556.[75] V. Babuska, P-wave velocity anisotropy in crystalline rocks, Geophys. J.R. Astron. Soc. 76 (113) (1984) 1–11.[76] K.S. Alexandrov, T.V. Ryzhova, Elastic properties of rock-forming minerals: 2. Layered silicates, Bull. Acad. Sci. USSR, Geophys.
Ser., English Transl. 12 (1961) 871–875.[77] M.K. Hubbert, W.W. Rubey, Role of fluid pressure in mechanics of overthrust faulting. 1. Mechanics of fluid filles porous solids and
its application to overthrust faulting, Geol. Soc. Am. Bull. 70 (1959) 115–166.[78] S. Crampin, D.W. King, Evidence for anisotropy in the upper-mantle beneath Eurasia from generalized higher mode surface waves,
Geophys. J.R. Astron. Soc. 49 (1977) 59–85.[79] O. Nuttli, The effects of the Earth’s surface on the S-wave particle motion, Bull. Seismol. Soc. Am. 51 (1961) 237–246.[80] R. Evans, Effects of the free surface on shear wavetrains, Geophys. J.R. Astron. Soc. 76 (1984) 165–172.[81] D.C. Booth, S. Crampin, Shear-wave polarizations on a curved wavefront at an isotropic free-surface, Geophys. J.R. Astron. Soc. 83
(1985) 31–45.[82] E. Liu, S. Crampin, Effects of the internal shear wave window: comparison with anisotropy induced splitting, J. Geophys. Res. 95
(1990) 11275–11281.[83] S. Crampin, A review of the effects of crack geometry on wave propagation through aligned cracks, Can. J. Expl. Geophys. 29 (1993)
3–17.[84] Z. Peng, Y. Ben-Zion, Systematic analysis of crustal anisotropy along the Karadere-Duzce branch of the North Anatolian fault,
Geophys. J. Int. 159 (2004) 253–274.[85] R. Stefansson et al., Earthquake prediction research in the South Iceland Seismic Zone and the SIL Project, Bull. Seismol. Soc. Am.
83 (1993) 696–716.
S. Crampin, S. Peacock / Wave Motion 45 (2008) 675–722 721
[86] S. Crampin et al., SMSITES: developing stress-monitoring sites and infrastructure for forecasting earthquakes, Final Report toEuropean Commission, EC Contract No. EVR1-CT1999-40002, 2004, p. 73.
[87] S. Crampin, Effective anisotropic elastic-constants for wave propagation through cracked solids, Geophys. J.R. Astron. Soc. 76(1984) 135–145.
[88] S. Crampin, Seismic wave propagation through a cracked solid: polarization as a possible dilatancy diagnostic, Geophys. J.R.Astron. Soc. 53 (1978) 467–496.
[89] J.A. Hudson, Overall properties of a cracked solid, Math. Proc. Camb. Phil. Soc. 88 (1980) 371–384.[90] J.A. Hudson, Wave speeds and attenuation of elastic waves in material containing cracks, Geophys. J.R. Astron. Soc. 64 (1981) 133–
150.[91] *�
S. Crampin, The New Geophysics: shear-wave splitting provides a window into the crack-critical rock mass, Leading Edge 22(2003) 536–549.
[92] S. Crampin, Shear-wave splitting in a critical self-organized crust: the New Geophysics, 70th Ann. Int. Mtg., Soc. Expl. Geophys.Calgary 2 (2000) 1544–1547, Expanded Abstracts.
[93] S. Crampin, M. Yedlin, Shear-wave singularities of wave propagation in anisotropic media, J. Geophys. 49 (1981) 43–46.[94] S. Crampin, Effects of point singularities on shear-wave propagation in sedimentary basins, Geophys. J. Int. 107 (1991) 531–543.[95] S. Crampin, S.V. Zatsepin, C. Slater, L.Y. Brodov, Abnormal shear-wave polarizations as indicators of pressures and over pressures,
58th Conf., EAGE, Amsterdam, Extended Abstracts, X038 (1996).[96] I. Bush, S. Crampin, Paris Basin VSPs: case history establishing combinations of matrix- and crack-anisotropy from modelling shear
wavefields near point singularities, Geophys. J. Int. 107 (1991) 433–447.[97] S. Crampin, D.C. Booth, M.A. Krasnova, E.M. Chesnokov, A.B. Maximov, N.T. Tarasov, Shear-wave polarizations in the Peter
the First Range indicating crack-induced anisotropy in a thrust-fault regime, Geophys. J.R. Astron. Soc. 84 (1986) 401–412.[98] G.M. Holmes, S. Crampin, R.P. Young, Seismic anisotropy in granite at the Underground Research Laboratory, Manitoba,
Geophys. Prosp. 48 (2000) 415–435.[99] *Y.-G. Li, T.-L. Teng, T.L. Henyey, Shear-wave splitting observations in the Northern Los Angeles Basin, Southern California,
Bull. Seismol. Soc. Am. 84 (1994) 307–323.[100] *R.M. Nadeau, W. Foxall, T.V. McEvilly, Clustering and periodic recurrence of microearthquakes on the San Andreas Fault at
Parkfield, California, Science 267 (1995) 503–507.[101] *E. Karageorgi, T.V. McEvilly, R. Clymer, P. Source, Seismological studies at Parkfield. IV: variations in controlled-source
waveform parameters and their correlation with seismicity, 1987 to 1995, Bull. Seismol. Soc. Am. 87 (1997) 39–49.[102] *K.R. Gledhill, Shear waves recorded on close-spaced seismographs: I. Shear-wave splitting results, Can. J. Expl. Geophys. 29
(1993) 285–298.[103] N.J. Balfour, M.K. Savage, J. Townend, Stress and crustal anisotropy in Marlborough, New Zealand: evidence for low fault strength
and structure-controlled anisotropy, Geophys. J. Int. 163 (2005) 1073–1086.[104] *E. Del Pezzo, F. Bianco, S. Petrosino, G. Saccorotti, Changes in the coda decay rate and shear-wave splitting parameters associated
with seismic swarms at Mt. Vesuvius, Italy, Bull. Seismol. Soc. Am. 94 (2004) 439–452.[105] *A. Saiga, Y. Hiramatsu, T. Ooida, K. Yamaoka, Spatial variation in the crustal anisotropy and its temporal variation associated
with a moderate-sized earthquake in the Tokai region, Geophys. J. Int. 154 (2003) 695–705.[106] G. Graham, S. Crampin, Shear-wave splitting from regional earthquakes in Turkey, Can. J. Expl. Geophys. 29 (1993) 279–371.[107] G.V. Yegorkina, V.A. Rakitov, I.V. Garetovskaya, L.M. Yegorova, Anisotropy of velocities of seismic waves and the stress state of
the Earth’s crust in the territory of Armenia, Izvestiya, Earth Phys. (English Ed.) 13 (1977) 554–562.[108] W.M. Kohler, J.H. Healy, S.S. Wegner, Upper crustal structure of the Mount Hood, Oregon, Region as revealed by time-term
analysis, J. Geophys. Res. 87 (1982) 339–355.[109] S. Crampin, R. McGonigle, M. Ando, Extensive-dilatancy anisotropy beneath Mount Hood, Oregon, and the effect of aspect ratio
on seismic velocities through aligned cracks, J. Geophys. Res. 91 (1986) 12703–12710.[110] C.W. Burnham, J.R. Holloway, N.F. Davis, Thermodynamic properties of water to 1,000�C and 10,000 bars, Spec. Paper, Geol.
Soc. Am. 132 (1969) 36.[111] S. Crampin, Aligned cracks not LPO as the cause of mantle anisotropy, EGS-AGU-EUG Joint Assembly, 06–11 April, 2003, Nice,
EAEG03-A-00205, SM4-1FR1P-0073, 2003.[112] J.B. Fletcher, T. Fumal, H.-P. Liu, L.C. Carrol, Near-surface velocities and attenuation at two boreholes near Anza, California,
from logging data, Bull. Seismol. Soc. Am. 80 (1990) 807–831.[113] T.M. Daley, T.V. McEvilly, Shear wave anisotropy in the Parkfield Varian Well VSP, Bull. Seismol. Soc. Am. 80 (1990) 857–869.[114] R.C. Aster, P.M. Shearer, High-frequency borehole seismograms recovered in the San Jacinto Fault Zone, Southern California. Part
1. Polarisations, Bull. Seismol. Soc. Am. 81 (1991) 1057–1080.[115] P. Leary, R.E. Abercrombie, Frequency dependent crustal scattering and absorption at 5–160 Hz from coda decay observed at
2.5 km depth, Geophys. Res. Lett. 21 (1994) 971–974.[116] R.C. Aster, P.M. Shearer, Initial shear wave particle motions and stress constraints at the Anza Seismic Network, Geophys. J. Int.
108 (1992) 740–748.[117] Z. Zhang, S.Y. Schwartz, Seismic anisotropy in the shallow crust of the Loma Prieta segment of the San Andreas fault system, J.
Geophys. Res. 100 (1994) 9651–9661.[118] S. Crampin, The scattering of shear waves in the crust, Pure Appl. Geophys. 132 (1990) 67–91.[119] J.C. Zinke, M.D. Zoback, Structure-related and stress-induced shear-wave velocity anisotropy: observations from microearthquakes
near the Calaveras Fault in central California, Bull. Seismol. Soc. Am. 90 (2000) 1305–1312.
722 S. Crampin, S. Peacock / Wave Motion 45 (2008) 675–722
[120] X.R. Shih, R.P. Meyer, Observation of shear wave splitting from natural events: South Moat of Long Valley Caldera, California,June 29 to August 12, 1982, J. Geophys. Res. 95 (1990) 11179–11195.
[121] E.S. Cochran, J.E. Vidale, Y.-G. Li, Near-fault anisotropy following the Hector Mine earthquake, J. Geophys. Res. 108 (B9) (2003)2436, doi:10.1029/2002JB002352.
[122] C.G. Munson, C.H. Thurber, Y. Li, P.G. Okuba, Crustal shear wave anisotropy in southern Hawaii: spatial and temporal analysis,J. Geophys. Res. 99 (1995) 20367–20377.
[123] S. Kaneshima, Origin of crustal anisotropy: shear wave splitting studies in Japan, J. Geophys. Res. 95 (1990) 11121–11123.[124] T. Volti, Y. Kaneda, S. Zatsepin, S. Crampin, Shear-wave splitting in Nankai Trough (Japan) using ocean bottom seismometers and
HINET data, in: Frontier Research on Earth Evolution, IFREE Rep. 2001–2002, 1 (2003) 155–167.[125] *Y. Hiramatsu, H. Honma, A. Saiga, M. Furumoto, T. Ooida, Seismological evidence on characteristic time of crack healing in the
shallow crust, Geophys. Res. Lett. 32 (2005) L09304, doi:10.1029/2005GL022656.[126] M.A. Krasnova, E.M. Chesnokov, Changes in shear-wave polarization in the crust of Kamchatka based on records of local
earthquakes, Volc. Seismol. 20 (1999) 539–550.[127] M.N. Luneva, J.M. Lee, Shear wave splitting beneath South Kamchatka during the 3-year period associated with the 1997
Kronotsky earthquake, Tectonophysics 274 (2003) 135–161.[128] *K.R. Gledhill, Shear waves recorded on close-spaced seismographs: II. The complex anisotropic structure of the Wellington
Peninsula, New Zealand, Can. J. Expl. Geophys. 29 (1993) 299–314.[129] E. Audoine, M.K. Savage, K. Gledhill, Seismic anisotropy form local earthquakes in the transition region from a subduction to a
strike-slip plate boundary, New Zealand, J. Geophys. Res. 105 (2000) 8013–8033.[130] E. Audoine, M.K. Savage, K. Gledhill, Anisotropic structure under a back arc spreading region, the Taupo Volcanic Zone, New
Zealand, J. Geophys. Res. 109 (2004) B11305, doi:10.1029/2003JB:002932.[131] D.B. Taylor, Double contour integration for transmission from point sources through anisotropic layers as used in ANISEIS
software, Geophys. J.R. Astron. Soc. 91 (1987) 373–381.[132] D.B. Taylor, ANISEIS Manual, Version 5.6, MACROC Ltd. Available from: <http://xweb.geos.ed.ac.uk/~ernm01/anis/
Manual.html> (2005).[133] M.D. Zoback, H.-P. Harjes, Injection-induced earthquakes and crustal stress at 9 km depth at the KTB deep drilling site, Germany,
J. Geophys. Res. 102 (1997) 18477–18491.[134] P.C. Leary, L.A. Walter, S. Crampin, Physical model for downhole orbital vibrator (DOV) – (1) acoustic radiation, 73rd Ann. Int.
Soc. Explor. Geophys., Mtg, Dallas, 2003, Expanded Abstracts 2 (2003) 1532–1535.[135] L.A. Walter, P.C. Leary, S. Crampin, Physical model for downhole orbital vibrator (DOV) – (2) seismic radiation, 73rd Ann. Int.
Mtg, Soc. Explor. Geophys., Dallas, 2003, Expanded Abstracts 2, 1536–1539 (2003).