Embed Size (px)
Citation preview
A Review of Nitrogen Loading and A Review of Nitrogen Loading and Treatment Performance Treatment Performance
Recommendations for OWTS in the Recommendations for OWTS in the WekivaWekiva Study AreaStudy Area
FDOH Technical Review & Advisory Panel MeetingFDOH Technical Review & Advisory Panel Meeting
February 15, 2006February 15, 2006
Damann L. Anderson, P.E.Damann L. Anderson, P.E.
Purpose and ScopePurpose and Scope
Retained by stakeholders through FHBARetained by stakeholders through FHBA
Purpose:Purpose: To gain understanding of the To gain understanding of the significance of N loading from OWTSsignificance of N loading from OWTS
Scope:Scope: Review data, make assessment of Review data, make assessment of OWTS impacts relative to other sources OWTS impacts relative to other sources and FDOH recommended OWTS actionsand FDOH recommended OWTS actions
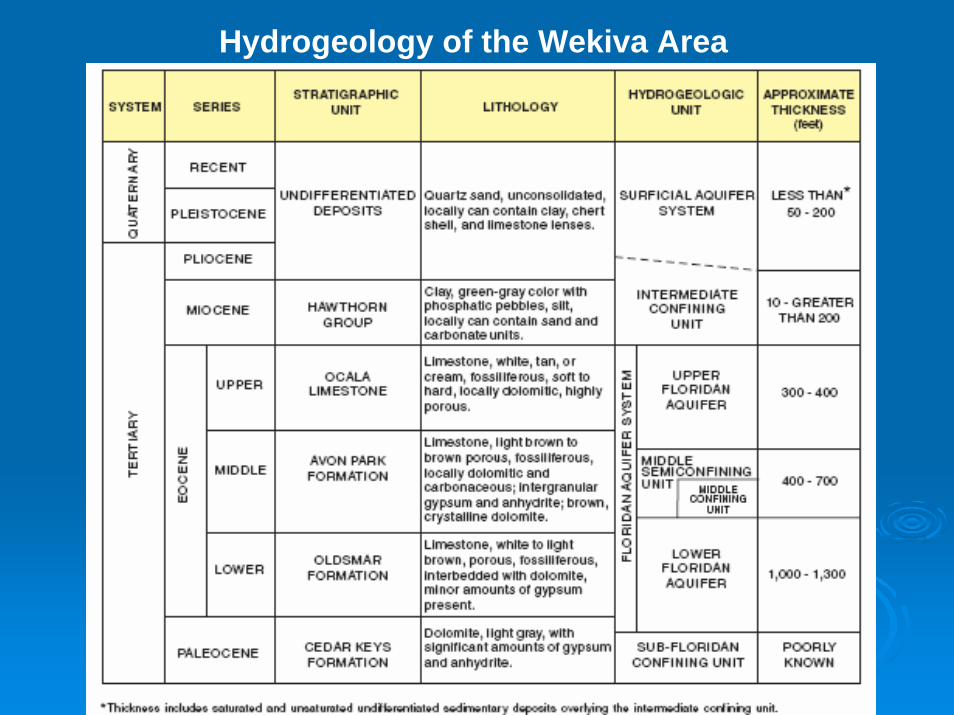
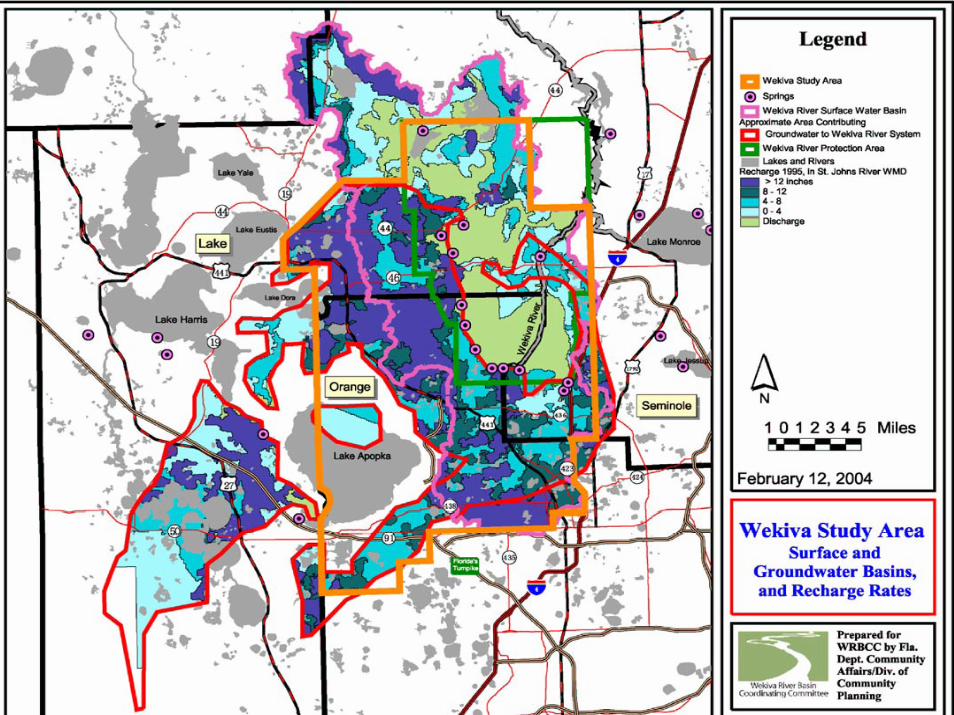
Hydrogeology of the Wekiva Area
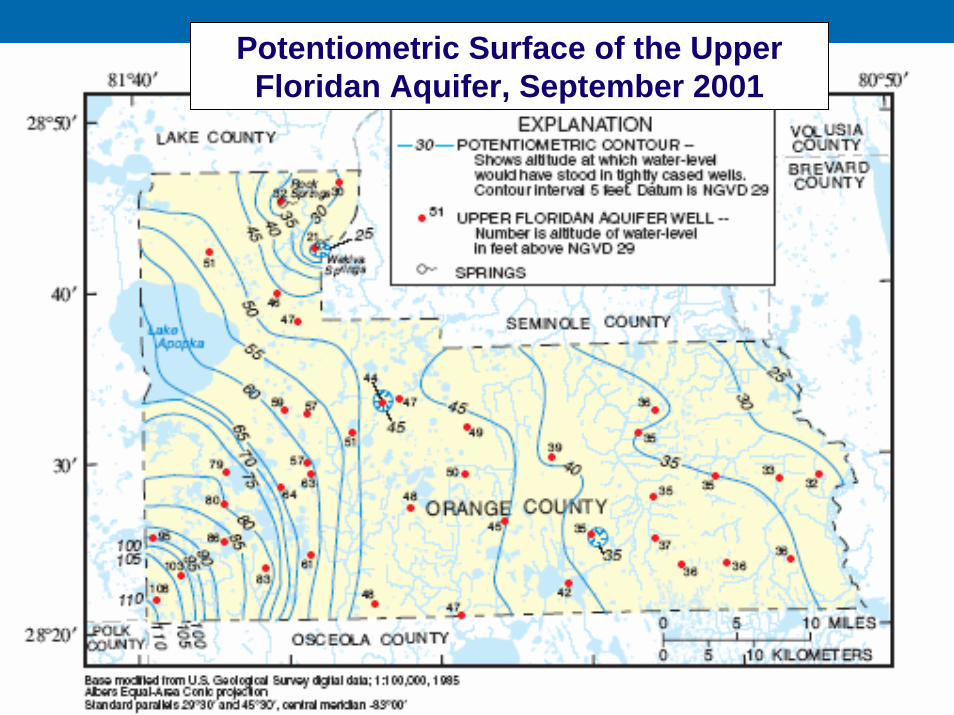
Potentiometric Surface of the Upper Floridan Aquifer, September 2001
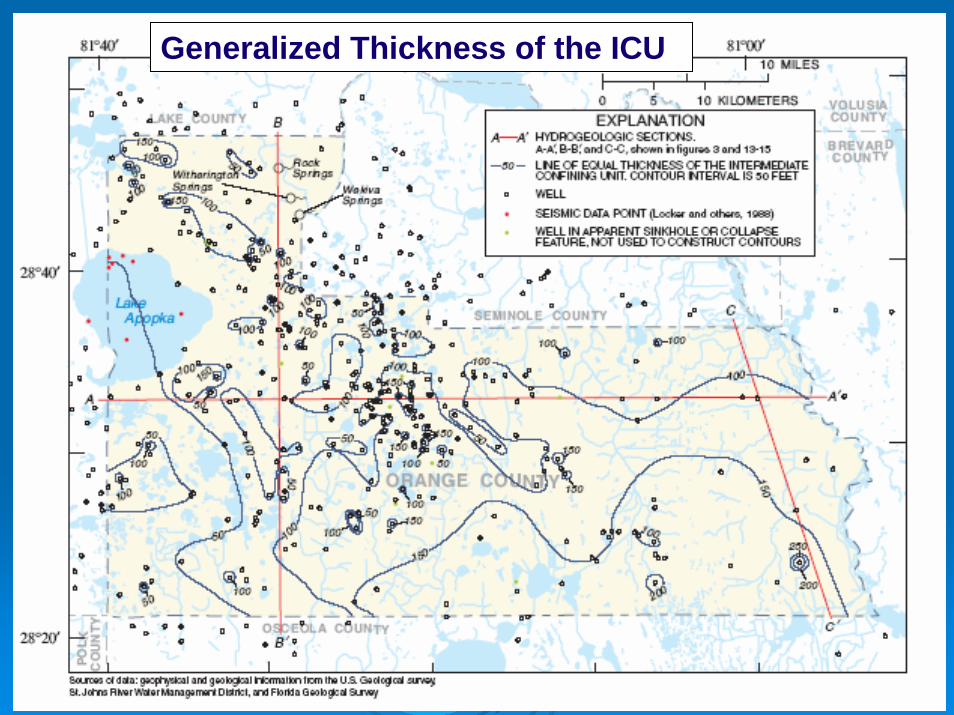
Generalized Thickness of the ICU
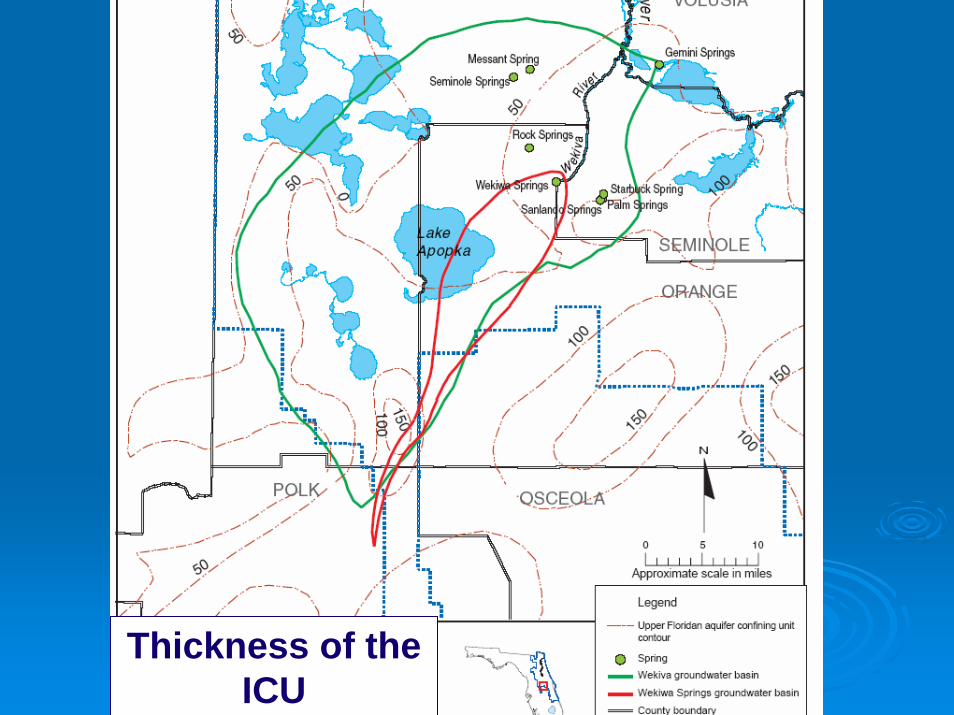
Thickness of the ICU
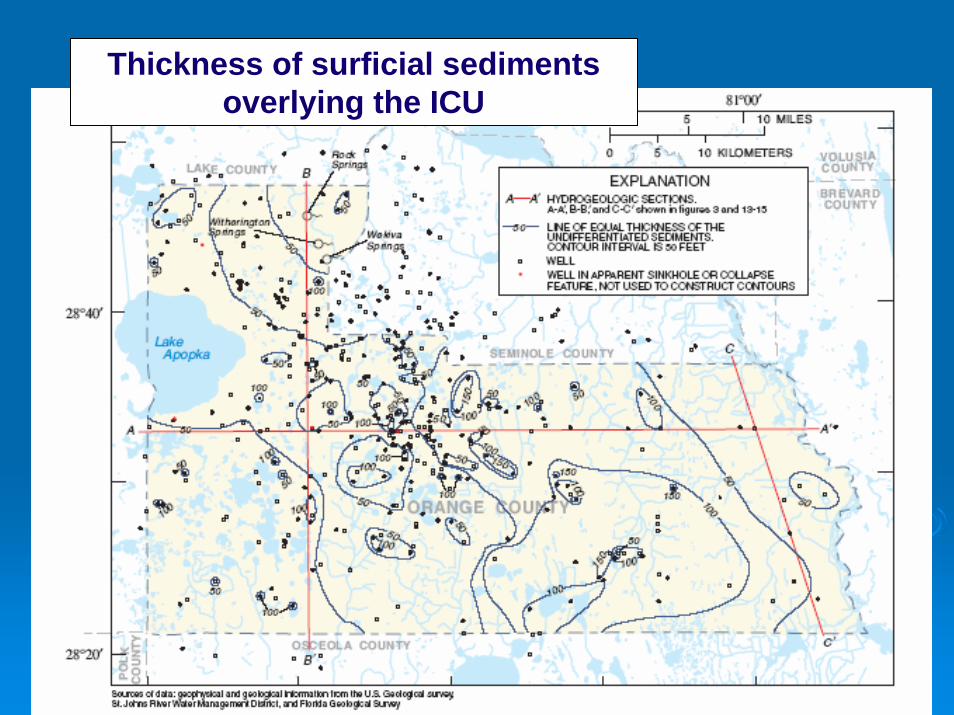
Thickness of surficial sediments overlying the ICU
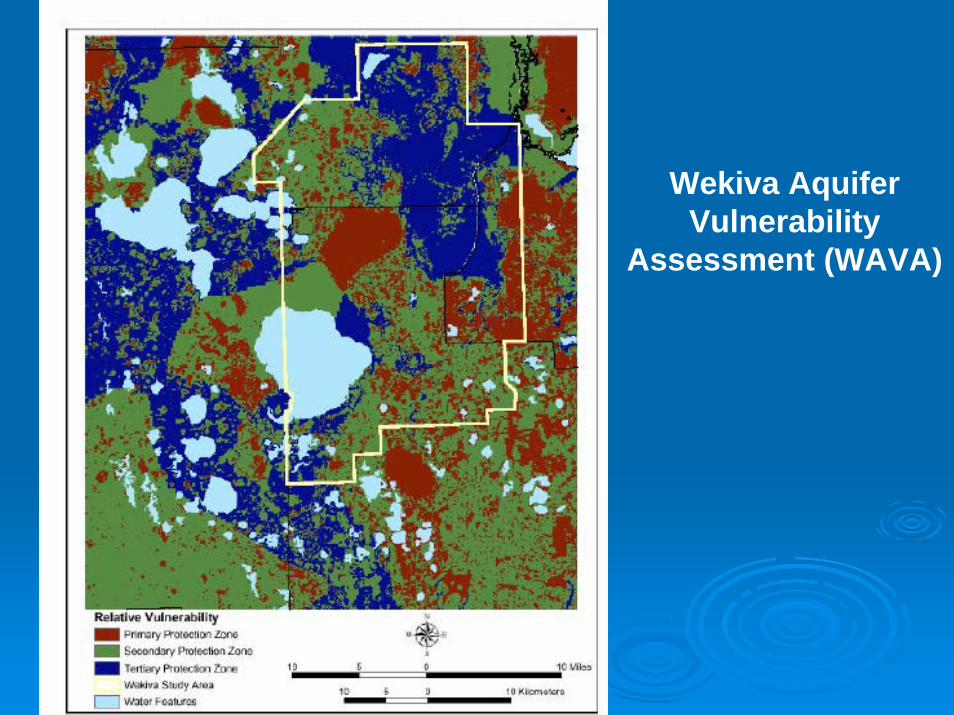
Wekiva Aquifer Vulnerability
Assessment (WAVA)
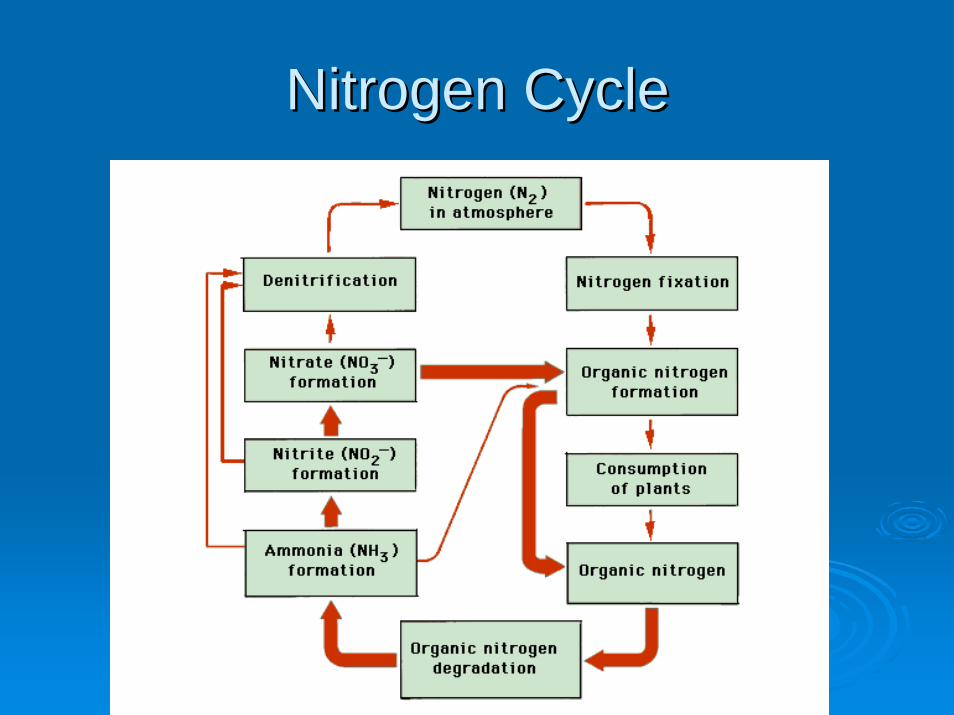
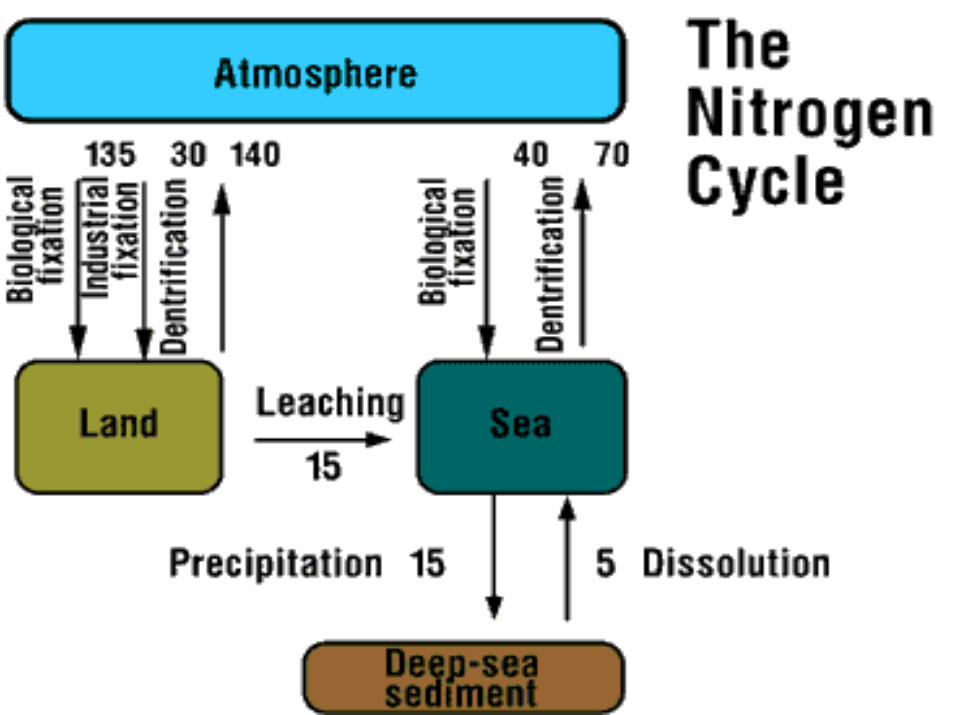
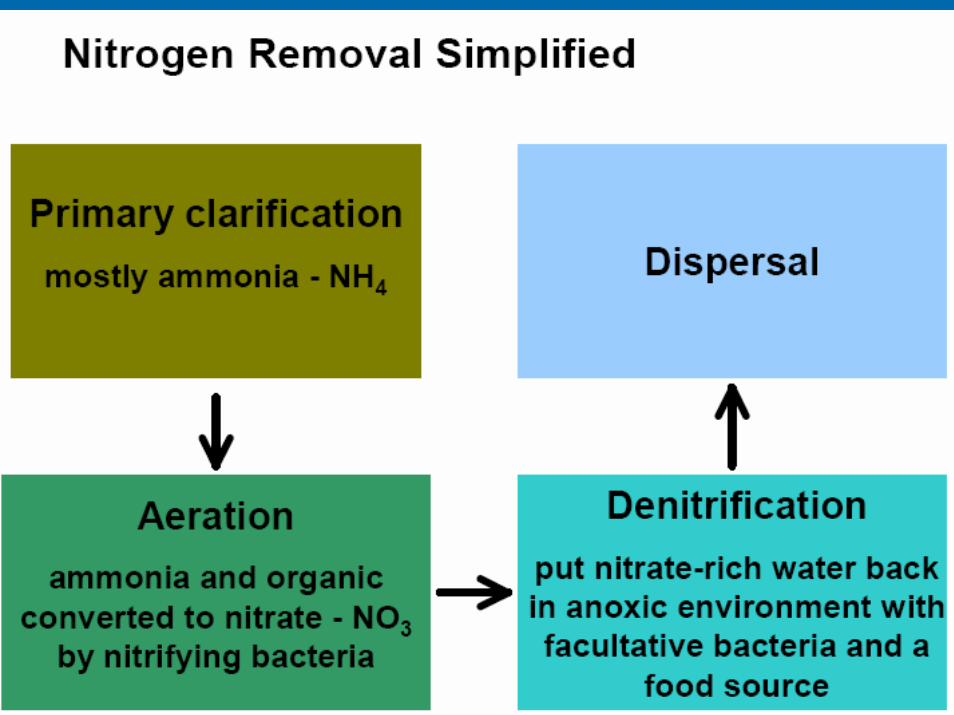
Nitrogen CycleNitrogen Cycle

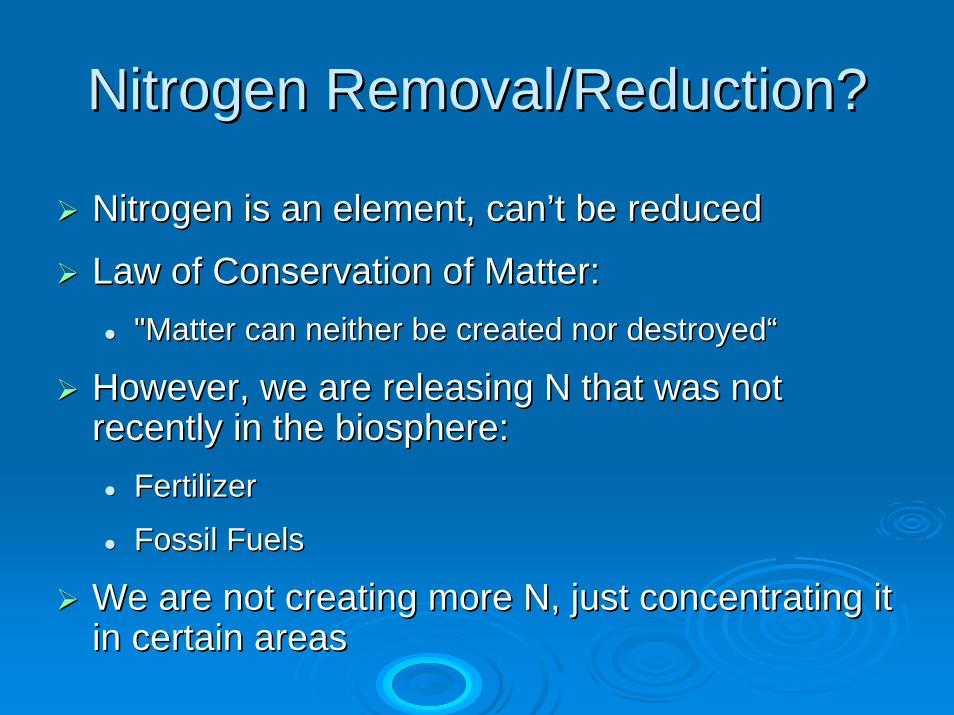
Nitrogen Removal/Reduction?Nitrogen Removal/Reduction?
Nitrogen is an element, canNitrogen is an element, can’’t be reducedt be reduced
Law of Conservation of Matter:Law of Conservation of Matter:"Matter can neither be created nor destroyed"Matter can neither be created nor destroyed““
However, we are releasing N that was not However, we are releasing N that was not recently in the biosphere:recently in the biosphere:
FertilizerFertilizer
Fossil Fuels Fossil Fuels
We are not creating more N, just concentrating it We are not creating more N, just concentrating it in certain areasin certain areas
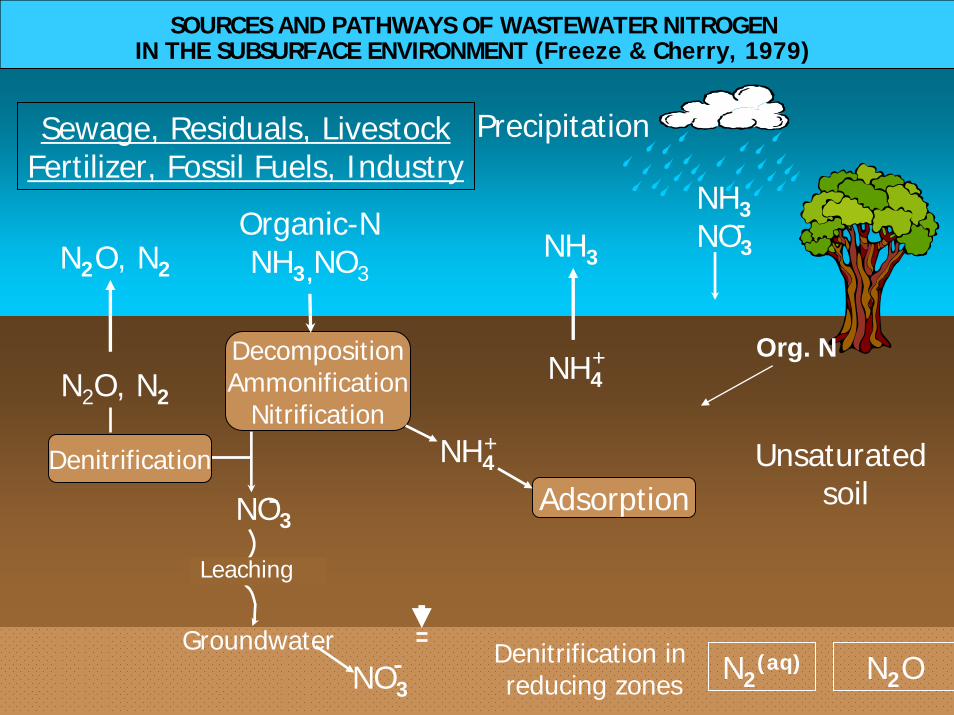
SOURCES AND PATHWAYS OF WASTEWATER NITROGEN IN THE SUBSURFACE ENVIRONMENT (Freeze & Cherry, 1979)
SOURCES AND PATHWAYS OF WASTEWATER NITROGEN IN THE SUBSURFACE ENVIRONMENT (Freeze & Cherry, 1979)
NO3
Precipitation
N2O, N2
DecompositionAmmonification
Nitrification
NH4
Adsorption
Groundwater
NO3
NH3
N2(aq)
N2O, N2
Organic-NNH3,NO3
Sewage, Residuals, LivestockFertilizer, Fossil Fuels, Industry
NH4
Leaching
+
+
NH3NO3
N2O
Unsaturatedsoil
Denitrification
Denitrification in reducing zones
Org. N
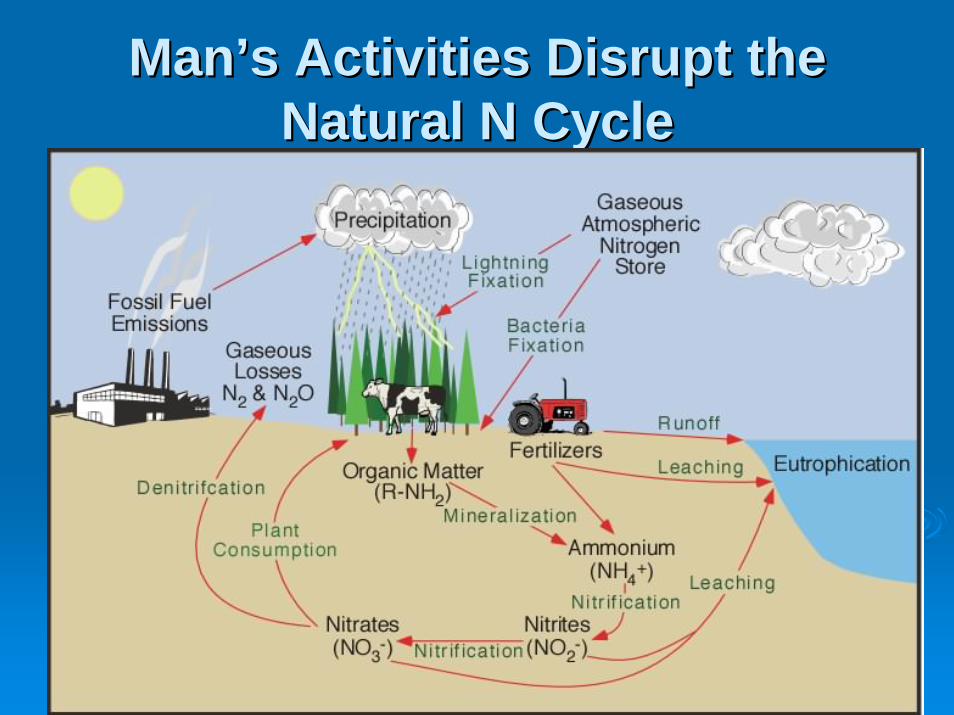
ManMan’’s Activities Disrupt the s Activities Disrupt the Natural N CycleNatural N Cycle
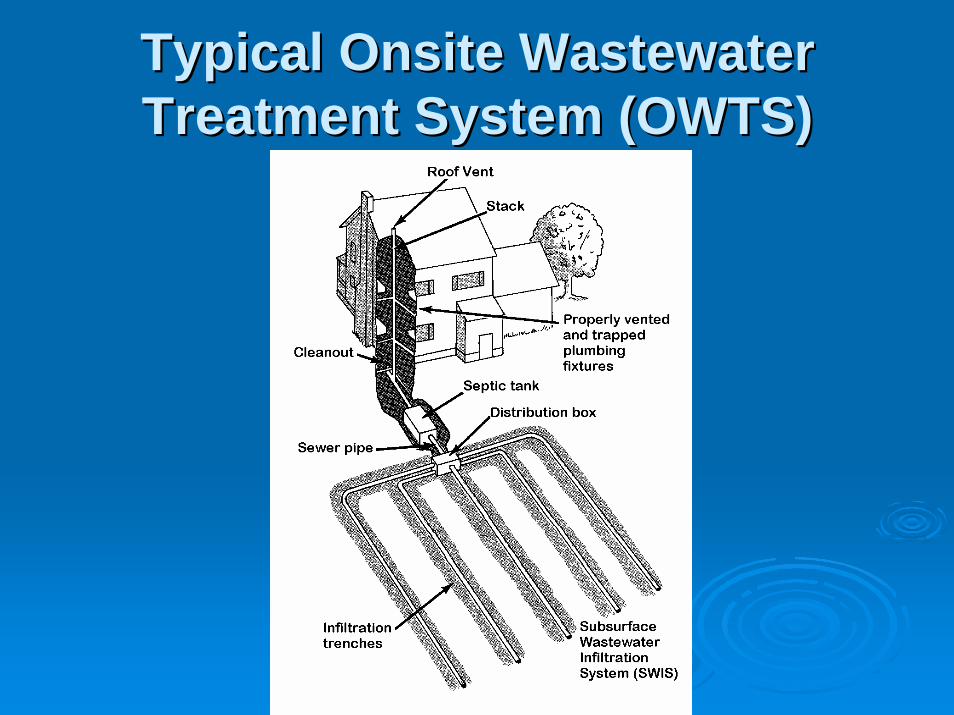
Typical Onsite Wastewater Typical Onsite Wastewater Treatment System (OWTS)Treatment System (OWTS)
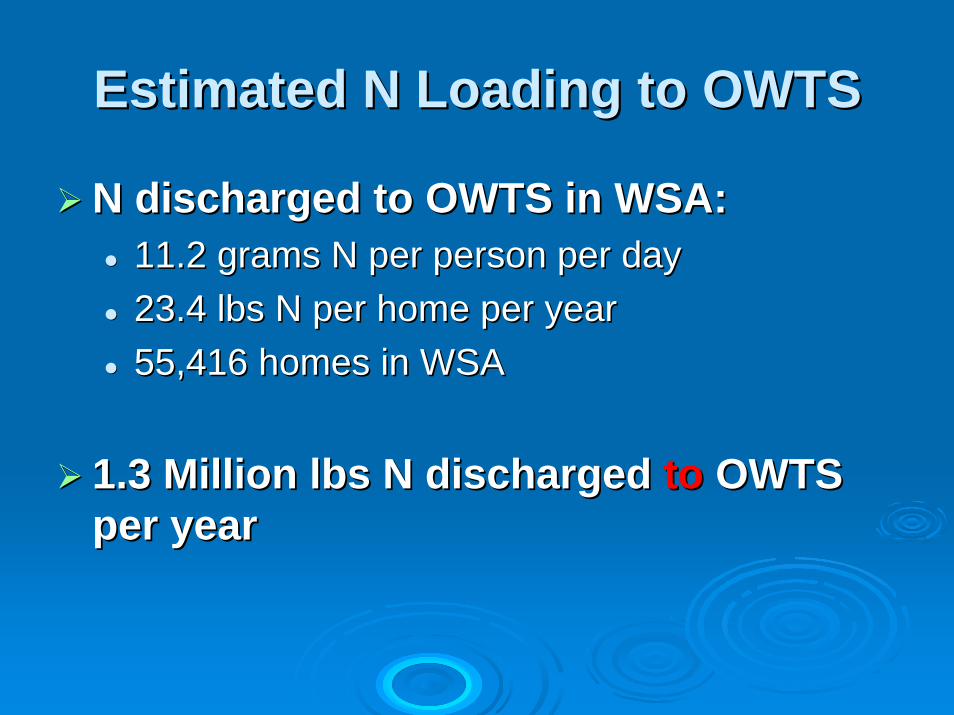
Estimated N Loading to OWTSEstimated N Loading to OWTS
N discharged to OWTS in WSA:N discharged to OWTS in WSA:11.2 grams N per person per day11.2 grams N per person per day23.4 lbs N per home per year23.4 lbs N per home per year55,416 homes in WSA55,416 homes in WSA
1.3 Million lbs N discharged 1.3 Million lbs N discharged toto OWTS OWTS per yearper year
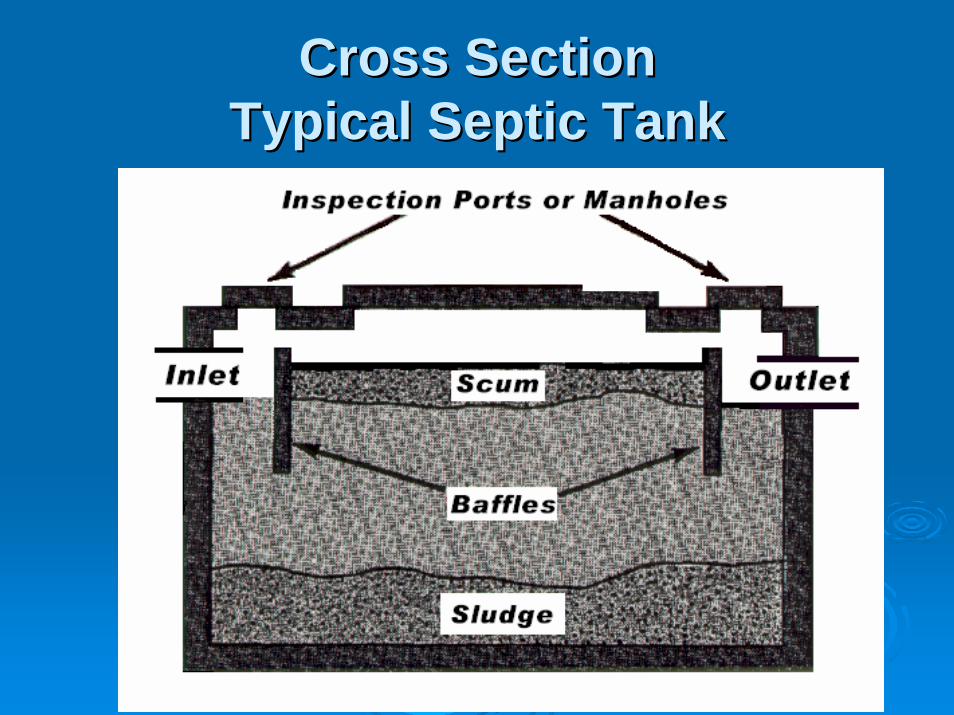
Cross Section Cross Section Typical Septic TankTypical Septic Tank
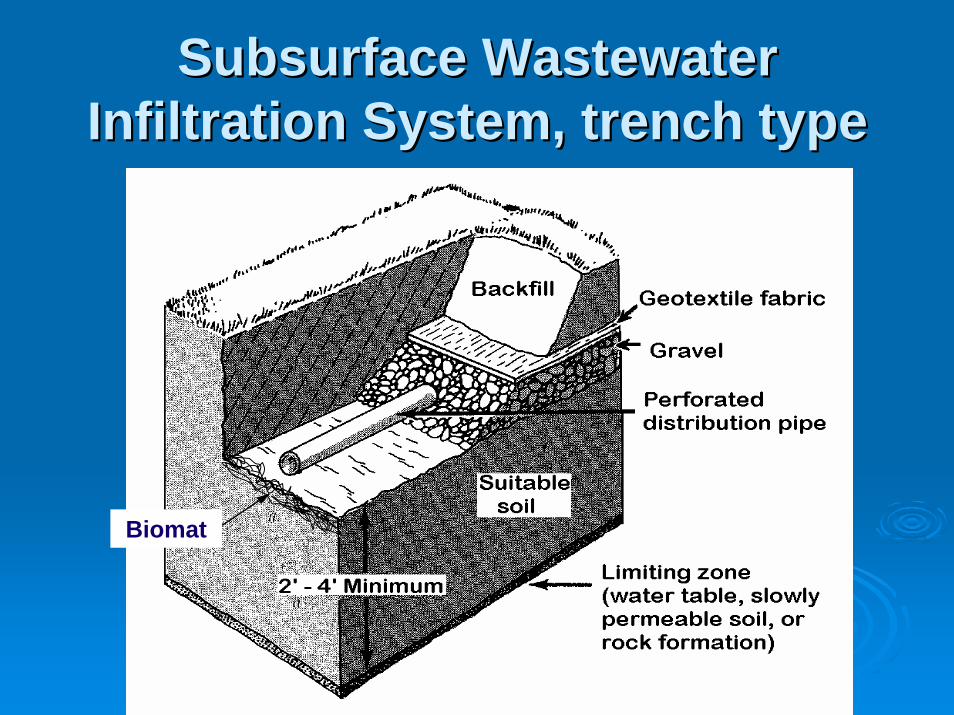
Subsurface Wastewater Subsurface Wastewater Infiltration System, trench typeInfiltration System, trench type
Biomat
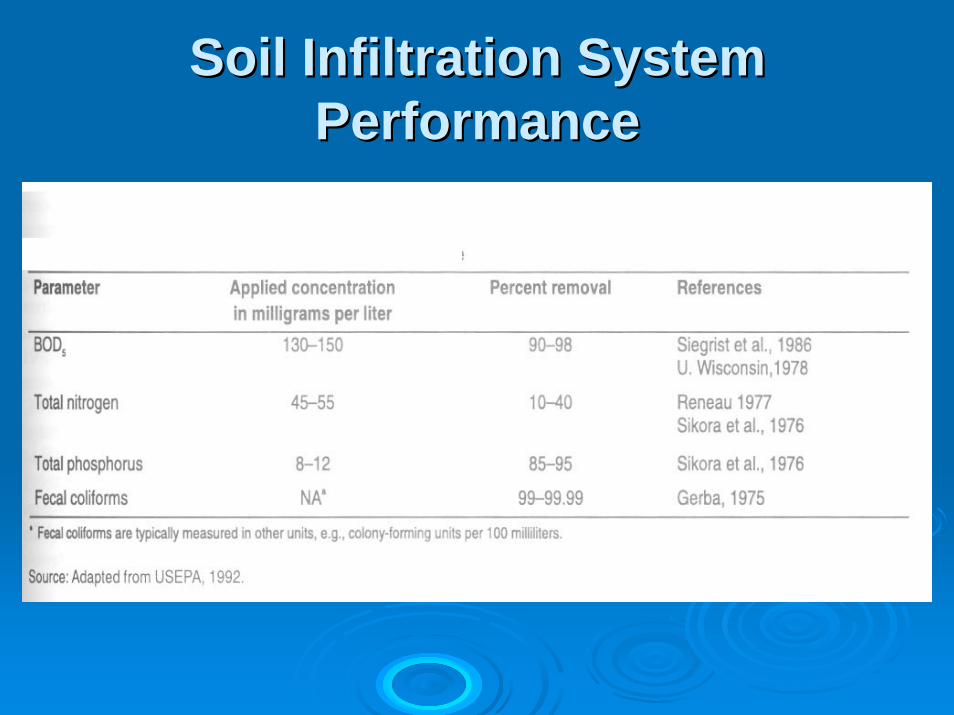
Soil Infiltration System Soil Infiltration System PerformancePerformance
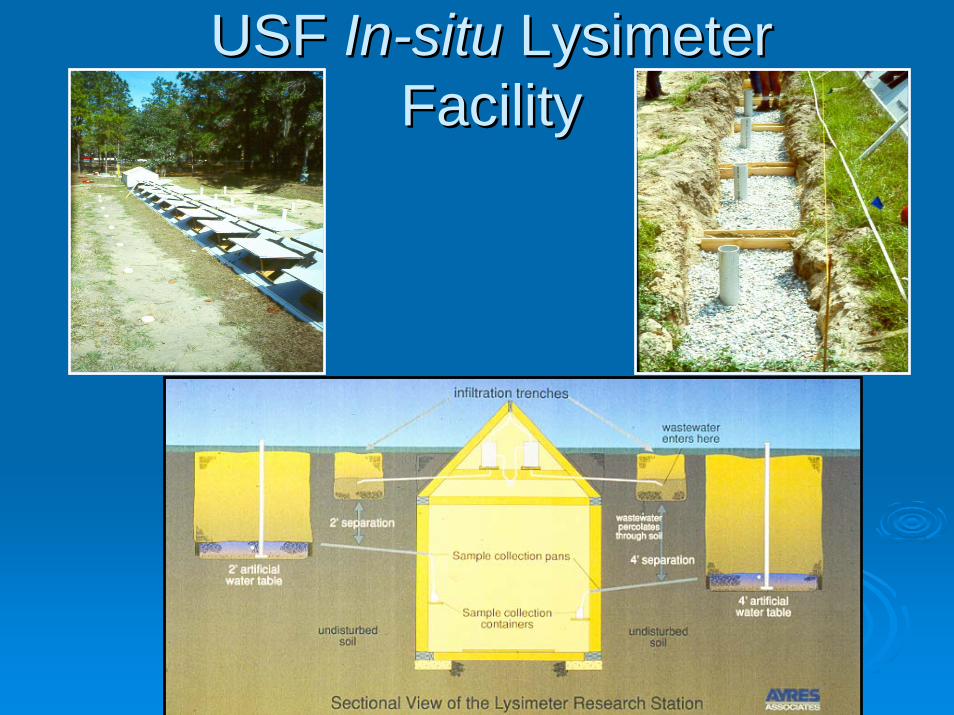
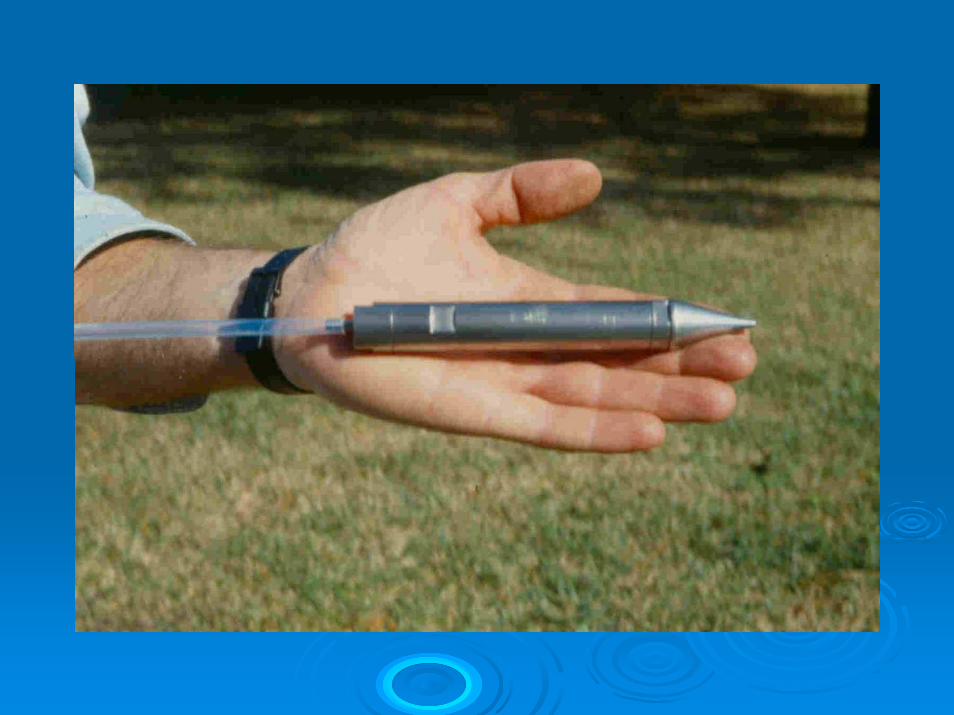
USF USF InIn--situsitu LysimeterLysimeterFacilityFacility
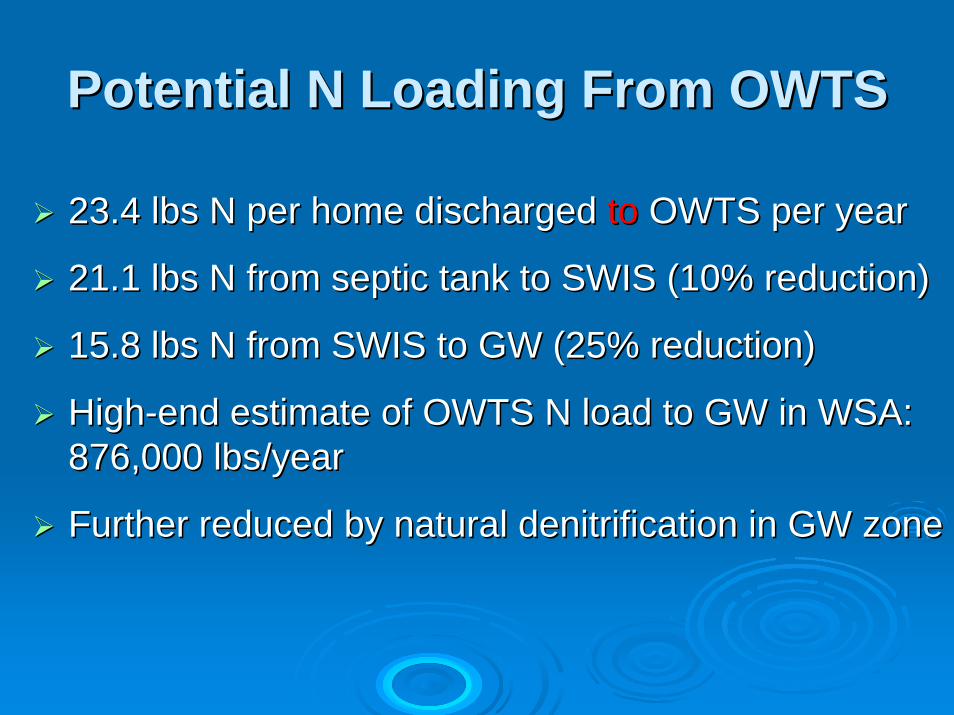
Potential N Loading From OWTSPotential N Loading From OWTS
23.4 lbs N per home discharged 23.4 lbs N per home discharged toto OWTS per yearOWTS per year
21.1 lbs N from septic tank to SWIS (10% reduction)21.1 lbs N from septic tank to SWIS (10% reduction)
15.8 lbs N from SWIS to GW (25% reduction)15.8 lbs N from SWIS to GW (25% reduction)
HighHigh--end estimate of OWTS N load to GW in WSA: end estimate of OWTS N load to GW in WSA: 876,000 lbs/year876,000 lbs/year
Further reduced by natural denitrification in GW zoneFurther reduced by natural denitrification in GW zone
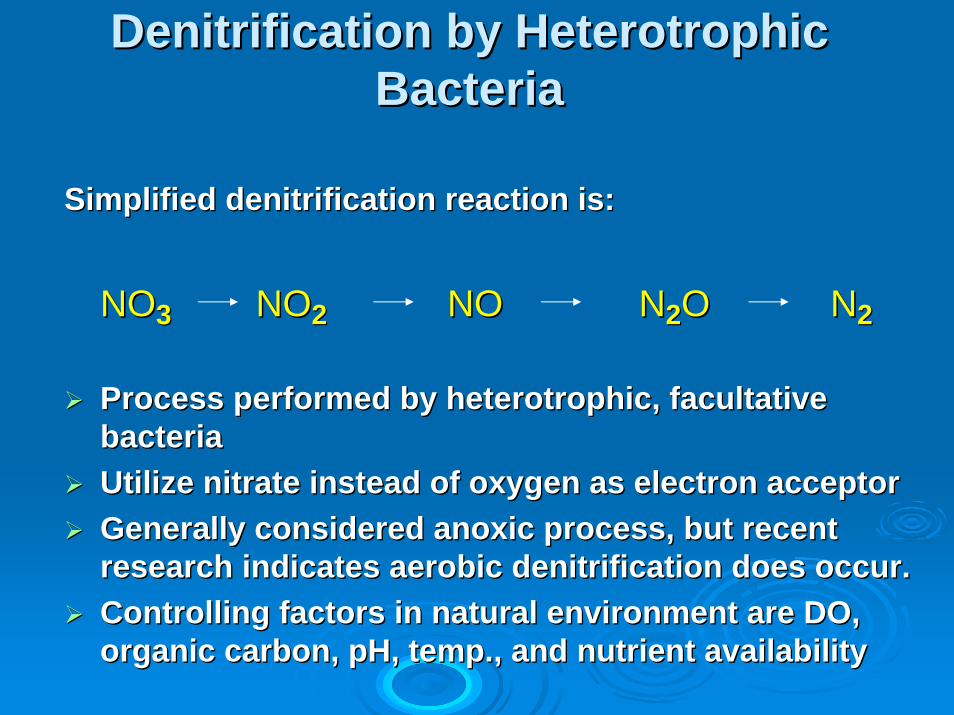
Denitrification by Heterotrophic Denitrification by Heterotrophic BacteriaBacteria
Simplified denitrification reaction is:Simplified denitrification reaction is:
NONO33 NONO22 NONO NN22OO NN22
Process performed by heterotrophic, facultative Process performed by heterotrophic, facultative bacteria bacteria Utilize nitrate instead of oxygen as electron acceptorUtilize nitrate instead of oxygen as electron acceptorGenerally considered anoxic process, but recent Generally considered anoxic process, but recent research indicates aerobic denitrification does occur.research indicates aerobic denitrification does occur.Controlling factors in natural environment are DO, Controlling factors in natural environment are DO, organic carbon, pH, temp., and nutrient availabilityorganic carbon, pH, temp., and nutrient availability
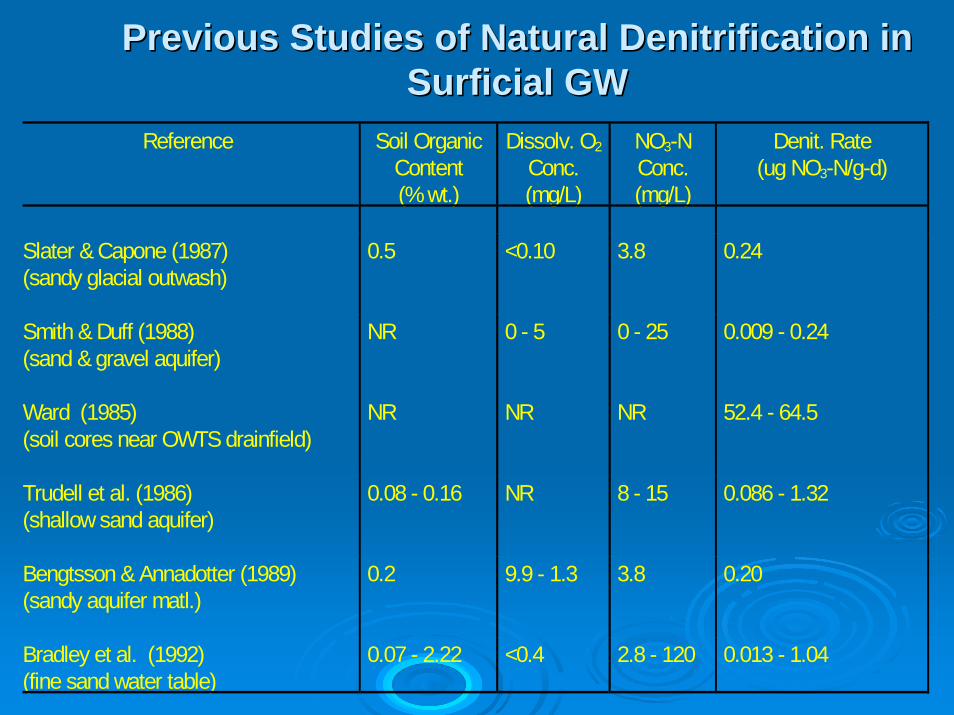
Previous Studies of Natural Denitrification in Previous Studies of Natural Denitrification in SurficialSurficial GWGW
Reference Soil OrganicContent(% wt.)
Dissolv. O2
Conc.(mg/L)
NO3-NConc.(mg/L)
Denit. Rate(ug NO3-N/g-d)
Slater & Capone (1987)(sandy glacial outwash)
0.5 <0.10 3.8 0.24
Smith & Duff (1988)(sand & gravel aquifer)
NR 0 - 5 0 - 25 0.009 - 0.24
Ward (1985)(soil cores near OWTS drainfield)
NR NR NR 52.4 - 64.5
Trudell et al. (1986)(shallow sand aquifer)
0.08 - 0.16 NR 8 - 15 0.086 - 1.32
Bengtsson & Annadotter (1989)(sandy aquifer matl.)
0.2 9.9 - 1.3 3.8 0.20
Bradley et al. (1992)(fine sand water table)
0.07 - 2.22 <0.4 2.8 - 120 0.013 - 1.04
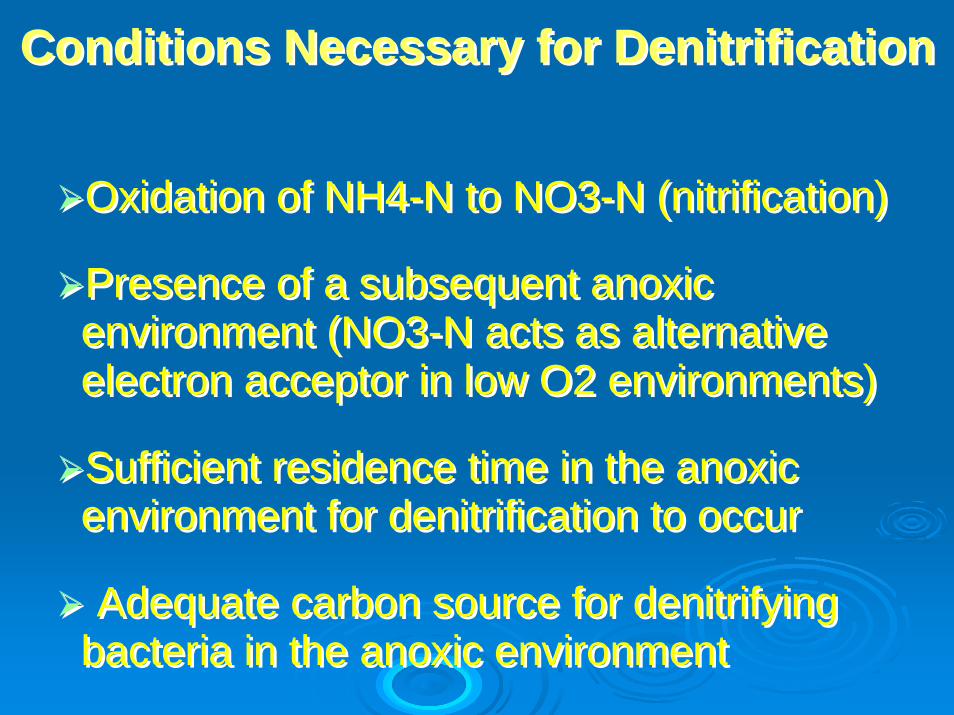
Conditions Necessary for DenitrificationConditions Necessary for Denitrification
Oxidation of NH4-N to NO3-N (nitrification)
Presence of a subsequent anoxic environment (NO3-N acts as alternative electron acceptor in low O2 environments)
Sufficient residence time in the anoxic environment for denitrification to occur
Adequate carbon source for denitrifying bacteria in the anoxic environment
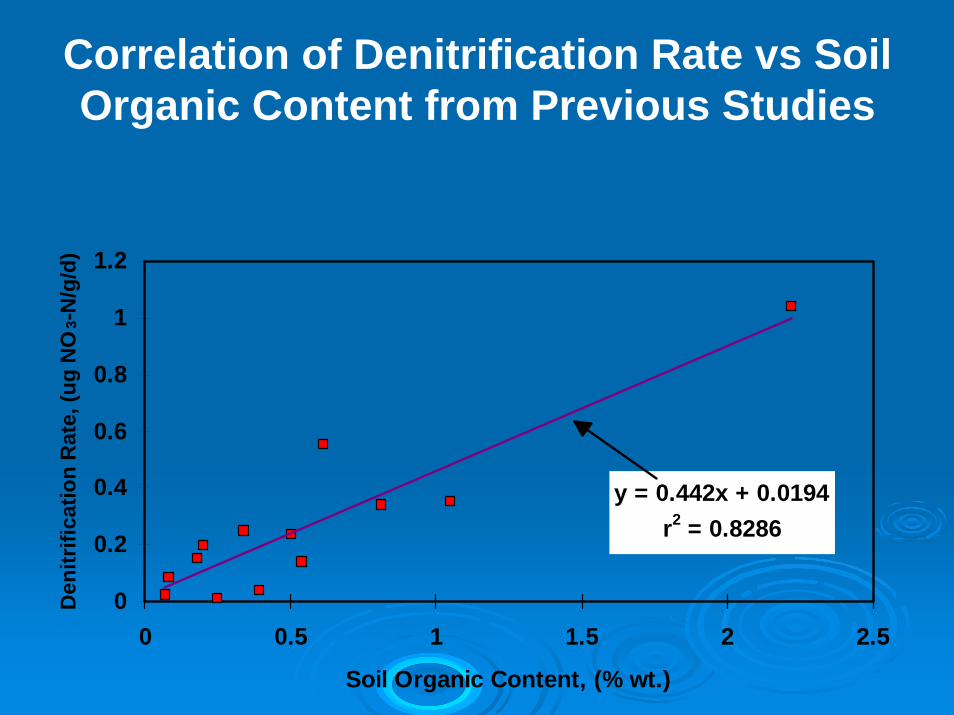
Correlation of Denitrification Rate vs Soil Organic Content from Previous Studies
y = 0.442x + 0.0194r2 = 0.8286
0
0.2
0.4
0.6
0.8
1
1.2
0 0.5 1 1.5 2 2.5
Soil Organic Content, (% wt.)
Den
itrifi
catio
n R
ate,
(ug
NO
3-N
/g/d
)
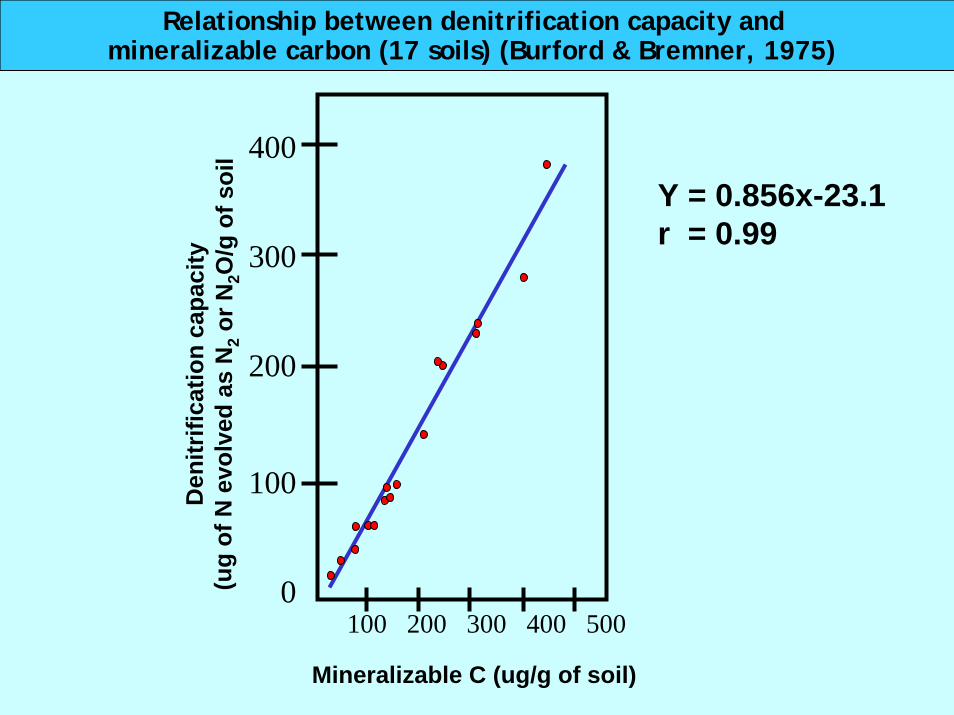
Relationship between denitrification capacity and mineralizable carbon (17 soils) (Burford & Bremner, 1975)
Relationship between denitrification capacity and mineralizable carbon (17 soils) (Burford & Bremner, 1975)
Den
it rif i
c ati o
n c a
paci
ty( u
go f
N e
v olv
e d a
s N
2o r
N2O
/g o
f so i
l 400
300
200
100
0100 200 300 400 500
Y = 0.856x-23.1r = 0.99
Mineralizable C (ug/g of soil)
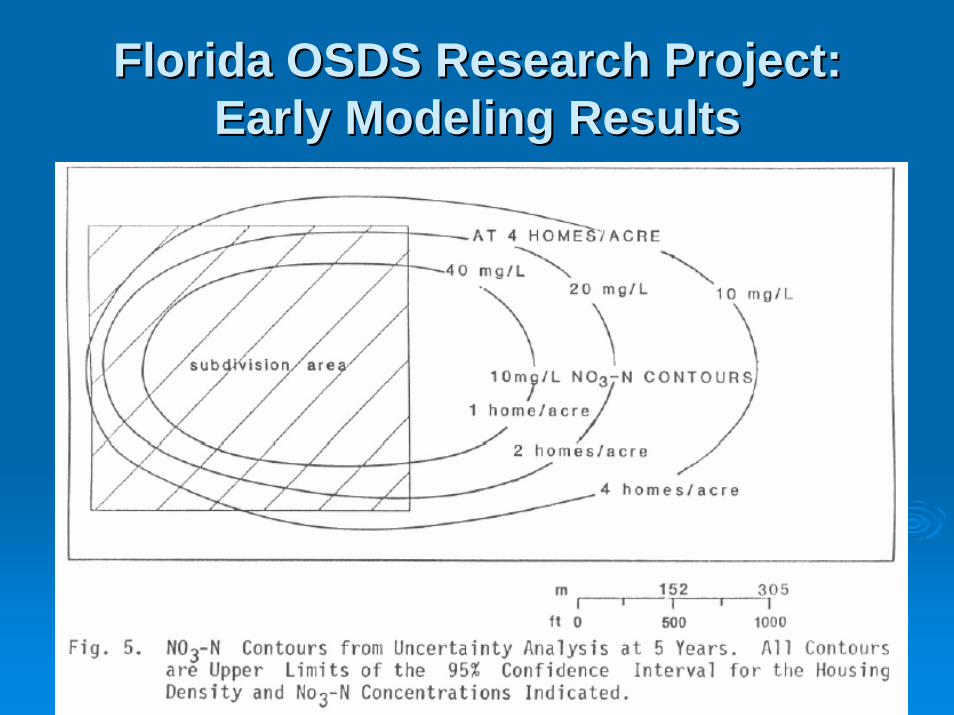
Florida OSDS Research Project: Florida OSDS Research Project: Early Modeling ResultsEarly Modeling Results
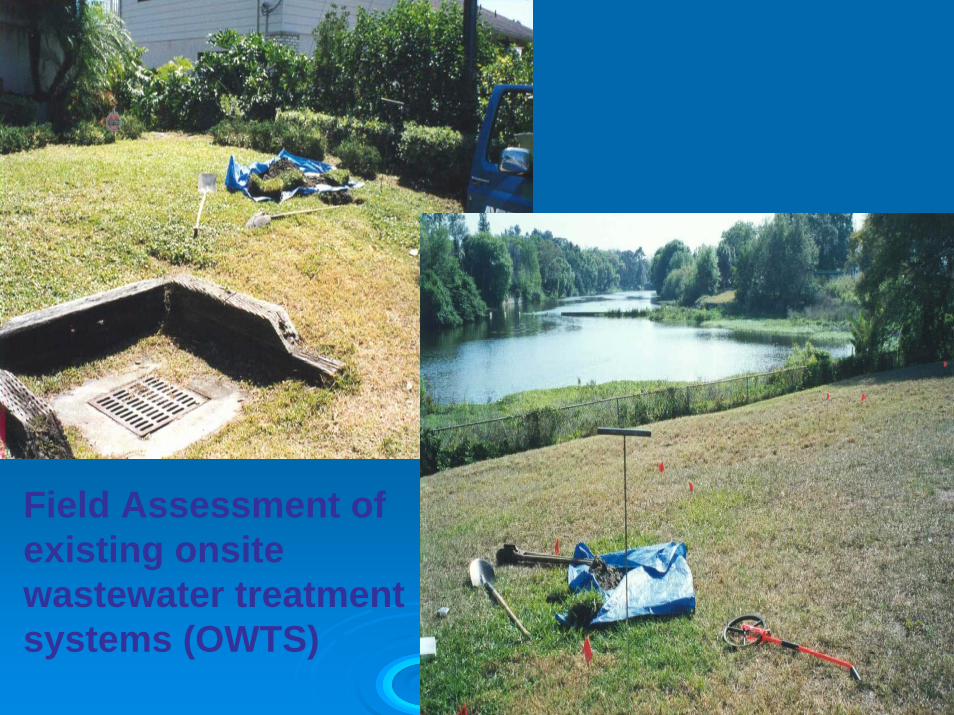
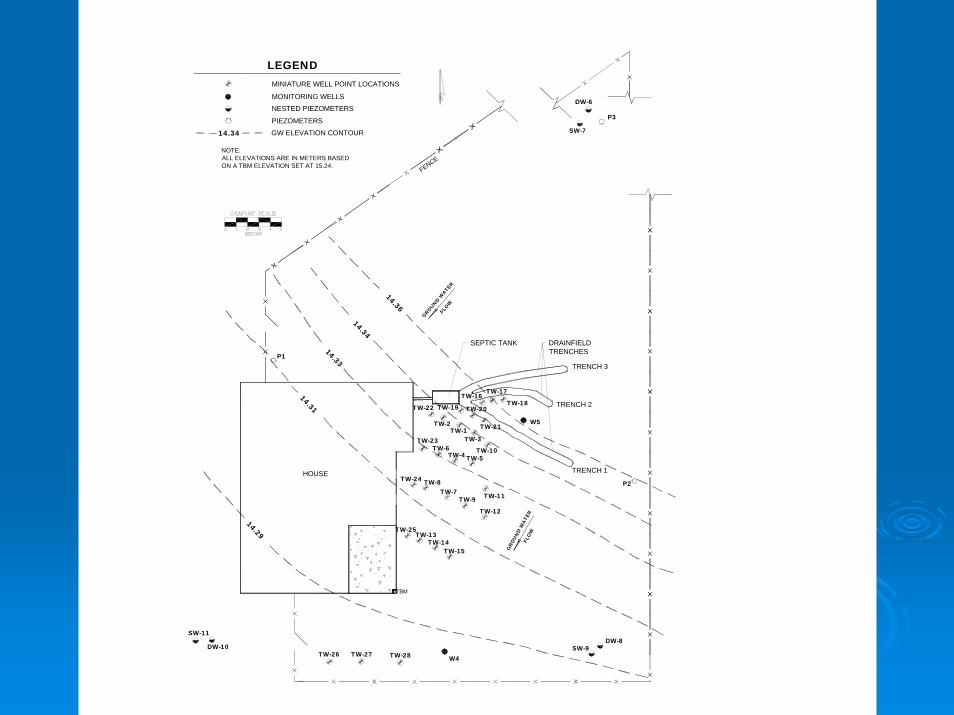
Field Assessment of existing onsite wastewater treatment systems (OWTS)
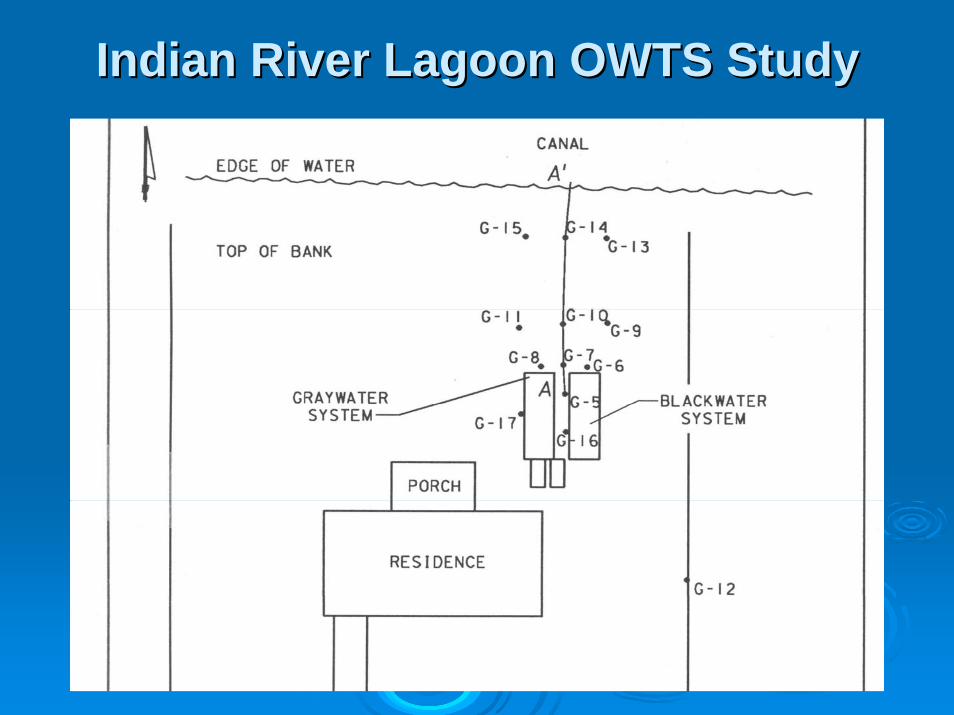
Indian River Lagoon OWTS StudyIndian River Lagoon OWTS Study
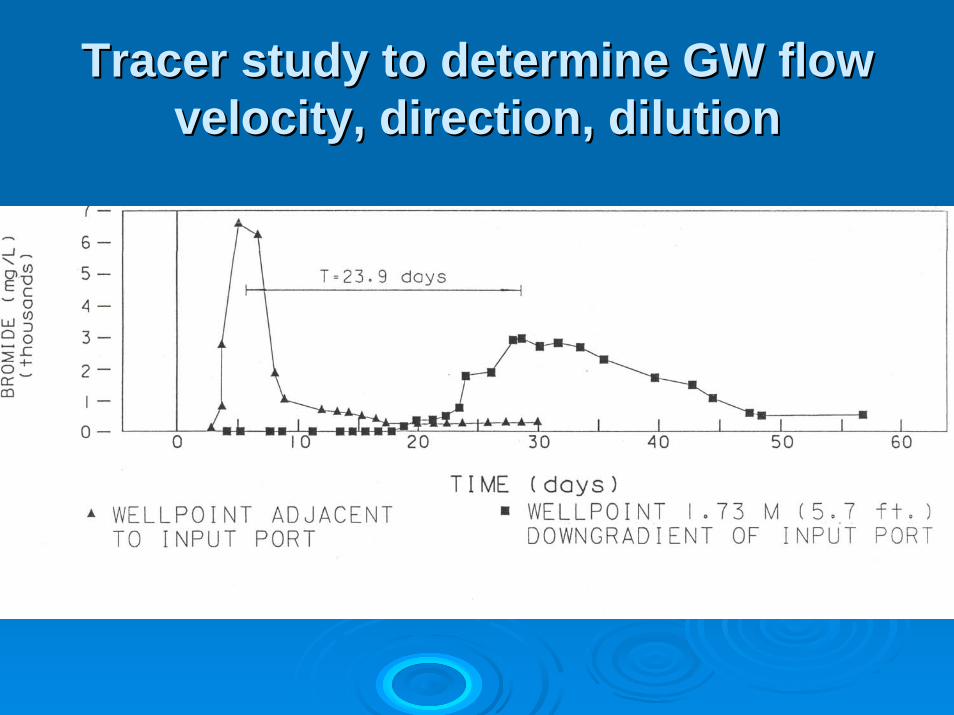
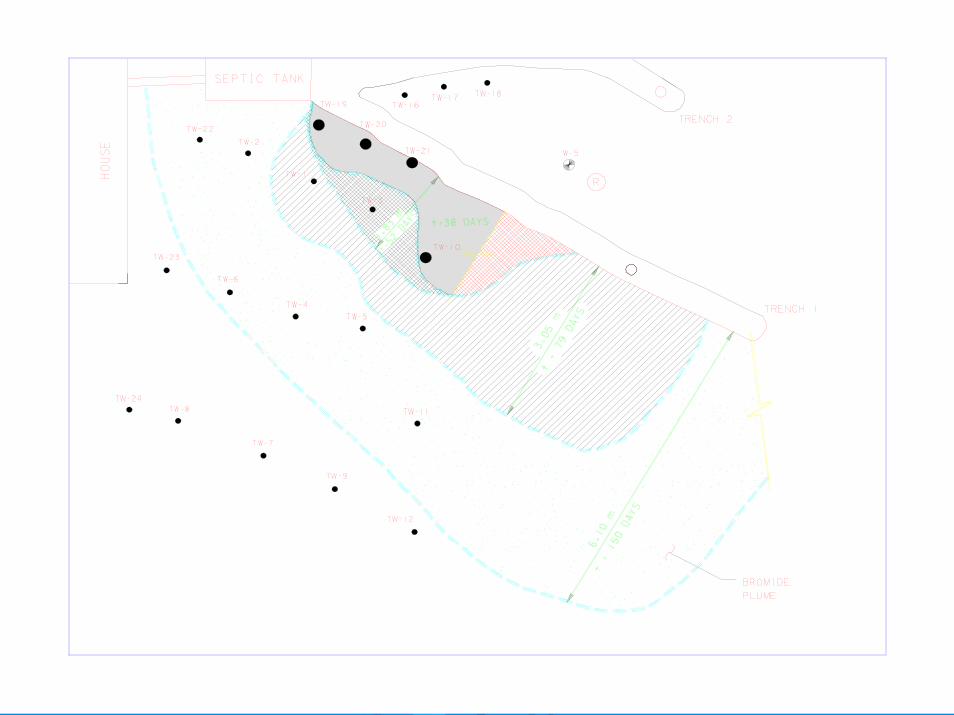
Tracer study to determine GW flow Tracer study to determine GW flow velocity, direction, dilutionvelocity, direction, dilution
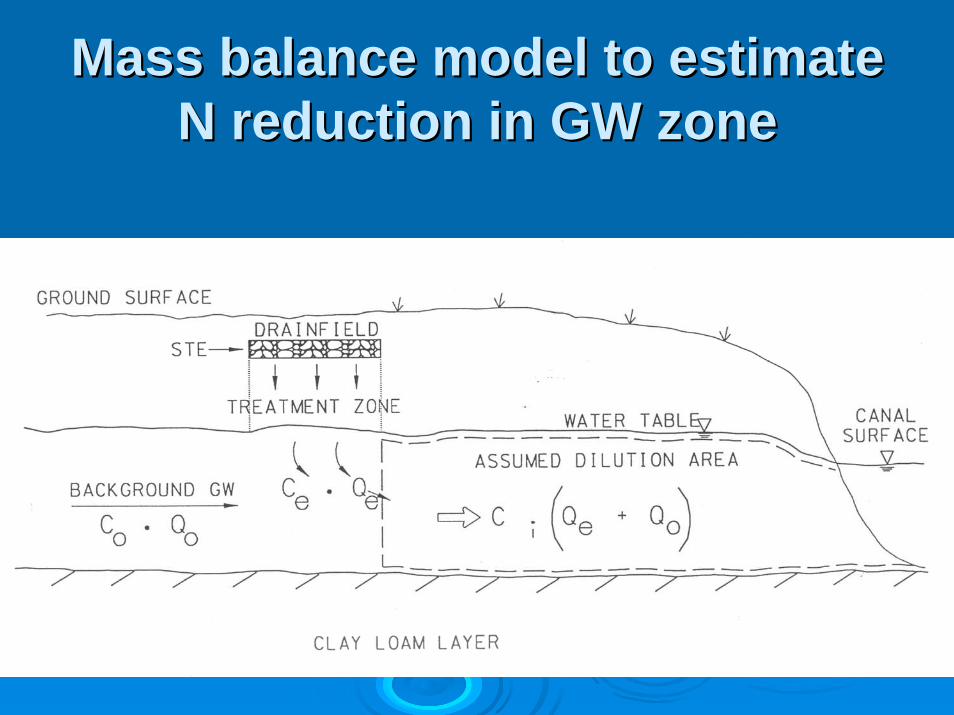
Mass balance model to estimate Mass balance model to estimate N reduction in GW zoneN reduction in GW zone
DW-10
SW-11
W4
DW-8SW-9
P2
W5
P1
P3
SW-7
DW-6
LEGENDMINIATURE WELL POINT LOCATIONS
MONITORING WELLS
HOUSE
14.36
14.34
14.33
14.31
14.29
GROUND WATE
R
FLOW
TW-26 TW-27 TW-28
TW-23
TW-15TW-14
TW-13TW-25
TW-12
TW-7 TW-8 TW-24
TW-6
TW-9 TW-11
TW-4 TW-5
TW-2
TW-22
TW-1 TW-3
TW-10
TW-19 TW-20
TW-21
TW-17
TW-18TW-16
SEPTIC TANK DRAINFIELDTRENCHES
TRENCH 3
TRENCH 2
TRENCH 1
NESTED PIEZOMETERS
PIEZOMETERS
FLO
W
GRO
UN
D W
ATER
FENCENOTE:ALL ELEVATIONS ARE IN METERS BASED ON A TBM ELEVATION SET AT 15.24.
GW ELEVATION CONTOUR14.34
TBM
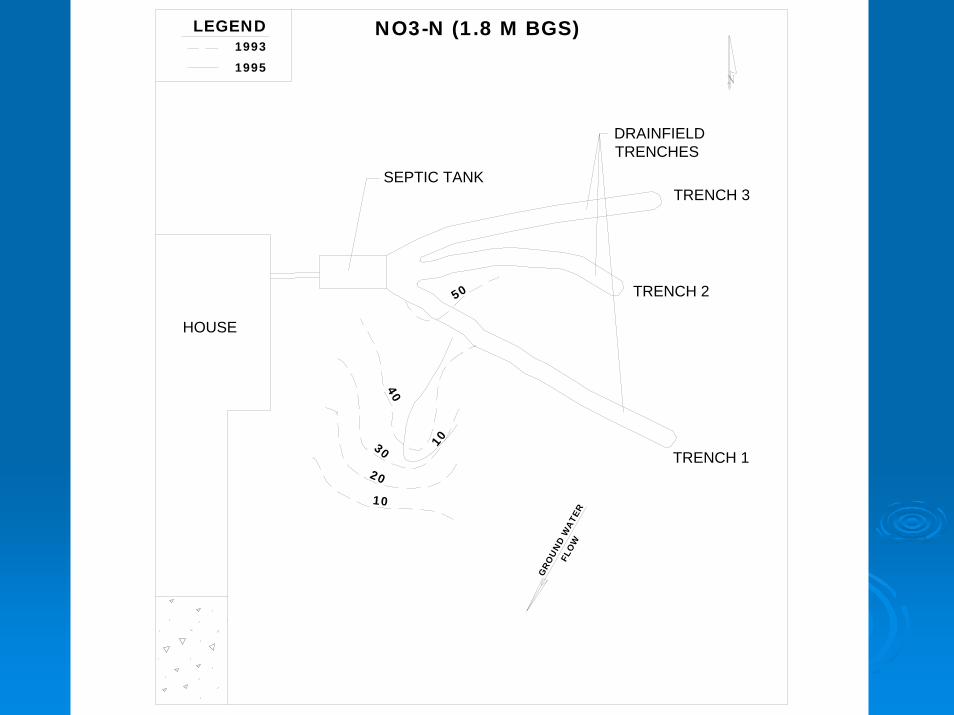
LEGEND1993
1995
HOUSE
DRAINFIELDTRENCHES
TRENCH 3
TRENCH 2
TRENCH 1
FLO
W
GRO
UN
D W
ATER
NO3-N (1.8 M BGS)
50
40
30
20
10
10
SEPTIC TANK
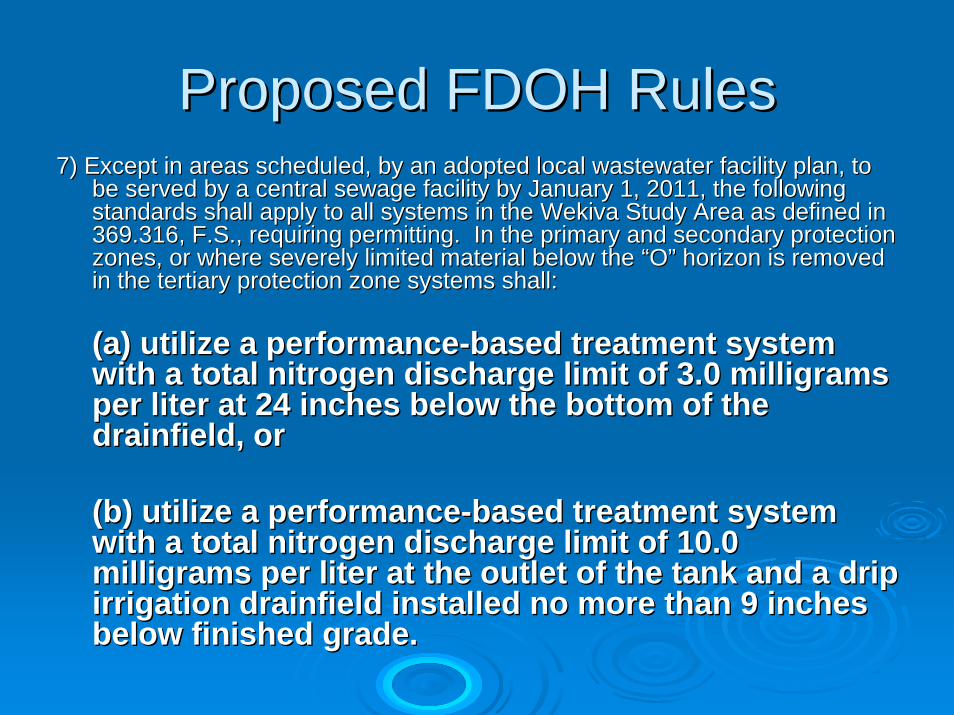
Proposed FDOH RulesProposed FDOH Rules7) Except in areas scheduled, by an adopted local wastewater fac7) Except in areas scheduled, by an adopted local wastewater facility plan, to ility plan, to
be served by a central sewage facility by January 1, 2011, the fbe served by a central sewage facility by January 1, 2011, the following ollowing standards shall apply to all systems in the standards shall apply to all systems in the WekivaWekiva Study Area as defined in Study Area as defined in 369.316, F.S., requiring permitting. In the primary and seconda369.316, F.S., requiring permitting. In the primary and secondary protection ry protection zones, or where severely limited material below the zones, or where severely limited material below the ““OO”” horizon is removed horizon is removed in the tertiary protection zone systems shall:in the tertiary protection zone systems shall:
(a) utilize a performance(a) utilize a performance--based treatment system based treatment system with a total nitrogen discharge limit of 3.0 milligrams with a total nitrogen discharge limit of 3.0 milligrams per liter at 24 inches below the bottom of the per liter at 24 inches below the bottom of the drainfielddrainfield, or, or
(b) utilize a performance(b) utilize a performance--based treatment system based treatment system with a total nitrogen discharge limit of 10.0 with a total nitrogen discharge limit of 10.0 milligrams per liter at the outlet of the tank and a drip milligrams per liter at the outlet of the tank and a drip irrigation irrigation drainfielddrainfield installed no more than 9 inches installed no more than 9 inches below finished grade.below finished grade.
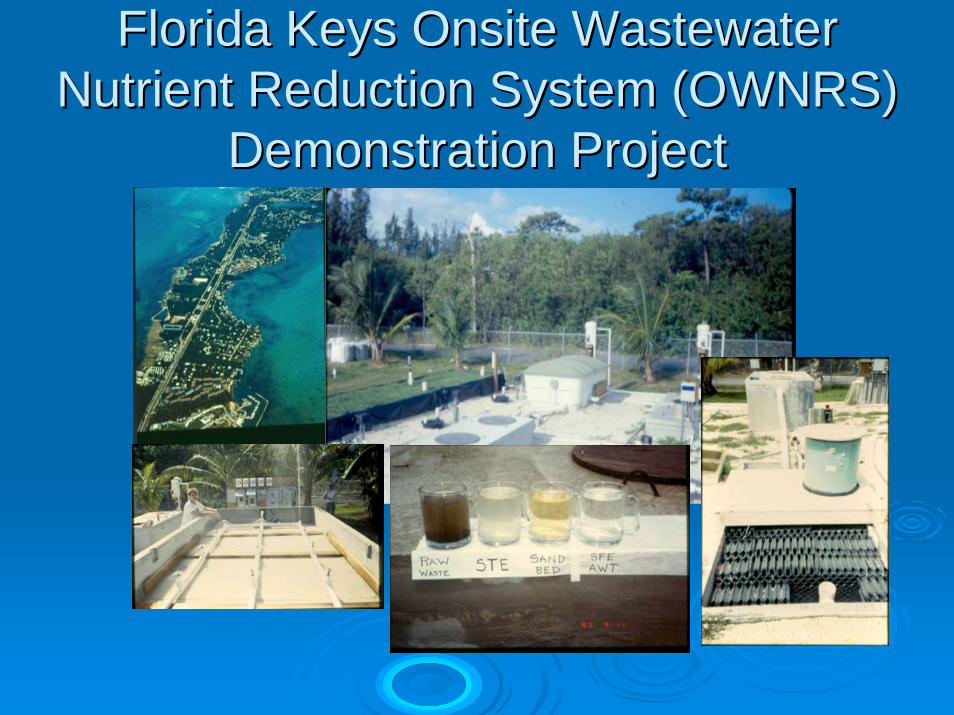
Florida Keys Onsite Wastewater Florida Keys Onsite Wastewater Nutrient Reduction System (OWNRS) Nutrient Reduction System (OWNRS)
Demonstration ProjectDemonstration Project
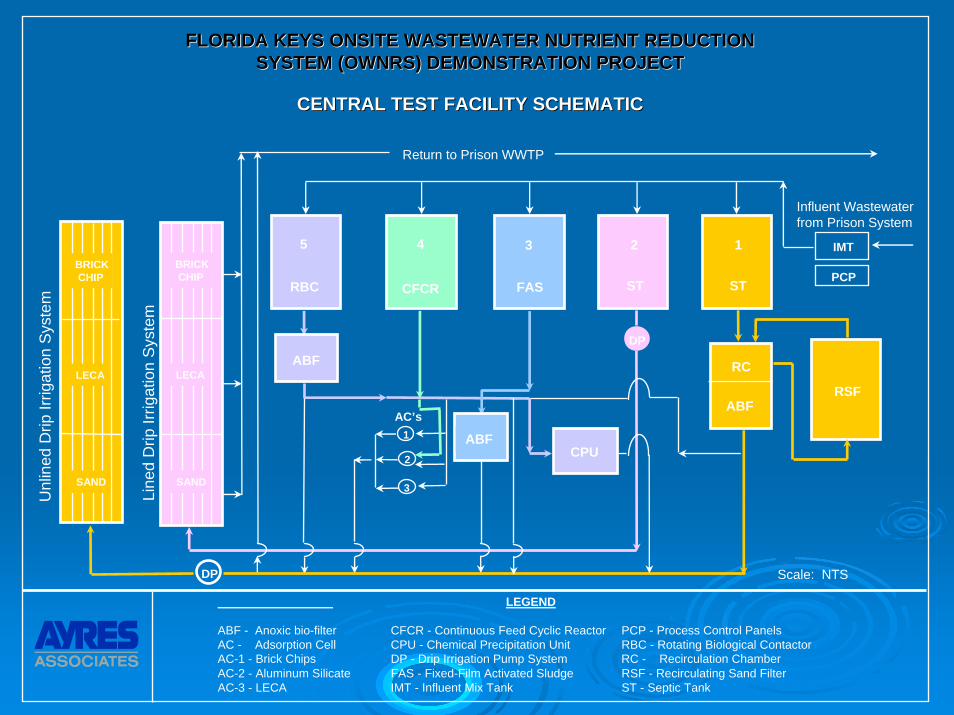
FLORIDA KEYS ONSITE WASTEWATER NUTRIENT REDUCTIONFLORIDA KEYS ONSITE WASTEWATER NUTRIENT REDUCTIONSYSTEM (OWNRS) DEMONSTRATION PROJECTSYSTEM (OWNRS) DEMONSTRATION PROJECT
CENTRAL TEST FACILITY SCHEMATICCENTRAL TEST FACILITY SCHEMATIC
Influent Wastewaterfrom Prison System
4
CFCR
3
FAS
1
ST
LEGEND
ABF - Anoxic bio-filter CFCR - Continuous Feed Cyclic Reactor PCP - Process Control Panels AC - Adsorption Cell CPU - Chemical Precipitation Unit RBC - Rotating Biological Contactor AC-1 - Brick Chips DP - Drip Irrigation Pump System RC - Recirculation Chamber AC-2 - Aluminum Silicate FAS - Fixed-Film Activated Sludge RSF - Recirculating Sand FilterAC-3 - LECA IMT - Influent Mix Tank ST - Septic Tank
Unl
ined
Drip
Irrig
atio
n S
yste
m
Line
d D
rip Ir
rigat
ion
Sys
tem
AC’s
CPU
Return to Prison WWTP
IMT
PCP
ABF
DP
2
ST
DP
ABF
RC
RSF
3
1
2
SAND
LECA
BRICKCHIP
SAND
LECA
BRICKCHIP
Scale: NTS
5
RBC
ABF
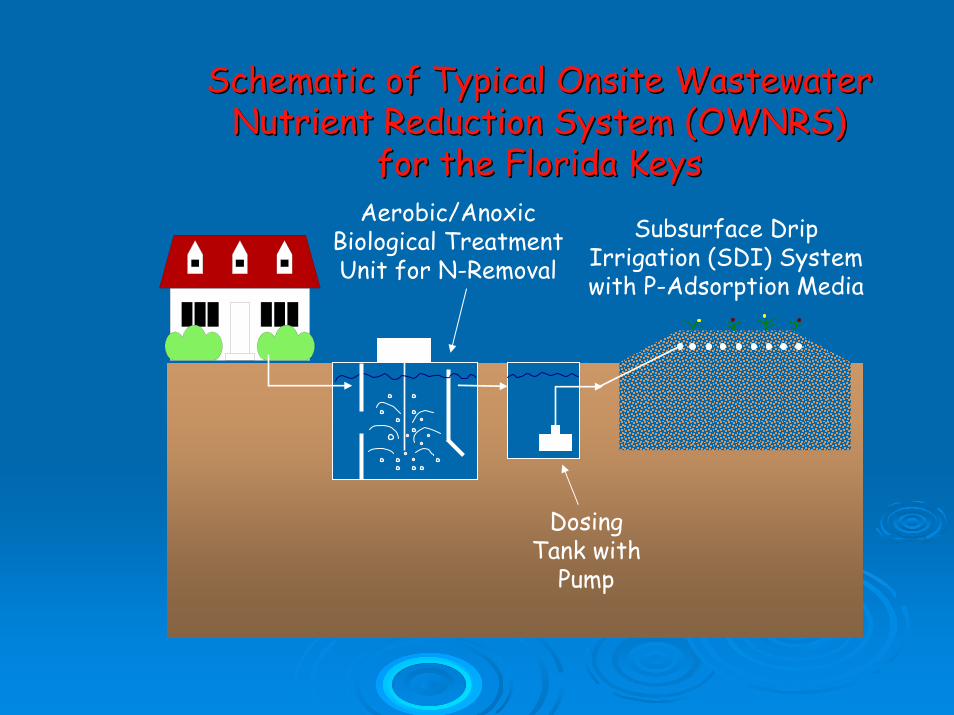
Schematic of Typical Onsite Wastewater Schematic of Typical Onsite Wastewater Nutrient Reduction System (OWNRS) Nutrient Reduction System (OWNRS)
for the Florida Keysfor the Florida KeysAerobic/Anoxic
Biological TreatmentUnit for N-Removal
Subsurface DripIrrigation (SDI) Systemwith P-Adsorption Media
DosingTank with
Pump
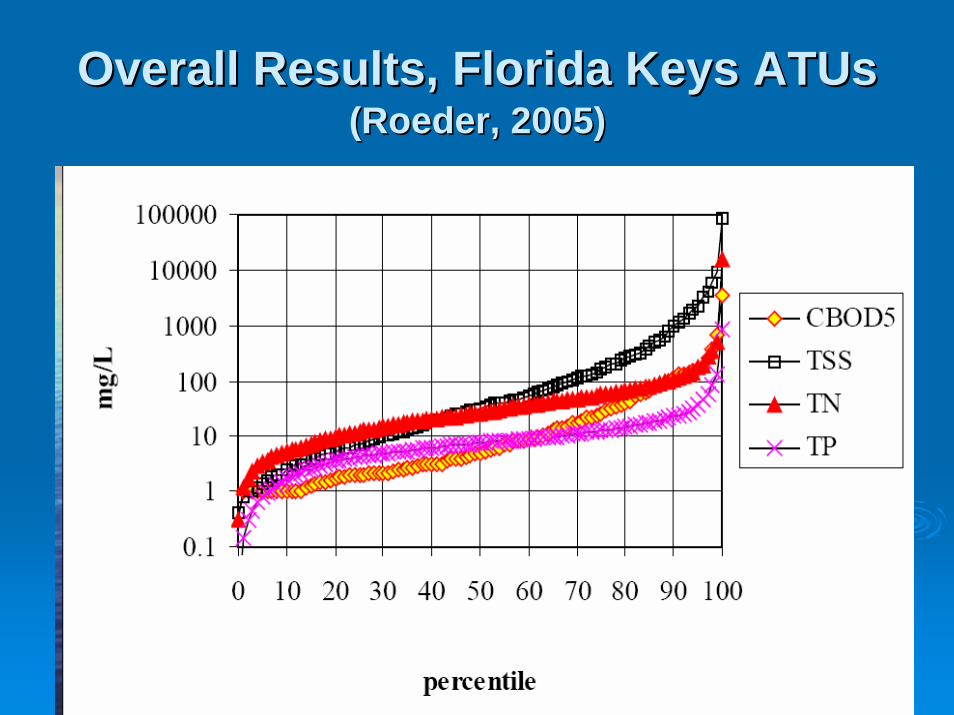
Overall Results, Florida Keys Overall Results, Florida Keys ATUsATUs(Roeder, 2005)(Roeder, 2005)
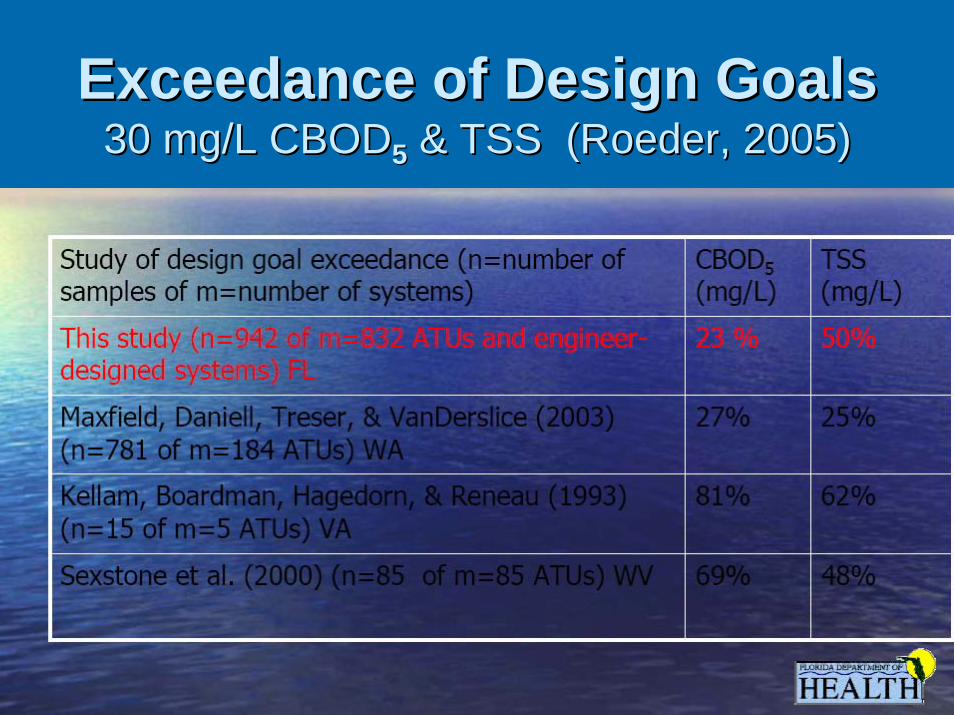
ExceedanceExceedance of Design Goalsof Design Goals30 mg/L CBOD30 mg/L CBOD55 & TSS (Roeder, 2005)& TSS (Roeder, 2005)
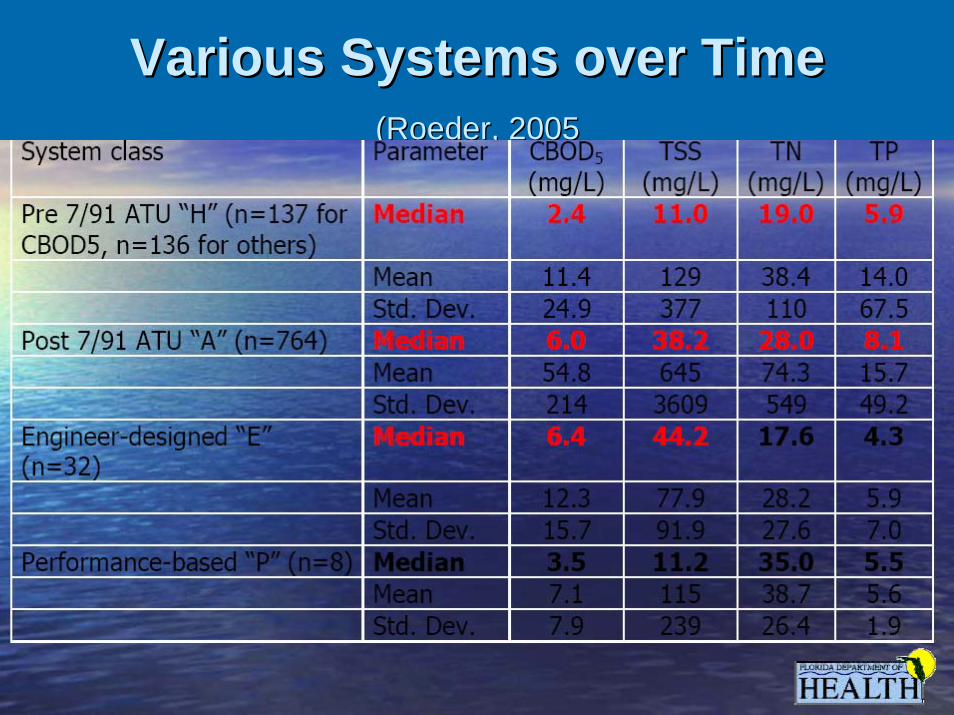
Various Systems over TimeVarious Systems over Time(Roeder, 2005(Roeder, 2005
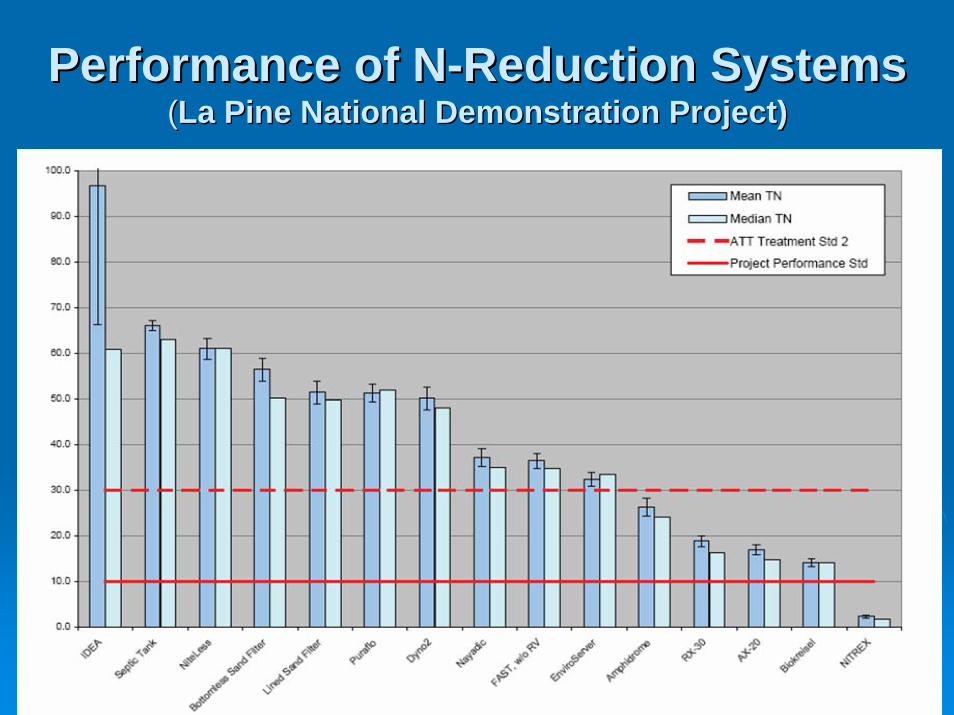
Performance of NPerformance of N--Reduction SystemsReduction Systems((La Pine National Demonstration Project)La Pine National Demonstration Project)
Cost of OWNRSCost of OWNRS
Capital Cost approximately $12,000 for Capital Cost approximately $12,000 for average home, but will be more for many, average home, but will be more for many, less for someless for some
Operation and Maintenance cost Operation and Maintenance cost estimated at approximately $1100 per year estimated at approximately $1100 per year including all costs over life of system including all costs over life of system (repairs, replacement, residuals, power,(repairs, replacement, residuals, power,……))
Cost of OWNRS (cont.)Cost of OWNRS (cont.)
Annual lifeAnnual life--cycle cost approximately cycle cost approximately $2232; or $186 per month$2232; or $186 per month
This cost compares closely to results of This cost compares closely to results of other studies such as Monroe County other studies such as Monroe County SWMP and Sarasota County PCSSRPSWMP and Sarasota County PCSSRP
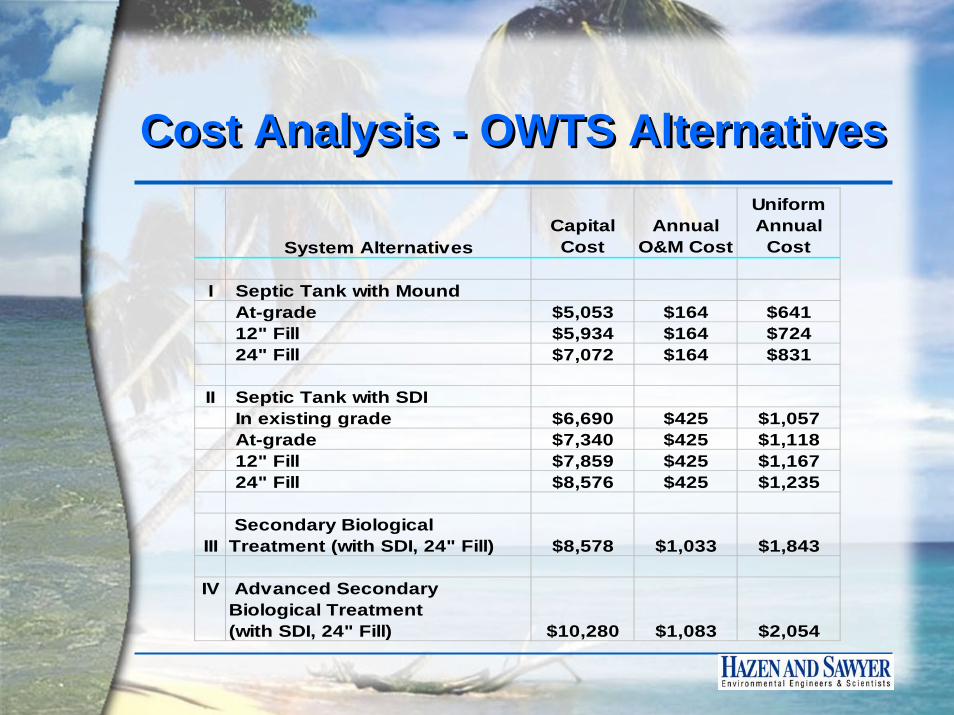
Cost Analysis - OWTS AlternativesCost Analysis - OWTS Alternatives
System AlternativesCapital Cost
Annual O&M Cost
Uniform Annual
Cost
I Septic Tank with MoundAt-grade $5,053 $164 $64112" Fill $5,934 $164 $72424" Fill $7,072 $164 $831
II Septic Tank with SDIIn existing grade $6,690 $425 $1,057At-grade $7,340 $425 $1,11812" Fill $7,859 $425 $1,16724" Fill $8,576 $425 $1,235
III Secondary Biological Treatment (with SDI, 24" Fill) $8,578 $1,033 $1,843
IV Advanced Secondary Biological Treatment (with SDI, 24" Fill) $10,280 $1,083 $2,054
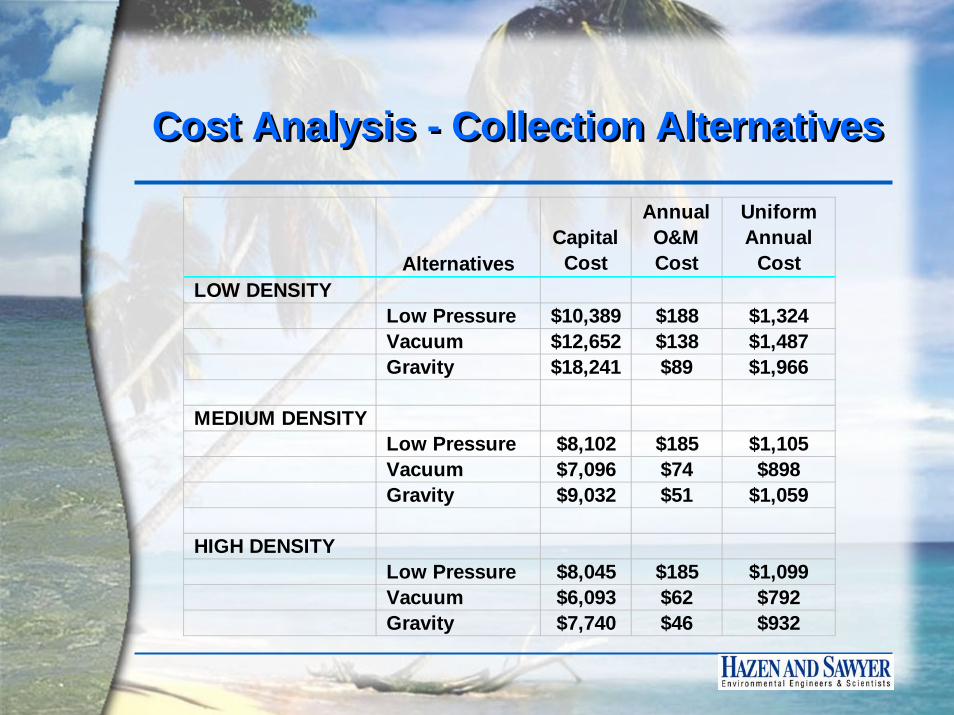
Cost Analysis - Collection AlternativesCost Analysis - Collection Alternatives
AlternativesCapital
Cost
Annual O&M Cost
Uniform Annual
CostLOW DENSITY
Low Pressure $10,389 $188 $1,324Vacuum $12,652 $138 $1,487Gravity $18,241 $89 $1,966
MEDIUM DENSITYLow Pressure $8,102 $185 $1,105Vacuum $7,096 $74 $898Gravity $9,032 $51 $1,059
HIGH DENSITYLow Pressure $8,045 $185 $1,099Vacuum $6,093 $62 $792Gravity $7,740 $46 $932
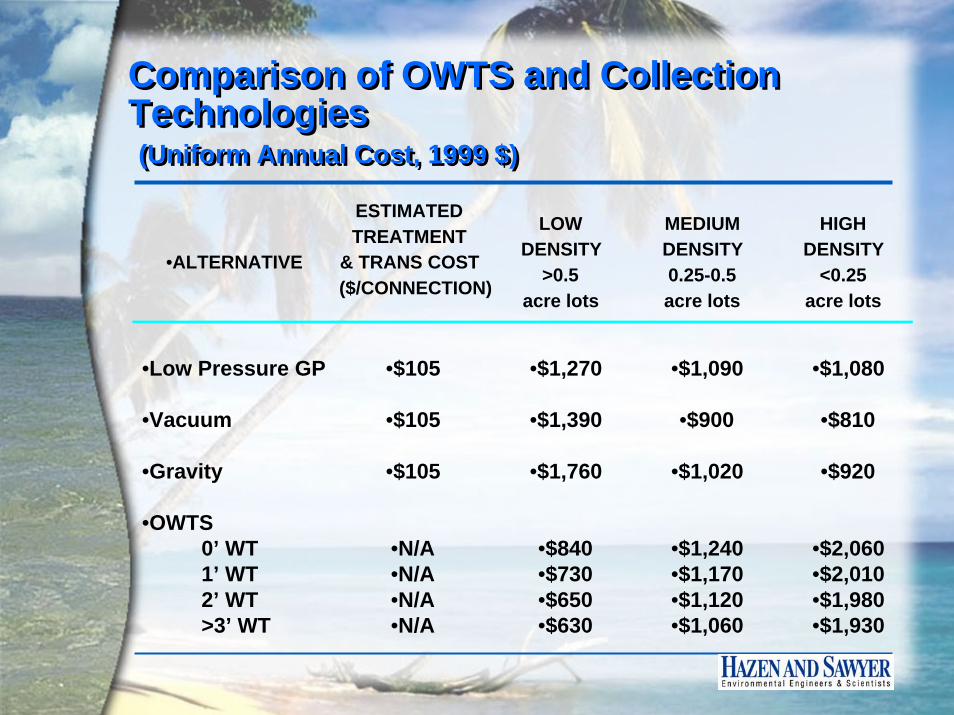
Comparison of OWTS and Collection Technologies(Uniform Annual Cost, 1999 $)
Comparison of OWTS and Collection Technologies(Uniform Annual Cost, 1999 $)
ESTIMATEDTREATMENT
& TRANS COST($/CONNECTION)
LOWDENSITY
>0.5acre lots
MEDIUMDENSITY0.25-0.5acre lots
HIGHDENSITY
<0.25acre lots
•ALTERNATIVE
•Low Pressure GP •$105 •$1,270 •$1,090 •$1,080
•Vacuum •$105 •$1,390 •$900 •$810
•Gravity •$105 •$1,760 •$1,020 •$920
•OWTS0’ WT1’ WT2’ WT>3’ WT
•N/A •$840 •$1,240 •$2,060•N/A •$730 •$1,170 •$2,010•N/A •$650 •$1,120 •$1,980•N/A •$630 •$1,060 •$1,930
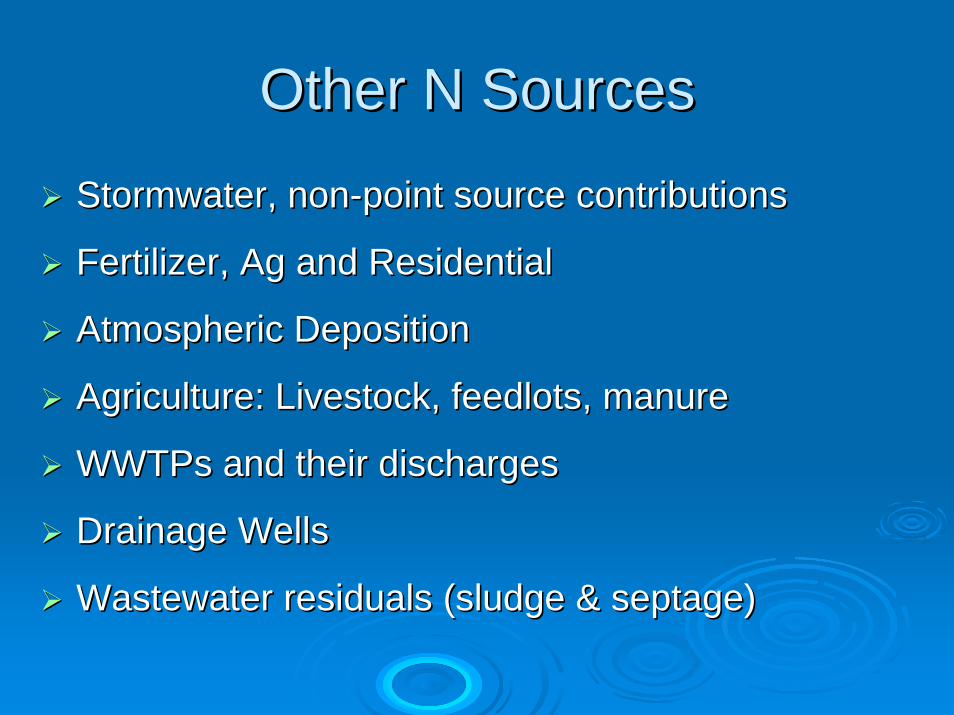
Other N SourcesOther N Sources
StormwaterStormwater, non, non--point source contributionspoint source contributions
Fertilizer, Ag and ResidentialFertilizer, Ag and Residential
Atmospheric DepositionAtmospheric Deposition
Agriculture: Livestock, feedlots, manureAgriculture: Livestock, feedlots, manure
WWTPsWWTPs and their dischargesand their discharges
Drainage WellsDrainage Wells
Wastewater residuals (sludge & Wastewater residuals (sludge & septageseptage))
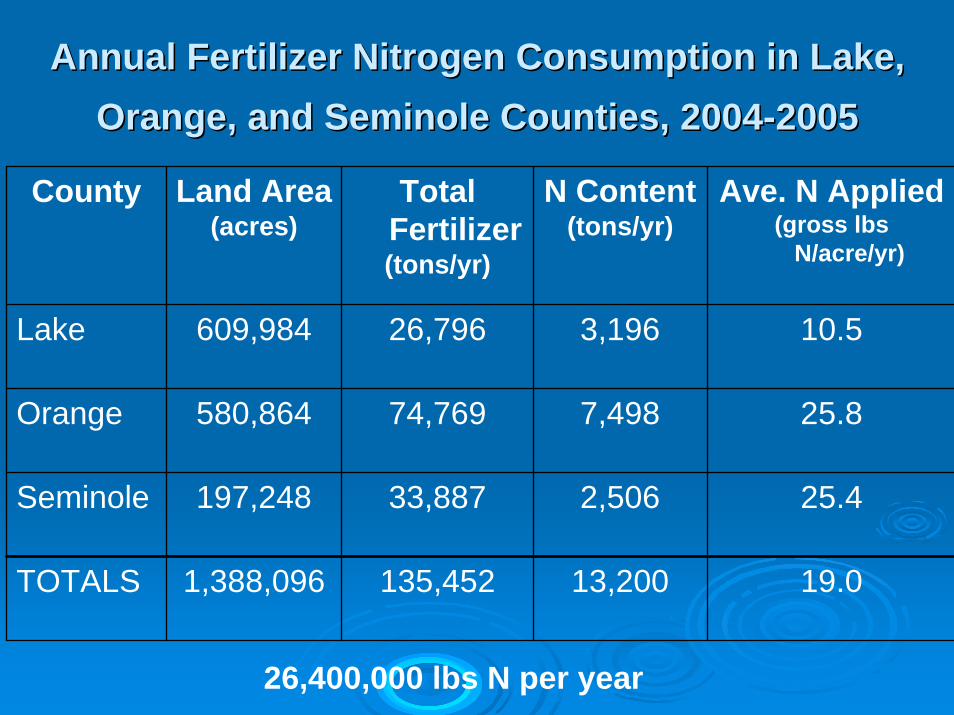
Annual Fertilizer Nitrogen Consumption in Lake, Annual Fertilizer Nitrogen Consumption in Lake, Orange, and Seminole Counties, 2004Orange, and Seminole Counties, 2004--20052005
County Land Area(acres)
Total Fertilizer(tons/yr)
N Content(tons/yr)
Ave. N Applied(gross lbs
N/acre/yr)
Lake 609,984 26,796 3,196 10.5
Orange 580,864 74,769 7,498 25.8
Seminole 197,248 33,887 2,506 25.4
TOTALS 1,388,096 135,452 13,200 19.0
26,400,000 lbs N per year
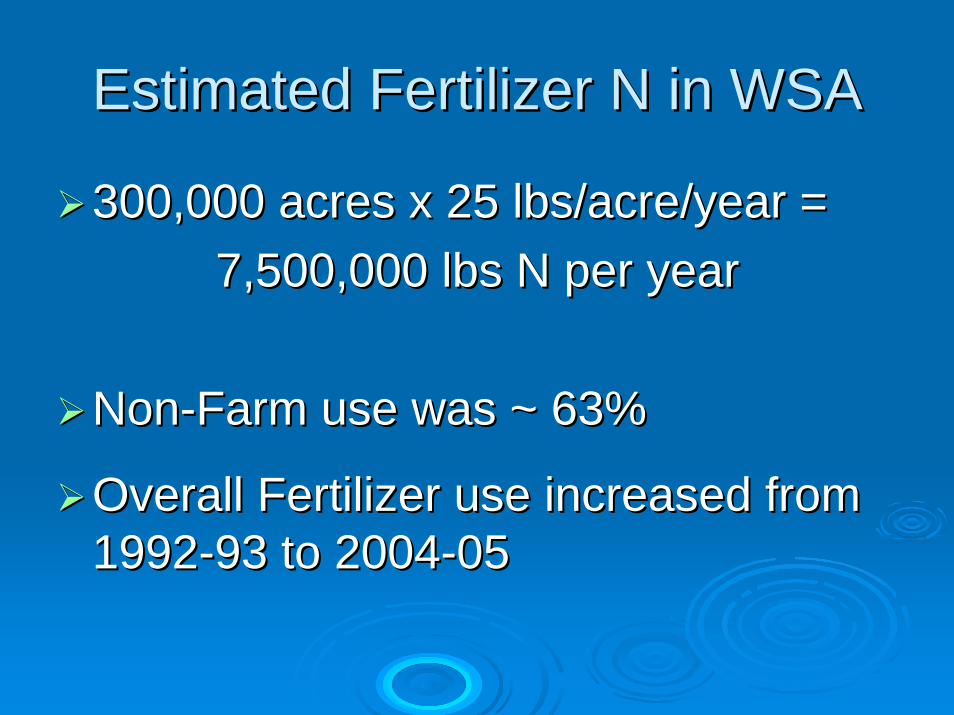
Estimated Fertilizer N in WSAEstimated Fertilizer N in WSA
300,000 acres x 25 lbs/acre/year = 300,000 acres x 25 lbs/acre/year = 7,500,000 lbs N per year7,500,000 lbs N per year
NonNon--Farm use was ~ 63%Farm use was ~ 63%
Overall Fertilizer use increased from Overall Fertilizer use increased from 19921992--93 to 200493 to 2004--0505

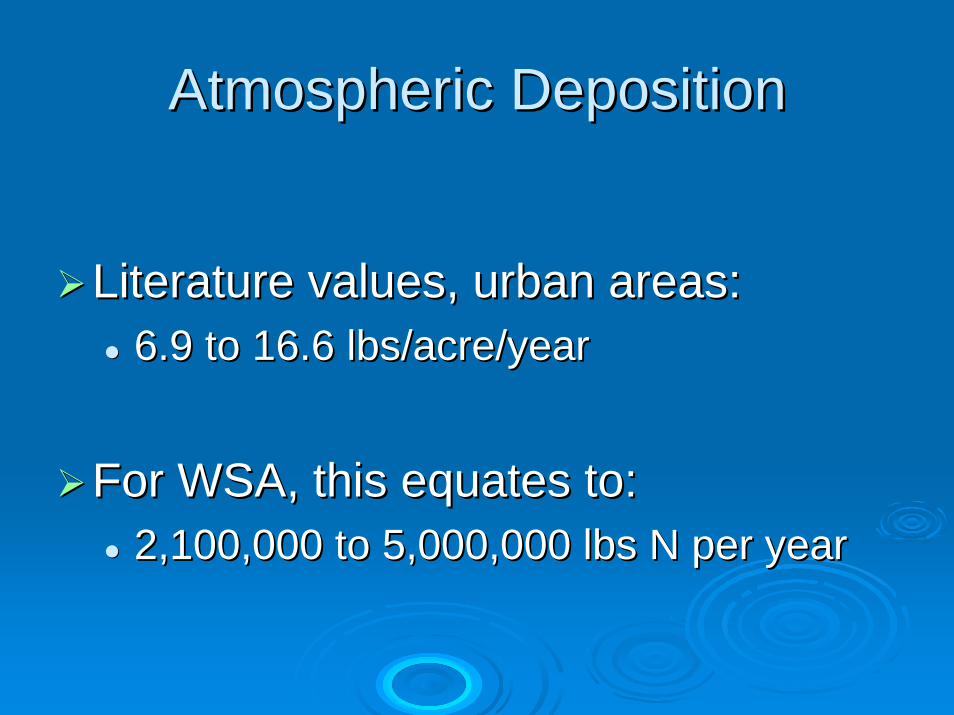
Atmospheric DepositionAtmospheric Deposition
Literature values, urban areas: Literature values, urban areas: 6.9 to 16.6 lbs/acre/year6.9 to 16.6 lbs/acre/year
For WSA, this equates to:For WSA, this equates to:2,100,000 to 5,000,000 lbs N per year2,100,000 to 5,000,000 lbs N per year
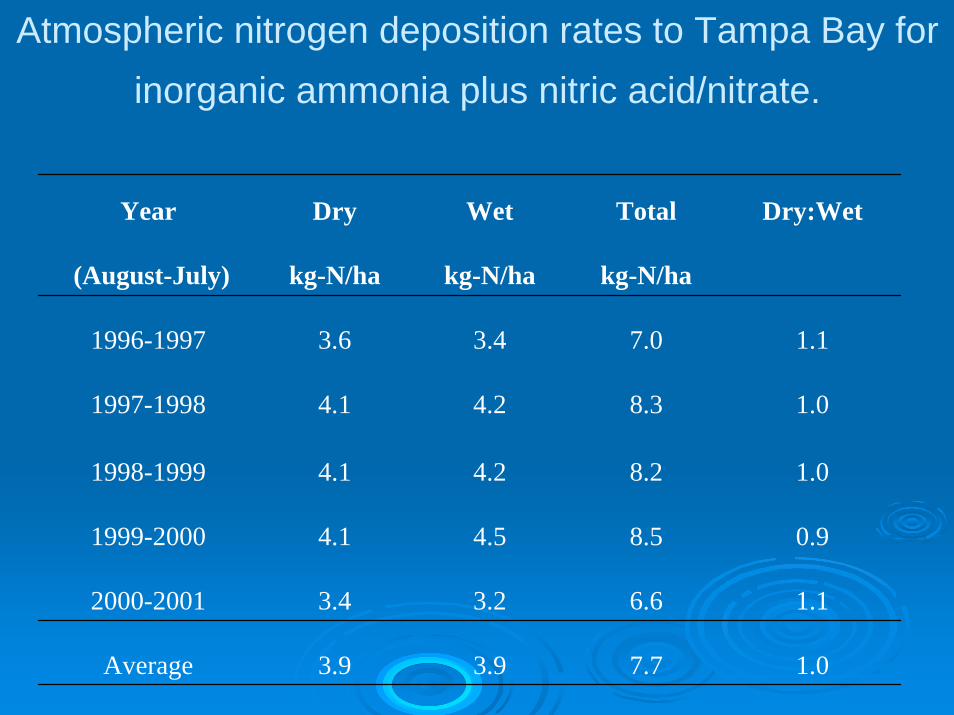
Atmospheric nitrogen deposition rates to Tampa Bay for inorganic ammonia plus nitric acid/nitrate.
Year Dry Wet Total Dry:Wet
(August-July) kg-N/ha kg-N/ha kg-N/ha
1996-1997 3.6 3.4 7.0 1.1
1997-1998 4.1 4.2 8.3 1.0
1998-1999 4.1 4.2 8.2 1.0
1999-2000 4.1 4.5 8.5 0.9
2000-2001 3.4 3.2 6.6 1.1
Average 3.9 3.9 7.7 1.0
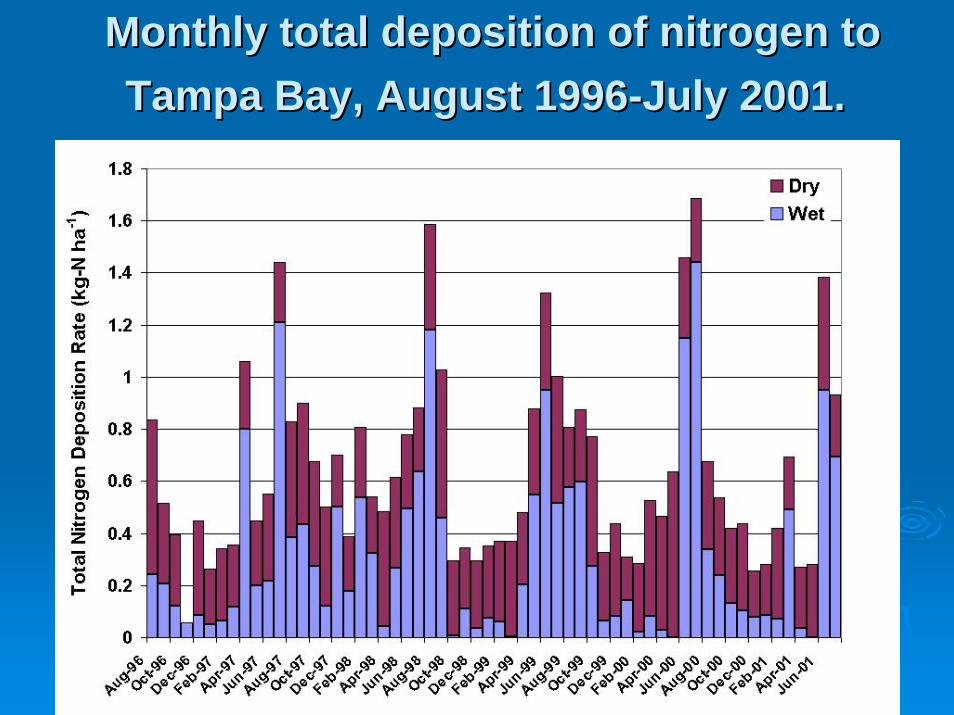
Monthly total deposition of nitrogen to Monthly total deposition of nitrogen to Tampa Bay, August 1996Tampa Bay, August 1996--July 2001.July 2001.
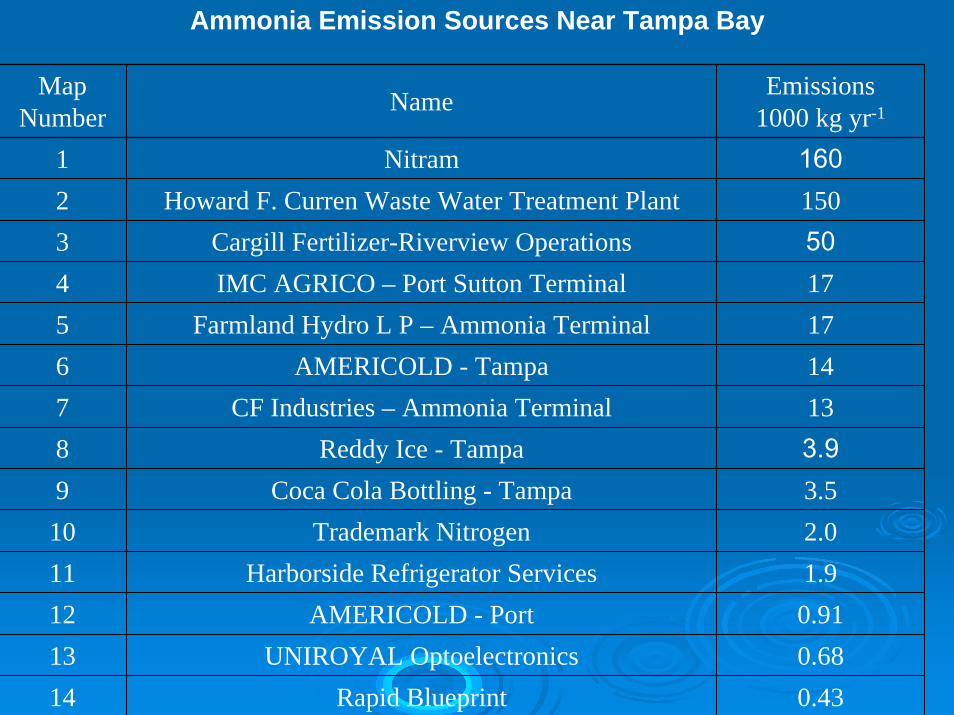
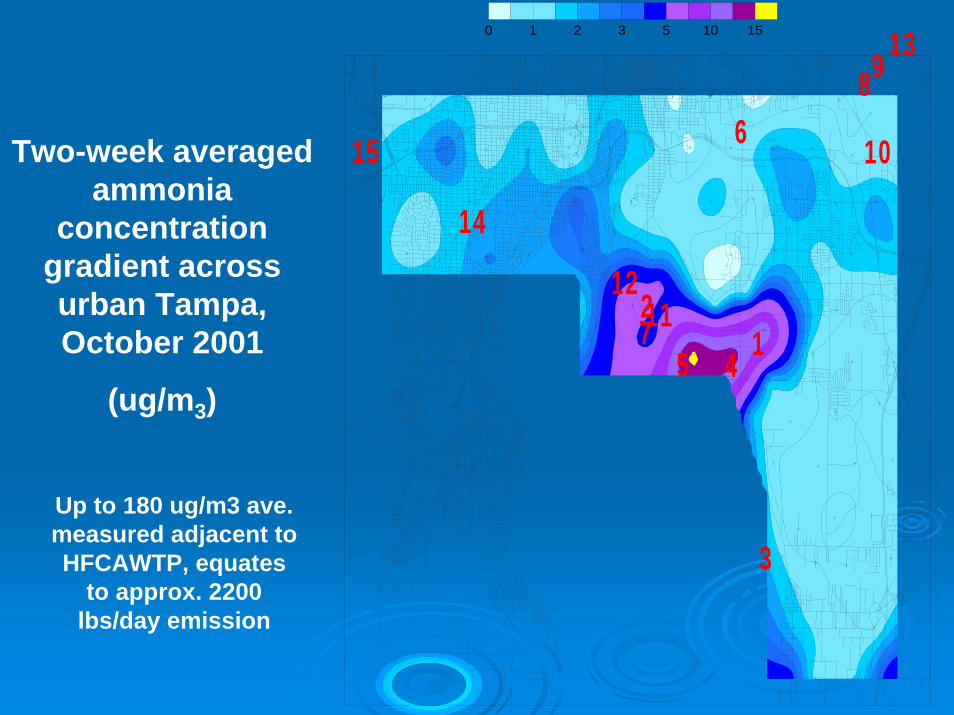
Ammonia Emission Sources Near Tampa Bay
MapNumber Name Emissions
1000 kg yr-1
1 Nitram 1602 Howard F. Curren Waste Water Treatment Plant 1503 Cargill Fertilizer-Riverview Operations 504 IMC AGRICO – Port Sutton Terminal 175 Farmland Hydro L P – Ammonia Terminal 176 AMERICOLD - Tampa 147 CF Industries – Ammonia Terminal 138 Reddy Ice - Tampa 3.99 Coca Cola Bottling - Tampa 3.510 Trademark Nitrogen 2.011 Harborside Refrigerator Services 1.912 AMERICOLD - Port 0.9113 UNIROYAL Optoelectronics 0.6814 Rapid Blueprint 0.43
12
3
45
6
7
89
10
1112
13
14
15
0 1 2 3 5 10 15
Two-week averaged ammonia
concentration gradient across urban Tampa, October 2001
(ug/m3)
Up to 180 ug/m3 ave. measured adjacent to HFCAWTP, equates
to approx. 2200 lbs/day emission
Atmospheric DepositionAtmospheric Deposition
Literature values, urban areas: Literature values, urban areas: 6.9 to 16.6 lbs/acre/year6.9 to 16.6 lbs/acre/year
For WSA, this equates to:For WSA, this equates to:2,100,000 to 5,000,000 lbs N per year2,100,000 to 5,000,000 lbs N per year
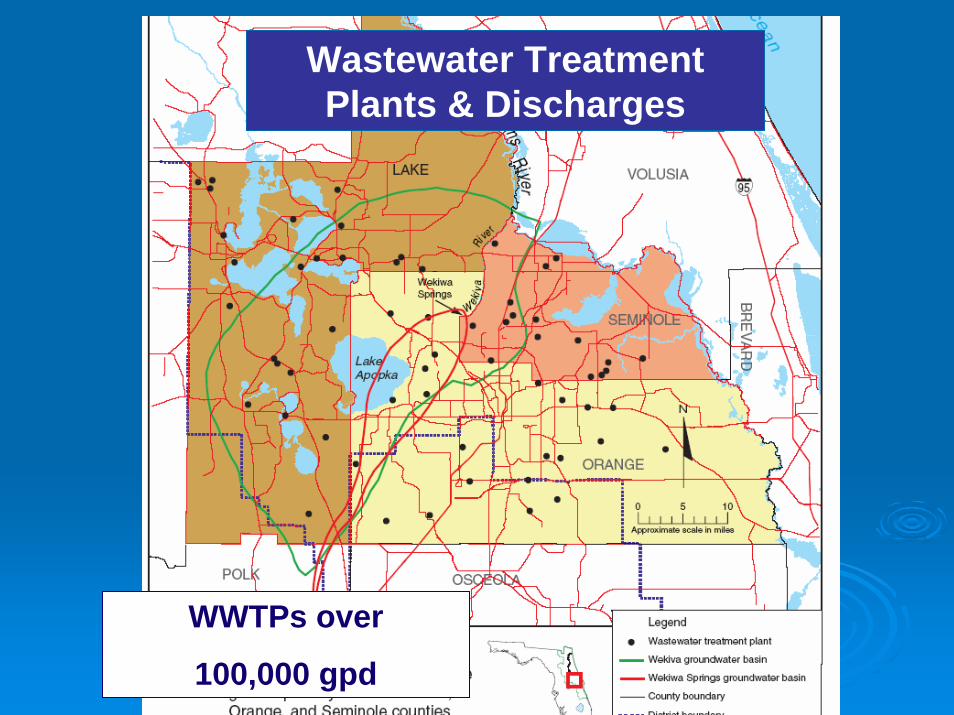
WWTPs over
100,000 gpd
Wastewater Treatment Plants & Discharges
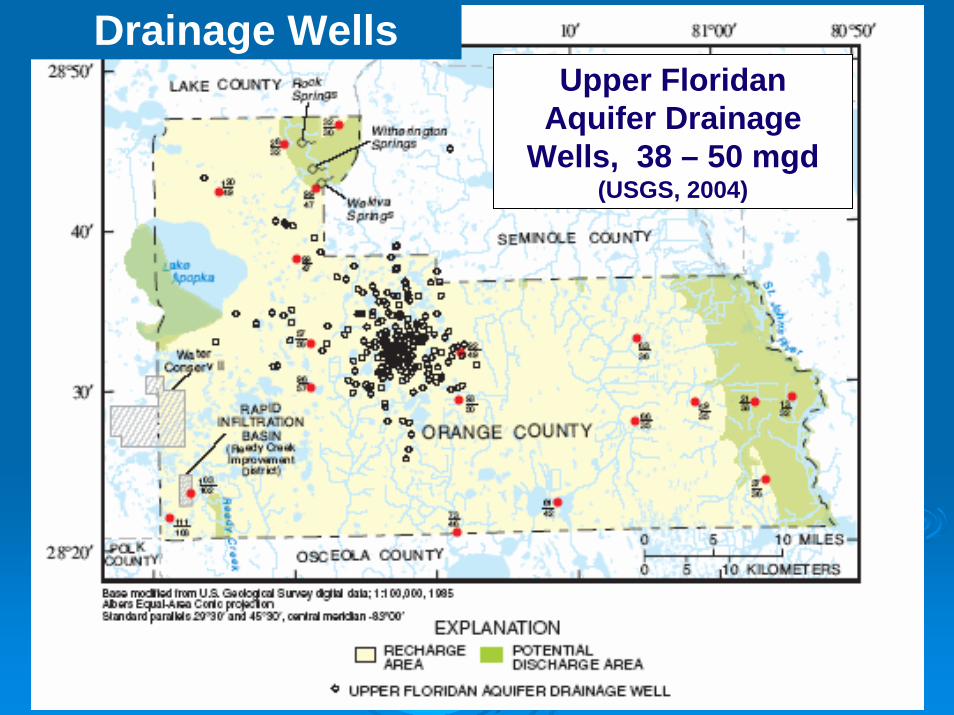
Upper Floridan Aquifer Drainage
Wells, 38 – 50 mgd(USGS, 2004)
Drainage Wells

Thickness of the ICU

How have other localities How have other localities dealt with the N issue?dealt with the N issue?
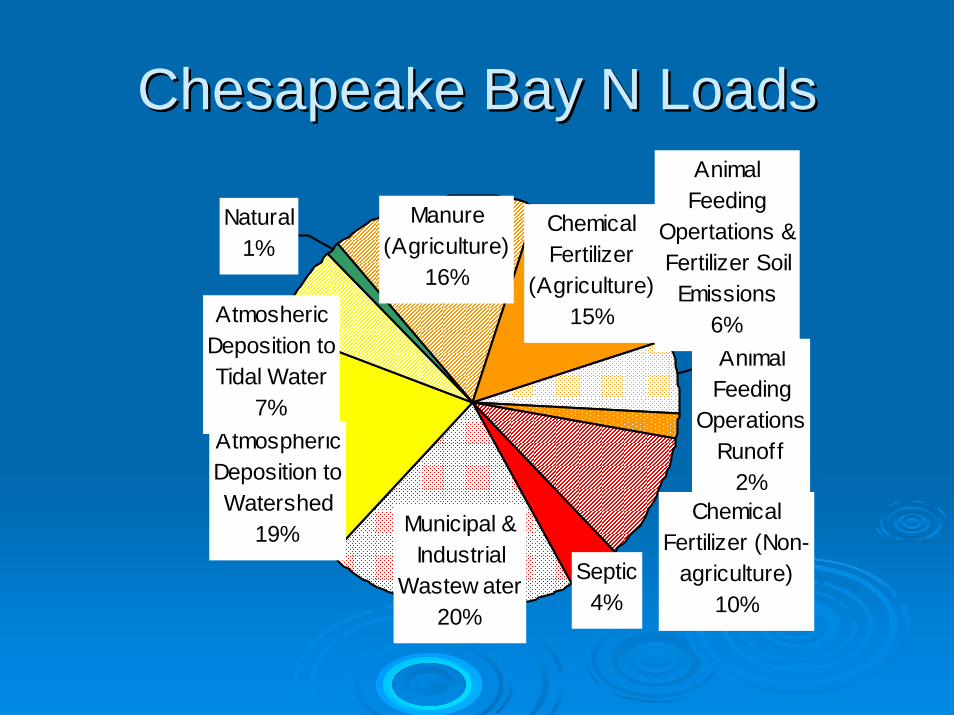
Chesapeake Bay N LoadsChesapeake Bay N Loads
Municipal & Industrial
Wastew ater20%
Atmospheric Deposition to Watershed
19%
Atmosheric Deposition to Tidal Water
7%
Septic4%
Animal Feeding
Operations Runoff
2%
Animal Feeding
Opertations & Fertilizer Soil Emissions
6%
Chemical Fertilizer
(Agriculture)15%
Chemical Fertilizer (Non-
agriculture)10%
Manure (Agriculture)
16%
Natural1%
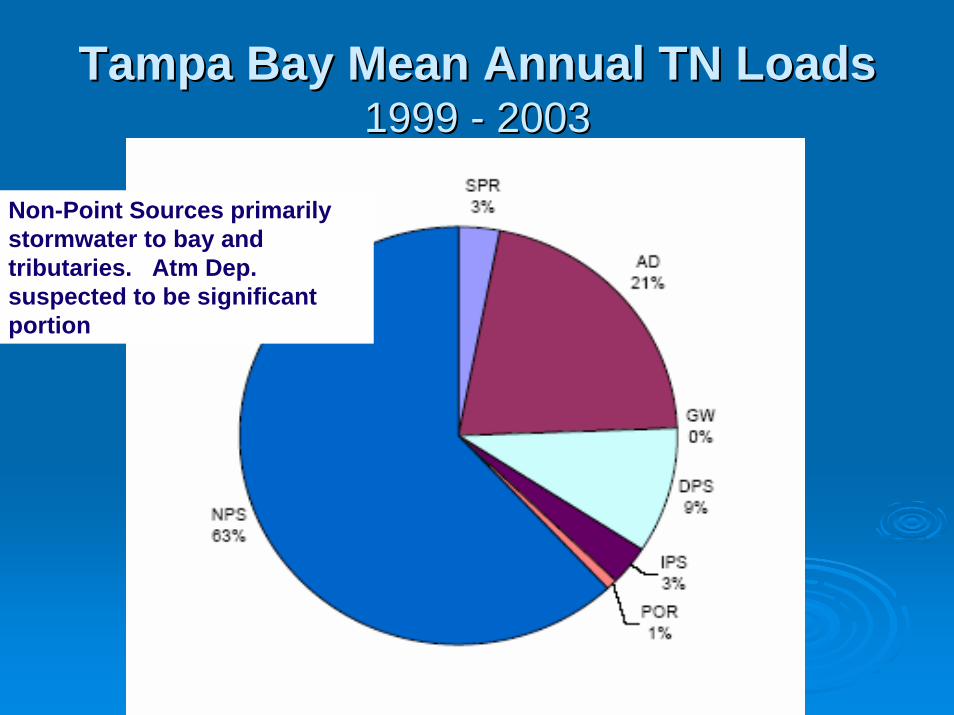
Tampa Bay Mean Annual TN LoadsTampa Bay Mean Annual TN Loads1999 1999 -- 20032003
Non-Point Sources primarily stormwater to bay and tributaries. Atm Dep. suspected to be significant portion
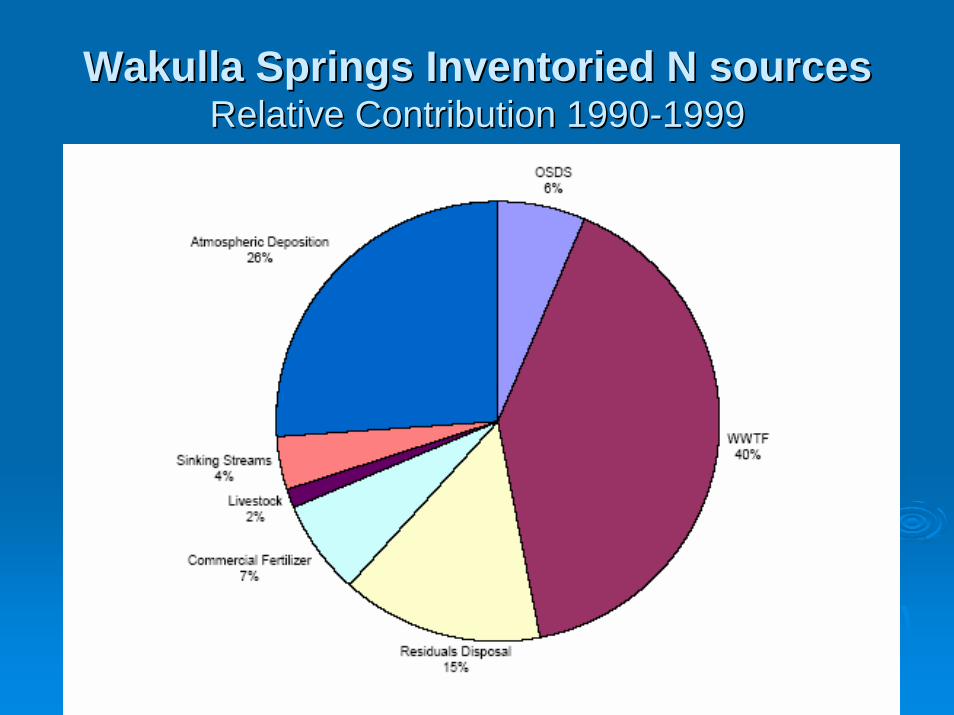
Wakulla Springs Inventoried N sourcesWakulla Springs Inventoried N sourcesRelative Contribution 1990Relative Contribution 1990--19991999
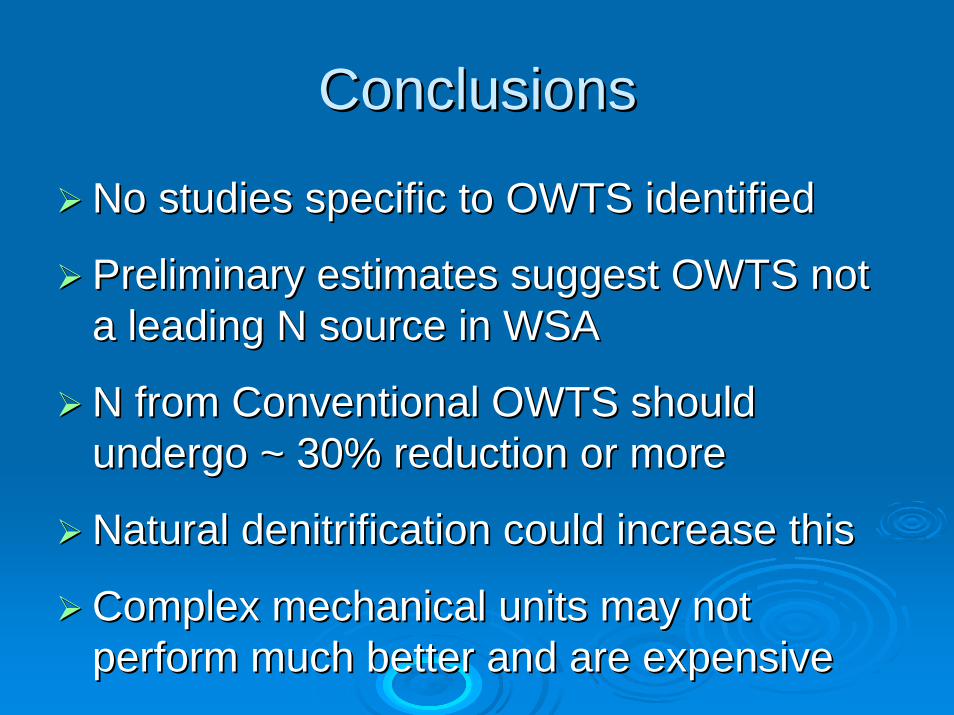
ConclusionsConclusions
No studies specific to OWTS identifiedNo studies specific to OWTS identified
Preliminary estimates suggest OWTS not Preliminary estimates suggest OWTS not a leading N source in WSAa leading N source in WSA
N from Conventional OWTS should N from Conventional OWTS should undergo ~ 30% reduction or moreundergo ~ 30% reduction or more
Natural denitrification could increase thisNatural denitrification could increase this
Complex mechanical units may not Complex mechanical units may not perform much better and are expensive perform much better and are expensive
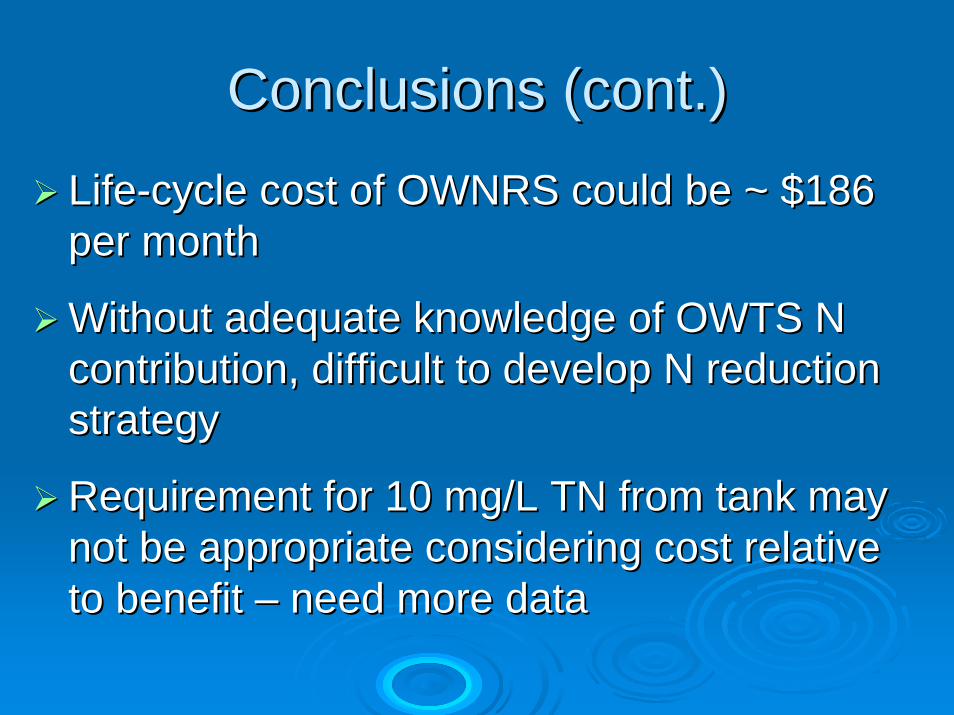
Conclusions (cont.)Conclusions (cont.)LifeLife--cycle cost of OWNRS could be ~ $186 cycle cost of OWNRS could be ~ $186 per monthper month
Without adequate knowledge of OWTS N Without adequate knowledge of OWTS N contribution, difficult to develop N reduction contribution, difficult to develop N reduction strategystrategy
Requirement for 10 mg/L TN from tank may Requirement for 10 mg/L TN from tank may not be appropriate considering cost relative not be appropriate considering cost relative to benefit to benefit –– need more dataneed more data
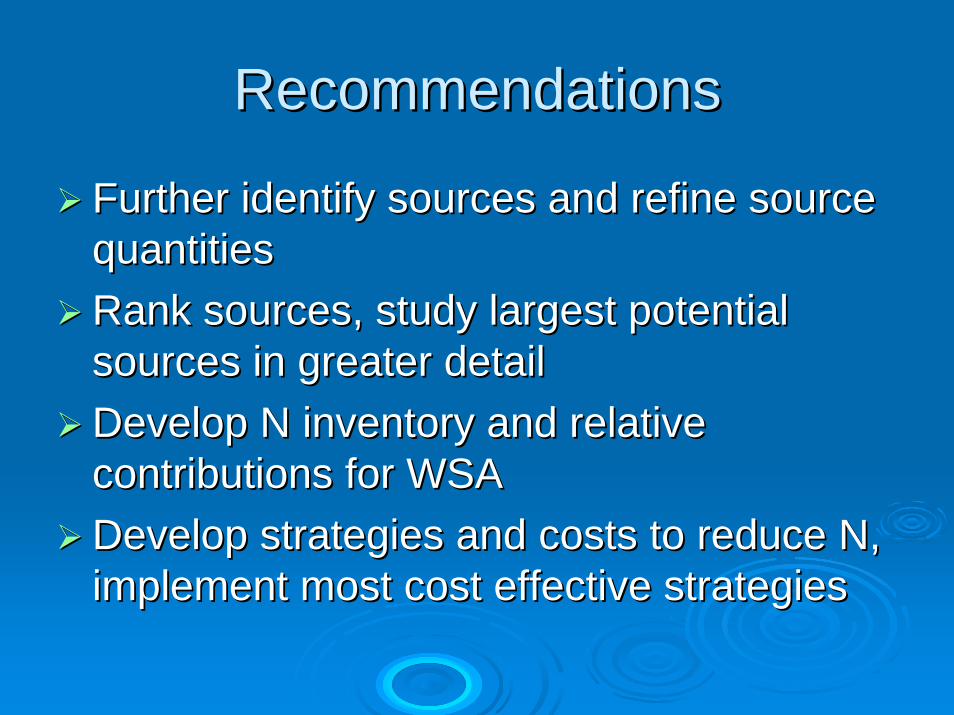
RecommendationsRecommendations
Further identify sources and refine source Further identify sources and refine source quantitiesquantitiesRank sources, study largest potential Rank sources, study largest potential sources in greater detailsources in greater detailDevelop N inventory and relative Develop N inventory and relative contributions for WSAcontributions for WSADevelop strategies and costs to reduce N, Develop strategies and costs to reduce N, implement most cost effective strategiesimplement most cost effective strategies
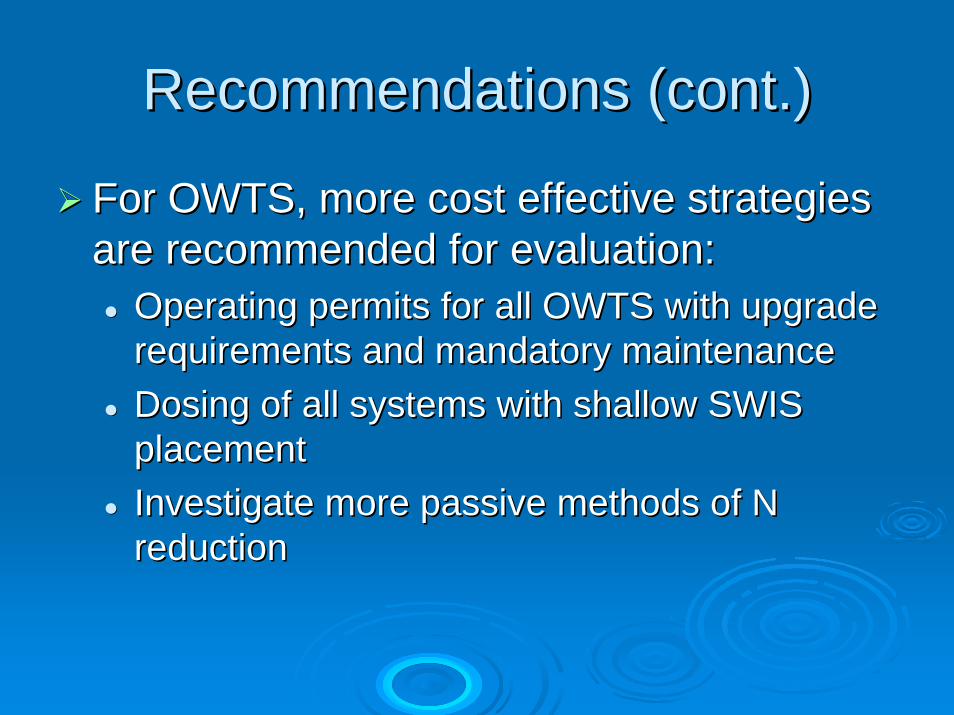
Recommendations (cont.)Recommendations (cont.)
For OWTS, more cost effective strategies For OWTS, more cost effective strategies are recommended for evaluation:are recommended for evaluation:
Operating permits for all OWTS with upgrade Operating permits for all OWTS with upgrade requirements and mandatory maintenancerequirements and mandatory maintenanceDosing of all systems with shallow SWIS Dosing of all systems with shallow SWIS placementplacementInvestigate more passive methods of N Investigate more passive methods of N reductionreduction