Embed Size (px)
Citation preview
A REVIEW OF LITERATURE ON OVERALL EQUIPMENT
EFFECTIVENESS (OEE)
Neelakandan B.1 and Dr. C. Muralidharan2 1Assistant professor, Manufacturing Engineering and 2Professor, Manufacturing Engineering,
Annamalai University, Annamalinagar 608002, Tamil Nadu, India. [email protected] /
[email protected] and Annamalai University, [email protected]
Abstract - To compete in the challenging global business scenario manufacturing industries are constantly strive
to improve manufacturing productivity and equipment utilization. The concept of overall equipment
effectiveness (OEE), is becoming increasingly popular, is being widely used as a quantitative tool for
performance measurement at equipment level and is accepted as the primary performance metric beyond
equipment to performance of whole factory. The review indicates that OEE and its extension are used as an
index to evaluate the performance of particular equipment or a subsystem, and that there is a lack of standard
method to evaluate the effectiveness of the entire system irrespective of configuration. The review also
broadcasts, that the time taken for inspection and resources involved for inspection are not accounted so far.
I. INTRODUCTION
A well-known and widely spread concept of improving the production performance is total productive
maintenance (TPM) founded by Nakajima (1988). Nakajima, developed TPM by combining the key features of
preventive, productive and predictive maintenance with TQM, QCs and employee involvement. As Ahuja and
Khamba (2008) say, “TPM is a production-driven improvement methodology that is designed to optimize
equipment reliability and ensure efficient management of plant assets through the use of employee involvement,
linking manufacturing, maintenance and engineering.
II. REVIEW OF LITERATURE (FRAME OF REFERENCE)
Seiichi Nakajima proposed the back bone of TPM metric OEE. A number of literatures are available dealing
with OEE e.g. Leachman (1997), Ljungberg (1998), Jonsson and Lesshammar (1999), Dal et al. (2000), Jeong
and Phillips (2001), DaCosta and Da Lima (2002), Huang et al., (2002), Huang et al.,(2003) Bamber et al. (2003),
De Ron and Rooda (2005, 2006), Nachiappan and Anantharaman (2006), Muthiah and Huang (2007), Muthiah
et al. (2008), Muchiri and Pintelon (2008), and Braglia et al. (2009).Most of researchers deal directly with the
technical aspects of OEE while some with alternative measures.
JASC: Journal of Applied Science and Computations
Volume 5, Issue 11, November/2018
ISSN NO: 1076-5131
Page No:188
Figure 1 Classification of OEE literature
The literature on OEE can be broadly classified into two major categories, namely(i) equipment and (ii)
factory level. Further, equipment can be branched into time based, hybrid and modification.(Figure 1) The
researchers widely accepted, that the performance of an equipment can be measured using the three dimensions,
Availability (A), Performance (P), Quality (Q) and their product as OEE. In time based all the three dimensions
are evaluated purely with respect to time only. In hybrid the performance and quality are evaluated either with
time, output, parts produced, or with volume whereas availability is still measured only with time. If any,
additional metrics added along with traditional OEE then it is classified under modification. OEE in factory
level is sub divided into two: as alternative and modifications. Most of the researchers derived their own metric
as an alternative to traditional OEE to explore it at the level of entire manufacturing unit, marking under
alternative. Some researchers added dimensions or clubbed dimensions and referred here as modification.OEE
metrics coined by the researchers focused at equipment level-. modification models- metric.
I. Equipment level - time based models
Here all the three dimensions availability, performance, and quality were evaluated in terms of time only
The formulae suggested by various authors for calculating OEE are given below.
(i.) According to Raffaele and Maria (2013), HerriWibowo (2012)
Availability (A) = �������������
�����������
Performance(P) =����������������
�������������
Quality(Q) =���������������������
����������������
OEE =Availability(A) × Performance(P) × Quality(Q)
=�������������
����������� ×
����������������
������������� ×
���������������������
����������������
i.e. OEE =���������������������
����������� ………………… (1)
(ii) Similarly Sermin and Birol (2010) calculated the same with varying nomenclature
Availability (A) =��������� ����
��� ��������� ����
Performance (P) =��� ��������� ����
��������� ����
Quality (Q) =�������������������
����������������
JASC: Journal of Applied Science and Computations
Volume 5, Issue 11, November/2018
ISSN NO: 1076-5131
Page No:189
i.e. ��� =����� ���������� ����
��� ��������� ����………………… (2)
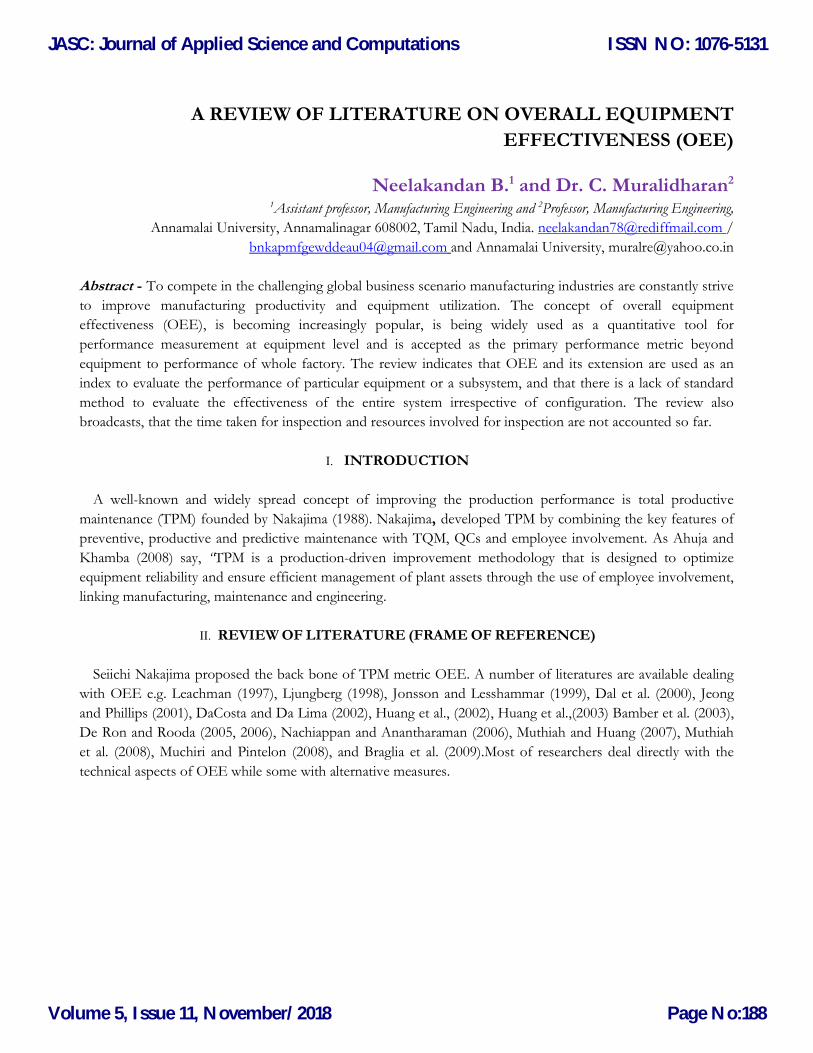
(iii) Ki-Young and Philips (2001) compared OEE by two computational methods based on theoretical
calendar time as OEE1 (figure 2) and Nakajima six loss category as OEE2(figure 3) and represented as OEE
=�������� ���������� ����
����� ����…………….. (3)
OEE 1 OEE 2
Time efficiency= ��������������������
��������� Availability (A) =
�������������������
���������
Speed efficiency =�����������������
������������������� Performance (P) =
�����������������
�������������������
Quality efficiency=����������������������
����������������� Quality (Q) =
����������������������
�����������������
Figure 2 . Theoretical time based OEE (1)
JASC: Journal of Applied Science and Computations
Volume 5, Issue 11, November/2018
ISSN NO: 1076-5131
Page No:190
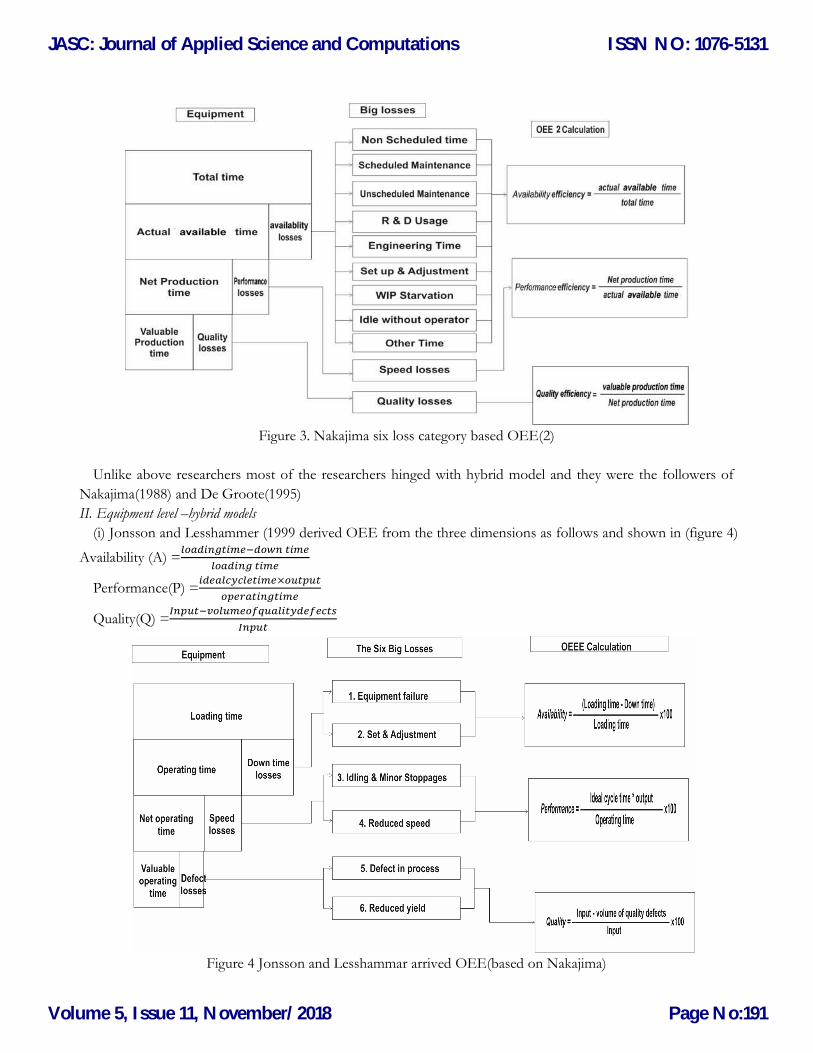
Figure 3. Nakajima six loss category based OEE(2)
Unlike above researchers most of the researchers hinged with hybrid model and they were the followers of
Nakajima(1988) and De Groote(1995)
II. Equipment level –hybrid models
(i) Jonsson and Lesshammer (1999 derived OEE from the three dimensions as follows and shown in (figure 4)
Availability (A) =���������������� ����
������� ����
Performance(P) =��������������������
�������������
Quality(Q) =����������������������������
�����
Figure 4 Jonsson and Lesshammar arrived OEE(based on Nakajima)
JASC: Journal of Applied Science and Computations
Volume 5, Issue 11, November/2018
ISSN NO: 1076-5131
Page No:191
De Groote(1995)defined OEE as
Availability (A) =���������������������������������������
���������������������
Performance(P) =������������������������
�������������������������
Quality(Q) =������������������������������������������
������������������������
III.(a)Equipment level –modification models (method of calculation)
In general, in three dimensions of OEE: Availability, Performance, Quality modifications are made in any one
of these dimensions.
(i) SEMI(2000)
In this approach the availability and quality remain unchanged and performance is classified into operational
efficiency (OE) and rate efficiency(RE)-
OEE = AE × (OE × RE) × QE ………………………(4)
AE = ��������� ������
����� ���� OE =
���������� ����
��������� ������RE =
����������� ���������� ���� ��� ������ �����
���������� ����
QE = ����������� ���������� ���� ��� ��������� �����
����������� ���������� ���� ��� ������ �����
This approach even though purely based on time models due to its expansion in the performance metric, is
placed under modification category. NilsonBastosetal.(2007) and Chakravathy etal. (2007) referred to the same.
Ron and Rooda (2005) also referred along with modified six big losses with respect to time.
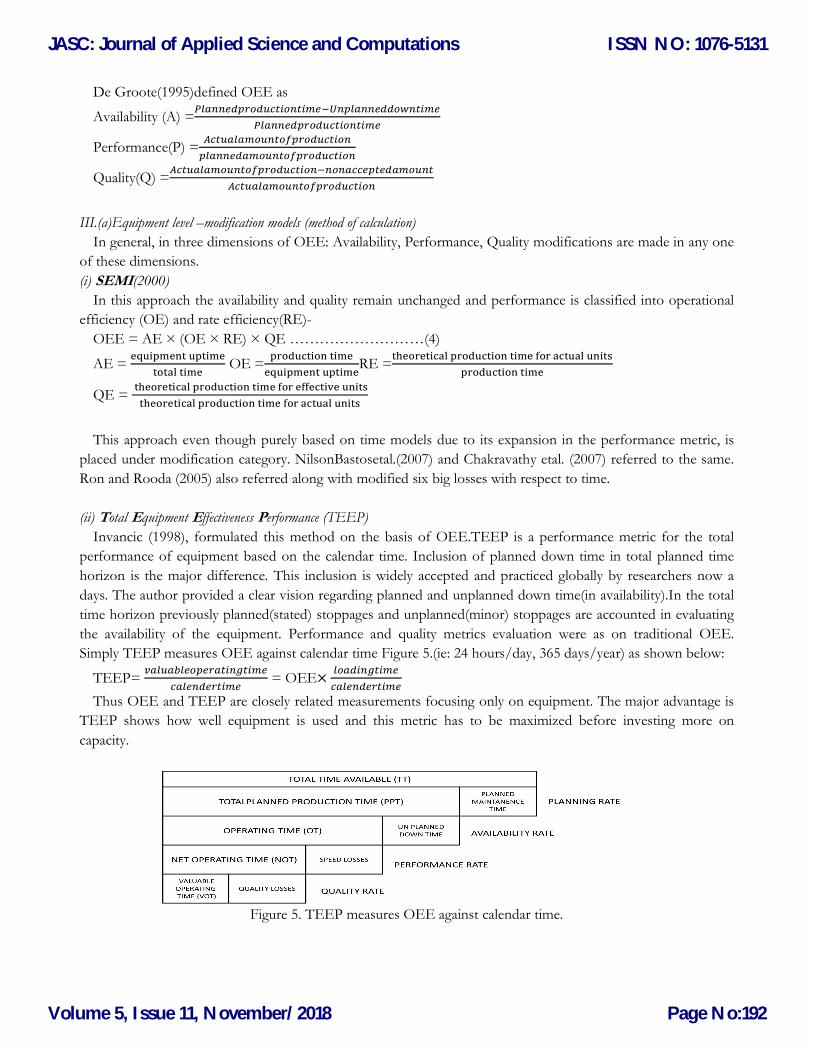
(ii) Total Equipment Effectiveness Performance (TEEP)
Invancic (1998), formulated this method on the basis of OEE.TEEP is a performance metric for the total
performance of equipment based on the calendar time. Inclusion of planned down time in total planned time
horizon is the major difference. This inclusion is widely accepted and practiced globally by researchers now a
days. The author provided a clear vision regarding planned and unplanned down time(in availability).In the total
time horizon previously planned(stated) stoppages and unplanned(minor) stoppages are accounted in evaluating
the availability of the equipment. Performance and quality metrics evaluation were as on traditional OEE.
Simply TEEP measures OEE against calendar time Figure 5.(ie: 24 hours/day, 365 days/year) as shown below:
TEEP= ���������������������
������������ = OEE×
�����������
������������
Thus OEE and TEEP are closely related measurements focusing only on equipment. The major advantage is
TEEP shows how well equipment is used and this metric has to be maximized before investing more on
capacity.
Figure 5. TEEP measures OEE against calendar time.
JASC: Journal of Applied Science and Computations
Volume 5, Issue 11, November/2018
ISSN NO: 1076-5131
Page No:192
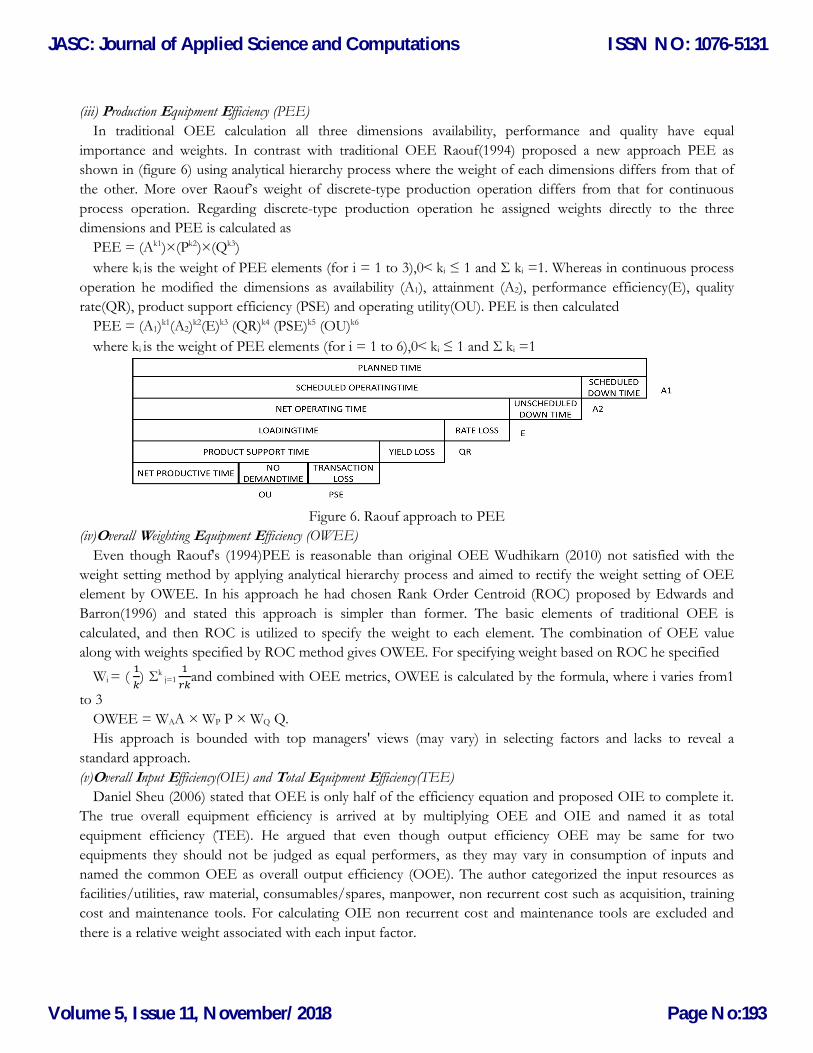
(iii) Production Equipment Efficiency (PEE)
In traditional OEE calculation all three dimensions availability, performance and quality have equal
importance and weights. In contrast with traditional OEE Raouf(1994) proposed a new approach PEE as
shown in (figure 6) using analytical hierarchy process where the weight of each dimensions differs from that of
the other. More over Raouf’s weight of discrete-type production operation differs from that for continuous
process operation. Regarding discrete-type production operation he assigned weights directly to the three
dimensions and PEE is calculated as
PEE = (Ak1)×(Pk2)×(Qk3)
where ki is the weight of PEE elements (for i = 1 to 3),0˂ ki ≤ 1 and Σ ki =1. Whereas in continuous process
operation he modified the dimensions as availability (A1), attainment (A2), performance efficiency(E), quality
rate(QR), product support efficiency (PSE) and operating utility(OU). PEE is then calculated
PEE = (A1)k1(A2)k2(E)k3 (QR)k4 (PSE)k5 (OU)k6
where ki is the weight of PEE elements (for i = 1 to 6),0˂ ki ≤ 1 and Σ ki =1
Figure 6. Raouf approach to PEE
(iv)Overall Weighting Equipment Efficiency (OWEE)
Even though Raouf's (1994)PEE is reasonable than original OEE Wudhikarn (2010) not satisfied with the
weight setting method by applying analytical hierarchy process and aimed to rectify the weight setting of OEE
element by OWEE. In his approach he had chosen Rank Order Centroid (ROC) proposed by Edwards and
Barron(1996) and stated this approach is simpler than former. The basic elements of traditional OEE is
calculated, and then ROC is utilized to specify the weight to each element. The combination of OEE value
along with weights specified by ROC method gives OWEE. For specifying weight based on ROC he specified
Wi = ( �
�) Σk
j=1 �
��and combined with OEE metrics, OWEE is calculated by the formula, where i varies from1
to 3
OWEE = WAA × WP P × WQ Q.
His approach is bounded with top managers' views (may vary) in selecting factors and lacks to reveal a
standard approach.
(v)Overall Input Efficiency(OIE) and Total Equipment Efficiency(TEE)
Daniel Sheu (2006) stated that OEE is only half of the efficiency equation and proposed OIE to complete it.
The true overall equipment efficiency is arrived at by multiplying OEE and OIE and named it as total
equipment efficiency (TEE). He argued that even though output efficiency OEE may be same for two
equipments they should not be judged as equal performers, as they may vary in consumption of inputs and
named the common OEE as overall output efficiency (OOE). The author categorized the input resources as
facilities/utilities, raw material, consumables/spares, manpower, non recurrent cost such as acquisition, training
cost and maintenance tools. For calculating OIE non recurrent cost and maintenance tools are excluded and
there is a relative weight associated with each input factor.
JASC: Journal of Applied Science and Computations
Volume 5, Issue 11, November/2018
ISSN NO: 1076-5131
Page No:193
OIE =Σ Ii=1 wieii = 1……I where I- input category, ei- resource usage, wi – relative weight of I.
Ii = ΣIi = 1wi =1 and ei = D/A where D - theoretical ideal input resource level and A- actual resource input
level..
��� = ��� × ��� = ��� × ���
III.(b) Equipment level –modification models (metric addition)
(i) Overall Resource Effectiveness(ORE)
Eswaramurthi and Mohanram (2013) modified and expanded the concept of Daniel Sheu (2006) and
postulated that “Overall Resource Effectiveness (ORE)” as the measure of overall effective time of the
manufacturing system (resources). It is the product of Readiness (R), Availability of facility (Af), Changeover
efficiency (C), Availability of material (Am), Availability of man power(Amp), Performance efficiency (P) and
Quality rate (Q). ORE considers the facilities like man, machines, tools, jigs and fixtures and gauges and
instruments
Readiness (R ) =���������������������
��������� Availability of facility(Af ) =
�����������
���������������������
Changeover efficiency (C) =�������������
����������� Availability of material (Am) =
�����������
�������������
Availability of man power (Amp) =������ ������� ����
������� ����
Performance (P) = ������ ����
������������� ���� Quality rate (Q) =
�����������������������
�����������������������
ORE = R Af C Am Amp P Q 100
(ii) Overall equipment and energy efficiency(OEEE)
JozefGlova (2012),achieved OEE manipulations at par with Nakajima’s concept as shown in figure and
additionally added energy as key performance indicator apart from availability, performance and quality
OEEE = OEE×E.
III. FACTORY LEVEL –ALTERNATIVE MODELS
(i) Overall factory effectiveness(OFE)
Scott and Pisa(1998), Oechsneret al.(2003), Williams(2006). This metric was developed to evaluate the factory
level effectiveness. Researchers have different views and approaches and there is no common approach for this
metric. According to Scott and Pisa (1998) OFE derives relationship among various machines and processes. It
aims to integrate all possible activities and information of a production unit. The authors suggested to create a
composite metric to achieve goals and applying weight factor for those metric is important.
(ii) Overall throughout effectiveness(OTE)
Haung et al. (2003) developed this metric on the basis of OEE dimensions for complex connected
manufacturing systems. The manufacturing system may consist of predefined subsystem including series, parallel,
assembly and expansion. Almost all industries may fall in any one these subsystems or configuration. The above
developed metric is used in theoretical bottle neck detection.OTE is addressed as the theoretical efficiency and
validated by simulation where, OTE derivation for series sub system having ‘n’ equipment, is
ni
R
ROEEnQjROEEni
OTEi
n
n
ijii
s
,.....2,1
}min{
1,.....2,1
minmin
1)(
JASC: Journal of Applied Science and Computations
Volume 5, Issue 11, November/2018
ISSN NO: 1076-5131
Page No:194
Ri is the theoretical processing rate of equipment specified by the manufacturer.
OEEi is the theoretical OEE of ith equipment
Qj is the quality efficiency of the jth equipment
In parallel sub system the author narrated there is no bottleneck equipment and calculated.OTE for this
subsystem is also of theoretical efficiency and validated by simulation.
n
ii
n
iii
p
R
ROEE
OTE
1
1)(
)(
Similar to parallel and series the OTE metric for assembly is also addressed as the theoretical efficiency and
validated by simulation. The assembly system the author assumed with n upstream equipment and one assembly
station and derived OTE metric as
1
11
,......2,1
minmin
1,....2,1
minmin
)(
n
nn
Rki
Ri
ni
OEERQnki
RiOEEi
niaOTE
And finally the author derived the case of expansion sub system which consists of n downstream equipments
and one expansion stations and queue capacity is unlimited. Moreover it is assumed that all equipments are
independent. This is also addressed and validated as other subsystems. The OTE for this subsystem is
n
iii
n
iiiii
Rk
OEERQKOEEe
elOTE
1
1
,Remin
,Remin
)(
The developed metrics only aid equipments selection, factory layout design and detection of bottleneck
theoretically and can be used only for diagnostic purpose. Computing metrics for continuous productivity is not
proposed. In author view if series of metrics based on cycle time is developed more information regarding
system performance can be obtained.
(iii) Overall Asset Effectiveness and (OAE) and Overall Production effectiveness (OPE)
Haung and Muthiah (2008).These measurement tools are developed from OEE tool, to identify and to
measure all losses in association with overall production process, and are widely applied in industries. Regarding
industrial application these two terms mean the same but they differ in measuring elements or losses. In the
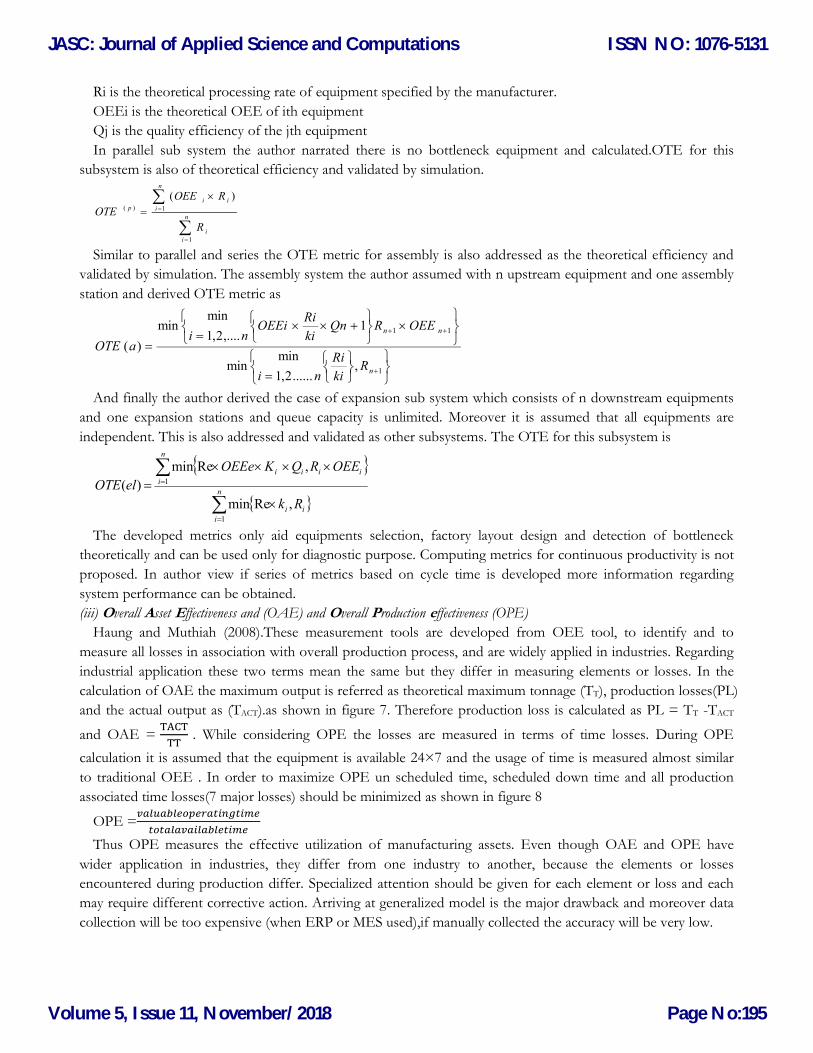
calculation of OAE the maximum output is referred as theoretical maximum tonnage (TT), production losses(PL)
and the actual output as (TACT).as shown in figure 7. Therefore production loss is calculated as PL = TT -TACT
and OAE = ����
�� . While considering OPE the losses are measured in terms of time losses. During OPE
calculation it is assumed that the equipment is available 24×7 and the usage of time is measured almost similar
to traditional OEE . In order to maximize OPE un scheduled time, scheduled down time and all production
associated time losses(7 major losses) should be minimized as shown in figure 8
OPE =���������������������
������������������
Thus OPE measures the effective utilization of manufacturing assets. Even though OAE and OPE have
wider application in industries, they differ from one industry to another, because the elements or losses
encountered during production differ. Specialized attention should be given for each element or loss and each
may require different corrective action. Arriving at generalized model is the major drawback and moreover data
collection will be too expensive (when ERP or MES used),if manually collected the accuracy will be very low.
JASC: Journal of Applied Science and Computations
Volume 5, Issue 11, November/2018
ISSN NO: 1076-5131
Page No:195
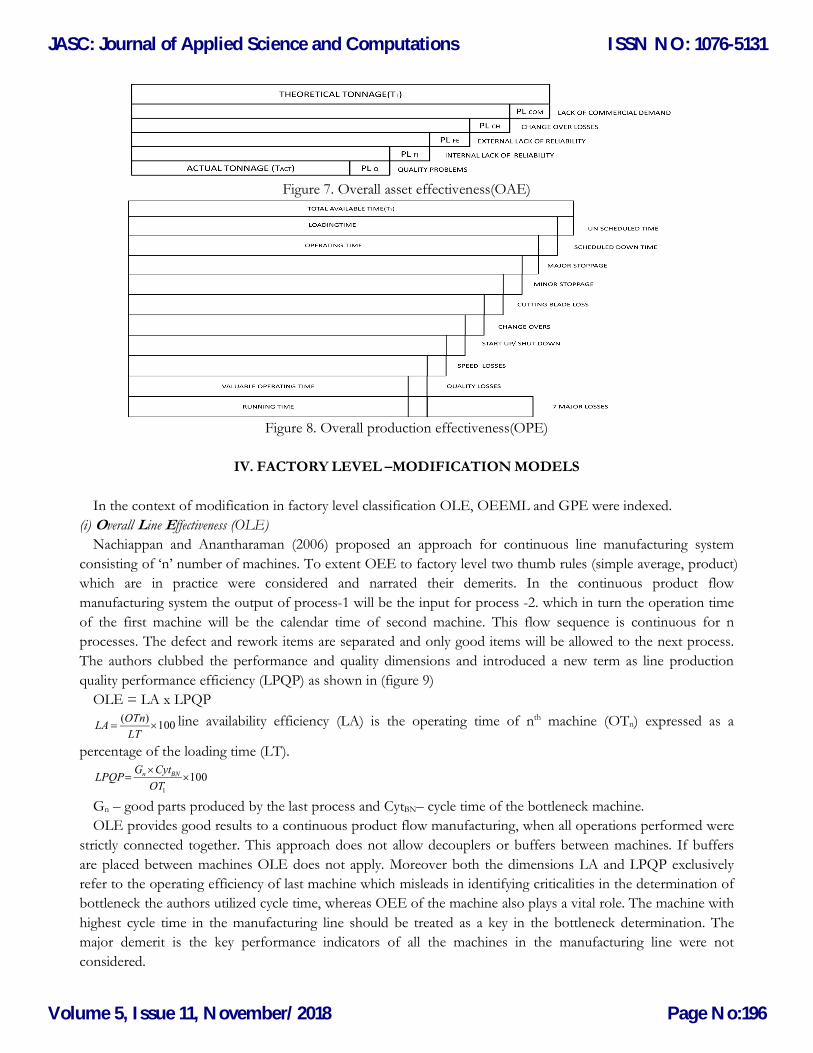
Figure 7. Overall asset effectiveness(OAE)
Figure 8. Overall production effectiveness(OPE)
IV. FACTORY LEVEL –MODIFICATION MODELS
In the context of modification in factory level classification OLE, OEEML and GPE were indexed.
(i) Overall Line Effectiveness (OLE)
Nachiappan and Anantharaman (2006) proposed an approach for continuous line manufacturing system
consisting of ‘n’ number of machines. To extent OEE to factory level two thumb rules (simple average, product)
which are in practice were considered and narrated their demerits. In the continuous product flow
manufacturing system the output of process-1 will be the input for process -2. which in turn the operation time
of the first machine will be the calendar time of second machine. This flow sequence is continuous for n
processes. The defect and rework items are separated and only good items will be allowed to the next process.
The authors clubbed the performance and quality dimensions and introduced a new term as line production
quality performance efficiency (LPQP) as shown in (figure 9)
OLE = LA x LPQP
100)(
LT
OTnLA line availability efficiency (LA) is the operating time of nth machine (OTn) expressed as a
percentage of the loading time (LT).
1001
OT
CytGLPQP BNn
Gn – good parts produced by the last process and CytBN– cycle time of the bottleneck machine.
OLE provides good results to a continuous product flow manufacturing, when all operations performed were
strictly connected together. This approach does not allow decouplers or buffers between machines. If buffers
are placed between machines OLE does not apply. Moreover both the dimensions LA and LPQP exclusively
refer to the operating efficiency of last machine which misleads in identifying criticalities in the determination of
bottleneck the authors utilized cycle time, whereas OEE of the machine also plays a vital role. The machine with
highest cycle time in the manufacturing line should be treated as a key in the bottleneck determination. The
major demerit is the key performance indicators of all the machines in the manufacturing line were not
considered.
JASC: Journal of Applied Science and Computations
Volume 5, Issue 11, November/2018
ISSN NO: 1076-5131
Page No:196
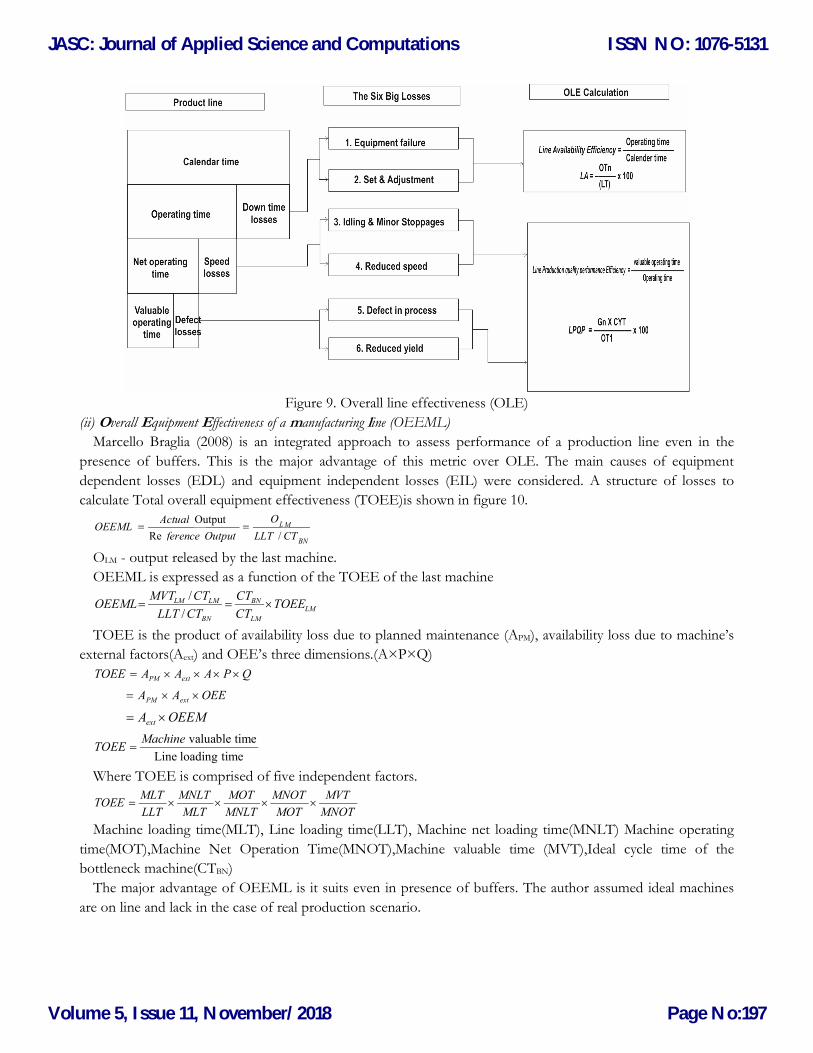
Figure 9. Overall line effectiveness (OLE)
(ii) Overall Equipment Effectiveness of a manufacturing line (OEEML)
Marcello Braglia (2008) is an integrated approach to assess performance of a production line even in the
presence of buffers. This is the major advantage of this metric over OLE. The main causes of equipment
dependent losses (EDL) and equipment independent losses (EIL) were considered. A structure of losses to
calculate Total overall equipment effectiveness (TOEE)is shown in figure 10.
OLM - output released by the last machine.
OEEML is expressed as a function of the TOEE of the last machine
LM
LM
BN
BN
LMLM TOEECT
CT
CTLLT
CTMVTOEEML
/
/
TOEE is the product of availability loss due to planned maintenance (APM), availability loss due to machine’s
external factors(Aext) and OEE’s three dimensions.(A×P×Q)
QPAAATOEE extPM
OEEAA extPM
OEEMAext
timeloading Line
time valuableMachineTOEE
Where TOEE is comprised of five independent factors.
MNOT
MVT
MOT
MNOT
MNLT
MOT
MLT
MNLT
LLT
MLTTOEE
Machine loading time(MLT), Line loading time(LLT), Machine net loading time(MNLT) Machine operating
time(MOT),Machine Net Operation Time(MNOT),Machine valuable time (MVT),Ideal cycle time of the
bottleneck machine(CTBN)
The major advantage of OEEML is it suits even in presence of buffers. The author assumed ideal machines
are on line and lack in the case of real production scenario.
BN
M L
CT LLT O
Output ference
Actual OEEML
/ Re
Output
JASC: Journal of Applied Science and Computations
Volume 5, Issue 11, November/2018
ISSN NO: 1076-5131
Page No:197
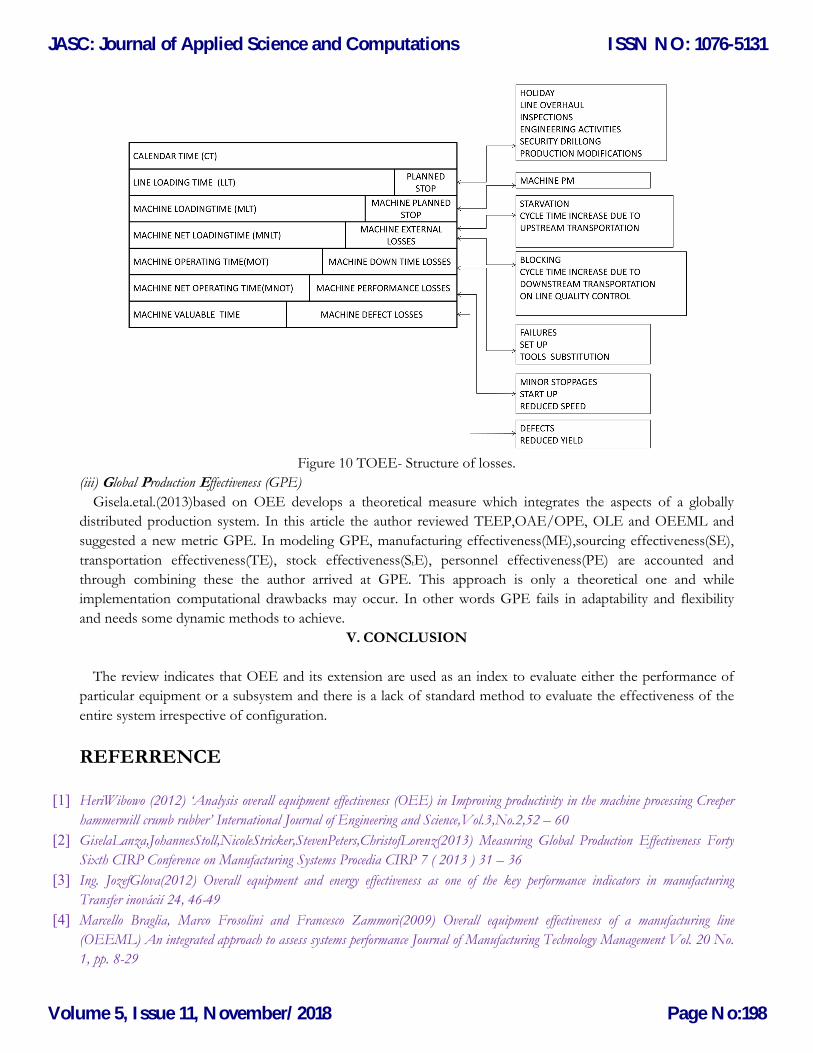
Figure 10 TOEE- Structure of losses.
(iii) Global Production Effectiveness (GPE)
Gisela.etal.(2013)based on OEE develops a theoretical measure which integrates the aspects of a globally
distributed production system. In this article the author reviewed TEEP,OAE/OPE, OLE and OEEML and
suggested a new metric GPE. In modeling GPE, manufacturing effectiveness(ME),sourcing effectiveness(SE),
transportation effectiveness(TE), stock effectiveness(StE), personnel effectiveness(PE) are accounted and
through combining these the author arrived at GPE. This approach is only a theoretical one and while
implementation computational drawbacks may occur. In other words GPE fails in adaptability and flexibility
and needs some dynamic methods to achieve.
V. CONCLUSION
The review indicates that OEE and its extension are used as an index to evaluate either the performance of
particular equipment or a subsystem and there is a lack of standard method to evaluate the effectiveness of the
entire system irrespective of configuration.
REFERRENCE
[1] HeriWibowo (2012) ‘Analysis overall equipment effectiveness (OEE) in Improving productivity in the machine processing Creeper
hammermill crumb rubber’ International Journal of Engineering and Science,Vol.3,No.2,52 – 60
[2] GiselaLanza,JohannesStoll,NicoleStricker,StevenPeters,ChristofLorenz(2013) Measuring Global Production Effectiveness Forty
Sixth CIRP Conference on Manufacturing Systems Procedia CIRP 7 ( 2013 ) 31 – 36
[3] Ing. JozefGlova(2012) Overall equipment and energy effectiveness as one of the key performance indicators in manufacturing
Transfer inovácií 24, 46-49
[4] Marcello Braglia, Marco Frosolini and Francesco Zammori(2009) Overall equipment effectiveness of a manufacturing line
(OEEML) An integrated approach to assess systems performance Journal of Manufacturing Technology Management Vol. 20 No.
1, pp. 8-29
JASC: Journal of Applied Science and Computations
Volume 5, Issue 11, November/2018
ISSN NO: 1076-5131
Page No:198
[5] PatrikJonsson and Magnus Lesshammar (1999) Evaluation and improvement of manufacturing performance measurement systems
– the role of OEE International Journal of Operations & Production Management,Vol. 19 No. 1, pp. 55-78,
[6] De Groote, P. (1995), “Maintenance performance analysis: a practical approach”, Journal of Quality in Maintenance Engineering,
Vol. 1 No. 2, pp. 4-24
[7] Raouf, A. (1994), “Improving capital productivity through maintenance”, International Journal of Operations and Production
Management, Vol. 14 No. 7, pp. 44-52.
[8] Bulent Dal Phil Tugwell Richard Greatbanks(2000) Overall equipment effectiveness as a measure of operational improvement -A
practical analysis International Journal of Operations & Production Management,Vol. 20 No. 12, pp. 1488-1502.
[9] Ljungberg, O. (1998), ``Measurement of overall equipment effectiveness as a basis for TPM activities'', International Journal of
Operations and Production Management, Vol. 18 No. 5,pp. 495-507.
[10] Ki-Young Jeong, Don.T.Philips(2001),”Operational efficiency and effectiveness measurement”, International Journal of Operations
& Production Management,Vol.21No.11,pp.1404-1416
[11] Bamber, C.J., Castka, P., Sharp, J.M. and Motara, Y. (2003), “Cross functional team working for overall equipment effectiveness
(OEE)”, Journal of Quality in Maintenance Engineering, Vol. 9 No. 3, pp. 223-38.
[12] Jeong, K. and Phillips, D.T. (2001), “Operational efficiency and effectiveness measurement”, International Journal of Operations
& Production Management, Vol. 21 No. 11, pp. 1404-16.
[13] Ericsson, J. (1997), “Disruption analysis – an important tool in lean production”, Department of Production and Material
Engineering, Lund University, Lund
[14] Nachiappan, R.M. and Anantharam, N. (2006), “Evaluation of overall line effectiveness (OLE) in a continuous product line
manufacturing system”, Journal of Manufacturing Technology Management, Vol. 17 No. 7, pp. 987-1008.
[15] Nakajima, S. (1988), An Introduction to TPM, Productivity Press, Portland, OR. Oechsner.R, Pfeffer.M, Pfitzner.L.
Binder,H. ,Muller,E. and Vonderstrass, T. (2003), “From overall equipment efficiency (OEE) to overall fab effectiveness
(OFE)”, Material Science in Semiconductor Processing, Vol. 5 No. 4, pp. 333-9.
[16] De Ron, A.J. and Rooda, J.E. (2005), “Equipment effectiveness: OEE revisited”, IEEE Transactions on Semiconductor
Manufacturing, Vol. 18 No. 1, pp. 190-6.
[17] Muthiah, K.M.N., Huang, S.H. and Mahadevan, S. (2008), “Automating factory performance diagnostics using overall
throughput effectiveness (OTE) metric”, International Journal of Advanced Manufacturing Technology, Vol. 36, pp. 811-24.
[18] Kanthi M.N. Muthiah and Samuel H. Huang(2006), A review of literature on manufacturing systems productivity measurement
and improvementInternational journal of Industrial and Systems Engineering, Vol. 1 No.4,pp461-484
[19] D. Daniel Sheu(2006),” Overall Input Efficiency and Total Equipment EfficiencyIEEE Transactions on Semiconductor
Manufacturing, vol. 19, no. 4,pp.496-501
[20] Huang, S.H., Dismukes, J.P., Shi, J., Su, Q., Wang, G., Razzak, M.A. and Robinson, D.E. (2002) ‘Manufacturing system
modeling for productivity improvement’, Journal of Manufacturing Systems, Vol. 21, No. 4, pp.249–259.
[21] Huang, S.H., Dismukes, J.P., Shi, J., Su, Q., Razzak, M.A., Bodhale, R. and Robinson, D.E. (2003)‘Manufacturing
productivity improvement using effectiveness metrics and simulation analysis’, International Journal of Production Research, Vol. 41,
No. 3, pp.513–527.
[22] Leachman, R.C. (1997) ‘Closed-loop measurement of equipment efficiency and equipment capacity’, IEEE Transactions on
Semiconductor Manufacturing, Vol. 10, No. 1, pp.84–97.
[23] Scott, D. and Pisa, R. (1998) ‘Can overall factory effectiveness prolong Moore’s law?’ Solid StateTechnology, vol.41.no.3pp.75–82.
[24] Muchiri, P. and Pintelon, L. (2008), “Performance measurement using overall equipment effectiveness (OEE): literature review
and practical application discussion”, International Journal of Production Research, Vol. 46 No. 13, pp. 3517-35.
[25] Badiger A.S., Gandhinathan R. (2008), “A proposal: evaluation of OEE and impact of six big losses on equipment earning
capacity”, International Journal of Process Management and Benchmarking, Vol. 2, No. 3
JASC: Journal of Applied Science and Computations
Volume 5, Issue 11, November/2018
ISSN NO: 1076-5131
Page No:199
[26] Goldratt, E.M.(1990b),What is This Thing Called Theory of Constraints and How Should it be Implemented?, North River
Press, New York, NY.
[27] Goldratt, E.M. (1994), It’s Not Luck, Gower, England
[28] Ivancic, I.(1998) Development of Maintenance in Modern Production: proceedings of 14th European maintenance Conference,
EUROMAINTENANCE’Dubrovnik,Hrvatska., 98, 5-7.
[29] R. Wudhikarn,(2010) “Overall Weighting Equipment Effectiveness,”The IEEE International Conf. on Industrial Engineering
and Engineering Management, Macau, People's Republic of China, pp. 23-27.
[30] Muthiah, K; Huang, S.:(2007) Overall throughput effectiveness (OTE) metric for factory-level performance monitoring and
bottleneck detection; International Journal of Production Research, Vol. 45 No. 20,4753-4769.
[31] F.H. Barron and B.E. Barrett,(1996) “Decision quality using ranked attribute weights”, Management Science, vol. 42,no. 11, pp.
1515–1523
[32] Chakravarthy, G.R., Keller, P.N., Wheeler, B.R., Oss, S.V.(2007) A Methodology for Measuring, Reporting, Navigating, and
Analyzing Overall Equipment Productivity (OEP). IEEE Advanced Semiconductor Manufacturing Conference, pp 303-312
[33] KaruppanaGounderEswaramurthi and PidugunVenkatachalamMohanram(2013) Improvement of manufacturing performance
measurement system and evaluation of overall Resource effectiveness, American Journal of Applied Sciences, Vol.10,No.2 ,pp131-
138, 2013
[34] SerminElevli and BirolElevli(2010) Performance Measurement of Mining Equipments by Utilizing OEE Acta Montanistica
Slovaca Ročník 15, číslo 2, 95-101
[35] Costa, S.E.G.D. and E.P.D. Lima, (2002.) Uses and misuses of the ‘overall equipment effectiveness’ forproduction management.
Proceedings of the IEEE International Engineering Management Conference,(IEMC’ 02), Catolica Do Parana, Curitiba,
Brazil,pp: 816-820.
[36] De Ron AJ,andRooda J.E (2006) OEE and equipment effectiveness: an evaluation. International Journal of production
Research.Vol.44.No.23 ,pp4987-5003
[37] Nilson Bastos Jr., Eduardo R. Loures, Eduardo A. P. Santos, Marco A. B. de Paula (2008) Production Process Efficiency
Analysis: an approach based on Colored Petri Nets Proceedings of the 17th World Congress The International Federation of
Automatic Control Seoul, Korea, July 6-11,2008
[38] Kunio Shirose, TPM for Operators, (Norman Bodek, Productivity, 1992).
[39] Ahuja, I.P.S. and Khamba, J.S., 2007, Assessment of contributions of successful TPM initiatives towards competitive
manufacturing, Journal of Quality in Maintenance Engineering, Vol. 14 No. 4, 2008, pp 356-374
[40] Dale, B.G. (1999) Managing Quality, Blackwell Publishers
JASC: Journal of Applied Science and Computations
Volume 5, Issue 11, November/2018
ISSN NO: 1076-5131
Page No:200