Embed Size (px)
Citation preview
A Review of Empirical Capital Structure Research ... 1
A Review of Empirical Capital Structure Research
and Directions for the Future †
John R. Graham∗
Duke University, Fuqua School of Business and NBER
Mark T. Leary∗∗
Washington University in St. Louis, Olin Business School
Key Words leverage, debt ratio, tradeoff theory, financial contracting, speed of adjustment,
partial adjustment model
Abstract This paper reviews empirical capital structure research, concentrating on papers published since
2005. We begin by documenting three dimensions of capital structure variation: cross-firm, cross-industry, and
within-firm through time. We summarize how well the traditional tradeoff and pecking order approaches explain
these sources of variation and highlight their empirical shortcomings. We review recent research that attempts
to address these shortcomings, much of which follows the following broad themes: i) Important variables have
been mis-measured in empirical tests, ii) The impact of leverage on non-financial stakeholders is important, iii)
The supply side of capital affects corporate capital structure, iv) Richer features of financial contracts have been
under-researched, v) Value effects due to capital structure appear to be modest over wide ranges of leverage, vi)
Estimates of leverage adjustment speeds are biased, vii) Capital structure dynamics have not been adequately
†We thank Ashwini Agrawal, Alon Brav, Murillo Campello, Murray Frank, Michael Lemmon, Adriano Rampini,
Stew Myers, and Michael Roberts for helpful comments, and Ben Ee for research assistance.
considered. Much progress has been made addressing these issues, some of which has led to the study of an
expanded range of capital structure topics, including debt maturity, loan and covenant characteristics, collateral
effects, and alternative financing sources such as leasing and credit lines. We conclude by summarizing unanswered
questions and areas for future research.
CONTENTS
INTRODUCTION . . . . . . . . . . . . . . . . . . . . . . . . . . . . . . . . . . . . . . . . . . . . . 3
LEVERAGE VARIATION AND THE LIMITATIONS OF TRADITIONAL MODELS . . . . . . . 5
Leverage and Firm Characteristics . . . . . . . . . . . . . . . . . . . . . . . . . . . . . . . . . . . . . . . 5
Analysis of Leverage Variation . . . . . . . . . . . . . . . . . . . . . . . . . . . . . . . . . . . . . . . . . 6
What Do Traditional Theories Explain? . . . . . . . . . . . . . . . . . . . . . . . . . . . . . . . . . . . . 9
WHY HAVE TRADITIONAL CAPITAL STRUCTURE MODELS STRUGGLED? . . . . . . . . 12
Variable Mis-measurement . . . . . . . . . . . . . . . . . . . . . . . . . . . . . . . . . . . . . . . . . . . . 12
Non-financial Stakeholders . . . . . . . . . . . . . . . . . . . . . . . . . . . . . . . . . . . . . . . . . . . . 15
Supply Effects . . . . . . . . . . . . . . . . . . . . . . . . . . . . . . . . . . . . . . . . . . . . . . . . . . . 17
Financial Contracting and Capital Structure . . . . . . . . . . . . . . . . . . . . . . . . . . . . . . . . . . 20
Are Value Effects Large Enough to Affect Capital Structure Choices? . . . . . . . . . . . . . . . . . . . . 26
EXPLAINING WITHIN-FIRM VARIATION . . . . . . . . . . . . . . . . . . . . . . . . . . . . . . 29
Mis-measurement of Adjustment Speeds . . . . . . . . . . . . . . . . . . . . . . . . . . . . . . . . . . . . 29
Dynamic tradeoff models . . . . . . . . . . . . . . . . . . . . . . . . . . . . . . . . . . . . . . . . . . . . . 33
CONCLUSIONS AND FUTURE DIRECTIONS . . . . . . . . . . . . . . . . . . . . . . . . . . . . 36
Outstanding Capital Structure Issues . . . . . . . . . . . . . . . . . . . . . . . . . . . . . . . . . . . . . . 37
Summary and Overarching questions . . . . . . . . . . . . . . . . . . . . . . . . . . . . . . . . . . . . . . 40
2
A Review of Empirical Capital Structure Research ... 3
1 INTRODUCTION
This paper reviews recent empirical capital structure research. Much of the research since the
seminal work of Modigliani and Miller (1958) has focused on testing the implications of two
traditional views of capital structure: the static tradeoff model in which firms form a leverage
target that optimally balances various costs (e.g., financial distress costs, stockholder-bondholder
agency conflicts) and benefits (e.g., tax savings, mitigated manager-shareholder agency costs)
of debt, and the pecking order of Myers and Majluf (1984) in which firms follow a financing
hierarchy designed to minimize adverse selection costs of security issuance. Empirically, these
theories have experienced both successes and challenges. Each view succeeds in explaining a
number of broad patterns in observed capital structures, such as the association between leverage
and various firm characteristics and the aggregate use of different sources of capital. However,
neither view has succeeded in explaining much of the observed heterogeneity in capital structures,
leverage changes, or security issuance decisions. In section II, we provide an overview of some
empirical properties of corporate capital structure to highlight these successes and failures.
Researchers have recently taken several approaches to address the shortcomings of the tra-
ditional models. These explanations, while not mutually exclusive, differ in their assumptions
and implications about the nature of the traditional models’ struggles. In some, the problem
lies not in the models themselves, but in our empirical measures of leverage and proxies for firm
characteristics, or biased estimates of model parameters. Other researchers suggest that while
the general framework of a given model is appropriate, the list of relevant market frictions is
incomplete. Still others suggest that the correct frictions have been identified, but the impli-
cations of those frictions for financial policies are incomplete without additional insights from
optimal contracting or dynamic considerations. Another possible explanation is that perhaps
the impact of modest leverage changes on firm value is small, resulting in a large number of
“neutral mutations” in observed data. These explanations of the inadequate performance of the

4 Graham & Leary
traditional capital structure models can be broadly grouped into the following seven categories:1
1. Important dependent and explanatory variables have been mis-measured.
2. The impact of leverage on non-financial stakeholders is important.
3. The supply side of capital affects corporate capital structures.
4. Richer features of financial contracts should be considered and add new dimensions to
study.
5. Value effects due to capital structure variation are modest over wide ranges of leverage
6. Estimates of leverage adjustment speeds are biased.
7. The implications of capital structure dynamics have not been adequately considered.
Note that the first five of these, which we review in section 3, are focused primarily (though not
exclusively) on explaining cross-sectional capital structure variation, while the last two, reviewed
in section 4, focus on variation within firms. While much of our discussion focuses on efforts to
explain leverage ratios or the debt-equity choice, in section 3 we also review the proliferation
of new research into the rich capital structure texture that emanates from item 5, such as debt
maturity, collateral effects, covenants, and credit lines.
While we begin by reviewing the empirical relevance of traditional capital structure views,
we note that there may not be much incremental knowledge gained by additional large sample
tests of the pecking order versus the tradeoff theory. Any decision that a company makes can
be viewed as trading off some costs and benefits. A broad enough interpretation of the tradeoff
theory may then be impossible to reject. In our view, the real question is which economic forces
are most important to capital structure choices. The sections that follow review the directions
the field is taking toward identifying these factors.
Further, there likely isn’t any “one size fits all” capital structure theory. For example, the
pecking order was not designed as a general theory to explain capital structure for all firms
1An additional line of research not reviewed here focuses on the interaction between financial policy and product
market outcomes. For an excellent recent review, see Parsons and Titman (2008).

A Review of Empirical Capital Structure Research ... 5
in all settings; rather, the original theory is geared towards mature, low growth-option firms.
More generally, a given market friction may be a first-order concern for some types of firms,
but of little relevance to others. Given the plethora of forces and issues that capital structure
research can investigate, challenges going forward include how to discern which issues are first-
order important versus secondary, and whether to study relations that hold relatively weakly in
broad panels of data versus holding strongly in very narrow samples. We comment further on
these issues in the conclusion.
2 LEVERAGE VARIATION AND THE LIMITATIONS OF TRADITIONAL
MODELS
A primary goal of capital structure research is to explain the heterogeneity in observed capital
structures. In this section, we highlight the successes and failures of traditional models in
explaining this variation. We look first at the directional associations between leverage and firm
characteristics and then at the ability of standard measures of the severity of market frictions
to explain the various components of leverage variation.
2.1 Leverage and Firm Characteristics
Table 1 (Panel A) examines differences in firm characteristics, conditional on the degree of
financial leverage.2 Several features are evident. First, firms vary widely in their use of leverage.
Average book leverage ranges from 1% in the lowest leverage quintile (11% of sample firms have
no debt) to 63% in the highest quintile. Second, firms with very low levels of leverage differ
in fundamental ways from firms with high leverage. For example (as many previous authors
have documented), high leverage companies are significantly larger, older, have more tangible
assets, lower market-to-book ratios, less volatile earnings, and are less R&D-intensive. Third, the
relation between leverage and many of these variables is non-linear. Specifically, firms with very
2The data are taken from the Compustat annual files from 1974 through 2009. See table headers for a more
complete sample description.

6 Graham & Leary
high leverage (quintile 5) are smaller, younger, and have higher market-to-book ratios than firms
with moderately high leverage. While this is partly influenced by the presence of distressed firms
in the highest leverage quintile, Figure 1 indicates that several of these non-linearities remain
even after removing distressed firms.
Table 1 also indicates a strong positive correlation between the level of leverage and debt
maturity, measured by the percentage of debt maturing in more than three years. Panel B shows
how firm characteristics vary conditional on debt maturity (Barclay and Smith (1995)). Many of
the relationships evident for leverage also hold for maturity. Firms with longer maturity debt are
on average larger, older, more profitable, have more tangible assets, fewer growth opportunities,
are less R&D intensive, and have less volatile earnings.
Panel C sorts by the proportion of fixed claims accounted for by leases. Here again we see
large differences in characteristics between more and less lease-dependent firms, although these
differences are most pronounced when moving from the third to fifth quintiles. Companies that
use more leases relative to debt are smaller, younger, less profitable, higher growth, have fewer
tangible assets, and pay fewer dividends. Panels D and E present, respectively, analogous tables
when sorting by total leverage (debt plus leases scaled by book assets) and the ratio of total
liabilities to assets, an alternative measure of leverage proposed by Welch (2011a). The results
are similar to those shown in Panel A, though we recognize that deeper analysis (e.g., coefficients
in multivariate regressions) might reveal important differences.
2.2 Analysis of Leverage Variation
Leverage ratios and other features of financial structure can vary across industries, across firms
within an industry, and within a firm (over time). In Table 2 we decompose total variation in
leverage, debt maturity and lease usage into these three components. The first two columns
report the proportion of leverage variation attributable to each component for book and quasi-

A Review of Empirical Capital Structure Research ... 7
market measures of leverage.3 We define industries by 4-digit SIC code. First, we note that,
consistent with the findings of Lemmon et al. (2008), leverage varies more cross-sectionally than
within firms. For both book and market leverage, roughly 60% of leverage variation is cross-
sectional. Of that cross-sectional variation, however, the majority is across firms within a given
industry rather than between industries, consistent with the findings of MacKay and Phillips
(2005). Within-industry leverage variation is twice as large as between-industry variation for
market leverage and three times as large for book leverage.
Panel A of Figure 2 shows that cross-sectional leverage variation has not been constant over
time. The figure plots the total, within-industry and between industry standard deviation of
leverage by year. The overall cross-sectional standard deviation has increased by about 1/3
from 1974 to 2009. Further, almost all of this increase has occurred within-industries, while the
between-industry standard deviation has remained fairly constant.
Columns (3) and (4) of Table 2 show similar patterns for debt maturity and the use of leases,
respectively. For both measures of debt structure, we see that the majority of variation is cross-
sectional and there is substantially more variation within industries than between industries.
However, leasing varies relatively more across industries and relatively less within firms.
Given these sources of variation, a natural next question to ask is, how well do our proxies
for leverage determinants (those examined in Table 1) explain variation in leverage along these
dimensions?4 We estimate the proportion of within-firm leverage, maturity, or leasing variation
explained by these determinants by estimating the following regression:
Lijt = α+ βXijt + ρi + ϵijt (1)
and report the adjusted R2 after partialling out the variation explained by firm fixed effects (ρi).
3Market leverage is defined as book value of short- and long-term debt divided by the sum of the book value
of debt and the market value of equity.
4We note that capital structure theory does not necessarily imply that leverage is a simple linear function
of these variables. However, this exercise gives an indication of the extent to which commonly used proxies for
market frictions capture the relevant inputs to capital structure choices.

8 Graham & Leary
Similarly, we measure the proportion of across-industry variation explained by estimating:
L.jt = α+ βX.jt + γt + ϵjt (2)
and report the adjusted R2 after partialling out year fixed effects. Finally, we measure the
proportion of within-industry variation explained by estimating year-by-year cross-sectional re-
gressions of the form:
Lij = α+ βXij + ηj + ϵij . (3)
For each year, we take the adjusted R2 after partialling out industry fixed effects and average
these R2s across years.
The results in columns (5) and (6) of Table 2 show that the standard variables are least effec-
tive at explaining within-firm debt ratio variation, explaining only 6% (11%) of the within-firm
variation in book (market) leverage. Columns (7) and (8) show that these proxies are even
less successful at explaining within-firm changes in debt maturity and leasing. This is consistent
with the findings of Welch (2004), who concludes that despite frequent security issuance activity,
year-to-year changes in leverage ratios are difficult to reconcile with capital structure theories.
Standard proxies are more successful in explaining cross-sectional leverage variation, and ex-
plain relatively more between-industry variation (20% and 29% for book and market leverage,
respectively) than within industry variation (15% and 20%). Again, the same pattern holds for
debt structure. Yet, even where the standard proxies perform best, the majority of leverage
variation remains unexplained (see Figure 1). For example, while there are large differences in
asset tangibility (net PPE/Assets) between firms in the lowest leverage decile and those in the
middle decile, there is little variation in average tangibility across deciles 6 through 10. Similar
patterns hold for other characteristics such as market-to-book, R&D, and earnings volatility.
Finally, we note that not only do existing determinants struggle to explain leverage variation,
their explanatory power has declined over time. In Panel B of Figure 2, we report the proportion
of explained variation within- and between-industries by year. Combined with panel A, we see
that, while within-industry variation has increased over time, our ability to explain that variation

A Review of Empirical Capital Structure Research ... 9
has decreased. Within-industry R2s for book leverage have fallen from roughly 30% in the mid-
1970s to less than 10% in the most recent decade. Much of this decline occurred during the
1980s. Between-industry R2s have also declined somewhat, especially during the 1980s, and are
markedly more volatile.
Taken together, we summarize the stylized facts for leverage, maturity and lease intensity as
follows:
1. There is more cross-sectional variation than within-firm variation.
2. Most of the cross-sectional variation is within industries as opposed to across industries.
3. Within-industry variation has increased over time.
4. Standard proxies best explain variation across industries, but struggle to explain variation
within firms.
5. The ability of standard proxies to explain leverage variation has declined over time, par-
ticularly for within-industry variation.
2.3 What Do Traditional Theories Explain?
The analyses above highlight the empirical successes and failures of traditional theories of capital
structure. Building on the irrelevance results of Modigliani and Miller (1958), the static tradeoff
suggests firms choose their capital structures to balance the benefits of debt financing (e.g.,
corporate tax savings and mitigation of agency conflicts between managers and shareholders)
with the direct and indirect costs of financial distress. Several cross-sectional patterns in leverage
are broadly consistent with this view.5 For example, if large firms are more stable, they likely
face lower bankruptcy probabilities and thus have higher optimal leverage. And if tangible assets
are easier to recover in default than intangible assets, leverage should be positively correlated
5See, for example, studies by Bradley, Jarrel and Kim (1984), Titman and Wessels (1988), Rajan and Zingales
(1995), and Fama and French (2002) and excellent reviews by Harris and Raviv (1991) and Frank and Goyal
(2009).

10 Graham & Leary
with asset tangibility and negatively correlated with R&D intensiveness. In terms of investment
opportunities, low-growth firms are likely more exposed to agency conflicts between managers
and shareholders, while firms with valuable growth options are more exposed to debt overhang
concerns. We would thus expect leverage to be negatively associated with the market-to-book
ratio. Further, Graham (1996) and Mackie-Mason (1990) show that high marginal tax rate
firms are more likely to issue debt. Focusing on within-firm variation, the tradeoff view is
that deviations from optimal leverage are costly and should be corrected. Studies such as
Jalilvand and Harris (1984) present evidence that leverage ratios mean-revert, consistent with
firms managing leverage toward a target.
Thus, directionally, many of the observed cross-sectional and within-firm patterns in leverage
are consistent with traditional tradeoff predictions. However, there are important shortcomings.
First, as several authors point out, the negative relation between profitability and leverage
appears inconsistent with the tradeoff model because, all else equal, more profitable firms should
more highly value the tax-shield benefits of debt. Related, many firms have very low (or zero)
leverage despite facing heavy tax burdens and apparently low distress risk (Graham (2000)).
Second, while directional tradeoff predictions are consistent with broad leverage patterns, they
explain relatively little of the observed capital structure variation. As Lemmon et al. (2008)
point out, much of the remaining variation is firm-specific and time-invariant. Third, while
studies estimating partial adjustment models (e.g., Jalilvand and Harris (1984) and Auerbach
(1985)) report statistically significant mean-reversion parameters, recent research (e.g., Fama
and French (2002), Baker and Wurgler (2002), Welch(2004), Iliev and Welch (2010)) suggests
that the rate of reversion to target is too slow to be considered a first-order policy determinant.
In light of this evidence, Myers (1993) suggests “[The static tradeoff model] may be a weak guide
to average behavior. It is not much help in understanding any given firm’s decisions.”
A traditional alternative to the tradeoff view comes from the pecking order of Myers and
Majluf (1984) and Myers (1984). While not a distinct framework from the tradeoff view (all

A Review of Empirical Capital Structure Research ... 11
economic choices involve tradeoffs between costs and benefits), the models differ in their view
of which market frictions are most relevant. The pecking order view suggests that the adverse
selection costs of issuing equity are large enough to render other costs and benefits of debt and
equity second-order. This implies financial slack is valuable and predicts a financing hierarchy
in which mature firms with limited growth prospects finance investments first out of internal
funds, then with debt, and issue equity only as a last resort.6 The promise of this view lies in
its consistency with two empirical regularities: (i) there is a significant negative market reaction
to the announcement of seasoned equity issues; and (ii) in aggregate, firms fund the majority
of investments with retained earnings while aggregate net equity issues are often small or even
negative.
At the micro level, studies by Shyam-Sunder and Myers (1999) and Helwege and Liang (1996)
have shown a strong correlation between a firm’s “financing deficit” (a proxy for the need for
external funding) and the issuance/retirement of debt.7 Frank and Goyal (2003) report very
different results when applying the tests of Shyam-Sunder and Myers to a broader sample.
Specifically, smaller and younger firms fill their financing deficits largely with equity. Similarly,
Fama and French (2005) report that equity issues are common, especially among small and high
growth firms. While such firms likely facing greater information asymmetry, Lemmon and Zender
(2010) point out that these findings are not necessarily inconsistent with the pecking order for
two reasons. First, high growth firms may be constrained by limited debt capacity (although
this suggests a role for tradeoff forces). Second, Myers and Majluf (1984) demonstrate that the
pecking order is most likely to be relevant for firms for which the value of growth opportunities
6Other frictions, such as transaction costs, taxes, agency costs, and managerial optimism can also generate
this hierarchy. See Stiglitz (1973), Myers (2003), and Heaton (2002). Similar predictions can also be generated
from full-information models if investment is the first-order decision and payout is smoothed, as in Lambrecht
and Myers (2010).
7Chirinko and Singha (2000) raise concerns over the power of financing-deficit regressions to distinguish among
alternative financing motives.

12 Graham & Leary
is low relative to assets in place. However, Leary and Roberts (2010) find that the pecking order
struggles to correctly predict issuance decisions, even among subsamples where the theory is
most expected to hold. Overall, while the pecking order may be a useful “conditional theory”
(Myers (2001)), like the tradeoff view it leaves many financing decisions unexplained.
Thus, while the traditional views each contain “elements of truth that help explain some
aspects of financing decisions” (p. 581; Fama and French, 2005) neither, by itself, is able to
account for the rich diversity in observed financial structures. It is against this backdrop that
we turn our review to recent advances in capital structure research that offer explanations for
these shortcomings and explore related issues.
3 WHYHAVE TRADITIONAL CAPITAL STRUCTUREMODELS STRUG-
GLED?
The previous section documents that extant research leaves much of the variation in corporate
debt policies unexplained. In this section, we review the primary approaches the recent literature
has taken to address this shortcoming.
3.1 Variable Mis-measurement
Leverage: Several authors have suggested that empirical capital structure inference is clouded
by mis-measurement of the dependent variable itself: leverage. Welch (2011a) points out that
standard measures of leverage exclude non-debt liabilities from the numerator. Thus, all else
equal, a firm with more non-financial liabilities appears less levered (see Panel E of Table 1 for
analysis conditioning on total liabilities, one measure that Welch suggests to avoid this problem).
Rampini and Viswanathan (2010) and Rauh and Sufi (2010a) suggest including the capitalized
value of operating leases in measures of debt (see Panel D). Cornaggia et al. (2009) document
that the role of leases has increased in time, and that increased operating leases appear to
substitute for debt usage. Consequently, the potential relevance of measuring total debt as
A Review of Empirical Capital Structure Research ... 13
the sum of capitalized leases and debt appears to be growing in importance.8 Rampini and
Viswanathan (2010) show that mean debt plus leasing ratios are relatively constant across firm
size deciles, while debt ratios (without adding leases) are positively related to size, suggesting
that firm size affects the debt structure but not the total amount of leverage a firm truly chooses.9
Rauh and Sufi (2010a) also include lease values in leverage, and find that this increases the
explanatory power of industry average leverage for firm i leverage by about 20% (R2 increases
from 0.20 to 0.24).
Distress Costs: One vexing problem for the tax-bankruptcy cost tradeoff literature is that
the probability of distress as measured by historic default occurrence is small. Based on these
probabilities the expected cost of distress appears to be much smaller than the apparently large
corporate tax benefits that could be achieved by using more debt (Miller, 1977; Graham, 2000),
implying that observed debt ratios are smaller than optimal debt implied by some traditional
static tradeoff models. Almeida and Philippon (2007) emphasize that distress occurs in bad
times, when the utility of a dollar is high. Thus, one should not use standard probabilities
to calculate expected distress costs. Instead, the authors back out risk-adjusted (i.e., risk-
neutral) default probabilities from market data on corporate bond spreads. These probabilities
of default imply that the risk-adjusted present value expected cost of default for BBB bonds is
about 4.5% of firm value, much higher than the 1.4% implied by standard probabilities. This
4.5% is also close in magnitude to extant measures of the benefits of debt (e.g., net of a rough
measure of personal tax costs; Graham, 2000). Thus, measured in this way, the expected cost
of distress may be large enough to offset on average the expected benefits of debt, and therefore
8The Financial Accounting Standards Board is debating whether operating and capital leases should be com-
bined and presented on the balance sheet. (Currently, operating leases are off balance-sheet but discussed in
financial footnotes.) If this accounting change goes through, it may affect whether future empiricists can identify
separate capital and operating leasing behaviors.
9Our analysis in Panel C of Table 1 indicates that the proportion of fixed claims from leasing decreases
monotonically with size.

14 Graham & Leary
on average corporate debt choices may be close to the ex ante optimum implied by the trade-
off model.10 (We note that though Almeida and Phillipon’s approach may help to explain the
average cost/benefit trade-off, it does not address cross-sectional issues about why some firms
(e.g., profitable firms) appear to use less debt than the trade-off model might imply.) Molina
(2005) also argues that distress probabilities are underestimated (in his view, due to omitted
variable bias.) To correct this bias, Molina proposes using marginal tax rates and past market
valuations as instrumental variables for leverage. Under the assumption that these instruments
are unrelated to credit ratings (but for their effect on leverage) he estimates a much higher
expected probability of distress, again offering a possible solution to the “underleverage puzzle.”
Tax Shields: It is possible that standard measures of tax benefits of incremental interest
deductions are overstated. Following in the tradition of DeAngelo and Masulis (1980), several
papers demonstrate that there are substantial non-debt tax shields that are missed by research
based solely on standard financial statement data. Graham and Tucker (2006) gather data
from 44 tax shelter legal filings and find that the annual deduction due to shelters is huge,
averaging 9% of asset value. Given such large “off balance sheet” deductions, these firms would
not find incremental debt interest deductions very valuable, and the authors document that
these companies reduced their debt ratios by about 800 basis points during the years of shelter
activity. Though somewhat smaller in magnitude, Shivdasani and Stefanescu (2010) find that
pension contributions that can be deducted from taxable income are roughly one-third of debt
interest deductions. This implies that standard debt ratio measures are understated for defined
benefit firms and also that defined benefit deductions reduce the incentive to use traditional
debt tax shields. Graham, Lang, and Shackleford (2004) find a similar result in relation to
deductions occurring due to executive stock option exercises. The implication of these papers is
10Elkamhi et al. (2009) argue that Almeda and Phillipon’s 4.5% calculation lumps together effects of negative
economic shocks and default costs. Using the Leland-Toft (1996) structural model to separate off the effects of
economic shocks, they argue that ex ante expected default costs are less than 1%, much smaller than expected
tax benefits.

A Review of Empirical Capital Structure Research ... 15
that researchers who do not incorporate deductions from off-balance sheet activity such as tax
shelters and pensions may incorrectly conclude that a company uses too few interest deductions.
In these last two papers, however, even after these novel deductions are considered, incremental
tax benefits still appear to be fairly large.
Huizinga et al. (2008) point to another issue, namely that multinational companies face
international tax incentives, while most research takes the perspective of a domestic-only firm.
Examining data from 32 European countries from 1994 to 2003, the authors find that the usual
tax incentive (to use more debt in a country where firms face a higher income tax rate) has
moderate effects: a 10% increase in the marginal tax rate increases debt usage about 1.8%.
Somewhat more important is shifting debt across subsidiaries within a multinational firm in
response to tax rate variation across the countries in which those subsidiaries operate: a 10%
increase in the tax rate in one country is estimated to lead to a 2.4% increase in debt in the
subsidiary operating in that country (relative to a subsidiary that did not face a tax increase).
3.2 Non-financial Stakeholders
Traditional capital structure research focuses on the relationship between the firm and its finan-
cial claimants, without addressing employees or other stakeholders. Recent work shows how the
incentive effects of capital structure can affect contracting between the firm and non-financial
stakeholders, in particular, employees, customers, and suppliers.
3.2.1 Suppliers and customers Titman and Wessels (1988) argue that the indirect
costs of distress can be high when distress to a given firm would bring about difficulties for its
customers (who are hesitant to purchase from a company that might default and not be around
to service the product) or suppliers (who might not supply product to a firm in or near distress).
These issues are heightened for durable goods producers because these are the types of goods
for which future service is important.
Banerjee et al. (2008) use customer/supplier data from the Compustat Business Information
16 Graham & Leary
File (which only runs through 1999) and find that companies use less debt when their supplier
is “dedicated” (e.g., a supplier that sells much of its output to one customer). This behavior is
consistent with customers considering their own financial distress risk as a cost to the supplier
(perhaps because dedicated suppliers will attempt to charge high-debt customers more). The
same works in reverse, with suppliers using less debt when their customers are “dedicated” to
one or a few suppliers. In both cases, the results are strongest in durable goods markets. Thus,
Banerjee et al. (2008) provide a deeper empirical explanation of Titman and Wessels’ finding.
In a related paper, Kale and Shahrur (2007) find that less debt is used by companies that have
relationship-specific investments (e.g., strategic alliances and joint ventures) with suppliers and
customers.
3.2.2 Employees and risk Leverage also increases risk for another important stakeholder:
employees, who are exposed to unemployment risk in the event of bankruptcy. This (indirect)
cost of financial distress is ultimately borne by the company in the form of higher wages (Berk et
al., 2010) and thus discourages the use of debt in a tradeoff sense. Agrawal and Matsa (2010) find
evidence consistent with this prediction. They find that when a state (exogenously) increases
unemployment insurance benefits, which has the effect of reducing the expected labor risk cost of
financial distress, companies increase debt usage. A hypothetical doubling of the unemployment
insurance benefit increases debt ratios by about 400 basis points. For a BBB firm, the authors
estimate that unemployment-related financial risk costs the firm about 0.57% of firm value.
3.2.3 Labor bargaining While the above studies suggest high leverage can make labor
contracting more costly, Brander and Lewis (1986) argue that management can use debt as a
negotiating tool. For example, firms with a substantial debt load can argue that employees must
take a pay cut to help the firm avoid (or emerge from) financial distress.11 Several recent papers
11An additional implication of Brander and Lewis (1986) and related studies is that capital structure can
affect how a firm competes in product markets. Several researchers have shown empirical support for product
market effects (e.g. Chevalier (1995), Kovenock and Phillips (1995, 1997), MacKay and Phillips (2005)). We limit
discussion for space reasons but refer the reader to Parsons and Titman (2008) for a thorough review.

A Review of Empirical Capital Structure Research ... 17
investigate labor negotiations in detail.
Hennessy and Livdan (2009) model optimal debt choice as a trade-off between the bargaining
benefits of debt and debt-related supplier disincentives. Their model predicts that leverage
should increase with supplier bargaining power (e.g., unionization rates) and decrease with the
use of human capital in the production process. Matsa (2010) finds support for the unionization
prediction, exploiting exogenous variation that comes from changes in state laws related to union
power. He finds that an additional 10% unionization leads to approximately a 100 basis point
increase in debt ratios (as the firm presumably takes on debt as an eventual bargaining device).
Matsa implicitly assumes that companies can ex ante use debt (and the probability of financial
distress) to negotiate with employees. To document whether this occurs ex post (which would
justify the ex ante assumption), Benmelech et al. (2010) investigate whether distressed airlines
successfully bargain concessions from employees. They find that airlines are able to wring the
largest concessions from the employees who would be hurt the most if an airline would go
bankrupt (e.g., highly paid pilots who work for airlines with underfunded pensions), consistent
with distress playing an important role in labor negotiations in this setting.
3.3 Supply Effects
Much of the extant capital structure literature has assumed, consistent with Modigliani and
Miller (1958), that capital supply is perfectly elastic, implying that capital structures are de-
termined solely by corporate demand for debt. Several recent studies challenge this notion and
suggest that capital market segmentation and supply conditions significantly influence observed
financial structures.12
3.3.1 Credit supply Much of the recent work in this area focuses on segmentation in debt
markets between bank-dependent firms and those with access to arms-length lenders. Faulkender
and Petersen (2006) use access to public debt markets, proxied by the existence of a credit rating,
12We review here recent studies with the most direct implications for corporate capital structure. For a more
comprehensive review of the role of supply conditions in corporate finance and investment, see Baker (2009).

18 Graham & Leary
as a supply shifter. They find that firms with a credit rating have debt ratios significantly higher
than those without, even controlling for typical proxies for debt demand. This suggests that
firms without bond market access face a different supply schedule than those with. However,
a concern is that the existence of a bond rating captures unobservable differences in demand,
which Faulkender and Petersen address with instrumental variables, employing proxies for firm
visibility and uniqueness as instruments for having a credit rating.
Subsequent studies bolster the identification of this supply effect by studying shocks to the
supply curve faced by bank-dependent firms. Sufi (2009a) examines the introduction of ratings
for syndicated loans, which he concludes led to increased debt issuance and investment by riskier
borrowers. This suggests these ratings were effective in reducing the informational frictions that
generate segmentation like that noted by Faulkender and Petersen. Similarly, Tang (2009)
studies the surprise refinement of Moody’s credit ratings in 1982 and shows that firms receiving
a refinement upgrade added more long-term debt and use more debt relative to equity than firms
receiving a downgrade. Leary (2009) studies shocks to banks’ access to loanable funds caused by
the introduction of negotiable CDs in the early 1960s and the imposition of binding interest rate
ceilings in 1966. These loan supply shocks had differential effects on both leverage ratios and
the mix of bank vs. non-bank debt of small firms relative to large firms. Choi et al. (2010) show
that supply effects are also evident in the convertible bond market, using the short-sale ban of
Fall 2008 as an instrument for the capital supply of convertible bond arbitrage hedge funds.
On the other hand, two recent papers demonstrate that supply shocks are not uniformly as-
sociated with relative leverage changes. Rice and Strahan (2010) study changes in bank market
competition caused by relaxation of interstate branching regulations. They find higher interest
rates in states with tighter restrictions on interstate branching, suggesting that decreased com-
petition restricts loan supply. However, they do not find an effect on loan quantities. Lemmon
and Roberts (2010) study segmentation based on investment vs. speculative-grade bond rat-
ings. Identification comes from the supply shock in the junk bond market precipitated by the
A Review of Empirical Capital Structure Research ... 19
collapse of Drexel Burnham Lambert, Inc. and subsequent regulatory changes in 1989. Lem-
mon and Roberts show that debt issuance and investment of below-investment grade firms are
affected by junk bond supply conditions.13 However, because speculative grade firms are unable
to substitute toward equity capital, simultaneous declines in debt issuance and investment rates
leave leverage ratios relatively unchanged. These results, in combination with those of Rice and
Strahan (2010), suggest that the effects of supply conditions on capital structures may depend
on the particular segment or economic conditions attending the shock.
3.3.2 Equity market timing Supply conditions can affect equity issuance motives through
either of two channels. The first is that managers attempt to exploit deviations of security prices
from fundamental value (Baker, Stein and Wurgler (2003); Campello and Graham (2010)). Sec-
ondly, if adverse selection costs are negatively correlated with market returns, the cost of equity
issuance identified by Myers and Majluf (1984) may be lower when prices are high (Bayless and
Chaplinsky (1996)). Both survey (Graham and Harvey (2001)) and archival evidence has shown
that the propensity to issue equity (both in absolute terms and relative to debt) is positively
correlated with recent past equity returns (Taggart (1977), Marsh (1982), Hovakimian, Opler
and Titman (2001)). Whether these patterns can be attributed to equity market supply condi-
tions again depends on our ability to separate supply from demand factors. For example, equity
issuance and returns may both be correlated with growth opportunities. Identifying a separate
supply effect can be particularly challenging if changes in investor sentiment are correlated with
firm fundamentals.
Several types of evidence support the case for a supply channel. First, post-issuance returns
and operating performance are unusually low.14 More recently, Chang, Dasgupta and Hilary
13This evidence of segmentation based on credit ratings is one possible explanation for the finding of Kisgen
(2006, 2009) that firms manage leverage ratios to maintain a given credit rating and of Kisgen and Strahan (2010)
that bond yields fall for firms receiving a higher rating from a newly certified agency, relative to their ratings from
other agencies.
14See Ritter (2003) and Eckbo, Masulis and Norli (2007) for thorough reviews of the evidence on post-issuance

20 Graham & Leary
(2006) argue that firms with less analyst following are more prone to both mispricing and adverse
selection costs. Consistent with supply effects, they find that the equity issues of these firms are
more sensitive to equity market conditions than are firms with greater analyst following. Lamont
and Stein (2006) argue that aggregate market prices are more likely to reflect mispricing than
are individual firm-level prices. Consistent with a mispricing channel, they find that net equity
issuance is more sensitive to aggregate stock returns than to firm-level returns. Huang and Ritter
(2009) back out the implied equity risk premium from observed prices and analyst EPS forecasts
and show that issuance decisions are highly sensitive to this estimated risk premium. Finally,
Baker, Coval and Stein (2007) present evidence that the willingness of target firm shareholders
to passively hold shares received from an acquirer affects both acquirer returns and the choice
of payment method (i.e., stock vs. cash).
While supply-driven equity issuance activity is clearly relevant for time-series changes in cap-
ital structure, it becomes relevant for cross-sectional leverage ratios only if the capital structure
effects of these issuances are persistent. If firms use subsequent security issuance and retirement
activity to undo the leverage effects of market timing issuances, they amount only to tempo-
rary deviations from optimal capital structure. We return to this issue when we discuss recent
evidence on leverage dynamics in Section 4.
3.4 Financial Contracting and Capital Structure
Insights from optimal financial contracting theory broaden our understanding of capital structure
beyond that which is provided by the traditional models.15 Traditional models take the types
of securities as given and ask whether an optimal mix of these securities enhances firm value. In
contrast, this literature starts with an underlying friction (typically an incentive conflict between
the manager/owner and investor) and derives the optimal contract(s) that mitigate the effect of
the friction.
returns. See Loughran and Ritter (1997) for evidence on operating performance.
15See Roberts and Sufi (2009a) for a thorough review of empirical work in financial contracting.

A Review of Empirical Capital Structure Research ... 21
The resulting empirical questions naturally go beyond just studying leverage ratios and focus
on more detailed features and types of financing contracts, such as covenants, maturity, leasing,
and the potential for renegotiation.16 This can help explain the shortcomings of traditional
models in several ways. First, if incentive conflicts are controlled by features of debt contracts,
there may be little role for the leverage ratio in mitigating agency or information problems.
For example, covenants may control incentives more effectively than high leverage (Nini, Smith
and Sufi (2009)). Second, it helps refine our understanding of the determinants of debt capac-
ity (e.g., Rampini and Viswanathan (2010) argue that in the face of incentive conflicts, only
collateralizable assets can support borrowing capacity). Third, the contracting literature high-
lights the fact that not all debt is equivalent, as is often implicitly assumed in constructing
leverage ratios. In DeMarzo and Sannikov (2006), for example, firm risk and liquidation values
have no effect on total debt capacity but do influence the mix of long-term debt and lines of
credit. Empirically, Rauh and Sufi (2010b) examine firms with credit ratings and demonstrate
that there is substantial variation in the types of debt financing that firms use, even among
firms with similar overall debt ratios.17 They also show that the correlation between standard
leverage determinants and debt levels can be quite different for different types of debt. For
example, the negative relation between profitability and leverage is driven primarily by private
placements and convertible debt, but reverses sign for bank debt. To the extent that convertible
debt is more informationally sensitive than bank debt, this challenges the traditional pecking
order interpretation of this relation.
16There is of course an older literature on these capital structure issues. For example, debt maturity (Myers,
1977; Barclay and Smith, 1995), covenants (Smith and Warner, 1979), leasing (Myers, Bautista, and Dill; Smith
and Wakefield, 1985). The recent financial contracting literature has rekindled interest in these topics and also
introduced a new framework within which to interpret results.
17Rauh and Sufi also argue that (rated) companies use multiple sources of debt. Colla et al. (2010) perform
similar analysis but also include unrated firms in their sample. They document the intriguing result that most
(unrated) firms rely on only one type of debt financing, whether that type be term loans, senior bonds, leases,
etc.

22 Graham & Leary
In this section, we focus on two groups of recent papers coming out of this literature. The
first studies the role of asset liquidity and redeployability on the availability, cost, and maturity
of debt financing. The second studies the role of covenants and renegotiation.
3.4.1 Collateral and asset redeployability It has long been known that collateral,
as measured by PPE/Assets, plays a major role in explaining capital structure (e.g., Graham,
1996). The strong relation is evident and near-monotonic in most panels of Table 1, where higher
PPE is associated with higher leverage, longer debt maturity, and less leasing as a percentage
of fixed obligations. (The PPE effect is nonmonotonic and falls off in panel E, which examines
total liabilities over assets.) What is less clear is why the result holds and whether all forms of
PPE are equally valuable as collateral. We group papers in this subsection roughly by whether
a given paper empirically investigates collateral effects in the context of leverage ratios, cost of
finance, debt maturity, or leasing.
Leverage Ratios: A central focus of the financial contracting literature is the ability of a lender
to seize a borrower’s assets in default. Consequently, the redeployability of the asset (i.e., the
degree to which the asset can be readily used by other firms) affects the amount and structure
of debt that can be borrowed. One key empirical finding is that debt capacity of assets increases
when those assets are more redeployable. For example, Campello and Giambona (2010) show
that land and buildings, which one could argue are more redeployable than are other forms
of PPE, support greater debt usage.18 In contrast, assets that are not as readily redeployable
(e.g., unique machines) have less debt capacity. The authors also find that redeployability is
more valuable during periods of tight credit, and (somewhat surprisingly) only important for
financially constrained firms. Interestingly, Rauh and Sufi (2010b) find that the positive relation
between tangibility and leverage disappears for bank debt, suggesting that bank relationships
can substitute for physical collateral.
18Gan (2007) examines the collateral channel effect on corporate policies of the shock to Japanese land values
in the early 1990s. She finds that firms with greater land holdings suffered greater reductions in borrowing (and
investment) as a result of the reduced liquidity and collateral value of land.
A Review of Empirical Capital Structure Research ... 23
Though they do not break tangible assets into components (e.g., land/buildings, machinery),
Rauh and Sufi (2010a) find that the overall degree of asset tangibility is highly correlated across
firms within the same industry (which they measure based on CapitalIQ competitor data, rather
than SIC codes). They argue that this within-industry similarity of asset tangibility drives their
finding that the mean debt ratio of competitors by itself explains 30% of leverage variation.19
Related, two recent papers argue that the amount of debt used should increase when the type
of debt used has lower expected cost of distress. In particular, Lemmon et al. (2010) and
Korgaonkar and Nini (2010) find that total firm debt increases with the proportion of that debt
that is made up by securities backed by safe assets such as accounts receivable.
Financing Cost : Benmelech and Bergman (2011) show that the collateral channel can spread
the effects of distress from one firm to another. Among airlines, they examine the cost of debt
in different tranches, identifying effects based on the degree to which the collateral of a given
tranche consists of aircraft models that are also used by other airlines that have encountered
distress. The idea is that collateral value decreases, and hence the cost of debt in a tranche
increases, when the airplane type is also used by distressed firms. The authors confirm this
empirically. Benemelech and Bergman (2009) also study the airline industry, and in particular
the secured claims of a given airline. They find more redeployable assets are associated with
lower debt costs (as measured by yield spreads), higher credit ratings, and higher loan-to-value
ratios.
Debt Maturity : Benmelech (2009) defines salability as the combination of asset redeployability
and asset liquidity (with the latter being the financial strength of potential third-party users
of an asset). A key finding is that debt maturity is affected by collateral characteristics, with
more salable assets allowing the firm to use longer term debt. Benmelech (2009) examines
the rolling stock of 19th century railroads and finds that more salable assets (that is, trains
with car width designed to run on standard guage track) lead to railroad firms using more
19Recent work by Leary and Roberts (2011) shows evidence for a complementary explanation of the importance
of industry leverage, namely that firms are directly influenced by the financing choices of their peers.

24 Graham & Leary
long-term debt. (Contrary to the research described above, Benmelech does not find a relation
between the overall debt ratio and salability.) Focusing more on the liquidity characteristics of
collateral, Benemelech et al. (2005) find that more liquid commercial real estate (as measured by
the number of potential buyers) leads to more nonrecourse loan contracts and longer maturity
debt.20
Leasing : Dynamic models can be used to study the important role that collateral plays in
leasing. Eisfeldt and Rampini (2009) and Rampini and Viswanathan (2010) argue that when
a borrower is distressed, collateral tied to a lease contract is easier to seize than is collateral
tied to secured debt, and therefore leasing increases debt capacity. These models argue that
this benefit of leasing is traded off against the cost of separating asset ownership and control
in leasing. As a result, more constrained and less profitable firms are more likely to lease.
Evidence consistent with these predictions is evident in Table 1, Panel C (if firm size and asset
tangibility are interpreted as inverse measures of financial constraints), though the relation is
nonmonotonic. Rampini and Viswanathan (2010) argue that their model helps explain the “low
leverage puzzle”: firms with zero or low leverage are primarily those with few tangible assets,
and these firms are significant users of leases. Gavazza (2010) also argues that the expected
costs of external finance decrease with asset liquidity. By studying April 2003 aircraft leases,
he finds that more liquid assets lead to more operating leasing, shorter term leases (because the
lessor demands longer tenor when the asset is less liquid) and lower lease rates.
3.4.2 Constraining managers: covenants and renegotiation Incentive conflicts
often arise as a firm becomes distressed. For example, a manager might like to maintain control
of the firm, hoping to right the ship before the firm liquidates, possibly by undertaking risky
actions. Lenders, in contrast, would like to take control of the firm before it becomes too
distressed. The financial contracting literature derives covenants as a means to address this
conflict, giving control to lenders if a firm violates a profitability covenant for instance, or
20Almeida, Campello, Laranjeira, and Weisbenner (2009) document real effects (decreased investment) of debt
maturity among firm for which long-term debt matured during the 2007-2009 financial crisis.
A Review of Empirical Capital Structure Research ... 25
resulting in renegotiation between the borrower and lender at an early stage.
Several recent papers investigate covenants and their effects. Chava et al. (2008) argue
that covenants are used to counter managerial agency (e.g., covenants that restrict investment
are more prevalent, and covenants that restrict payout or takeovers are less prevalent, when
managers are entrenched) and lack of transparency (e.g., payout covenants are more common
when a firm uses less transparent accounting or when uncertainty about investment is high).
Roberts and Sufi (2009b) find that one-fourth of U.S. public companies violate a debt covenant
at some point between 1996 and 2005. Following these violations, one-fourth of lenders reduce
the size of the violator’s credit facility and debt ratios of violators decline from about 29% to
24%, but only 4% of credit agreements are terminated by the lender. Though these results
indicate that covenants matter, the authors state (p. 1669) that “covenant violations are not
responsible for much of the total variation in leverage ratios” (see Section 2 of our paper).
Sufi (2009b) studies covenants associated with corporate lines of credit. He finds that credit
lines are an important potential source of funding, equalling 16% of total assets. (On average, 6%
is drawn from credit lines and would appear as debt on the balance sheet, while 10% is undrawn
and represents unused debt capacity.21) Sufi highlights that access to credit line financing is
conditional on corporate performance by documenting that the size of available credit lines
shrinks by one-fourth following violation of a covenant. Campello et al. (2011) survey several
hundred public and private firms regarding line of credit covenant violations during the 2007-
2009 financial crisis. They find that 19% of respondents violated a financial covenant and another
8% nearly violated. Even in the midst of a crisis, only 9% of violators had all of their credit lines
canceled in response, though the majority received unfavorable changes in terms (e.g. higher
fees, collateral requirements or borrowing limits). This suggests that intermediaries are willing
to renegotiate in order to maintain the lending relationship. Overall, the financial consequences
of violation were more severe during the credit crisis, but even then covenant violations did not
21About one-third of firms that have zero debt on the balance sheet have an established but completely undrawn
line of credit, providing a new wrinkle into the puzzle of zero debt firms.
26 Graham & Leary
prevent access to credit for most firms.22
Benmelech and Bergman (2008) find that collateral values are important not only for obtaining
financing, but also influencing renegotiation. They find that airlines are better able to renegotiate
lease obligations when the collateral behind the lease is poor (and, when an airline’s financial
position is poor).
3.5 Are Value Effects Large Enough to Affect Capital Structure Choices?
In Section 2, we highlighted that several correlations between leverage and firm characteristics
are directionally consistent with predictions from traditional tradeoff theories, though other
relations are either not statistically significant or have the wrong sign. Table 2 and Figure 2
highlight that the majority of capital structure variation remains unexplained. In this section,
we discuss research that indicates that the contribution to firm value of optimal capital structure
choices is moderate for most firms (though large for some firms). If the value effects of capital
structure are modest over wide ranges of leverage, this might explain why researchers have
struggled to document large, significant capital structure effects. While large deviations from
optimal may be costly, there may be little incentive for companies with moderate leverage to
frequently optimize capital structure policy in ways that are correlated with observable variables.
Two recent papers quantify the net benefit of optimal financial policy and shed some light on
the value-importance of capital structure decisions. Thus, the importance of capital structure
tradeoffs may be modest over wide ranges of leverage choices. van Binsbergen et al. (2010)
examine the debt choices of non-distressed, unconstrained firms that appear to make (close to)
optimal financing decisions. In equilibrium, these debt choices should occur where the marginal
benefit function (directly simulated by the authors) intersects the marginal cost of debt function.
The cost function itself is unobserved; however, as the benefit function shifts, it is possible to
observe a series of optimal cost/benefit intersection points, and these observed points allow the
22Chava and Roberts (2008) and Nini et al. (2009) document real effects (decreased investment) following
covenant violation.
A Review of Empirical Capital Structure Research ... 27
cost function to be inferred (by statistically “connecting the dots” provided by the intersection
points). The crucial requirement is that the cost function must remain fixed as the benefit
function shifts, which the authors accomplish by including control variables designed to hold the
cost function ceteris paribus fixed and/or by observing exogenous variation in benefit functions
induced by tax regime changes. This approach explicitly provides firm-specific benefit and cost
of debt functions. By integrating the area between these functions, the authors estimate the net
benefits of optimal financing choice. van Binsbergen et al. (2010) find that the net benefit of
optimal financial choice equals about 3.5% of asset value averaged across all firms. Net benefits
average 6% for firms in the upper half of the net benefit distribution, but only about 1% for
firms in the lower half of the distribution.
Korteweg (2010) uses a completely different approach and finds similar results. Korteweg
generalizes the Modigliani and Miller (1958) beta levering and valuation formulas. By observing
how market returns of stocks and bonds vary across firms, conditional on a company’s leverage,
he infers a 4% net contribution of financing choice to firm value.
This evidence indicates that for perhaps half of public firms the value contribution of optimal
capital structure is modest (see van Binsbergen et al.’s relatively flat value function in their
Figure 10 for leverage +/- 20% of optimal debt choice), perhaps indicating that many firms will
not carefully optimize capital structure each period (in the face of even modest transactions
costs). However, it is also the case that far-out-of-equilibrium choices (e.g., using excessive
debt) can have disastrous effects. It is also true that for some firms, the optimal financing choice
is quite valuable. For example, Hotchkiss et al. (2011) show that private equity investments
earn abnormal returns of nearly 70% in 192 LBOs completed between 1990 and 2006, with
about one-third of that coming from interest tax savings, greater than the one-fourth emanating
from operating improvements. Thus, in cases, choosing a new capital structure is associated
with substantial value enhancement. Nonetheless, these papers raise the possibility that the
moderate success of the capital structure literature is tied to moderate value effects for a wide
28 Graham & Leary
variety of capital structure choices.
3.5.1 Does capital structure reflect managers’ personal preferences? One
potential implication of a flat value function is that capital structures may reflect managers’
personal preferences or biases, with little correction by equityholders or the market for corporate
control. Several recent studies suggest this could be the case. Bertrand and Schoar (2003)
provocatively find that CFO fixed effects (but not CEO effects) are correlated with leverage
and interest coverage in their firm.23 The authors identify manager fixed effects when the CFO
moves from one company to the other, with the implication that debt policy changes as a new
CFO arrives to the firm. Due to data limitations, it is not possible to say whether the CFO
forces her capital structure preferences on the firm or the firm decides it wants a new capital
structure and therefore hires a CFO who they know has worked in a similar capital structure
setting in the past.24
Graham and Narasimhan (2004) document a capital structure effect based on personal expe-
riences during the Great Depression era. The authors document that debt ratios fell by about
one third during the Depression. The more interesting result is that debt ratios remained low at
companies as long as their Depression-era president remained in power. Once the Depression-era
president left the firm, on average the firm’s debt ratio increased back to its pre-Depression level.
Malmendier, Tate, and Yan (2010) link several personal CEO traits to corporate financial policy.
They also find that CEOs with Depression experience use less external financing. Malmandeir et
al. also find that overconfident managers (who thus might view their firm as being undervalued)
rely more heavily on internal financing. A recent paper by Cronqvist et al. (2010) finds an
23Finding that CFOs affect capital structure is plausible given the evidence in Graham et al. (2010) that CFOs
play a relatively larger decision role in capital structure than in other corporate policies (such as mergers and
acquisitions).
24Fee et al. (2010) examine exogenous variation in CEO changes, such as unexpected death, which they argue
would be easiest to causally interpret in terms of executive fixed effects. They do not find evidence of CEO fixed
effects in corporate policies following these exogenous events, leading them to question previous managerial style
interpretations.

A Review of Empirical Capital Structure Research ... 29
association between a manager’s personal leverage (measured by home mortgage loan to value
ratio) and corporate leverage.
Related, two recent studies show that risk incentives in CEO compensation contracts signif-
icantly impact leverage decisions. Lewellen (2006) uses information about CEO portfolios to
estimate the impact of a change in leverage on each CEO’s certainty-equivalent wealth, which
she empirically links to issuance decisions and leverage. Brockman et al. (2010) similarly find
that compensation packages affect the structure of debt financing. In particular, certain (high
vega) compensation packages may give managers incentive to take on risk, while others (high
delta) may discourage risk. The authors find that short term debt, which can be used to at-
tenuate the incentive to take on risk, is more prevalent in risky (high vega) settings, and less
prevalent in low risk (high delta) settings.
4 EXPLAINING WITHIN-FIRM VARIATION
The previous section described new research that (for the most part) addresses inadequacies
of traditional explanations of cross-sectional variation in capital structure. In this section we
review deficiencies and recent improvements related to within-firm analysis.
4.1 Mis-measurement of Adjustment Speeds
One potential explanation for the poor explanatory power of traditional tradeoff models is that
firms are often perturbed away from target leverage. That is, firms’ actual leverage may deviate
from optimal due, for example, to shocks to asset values or because managers take advantage
of short-term market timing opportunities. If so, proxies for optimal leverage determinants will
have low explanatory power, both in the cross section and within-firm. If firms actively manage
leverage toward a target, though, we ought to see evidence of a return to target following such
shocks.
However, several authors conclude that firms appear to respond slowly (at best) to deviations

30 Graham & Leary
between actual and target leverage. For example, Fama and French (2002) estimate a partial
adjustment model of leverage and find the speed of adjustment, while statistically significant, to
be “a snail’s pace.” Welch (2004) finds that 60% of year-to-year variation in leverage ratios is
due to active net issuance activity. However, very little of this variation is explained by proxies
for leverage targets and firms do not appear to reverse the mechanical effect of stock returns on
leverage. Baker and Wurgler (2002) report that past market timing opportunities, proxied by an
external-finance-weighted average of past market-to-book ratios, is strongly negatively correlated
with leverage ratios, even controlling for contemporaneous firm characteristics. Further, these
effects are highly persistent: the marginal effect of past timing opportunities measured up to
year t is still evident in year t+ 10.
All of these results suggest, in different ways, that firms do not appear to actively manage
leverage toward a target. Recent research argues that much of this evidence results from mis-
measurement of adjustment speeds. Some recent studies focus on bias in estimates of partial
adjustment coefficients (Section 4.1.1). Others argue that partial adjustment models have weak
power to distinguish leverage targeting from other financing motives (Shyam-Sunder and Myers
(1999), Chang and Dasgupta (2009). As a result, to infer targeting behavior, other studies
examine security issuance choice or the response to specific leverage shocks (Section 4.1.2).
4.1.1 Partial adjustment models A common empirical specification of a traditional
tradeoff model that allows for temporary deviations from target is the partial adjustment model:
∆Lit = α+ γ (L∗it − Lit−1) + ϵit or (4)
Lit = α+ γL∗it + (1− γ)Lit−1 + ϵit
where L∗it is the optimal leverage for firm i in time t, and γ measures the “speed of adjustment”
(SOA) – how much of the gap between actual and target leverage a firm closes in a year.
Note that the unobserved optimum L∗it must be specified by the researcher, usually as a linear
combination of observable leverage determinants such as those in Table 2. However, Lemmon,
Roberts and Zender (2008) (LRZ) demonstrate that the estimated SOA is little affected whether
A Review of Empirical Capital Structure Research ... 31
one specifies the target as a firm-specific constant or as a function of time-varying characteristics.
Likewise, Iliev and Welch (2010) show that most estimators produce similar SOAs whether data
are simulated under the assumption of unknown targets or data are simulated with perfectly
known targets.
Several authors note that much of the unexplained leverage variation (Table 2) is firm-specific.
LRZ show that adding firm fixed effects to the standard set of leverage determinants more than
triples the adjusted R2. The presence of firm effects in the error makes consistent estimation
of the speed of adjustment challenging, since it implies correlation between ϵit and Lit−1 in
equation (4). Unfortunately, simply adding fixed effects (or de-meaning variables within firm)
does not remove the correlation between the independent variable and the error. Fortunately, the
biases from estimating the partial adjustment model with OLS and fixed effects run in opposite
directions, with OLS under-stating the true adjustment speed and fixed-effects estimation over-
stating (Hsiao, 2003). This at least allows us to bound the average speed of adjustment.25
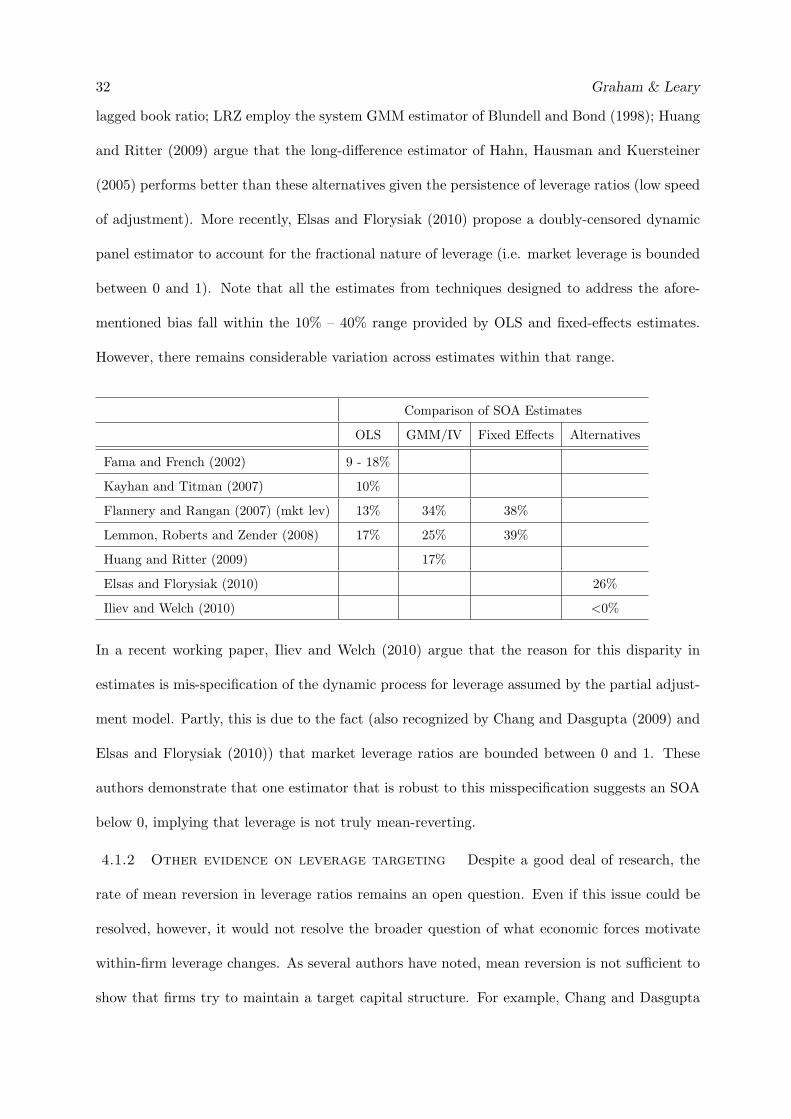
The table below summarizes estimated leverage adjustment speeds from recent studies.26 As
expected, OLS delivers the lowest estimates, ranging from 10% to 18% per year. Fixed effects
estimates are the highest, close to 40% per year. Several authors have turned to instrumental
variables and GMM approaches to reduce the bias in these previous sets of estimates.27 Flan-
nery and Rangan (2006) use IV with the lagged market leverage ratio as an instrument for the
25However, both Huang and Ritter (2009) and Flannery and Hankins (2010) demonstrate that for subsamples
of firms with as few as five observations (the median firm in the industrial CRSP/Compustat universe has only
7 years of data), the bounds placed on the speed of adjustment by OLS and FE estimators can be too wide to
provide useful information.
26All reported adjustment speed estimates based on book leverage, with the exception of Flannery and Rangan
(2006). The estimate from Kayhan and Titman (2007) is an annualized rate based on the five-year rate reported
in their paper.
27Flannery and Hankins (2010) compare the performance of various estimators on simulated data sets with
features similar to standard corporate data and conclude that Blundell-Bond and the bias-corrected fixed effects
estimator of Kiviet (1995) perform best.
32 Graham & Leary
lagged book ratio; LRZ employ the system GMM estimator of Blundell and Bond (1998); Huang
and Ritter (2009) argue that the long-difference estimator of Hahn, Hausman and Kuersteiner
(2005) performs better than these alternatives given the persistence of leverage ratios (low speed
of adjustment). More recently, Elsas and Florysiak (2010) propose a doubly-censored dynamic
panel estimator to account for the fractional nature of leverage (i.e. market leverage is bounded
between 0 and 1). Note that all the estimates from techniques designed to address the afore-
mentioned bias fall within the 10% – 40% range provided by OLS and fixed-effects estimates.
However, there remains considerable variation across estimates within that range.
Comparison of SOA Estimates
OLS GMM/IV Fixed Effects Alternatives
Fama and French (2002) 9 - 18%
Kayhan and Titman (2007) 10%
Flannery and Rangan (2007) (mkt lev) 13% 34% 38%
Lemmon, Roberts and Zender (2008) 17% 25% 39%
Huang and Ritter (2009) 17%
Elsas and Florysiak (2010) 26%
Iliev and Welch (2010) <0%
In a recent working paper, Iliev and Welch (2010) argue that the reason for this disparity in
estimates is mis-specification of the dynamic process for leverage assumed by the partial adjust-
ment model. Partly, this is due to the fact (also recognized by Chang and Dasgupta (2009) and
Elsas and Florysiak (2010)) that market leverage ratios are bounded between 0 and 1. These
authors demonstrate that one estimator that is robust to this misspecification suggests an SOA
below 0, implying that leverage is not truly mean-reverting.
4.1.2 Other evidence on leverage targeting Despite a good deal of research, the
rate of mean reversion in leverage ratios remains an open question. Even if this issue could be
resolved, however, it would not resolve the broader question of what economic forces motivate
within-firm leverage changes. As several authors have noted, mean reversion is not sufficient to
show that firms try to maintain a target capital structure. For example, Chang and Dasgupta
A Review of Empirical Capital Structure Research ... 33
(2009) demonstrate that simulated data in which firms choose randomly between debt and equity
to meet their financing deficit produces significant SOA estimates of similar magnitude to those
reported in the literature. This mechanical mean-reversion can result from two sources. One is
the boundedness of leverage mentioned above. Second, as noted by Shyam-Sunder and Myers
(1999), serial correlation in financing deficits and profitability can give the appearance of mean
reversion when firms follow a pecking order of financing choices with no explicit target.
In response, other studies have looked for evidence of leverage targeting outside of the stan-
dard partial adjustment framework. Hovakimian, Opler and Titman (2001) use a discrete choice
model to show that the debt-equity choice in issuing and repurchasing securities is a function of
deviation from target leverage combined with market conditions.28 Similarly, Kayhan and Tit-
man (2007) show in an extended partial-adjustment framework that over longer time horizons (5
- 10 years), cumulative financing deficits, market timing opportunities, and reversion to leverage
targets all play a role in determining leverage changes. Alti (2006) examines the persistence
of market-timing by comparing post-IPO leverage changes in hot and cold issuance periods.
He finds that firms that go public in hot markets issue more equity, leading to lower post-IPO
leverage. However, they subsequently issue more debt and less equity than their cold-market
counterparts, resulting in similar leverage ratios within two years.29
4.2 Dynamic tradeoff models
A growing literature argues that empirical evidence is more consistent with the tradeoff model
than previously recognized. However, these papers argue that traditional models lack a full con-
sideration of capital structure dynamics. While the partial adjustment models discussed above
are dynamic, they implicitly assume that each period’s capital structure choice is driven by a
28Welch (2004) argues that issuance choice alone is insufficient to describe leverage policy, since many issuances
(e.g., those by low leverage firms) have little effect on leverage.
29While this evidence suggests the importance of leverage targets, Chang and Dasgupta (2009) show that the
findings in Kayhan and Titman (2007) and Alti (2006) could also result from mechanical mean-reversion.

34 Graham & Leary
comparison of actual to target leverage. Models that derive the optimal dynamic policy show
that this need not be the case. For example, in costly adjustment models (section 4.2.1), opti-
mal policy is described by initial leverage and recapitalization boundaries, rather than leverage
targets; in endogenous investment models (section 4.2.2), financing decisions depend not only
on the associated tax benefits and distress costs, but also on their effects on future investment
and financing choices. A primary contribution of this literature is to demonstrate that (under
the assumptions of the model) many features of the empirical data can be generated from a (dy-
namic) tradeoff model in which traditional market frictions (e.g. taxes and bankruptcy costs)
play a prominent role.
4.2.1 Costly adjustment models Two types of dynamic tradeoff models have received
the most attention in the empirical literature. The first explore dynamic policy in the presence
of costly restructuring. In Fischer, Heinkel and Zechner (1989) firms trade off the tax benefits
and distress costs of debt as in the static tradeoff model. However, they receive annual shocks
to asset values and recapitalization is costly. This implies there is not an optimal level of
leverage, but an optimal range. Firms are inactive with respect to capital structure as long as
leverage stays within that range and only make adjustments when leverage hits an upper or
lower recapitalization bound. Goldstein, Ju, and Leland (2001) generate similar dynamics in
a model in which costs of retiring debt are infinite, but the firm retains an option to increase
leverage if firm value hits an upper boundary.
Several papers show that costly-adjustment models account for several empirical properties of
leverage often considered inconsistent with the (static) tradeoff model. Strebulaev (2007) shows
that data simulated from a model similar to those described above produce a negative correlation
between leverage and profitability, a large effect of recent stock returns, and slow mean reversion.
Further, the cross-sectional relationships between leverage and firm characteristics can be quite
different when using observations at “refinancing points” (i.e., just after firms recapitalize) versus
using all observations. Kurshev and Strebulaev (2007) show that a similar model can account
A Review of Empirical Capital Structure Research ... 35
for an inverse relation between leverage and firm size. Hackbarth, Miao and Morrellec (2006)
and Bhamra, Kuehn, and Strebulaev (2010) present costly adjustment models that can account
for the dynamic relation between leverage and macroeconomic characteristics.
Other studies find empirical support for costly adjustment models. Leary and Roberts (2005)
use a duration model to capture infrequent adjustment in a dynamic discrete choice framework.
Three key results support the costly adjustment view. First, firms make lumpy capital structure
adjustments, on average once every four quarters, but clustered in time. Second, the conditional
probability of a given adjustment in the next period is a moderately decreasing function of the
time since the last adjustment, consistent with convex adjustment costs (Altinkilic and Hansen
(2010)). Third, an increase (decrease) in leverage relative to target decreases the time until
the next leverage decreasing (increasing) change in net debt. Byoun (2008) and Faulkender et
al. (2009) further support the costly adjustment view by showing that in a partial adjustment
model, the estimated speed of adjustment is a decreasing function of estimated adjustment costs.
4.2.2 Endogenous investment models The second class of dynamic models explains
observed capital structure patterns by endogenizing corporate decisions such as investment.30
Hennessey and Whited (2005) offer a dynamic tradeoff model that generates persistence in
debt levels and a negative correlation between profitability and leverage without requiring large
adjustment costs or infrequent issuance activity. In addition to the tax benefit and bankruptcy
cost of debt, there is a proportional flotation cost of equity issuance (which amplifies the cost of
raising equity) and a personal tax on equity distributions (which decreases the value of equity
payouts). Thus, a key element of financing choice is the sign of current and expected future net
equity issuance. Debt issues are most costly when they increase current equity payout or future
equity issuance. Since firms with high lagged debt or low profitability are more likely to be
raising than distributing equity capital, leverage levels are persistent and negatively correlated
with lagged liquidity. Hennessey and Whited simulate data from their model and demonstrate
30Mauer and Triantis (1994) published an early model of dynamic capital structure with adjustment costs and
endogenous investment.

36 Graham & Leary
that it has these properties. They further use actual data to estimate the structural parameters
of their model via simulated method of moments. They find their model is able to match most
moments of the empirical data well with empirically reasonable equity flotation costs.
Tserlukevich’s (2008) model also generates a negative relation between profitability and lever-
age, mean-reverting leverage ratios, and a dependence of leverage on past stock returns. Here,
refinancing is costless, but there is a fixed cost of exercising irreversible investment opportunities.
Installed capital produces taxable income, but unexercised growth options do not. Given the
investment frictions, debt policy therefore does not immediately respond to changes in the value
of investment opportunities. Tsyplakov (2008) generates a similar prediction by incorporating
a time to build constraint into a dynamic tradeoff model.
More recently, DeAngelo, DeAngelo and Whited (2010) present an endogenous investment
model that generates low leverage targets and matches the slow adjustment speeds discussed
earlier, in the context of a tax-bankruptcy tradeoff. Leverage targets are low because they reflect
not only tax benefits and distress costs, but the option to fund future investments in the face of
limited debt capacity. Firms may temporarily deviate from target (which lowers SOA) by issuing
debt to fund investment opportunities when equity issuance and cash holdings are costly.31
5 CONCLUSIONS AND FUTURE DIRECTIONS
The papers summarized above collectively advance our understanding of corporate capital struc-
ture decisions, though none by itself addresses all the unanswered questions. Below, we identify
challenges facing each of these lines of research, with an eye towards highlighting fruitful areas
for future research.
31See also Titman and Tsyplakov (2007); Sundaresan and Wang (2006); Morellec and Schurhoff (2010); Morellec
and Schurhoff (2010)

A Review of Empirical Capital Structure Research ... 37
5.1 Outstanding Capital Structure Issues
Mismeasurement : Existing studies argue convincingly that careful measurement of key variables
of interest (e.g., marginal tax rates and expected bankruptcy costs) is crucial for detecting the
influence of frictions on capital structure choices. What is less clear, and a remaining challenge
for future research, is how far these adjustments, by themselves, take us in resolving the capital
structure puzzle (of addressing shortcomings in traditional models, including leaving the bulk
of capital structure variation unexplained). Even though these adjustments have improved
the statistical modeling of capital structure, each is only a partial fix and still leaves much
capital structure variation unexplained. Though it would be a daunting task, no paper attempts
to combine these corrections in one unified analysis. Even if all the adjustments were made
simultaneously, it is unclear whether the end result would explain substantial capital structure
variation. Finally, as is clear from examining Table 1, the common variables used to measure
capital structure appear to have nonlinear relations with the dependent variables, and yet few
empirical tests explicitly account for these nonlinearities.
Labor contracting : The existing evidence shows that there are indeed interactions between
contracting with investors and contracting with non-financial stakeholders. A remaining question
is whether this effect is concentrated in certain industries (e.g., with high unionization) or is an
important consideration that can be generalized across a broad sample. Graham and Harvey
(2001) do not find broad acknowledgment of labor effects among surveyed CFOs, though this
may be a difficult issue to investigate via a survey. And, to the extent that it is a bigger
consideration in some industries than others, can labor account for variation within industries
or only across industries? In sum, are labor effects first order capital structure drivers?
Supply side: The literature has established that supply factors are a relevant (and previously
underemphasized) determinant of individual firm financing choices and cross-sectional leverage
differences. The questions that remain are more challenging. For example, to what extent
do these effects operate through quantity restrictions versus price mechanisms? Under what

38 Graham & Leary
conditions and in which segments do capital supply shocks have the largest impact on capital
structures? To what extent do innovations that reduce market frictions mitigate the role of
supply factors?32 Finally, negative post-issuance returns suggest an unexplored challenge for
the equity supply literature: negative long-run returns suggest that companies did not issue
enough equity in the “window of opportunity” because equity value was apparently still high
immediately after the SEO. What forces restrict equity issuance to be below the level that
maximizes (current) shareholder value?
Financial contracting : The financial contracting view provides new insights beyond those
offered by traditional models that take existing securities as given. This literature is helpful in
understanding why observed financial contracts are structured as they are, and perhaps provides
guidance for improving contract structures. What is less well understood is the extent to which
these insights help account for the unexplained variation in leverage ratios, and also whether
they are the first-order issues that would concern a financial manager. For example, while the
issues and interpretations from the incomplete contracts literature differ somewhat from the
traditional models, this is not to say that the traditional issues are any less important than the
new contracting issues.
One helpful contracting insight is the link between asset liquidation values and debt capacity,
which by now is empirically well established. Among the open questions are the degree to
which contract features such as covenants and renegotiation affect debt-equity choices. For
example, Roberts and Sufi (2009b) show that covenant violations trigger control rights changes
and thereby influence financing choices ex-post. It would be interesting to know whether the
fear of losing control rights, or limits on renegotiation, drive firms to non-debt financing ex-ante.
Finally, to date there has been little empirical testing of the dynamic contracting models (e.g.,
DeMarzo and Fishman (2007)).
SOA and leverage targeting : The question of whether firms behave as if managing leverage
32See Loutskina and Strahan (2009) for interesting evidence with respect to securitization in the mortgage
industry.

A Review of Empirical Capital Structure Research ... 39
to a target is an important and still open question. However, in our view, more work refining
estimates of partial adjustment parameters may not be the most fruitful path to answering
this question. First, as mentioned, several authors have questioned the power of these models
to distinguish leverage targeting from alternative policies. Second, there is not a clear null
hypothesis. In other words, while adjustment speeds near 0 or 1 may be informative, it’s not clear
whether knowing the true SOA is 15%, 25% or 35% significantly enhances our understanding
of the motives behind financing decisions. Rather, new methods outside the partial adjustment
framework may be necessary to identify the circumstances under which firms make deliberate,
value-relevant financing decisions and when they fail to do so.
Dynamic Tradeoff Models: While these models have successfully shown that simple tax-
bankruptcy frictions could generate data consistent with what is observed, they have not yet
shown that these frictions are in fact first-order drivers of financial policies. For example, sev-
eral models generate a persistent negative relation between past equity returns and leverage,
suggesting the existence of this pattern in the data is not sufficient to reject the tradeoff model.
This is a useful insight. However, two caveats are in order. First, as noted by Welch (2011b), the
quantitative calibrations are conditional on the assumption that all capital structure variation
is attributable to the select forces (and functional forms) included in the model. Second, the
ability of simulations from a structural model to match sample moments does not by itself reject
alternative explanations, such as the market timing view of Baker and Wurgler (2002). More
work is warranted in comparing the model fit or predictive ability of dynamic structural models
against plausible alternatives. In addition, structural models typically are calibrated to explain
the average firm, and it is often not clear the extent to which they help explain cross-sectional
heterogeneity, which, as we saw in Table 2, is a primary source of capital structure variation.
Value-relevance of capital structure choices: The implication that, for many firms, the value
function is flat for +/- 25% or more deviation from optimal is intriguing because it implies that
for many firms capital structure choices are not first-order important. This may explain why

40 Graham & Leary
it is difficult to document statistically significant results in the broad panel. It also raises the
possibility that empirical tests should focus on the subset of firms for which capital structure is
most value-relevant. It is also important to consider why estimated value functions may appear
flat for many firms. Is it that capital structure truly does not matter for these firms, or could it
possibly be that the value functions are estimated over a wide range of firms, perhaps averaging
away offsetting effects across firms? Is the flatness of the value function related to the range of
inaction predicted by costly adjustment models? Finally, we note that value functions have not
been estimated conditional on governance or contracting characteristics.
5.2 Summary and Overarching questions
We started by noting that extant research has explained only a portion of observed capital
structure behavior. We reviewed recent progress into understanding whether the struggle to
explain capital structure is driven by researchers having investigated the wrong models and
issues, because key variables are mismeasured, because the managerial decision process is mis-
specified, or because managers are locally indifferent. Many individual “fixes” have recently
been made (e.g., well measured proxies, supply factors, stakeholder effects, etc.) but it is still
not clear what it all adds up to.
We conclude with some questions that cut across the categories summarized above:
1. We know that firm fixed effects capture a large part of the unexplained capital structure
variation. More work is needed to identify which firm-specific, and largely time-invariant,
characteristics are missing from our models.
2. Leary and Roberts (2010) suggest that we can now explain issuance decisions fairly well
but to date, much variation in leverage ratios remains unexplained. Are large, deliberate
changes in capital structure easier to explain than changes or levels on the broad sample
of observations?33
33In a recent study, DeAngelo and Roll (2011) find that large leverage changes coincide with changes in invest-

A Review of Empirical Capital Structure Research ... 41
3. While directional effects of various market frictions have been documented, less is known
about which of these frictions is most important for capital structure decisions.
4. Which samples are most appropriate for testing capital structure theories? The most
relevant market frictions are likely to vary across different subsamples. For example, costly-
adjustment models are likely to be most empirically relevant for small, opaque firms, while
the pecking order applies more to mature, high assets-in-place firms. Thus, we may gain
more clarity on the drivers of financing decisions by focusing on appropriate subsets of
firms.
5. How are leverage and debt structure decisions related? Supply-side and financial con-
tracting views suggest debt structure and leverage are tightly linked. Perhaps we should
consider these as joint, rather than sequential, decisions. Billet, King and Mauer (2007),
for example, make progress in this dimension, though finding reliable instruments remains
a challenge. More broadly, capital structure decisions are likely made jointly with other
corporate policies such as payout and governance, an issue that warrants more research
attention.34
6. The variety of capital structure issues that have recently been investigated is impressive.
Going forward, how can researchers decide which issues to investigate next, or which results
are more important? One consideration might be which issues are most value relevant. For
example, is it more important to understand a firm’s ratio of total debt to value or whether
the debt is composed of short-term debt, long-term debt, or a debt substitute? While
difficult to determine, the value-relevance of these issues might help guide the profession
going forward.
Though in this review we have focused on research published in the last six years, we expect
that the questions raised herein will be relevant for many years to come.
ment policy.
34See, for example, Smith and Watts (1992).
42 Graham & Leary
Literature Cited
Agrawal A, Matsa D. 2010. Labor Unemployment Risk and Corporate Financing Decisions.
Work. Pap., Northwestern Univ.
Almeida H, Philippon T. 2007. The Risk-Adjusted Cost of Financial Distress. J. Finance 62:
2557-2586
Almeida H, Campello M, Laranjeira B, Weisbenner S. 2009. Corporate Debt Maturity and the
Real Effects of the 2007 Credit Crisis. Work. Pap., Univ. Illinois
Alti A. 2006. How Persistent Is the Impact of Market Timing on Capital Structure?. J. Finance
61: 1681-1710
Altinkilic O, Hansen R. 2000. Are there economies of scale in underwriter fees? Evidence of
rising external financing costs. Rev. Financ. Stud. 13: 191-218
Auerbach A. 1985. Real Determinants of Corporate Leverage. In Corporate capital structures in
the United States, University of Chicago Press
Baker M. 2009. Capital Market-Driven Corporate Finance. Ann. Rev. of Fin. Econ. 1: 181-205
Baker M, Wurgler J. 2002. Market timing and capital structure. J. Finance 57: 1-30
Baker M, Stein J, Wurgler J. 2003. When does the market matter? Q. J. Econ. 118: 969-1005
Banerjee S, Dasgupta S, Kim Y. 2008. Buyer-Supplier Relationships and the Stakeholder Theory
of Capital Structure. J. Finance 63: 2507-2552
Barclay M, Smith C. 1995. The Maturity Structure of Corporate Debt. J. Finance 50: 609-631
Bayless M, Chaplinsky S. 1996. Are there windows of opportunity for seasoned equity issuances?
J. Finance 51: 253-278
Benmelech E. 2009. Asset Salability and Debt Maturity: Evidence from Nineteenth-Century
American Railroads. Rev. Financ. Stud. 22: 1545-1584
Benmelech E, Bergman N. 2008. Liquidation Values and the Credibility of Financial Contract
Renegotiation: Evidence from U.S. Airlines. Q. J. Econ. 123: 1635-1677
Benmelech E, Bergman N. 2011. Bankruptcy and the Collateral Channel. J. Finance Forthcom-
A Review of Empirical Capital Structure Research ... 43
ing
Benmelech E, Bergman N, Enriquez R. 2010. Negotiating with Labor Under Financial Distress.
Work. Pap., Harvard Univ.
Benmelech E, Garmaise M, Moskowitz T. 2005. Do Liquidation Values Affect Financial Con-
tracts? Evidence from Commercial Loan Contracts and Zoning Regulation. Q. J. Econ. 120:
1121-1154
Berk J, Stanton R, Zechner J. 2010. Human Capital, Bankruptcy and Capital Structure. J.
Finance 65: 891-926
Bertrand M, Schoar A. 2003. Managing with Style: The Effect of Managers on Firm Policies.
Q. J. Econ. 118: 1169-1208
Bhamra S, Kuehn L, Strebulaev I. 2010. The Aggregate Dynamics of Capital Structure and
Macroeconomic Risk. Rev. Financ. Studies 23: 4187-4241
Billett M, King T, Mauer D. 2007. Growth Opportunities and the Choice of Leverage, Debt
Maturity, and Covenants. J. Finance 62: 697-730
van Binsbergen J, Graham J, Yang J. 2010. The Cost of Debt. J. Finance 65: 2089-2136
Blundell R, Bond S. 1998. Initial conditions and moment restrictions in dynamic panel data
models. J. Econometrics 87: 115 - 143
Bradley M, G. A. Jarrell E. H. Kim, 1984. On the existence of an optimal capital structure:
Theory and evidence. J. Finance 39: 857-878
Brander J, Lewis T. 1986. Oligopoly and Financial Structure: The Limited Liability Effect.
Amer. Econ. Rev. 76: 956-970
Brockman P, Martin X, Unlu E. 2010. Executive Compensation and the Maturity Structure of
Corporate Debt. J. Finance 65: 1123-1161
Byoun S. 2008. How and When Do Firms Adjust Their Capital Structures toward Targets? J.
Finance 63: 3069-3096
Campello M, Giambona E. 2010. Capital Structure and the Redeployability of Tangible Assets.
44 Graham & Leary
Work. Pap., Univ. Illinois
Campello M, Giambona E, Graham J, Harvey C. 2010. Liquidity Management and Corporate
Investment During a Financial Crisis. Rev. Financ. Stud. Forthcoming
Campello M, Graham J. 2010. Do Stock Prices Influence Corporate Decisions? Evidence from
the Technology Bubble. Work. Pap., Duke Univ.
Campello M, Graham J, Harvey C. 2010. The real effects of financial constraints: Evidence from
a financial crisis. J. Financ. Econ. 97: 470-487
Chang X, Dasgupta S. 2009. Target Behavior and Financing: How Conclusive Is the Evidence?.
J. Finance 64: 1767 - 1796
Chang X, Dasgupta S, Hilary G. 2006. Analyst Coverage and Financing Decisions. J. Finance
61: 3009-3048
Chava S, Roberts M. 2008. How does financing impact investment? The role of debt covenants.
J. Finance 63: 2085-2121
Chevalier J, 1995. Capital Structure and Product-Market Competition: Empirical Evidence from
the Supermarket Industry. Amer. Econ. Rev. 85: 415435
Chirinko R, Singha A. 2000. Testing static tradeoff against pecking order models of capital
structure: a critical comment. J. Financ. Econ. 58: 417-425
Choi D, Getmansky M, Henderson B, Tookes H. 2010. Convertible Bond Arbitrageurs as Sup-
pliers of Capital. Rev. Financ. Studies Forthcoming
Colla P, Ippolito F, Li K. 2010 Debt Specialization, Work. Pap., Univ. of British Columbia
Cornaggia K, Franzen L, Simin T. 2009. Capital Structure and the Changing Role of Off-Balance-
Sheet Lease Financing. Work. Pap., Amer. Univ.
Cronqvist H, Makhija A, Yonker S. 2010. Behavioral Consistency in Corporate Finance: CEO
Personal and Corporate Leverage. Work. Pap., Ohio St. Univ.
DeAngelo H, Masulis R. 1980. Optimal capital structure under corporate and personal taxation.
J. Financ. Econ. 8: 3-29
A Review of Empirical Capital Structure Research ... 45
DeAngelo H, DeAngelo L, Whited T. 2010. Capital structure dynamics and transitory debt. J.
Finance forthcoming
DeAngelo H, Roll R. 2011. How stable are corporate capital structures? Work. Pap., Univ.
Southern California.
DeMarzo P, Fishman M. 2007. Optimal long-term financial contracting. Rev. Financ. Stud. 20:
2079-2128
DeMarzo P, Sannikov Y. 2006. Optimal Security Design and Dynamic Capital Structure in a
Continuous-Time Agency Model. J. Finance 61: 2681-2724
Eckbo BE, Masulis RW, Norli O. 2007. Security Offerings, In The Handbook of Corporate
Finance: Empirical Corporate Finance, ed. BE Eckbo, Volume 1, Chapter 6. Amsterdam:
Elsevier/North-Holland
Eisfeldt A, Rampini A. 2009. Leasing, Ability to Repossess, and Debt Capacity. Rev. Financ.
Stud. 22: 1621-1657
Elkamhi R, Parson C, Ericsson J. 2010. The Cost of Financial Distress and the Timing of
Default. Work. Pap., U. Iowa
Elsas R, Florysiak D. 2010. Dynamic Capital Structure Adjustment and the Impact of Fractional
Dependent Variables. Work. Pap., University of Munich.
Fama E, French K. 2002. Testing trade-off and pecking order predictions about dividends and
debt. Rev. Financ. Stud. 15: 1-33
Fama E, French K. 2005. Financing decisions: who issues stock? J. Financ. Econ. 76: 549-582
Faulkender M, Petersen M. 2007. Does the source of capital affect capital structure? Rev. Financ.
Stud. 19: 45-79
Faulkender M, Flannery M, Hankins K, Smith J. 2009. Are Adjustment Costs Impeding Realiza-
tion of Target Capital Structure? Work. Pap., U. Florida
Fee C, Hadlock C, Pierce J. 2010. Managers Who Lack Style: Evidence from Exogenous CEO
Changes. Work. Pap., Mich. St. Univ.
46 Graham & Leary
Fischer E, Heinkel R, Zechner J. 1989. Dynamic Capital Structure Choice: Theory and Tests.
J. Finance 44: 19-40
Flannery M, Hankins K. 2010. Estimating Dynamic Panel Models in Corporate Finance. Work.
Pap., Univ. Florida
Flannery M, Rangan K. 2006. Partial adjustment toward target capital structures. J. Financ.
Econ. 79: 469-506
Frank M, Goyal V. 2003. Testing the pecking order theory of capital structure. J. Financ. Econ.
67: 217-248
Frank M, Goyal V. 2008. Tradeoff and pecking order theories of debt. In The Handbook of Cor-
porate Finance: Empirical Corporate Finance, ed. BE Eckbo, Vol. 2, Chapter 12. Amsterdam:
Elsevier/North-Holland
Frank M, Goyal V. 2009. Capital Structure Decisions: Which Factors Are Reliably Important?
Fin. Management 38: 137
Gan J. 2007. Collateral, debt capacity, and corporate investment: Evidence from a natural
experiment. J. Fin. Econ. 85: 709-734
Gavazza A. 2010. Asset liquidity and financial contracts: Evidence from aircraft leases. J. Fin.
Econ. 95: 62-84
Goldstein R, Ju N, Leland H. 2001. An EBIT-Based Model of Dynamic Capital Structure. J.
Business 74: 483-512
Graham J. 1996. Debt and the marginal tax rate. J. Fin. Econ. 41: 41-73
Graham J. 1996. Proxies for the marginal tax rate. J. Fin. Econ. 42: 187-221
Graham J. 2000. How big are the tax benefits of debt? J. Finance 55: 1901-1941.
Graham J, Harvey C. 2001. The theory and practice of corporate finance: evidence from the
field. J. Financ. Econ. 60: 187-243.
Graham J, Harvey C, Puri M. 2010. Capital Allocation and Delegation of Decision-Making
Authority Within Firms. Work. Pap., Duke Univ.
A Review of Empirical Capital Structure Research ... 47
Graham J, Lang M, Shackelford D. 2005. Employee Stock Options, Corporate Taxes and Debt
Policy. J. Finance 59: 1585-1618
Graham J, Lemmon M, Schallheim J. 1998. Debt, Leases, Taxes, and the Endogeneity of Cor-
porate Tax Status. J. Finance 53: 131-162
Graham J, Narasimhan K. 2004. Corporate survival and managerial experiences during the Great
Depression. Work. Pap., Duke Univ.
Graham J, Tucker A. 2006. Tax Shelters and Corporate Debt Policy. J. Financ. Econ. 81: 563
- 594
Hackbarth D, Miao J, Morellec E. 2006. Capital structure, credit risk, and macroeconomic
conditions. J. Financ. Econ. 82: 519-550
Hahn J, Hausman J, Kuersteiner G. 2007. Long Difference Instrumental Variables Estimation
for Dynamic Panel Models with Fixed Effects. J. Econometrics 140: 574-617
Harris M, Raviv A. 1991. The Theory of Capital Structure. J. Finance 46:297-355
Heaton J. 2002. Managerial Optimism and Corporate Finance. Fin. Management 31: 33-45
Helwege J, Liang N. 1996. Is there a pecking order? Evidence from a panel of IPO firms. J.
Financ. Econ. 40: 429-458.
Hennessy C, Livdan D. 2009. Debt, bargaining, and credibility in firmsupplier relationships. J.
Financ. Econ. 93: 382-399
Hennessy C, Whited T. 2005. Debt dynamics. J. Finance 60: 1129-1165
Hovakimian A, T. Opler, S. Titman, 2001. The debt-equity choice. J. Fin. and Quant. Analysis
36: 1-24
Hsiao C. 2003. Analysis of Panel Data. Cambridge University Press
Huang R, Ritter J. 2009. Testing Theories of Capital Structure and Estimating the Speed of
Adjustment. J. Financ. Quant. Analysis 44: 237 - 271
Huizinga H, Laeven L, Nicodeme G. 2008. Capital Structure and International Debt Shifting. J.
Financ. Econ. 88: 80-118
48 Graham & Leary
Iliev P, Welch I. 2010. Reconciling Estimates of the Speed of Adjustment of Leverage Ratios.
Work. Pap., Brown Univ.
Jalilvand A, Harris R. 1984. Corporate behavior in adjusting to capital structure and dividend
targets: An econometric study. J. Finance 39: 127-145
Jensen M, Meckling W. 1976. Theory of the firm: managerial behavior, agency costs and own-
ership structure. J. Financ. Econ. 3: 305-360.
Kale J, Shahrur H. 2007. Corporate Capital Structure and the characteristics of suppliers and
customers. J. Financ. Econ. 83: 321-365
Kayhana A, Titman S. 2007. Firms’ histories and their capital structures. J. Financ. Econ. 83:
1-32
Kisgen D. 2006. Credit Ratings and Capital Structure. J. Finance 61: 1035-1072
Kisgen D. 2009. Do Firms Target Credit Ratings or Leverage Levels? J. Financ. Quant. Analysis
44: 1323-1344
Kisgen D, Strahan P. 2009. Do Regulations Based on Credit Ratings Affect a Firm’s Cost of
Capital? Work. Pap., Boston College
Kiviet J. 1995. On bias, inconsistency, and efficiency of various estimators in dynamic panel data
models. J. Econometrics 68: 53-78
Korgaonkar S, Nini G. 2010. Special Purpose Vehicles and Nonfinancial Corporate Finance.
Work. Pap., Univ. Pennsylvania
Korteweg A. 2009. The Net Benefits to Leverage. J. Finance Forthcoming
Kovenock D, Phillips G. 1995. Capital Structure and Product-Market Rivalry: How Do We
Reconcile Theory and Evidence?. Am. Econ. Rev. 85: 403-408
Kovenock D, Phillips G. 1997. Capital structure and product market behavior: an examination
of plant exit and investment decisions. Rev. Financ. Stud. 10: 767-803
Kurshev A, Strebulaev I. 2007 Firm Size and Capital Structure. Work. Pap., Stanford Univ.
Lamont O, Stein J. 2006. Investor Sentiment and Corporate Finance: Micro and Macro. Am.
A Review of Empirical Capital Structure Research ... 49
Econ. Rev. 96: 147-151
Leary M. 2009. Bank Loan Supply, Lender Choice, and Corporate Capital Structure. J. Finance
64: 1143-1185
Leary M, Roberts M. 2005. Do firms rebalance their capital structures? J. Finance 60: 2575-
2619.
Leary M, Roberts M. 2010. The pecking order, debt capacity, and information asymmetry. J.
Financ. Econ. 95: 332-355
Leary M, Roberts M. 2011 Do peer firms affect corporate financial policy?, Work. Pap., Univ.
Pennsylvania and Washington Univ. in St. Louis.
Lee I, Lochhead S, Ritter J, Zhao Q. 1996. The costs of raising capital. J. Financ. Research 19:
59-74
Leland H, Toft K. 1996. Optimal capital structure, endogenous bankruptcy, and the term struc-
ture of credit spreads. J. Finance 51: 987-1019
Lemmon M, Roberts M. 2010. The Response of Corporate Financing and Investment to Changes
in the Supply of Credit. J. Financ. Quant. Analysis 45: 555-587
Lemmon M, Roberts M, Zender J. 2008. Back to the Beginning: Persistence and the Cross-
Section of Corporate Capital Structures. J. Finance 63: 1575-1608
Lewellen K. 2006. Financing decisions when managers are risk averse. J. Financ. Econ. 82:
551-589
Loughran T, Ritter J. 1995. The New Issues Puzzle. J. Finance 50: 23-51
Loughran T, Ritter J. 1997. The Operating Performance of Firms Conducting Seasoned Equity
Offerings. J. Finance 52: 1823-1850
Loughran T, Ritter J. 2004. Why Has IPO Underpricing Changed over Time?. Financ. Man-
agement 33: 5-37
Loughran T, Ritter J, Rydqvist K. 1994. Initial public offerings: International insights. Pacific-
Basin Fin. J. 2: 165-199
50 Graham & Leary
Loutskina E, Strahan P. 2009. Securitization and the Declining Impact of Bank Finance on Loan
Supply: Evidence from Mortgage Originations. J. Finance 64: 861-889
MacKay P, Phillips G. 2005. How Does Industry Affect Firm Financial Structure? Rev. Financ.
Stud., 18: 1433-1466
Mackie-Mason J. 1990. Do taxes affect corporate financing decisions? J. Finance 44: 1471-1493
Marsh P. 1982. The choice between equity and debt: an empirical study. J. Finance 37, 121-144.
Matsa D. 2010. Capital Structure as a Strategic Variable: Evidence from Collective Bargaining.
J. Finance 65: 1197-1232
Mauer D, Triantis A. 1994. Interactions of Corporate Financing and Investment Decisions: A
Dynamic Framework. J. Finance 49: 1253-1277
Miller M. 1977. Debt and Taxes. J. Finance 32: 261-275
Modigliani F, Miller M. 1958. The Cost of Capital, Corporation Finance and the Theory of
Investment. Am. Econ. Rev. 48: 261-297
Molina C. 2005. Are Firms Underleveraged? An Examination of the Effect of Leverage on
Default Probabilities. J. Finance 60: 1427-1459
Morellec E, Schrhoff N. 2010. Dynamic Investment and Financing under Personal Taxation. Rev.
Financ. Stud. 23: 101-146
Morellec E, Schrhoff N. 2010. Corporate investment and financing under asymmetric information.
J. Financ. Econ. Forthcoming
Myers S. 1977. Determinants of corporate borrowing. J. Financ. Econ. 5: 147-175
Myers S. 1984. The capital structure puzzle. J. Finance 39: 575-592.
Myers S. 1993. Still Searching for Optimal Capital Structure. J. Applied Corp. Finance 6: 4-14
Myers S. 2001. Capital structure. J. Econ. Perspectives, 15: 81-102
Myers S. 2003. Financing of corporations. In Handbook of the Economics of Finance, ed. G
Constantinides, M Harris, Amsterdam: Elsevier, pp. 215-254
Myers S, Dill D, Bautista A. 1976. Valuation of Financial Lease Contracts. J. Finance 31: 799-
A Review of Empirical Capital Structure Research ... 51
819
Myers S, Majluf N. 1984. Corporate financing and investment decisions when firms have infor-
mation that investors do not have. J. Financ. Econ. 13: 187-221.
Nini G, Smith D, Sufi A. 2009. Creditor control rights and firm investment policy. J. Financ.
Econ. 92: 400-420
Park C. 2000. Monitoring and Structure of Debt Contracts. J. Finance 55: 2157-2195
Parsons C, Titman S. 2008 Capital Structure and Corporate Strategy. In The Handbook of Cor-
porate Finance: Empirical Corporate Finance, ed. BE Eckbo, Vol. 2, Chapter 13. Amsterdam:
Elsevier/North-Holland
Parsons C, Titman S. 2009. Empirical Capital Structure: A Review. Foundations and Trends in
Finance 3(1): 1-93
Rajan R, Zingales L. 1995. What do we know about capital structure: Some evidence from
international data. J. Finance 50: 1421-1460
Rampini A, Viswanathan S. 2010. Collateral, risk management, and the distribution of debt
capacity. J. Finance 65: 2293-2322
Rampini A, Viswanathan V. 2010 Collateral and Capital Structure. Work. Pap., Duke Univ.
Rauh J, Sufi A. 2010a. Product Markets, Leases, and Asset Similarity. Work. Pap., University
of Chicago
Rauh J, Sufi A. 2010b. Capital Structure and Debt Structure. Rev. Financ. Stud. 23: 4242-4280
Rice T, Strahan P. 2010. Does Credit Competition Affect Small-Firm Finance? J. Finance 65:
861-889
Roberts M, Sufi A. 2009a. Control Rights and Capital Structure: An Empirical Investigation.
J. Finance 64: 1657-1695
Roberts M, Sufi A. 2009b. Renegotiation of financial contracts: Evidence from private credit
agreements. J. Financ. Econ. 93: 159-184
Ross Stephen A. 1977. The determination of financial structure: the incentive-signaling ap-
52 Graham & Leary
proach. Bell J. Economics 8: 23-40
Shivdasani A, Stefanescu I. 2010. How do Pensions Affect Corporate Capital Structure Decisions?
Rev. Financ. Stud. Forthcoming
Shyam-Sunder L, Myers S. 1999. Testing static tradeoff against pecking order models of capital
structure. J. Financ. Econ. 51: 219-244
Smith C. 1986. Investment banking and the capital acquisition process. J. Financ. Econ. 15:
3-29
Smith C, Warner J. 1979. On financial contracting: An analysis of bond contracts. J. Financ.
Econ. 7: 117-161
Stiglitz J. 1973. Taxation, corporate financial policy and the cost of capital. J. Public Econ. 2:
1-34
Strebulaev I. 2007. Do tests of capital structure theory mean what they say? J. Finance 62:
1747-1787
Strebulaev I, Yang B. 2007. The mystery of zero-leveraged firms, Work. Pap., Stanford Univ.
Sufi A. 2009a. The Real Effects of Debt Certification: Evidence from the Introduction of Bank
Loan Ratings. Rev. Financ. Stud. 22: 1659-1691
Sufi A. 2009b. Bank Lines of Credit in Corporate Finance: An Empirical Analysis. Rev. Financ.
Stud. 22: 1057-1088
Sundaresan S, Wang N. 2006. Dynamic Investment, Capital Structure, and Debt Overhang.
Work. Pap., Columbia Univ.
Taggart RA. 1977. A model of corporate financing decisions. J. Finance 32: 1467-1484
Taillard J., 2008. Thriving in the midst of financial distress? An analysis of firms exposed to
asbestos litigation, Work. Pap., Boston College.
Tang T. 2009. Information asymmetry and firms’ credit market access: Evidence from Moody’s
credit rating format refinement. J. Financ. Econ. 93: 325-351
Titman S, Tsyplakov S. 2007. A Dynamic Model of Optimal Capital Structure. Rev. Finance
A Review of Empirical Capital Structure Research ... 53
11: 401-451
Titman S, Wessels R. 1988. The determinants of capital structure. J. Finance 43: 1-19
Tserlukevich Y. 2008. Can real options explain financing behavior? J. Financ. Econ. 89: 232-252
Tsyplakov S. 2008. Investment frictions and leverage dynamics J. Financ. Econ. 89: 423-443
Malmendier U, Tate G, Yan J. 2010. Managerial Beliefs and Corporate Financial Policies. Work.
Pap., Univ. Cal. Berkeley
Welch I. 2004. Capital structure and stock returns, J. Polit. Econ. 112: 106-131
Welch I. 2011a. Two Common Problems in Capital Structure Research: The Financial-Debt-To-
Asset Ratio and Issuing Activity Versus Leverage Changes. Int. Rev. Fin. 11: 1-17
Welch I. 2011b. A Critique of Recent Quantitative and Deep-Structure Modeling in Capital Struc-
ture Research and Beyond. Work. Pap., Brown Univ.
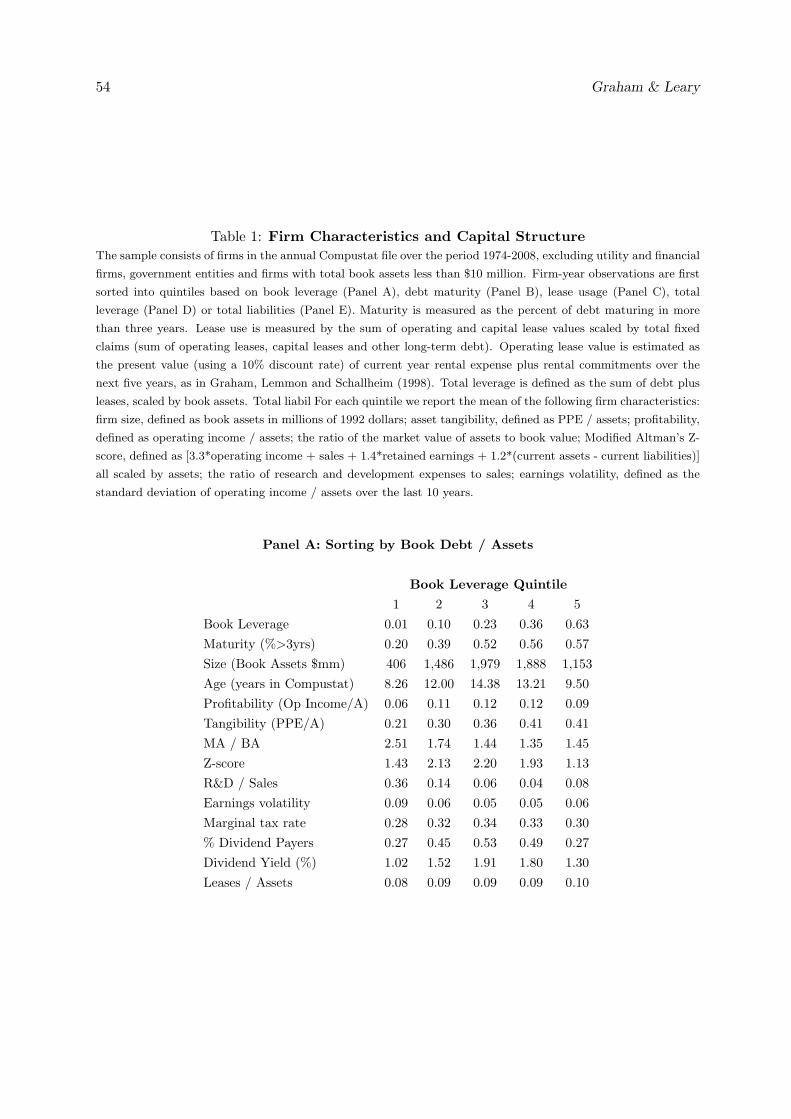
54 Graham & Leary
Table 1: Firm Characteristics and Capital Structure
The sample consists of firms in the annual Compustat file over the period 1974-2008, excluding utility and financial
firms, government entities and firms with total book assets less than $10 million. Firm-year observations are first
sorted into quintiles based on book leverage (Panel A), debt maturity (Panel B), lease usage (Panel C), total
leverage (Panel D) or total liabilities (Panel E). Maturity is measured as the percent of debt maturing in more
than three years. Lease use is measured by the sum of operating and capital lease values scaled by total fixed
claims (sum of operating leases, capital leases and other long-term debt). Operating lease value is estimated as
the present value (using a 10% discount rate) of current year rental expense plus rental commitments over the
next five years, as in Graham, Lemmon and Schallheim (1998). Total leverage is defined as the sum of debt plus
leases, scaled by book assets. Total liabil For each quintile we report the mean of the following firm characteristics:
firm size, defined as book assets in millions of 1992 dollars; asset tangibility, defined as PPE / assets; profitability,
defined as operating income / assets; the ratio of the market value of assets to book value; Modified Altman’s Z-
score, defined as [3.3*operating income + sales + 1.4*retained earnings + 1.2*(current assets - current liabilities)]
all scaled by assets; the ratio of research and development expenses to sales; earnings volatility, defined as the
standard deviation of operating income / assets over the last 10 years.
Panel A: Sorting by Book Debt / Assets
Book Leverage Quintile
1 2 3 4 5
Book Leverage 0.01 0.10 0.23 0.36 0.63
Maturity (%>3yrs) 0.20 0.39 0.52 0.56 0.57
Size (Book Assets $mm) 406 1,486 1,979 1,888 1,153
Age (years in Compustat) 8.26 12.00 14.38 13.21 9.50
Profitability (Op Income/A) 0.06 0.11 0.12 0.12 0.09
Tangibility (PPE/A) 0.21 0.30 0.36 0.41 0.41
MA / BA 2.51 1.74 1.44 1.35 1.45
Z-score 1.43 2.13 2.20 1.93 1.13
R&D / Sales 0.36 0.14 0.06 0.04 0.08
Earnings volatility 0.09 0.06 0.05 0.05 0.06
Marginal tax rate 0.28 0.32 0.34 0.33 0.30
% Dividend Payers 0.27 0.45 0.53 0.49 0.27
Dividend Yield (%) 1.02 1.52 1.91 1.80 1.30
Leases / Assets 0.08 0.09 0.09 0.09 0.10
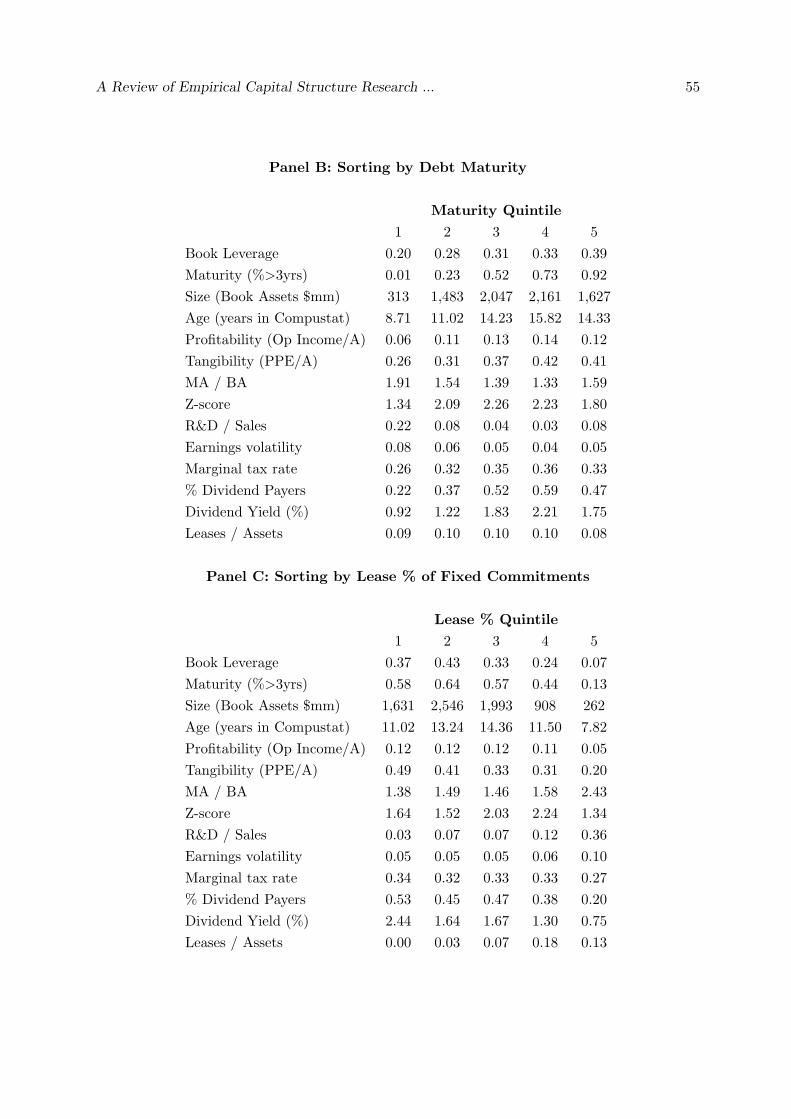
A Review of Empirical Capital Structure Research ... 55
Panel B: Sorting by Debt Maturity
Maturity Quintile
1 2 3 4 5
Book Leverage 0.20 0.28 0.31 0.33 0.39
Maturity (%>3yrs) 0.01 0.23 0.52 0.73 0.92
Size (Book Assets $mm) 313 1,483 2,047 2,161 1,627
Age (years in Compustat) 8.71 11.02 14.23 15.82 14.33
Profitability (Op Income/A) 0.06 0.11 0.13 0.14 0.12
Tangibility (PPE/A) 0.26 0.31 0.37 0.42 0.41
MA / BA 1.91 1.54 1.39 1.33 1.59
Z-score 1.34 2.09 2.26 2.23 1.80
R&D / Sales 0.22 0.08 0.04 0.03 0.08
Earnings volatility 0.08 0.06 0.05 0.04 0.05
Marginal tax rate 0.26 0.32 0.35 0.36 0.33
% Dividend Payers 0.22 0.37 0.52 0.59 0.47
Dividend Yield (%) 0.92 1.22 1.83 2.21 1.75
Leases / Assets 0.09 0.10 0.10 0.10 0.08
Panel C: Sorting by Lease % of Fixed Commitments
Lease % Quintile
1 2 3 4 5
Book Leverage 0.37 0.43 0.33 0.24 0.07
Maturity (%>3yrs) 0.58 0.64 0.57 0.44 0.13
Size (Book Assets $mm) 1,631 2,546 1,993 908 262
Age (years in Compustat) 11.02 13.24 14.36 11.50 7.82
Profitability (Op Income/A) 0.12 0.12 0.12 0.11 0.05
Tangibility (PPE/A) 0.49 0.41 0.33 0.31 0.20
MA / BA 1.38 1.49 1.46 1.58 2.43
Z-score 1.64 1.52 2.03 2.24 1.34
R&D / Sales 0.03 0.07 0.07 0.12 0.36
Earnings volatility 0.05 0.05 0.05 0.06 0.10
Marginal tax rate 0.34 0.32 0.33 0.33 0.27
% Dividend Payers 0.53 0.45 0.47 0.38 0.20
Dividend Yield (%) 2.44 1.64 1.67 1.30 0.75
Leases / Assets 0.00 0.03 0.07 0.18 0.13
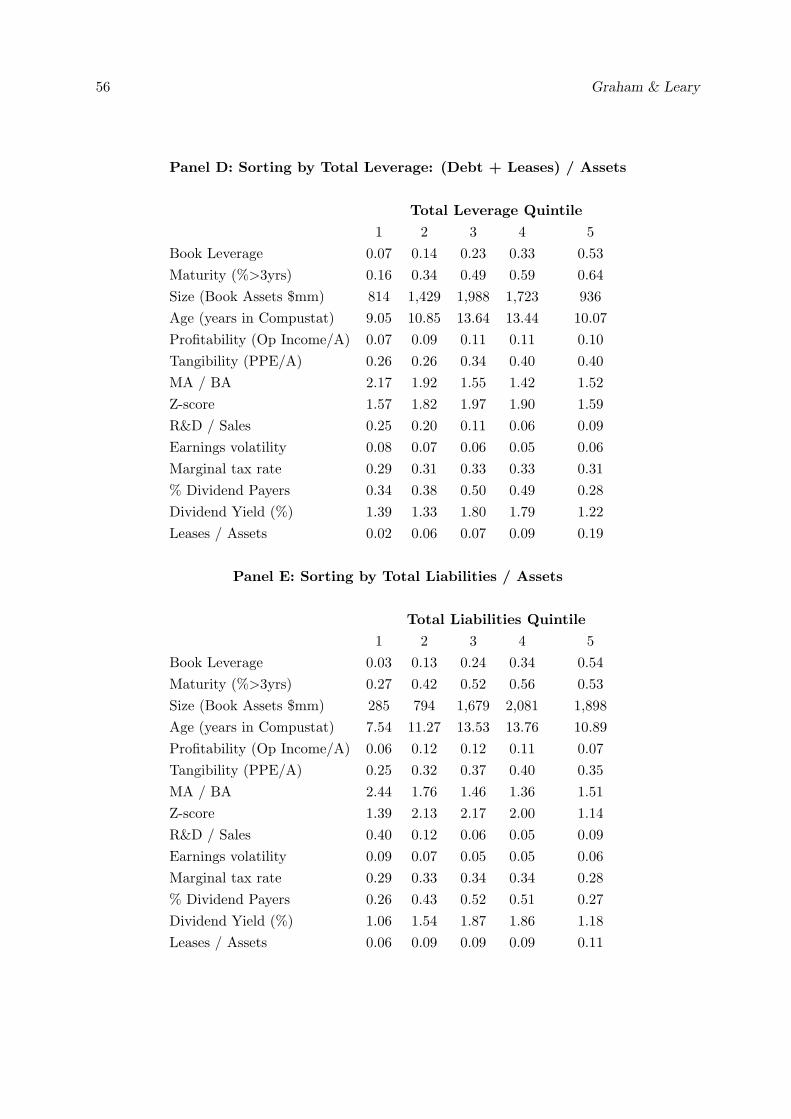
56 Graham & Leary
Panel D: Sorting by Total Leverage: (Debt + Leases) / Assets
Total Leverage Quintile
1 2 3 4 5
Book Leverage 0.07 0.14 0.23 0.33 0.53
Maturity (%>3yrs) 0.16 0.34 0.49 0.59 0.64
Size (Book Assets $mm) 814 1,429 1,988 1,723 936
Age (years in Compustat) 9.05 10.85 13.64 13.44 10.07
Profitability (Op Income/A) 0.07 0.09 0.11 0.11 0.10
Tangibility (PPE/A) 0.26 0.26 0.34 0.40 0.40
MA / BA 2.17 1.92 1.55 1.42 1.52
Z-score 1.57 1.82 1.97 1.90 1.59
R&D / Sales 0.25 0.20 0.11 0.06 0.09
Earnings volatility 0.08 0.07 0.06 0.05 0.06
Marginal tax rate 0.29 0.31 0.33 0.33 0.31
% Dividend Payers 0.34 0.38 0.50 0.49 0.28
Dividend Yield (%) 1.39 1.33 1.80 1.79 1.22
Leases / Assets 0.02 0.06 0.07 0.09 0.19
Panel E: Sorting by Total Liabilities / Assets
Total Liabilities Quintile
1 2 3 4 5
Book Leverage 0.03 0.13 0.24 0.34 0.54
Maturity (%>3yrs) 0.27 0.42 0.52 0.56 0.53
Size (Book Assets $mm) 285 794 1,679 2,081 1,898
Age (years in Compustat) 7.54 11.27 13.53 13.76 10.89
Profitability (Op Income/A) 0.06 0.12 0.12 0.11 0.07
Tangibility (PPE/A) 0.25 0.32 0.37 0.40 0.35
MA / BA 2.44 1.76 1.46 1.36 1.51
Z-score 1.39 2.13 2.17 2.00 1.14
R&D / Sales 0.40 0.12 0.06 0.05 0.09
Earnings volatility 0.09 0.07 0.05 0.05 0.06
Marginal tax rate 0.29 0.33 0.34 0.34 0.28
% Dividend Payers 0.26 0.43 0.52 0.51 0.27
Dividend Yield (%) 1.06 1.54 1.87 1.86 1.18
Leases / Assets 0.06 0.09 0.09 0.09 0.11
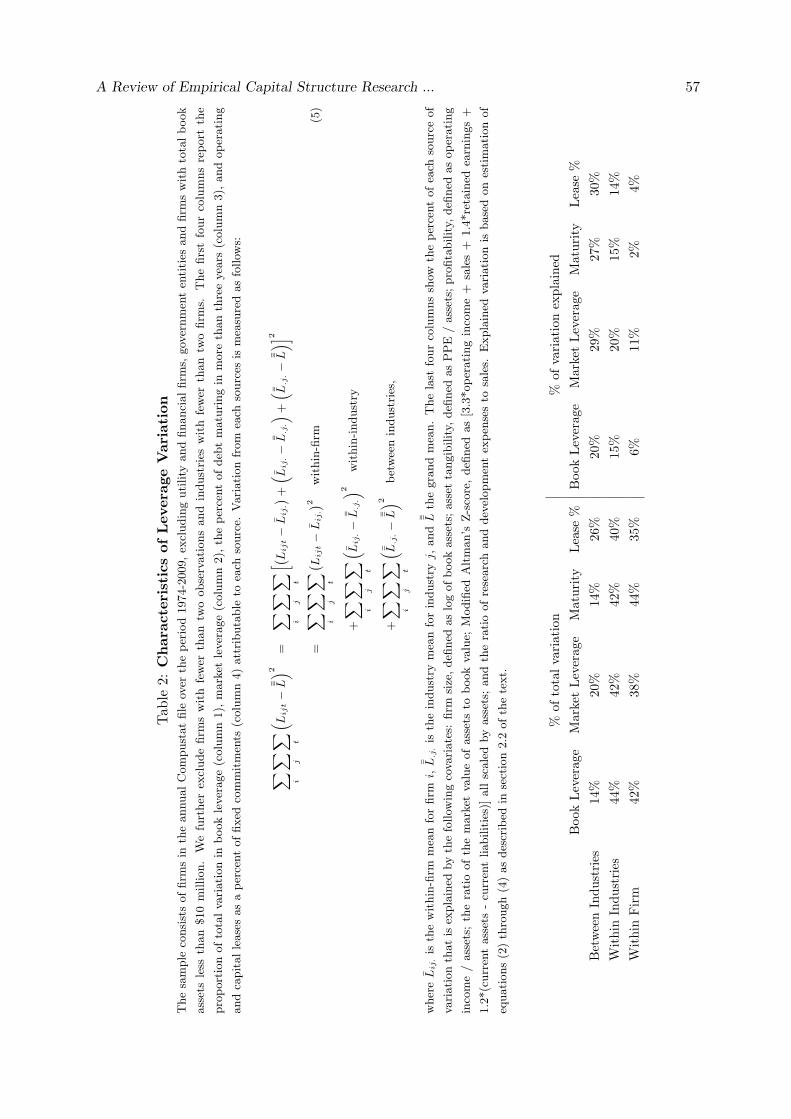
A Review of Empirical Capital Structure Research ... 57
Tab
le2:
Chara
cteristicsofLevera
geVariation
Thesample
consistsoffirm
sin
theannualCompustatfile
over
theperiod1974-2009,excludingutility
andfinancialfirm
s,governmententities
andfirm
swithtotalbook
assetsless
than$10million.Wefurther
excludefirm
swithfewer
thantw
oobservationsandindustries
withfewer
thantw
ofirm
s.Thefirstfourcolumnsreport
the
proportionoftotalvariationin
bookleverage(column1),
market
leverage(column2),
thepercentofdeb
tmaturingin
more
thanthreeyears
(column3),
andoperating
andcapitalleasesasapercentoffixed
commitmen
ts(column4)attributable
toeach
source.
Variationfrom
each
sources
ismeasuredasfollow
s:
∑ i
∑ j
∑ t
( Lij
t−
¯ L) 2
=∑ i
∑ j
∑ t
[ ( Lij
t−
Lij.) +
( Lij.−
¯ L.j.) +
( ¯ L .j.−
¯ L)] 2
=∑ i
∑ j
∑ t
( Lij
t−
Lij.) 2
within-firm
(5)
+∑ i
∑ j
∑ t
( Lij.−
¯ L.j.) 2
within-industry
+∑ i
∑ j
∑ t
( ¯ L .j.−
¯ L) 2
betweenindustries,
whereL
ij.is
thewithin-firm
meanforfirm
i,¯ L.j.is
theindustry
meanforindustry
j,and
¯ Lthegrandmean.Thelast
fourcolumnsshow
thepercentofeach
sourceof
variationthatis
explained
bythefollow
ingcovariates:
firm
size,defi
ned
aslogofbookassets;
asset
tangibility,
defi
ned
asPPE
/assets;
profitability,
defi
ned
asoperating
income/assets;
theratioofthemarket
valueofassetsto
bookvalue;
Modified
Altman’s
Z-score,defi
ned
as[3.3*operatingincome+
sales+
1.4*retained
earnings+
1.2*(curren
tassets-cu
rren
tliabilities)]allscaledbyassets;
andtheratioofresearchanddevelopmentexpen
sesto
sales.
Explained
variationis
basedonestimationof
equations(2)through(4)asdescribed
insection2.2
ofthetext.
%oftotalvariation
%of
variationexplained
Book
Leverag
eMarket
Leverag
eMaturity
Lease
%Book
Leverag
eMarket
Leverag
eMaturity
Lease
%
BetweenIndustries
14%
20%
14%
26%
20%
29%
27%
30%
Within
Industries
44%
42%
42%
40%
15%
20%
15%
14%
Within
Firm
42%
38%
44%
35%
6%11
%2%
4%
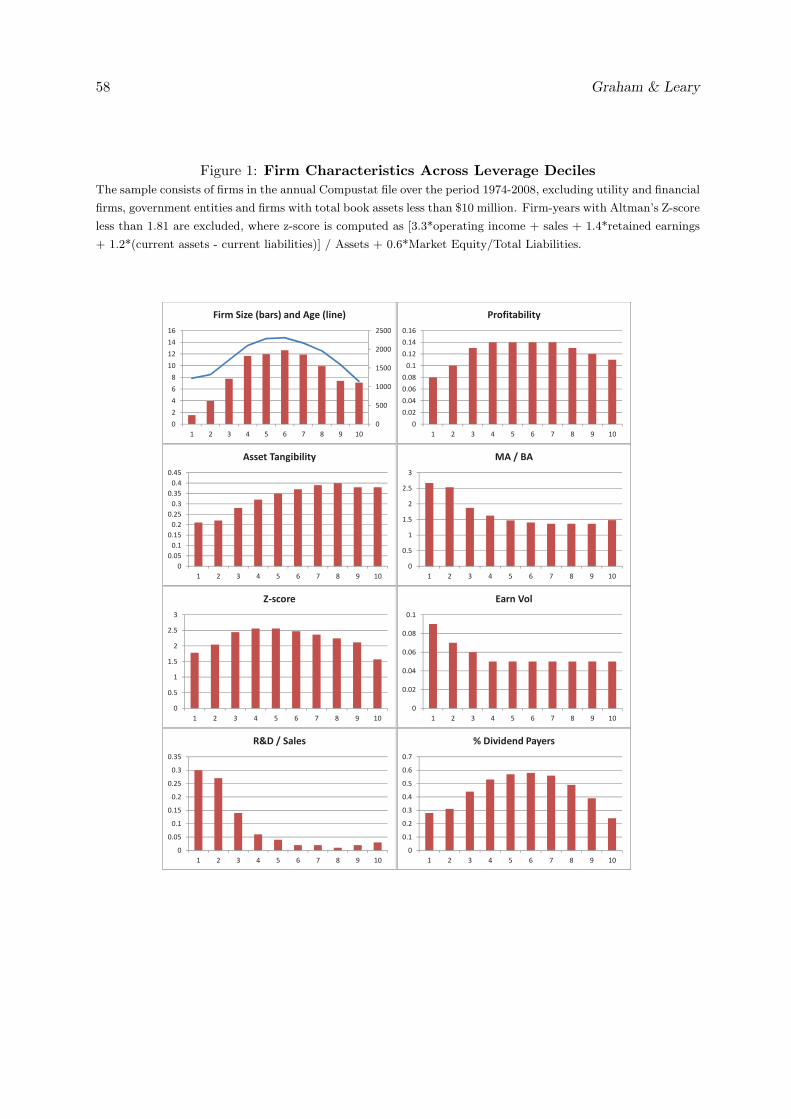
58 Graham & Leary
Figure 1: Firm Characteristics Across Leverage Deciles
The sample consists of firms in the annual Compustat file over the period 1974-2008, excluding utility and financial
firms, government entities and firms with total book assets less than $10 million. Firm-years with Altman’s Z-score
less than 1.81 are excluded, where z-score is computed as [3.3*operating income + sales + 1.4*retained earnings
+ 1.2*(current assets - current liabilities)] / Assets + 0.6*Market Equity/Total Liabilities.
0
0.02
0.04
0.06
0.08
0.1
1 2 3 4 5 6 7 8 9 10
Earn Vol
0
500
1000
1500
2000
2500
0
2
4
6
8
10
12
14
16
1 2 3 4 5 6 7 8 9 10
Firm Size (bars) and Age (line)
0
0.02
0.04
0.06
0.08
0.1
0.12
0.14
0.16
1 2 3 4 5 6 7 8 9 10
Profitability
0
0.05
0.1
0.15
0.2
0.25
0.3
0.35
0.4
0.45
1 2 3 4 5 6 7 8 9 10
Asset Tangibility
0
0.5
1
1.5
2
2.5
3
1 2 3 4 5 6 7 8 9 10
MA / BA
0
0.05
0.1
0.15
0.2
0.25
0.3
0.35
1 2 3 4 5 6 7 8 9 10
R&D / Sales
0
0.5
1
1.5
2
2.5
3
1 2 3 4 5 6 7 8 9 10
Z!score
0
0.1
0.2
0.3
0.4
0.5
0.6
0.7
1 2 3 4 5 6 7 8 9 10
% Dividend Payers
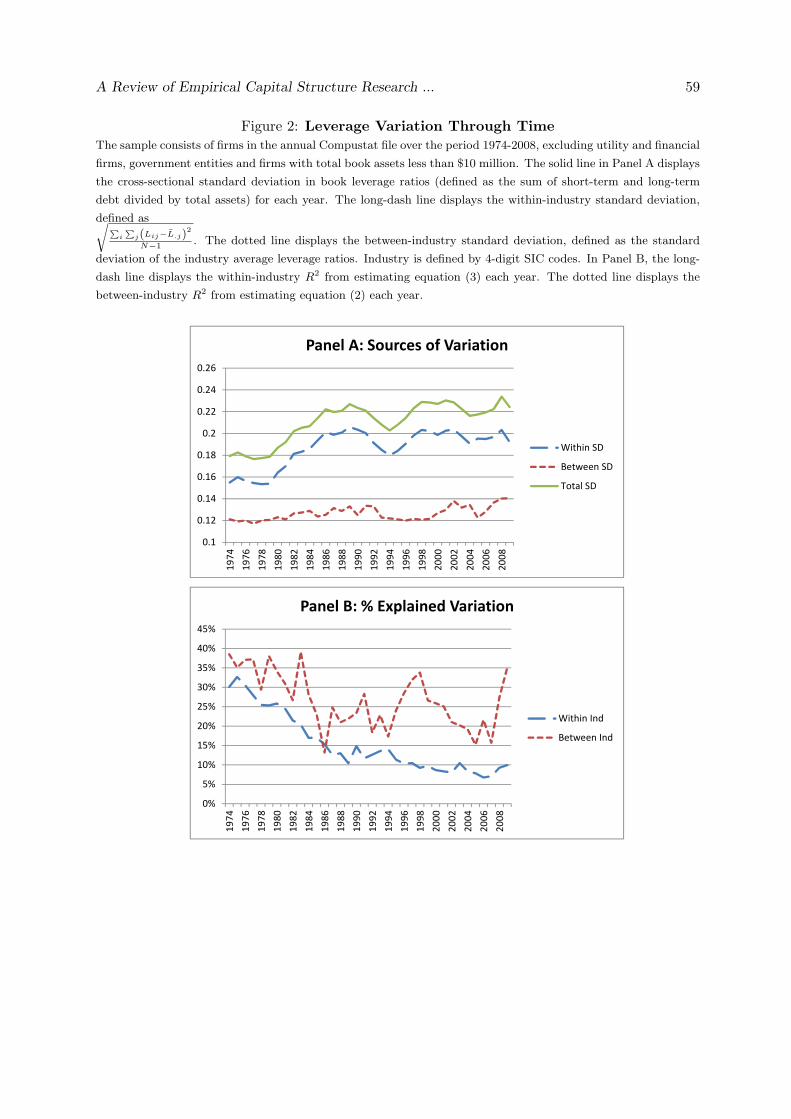
A Review of Empirical Capital Structure Research ... 59
Figure 2: Leverage Variation Through Time
The sample consists of firms in the annual Compustat file over the period 1974-2008, excluding utility and financial
firms, government entities and firms with total book assets less than $10 million. The solid line in Panel A displays
the cross-sectional standard deviation in book leverage ratios (defined as the sum of short-term and long-term
debt divided by total assets) for each year. The long-dash line displays the within-industry standard deviation,
defined as√∑i
∑j(Lij−L.j)
2
N−1. The dotted line displays the between-industry standard deviation, defined as the standard
deviation of the industry average leverage ratios. Industry is defined by 4-digit SIC codes. In Panel B, the long-
dash line displays the within-industry R2 from estimating equation (3) each year. The dotted line displays the
between-industry R2 from estimating equation (2) each year.
0%
5%
10%
15%
20%
25%
30%
35%
40%
45%
19
74
19
76
19
78
19
80
19
82
19
84
19
86
19
88
19
90
19
92
19
94
19
96
19
98
20
00
20
02
20
04
20
06
20
08
Panel B: % Explained Variation
Within Ind
Between Ind
0.1
0.12
0.14
0.16
0.18
0.2
0.22
0.24
0.26
19
74
19
76
19
78
19
80
19
82
19
84
19
86
19
88
19
90
19
92
19
94
19
96
19
98
20
00
20
02
20
04
20
06
20
08
Panel A: Sources of Variation
Within SD
Between SD
Total SD