Embed Size (px)
Citation preview

A Review of “A Multiple-Parameter Approach for
Establishing Minimum Levels for Category 3 Lakes of the Southwest Florida Water
Management District” June 2001 Draft by D. Leeper, M. Kelly, A.
Munson and R. Gant
By Dierberg and Wagner for the SWFWMD September 2001

The Southwest Florida Water Management District (District) does not discriminate upon the basis of any individual’s disability status. This non-discriminatory policy involves every aspect of the District’s functions, including one’s access to, participation, employment, or treatment in its programs or activities. Anyone requiring accommodation as provided for in the American with Disabilities Act should contact (352) 796-7211 or 1-800-423-1476, extension 4215; TDD ONLY 1-800-231-6103; FAX (352) 754-6749.

A Review of “A Multiple-Parameter Approach for
Establishing Minimum Levels for Category 3 Lakes of the Southwest Florida Water
Management District” June 2001 Draft by D. Leeper, M. Kelly, A.
Munson and R. Gant
Prepared by Forrest E. Dierberg, Ph.D Kenneth J. Wagner, Ph.D
For the Southwest Florida Water Management District
2379 Broad Street Brooksville, FL 34604-6899
September 2001

Table of Contents
Executive Summary ...................................................................................................1 1.0 Introduction..........................................................................................................6 2.0 Charge to the Peer Reviewers ..............................................................................6 3.0 Results of the Peer Review ..................................................................................9 3.1 Evaluation of Scientific Reasonableness ........................................................9 3.1.a. Data Collection and Representativeness...............................................9 3.1.a.1. Data Collection ..............................................................................9 3.1.a.2. Quality Assurance (QA) ..............................................................12 3.1.a.3. Data Exclusion.............................................................................12 3.1.a.4. Data Representativeness ..............................................................13 3.1.b. Assumptions........................................................................................14 3.1.b.1. Clarity and Validity .....................................................................14 3.1.b.2. Minimization ...............................................................................19 3.1.b.3. Alternative Analyses with Fewer Assumptions ..........................19 3.1.c. Procedures ...........................................................................................20 3.1.c.1. Best Available Information .........................................................20 3.1.c.2. Completeness...............................................................................24 3.1.c.3. Application ..................................................................................24 3.1.c.4. Limitations...................................................................................27 3.1.c.5. Repeatability ................................................................................28 3.1.c.6. Strength of the Conclusions.........................................................28 3.2 Evaluation of Deficiencies...........................................................................28 3.2.a. Identification .......................................................................................28 3.2.b. Remediation........................................................................................30 3.2.c. Application..........................................................................................30 3.2.d. Alternative Methods ...........................................................................30 3.3 Evaluation of Alternative Methods..............................................................31 3.3.a. Setting the Minimum Lake Level Equal to the Historic P50 Without the Use of Significant Change Standards...................................31 3.3.b. Discarding the Significant Change Standards if the Minimum Lake Level is Higher Than the Historic P50 and Then Setting the
Minimum Lake Level Equal to the Historic P50 .....................................33 3.3.c. Alternative Use of Significant Change Standards: Averages and Medians..............................................................................................34 3.3.d. Inclusion of a Trophic State Significant Change Standard ...............35
3.3.e. Development of a Significant Change Standard for Stratified Lakes.........................................................................................................40 3.3.f. Development of a Significant Change Standard for Maximum of
Depth Colonization for Submerged Aquatic Vegetation .........................41 3.3.g. Development of a Significant Change Standard for Herbaceous
Wetland Area (HWA)...............................................................................43 3.3.h. Recreation/Ski Standard Significant Change Standard Enhancement ............................................................................................43 3.3.i. Aesthetic Significant Change Standard Enhancement ........................44 3.3.j. Possible Benthic Invertebrate Standard...............................................44 3.3.k. Consideration of Septic Influences......................................................45 3.3.l. Adjustments of the Reference Lake Water Regime (RLWR) ...........45 4.0 References ..........................................................................................................47
Tables 1 Comparison of the dynamic ratio values calculated by SWFWMD and the Peer Reviewers....................................................................................................10 2 Comparison of the elevational differences among different proposed methods ...............................................................................................................32 3 Differences between MLLs calculated by proposed District methodology and either the mean or median of all parameter values ......................................35 4 Dynamic Ratio values under varying assumptions.............................................36 5 Predicted change in phosphorus concentration with water level change ...........38 6 Predicted change in phosphorus concentration with water level change under different initial phosphorus concentrations ..............................................40

Peer Review: Category 3 Lakes Page 1
EXECUTIVE SUMMARY This is a summary of the Scientific Peer Review Panel’s evaluation of scientific and technical data, assumptions, and methodologies used by Southwest Florida Water Management District in the development of its proposed Minimum Levels for Category 3 Lakes. It is the second independent peer review that the District has undertaken regarding the lake resources in the Tampa Bay area. The first review, which included other water resources (wetlands, groundwater, Tampa Bay Canal) in the Northern Tampa Bay Water Resource Assessment Project Area, focused on Category 1 and 2 lakes. Both Category 1 and 2 lakes have fringing cypress wetlands that are greater than 0.5 acre, whereas Category 3 lakes are not contiguous with cypress-dominated wetlands, or if fringing cypress wetlands are present, they represent < 0.5 acre. Both panel members for this peer review also served as panel members in evaluating the methodology for establishing Minimum Levels for Category 1 and 2 lakes in 1999. This peer review is focused on the methodology proposed by the District in the development of provisional Minimum Levels for 14 Category 3 lakes in the draft document entitled “A Multiple-Parameter Approach for Establishing Minimum Levels for Category 3 Lakes of the Southwest Florida Water Management District”. One of the most salient differences between the Panel’s reviews of the methods employed in establishing Minimum Levels for Category 1 and 2 lakes and those used for Category 3 lakes is the presence of significant stands of cypress in the former and the absence of cypress except for remnants in the latter. This has led to two major distinctions in establishing Minimum Levels between the cypress-dominated (Categories 1 and 2) and cypress-depauperate (Category 3) lakes. First, cypress tree buttressing has been widely accepted as being a reliable hydrologic indicator of the normal pool. This indicator has been used in the Category 3 lakes whenever there were remnant trees available, but in those lakes where cypress trees are absent, other less reliable hydrologic indicators were applied. Second, and more importantly, the ecological health of cypress-dominated lakes was centered entirely on the fringing cypress trees. It is believed that if the fringing cypress community is protected, then all other lake attributes (recreation, aesthetics, water quality, and other biological resources) will also be protected. However, lakes without significant stands of cypress trees, such as Category 3 lakes, need other sentinel indicators for determining appropriate protective efforts. This requirement of alternative indicators has significantly changed the methodology of setting Minimum Lake Levels for Category 3 lakes from what had been adopted for Category 1 and 2 lakes. Instead of just one key protective measure (i.e., that of protecting the viability of fringing cypress wetlands), the District has advanced no less than 8 equally weighted parameters (sediment resuspension; aesthetics; herbaceous wetland area; maximum depth of colonization of the submerged aquatic vegetation; species richness; dock usage; basin interconnectivity; and skiing/recreation) in the consideration of setting Minimum Levels. These 8 parameters encompass the goals advanced by the current Water Resource Implementation Rule for protecting Florida’s water resources and environmental values while considering natural seasonal fluctuations in water levels.
Peer Review: Category 3 Lakes Page 2
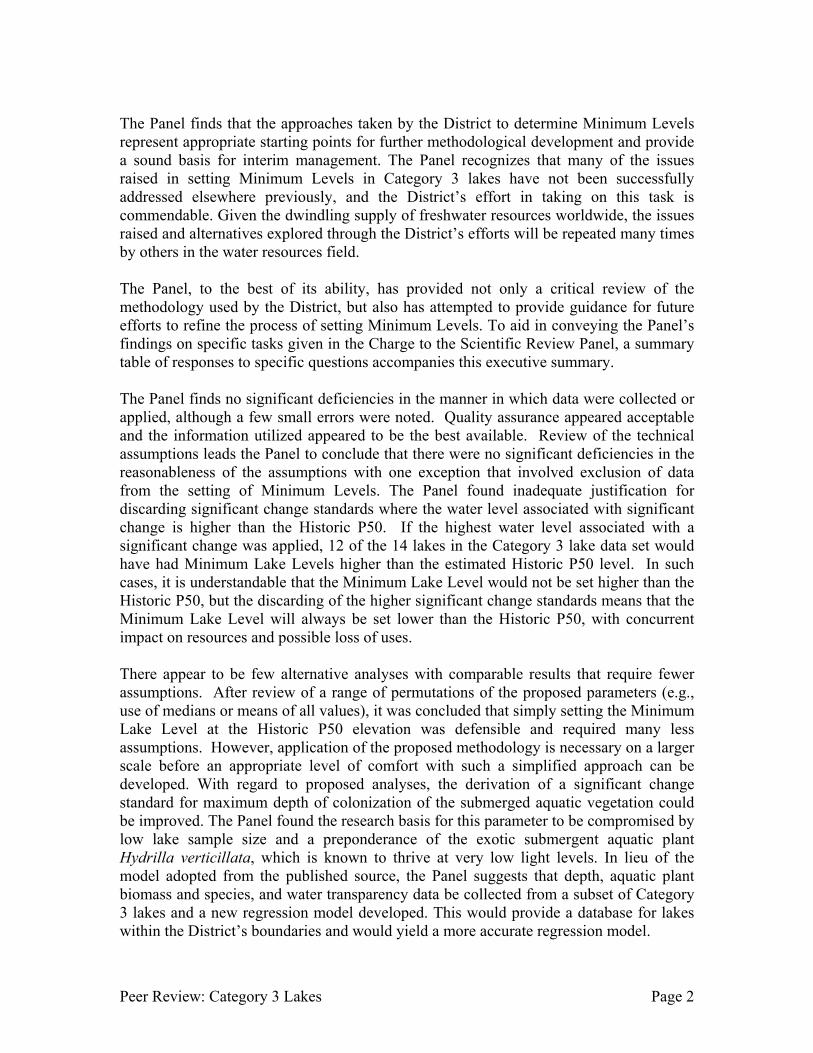
The Panel finds that the approaches taken by the District to determine Minimum Levels represent appropriate starting points for further methodological development and provide a sound basis for interim management. The Panel recognizes that many of the issues raised in setting Minimum Levels in Category 3 lakes have not been successfully addressed elsewhere previously, and the District’s effort in taking on this task is commendable. Given the dwindling supply of freshwater resources worldwide, the issues raised and alternatives explored through the District’s efforts will be repeated many times by others in the water resources field. The Panel, to the best of its ability, has provided not only a critical review of the methodology used by the District, but also has attempted to provide guidance for future efforts to refine the process of setting Minimum Levels. To aid in conveying the Panel’s findings on specific tasks given in the Charge to the Scientific Review Panel, a summary table of responses to specific questions accompanies this executive summary. The Panel finds no significant deficiencies in the manner in which data were collected or applied, although a few small errors were noted. Quality assurance appeared acceptable and the information utilized appeared to be the best available. Review of the technical assumptions leads the Panel to conclude that there were no significant deficiencies in the reasonableness of the assumptions with one exception that involved exclusion of data from the setting of Minimum Levels. The Panel found inadequate justification for discarding significant change standards where the water level associated with significant change is higher than the Historic P50. If the highest water level associated with a significant change was applied, 12 of the 14 lakes in the Category 3 lake data set would have had Minimum Lake Levels higher than the estimated Historic P50 level. In such cases, it is understandable that the Minimum Lake Level would not be set higher than the Historic P50, but the discarding of the higher significant change standards means that the Minimum Lake Level will always be set lower than the Historic P50, with concurrent impact on resources and possible loss of uses. There appear to be few alternative analyses with comparable results that require fewer assumptions. After review of a range of permutations of the proposed parameters (e.g., use of medians or means of all values), it was concluded that simply setting the Minimum Lake Level at the Historic P50 elevation was defensible and required many less assumptions. However, application of the proposed methodology is necessary on a larger scale before an appropriate level of comfort with such a simplified approach can be developed. With regard to proposed analyses, the derivation of a significant change standard for maximum depth of colonization of the submerged aquatic vegetation could be improved. The Panel found the research basis for this parameter to be compromised by low lake sample size and a preponderance of the exotic submergent aquatic plant Hydrilla verticillata, which is known to thrive at very low light levels. In lieu of the model adopted from the published source, the Panel suggests that depth, aquatic plant biomass and species, and water transparency data be collected from a subset of Category 3 lakes and a new regression model developed. This would provide a database for lakes within the District’s boundaries and would yield a more accurate regression model.

Peer Review: Category 3 Lakes Page 3
The Panel finds that the District was diligent in its development of significant change standards, but expresses concern over the limited level of development and application of significant change standards for some of the parameters. This resulted in a limited role for herbaceous wetland area and maximum depth of colonization for submerged plants in the currently proposed approach. Although a well-defined and supported method (i.e., the dynamic ratio) for determining the significant change standard for sediment resuspension was developed, it suffered from a lack of sensitivity when applied to the Category 3 lakes. The Panel suggests improved methods for enhancing the significant change standards for aesthetics and skiing/recreation, although the currently proposed standards are applicable. From independent reviews by experts in avian biology and from public comments by interested parties, the most controversial of the 8 lake parameters is the bird species richness standard. This was examined extensively by the Panel, which finds that the methodology did suffer from some of the deficiencies pointed out by the other parties and reviewers. Nevertheless, the research upon which the significant change standard is based represents the best available information as of December 31, 2000, and the resulting significant change standard of one species lost with a 15% decrease in surface area is conservative in protecting species richness across other communities such as fish and aquatic macrophytes. Moreover, the time, expense, and likely outcome of conducting a follow-up study would in all probability not significantly alter the currently proposed approach of setting Minimum Lake Levels, or the final Minimum Lake Level endpoint. Subject to correction of several minor errors and contradictions, the overall application of the procedure for establishing a water level regime for Category 3 lakes has been performed in a logical fashion with supportable results. As in any rule making process, there are limitations and imprecisions. They appear to have been addressed in the overall context of developing the methodology, including the development of the concept and database for the Reference Lake Water Regime. Possible consideration of additional factors in the establishment of Minimum Lake Levels, such as the relationship between water level and septic system function or the influence of recent watershed development and drought, was found to be potentially useful in the future but not essential to the appropriate application of the proposed multi-parameter approach. Although the methodologies for establishing Minimum Levels for Category 3 lakes are generally acceptable, deficiencies in their application and consideration of additional parameters require future adjustment. While not a direct criticism of the proposed methodology, the Panel found the application of the methodology in establishing the Minimum Lake Level too exclusive of those lake standards whose significant changes were above the Historic P50. Under the currently proposed approach, those parameters would be discarded from further consideration in establishing the Minimum Lake Level, even though there is a demonstration that significant change occurs in one or more lake attributes.

Peer Review: Category 3 Lakes Page 4
The Panel recommends that for those lakes where one or more of the significant change standards fall above the Historic P50 elevation, the Minimum Lake Level be established at the Historic P50 elevation. Not only does this better protect those lake attributes whose significant change standards fall above the Historic P50, but it also is more consistent with the definition of the Minimum Lake Level as approximating the Historic P50 elevation. If this alternative approach was adopted, it would result in only a minor effect on lake surface area, as between 1 and 15% more lake area would be added at the new Minimum Levels of those 12 lakes affected. However, the mean depth of those 12 lakes would increase by 0.7 feet compared to the depths corresponding to the proposed methodology of the District. Other advantages of considering the alternative method for setting the Minimum Lake Level include minimization of assumptions and a better alignment with the Historic P50 elevation, which has been reduced from the pre-development Historic P50. The Panel examined 11 alternative methods. These were not intended in lieu of any of the 8 parameters currently contained in the proposed methodology, but as possible additions or modifications to the existing eight. Most would require only a limited dedication of resources for adequate evaluation. Besides suggestions on developing significant change standards for stratified lakes, maximum depth of colonization of submerged vegetation, and the herbaceous wetland area, the enhancements of the significant change standards for recreation/skiing and aesthetics are also presented. The Panel investigated several new parameters, including trophic state and the benthic invertebrate community (mollusks). Although these two parameters hold promise as future add-ons in establishing Minimum Lake Levels, more data (and assumptions) are needed before they could be scientifically justified as contributing sufficient power to the multiple parameter approach. Lastly, the charge to the Peer Review Panel specifically called for areas of agreement and disagreement between each of the reviewers concerning responses and comments on each task to be identified. Although each reviewer had his own opinions of the strengths and weaknesses of each of the procedures presented by the District staff or suggested alternatives, the differences were never substantial enough that consensus could not be reached. Therefore, this Final Report of the Peer Review of “A Multiple-Parameter Approach for Establishing Minimum Levels for Category 3 Lakes of the Southwest Florida Water Management District” does not contain any areas of disagreement between the two reviewers.

Peer Review: Category 3 Lakes Page 5
Summary of Peer Reviewers’ Responses to Questions Posed in the
Charge Yes Somewhat No Evaluation of Scientific Reasonableness 1.a.1. Was data collection properly done? X 1.a.2. Was the quality assurance adequate? X 1.a.3. Is exclusion of data justified? X 1.a.4. Do data represent best information available as of
December 2000? X
1.b.1. Are assumptions clearly stated? X 1.b.2. Are assumptions minimized? X 1.b.3. Are there alternative analyses with comparable results
and fewer assumptions? X
1.c.1. Are procedures appropriate, reasonable, and based on best available information?
X
1.c.2. Do procedures incorporate all necessary factors? X 1.c.3. Have procedures been correctly applied? X 1.c.4. Have limitations and imprecisions in the information
been handled reasonably? X
1.c.5. Are procedures repeatable? X 1.c.6. Are conclusions from procedures supported by the data? X Evaluation of Deficiencies 2.a. Do scientific deficiencies exist and have errors been
introduced? X
2.b. Can the deficiencies be remedied? X 2.c. How would remedies be applied and at what level of
effort? See Section 3.3
2.d. If deficiencies cannot be remedied, what alternative methods might be available?
See Section 3.3
Evaluation of Alternative Methods See Section 3.3

Peer Review: Category 3 Lakes Page 6
1.0 INTRODUCTION Under Florida statutes, the Southwest Florida Water Management District (hereafter, the District or SWFWMD) provides for Peer Review of methodologies developed to aid management of water resources within the jurisdiction of the District. Setting minimum lake levels has become a priority in light of declining levels over the recent decades and increasing demand for water by human residents of the area. The first Minimum Flows and Levels Panel addressed several areas related to a broad spectrum of water resource issues in the north Tampa Bay area. Included in these minimum flow and water level priority areas was the issue of appropriate methods for setting target lake levels for Category 1 and 2 lakes, lakes with fringing cypress wetlands of greater than 0.5 acre. This Panel has been assembled to review the proposed method for setting minimum levels for Category 3 lakes, lakes without fringing cypress wetlands of greater than 0.5 acre. This review follows the organization of the Charge to the Peer Review Panel, addressing the questions posed and offering supporting explanation and analysis. It is the job of the Peer Review Panel to assess the strengths and weaknesses of the overall approach and its component parts. This review is offered in the spirit of enhancing water resource management within the District, and strengthening the overall science of water resource management. 2.0 THE CHARGE The charge to the consultants of this Minimum Flows and Levels Panel had four elements, paraphrased as follows:
1. Review the District’s draft document that outlines a multi-parameter method for setting target lake levels for Category 3 lakes (lakes without fringing cypress wetlands of 0.5 acre or more).
2. Review additional documents that provide background, support or criticism of the proposed approach.
3. Participate in a public meeting for the purpose of receiving comments and discussing directly the issues, strengths and weaknesses relating to the proposed approach.
4. Provide a written report to the District that reviews the proposed method within the framework established for Peer Reviews for the District. This includes determining if the method is scientifically reasonable, describing any deficiencies, and proposing any alternative methods that appear preferable.

Peer Review: Category 3 Lakes Page 7
Several review constraints have also been set. “Givens” include: 1. The selection of lakes for which minimum levels have initially been set. The
District has a priority list and an orderly approach to setting minimum levels that is not part of the review process.
2. Determination of the baseline from which “significant harm” is to be determined. Water level changes attributable to structural alteration of outlets, drainage systems, and other lake or watershed features are not expected to be reversed as a consequence of the proposed method for setting target water levels.
3. Definition of what constitutes “significant harm” to the water resource. Where a change has been quantified as harmful by the District, the associated threshold that defines the change is to be accepted.
4. The adopted method for establishing minimum levels for lakes with fringing cypress wetlands greater than 0.5 acre. This method is based on maintaining the cypress wetlands and has been the focus of a previous Peer Review Panel.
Both consultants for this Peer Review Panel served on the previous Minimum Flows and Levels Panel that addressed Category 1 and 2 lakes, and are familiar with the process and the methods adopted to date. Similar constraints were imposed on the first Panel, and one has posed distinct difficulty in each case: #3, the definition of “significant harm”. For the Category 1 lakes, the sole determinant of significant harm was the water level (assessed as P10 or P50) in relation to the Normal Pool as determined from cypress buttresses; “significant harm” is based on the premise that if an adequate water level was not maintained, the integrity of the cypress wetland would be threatened. For Category 2 lakes, which are structurally altered such that the water level regime does not fully protect the cypress wetland, the same significant harm standard was applied, but with the Normal Pool determined from data other than cypress buttresses (elevation of the control point or the Current P10, whichever was greater). A Category 2 aquatic system may be clearly harmed by structural alteration, but the method emphasizes consistent application of a threshold from a defensible starting point, defining “significant harm” in a relative manner. This approach acknowledges that factors beyond current control of the District may cause harm to the system, and sets up a process whereby significant harm is defined based on factors within the District’s control. It also sets a numerical threshold for harm, much like water quality standards do for contaminant concentrations. This is a common and accepted approach, but suffers from the inability of thresholds to adequately describe what is really a gradient of harm. To overcome this limitation, thresholds may be set to provide adequate protection under all but the most unusual cases, building in a margin of safety. Alternatively, if a defensible margin of safety cannot be determined, the threshold may be set to provide adequate protection under “average” conditions. This causes considerable dissention upon implementation in many cases, as one or more parties may feel that the threshold is too restrictive or not restrictive enough. The whole approach of setting thresholds is fairly contentious, and the constraint on the Panel is intended to eliminate this issue and focus effort on the overall method of setting minimum lake levels.

Peer Review: Category 3 Lakes Page 8
The definition of significant harm is even more problematic for the Category 3 lakes, however, since the multi-parameter approach considers as many as 8 possible measures of significant harm. The term “significant harm” has been largely abandoned in the SWFWMD draft document in favor of “significant change”. Considerable discussion was devoted to this definition and its determination at the public meeting, and it is difficult to properly review the methodology without some consideration of the definition of “significant change”. We will note situations where this is a problematic issue in our review of the method, but we will abide by the charge to the extent possible and devote relatively little discussion to this aspect of method development. Along these same lines, it is important to note that the development of a method for setting target water levels is largely decoupled from the sources of water level decline and the possible restoration approaches. For those working in water resource management, including the Panel members, it is difficult to focus on just the methodology for setting minimum levels and to ignore the broader picture of why such a methodology is needed or how it will be used within the context of restoration and water resource management. Discussion at the public meeting, review of data for the target lakes, and review of reports provided by the District (Emery, 1992; Leggette, Brashears & Graham, 1995) revealed several sources of water level decline, including structural alteration of outlets, alteration of drainage patterns within watersheds, drought, and direct or indirect withdrawal of water for human uses. This review makes no supposition regarding the relative importance of these factors, but must consider them in reviewing the development of parts of the proposed method, such as the Reference Lake Water Regime (RLWR), which is dependent upon historic conditions that may have been affected differentially by these factors. In terms of implementation of programs to restore lake levels to some desired distribution over time, this review makes no supposition regarding how this will be accomplished. We do, however, note the challenging nature of such a proposition, and commend the District for facing it now. Many other areas of the United States will have to deal with this problem eventually, and few have made much headway to date. The options are limited and generally center on alteration of human water sources or uses. The charge states that the baseline from which significant harm is determined is a given, and that baseline includes changes in water levels caused by structural alteration. Drought is not within the control of any human organization at this time. It has historically been difficult to reverse watershed alterations that affect flows and lake levels, although additional alterations (e.g., channel creation, pumping) could offset past alterations to some extent. This leaves direct and indirect withdrawals as the most easily controlled factors, and directly affects human users within the area.

Peer Review: Category 3 Lakes Page 9
3.0 RESULTS OF THE PEER REVIEW 3.1 Evaluation of Scientific Reasonableness Overall, the method is reasonable. It incorporates multiple measures of potential impact to Category 3 lakes within the framework of the Minimum Levels Approach for Category 1 and 2 lakes, assessing significant change based on variables other than contiguous cypress wetlands greater than 0.5 acre in area. The selection of the 8 parameters for establishing the MLL encompasses the recommendations made by the Scientific Review Panel during the establishment of Minimum Levels for Category 1 and 2 lakes. That is, additional indicators (i.e., lake volume, lake area, and littoral plant assemblages) of lake condition should be applied to the development of minimum levels to the extent possible. The selection of the 8 parameters also covers the current Water Resources Implementation Rule (Chapter 62-40, Florida Administrative Code) which states that consideration shall be given to recreation, fish and wildlife habitats and passage of fish, transfer of detrital material, aesthetic and scenic attributes, filtration and absorption of nutrients and other pollutants, sediment loads, water quality, and navigation. District staff has addressed all these lake qualities in one or more of their multi-parameter assessment. Considerable effort has gone into developing indicators of impaired lake function as a consequence of reduced depth, area or volume. This is a scientifically complex area of environmental evaluation and regulation, however, and there is not an extensive body of experience from which to work. Refined or additional analyses can be envisioned and may be developed, but these would tend to add to, rather than replace, the proposed approach. 3.1.a. Review of data and information The proposed approach relies on measures of lake and watershed area, lake bathymetry, indicators of normal pool elevation, any outlet control point elevation, water levels over multiple years, elevation of shoreline structures, and biological features of lakes. The approach applies both generalized relationships between water level and lake functions and lake-specific information. 3.1.a .1. Were data properly collected? We do not have all original data or associated collection procedures in our possession, but collection procedures appear proper based on the data that were provided. Furthermore, experience with data collection procedures from the previous MFL Panel (for Category 1 and 2 lakes) indicates that the process is likely to have been conducted properly and with enough redundancy to evaluate methodological precision and estimate accuracy. For example, measurement of normal pool elevation is based on biological indicators and for any given lake typically exhibits a range of up to 0.5 ft. A mean elevation is reported as the normal pool elevation, based on multiple measures, and provides a reasonable assessment of central tendency. Elevations are reported to the nearest 0.01 ft NGVD, about the limit of measurement precision and more exact than necessary, based upon biological variability.

Peer Review: Category 3 Lakes Page 10
Other elevation values are collected similarly, calculated as the mean of multiple measurements reported at the numerical limit of the survey methodology. The use of central tendency measures allows statistical analysis of variability and its possible effect on minimum levels, although no such analysis has been provided to us. Any error in the average elevations derived in this manner is likely to be on the order of 0.1 ft or so, which does not appear to be an important deviation within the overall minimum levels framework. This could be an issue in the enforcement of minimum levels, such as when the target MLL is missed by 0.01 ft, but we have no knowledge of the enforcement aspect of this program. Other analyses depend upon published literature, and those methods have been scrutinized by SWFWMD staff as well as outside parties. A few of the methods were questioned by members of this Peer Review panel and outside parties. This has led to the reliability of the resultant relationships being questioned on the grounds of both measurement approach and the substitution of short-term data sets from multiple lakes for lake-specific data over longer time periods. Initially, we felt more work needed to be done on the dynamic ratio since there is an apparent lack of sensitivity to the parameter in the 14-lake data set in Table 4-1 of the Draft Report (Leeper et al., 2001). There was only one lake (Big Fish) that had dynamic ratios greater than the 0.8 cutoff, but even then both dynamic ratios corresponding to the Current P10 and P90 elevations were >0.8, indicating that the entire lakebed is subject to resuspension part of the time over the entire dynamic range of water elevations. To be certain that the dynamic ratios at the Current P10 and Current P90 lake stage elevations were computed correctly, we recalculated the dynamic ratios for a subset of four lakes (Table 1). Since the lake depths corresponding to the Current P10 and P90 elevations were not given in the report, we calculated them by determining the water volume at each of those elevations from the Lake Stage vs. Lake Volume figure, and then dividing by the respective areas provided in the Draft Report. Table 1. Comparison of the dynamic ratio values calculated by SWFWMD and the Peer Reviewers corresponding to the Current P10 and Current P90 stage elevations of four Category 3 lakes. Z = lake water depth was calculated by the quotient of the lake volume divided by the lake area.
Current P90 Current P10 Dynamic Ratio Dynamic Ratio
Z (m) SWFWMD Peer
Z (m) SWFWMD Peer
Big Fish 0.9 1.0 0.2 0.6 2.5 2.8 Raleigh 1.7 0.1 0.1 3.0 0.1 0.1 Rogers 1.7 0.2 0.3 2.9 0.3 0.2 Starvation 1.1 0.3 0.4 1.9 0.3 0.3

Peer Review: Category 3 Lakes Page 11
There is generally good agreement between the two groups of scientists except for Big Fish Lake at the Current P90 lake stage elevation, which may have been due in part to the interpolation of the lake volume from the Lake Stage vs. Lake Volume graph by the Peer Reviewers. Nevertheless, Big Fish Lake is the only lake in the data set whose dynamic ratio changes from greater to lesser than 0.8 between the Current P10 and Current P90 elevations. This means that the lake is less likely to experience resuspended sediment the shallower it becomes, a rather counter-intuitive result. Another example of data collection methods that has been challenged is the relationship between bird species richness and Florida lake area. Ornithologists have been critical (Rodgers, 2001; Jackson, 2001) of its development by scientists other than avian biologists, the lumping of certain bird species into larger taxonomic groups, inclusion of rare species, and the failure to examine feeding guilds or other measures of ecological significance instead of simple taxonomic richness. Additionally, the lack of abundant data for specific systems that have undergone areal changes over time necessitates reliance on an assumption of transferability for the multi-lake richness-area relationship to individual lakes over time. Similar empirical relationships between lake area and species richness for aquatic plants and fish have been applied with slightly higher results (28-30% difference in areal loss necessary to cause presumed loss of one aquatic plant or fish species vs. 15% areal loss for a one species decrease in the avian fauna), but collection methods have been less criticized for these variables. This suggests that either the relationships are reasonable or there is an unknown, underlying flaw that negates the whole process of judging species richness by lake area. However, it is unlikely that the relationship between species richness and lake surface area is a flawed concept since it has been shown to exist in other studies. For example, Nürnberg (1995) reported that fish species richness in northern lakes was positively correlated to lake area (r2 = 0.41 for all lakes in the data set; r2 = 0.61 for non-acidic [i.e., neutral] lakes). The main controversy over the use of species richness as a significant change standard relates to how to use data to decide on an appropriate limit of impact. A potentially more severe inadequacy pertains to the data collected in the Canfield et al. (1985) study that was used as the basis for establishing the maximum depth of colonization (MDC) for submersed aquatic vegetation (SAV). There are some drawbacks in using that database which we feel could be examined and redressed for limited effort and cost. Canfield et al. (1985) included emergent and floating vegetation in their 26-lake data set, which we feel are not nearly as physiological dependent on underwater light penetration as is the submersed aquatic vegetation community. Subtracting the number of lakes with floating or emergent vegetation, the data set is reduced from 26 to 18 lakes. Furthermore, of those 18 lakes, 11 of them were dominated by hydrilla (Hydrilla verticillata), which biases the regression coefficients towards this exotic species that is known for growing in low light environments. We propose an alternative method under Task 3.

Peer Review: Category 3 Lakes Page 12
3.1.a.2. Was QA adequate? It is difficult to fully evaluate quality assurance procedures without all raw data in hand, but there is no evidence that QA was inadequate and past experience with the previous MFL Panel suggests that QA in SWFWMD operations relating to minimum lake levels has been adequate. We have not been provided with duplicate measures, other than the field measures for the hydrologic indicators, or other comparative diagnostic assessments that would facilitate more detailed review of QA procedures. However, it should be noted that the use of central tendency measures limits the impact of an occasional inaccurate or imprecise measurement. Furthermore, consideration of comparable measurements from adjacent lake basins (e.g., normal pool elevation at nearby lakes) was used as a check on the accuracy of lake-specific measures, and did result in the discarding of one measured normal pool elevation (Rogers Lake, based on data for nearby Raleigh Lake). 3.1.a.3. Is exclusion of any data justified? The most obvious case of data exclusion evident in the materials provided is the above noted rejection of the normal pool elevation for Rogers Lake obtained from low-limit elevation of saw palmetto and pine. This normal pool elevation was several feet higher than that calculated from adjacent and hydrologically connected Raleigh Lake based on cypress buttress measurements. This is particularly enigmatic considering that the stage level decrease in Lake Rogers was more dramatic after 1964 (Fig. 6-53 in Leeper et al. 2001) than it was in Lake Raleigh (Fig. 6-48 in Leeper et al. 2001). This should have produced normal pool elevations for saw palmetto that were lower than the cypress tree elevations in Raleigh Lake. As experience with normal pool estimation from cypress buttress inflection points is substantial and this approach has been fairly reliable at Category 1 and 2 lakes, rejection of the normal pool elevation determined from saw palmetto and pine position appears justified in this case. A second less obvious example is found at Hobbs Lake (p6-97 in Leeper et al. 2001), where the narrative notes that the water level data between 1946 and 1962 pre-date regional withdrawal impacts, but do not meet the criteria for historic data. From the graph on p6-102 (in Leeper et al. 2001), the reason for this is not evident, and choice of data to establish the Historic P50 has a substantial impact on regulatory water levels. More support is needed for this rejection of data, especially since Lake Hobbs was classed as a Category 1 lake during the first Peer Review of Category 1 and 2 lakes. It was only one of 6 lakes out of 22 that had acceptable historic data (see Appendix B: Reference Lake Hydrographs of the Northern Tampa Bay Minimum Flows & Levels White Papers, March 19, 1999). A separate form of data rejection that should be discussed is the discarding of minimum water level indications from significant change standards when the resulting water level is higher than the Historic P50. Several examinations of the provided materials failed to reveal why the minimum level would not be set at the Historic P50 in such a case. In other words, if there is an indication that significant change is occurring at a water level higher than the Historic P50, it is understandable that the MLL might not be set higher than the Historic P50, but it is not clear why the indication of significant change would be

Peer Review: Category 3 Lakes Page 13
ignored in determining the MLL. As this is less a question of data collection than data use, it will be taken up further under Sections 3.1.b.1. and 3.3 of this review. A yet additional form of data exclusion involves abandoning the effort to develop certain significant change standards because there was no clear relationship between water level and data for possible impacts that could be discerned or translated into a workable analysis. Such exclusion was done with adequate explanation, and an insightful summary table of the benefits and drawbacks of each possible indicator of impact was provided, but it may be possible to find a way to include such data and analysis with further examination and additional assumptions. For example, it is suspected that decreased mean depth could lead to undesirable changes in trophic state, but no method for assessing that change in a meaningful manner could be devised based on the available data and assumptions made in the review of procedure development. Possible analyses toward this end are discussed in Section 3.3. 3.1.a.4. Do data represent the best information available? As we have limited knowledge of any additional data, the data do appear to represent the best information available. There may be additional data of relevance, and there may be ways to use additional data that have not been considered, but the data presented appear to be generally appropriate for the intended use in setting minimum levels at the target lakes. There are, however, a couple of important exceptions where additional existing data, or data easily acquired, would strengthen the procedures developed for establishing MLL for Category 3 lakes:
• Although there are 14 identified lakes presented in the Draft Report as being classed as Category 3 lakes, the reality is that there are only 10 independent lake systems. This is because of three groups of lakes that are interconnected by their surface hydrology: Raleigh and Rogers; Church and Echo; Helen and Ellen and Barbara. The lakes within each of those lake systems are not truly independent of each other, and therefore may be expected to function similarly, especially in response to lake level fluctuations. It would add more robustness to the overall analysis of the procedures used to set MLL in Category 3 lakes if more Category 3 lakes (totaling ~ 20 independent lakes) were added to the data set. However, the choice of lakes for which minimum levels are being set at this time is a given in the Charge to Consultants.
• Instead of relying on a regression equation found in the literature pertaining to other Florida lakes in developing a significant change standard for the MDC of SAV, more current, site-specific, and numerically superior data should be acquired. A more complete explanation of the procedure is found in Task 3.3.

Peer Review: Category 3 Lakes Page 14
3.1.b. Review of assumptions 3.1.b.1. Are assumptions clearly stated? Assumptions are not always clearly stated in the discussion of development of the minimum level procedure, but procedure development is laid out in such a way that assumptions are usually apparent and easily understood. Several assumptions are critical to the overall procedure of setting water level targets for Category 3 lakes. Those associated with Category 1 and 2 lakes as well have been addressed by the previous MFL Panel and were not found to be fatal flaws. Examples include the correspondence of normal pool indicators to the approximate historic P10 level and that harm to contiguous cypress wetlands constitutes harm to the lake. For Category 3 lakes, apparent assumptions include:
• An additional RLWR is needed for lakes in the Central Hernando-Eastern Pasco County Region, as the North Tampa Bay RLWR is inappropriate for this region – This appears to be a valid assumption, based on the data provided for the one lake in this region with reliable historic records. Nevertheless, basing a RLWR on records for one lake only is suspect. The use of 22 lakes to establish the RLWR for North Tampa Bay seemed adequate, and it was suggested that there might be classes of lakes within that grouping that could form separate RLWRs with lesser within-group variability. However, it would be preferable to establish a RLWR from more lakes than the 16 years of data from Crews Lake. The use of the Central Hernando-Eastern Pasco RLWR to set regulatory water levels for only one of 17 lakes minimizes the impact of this assumption.
It should be further noted that the development of any RLWR from historic data assumes that the influences that shaped that RLWR remain constant. This will never be completely true, and may be substantially false where watershed features have been altered to a large degree or where climate has changed. Concern is expressed over what appears to be increasing variability in water level data sets (not just declining water levels) that may reflect a change in the RLWR from what has been established from data collected as much as 6 decades ago. The use of central tendency measures (as with the North Tampa Bay area lakes) will minimize potential impact, and it is not clear that changes in the RLWR are large, but the validity of the assumption is not certain.
• The normal pool elevation in the absence of cypress trees can be determined from
other vegetation patterns – Many other wetland mapping exercises use vegetation pattern to assess boundaries that relate to hydrologic conditions, so the approach is sound in theory. However, there are multiple types of wetlands (and uplands) with differing relations to area hydrology (e.g., depression wetlands, slope wetlands). To be useful, normal pool indicators must reflect hydrology that is closely tied to lake level. This relationship may not hold up in cases of non-equilibrium of ground water with lake level or for facultative plant species that depend on factors other than just water level for their distribution. The choices

Peer Review: Category 3 Lakes Page 15
for Category 3 lakes appear reasonable, but factors other than lake level may be responsible for variability in normal pool estimates for any given lake, such as the one seemingly aberrant normal pool indication for Rogers Lake. The use of cypress buttress measures to establish the normal pool for 13 out of 17 target lakes minimizes the impact of this assumption.
• Declining water levels can affect the thermal structure of the lake and the
resuspension of sediments – This is a reasonable assumption, but is difficult to put into practice as a significant change standard and has a limited role in the currently proposed approach. Certainly a loss of depth in a previously stratified lake can disrupt or prevent future stratification, but most of the target lakes have been described as minimally stratified even at full depth. There may be some concern that intermittent stratification occurs and is important to water quality and overall lake ecology, but we have no data to evaluate this premise at this time.
Additionally, since the data for the target lakes clearly show that average depth and lake area decline together in a fairly linear fashion, the effect of declining water level on the dynamic ratio is not especially striking as calculated. The dynamic ratio is useful for evaluating the potential for resuspension within a lake, but is not overly amenable to evaluating impacts of changing water depth without a change in the calculation method. That change would involve acknowledging that the exposed area is still part of the lake and subject to erosion while exposed or resuspension when water levels rise. Calculation of the dynamic ratio would employ a stable water level (Historic P50, P10?) for a range of average depths, illustrating the full impact of changing water level. Yet this alternative approach did not yield substantially increased sensitivity, as will be addressed in Section 3.3.
• Water levels should be maintained to allow reasonable use of docks constructed
in accordance with permitted practices – A dock constructed in accordance with past permits should have one to two and a half feet of water under its deep end to facilitate access with minimal bottom damage, depending on when and where it was built. These docks provide a historic representation of some frequently occurring water level, although whether or not that level corresponds to the Historic P50 is not clear. While there is room for debate over the depth of water that should be maintained and at what frequency, the assumption that this use should be preserved is reasonable, and ties water levels to use, an important aspect of most regulatory systems. Note that the establishment of the dock standard is based on two feet above the substrate elevation of the 10th percentile among existing docks (not the shallowest one), which assumes that some small percentage of docks may have been constructed improperly.
• Water levels should be maintained to allow fish and boat passage among
historically connected basins of a lake – This is a reasonable assumption that ties water levels to lake use by humans and non-humans alike. There is room for debate over the depth necessary for motorized watercraft passage (currently set at

Peer Review: Category 3 Lakes Page 16
2 ft) or non-motorized watercraft and fish passage (currently set at 1 ft) and over what the frequency of the target water level should be (currently set at the Historic P50), but it is appropriate to manage for access to all basins.
• The area of a lake should be maintained to avoid the loss of species – This is a
reasonable assumption that is applied by setting the acceptable loss of area at the level at which one species would be lost, based on a regression of species richness on lake area. The bird richness regression was the most conservative, at a species lost with 15% decrease in area, and was applied instead of the fish or aquatic plant regressions, which indicated loss of a species at a 28-30% decrease in area. There has been criticism of the application of regressions based on many lakes over a short time span to a single lake over a longer period, and of the details in regression line derivation, but the theory is sound and the conversion to an applied form is reasonable. Further research on what happens at individual lakes over time is worthwhile and might be used to modify the regressions in the future.
We support the use of the significant change standard based on the relationship between bird species richness and lake area (15%), not so much because we believe that this relationship is beyond challenge, but because it provides a margin of safety over the 28-30% area change associated with the loss of one plant or fish species. The applicable statutes provide for protection of biotic resources and do not specify the loss of a species as acceptable. Additionally, loss of species from other faunal groups (e.g., benthic invertebrates, which have been visibly decimated by recent low water levels) have not been examined, so the bird species loss regression is not necessarily the most sensitive one.
• Water levels should be maintained to avoid major shifts in littoral vegetation and
fringing emergent wetlands- This is a reasonable assumption that represents an extension of the argument used to establish water levels for Category 1 and 2 lakes. Application is hindered, however, by the more transient nature of herbaceous plant communities. Little effort appears to have gone into evaluating impact to contiguous wetlands not dominated by cypress, but with the expertise developed by the SWFWMD working with Category 1 and 2 lakes, there is probably good reason even if it has not been clearly stated. Instead, the proposed approach focuses on emergent vegetation and floating plants. Even though the large sample size (295 lakes) helped to statistically validate the ≤ 4 ft depth optimum by lowering the variation in herbaceous plant community positions relative to fluctuating water levels (both for high and low water depths), use of the colonized area could prove difficult for an individual lake, as the zone of colonization moves fairly quickly with changing water depth. Development of a more quantitative significant change standard for either HWA or SAV seems desirable, but will involve more assumptions and a change in approach. This is addressed in Section 3.3.

Peer Review: Category 3 Lakes Page 17
• Water levels should be maintained to provide a reasonable level of aesthetic appeal for human users – This is a bold but reasonable assumption that is supported by expressing human expectations in terms of “normal” and “altered” water levels. Development of a significant change standard depends upon acceptance of a change from the Historic P50 level to the LGL, or P90 level, as aesthetically unappealing. While this could be debated in terms of what human expectations are involved, it is a reasonable starting point and is supported by visual depictions of the associated change in some lakes and our own impressions from visiting some of the target lakes. This standard could be refined by further study, and may require less assumptions about user preference as a result, as discussed in Section 3.3.
• Water levels should be maintained to provide continued safe water skiing and
related recreational use where such use has existed in the past – This is a reasonable assumption based on maintaining existing uses in a water body, and relies on providing a safe area for waterskiing based on Coast Guard requirements and a literature review of boating impacts on lakes. The application of this assumption is not very rigorous; it requires only that one waterskier be accommodated, while many more may have been historically able to use the lake at the same time. It also assumes a standard area and shape for waterskiing that may not be entirely applicable. An alternative would be to maintain boatable acres, defined as the area that can be safely used by motorized watercraft with minimal environmental damage as well. However, the use of this assumption as proposed is appropriate at the most basic level of continuing to support an existing use. Enhancement of this standard is addressed in Section 3.3.
• The RLWR adequately reflects the water level regime in the absence of
withdrawals – This assumption was reviewed and generally accepted as part of the Peer Review process for Category 1 and 2 lakes, with recommendations for improvement (Bedient et al., 1999). The issue of more recent development impacts affecting water level variability to a greater extent than reflected in the RLWR for the Northern Tampa Bay area was highlighted during the August 2001 public meeting held in relation to Category 3 lakes. There may indeed be greater current variability than that induced by water withdrawals, as a function of both development in the watershed and multiple drought years since 1989. Sorting out the relative influence of each factor is problematic, however, and requires additional assumptions. While it is advisable to examine the effect of development and recent drought on the RLWR, the established RLWR is not highly inaccurate or less preferable based on available data at this time. A preliminary evaluation of grouping lakes as isolated or connected by surface hydrology revealed minimal changes in the resulting RLWRs (See Section 3.3).
• Where a significant change standard suggests a MLL higher than the Historic
P50, that significant change standard is to be discarded in setting the MLL for the lake in question - The discarding of significant change standards where the water level associated with significant change is higher than the Historic P50 (as

Peer Review: Category 3 Lakes Page 18
determined by historic data, current data, or the normal pool elevation minus the RLWR50) is a more troublesome assumption for which adequate justification has not been found. In such cases, it is understandable that the MLL would not be set higher than the Historic P50, but the discarding of higher significant change standards means that the MLL will always be set lower than the Historic P50.
There is an exception to the above situation, but it did not arise for the test lakes. If either of the two aquatic plant parameters, herbaceous wetland area (HWA) and maximum depth of colonization (MDC) for SAV, result in a significant change relative to the Historic P50 area of herbaceous coverage or maximum depth of SAV colonization, then the MLL can be equal to the Historic P50. This approach would be valid as long as elevations associated with the significant change standards of the remaining six parameters are above the Historic P50 elevation. This was never the case for any of the fourteen Category 3 lakes because of the lack of sensitivity and inadequate establishment of significant change standards for the HWA and MDC (elaborated on elsewhere). As the definition of MLL incorporates approximation of the Historic P50, the MLL could be justifiably set at the Historic P50 when a significant change standard indicates a higher MLL. The MLL values resulting from the proposed approach by the District (without defaulting to the Historic P50 if any of the significant change standards exceed the Historic P50) result in a loss of 1-15% of the lake area at the Historic P50, not a major reduction but one that does not seem justified when any significant change standard exceeds the Historic P50. Another aspect of discarding significant change standards if they suggest a MLL greater than the Historic P50 deserves consideration. The Recreation/Ski and Dock-Use Significant Change Standards frequently are higher than the Historic P50 (8 of the 14 Category 3 lakes had critical minimum elevations for either of these two parameters exceeding the Historic P50 elevation). This means that dock usage and recreational skiing are placed as lower priorities because their critical minimum elevations exceeded the P50 elevation. On the other hand, if their critical minimum elevations were just a small amount below the Historic P50, then the MLL would likely be established at those critical minimum elevations. In other words, skiing and dock-use activities on a lake will be curtailed if their critical minimum elevations are above the Historic P50 elevation, but not if they are just below the Historic P50. The current guideline for establishing MLL appears to penalize these two lake attributes vis-à-vis the other 6 parameters, although we are not suggesting that the MLL be set higher than the Historic P50. Still a more conservative approach, and one that would be easier to administer, is to simply set the MLL at the Historic P50 level for all Category 3 lakes. The largest deviation between MLL and Historic P50 for the 14-lake Category 3 data set is a lake surface area that is 15% less than the surface area corresponding to the Historic P50, using the District’s proposed approach. If the MLL is set to the Historic P50 for any lake that has one of the significant change standards above

Peer Review: Category 3 Lakes Page 19
the Historic P50, then the argument that the MLL for all Category 3 lakes should a priori be set equal to the Historic P50 is considerably strengthened. This is because only two (Lake Rogers and Round Lake) of the fourteen Category 3 lakes in the data set do not have any of their significant change standards above the elevation for the Historic P50. This will be discussed more as an alternative approach in Section 3.3.
3.1.b.2. Are assumptions minimized? In general assumptions are minimized, as analyses that require more assumptions or more complicated logic have been deleted from consideration. Issues relating to the impact of changing water level on lake water chemistry and overall trophic state bear further analysis, but were found during the procedure development to call for too many assumptions (or too much data) to be useful at this time. Some assumptions may indeed be warranted, but they will add to the list, which is now manageably small. If the MLL was simply set as equal to the Historic P50, further minimization of assumptions would be achieved, but the useful exercise of testing the multi-parameter method would be negated. The multi-parameter method appears to minimize assumptions to the extent possible within the context of its development and application. 3.1.b.3. Are there alternative analyses with comparable results and fewer assumptions? There also do not appear to be alternative analyses with comparable results that require fewer assumptions, except possibly for the MDC of SAV (discussed below). There may indeed be worthwhile alternative (or more likely in this case, additive) analyses to be considered, but these will mostly require additional assumptions. If those additional assumptions are offset by increased power to the procedure, they may be worthwhile, but we have not perceived that minimum levels can be set with alternative analyses relying upon less assumptions. Setting the MLL equal to the Historic P50 appears to provide comparable results with fewer assumptions, but this would not be known if the proposed analyses were not conducted, and represents an alternative approach, not an alternative analysis. The analyses conducted for the fourteen Category 3 target lakes (three lakes in the 17-lake data set were Category 2 lakes, which did not require any of the 8 parameters) resulted in the use of all five well-developed significant change standards, suggesting that all assumptions made in the development of those standards were needed. However, the remaining 3 parameters (Lake Mixing/Stratification, MDC for SAV, and the Herbaceous Wetland Area) do not have well-developed significant change standards. One of these in particular, the MDC for SAV is likely to be amenable to alternative analyses with better results and fewer assumptions. The methodology is presented under Task 3.3.

Peer Review: Category 3 Lakes Page 20
3.1.c. Review of procedures 3.1.c.1. Are procedures appropriate, reasonable and based on best available information? Overall, the procedures are based on the best available data and are appropriate and reasonable. There may be additional analyses that could enhance the power of the overall procedure by adding significant change standards, and there are a few aspects of the proposed analyses that may warrant modification, but the procedure appears sound. Primary issues warranting further discussion are addressed below and in Section 3.3 of this review. Lake Mixing and Susceptibility to Sediment Resuspension As the District staff has pointed out, lake mixing and sediment resuspension are not the same. Certainly when sediments become resuspended, it can safely be said that the water column is no longer stratified with respect to temperature and dissolved oxygen, and therefore the water column is also mixed. However, destratification can occur without resuspension of sediments, and may on its own constitute a significant change to the lake. Thus there are really two issues the District is trying to address. The first is how frequently do sediments within a lake become resuspended? Secondly, how often does the lake stratify/destratify if indeed there is little or no sediment resuspension? In either case, the end result is the likelihood of nutrient and particle entrainment within the water column. As described in the paragraphs immediately below and in Section 3.3, the selection of the dynamic ratio as a measure of sediment resuspension and vertical depth profiles of dissolved oxygen and temperature for assessing stratification/destratification are reasonable. However, more development in the interpretation of the data associated with stratification/destratification (lake mixing but not necessarily accompanied by sediment resuspension), especially as related to a significant change standard, is desirable. Due to a lack of sensitivity to a cutoff standard of 0.8 for the dynamic ratio among the 14 lakes classified as Category 3 in the data set, an alternate standard was explored. An alternative standard that may deserve consideration is a more stringent one of 0.35, which corresponds to the dynamic ratio where 50% (instead of 100% at a ratio of 0.8) of the lakebed is disturbed some of the time (Bachmann et al. 2000). However, the maximum percentage of time that a 50% disturbance in the lakebed of any one of the 7 lakes in the original 36 Florida lakes studied by Bachmann et al. (2000) with dynamic ratios between 0.35 (the proposed alternate new standard) and 0.8 (the currently proposed standard by SWFWMD staff) is only 1%. This does not represent a significant difference from the originally proposed 0.8 ratio standard, which corresponds to no disturbance of the lakebed at any time. Moreover, even a 0.35 standard would not change the sensitivity problem given the ranges of dynamic ratio values calculated for the 14 Category 3 lakes in Table 4-1 of Leeper et al. (2001). It appears that most of the Category 3 lakes are deep enough with respect to their surface areas that resuspension will not be a problem between Current P10 and Current P90

Peer Review: Category 3 Lakes Page 21
elevations. There may be some minimum depth cutoff, such as 4 ft, below which resuspension may be expected independently of lake area, but this situation did not arise with the test lakes. We therefore see no reason to alter the 0.8 dynamic ratio standard as currently proposed by District staff, which was chosen based on an appropriate scientific study using Florida lakes (Bachmann et al. 2000). Species Richness District staff considered three communities (aquatic macrophytes, fish, and birds) in its search for finding the most sensitive community to lake area changes. They found that among the three communities, the bird community was the most sensitive to water surface area changes; bird species decreased at a rate of one per 15.6% decrease in lake area according to a 46-Florida lake study by Hoyer and Canfield (1994). The assumptions, methods, quality assurance, and scientific reasonableness of the Hoyer and Canfield (1994) paper, as well as the assumptions and procedures employed by the District staff in applying the regression models to Category 3 lakes, have been reviewed by three avian biologists, K.L. Bildstein, J.A. Rodgers, Jr. and J. Jackson. Independent reviewers provided opposing opinions in their assessments of the scientific integrity of the Hoyer and Canfield (1994) study, and the subsequent use of the results from that study by the District staff in setting minimum levels for Category 3 lakes. Bildstein (2001) reported that Hoyer and Canfield used the correct scientific methodology and drew the correct conclusions in their original 1994 study, and that District staff had interpreted and applied the results of that study correctly to the Category 3 lakes. On the other hand, Rodgers (2001) and Jackson (2001) stated that the Hoyer and Canfield (1994) study was too simplistic, and were pessimistic as to its utility as a basis for establishing bird species richness in Category 3 lakes. Further lack of consensus opinions on this subject were expressed in letters from the personnel in the Public Utilities Department of the City of St. Petersburg and Environmental Protection Commission of Hillsborough County. Our initial reaction coincides with many of the other government entities and both Rodgers and Jackson: a lengthier period of study (> 2 years) with more frequent sampling (monthly) on Category 3 lakes where bird species are better identified as well as other obvious habitat factors such as the slope of the lake bottom, percentage of emergent vegetation, water depth, and shoreline development would be ideal. However, there are serious technical, time and budgetary constraints that prevent such an undertaking. Below we elaborate on four types of these constraints. 1. Time Delays and Expense with Only Marginal Improvement in the Significant Change Standard Initiating a study that is greater than two years in length as suggested by some reviewers would delay the whole minimum flows rule making by more than the time period of the study once the extra time for data analysis, report writing, and peer review are considered. Such a long-term study would be expensive. The delay and expense may be justified only if there is a reasonable chance that the conclusions reached at the end of the study would be significantly different than the conclusions reached by Hoyer and

Peer Review: Category 3 Lakes Page 22
Canfield (1994). We did not discern from our reading of the reviewers’ reports that there would be a definite and significant change in the significant change standard if the study was repeated, although the possibility exists. Indeed, the more recent work by Hoyer and Canfield (2001) suggests that the 1994 study provided reliable results. In their more recent paper on a single lake that evaluated for bird richness and abundance over 5 years (Hoyer and Canfield, 2001), 76% of all bird species were observed in the first year, and those observed thereafter were usually rare in abundance. Annual variation in richness and overall abundance was not striking, although there were certainly significant variations in abundance for individual species. 2. “Best Available Science” Although some of the reviewers criticized the methodology utilized and the expertise of Hoyer and Canfield as non-ornithologists, as well as the validity of the statistics and the variance of the data, in arriving at the one species lost per 15.6% decrease in area metric, none of them suggested that there was a better study completed by the end of 2000 which should be used in place of the Hoyer and Canfield (1994) study. This means that the District staff used the best available science at the time in arriving at the significant change standard for species richness. One of the independent reviewers provided a positive review of the Hoyer and Canfield (1994) paper, clearly indicating that District staff had used the best available science in an appropriate manner in the establishment of the significant change standard for species richness. 3. Technical Merits and Robustness of the Adopted Significant Change Standard There is little argument among the reviewers that lake surface area per se is an overriding variable in determining avian species richness. This is well documented in the literature, and shows up as being the single-most important variable (r2=0.74) in accounting for species richness in the Hoyer and Canfield (1994) study. This is a highly statistically significant variable, which should not be ignored considering that the Florida lake data set from which it was derived consisted of surface areas in the same range as the Category 3 lakes (see below for more detailed discussion). Other influences, such as trophic state, proved much less influential than lake area (Hoyer and Canfield, 2001). The major controversial conclusion in the Hoyer and Canfield (1994) study is the statistic that indicates that for every 15.6% decrease in lake surface area, one bird species will be lost. This value was rounded down to 15% to establish a significant change standard. For the various reasons stated by the reviewers, this number could increase or decrease. One of the reasons for a change in this percentage is that crows, terns, and gulls were not identified by species (rather by families or sub-families). Complete separation of these families and sub-families into species would have the effect of increasing the number of total bird species on a lake, which in turn may result in a more stringent (i.e., less percentage decrease in a lake’s surface area per one decrease in bird species) significant change standard. How much of a percentage decrease would depend on how many species made up each of those families and sub-families, and how sensitive each of the species was vis-à-vis the other species within the family to water level changes. We suspect that the effect on the significant change standard would be minor, but literature review or re-analysis of existing data might be undertaken to evaluate this effect.

Peer Review: Category 3 Lakes Page 23
Moreover, a more detailed study (e.g., longer period of study, site-specific, more frequent observations) that results in a significant change standard less than 15.6% is likely to have a limited impact on the final selected MLL because there would be only minor lake level changes going from a 15% reduction in lake area from the Historical P50 to 10% or even 5%. Alternatively, the significant change standard could rise from the present 15% to a higher value as a result of more in-depth and site-specific studies. Again, an increase in 5% or 10% (to 20% or 25%) probably wouldn’t substantially affect the final selection of the MLL because the increase in the significant change standard would result in a small change in the MLL, or another of the significant change standards would replace it. 4. Considering Other Communities in the Determination of a Significant Change Standard for Species Richness There is some resistance to using bird communities rather than fish or aquatic macrophytes (more truly aquatic indicators) as the most sensitive community relative to lake area, but that is what the data support. Data for communities other than fish and macrophytes are insufficient to generate significant change standards. Alternative analyses of fish or macrophyte data might yield different results, but are not clearly preferable. Unpublished macrophyte data from University of Florida were used to determine the relationship between macrophyte species and lake surface area. The regression model depicting that relationship is provided in the District’s Draft Report (Fig. 4-4, Leeper et al., 2001). Inspection of Figure 4-4 reveals that a large range of surface areas (< 1 ha to >10,000 ha) was used in the development of the regression model. Many of these lakes therefore have surface areas that exceed the surface area of the largest lake (Big Fish Lake with HMLL and MLL corresponding to 250 and 65 ha, respectively) in the Category 3 data set. Using a regression model developed from a data set that includes lakes of larger surface areas than the typical Category 3 lake poses a risk; lakes with higher surface areas in the original data set may skew the regression slope or intercept to values that are significantly different than if the range was decreased to bracket the surface areas of the target lakes. For example, it is possible that the relationship between lake surface area and number of species loss may not be log linear at higher surface areas (e.g., 1000-10,000 ha) if the littoral zone inhabited by macrophytes represents less on a percentage basis of the total surface area than in lakes with smaller surface areas. For this Category 3 lake data set, it would be insightful to delete lakes with surface water areas that are >250 ha from the original University of Florida data set, and recalculate the regression coefficients. Then check to see whether the 30% loss of surface area still equates to the loss of one macrophyte species. Inspection of the subset of data points representing lakes <250 ha in Fig. 4-4 gives us the impression that the correlation coefficient (r-value) will decrease and the lake surface decrease necessary for the loss of one macrophyte species may be >30%, which would put the macrophyte community even further removed as the most sensitive community of the three. Nevertheless, to be scientifically certain, the deletion and subsequent recalculation exercise should be undertaken.

Peer Review: Category 3 Lakes Page 24
The same concern expressed above also applies to determining fish community sensitivity to lake level changes. The fish species richness vs. lake surface area model deployed by District staff for Category 3 lakes originated from Bachmann et al. (1996), who developed the regression relationship based on a 65-Florida lake data set. If the range of lake area is similar to that expected for future lakes for which minimum levels will be set, no action is necessary. If the range is much wider than that for expected target lakes, however, some recalculation of the regression may be in order after deletion of inapplicable lake data. However, the District included data from larger lakes in anticipation of application of this significant change standard to larger lakes in future years. While there may be classes of lakes with differing species richness vs. area regressions, the development of a single regression and associated significant change standard provides consistency and maximizes the size of the data set used to develop the regression. After considerable discussion of the benefits and drawbacks of this approach, we concur that the District has acted properly and reasonably in the development of this significant change standard, which is based on bird communities. 3.1.c.2. Do procedures incorporate all necessary factors? In general, necessary factors are incorporated, but all factors that may be useful may not have been incorporated. Section 3.3 outlines possible additional factors to be considered in the overall approach to setting minimum levels for Category 3 lakes. 3.1.c.3. Have procedures been correctly applied? Overall, application of the procedure for establishing a target water level regime for target lakes has been performed in a logical fashion with supportable results. There are, however, a few errors that should be corrected in the interest of accuracy of the supporting narrative (Leeper et al., 2001):
• In the discussion on p3-6 (1st paragraph, line 6) under Establishing Minimum and Guidance Levels for Category 1 and 2 Lakes, the “difference between the Current P10 and Current P50 is greater than…” should be changed to “difference between the Current P10 and Current P50 is less than…”.
• An apparent contradiction in setting the critical minimum elevation for the Recreation/Ski Standard occurs on pages 4-24 and 5-15. It is not clear which is correct. Perhaps lines 7-13 in the middle paragraph on p4-24 could be reworded so that they read something like: “Use of a significant change standard based on safe skiing would be appropriate for lakes with a critical minimum elevation that is higher than the Low Guidance Level, as these lakes would be considered to have historically supported skiing for at least ninety percent of the time. Use of a significant change standard based on safe-skiing for lakes with a critical minimum elevation lower than the Low Guidance would not be appropriate. Under such conditions, the standard would identify the elevation at which the lake would no longer support safe skiing for ninety percent of the time.” Still, it is uncertain as to whether it really makes a difference whether the critical minimum elevation is greater or lesser than the LGL since some of the lakes had critical minimum

Peer Review: Category 3 Lakes Page 25
elevations that were above, while others were below, the LGL. The only lake (Fairy) whose MLL depended on the Recreation/Ski Standard had a critical minimum elevation that was 31.0 ft (Recreation/Ski Standard = 32.1 – 1.1 ft for the RLWR5090), which was lower than the LGL of 31.3 ft (Table 6-26 in Leeper et al., 2001).
• The step-by-step instructions for a multiple-parameter approach for establishing MLL for Category 3 lakes are sometimes nebulous, and other times confusing. Beginning on p5-10 and ending on p5-15 in Leeper et al. (2001):
o Lake Mixing and Stratification: In Step 1, the elevation range for calculating the dynamic ratios is between the HGL and LGL. Yet in Section 6 when the dynamic ratio is being applied to different lakes, the District staff uses the Current P10 and Current P90 as the range.
o Lake Mixing and Stratification: As is written now, every Category 3 lake undergoing the establishment of a MLL would proceed to Step 2 if they have a dynamic ratio of > 0.8 (indicative of sediment resuspension) within their Current P10 and P90 ranges. Since it can be safely assumed that sediment resuspension would automatically destratify a lake, there would be no need for additional data (i.e., dissolved oxygen conentration and temperature profiles) to be collected on those lakes.
o Lake Mixing and Stratification: There is no quantitative “benchmark” provided in Step 2 for determining when stratification is significant enough to warrant examining a significant change standard for lake mixis (see discussion on Anoxic Factor presented in Section 3.3). This “benchmark” would be something analogous to what the dynamic ratio is to sediment resuspension.
o Herbaceous Wetland Coverage: There is also lack of a “benchmark” under this parameter’s instructions. In Step 2, the objective is to “identify basin elevations where change in lake stage would result in substantial change in potential wetland area.” Lack of a metric that defines when a “substantial change” occurs will limit application of this standard.
o Submersed Aquatic Vegetation Maximum Depth of Colonization: Similar to the Herbaceous Wetland Coverage immediately above, there is no guidance provided on what constitutes “substantial change in area of potentially colonized plants” in Step 4.
o Submersed Aquatic Vegetation Maximum Depth of Colonization: Steps 3 and 4 appear to be out of sequence and might be switched.
o Recreation/Ski: There’s a contradiction between the U.S Coast Guard recommendation of a ski corridor as defined as a circular area with a diameter of 418 ft and depth of at least 5 ft (p4-24 in Leeper et al., 2001) and the procedure described in Step 1 which states “…ski corridor delineated as a circular area with a radius of 418 feet.” The 1999 document from the Office of Boating Safety of the U.S. Coast Guard does not provide a diameter or radius specification for the ski area, but does describe a “skiing course” that should be at least 2000-3000 feet long with 100 feet of buffer space one either side (rectangular in shape). However, the Leeper et al. (2001) report on p4-23 cites the U.S. Coast Guard Office

Peer Review: Category 3 Lakes Page 26
of Boating and Safety (2001) as recommending that “ski corridors” be at least 200 by 2000 feet (~ 9 acres, assuming the corridors are rectangular in shape, or ~ 13 acres assuming the corridors can be delineated by a circular area). Based on the equations for determining the circumference and area of a circle, we have determined that a radius (and not a diameter) of 418 feet is correct. Thus the reference to a 418 ft diameter at the top of page 4-24 should be changed to a 418 ft radius. At the same time, it may be possible to fit a ski area into a lake with having an available radius of 418 ft, simply by changing the shape of the ski area. Some provision for this exception appears to be needed.
o Recreation/Ski: It seems unnecessary to proceed to Step 5 if, under Step 1, the basin does not contain enough area to develop a Recreation/Ski Standard.
o Recreation/Ski: It seems unnecessary to make a distinction in Step 3 of comparing the critical minimum elevation to the LGL when the implementation of the Recreation/Ski Standard to the Category 3 lakes in Section 6 included lakes where some had critical minimum elevations that were above, while others were below, the LGL. See discussion above.
• Big Fish Lake, p6-6, lists the HGL= current P10, when it should be the CP. Tables 6-1 and 6-2 correctly list the HGL as the CP elevation, so this error did not impact the establishment of water levels.
• Lake Calm, p6-18, 1st paragraph, line 13. Historic P50 elevation should be changed to High Guidance Level.
• Church and Echo Lakes, p6-32&33. The CP chosen for No. 3 (=33.75 ft. NGVD), is not the high point in the channel (No. 2), which has an elevation of 34.92 ft. NGVD. Several other issues with choice of CP elevation have been noted, and it seems preferable to set the CP at the elevation of an actual structure, not a high point in a channel that may be created by temporary sediment accumulation. This may account for some of the CP elevations given, but requires documentation.
• Crenshaw Lake, p6-43, either the recreational/ski standard of 55.1 ft NGVD is incorrect or the procedure incorrectly applies the dock standard of 53.45 ft NGVD as the significant change standard from which the MLL is established. It appears from the available data that the recreation/ski standard should have been 50.1 ft NGVD, so the choice of the dock standard in setting the MLL appears correct.
• Fairy Lake, p6-66, Historic P50 is calculated as HGL-RLWR50 for the North Tampa Bay RLWR, which is 1.1 ft. However, the difference between the current P10 and the current P50 is 1.06 ft, and should be used to determine the Historic P50 according to the flow chart on p5-19. This results in an error in the Historic P50 of only 0.04 ft, but it does appear to be an error.
• Fairy Lake, p6-68. The CP chosen was No. 3 (=32.18 ft. NGVD), and not No. 1, which is higher (=33.0 ft. NGVD) and closer to the lake. (See note for Church and Echo Lakes above).
• Lake Raleigh, p6-105, 1st paragraph, lines 3 and 4. The Recreation/Ski Standard is not lower than the Historic P50 elevation as stated (see Table 6-45 on p6-107).

Peer Review: Category 3 Lakes Page 27
• Round Lake, p6-128, 1st paragraph, line 3. The period of record shown in Fig. 6-58 indicates that the period of record is from January 1974 through July 1982 (and not July 1996).
Each of these points of confusion has been discussed with District staff, and even though the staff was in agreement with our findings, we retained this section in the final report since the raised issues were contained in the original draft report that we were charged to review. The resolution of the CP elevation discrepancies is pending until a resurvey can be completed by the District engineers. 3.1.c.4. Have limitations and imprecisions in the information been handled reasonably? Limitations and imprecisions appear to be handled reasonably. Reasons for rejecting various possible regulatory water levels have been stated and the reporting format provides sufficient supporting information to allow independent review and consideration. The precise elevations established by the procedure may be subject to some debate, as there is variability in most measurements and no analysis of uncertainty has been provided. However, any change in results is not likely to involve a large change in any regulatory water level. Applied significant change standards tend to reflect a definite loss of use or impact to the resource, not fine gradations of use impairment or impact. One imprecision over which concern has been raised in discussion with interested parties is the RLWR applied when appropriate historic water level data for a target lake is lacking. This was a concern for the Peer Review Panel considering Category 1 and 2 lakes as well. That panel concluded that the chosen RLWR for North Tampa Bay area lakes was reasonable, but might be improved with additional data and subdivision into additional lake categories (mostly by geographic grouping). The same criticism applies to the Category 3 lakes, with possible subdivision based on whether or not a lake is isolated from other lakes in terms of surficial hydrologic connection. We will examine this potential modification in Section 3.3, but it is not clearly better than the chosen approach. The additional concern about RLWR raised during the deliberations of the Category 3 lakes panel is that development in the watersheds of target lakes may have altered the RLWR by increasing hydrologic variability, a common impact of development. Several reports prepared for the City of St. Petersburg (Emery, 1992; Leggette, Brashears & Graham, 1995) support this contention. It was suggested that the maximum P10-P50 and P10-P90 values might be applied instead of the mean for reference lakes. This might provide some correction for variability induced by development, but would eliminate the use of central tendency that minimizes the impact of measurement imprecision. Such an approach would not clearly be superior to that applied, but might be an option with further investigation. Alternatively, lake-specific data might be used to generate a RLWR for each target lake. This would involve assessing variability within the context of all existing impacts on lake

Peer Review: Category 3 Lakes Page 28
level, including development, drought, structural alteration of outlets, and withdrawals. Again, this might correct for development impacts, but would also reflect other impacts and introduce other sources of imprecision and error. As recent data would be used to incorporate development impacts, and since the period of 1989 to 2001 is among the driest on record in Florida, RLWRs generated in this manner would not necessarily be any more representative of the true RLWR than the chosen approach. It might be worthwhile to examine water level data for lakes with long-term records to see if various influences could be quantified, but this approach is not possible for all lakes and would involve extrapolation for use at other lakes that is functionally no different than that applied in the chosen approach. 3.1.c.5. Are procedures repeatable? The procedures are repeatable, and although repetitive data collection and analyses might lead to changes in assigned regulatory water levels, expected changes would be small unless specified assumptions were altered. 3.1.c.6. Are conclusions from the procedures supported by the data? Except where reporting or calculation errors were encountered, the conclusions from the procedure are generally supported by the data. The Peer Review Panel cites a number of concerns over the development of significant change standards, but based on what the District has established, the conclusions are supported. There could be some concern that the MLL is being set too low in many of the target lakes, as current data were used to establish the water level regime upon which other analyses depend, but the data do support the conclusions. At issue is whether it is sufficient to “hold the line” on further decreases in water level, or if it is necessary to increase the water level in the target lakes to restore historic conditions. Only 3 of 14 lakes subjected to the procedure are assigned MLL values substantially above what occurs now in those lakes, yet the water level data provided for nearly all lakes show wider variability in water level than considered natural for this area and many show downward trends in lake level over the period of record. Further degradation will be prevented through the use of the proposed procedure, but restorative mandates appear few. This moves into the area of determining the baseline from which significant harm (or change) is to established, and is outside the scope for this evaluation (it is one of the “givens” for this review). 3.2 Evaluation of the Deficiencies Most of the procedures do not contain deficiencies, and most potential adjustments constitute additional or preferred analyses that increase the power of the procedure or address shortcomings that are not fatal flaws in the overall approach. 3.2.a. What scientific deficiencies exist and what errors are introduced? The scientific deficiencies of concern relate mainly to establishing quantitative significant change standards. This is a difficult process and the District is to be commended for its

Peer Review: Category 3 Lakes Page 29
efforts to develop defensible standards. Only one significant change standard was applied to Category 1 and 2 lakes: impact to cypress. The absence of dominant cypress stands around Category 3 lakes necessitated alternative measures, and this places the District on the cutting edge of biological impact assessment for lakes. This effort and situation not withstanding, enhancement of the scientific basis of some significant change standards is desired. At least two (Herbaceous Wetland Area [HWA] and Maximum Depth of Colonization [MDC] for Submergent Aquatic Vegetation [SAV]) of the suggested 8 parameters suffer from a lack of sensitivity in that they never appear as a quantitative measure in determining the MLL of any of the fourteen Category 3 lakes. This is because there is no guidance provided as to what corresponds to a “substantial change in potential wetland or SAV colonization area.” In effect, significant change standards cannot be calculated for these two parameters as long as a critical minimum or maximum coverage is not specified. Consequently, these two parameters have been relegated to a “second-tier” status behind the other 6 parameters that have quantitative significant change standards associated with them. The outcome of this approach is invariably a sentence near the end of the Summary of Data and Analyses Supporting Minimum and Guidance Levels section for each of the fourteen Category 3 lakes that reads: “Changes in potential herbaceous wetland area and area of potential aquatic macrophyte colonization with lake stage also did not indicate that use of any of the identified standards would be inappropriate.” Without a defined significant change standard for these plant parameters, their importance and use in defining MLL will be based on only a subjective interpretation of the data. From what has been provided in Leeper et al. (2001), this subjective and arbitrary interpretation results in a minor to negligible role played by these plant communities. Yet there are some apparent significant quantitative changes associated with water level changes in some of the Category 3 lakes. For example, the HWA at the Historic P50 elevation and LGL for Big Fish Lake is ~ 175 and ~ 100 acres, respectively (Fig. 6-7 in Leeper et al., 2001). This represents a loss of ~ 75 acres, or 43% of the HWA at the Historic P50 elevation, which is probably a significant change to most aquatic biologists and limnologists. Changes in the HWA appear to be around 25-30% between the Historic P50 and LGL elevations (Fig. 6-69 in Leeper et al., 2001) in Starvation Lake. Both Cypress Lake and Lake Raleigh have HWA and SAV coverage shifts that approximate a 20% change. These analyses indicate that there are substantial changes in the coverage of Herbaceous Wetlands and SAV with decreasing water elevations in some of the Category 3 lakes, but without some definition of what constitutes a significant change, no weight is assigned to these changes in the establishment of MLLs. The most logical source of support for a quantitative SAV standard might be its relation to the fish community or fish populations of particular interest. Unfortunately, the most relevant research (Canfield and Hoyer, 1992) suggests that there is no major shift in bass population features over the range of 10 to 85% SAV coverage. An alternative approach to developing a significant change standard for SAV is clearly needed.

Peer Review: Category 3 Lakes Page 30
Another scientific deficiency in the establishment of significant change standards relates to the aesthetic standard. The current approach assumes that a reduction in the P50 to the LGL would be perceived by human lake users as an aesthetic impairment. We concur, but submit that user perception surveys might provide a more accurate appraisal of acceptable change in water level. Such surveys have been successfully applied to determination of the acceptable level of change in water clarity (Smeltzer and Heiskary 1990) and appear applicable to determining the acceptability of water level changes. As such surveys have not previously been conducted, and require time and financial resources, the District acted reasonably in establishing the aesthetic significant change standard as it did. However, user perception surveys are recommended as a means to improve this standard. Additionally, the establishment of the recreation/ski significant change standard depends upon fitting a minimum circular area with a minimum depth into the lake, and presumes no impact as long as one such area can be fitted into the lake. If a lake that supports 20 waterskiers at once is reduced in area to the point that only one waterskier can be safely accommodated, most users would perceive an impact. Alternatively, waterskiing may still be accommodated by a linear path or other shape even if the minimum circular area (radius = 418 ft) does not fit in the lake at a reduced water level. The chosen approach relies on complete elimination of a use before an impact is declared, and may not apply the most appropriate measure of use impairment. The oversimplification of the measurement of impact on recreation/skiing can be corrected only by a more complicated procedure, but enhancement of this significant change standard is possible. 3.2.b. Can the deficiencies be remedied? Yes, if we consider them to be actual deficiencies. These are addressed mainly in Section 3.3 of this review, and include application of significant change standards that place the MLL above the Historic P50, enhancing the aesthetic, recreation/ski and stratification standards, and development of significant change standards for herbaceous wetland area and submergent aquatic vegetation. 3.2.c. How would any remedies be applied, what is the precision and accuracy of the adjusted procedure, and what level of effort is necessary to apply it? Most adjustments are intended to increase the power of the procedure, not to be essential remedies for deficiencies. As such, their value must be carefully weighed against the effort necessary to apply them. More detail is provided in Section 3.3. 3.2.d. If deficiencies cannot be remedied, what alternative methods might be applied? See Section 3.3 for suggested improvements.

Peer Review: Category 3 Lakes Page 31
3.3 Evaluation of Alternative Methods There are several supplementary analyses that may be preferable to existing analyses or may be worthwhile to add to the proposed approach. These proposed supplementary analyses and the level of effort necessary to collect data and apply them are discussed below. Several issues warrant further discussion as relates to adjusting the proposed procedure for maximum applicability to the range of target lakes envisioned and most effective and defensible establishment of minimum lake levels. These include:
• Setting the MLL equal to the Historic P50 without any further use of significant change standards
• Discarding significant change standards if the resulting MLL is higher than the Historic P50
• Alternative use of significant change standards: averages and medians • Additional steps for establishing a significant change standard that indicates
trophic state changes • Development of a significant change standard for stratified lakes • Development of a significant change standard for the maximum depth of
colonization (MDC) for submergent aquatic vegetation (SAV) • Development of a significant change standard for Herbaceous Wetland Area
(HWA) • Recreation/ski significant change standard enhancement • Aesthetic significant change standard enhancement • Possible benthic invertebrate significant change standard • Consideration of septic system influences • Adjustment of the Reference Lake Water Regime (RLWR)
3.3.a. Setting the MLL equal to the Historic P50 without any further use of significant change standards Since these Category 3 lakes do not have a historical record, the “Historic” P50 is determined from the HGL minus the RLWR50. “Historic” should not be construed to mean “based on historic data” in such cases, but is rather an approximation of conditions that would be expected to exist in the absence of influence from withdrawals. Such conditions may indeed differ substantially from true historic conditions. The first lettered column (A) in Table 2 represents the difference between the Normal Pool (NP ~ Historic P10) as determined by the hydrologic indicators and the HGL as determined by either the CP, Current P10, or the NP. The 1.4 ft mean difference represents the average reduction in lake level at the P10 elevation due to “current conditions” (i.e., surface runoff diversion, structural alterations, and groundwater withdrawal). This is the “handicap” that the lakes have sustained from previous manipulations within the lake and its watershed.

Peer Review: Category 3 Lakes Page 32
Table 2. Comparison of the elevational differences among different proposed methods in establishing the Minimum Lake Level for Category 3 lakes.
Lake HGL Ref. Pt.
NP - HGL(ft)
A
Dist. MLL (ft)
Determining Parameter
Hist P50 (ft)
Hist P50 – Dist. MLL (ft)
B
Hist P50 – Dist.
MLL* (ft)
C
Mean of Significant Parameters
(ft)
D
Dist. MLL – Mean of
Sign. Para. (ft)
E
Hist P50 –
Mean of Sign. Para. (ft)
F
Big Fish CP 0.4 73.05 Sp. Richness 73.45 0.4 0.4 74.5 - 1.4 - 1.1 Calm CP 1.9 47.31 Aesthetics 48.41 1.1 1.1 45.3 2.0 3.1 Church/Echo** CurrP10 2.2 33.54 Aesthetics 34.64 1.1 1.1 33.0 0.5 1.7 Crenshaw CurrP10 1.9 53.45 Dock-Use 54.52 1.1 1.1 53.3 0.2 1.2 Cypress CP 2.5 46.75 Aesthetics 47.85 1.1 1.1 47.2 - 0.4 0.7 Fairy CurrP10 1.9 32.10 Ski 32.42 0.3 0.3 31.0 1.1 1.4 Helen/Ellen/ Barbara CurrP10 1.9 52.10 Basin
Connec. 52.37 0.3 0.3 51.4 0.7 1.0
Raleigh** NP 0.0 42.82 Aesthetics 43.92 1.1 1.1 42.1 0.7 1.8 Rogers** NP 0.0 42.82 Aesthetics 43.92 1.1 0.0 39.4 3.4 4.5 Round** CurrP10 1.7 53.26 Dock-Use 53.42 0.2 0.0 52.6 0.7 0.8 Starvation CP 0.6 50.65 Sp. Richness 51.72 1.1 1.1 50.7 - 0.1 1.0 Mean 1.4 0.8 0.7 0.7 1.5 S. D. 0.9 0.4 0.5 1.25 1.4
* Lakes Rogers and Round are defaulted to zero because they are the only two lakes in the data set that do not have any of their Significant Change Standards above the Hist P50. ** Category 3 Lakes considered to be more hydraulically “isolated” compared to those which are more “flow-through”.
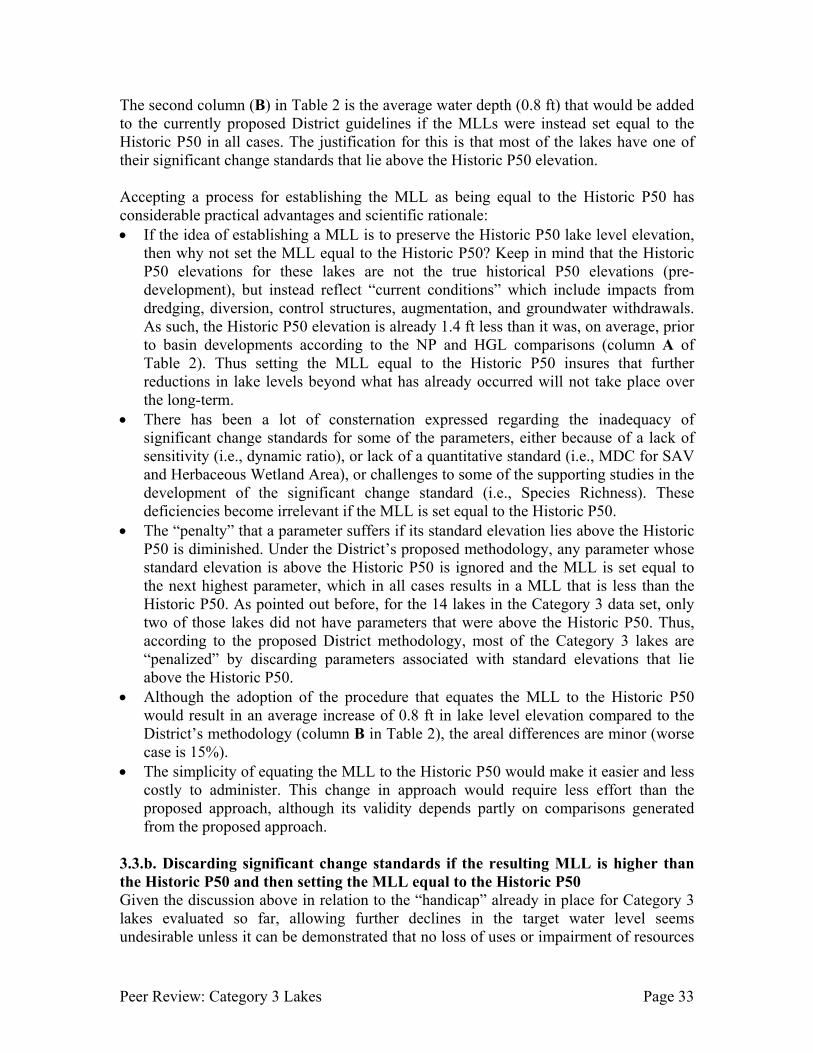
Peer Review: Category 3 Lakes Page 33
The second column (B) in Table 2 is the average water depth (0.8 ft) that would be added to the currently proposed District guidelines if the MLLs were instead set equal to the Historic P50 in all cases. The justification for this is that most of the lakes have one of their significant change standards that lie above the Historic P50 elevation. Accepting a process for establishing the MLL as being equal to the Historic P50 has considerable practical advantages and scientific rationale: • If the idea of establishing a MLL is to preserve the Historic P50 lake level elevation,
then why not set the MLL equal to the Historic P50? Keep in mind that the Historic P50 elevations for these lakes are not the true historical P50 elevations (pre-development), but instead reflect “current conditions” which include impacts from dredging, diversion, control structures, augmentation, and groundwater withdrawals. As such, the Historic P50 elevation is already 1.4 ft less than it was, on average, prior to basin developments according to the NP and HGL comparisons (column A of Table 2). Thus setting the MLL equal to the Historic P50 insures that further reductions in lake levels beyond what has already occurred will not take place over the long-term.
• There has been a lot of consternation expressed regarding the inadequacy of significant change standards for some of the parameters, either because of a lack of sensitivity (i.e., dynamic ratio), or lack of a quantitative standard (i.e., MDC for SAV and Herbaceous Wetland Area), or challenges to some of the supporting studies in the development of the significant change standard (i.e., Species Richness). These deficiencies become irrelevant if the MLL is set equal to the Historic P50.
• The “penalty” that a parameter suffers if its standard elevation lies above the Historic P50 is diminished. Under the District’s proposed methodology, any parameter whose standard elevation is above the Historic P50 is ignored and the MLL is set equal to the next highest parameter, which in all cases results in a MLL that is less than the Historic P50. As pointed out before, for the 14 lakes in the Category 3 data set, only two of those lakes did not have parameters that were above the Historic P50. Thus, according to the proposed District methodology, most of the Category 3 lakes are “penalized” by discarding parameters associated with standard elevations that lie above the Historic P50.
• Although the adoption of the procedure that equates the MLL to the Historic P50 would result in an average increase of 0.8 ft in lake level elevation compared to the District’s methodology (column B in Table 2), the areal differences are minor (worse case is 15%).
• The simplicity of equating the MLL to the Historic P50 would make it easier and less costly to administer. This change in approach would require less effort than the proposed approach, although its validity depends partly on comparisons generated from the proposed approach.
3.3.b. Discarding significant change standards if the resulting MLL is higher than the Historic P50 and then setting the MLL equal to the Historic P50 Given the discussion above in relation to the “handicap” already in place for Category 3 lakes evaluated so far, allowing further declines in the target water level seems undesirable unless it can be demonstrated that no loss of uses or impairment of resources

Peer Review: Category 3 Lakes Page 34
occurs. Wherever a significant change standard results in a target MLL higher than the Historic P50, discarding that standard completely results in a loss of utility and probable impairment. This is counter to the purpose of setting MLLs. The case has been made that setting the MLL higher than the Historic P50 may not be defensible, but we are not convinced that any parameter that causes the MLL to be set higher than the Historic P50 should be discarded. Rather, it seems appropriate to set the MLL equal to the Historic P50 in such cases, maintaining the use or avoiding impairment to the extent possible while not setting an MLL higher than the Historic P50. The result is not greatly different than setting the MLL at the Historic P50 in all cases, from an overall perspective. Column (C) in Table 2 is the same as column B except that values for the two lakes (Rogers and Round) which do not have any of their significant change standards indicating a MLL above the “Historic” P50 elevation are set equal to zero, since they would have MLL set equal to the District’s current MLL elevation under the currently proposed District procedure. Doing this results in only a slight decrease (0.1 ft) in the average elevation of the MLL compared to setting the MLL at the Historic P50 for all the lakes. The difference is substantial for only one (L. Rogers) of those two lakes. Since the focus of the MLL is to maintain uses and resources, it seems fair to allow a decrease in the MLL below the Historic P50 when no significant change standards are exceeded by that MLL. If, however, any parameter in the multi-parameter approach suggests a MLL higher than the Historic P50, setting the MLL equal to the Historic P50 appears appropriate. This change in approach requires no additional effort. 3.3.c. Alternative use of significant change standards: averages and medians Still another approach would be to average all the standard elevations attributed to a single lake (column D in Table 2). If this was done, the net result would be an appreciable reduction (mean of 0.7 ft) in the MLL for most of the lakes as compared to the District’s proposed methodology (column E in Table 2). It would be even a larger decrease (1.5 ft) compared to the Historic P50 (column F in Table 2). It is not a consistent decrease, however, and exhibits no pattern that suggests there is any bias in the District’s proposed methodology. The same general pattern of MLLs applies to using the median of all elevations derived from all applicable parameters (Table 3), but most differences are smaller. There is some merit to using the median instead of the mean, as there is no clear indication that the values for any lake are normally distributed. In that case, the change in MLL from that proposed by the District is minimal (<0.1 ft) for 5 lakes and large (>1.0 ft) for only 2 lakes. If the purpose of setting a MLL is to protect uses and resources, taking an average or median serves no useful purpose. Measures of central tendency are appropriate when all the values being averaged have a reasonable probability of approximating the same “true” value. The up to eight different parameters applied in the District’s approach are not expected to yield identical results for any lake, and the use of eight parameters is an acknowledgement that different features may be the most sensitive at different lakes.

Peer Review: Category 3 Lakes Page 35
Table 3. Differences between MLLs calculated by proposed District methodology and either the mean or median of all parameter values.
Lake
Dist. MLL-Mean MLL (ft.)
Dist. MLL-Median MLL (ft.)
Big Fish -1.45 0 Calm +2.73 +2.86 Church/Echo +0.57 +0.21 Crenshaw +0.17 +0.01 Cypress -0.42 0 Fairy +1.07 +0.78 Helen/Ellen/ Barbara +0.72 +0.41
Raleigh +0.69 +0.41 Rogers +3.44 +2.61 Round +0.64 +0.02 Starvation -0.10 +0.01
The approach of establishing the MLL as an average or median of the elevations for all parameters that apply to a lake is not recommended because of the following two reasons: • Lake uses and biotic integrity are likely to be compromised. Some significant change
standards will have corresponding lake level elevations above the MLL as determined by average or median. For example, Lake Rogers would have a MLL that is 3.4 ft lower (at 39.42 NGVD) than the currently District-proposed MLL at 42.82 ft (NGVD) if an average MLL was applied. This would result in a violation of the Species Richness standard since its elevation is set at 40.00 ft elevation (NGVD) for the lake. Likewise for Fairy Lake, the Aesthetic standard would be affected since it lies at 31.32 ft (NGVD), which is between the District’s proposed MLL of 32.1 ft (NGVD) and the MLL elevation based on an average of all the pertinent parameters (31.0 ft NGVD).
• Acceptance of any method that yields a lower MLL than the one currently proposed by the District would result in an even further departure from the Historic P50 elevation, which by definition is supposed to approximate the MLL.
3.3.d. Additional steps for establishing a significant change standard that indicates trophic state changes As noted in the District’s proposed plan (Leeper et al., 2001) and in discussion at the August 2001 public meeting, there is interest in incorporating one or more measures of impact on trophic state into the multi-parametric approach for determining MLL and related water levels. This has proved difficult, but several options are explored here.
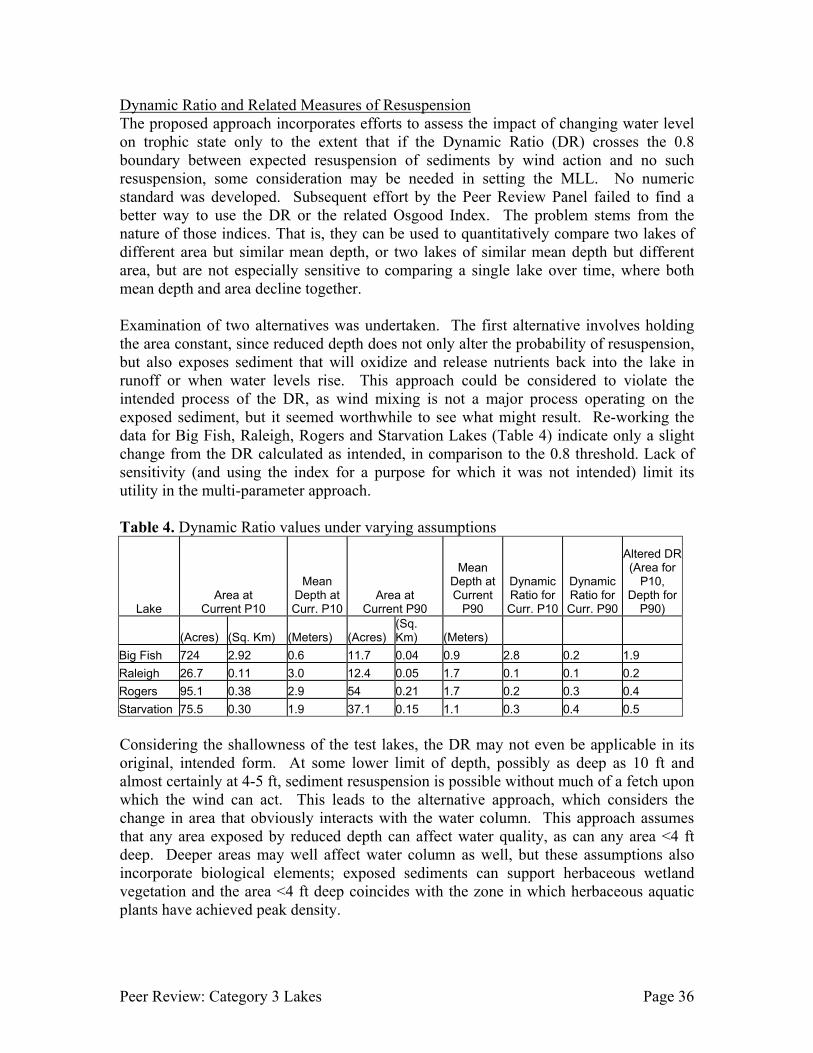
Peer Review: Category 3 Lakes Page 36
Dynamic Ratio and Related Measures of Resuspension The proposed approach incorporates efforts to assess the impact of changing water level on trophic state only to the extent that if the Dynamic Ratio (DR) crosses the 0.8 boundary between expected resuspension of sediments by wind action and no such resuspension, some consideration may be needed in setting the MLL. No numeric standard was developed. Subsequent effort by the Peer Review Panel failed to find a better way to use the DR or the related Osgood Index. The problem stems from the nature of those indices. That is, they can be used to quantitatively compare two lakes of different area but similar mean depth, or two lakes of similar mean depth but different area, but are not especially sensitive to comparing a single lake over time, where both mean depth and area decline together. Examination of two alternatives was undertaken. The first alternative involves holding the area constant, since reduced depth does not only alter the probability of resuspension, but also exposes sediment that will oxidize and release nutrients back into the lake in runoff or when water levels rise. This approach could be considered to violate the intended process of the DR, as wind mixing is not a major process operating on the exposed sediment, but it seemed worthwhile to see what might result. Re-working the data for Big Fish, Raleigh, Rogers and Starvation Lakes (Table 4) indicate only a slight change from the DR calculated as intended, in comparison to the 0.8 threshold. Lack of sensitivity (and using the index for a purpose for which it was not intended) limit its utility in the multi-parameter approach. Table 4. Dynamic Ratio values under varying assumptions
Lake Area at
Current P10
Mean Depth at Curr. P10
Area at Current P90
Mean Depth at Current
P90
DynamicRatio for Curr. P10
Dynamic Ratio for Curr. P90
Altered DR(Area for
P10, Depth for
P90)
(Acres) (Sq. Km) (Meters) (Acres) (Sq. Km) (Meters)
Big Fish 724 2.92 0.6 11.7 0.04 0.9 2.8 0.2 1.9 Raleigh 26.7 0.11 3.0 12.4 0.05 1.7 0.1 0.1 0.2 Rogers 95.1 0.38 2.9 54 0.21 1.7 0.2 0.3 0.4 Starvation 75.5 0.30 1.9 37.1 0.15 1.1 0.3 0.4 0.5 Considering the shallowness of the test lakes, the DR may not even be applicable in its original, intended form. At some lower limit of depth, possibly as deep as 10 ft and almost certainly at 4-5 ft, sediment resuspension is possible without much of a fetch upon which the wind can act. This leads to the alternative approach, which considers the change in area that obviously interacts with the water column. This approach assumes that any area exposed by reduced depth can affect water quality, as can any area <4 ft deep. Deeper areas may well affect water column as well, but these assumptions also incorporate biological elements; exposed sediments can support herbaceous wetland vegetation and the area <4 ft deep coincides with the zone in which herbaceous aquatic plants have achieved peak density.

Peer Review: Category 3 Lakes Page 37
The premise is that as depth is reduced, exposed area increases and the area <4 ft deep will change in accordance with bathymetry. If the area <4 ft deep declines, there may be no major change in the area of obvious interaction between sediment and water quality. If the area <4 ft deep is similar to or greater than what it was at the higher water elevation, the area of obvious interaction will increase and trophic state may be affected. The starting point would logically be the Historic P50, representing the long-term average water level. The key to such a significant change indicator is the selection of a percentage change in the size of this area of interaction that represents an unacceptable (or significant) alteration. No clear guidance could be found, but it seems logical that an increase of 10-20% could have a detectable effect on water quality. With a starting point of the Historic P50, an acceptable change of 15% would make this index identical to the species richness parameter for birds. At least the bird richness parameter had some empirical support, and it was criticized for lack of rigor. Without some form of empirical support for the postulated impact of changing water level on interaction between sediments and the water column, this approach offers no improvement over the species richness parameter and does not appear useful. Empirical Trophic State Models Empirically developed models of the relationship between loading of nutrients (especially phosphorus) and in-lake concentrations have been used to project the impact of changing land use or water management on trophic conditions. Application to the test lakes in complete form would require a loading analysis that some might consider onerous and others might consider inadequate, but it may be possible to apply the models without an accurate appraisal of loading. The intent would be to establish a representation of the phosphorus status at the Historic P50, then to evaluate the percent change at a lower MLL. The significant change threshold for this approach would logically be on the order of 10-20%, based on visibly perceptible changes in algal density or water clarity. It should be noted that response to a change in phosphorus concentration is likely to be visible only at lower phosphorus levels and corresponding higher water clarity, but the high clarity of target lakes viewed in August 2001 suggests that such an approach may be applicable. Some states apply numerical change standards (e.g., Maine, with mostly very clear lakes, allows no more than a 1 ppb increase in P concentration), but there may be no clear basis for such a standard in FL. To apply this approach, some data are needed and several assumptions must be made: • Initial P load: The models allow the load to be predicted from in-lake concentrations,
a readily acquired measure that may already be available for many lakes, given Florida’s extensive LakeWatch program. These data are not in the possession of the Panel at this time, however, so we will assume several hypothetical in-lake levels for example purposes.
• Initial hydraulic load: The flushing rate is an important variable in most models, and the quantity of incoming water can be estimated from the watershed area multiplied

Peer Review: Category 3 Lakes Page 38
by a water yield coefficient. We will assume a yield of 1 cubic foot per second per square mile of watershed (1 csm) for example purposes.
• Mean depth: This can be derived from the available bathymetric data for each lake, simply expressed as volume divided by area.
• Future P load: Although load may change with altered inflow, it will be assumed that the P load is constant. This may be a very weak assumption for lakes for which the source of water and nutrients is the same.
• Future hydraulic load: If the water level declines as a function of direct withdrawal, the hydraulic load may not be altered. However, it is assumed that water level will decline as a function of withdrawals from outside the lake, leading to decreased inflow. That decrease in inflow will be estimated as the percentage decrease in lake volume.
A spreadsheet model was applied to test this approach. The process proceeded as follows: • The needed data for the Historic P50 condition (P concentration, watershed area, lake
area and volume) were entered into Part 1 of the model (which applies two separate empirical models), resulting in a calculation of the initial P load (in Part 2 of the model) necessary to achieve the observed in-lake P concentration.
• The estimated load was entered into Part 1 of the model to yield an estimate of the P concentration in Part 2 of the model. The actual and predicted P concentrations should be the same, but rounding error can result in small differences.
• The area and volume for the new (reduced) water level were entered into Part 3 of the model, yielding an estimate of the new P concentration.
• Initial and new P concentrations were compared. Examples have been run for the Historic P50 vs. the Current P50 and the Current P90 for selected lakes (Table 5, including all test lakes for which sufficient data were provided). Table 5. Predicted change in phosphorus concentration with water level change
Lake Elev. Difference (Historic-Current
P50)
% P Change
Elev. Difference (Hist. P50-Curr. P90)
% P Change
Big Fish 1.36 9.1 5.84 518 Calm 0.89 15.8 3.38 37 Church/Echo 0.91 10.0 3.82 30 Crenshaw 1.02 0.0 3.83 30 Cypress 1.20 0.0 3.52 5 Helen/Ellen/Barb 0.96 10.5 2.55 26 Starvation 0.22 10.0 6.06 65

Peer Review: Category 3 Lakes Page 39
Over the range of Current P50 to Current P90, the change in phosphorus concentration and associated trophic status is substantial for most lakes. Not all are affected in the same manner, as changing depth, area and volume vary among these lakes, but this approach is sensitive enough to detect potentially significant changes in trophic status over the range of water levels likely to be observed. Choosing a significant change standard would be less subjective if a target value was selected, such as a P concentration of no larger than 20 ppb, or water clarity of 2 m as measured by Secchi disk. The model has an accompanying set of calculations that evaluate average and maximum chlorophyll and Secchi transparency as well as estimating P concentration. If the lake P concentration is already >20 ppb, perhaps no change from the actual P concentration or that calculated for the Historic P50 should be allowed. This would be especially true if the lake was listed on the Section 303D list. Using an actual or calculated Secchi transparency could be useful, as it ties lake condition to lake uses (a contact recreation standard for water clarity in FL would be helpful). Alternatively, setting some reasonable percent change in P concentration that will be allowed as a function of declining water level could work, if such a limit can be agreed upon. It is generally suggested that a 20% change in loading will result in an observable change in lake condition, while some changes may be detectable with a 10% shift. This method has merit, but does rely on assumptions that have not been tested thoroughly or even sufficiently. The assumption that the load of phosphorus will remain constant with a decreased water load is especially troublesome. Inspection of several of the target Category 3 lakes at very low water levels suggested no algal blooms in August 2001, and water clarity was quite high in virtually all cases. If reduced water input translates into reduced load, there may not be a major trophic state impact from changing water level due to reduced water inputs. Additionally, the starting values in the model are important to the outcome. Assumption of a proportional outcome with a proportional change in any variable was not upheld when the starting phosphorus concentration was changed from 20 ppb to 40 ppb (Table 6). Consequently, this approach would appear to have validity only if used with accurate, system-specific data. This would require a major effort for each lake, as not all necessary data are readily available. While this may be a useful avenue for future research and application, it is not a realistic addition to the multi-parameter method at this time.

Peer Review: Category 3 Lakes Page 40
Table 6. Predicted change in phosphorus concentration with water level change under different initial phosphorus concentrations
Lake Elev. Difference (Historic-Current P50)
% P change at initial P = 20 ppb
% P change at initial P = 40 ppb
Big Fish 1.36 9.1 20.0 Calm 0.89 15.8 5.0 Church/Echo 0.91 10.0 8.0 Crenshaw 1.02 0.0 0.0 Cypress 1.20 0.0 3.0 Helen/Ellen/Barb 0.96 10.5 2.0 Starvation 0.22 10.0 10.0
3.3.e Development of a significant change standard for stratified lakes There appears to be a lack of a metric for developing a change standard for those lakes where the dynamic ratio is less than 0.8 between the HGL and LGL (indicating insignificant resuspension), but do produce stable patterns of thermal stratification as evident from depth profiles of water column temperature and dissolved oxygen concentration during summer months (see p5-10 in Leeper et al., 2001). Under such a regimen, direct resuspension of nutrient-enriched sediments and porewaters into the water column is not likely to be significant. However, there still exists the potential for release of nutrients from sediments into anaerobic hypolimnetic bottom waters, which would readily be entrained in the water column during destratification. There are several published indexes that should be explored by the District staff as possibly being suitable to incorporate as part of their multi-parameter assessment. One of these “anoxic” indexes could be used individually, or more appropriately, in combination with the dynamic ratio. The first index (Osgood 1988) is simply the reciprocol (the mean depth in meters divided by the square root of the lake surface area in km2) of the Dynamic Ratio. Osgood (1988) found that this ratio was closely correlated with the fraction of lake volume involved in mixis and the duration of summertime mixis. More polymictic lakes (z/Ao
0.5≈5 and less) had a summertime increase in total P if internal P supplies are important compared to dimictic lakes (z/Ao
0.5≈7 and higher). It is interesting to compare the ratio proposed by Osgood (1988) with the Dynamic Ratio, both expressed in the Dynamic Ratio form (Ao
0.5/z). Whereas Bachmann et al. (2000) reported a dynamic ratio of greater than 0.8 as indicative of sediment resuspension, the reciprocal of the Osgood ratio for polymictic lakes is 0.2 or less. Thus, the standard derived by Bachmann et al. (2000), which is required for sediment resuspension, is nearly four times higher than the criterion set forth by Osgood (1984) for lakes that mix frequently from thermal destratification or less intensive wind energies.
Peer Review: Category 3 Lakes Page 41
Another index to seriously consider is the Anoxic Factor (AF), which quantitatively summarizes the extent and duration of anoxia in stratified lakes (Nürnberg 1995). It is a ratio that represents the number of days in a year or season that a sediment area equal to the lake surface area is anoxic (units of days/year or days/season):
o
n
1iii
A
atAF
∑=
⋅=
This index has several important features (Nürnberg 1995):
• Gives a quantitative measure of hypolimnetic anoxia in stratified lakes that is comparable across lakes of different sizes since it is corrected for lake surface area.
• It is a useful indicator of sediment related trophic processes besides anoxia, such as processes like P and Fe release that require reduced sediment surfaces.
• Sensitive to small, but deep lakes that are oligotrophic to mesotrophic where anoxia would not be expected to be extensive or frequent.
• It has been reported to be significantly negatively correlated with the number of fish species in small Canadian lakes
Since the guidelines presented in Leeper et al. (2001) state in the event that the dynamic ratio does not change or changes from ≥0.8 to <0.8 with a change in elevation bounded by the Current P10 and P90 elevations, dissolved oxygen and temperature profiles will be gathered. Such an action guideline would yield the necessary data to construct AF, and no additional field costs or monitoring would be required. Choosing a significant change standard for AF could be done by regressing the AF against the lake area for those lakes within the District’s boundaries that were included in the monitoring program. 3.3.f. Development of a significant change standard for the maximum depth of colonization (MDC) for submerged aquatic vegetation (SAV) We consider this parameter to be a very important one in the 8-member suite of parameters used to set MLL because SAV:
• provides a critical habitat for fish • serves as a food source for waterfowl • is important in nutrient recycling, sediment stability, and water turbidity • is sensitive to water quality changes
Although all of the four above reasons are important in themselves, it is the sensitivity of SAV to water quality changes that is perhaps the most important because, in addition to the sediment resuspension/stratification parameter previously discussed, this is the only other parameter that encompasses trophic state. Whereas the sediment resuspension/stratification parameter captures the direct cause of nutrient enrichment (i.e., increase in trophic state) through internal loading, the SAV coverage parameter describes more of the effects of nutrient enrichment on a key community. As a lake becomes more eutrophic, higher phytoplankton populations reduce the depth to which

Peer Review: Category 3 Lakes Page 42
light penetrates. This causes the SAV community to become more limited to shallower depths than before, which results in less SAV biomass and coverage in the lake. The significant change standard for this parameter is based on a study of 26 Florida lakes by Canfield et al. (1985). Canfield et al. performed a regression of the maximum depth of macrophyte colonization (MDC) vs. the Secchi disc depth (SD), which produced the following empirical model:
log(MDC) = 0.42log(SD) + 0.41 r2 = 0.71 where MDC and SD are expressed in meters. Note that this equation is incorrectly given on p4-21 in the Draft Report (Leeper et al., 2001). The high coefficient of determination for the regression suggests that the model should be robust for other Florida lakes. However, there are some drawbacks in using that database which we feel should be examined and redressed for minimum effort and cost. Canfield et al. (1985) included emergent and floating vegetation in their 26-lake data set, which we feel are not nearly as physiological dependent on underwater light penetration as is the submersed aquatic vegetation community. If you subtract the number of lakes with floating or emergent vegetation, then the data set is reduced from 26 to 18 lakes. Furthermore, of those 18 lakes, 11 of them were dominated by hydrilla (Hydrilla verticillata), which biases the regression coefficients towards this exotic species that is known for growing in low light environments. Given the importance of this parameter, we recommend that the District staff initiate a site-specific study on as many lakes as feasible with the purpose of developing a regression relationship between MDC and SD for SAV. Such a study could be done quickly (within a growing season) and at only a small cost. District staff has essentially performed a similar type of exercise when it used its own database of 295 lakes to compile a mean depth of 3.9 ft for the emergent and floating macrophytes when it developed the significant change standard for the herbaceous wetland area parameter. At a minimum, Secchi disk depth could be correlated with the MDC for each lake, and a regression performed between the two variables. Only slightly more effort would be required to relate the MDC and the attenuation coefficient, which could be done by employing a conversion factor (Giesen et al. 1990). If this is done, then the minimal light requirement expressed as a percentage of the surface insolation could be reported for each major SAV taxon according to the Lambert-Beer equation:
Iz/Io = e-Kd • Z Where Iz is the photosynthetic active radiation (PAR) at depth z, Io is the PAR just below the water surface, Kd is the light attenuation coefficient (m-1), and z is the water depth (m).

Peer Review: Category 3 Lakes Page 43
By knowing the percentage transmittance of light at the MDC for each species, differences between SAV species could be accounted for and incorporated into the significant change standard. In other words, a species-specific MDC would be known and could be applied to the significant change standard, depending on which species dominated a lake. The suggested additional effort is substantial, and probably could not be accomplished within the time constraints for establishment of MLLs for the targeted lakes. It may provide future improvement in the application of the multi-parameter method, however, and is worth investigating. 3.3.g. Development of a significant change standard for Herbaceous Wetland Area (HWA) The Draft Report (Leeper et al., 2001) alludes to possibly calculating the significant change standards for herbaceous wetlands relative to the their occupation areas at the Historic P50 elevation. That is, some percentage change of the surface areas occupied by emergent plant communities at the Historic P50 should be determined to represent a pivotal point (i.e., a critical area) above which a significant change would occur in the plant community or related lake features. The elevations corresponding to this percentage would constitute the significant change standards that would then be compared to the other standards calculated. The elevation corresponding to the critical percentage change (say 20 to 25%) in the acreage of HWA from its coverage at the Historic P50 would be equal to the HWA significant change standard. This would be compared to the standards for the other six parameters to add another quantitative measure to the multi-parameter approach to setting minimum lake levels. The challenge is arriving at scientifically defensible critical minimum areas as the cutoff percentages. These percentages may be determined from a literature review as to what constitutes an “ideal” percentage of HWA habitat for lakes, or interviewing lake managers or user groups (fishermen, boaters, lake residents) as to their perceptions of appropriate coverage for herbaceous wetlands within lakes. This survey approach may overlap with the aesthetic standard setting process suggested later, but could still be applicable. 3.3.h. Recreation/ski significant change standard enhancement While the proposed significant change standard preserves a lake use, it could allow much less of that use on some lakes. Rather than evaluating water level based on the minimum that will support safe skiing, why not consider the change in useable lake area for watersking or any other motor-dependent activity of interest (e.g., fishing or just cruising). For example, boatable acreage could reasonably be defined as the area with some minimum depth (5 ft) at some minimum distance from shoreline and structures (100 ft), divided by the desired acres per boat (10-25). The impact induced by water level changes can then be assessed, and some reasonable reduction in boatable acres (20-25%) can be established as the significant change standard.

Peer Review: Category 3 Lakes Page 44
This approach might be facilitated by user surveys to identify levels of boatable area loss that are unacceptable to boaters, and would require substantial effort. At issue is defining a defensible percentage loss in boatable area. Alternatively, the currently proposed approach of simply maintaining waterskiing as a use might be modified in several ways. The significant change standard could be made more stringent by requiring less loss of waterskiing paths in terms of the number of circular units of appropriate size (radius = 418 ft) available at a lake. This would be similar to the boatable area approach. The significant change standard could be made more lenient by consideration of alternative paths that provide for safe waterskiing; paths need not be circular to be safe, and the area encompassed by a circle with a radius of 418 ft may well be available as a rectangle or other functional shape in some lakes. Any alternative approach with regard to the recreation/waterski significant change standard will require substantial effort to develop and implement, and may not be suitable for inclusion in the multi-parameter approach within the time constraints for its approval. The current approach of using a minimum area suitable for maintaining waterskiing as a lake use is acceptable, it just may not be optimal. 3.3.i. Aesthetic significant change standard enhancement The current significant change standard for lake aesthetics is reasonable as a first cut attempt to preserve a use, but could be substantially improved and more quantitatively supported by user surveys aimed at quantifying user perceptions of lake condition at various water levels. This is a common technique for quantifying acceptable change where subjectivity is a major factor. Recreation science deals with the associated uncertainty and statistical evaluation of results, and has been a great aid in settling disputes over minimum flows in rivers for aesthetic or other recreational uses, wilderness preservation, and scenic features maintenance. The effort necessary to generate a more quantitative assessment of water level aesthetics is substantial, and it may take several years to generate the necessary data. Undertaking such a survey is advised, however, to strengthen the aesthetic significant change standard. 3.3.j. Possible benthic invertebrate significant change standard The potential use of invertebrates as indicators of undesirable changes induced by water level decline was focused on zooplankton species and justifiably abandoned. However, where aquatic mollusk populations exist, size and age distributions at different depths often reflect the impact of drawdown over periods up to several decades long. By examining the spatial distribution of any given species of mollusk, and the age distribution for any given water depth, the zone of drawdown impact can be defined fairly clearly. It may very well correspond to the P10-P90 zone, in which case it could then be compared to the RLWR for the area. Otherwise, some index of impact zone change would have to be developed. Mollusk population features should correlate well with long-term water levels in lakes with suitable water chemistry (adequate calcium and pH >6.0) and substrate, providing acceptable precision and accuracy.

Peer Review: Category 3 Lakes Page 45
Considerable field work would be involved (possibly several thousand hours), but studies of this type (e.g., Normandaeu 1996, Fugro 1998) have been conducted elsewhere and the results have been used in setting the water level regime over annual and decadal cycles. If there are endangered or otherwise protected species of mollusks in the area, the SWFWMD may actually have some obligation to evaluate this approach. The current problem is that the low water levels of the last decade have apparently decimated the mollusk populations of many lakes, and it may be a long time before populations recover sufficiently to make such an investigation worthwhile. This may be more valuable as an indicator of restoration success than as a significant change standard for setting MLLs. 3.3.k. Consideration of septic system influences During the public meeting of August 2001, the issue of high water levels impacting septic system function was explored briefly. Current statutes in Florida require that there be only two feet of non-saturated soil (at the wettest time of year) between the bottom of the leach field and the ground water table (Henigar and Ray, 1990). Practices in many other states reference a distance of four to six feet between the bottom of the leach field and the ground water table for proper function of a conventional septic system. This suggests that many on-site disposal systems have been built in Florida in a manner that is sub-optimal for the protection of water quality, and that a decrease in adjacent lake level might actually provide some water quality benefits. Much site-specific work would be necessary to document such a benefit for any lake where the established MLL was high enough to potentially impact septic system function, and it is not recommended that this be a primary consideration in setting MLLs, but it should be noted that not every aspect of raising water levels back toward historic levels is beneficial. 3.3.l. Adjustment of the Reference Lake Water Regime (RLWR) During the public meeting on August 6, 2001, it was suggested that some of the Category 3 lakes are more flow-through systems, while others are more hydraulically unconnected to nearby lakes as far as their surface waters are concerned. Category 3 lakes that are considered to be more “isolated” with respect to their surface water hydrology are shown by double asterisks in Table 2. We could not detect any differences between the two types of lakes based on differences in the NP and HGL (column A), Historic P50 minus the District MLL (columns B and C), or the District MLL minus the mean of all applicable parameters (column E). However, the sample size of just 4 hydraulically “isolated” lakes is probably not large enough to detect any differences between the two hydrologic types of lakes if they should indeed exist. The suggestion that development in recent years has increased the variability in hydrology and therefore in water level has merit, but it will take considerable effort to sort out the influences of recent development, drought between 1989 and 2001, and water withdrawals from area wells, if indeed these influences can be separated. It seems worthwhile to examine the available data sets to see if this can be done, but application of results to a new RLWR requires assumptions additional to those applied in the construction of the existing RLWRs and is not clearly justifiable. Expenditure of perhaps

Peer Review: Category 3 Lakes Page 46
a week of staff time should be adequate to determine if such separation of influences is feasible with existing data, if it has not already been done. It has also been suggested that each lake could have its own RLWR based on current data that would reflect recent variability. This approach suffers from both a need for considerable additional effort and violation of the intended purpose of the RLWR (to assess variability in the absence of well withdrawals). However, in light of recent watershed development and drought conditions, it would be worthwhile to evaluate the available data to see how much more variable water levels are now than for the time period in which RLWRs were created, using data from the same lakes used to construct RLWRs. This might require just a few days of staff time, and may shed some light on changes in variability in response to recent events, even if the causes for any increased variability are not differentiable.

Peer Review: Category 3 Lakes Page 47
4.0 REFERENCES Bachmann, R.W., B.L. Jones, D.D. Fox, M. Hoyer, L.A. Bull, and D.E. Canfield, Jr. 1996. Relations between trophic state indicators and fish in Florida (U.S.A.) lakes. Can. J. Fish. Aquat. Sci. 53:842-855. Bachmann, R.W., M.V. Hoyer, and D.E. Canfield, Jr. 2000. The potential for wave disturbance in shallow Florida lakes. Lake and Reserv. Manage. 16:281-291. Bedient, P., M. Brinson, F. Dierberg, S. Gorelick, K. Jenkins, D. Ross, K. Wagner and D. Stephenson. 1999. Report of the Scientific Peer Review Panel on the data, theories and methodologies supporting the Minimum Flows and Levels Rule for Northern Tampa Bay area, Florida. SWFWMD, Brooksville, FL. Bildstein, K.L. 2001. Reviews of Hoyer and Canfield (1994) article on “Bird Abundance and Species Richness on Florida Lakes: Influence of Trophic Status, Lake Morphology, and Aquatic Macrophytes” and the draft document entitled “Rationale and Methods for Establishing Minimum Water Levels for Lakes without Fringing Cypress Wetlands within the Southwest Florida Water Management District” (SWFWMD 2001). Canfield, D.E., Jr., K.A. Langeland, S.B. Linda, and W.T. Haller. 1985. Relations between water transparency and maximum depth of macrophyte colonization in lakes. J. Aquat. Plant Manage. 23:25-28. Canfield, D.E. and M.V. Hoyer. 1992. Aquatic macrophytes and their relationship to the limnology of Florida lakes. Dept. Fish. Aquacult., Univ. FL, Gainesville, FL. Giesen, W.B.J.T., M.M. van Katwijk, and C. den Hartog. 1990. Eelgrass condition and turbidity in the Dutch Wadden Sea. Aquat. Bot. 37:71-85. Emery, S. H. 1992. Changes in Land Use/Drainage in the Vicinity of the Cosme-Odessa and Section 21 Wellfields. For the City of St. Petersburg, FL. Fugro East. 1998. Background and Specifications for a Sebago Lake Water Level Impact Assessment. Prepared for S.D. Warren Company by Fugro, Northborough, MA. Henigar and Ray Engineering Associates. 1990. Placement and Maintenance of Individual Septic Systems. Issue II, SWIM Model Ordinance Project, SWFWMD, Brooksville, FL. Hoyer, M.V., and D.E. Canfield, Jr. 1994. Bird abundance and species richness on Florida lakes: influence of trophic status, lake morphology, and aquatic macrophytes. Hydrobiol. 297/280:107-119. Hoyer, M.V., and D.E. Canfield, Jr. 2001. Citizen monitoring of aquatic bird populations using a Florida lake. Lake Reserv. Manage. 17:82-89.

Peer Review: Category 3 Lakes Page 48
Jackson, J. 2001. A review of “Bird Abundance and Species Richness on Florida Lakes: Influence of Trophic Status, Lake Morphometry, and Aquatic Macrophytes” and related literature as it relates to the potential estimation of the importance of South Florida lakes to aquatic birds. FL Gulf Coast University, Ft. Myers, FL. Leeper, D., M. Kelly, A. Munson and R. Gant. 2001. A Multiple-Parameter Approach for Establishing Minimum Levels for Category 3 Lakes of the Southwest Florida Management District. SWFWMD, Brooksville, FL. Leggette, Brashears & Graham and Greeley & Hansen. 1995. Hydrologic Conditions in the Northwest Hillsborough and South Pasco County Areas. For the City of St. Petersburg, FL. Normandeau Associates. 1996. Impact of Changing Water Level on Silver Lake, Pembroke, MA. Normandeau, Bedford, NH. Nürnberg, G. K. 1995. The anoxic factor, a quantitative measure of anoxia and fish species richness in central Ontario lakes. Trans. Am. Fish. Soc. 124:677-686. Osgood, R.A. 1988. Lake mixis and internal phosphorus dynamics. Arch. Hydrobiol. 113:629-638. Rodgers, J. 2001. Review of Hoyer and Canfield (1994) article on “Bird Abundance and Species Richness on Florida Lakes: Influence of Trophic Status, Lake Morphology, and Aquatic Macrophytes”. Smeltzer, E. and S. Heiskary. 1990. Analysis and application of lake user survey data. Lake Reserv. Manage. 6:109-118.