Embed Size (px)
Citation preview

Abstract—Software metrics is developed and used by the
various software organizations for evaluating and assuring
software code quality, operation, and maintenance. Software
metrics measure various types of software complexity like size
metrics, control flow metrics and data flow metrics. These
software complexities must be continuously calculated, followed,
and controlled. One of the main objectives of software metrics is
that applies to a process and product metrics. It is always
considered that high degree of complexity in a module is bad in
comparison to a low degree of complexity in a module. Software
metrics can be used in different phases of the software
development lifecycle. This paper reviews the theory, called
“software complexity metrics”, and analysis has been done
based on static analysis. We try to evaluate and analyze
different aspects of software metrics in structural testing which
offers of estimating the effort needed for testing.
Index Terms—Software metrics, lines of code, control flow
metrics, NPATH complexity, structural testing.
I. INTRODUCTION
The Software complexity is based on well-known software
metrics, this would be likely to reduce the time spent and cost
estimation in the testing phase of the software development
life cycle (SDLC), which can only be used after program
coding is done. Improving quality of software is a
quantitative measure of the quality of source code. This can
be achieved through definition of metrics, values for which
can be calculated by analyzing source code or program is
coded. A number of software metrics widely used in the
software industry are still not well understood [1]. Although
some software complexity measures were proposed over
thirty years ago and some others proposed later. Sometimes
software growth is usually considered in terms of complexity
of source code. Various metrics are used, which unable to
compare approaches and results. In addition, it is not possible
or equally easy to evaluate for a given source code [2].
Software complexity, deals with how difficult a program is to
comprehend and work with [3]. Software maintainability [3],
is the degree to which characteristics that hamper software
maintenance are present and determined by software
complexity. There dependencies are shown in Fig. 1.
This paper presents an analysis by which tester/developer
can minimize software development cost and improve testing
efficacy and quality
Manuscript received August 16, 2012; revised September 28, 2012.
The authors are with the Department of Computer Science & Engineering,
National Institute of Technology, Agartala, Tripura, INDIA, PIN 799055,
India (e-mail: [email protected]).
Fig. 1. Relationship between software complexity metrics and software
systems
II. PROBLEM STATEMENT
From software engineering point of view software
development experience shows, that it is difficult to set
measurable targets when developing software products.
Produced/developed software has to be testable, reliable and
maintainable. On the other side, “You cannot control what
you cannot measure” [4]. In software engineering field
during software process, developers do not know if what they
are developing is correct and guidance are needed to help
them accustom more improvement. Software metrics are
facilitating to track software enhancement. Various industries
dedicated to develop software, and use software metrics in a
regular basis. Some of them have produced their own
standards of software measurement, so the use of software
metrics is totally depending upon industry to industry. In this
regards, what to measure is classified into two categories,
such that software process or software product. But
ultimately, main goal of this measure is customer satisfaction
not only at delivery, but through the whole development
process.
III. BACKGORUND AND RELATED WORK
A. Software Metrics
Software metrics is defined by measuring of some property
of a portion of software or its specifications. Software metrics
provide quantitative methods for assessing the software
quality. Software metrics can be define as: "The continuous
application of measurement-based techniques to the software
development process and its products to supply meaningful
and timely management information (MI) together with the
use of those techniques to improve its products and that
process" [5].
A Review and Analysis of Software Complexity Metrics in
Structural Testing
Mrinal Kanti Debbarma, Swapan Debbarma, Nikhil Debbarma, Kunal Chakma, and Anupam Jamatia
International Journal of Computer and Communication Engineering, Vol. 2, No. 2, March 2013
129

B. Software Complexity
Software complexity, deals with how difficult a program is
to comprehend and work with [3]. Software maintainability
[3], is the degree to which characteristics that hamper
software maintenance are present and determined by
software complexity. Software complexity is based on
well-known software metrics.
Various software complexity metrics invented and can be
categorized into two types:
1) Static metrics
Static metrics are obtainable at the early phases of software
development life cycle (SDLC).
These metrics deals with the structural feature of the
software system and easy to gather.
Static complexity metrics estimate the amount of effort
needed to develop, and maintain the code.
2) Dynamic metrics
Dynamic metrics are accessible at the late stage of the
software development life cycle (SDLC). These metrics
capture the dynamic behavior of the system and very hard to
obtain and obtained from traces of code.
C. Software Complexity Measures: Attributes
Software complexity metrics can be distinguished by the
attributes used for measurement. In this paper, we are
concentrating on static measure which can be classified into
three types:
1) Size based metrics
Size is one of the most essential attributes of software
systems [6]. It controls the expenditure incurred for the
systems both in man-power and budget, for the development
and maintenance. These metrics specify the complexity of
software by size attributes and helps in predicting the cost
involvement for maintaining the system. Size based metrics
measures the actual size of the software module. Metrics is
originated from the basic counts such as line numbers,
volume, size, effort, length, etc.
2) Control flow based metrics
Control flow based metrics measures the
comprehensibility of control structures. These metrics also
confine the relation between the logic structures in program
with its program complexity. These metrics are originated
from the control structure of a program [3].
3) Data flow based metrics
Data flow based metrics measure the usage of data and
their data dependency (visibility of data as well as their
interactions) [3].
Structural testing criteria consider on the knowledge of the
internal structure of the program implementation to derive
the testing criteria. Test cases are generated for actual
implementation, if there is some change in implementation
then it leads to change in test cases. They can be classified as,
complexity, control flow and data flow based criteria. The
complexity based criterion requires the execution of all
independent paths of the program; it is based on McCabe’s
complexity concept [7]. For the control flow based criteria,
testing requirements are based on the Control Flow Graph
(CFG). It requires the execution of components (blocks) of
the program under test in condition of subsequent elements of
the CFG i.e. nodes, edges and paths. Another method is
number of unit tests needed to test every combination of
paths in a method. In Data Flow based criteria, both data flow
and control flow information are used to perform testing
requirements. These coverage criteria are based on code
coverage. Code coverage is the degree to which source code
of a program has been tested. Test coverage is measured
during test execution. Once such a criterion has been selected,
test data must be selected to fulfill the criterion.
TABLE I: SUMMARIZED SOFTWARE METRICS ARE SHOWN IN.
Type Metrics Description Merit &
De-merits
Size
Metrics
(Program
Size)
Lines of Code
(LOC),
Token Counts
(TC),
Function Points
(FP),
Halstead’s
software
science (HSS)
Metrics based on
program size,
amount of lines of
code,
declarations,
statements, and
files.
Halstead’s metrics
are based on count
of unique number
of operators and
operands in a
program.
Easy to
understand;
fast to count,
program
language
independent
and widely
applicable.
No need of
deep analysis
of program’s
logic
structure. In
contrast
ignores the
complexity
from the
control flow.
Control
flow based
metrics
(Program
Control
Structure)
McCabe’s
Cyclomatic
Complexity
(MCC), Conte’s
Average
Nesting Level,
(CANC),
NPATH
Complexity
(NC)
Metrics based on
control structure
of the program or
control flow graph
(CFG) and density
of control within
the program
Measure acyclic
execution path
through a
program.
Ignores the
complexity
from the data
flow of the
program and
Complexity
added by the
nesting levels.
Do not
distinguish the
complexities
of various
kinds of
control flow.
Data Flow
based
metrics
Chung’s live
definition
Metrics is based
on use of data
within a program.
Intra and inter
module’s data
dependency
complexity
Complexity of software is measuring of software code
quality; it requires a model to convert internal quality
attributes to code reliability. High degree of complexity in a
component like function, subroutine, object, class etc. is
consider bad in comparison to a low degree of complexity in
a component. Software complexity measures which enables
the tester to counts the acyclic execution paths through a
component and improve software code quality. In a program
characteristic that is one of the responsible factors that affect
the developer’s productivity [8] in program comprehension,
maintenance, and testing phase. There are several methods to
calculate complexity measures were investigated, e.g.,
Nesting Level [6], different version of LOC [8], NPATH [9],
McCabe’s cyclomatic number [10], Data quality [10],
Halstead’s software science [11], Function Points[12], Token
Counts[11], Chung’s live definition [13] etc.
IV. CLASIFICATION OF SOFTWARE METRICS
Software metrics are useful to the software process, and
product metrics. Various classification of software metrics
are as follows:
International Journal of Computer and Communication Engineering, Vol. 2, No. 2, March 2013
130
1) Software Process metrics
2) Software Product metrics
A. Software Process Metrics
Software process metrics involves measuring of properties
of the development process and also known as management
metrics. These metrics include the cost, effort, reuse,
methodology, and advancement metrics. Also determine the
size, time and number of errors found during testing phase of
the SDLC.
B. Software Product Metrics
Software process metrics involves measuring the
properties of the software and also known as quality metrics.
These metrics include the reliability, usability, functionality,
performance, efficacy, portability, reusability, cost, size,
complexity, and style metrics. These metrics measure the
complexity of the software design, size or documentation
created.
1) Size metrics: Lines of code
The size of the program indicates the development
complexity, which is known as Lines of Code (LOC). The
simplest measure of software complexity recommended by
Hatton (1977). This metric is very simple to use and measure
the number of source instruction required to solve a problem.
While counting a number of instructions (source), line used
for blank and commenting lines are ignored. The size,
complexity of today’s software systems demands the
application of effective testing techniques. Size attributes are
used to describe physical magnitude, bulk etc. Lines of code
and Halstead’s software science [11] are examples of size
metrics. M. Halstead proposed a metrics called software
science.
2) Control flow metrics: NPATH complexity [9]
The control flow complexity metrics are derived from the
control structure of a program. The control flow measure by
NPATH, invented by Nejmeh [9] it measures the acyclic
execution paths, NPATH is a metric which counts the
number of execution path through a functions. NPATH is an
example of control flow metrics.
One of the popular software complexity measures NPATH
complexity (NC) is determined as:
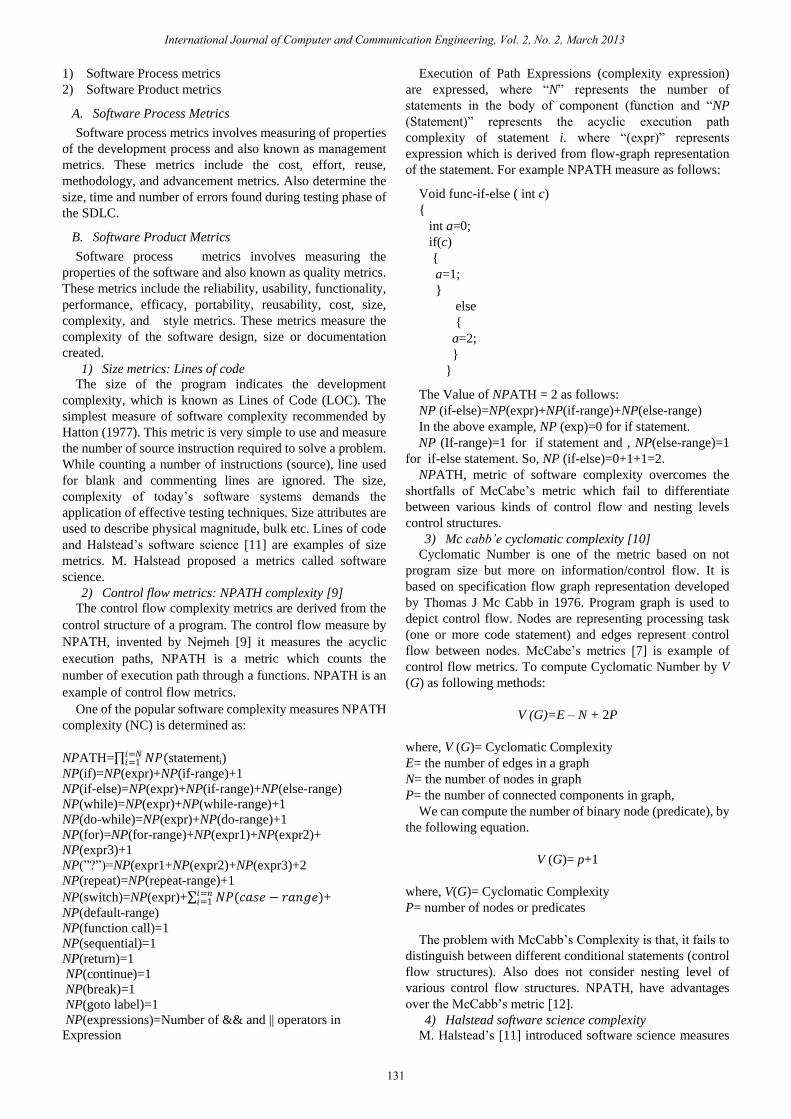
Execution of Path Expressions (complexity expression)
are expressed, where “N” represents the number of
statements in the body of component (function and “NP
(Statement)” represents the acyclic execution path
complexity of statement i. where “(expr)” represents
expression which is derived from flow-graph representation
of the statement. For example NPATH measure as follows:
Void func-if-else ( int c)
{
int a=0;
if(c)
{
a=1;
}
else
{
a=2;
}
}
The Value of NPATH = 2 as follows:
NP (if-else)=NP(expr)+NP(if-range)+NP(else-range)
In the above example, NP (exp)=0 for if statement.
NP (If-range)=1 for if statement and , NP(else-range)=1
for if-else statement. So, NP (if-else)=0+1+1=2.
NPATH, metric of software complexity overcomes the
shortfalls of McCabe’s metric which fail to differentiate
between various kinds of control flow and nesting levels
control structures.
3) Mc cabb’e cyclomatic complexity [10]
Cyclomatic Number is one of the metric based on not
program size but more on information/control flow. It is
based on specification flow graph representation developed
by Thomas J Mc Cabb in 1976. Program graph is used to
depict control flow. Nodes are representing processing task
(one or more code statement) and edges represent control
flow between nodes. McCabe’s metrics [7] is example of
control flow metrics. To compute Cyclomatic Number by V
(G) as following methods:
V (G)=E – N + 2P
where, V (G)= Cyclomatic Complexity
E= the number of edges in a graph
N= the number of nodes in graph
P= the number of connected components in graph,
We can compute the number of binary node (predicate), by
the following equation.
V (G)= p+1
where, V(G)= Cyclomatic Complexity
P= number of nodes or predicates
The problem with McCabb’s Complexity is that, it fails to
distinguish between different conditional statements (control
flow structures). Also does not consider nesting level of
various control flow structures. NPATH, have advantages
over the McCabb’s metric [12].
4) Halstead software science complexity
M. Halstead’s [11] introduced software science measures
International Journal of Computer and Communication Engineering, Vol. 2, No. 2, March 2013
131
NPATH= 𝑁𝑃(𝑖=𝑁𝑖=1 statementi)
NP(if)=NP(expr)+NP(if-range)+1
NP(if-else)=NP(expr)+NP(if-range)+NP(else-range)
NP(while)=NP(expr)+NP(while-range)+1
NP(do-while)=NP(expr)+NP(do-range)+1
NP(for)=NP(for-range)+NP(expr1)+NP(expr2)+
NP(expr3)+1
NP(”?”)=NP(expr1+NP(expr2)+NP(expr3)+2
NP(repeat)=NP(repeat-range)+1
NP(switch)=NP(expr)+ 𝑁𝑃(𝑐𝑎𝑠𝑒 − 𝑟𝑎𝑛𝑔𝑒)𝑖=𝑛𝑖=1 +
NP(default-range)
NP(function call)=1
NP(sequential)=1
NP(return)=1
NP(continue)=1
NP(break)=1
NP(goto label)=1
NP(expressions)=Number of && and || operators in
Expression

for software complexity product metrics. Halseatd’s software
science is based on a enhancement of measuring program size
by counting lines of code. Halstead’s metrics measure the
number of number of operators and the number of operands
and their respective occurrence in the program (code). These
operators and operands are to be considered during
calculation of Program Length, Vocabulary, Volume,
Potential Volume, Estimated Program Length, Difficulty,
and Effort and time by using following formulae.
n1 = number of unique operators,
n2 = number of unique operands,
N1 = total number of operators, and
N2 = total number of operands,
a) Program Length (N) = N1+N2
b) Program Vocabulary (n) = n1+n2
c) Volume of a Program (V) = N*log2n
d) Potential Volume of a Program (V*)=(2+n2)log2(2+n2)
e) Program Level (L) = L=V*/V
f) Program Difficulty (D) = 1/L
g) Estimated Program Length (N) = n1log2n1+n2log2n2
h) Estimated Program Level (L) = 2n2/(n1N2)
i) Estimated Difficulty (D) = 1/L = n1N2/2n2
j) Effort (E) = V/L = V*D = (n1 x N2) / 2n2
k) Time (T) = E/S [“S” is Stroud number (given by John
Stroud), the constant “S” represents the speed of a
programmer. The value “S” is 18]
One major weakness of this complexity is that they do not
measure control flow complexity and difficult to compute
during fast and easy computation.
V. STATIC ANANYSIS
Our analysis is based on static analysis of software
complexity metrics like size and control flow metrics. We
have considered four program characteristics from the
literature that are responsible for complexity measures. e.g.,
LOC, NC, MCC, and HSSC. For this study, we have selected
only program written in C language given in Fig. 2. We have
measured LOC, NPATH i.e. acyclic execution paths through
components for in an attempt at program optimization,
McCabe complexity and finally Halstead’s software science
complexity metrics. Statics analysis of metrics is not directly
associated to the execution of programs (source code). There
are three aspects can be affect maintenance of program, like
program volume/size, data organization, and control
structure.
While counting a number of instructions (source), line
used for blank and commenting lines are ignored. NPATH
measures the acyclic execution paths which counts the
number of execution path through a functions. Halstead’s
metrics measure the number of number of operators and the
number of operands and their respective occurrence in the
program (code). These operators and operands are to be
considered during calculation of Program Length,
Vocabulary, Volume, Potential Volume, Estimated Program
Length, Difficulty, and Effort and time. For McCabb’s
complexity measures program graph is used to depict control
flow. Nodes are representing processing task (one or more
code statement) and edges represent control flow between
nodes
TABLE II: CALCULATION OF THE COMPLEXITY MEASURES FROM PROGRAM
P
LOC NC MCC HSSC
35
24
Nodes
15
n1 15
n2 8
Edges
19
N1 56
N2 40
Pred.
Nodes
5
Vocabu
Lary
434
Estt.
Program
Length
82.6
Regions
5
Difficulty 37.5
Effort 16275
V(G)
6 Time 904.16
Consider an example, Let P be the source program in C
given below:
Consider a program from fig. 2, the complexity measured
by us and computed the complexity of the other proposed
measures i.e Lines of Code (LOC), NPATH Complexity
(NC), McCabb’s complexity (MCC) and Halstead’s software
science complexity (HSSC) are shown in Table II.
Fig. 2. Source program.
VI. CONCLUSION
Software complexity metrics have a tendency to be used in
judging the quality of software development and one of the
vital parts of the SDLC. The volume, control and data based
complexity are importance of today’s software systems
demand the application of effective testing techniques. In
addition, it was observed that software complexity metrics
which enables the tester to counts the acyclic execution paths
International Journal of Computer and Communication Engineering, Vol. 2, No. 2, March 2013
132

through a program and improve software quality. This static
analysis could be lead to reduce software development cost
and improve testing efficacy and software quality by
evaluating software complexity metrics with LOC, NPATH
(NC), McCabb’s complexity metrics (MCC) and Halstead’s
Software Science Complexity (HSSC).
REFERENCES
[1] T. J. M. Cabe, “A complexity measure,” IEEET Ransactions on
Software Engineering, vol. 2, 1976
[2] I. Herraiz, J. M. G. Barahona, and G. Robles, “Towards a theoretical
model for software growth,” in 29th International Conference on
Software Engineering Workshops (ICSEW'07).
[3] W. Harrison, K. Magel, R. Kluczny, and A. Dekok, Applying
Software Complexity Metrics to Program Maintenance Compute, vol.
15, pp. 65-79, 1982.
[4] T. D. Marco, “Controlling software projects,” Prrntice Hall, New
York, 1982.
[5] J. Verner and G. Tate, “A software size model,” IEEE Transaction on
Software Engineering, vol. 18, no. 4, 1992.
[6] W. Harrision and L. I. Magel, “A complexity based on nesting level,”
Sigplan Notice, vol. 16, no. 3, 1981.
[7] A. Fitzsimmons and T. Love, “A review and evaluation of software
science,” Computing Survey, vol. 10, no. 1, March 1978.
[8] S. D. Conte, H. E Dunsmore, and V. Y. Shen, “Software engineering
metrics and models,” Benjamin/Cummings Publishing Company, Inc.,
1986. [9] B. A. Nejmeh, “NPATH: A measure of execution path complexity and
its applications,” Comm. of the ACM, vol. 31, no. 2, pp. 188-210,
February 1988.
[10] T. A. McCabe, “A complexity measure,” IEEE Transactions on
Software Engineering, vol. 2, no. 4, pp. 308-320, December 1976.
[11] M. Halstead, Elements of Software Science. North Holland, 1977.
[12] E. E. Millis, “Software metrics,” SEI Curriculam Module SEI- CM. vol.
12, no. 2.1, Dec, 1988.
[13] C. M Chung and M. G Yang, “A software maintainability
measurement,” Proceedings of the 1988 Science, Engineering and
Tech. Houston, Texas, pp. V12-16.
Mrinal Kanti Debbarma was born in Tripura in
1972, Presently working as Assistant Professor at
Computer Science and Engineering Department of
National Institute of Technology Agartala, India, he
received the B.Tech (IET, Lucknow), M.Tech
(MNNIT, Allahabad), currently pursuing
Ph.D.(Information Technology) at Assam University.
His research interest include in Software Engineering
with special interest in Software metrics analysis and
Regression testing, MANET Routing Protocols, Wireless Sensor
Networks. He has 12 years of academic and 5 years Industrial experience.
Mr. Debbarma is a member of IAENG, IACSIT. email: [email protected].
Swapan Debbarma obtained his B.Tech degree in
Computer Science and Engineering in 2000 from
NERIST (North Eastern Regional Institute of
Technology, Deem University, AP, India).In 2010,
M.Tech degree in the same field of Engineering from
Tripura University and pursuing his PhD degree from
NIT, Agartala in the field of Nanotechnology under the
supervision of Professor K. P. Ghatak. He published
more than a dozen research papers in International
peer-reviewed. He joined as Lecturer in 2002 (Then Tripura Engineering
College) and Assistant Professor 2006 in the Department of Computer
Science and Engineering NIT.
Nikhil Debbarma is an Assistant Professor at the
Computer Science and Engineering Department of
National Institute of Technology, Agartala, India. He
received his B.E. in Computer Science and
Engineering at REC Jalandhar, India and M.Tech. in
Computer Science and Engineering at National
Institute of Technology, Agartala, India. His research
interests include OS, Database, Graph Theory,
Algorithm.
Kunal Chakma is an Assistant Professor at the
Computer Science and Engineering Department of
National Institute of Technology, Agartala, India. He
received his B.E. in Computer Science and
Engineering at REC Jalandhar, India and Currently
Pursuing M.Tech. in Computer Science and
Engineering at National Institute of Technology,
Agartala, India. His research interests include Systems
Software, Operating Systems, Real-Time Operating
Systems, Distributed Systems, Linux.
Anupam Jamatia is an Assistant Professor at the
Computer Science and Engineering Department of
National Institute of Technology, Agartala, India. He
received his B.E. in Computer Science and
Engineering at University College of Engineering,
Burla, Orissa, India in May 2000 and Currently
Pursuing M.Tech. in Computer Science and
Engineering at National Institute of Technology,
Agartala, India. His research interests include Routing
Protocol in Wireless Networking and Mobile Computing. He is a member of
IEEE.
International Journal of Computer and Communication Engineering, Vol. 2, No. 2, March 2013
133